twenty ninth annual report - valueresearchonline.com engaged in providing versatile, reliable and...
TRANSCRIPT
Twenty Ninth Annual Report
42
NOTES TO FINANCIAL STATEMENTS FOR THE YEAR ENDED MARCH 31, 2017
1. CORPORATE INFORMATION
ADC India Communications Limited (“the Company”) is a public company domiciled in India. The Company is engaged in providing versatile, reliable and cost effective connectivity solutions to suit individual enterprise and telecom service provider requirements. The Company provides copper and fiber physical connectivity in telecommunications and data networking solutions including structured cabling.
2.1 Basis of accounting and preparation of financial statements
The financial statements of the Company have been prepared in accordance with the Generally Accepted Accounting Principles in India (Indian GAAP) to comply with the Accounting Standards prescribed under Section 133 of the Companies Act, 2013 (“the Act”), as applicable. The financial statements have been prepared on accrual basis under the historical cost convention. The accounting policies adopted in the preparation of the financial statements are consistent with those followed in the previous year.
2.2 Use of estimates
The preparation of the financial statements in conformity with Indian GAAP requires the Management to make estimates and assumptions considered in the reported amounts of assets and liabilities (including contingent liabilities) and the reported income and expenses during the year. The Management believes that the estimates used in preparation of the financial statements are prudent and reasonable. Future results could differ due to these estimates and the differences between the actual results and the estimates are recognised in the periods in which the results are known / materialise.
2.3 Inventories
Inventories are valued as follows:
Raw materials, components, Lower of cost and net realizable value. However, materials consumable and packing materials and other items held for use in the production of inventories (including materials in transit) are not written down below cost if the finished products in which they will be incorporated are expected to be sold at or above cost. Cost is determined on a weighted average basis.
Work-in-progress and finished Lower of cost and net realizable value. Cost includes direct goods (including materials in transit) materials and labour and a proportion of manufacturing overheads based on normal operating capacity. Cost of finished goods includes excise duty. Cost is determined on a weighted average basis.
Traded goods (including materials Lower of cost and net realizable value. Cost is determined in transit) on a weighted average basis.
Net realizable value is the estimated selling price in the ordinary course of business, less estimated costs of completion (as appropriate) and estimated costs necessary to make the sale.
2.4 Cash and cash equivalents (for purposes of Cash Flow Statement)
Cash comprises cash on hand and demand deposits with banks. Cash equivalents are short-term balances (with an original maturity of three months or less from the date of acquisition), highly liquid investments that are readily convertible into known amounts of cash and which are subject to insignificant risk of changes in value.
2.5 Cash flow statement Cash flows are reported using the indirect method, whereby profit / (loss) before extraordinary items and
tax is adjusted for the effects of transactions of non-cash nature and any deferrals or accruals of past or
43
future cash receipts or payments. The cash flows from operating, investing and financing activities of the Company are segregated based on the available information.
2.6 Dividends With effect from April 1, 2016 final dividend, including tax thereon, on shares are recorded as a liability on
the date of approval by the shareholders and interim dividend, including tax thereon, are recorded as a liability on the date of declaration by the Company’s Board of Directors.
2.7 Depreciation and amortization Depreciable amount for assets is the cost of an asset, or other amount substituted for cost, less its
estimated residual value. Depreciation on tangible fixed assets has been provided on the straight-line method as per the useful life prescribed in Schedule II to the Companies Act, 2013.
Intangible assets acquired separately are measured on initial recognition at cost. Following initial recognition, intangible assets are carried at cost less accumulated amortization and accumulated impairment losses, if any.
Intangible assets are amortized on a straight line basis over the estimated useful economic life ranging from two to five years. The amortization period and the amortization method are reviewed at each financial period / year end. If the expected useful life of the asset is significantly different from previous estimates, the amortization period is changed accordingly.
Gains or losses arising from derecognition of an intangible asset are measured as the difference between the net disposal proceeds and the carrying amount of the asset and are recognized in the statement of profit and loss when the asset is derecognized.
2.8 Revenue recognition Revenue is recognized to the extent that it is probable that the economic benefits will flow to the Company
and the revenue can be reliably measured.
Revenue from sale of goods is recognised when the significant risks and rewards of ownership of the goods have passed to the buyer, which normally coincides with the delivery of goods in terms of the arrangements with the customer. Sales include Excise duty but exclude Sales tax and Value added tax.
Revenue from Turnkey contracts, which are generally time bound fixed price contracts, are recognised over the life of the contract using Proportionate Completion method, with contract costs determining the degree of completion. Foreseeable losses on such contracts are recognised when probable.
Revenue from service contracts are recognised, when the rendering of services under a contract is completed or substantially complete.
Interest income is recognized on a time proportion basis taking into account the amount outstanding and the applicable interest rate. Rental income is accounted on accrual basis.
2.9 Fixed Assets (Tangible / Intangible) Fixed assets are stated at cost less accumulated depreciation and accumulated impairment losses, if
any. The cost comprises purchase price, borrowing costs if capitalization criteria are met and directly attributable cost of bringing the asset to its working condition for the intended use. Any trade discounts and rebates are deducted in arriving at the purchase price.
Subsequent expenditure related to an item of fixed asset is added to its book value only if it increases the future benefits from the existing asset beyond its previously assessed standard of performance. All other expenses on existing fixed assets, including day-to-day repair and maintenance expenditure and cost of replacing parts, are charged to the statement of profit and loss for the period during which such expenses are incurred.
NOTES TO FINANCIAL STATEMENTS FOR THE YEAR ENDED MARCH 31, 2017

Twenty Ninth Annual Report
44
2.10 Foreign currency transactions and translations Initial recognition
Transactions in foreign currencies entered into by the Company are accounted at the exchange rates prevailing on the date of the transaction or at rates that closely approximate the rate at the date of the transaction.
Conversion
Foreign currency monetary items are reported using the closing rate. Non-monetary items are carried at historical cost.
Exchange differences
Exchange differences arising on the settlement of monetary items or on reporting company’s monetary items at rates different from those at which they were initially recorded during the year, or reported in previous financial statements, are recognised as income or as expenses in the year in which they arise.
2.11 Employee Benefits Defined contribution plans The Company’s contribution to provident fund, superannuation fund and employee state insurance
scheme are considered as defined contribution plans and are charged as an expense based on the amount of contribution required to be made and when services are rendered by the employees.
Defined benefit plans For defined benefit plans in the form of gratuity fund, the cost of providing benefits is determined using
the Projected Unit Credit method, with actuarial valuations being carried out at each balance sheet date. Actuarial gains and losses are recognised in the Statement of Profit and Loss in the period in which they occur. Past service cost is recognised immediately to the extent that the benefits are already vested and otherwise is amortised on a straight-line basis over the average period until the benefits become vested. The retirement benefit obligation recognised in the Balance Sheet represents the present value of the defined benefit obligation as adjusted for unrecognised past service cost, as reduced by the fair value of scheme assets. Any asset resulting from this calculation is limited to past service cost, plus the present value of available refunds and reductions in future contributions to the schemes.
Short-term employee benefits The undiscounted amount of short-term employee benefits expected to be paid in exchange for the
services rendered by employees are recognised during the year when the employees render the service. These benefits include performance incentive and compensated absences which are expected to occur within twelve months after the end of the period in which the employee renders the related service.
The cost of short-term compensated absences is accounted as under :
(a) in case of accumulated compensated absences, when employees render the services that increase their entitlement of future compensated absences; and
(b) in case of non-accumulating compensated absences, when the absences occur.
2.12 Segmental Reporting (i) Identification of segments:
The Company’s operating businesses are organized and managed separately according to the nature of products and services provided, with each segment representing a strategic business unit that offers different products and serves different markets. The analysis of geographical segments is based on the location in which the customers are situated.
NOTES TO FINANCIAL STATEMENTS FOR THE YEAR ENDED MARCH 31, 2017
45
(ii) Allocation of common costs:
Common allocable costs are allocated to each segment according to the relative contribution of each segment to the total common costs.
(iii) Segment policies:
The Company prepares its segment information in conformity with the accounting policies adopted for preparing and presenting the financial statements of the Company as a whole.
2.13 Leases Where the Company is lessee
Finance leases, which effectively transfer to the Company substantially all the risks and benefits incidental to ownership of the leased item, are capitalized at the lower of the fair value and present value of the minimum lease payments at the inception of the lease term and disclosed as leased assets. Lease payments are apportioned between the finance charges and reduction of the lease liability based on the implicit rate of return. Finance charges are charged directly against income. Lease management fees, legal charges and other initial direct costs are capitalised.
Leases where the lessor effectively retains substantially all the risks and benefits of ownership of the leased term, are classified as operating leases. Operating lease payments are recognized as an expense in the Statement of profit and loss on a straight-line basis over the lease term.
Where the Company is lessor
Where the Company as a lessor leases assets under finance leases, such amounts are recognised as receivables at an amount equal to the net investment in the lease and the finance income is recognised based on a constant rate of return on the outstanding net investment. Operating lease receipts are recognized as other income in the Statement of profit and loss on a straight-line basis over the lease term.
2.14 Earnings per share Basic earnings per share are calculated by dividing the net profit or loss for the period attributable to
equity shareholders by the weighted average number of equity shares outstanding during the period.
For the purpose of calculating diluted earnings per share, the net profit or loss for the period attributable to equity shareholders and the weighted average number of shares outstanding during the period are adjusted for the effects of all dilutive potential equity shares.
2.15 Taxes on income Tax expense comprises of current and deferred tax. Current income tax is measured at the amount expected
to be paid to the tax authorities in accordance with the applicable tax rates and the provisions of the Income Tax Act, 1961 and other applicable tax laws. The tax rates and tax laws used to compute the amount are those that are enacted or substantively enacted, at the reporting date. Current income tax relating to items recognized directly in equity is recognized in equity and not in the statement of profit and loss.
Deferred income taxes reflect the impact of timing differences between taxable income and accounting income originating during the current year and reversal of timing differences for the earlier years. Deferred tax is measured using the tax rates and the tax laws enacted or substantively enacted at the reporting date. Deferred income tax relating to items recognized directly in equity is recognized in equity and not in the statement of profit and loss.
Deferred tax liabilities are recognized for all taxable timing differences. Deferred tax assets are recognized for deductible timing differences only to the extent that there is reasonable certainty that sufficient future taxable income will be available against which such deferred tax assets can be realized. In situations where the Company has unabsorbed depreciation or carry forward tax losses and items relating to capital
NOTES TO FINANCIAL STATEMENTS FOR THE YEAR ENDED MARCH 31, 2017
Twenty Ninth Annual Report
46
losses, all deferred tax assets are recognized only if there is virtual certainty supported by convincing evidence that they can be realized against future taxable profits.
At each reporting date, the Company re-assesses unrecognized deferred tax assets. It recognizes unrecognized deferred tax asset to the extent that it has become reasonably certain or virtually certain, as the case may be, that sufficient future taxable income will be available against which such deferred tax assets can be realized.
The carrying amount of deferred tax assets are reviewed at each reporting date. The Company writes-down the carrying amount of deferred tax asset to the extent that it is no longer reasonably certain or virtually certain, as the case may be, that sufficient future taxable income will be available against which deferred tax asset can be realized. Any such write-down is reversed to the extent that it becomes reasonably certain or virtually certain, as the case may be, that sufficient future taxable income will be available.
Deferred tax assets and deferred tax liabilities are offset, if a legally enforceable right exists to set-off current tax assets against current tax liabilities and the deferred tax assets and deferred taxes relate to the same taxable entity and the same taxation authority.
Minimum Alternate Tax (MAT) paid in accordance with the tax laws, which gives future economic benefits in the form of adjustment to future income tax liability, is considered as an asset if there is convincing evidence that the Company will pay normal income tax. Accordingly, MAT is recognised as an asset in the Balance Sheet when it is probable that future economic benefit associated with it will flow to the Company.
2.16 Impairment of assets The carrying values of assets / cash generating units at each balance sheet date are reviewed for
impairment if any indication of impairment exists.
If the carrying amount of the assets exceed the estimated recoverable amount, an impairment is recognised for such excess amount. The impairment loss is recognised as an expense in the Statement of Profit and Loss, unless the asset is carried at revalued amount, in which case any impairment loss of the revalued asset is treated as a revaluation decrease to the extent a revaluation reserve is available for that asset.
The recoverable amount is the greater of the net selling price and their value in use. Value in use is arrived at by discounting the future cash flows to their present value based on an appropriate discount factor.
When there is indication that an impairment loss recognised for an asset (other than a revalued asset) in earlier accounting periods no longer exists or may have decreased, such reversal of impairment loss is recognised in the Statement of Profit and Loss, to the extent the amount was previously charged to the Statement of Profit and Loss. In case of revalued assets such reversal is not recognised.
2.17 Provisions and Contingencies A provision is recognised when the Company has a present obligation as a result of past events and
it is probable that an outflow of resources will be required to settle the obligation in respect of which a reliable estimate can be made. Provisions (excluding retirement benefits) are not discounted to their present value and are determined based on the best estimate required to settle the obligation at the balance sheet date. These are reviewed at each balance sheet date and adjusted to reflect the current best estimates. Contingent liabilities are disclosed in the Notes. Contingent assets are not recognised in the financial statements.
2.18 Operating Cycle Based on the nature of products / activities of the Company and the normal time between acquisition of
assets and their realization in cash or cash equivalents, the Company has determined its operating cycle as 12 months for the purpose of classification of its assets and liabilities as current and non-current.
NOTES TO FINANCIAL STATEMENTS FOR THE YEAR ENDED MARCH 31, 2017
47
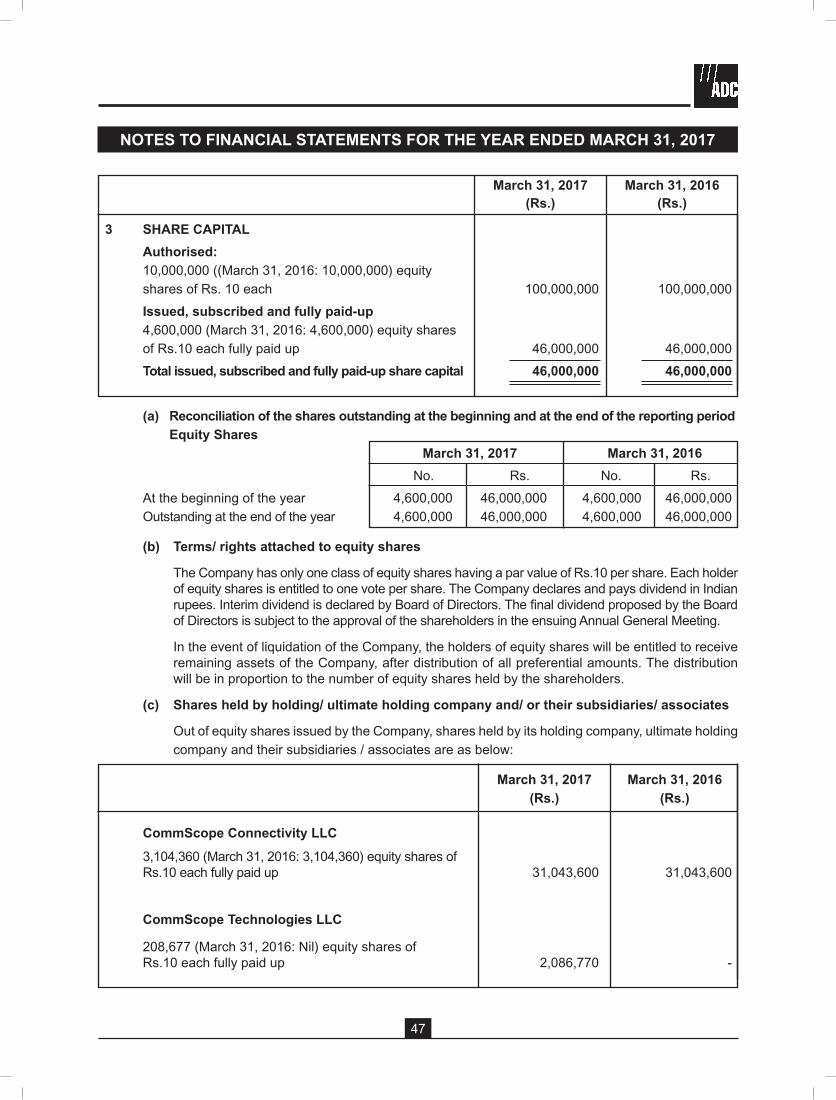
March 31, 2017 March 31, 2016 (Rs.) (Rs.)
3 SHARE CAPITAL Authorised: 10,000,000 ((March 31, 2016: 10,000,000) equity shares of Rs. 10 each 100,000,000 100,000,000 Issued, subscribed and fully paid-up 4,600,000 (March 31, 2016: 4,600,000) equity shares of Rs.10 each fully paid up 46,000,000 46,000,000 Total issued, subscribed and fully paid-up share capital 46,000,000 46,000,000
(a) Reconciliation of the shares outstanding at the beginning and at the end of the reporting period Equity Shares March 31, 2017 March 31, 2016 No. Rs. No. Rs. At the beginning of the year 4,600,000 46,000,000 4,600,000 46,000,000 Outstanding at the end of the year 4,600,000 46,000,000 4,600,000 46,000,000
(b) Terms/ rights attached to equity shares
The Company has only one class of equity shares having a par value of Rs.10 per share. Each holder of equity shares is entitled to one vote per share. The Company declares and pays dividend in Indian rupees. Interim dividend is declared by Board of Directors. The final dividend proposed by the Board of Directors is subject to the approval of the shareholders in the ensuing Annual General Meeting.
In the event of liquidation of the Company, the holders of equity shares will be entitled to receive remaining assets of the Company, after distribution of all preferential amounts. The distribution will be in proportion to the number of equity shares held by the shareholders.
(c) Shares held by holding/ ultimate holding company and/ or their subsidiaries/ associates
Out of equity shares issued by the Company, shares held by its holding company, ultimate holding company and their subsidiaries / associates are as below:
March 31, 2017 March 31, 2016 (Rs.) (Rs.)
CommScope Connectivity LLC 3,104,360 (March 31, 2016: 3,104,360) equity shares of Rs.10 each fully paid up 31,043,600 31,043,600
CommScope Technologies LLC
208,677 (March 31, 2016: Nil) equity shares of Rs.10 each fully paid up 2,086,770 -
NOTES TO FINANCIAL STATEMENTS FOR THE YEAR ENDED MARCH 31, 2017
Twenty Ninth Annual Report
48
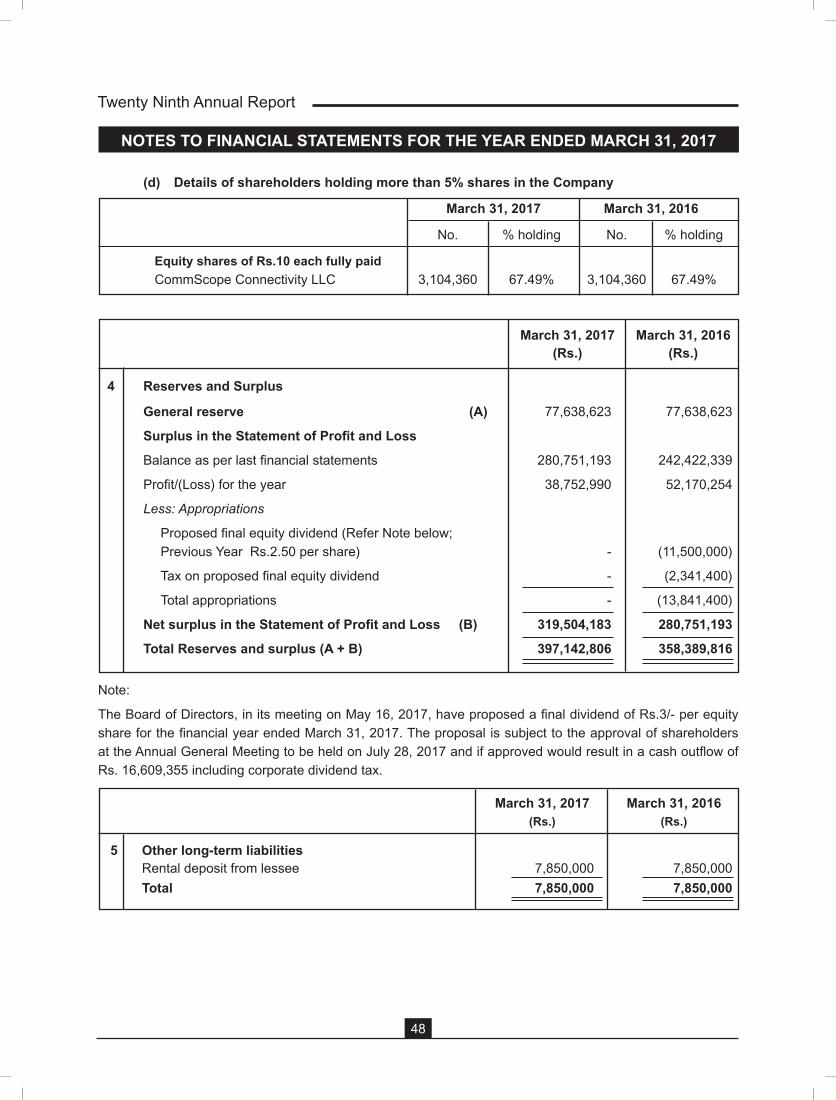
(d) Details of shareholders holding more than 5% shares in the Company
March 31, 2017 March 31, 2016
No. % holding No. % holding
Equity shares of Rs.10 each fully paid CommScope Connectivity LLC 3,104,360 67.49% 3,104,360 67.49%
March 31, 2017 March 31, 2016 (Rs.) (Rs.)
4 Reserves and Surplus
General reserve (A) 77,638,623 77,638,623
Surplus in the Statement of Profit and Loss
Balance as per last financial statements 280,751,193 242,422,339
Profit/(Loss) for the year 38,752,990 52,170,254
Less: Appropriations
Proposed final equity dividend (Refer Note below; Previous Year Rs.2.50 per share) - (11,500,000)
Tax on proposed final equity dividend - (2,341,400)
Total appropriations - (13,841,400)
Net surplus in the Statement of Profit and Loss (B) 319,504,183 280,751,193
Total Reserves and surplus (A + B) 397,142,806 358,389,816
Note:
The Board of Directors, in its meeting on May 16, 2017, have proposed a final dividend of Rs.3/- per equity share for the financial year ended March 31, 2017. The proposal is subject to the approval of shareholders at the Annual General Meeting to be held on July 28, 2017 and if approved would result in a cash outflow of Rs. 16,609,355 including corporate dividend tax.
March 31, 2017 March 31, 2016 (Rs.) (Rs.)
5 Other long-term liabilities Rental deposit from lessee 7,850,000 7,850,000 Total 7,850,000 7,850,000
NOTES TO FINANCIAL STATEMENTS FOR THE YEAR ENDED MARCH 31, 2017
49
NOTES TO FINANCIAL STATEMENTS FOR THE YEAR ENDED MARCH 31, 2017
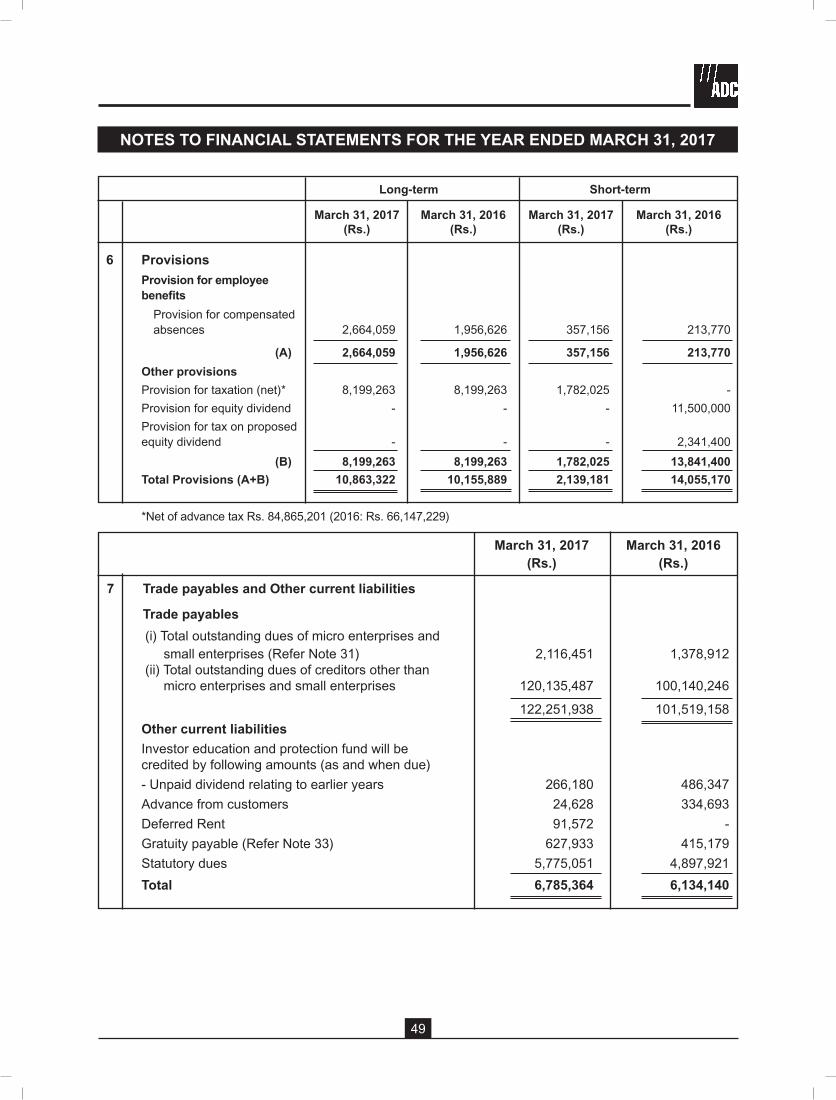
Long-term Short-term
March 31, 2017 March 31, 2016 March 31, 2017 March 31, 2016 (Rs.) (Rs.) (Rs.) (Rs.)
6 Provisions Provision for employee
benefits Provision for compensated
absences 2,664,059 1,956,626 357,156 213,770
(A) 2,664,059 1,956,626 357,156 213,770 Other provisions Provision for taxation (net)* 8,199,263 8,199,263 1,782,025 - Provision for equity dividend - - - 11,500,000 Provision for tax on proposed
equity dividend - - - 2,341,400 (B) 8,199,263 8,199,263 1,782,025 13,841,400
Total Provisions (A+B) 10,863,322 10,155,889 2,139,181 14,055,170
*Net of advance tax Rs. 84,865,201 (2016: Rs. 66,147,229)
March 31, 2017 March 31, 2016 (Rs.) (Rs.)
7 Trade payables and Other current liabilities
Trade payables (i) Total outstanding dues of micro enterprises and
small enterprises (Refer Note 31) 2,116,451 1,378,912 (ii) Total outstanding dues of creditors other than micro enterprises and small enterprises 120,135,487 100,140,246
122,251,938 101,519,158 Other current liabilities Investor education and protection fund will be
credited by following amounts (as and when due) - Unpaid dividend relating to earlier years 266,180 486,347 Advance from customers 24,628 334,693 Deferred Rent 91,572 - Gratuity payable (Refer Note 33) 627,933 415,179 Statutory dues 5,775,051 4,897,921 Total 6,785,364 6,134,140
Twenty Ninth Annual Report
50
NO
TES
TO F
INA
NC
IAL
STAT
EMEN
TS F
OR
TH
E YE
AR
EN
DED
MA
RC
H 3
1, 2
017
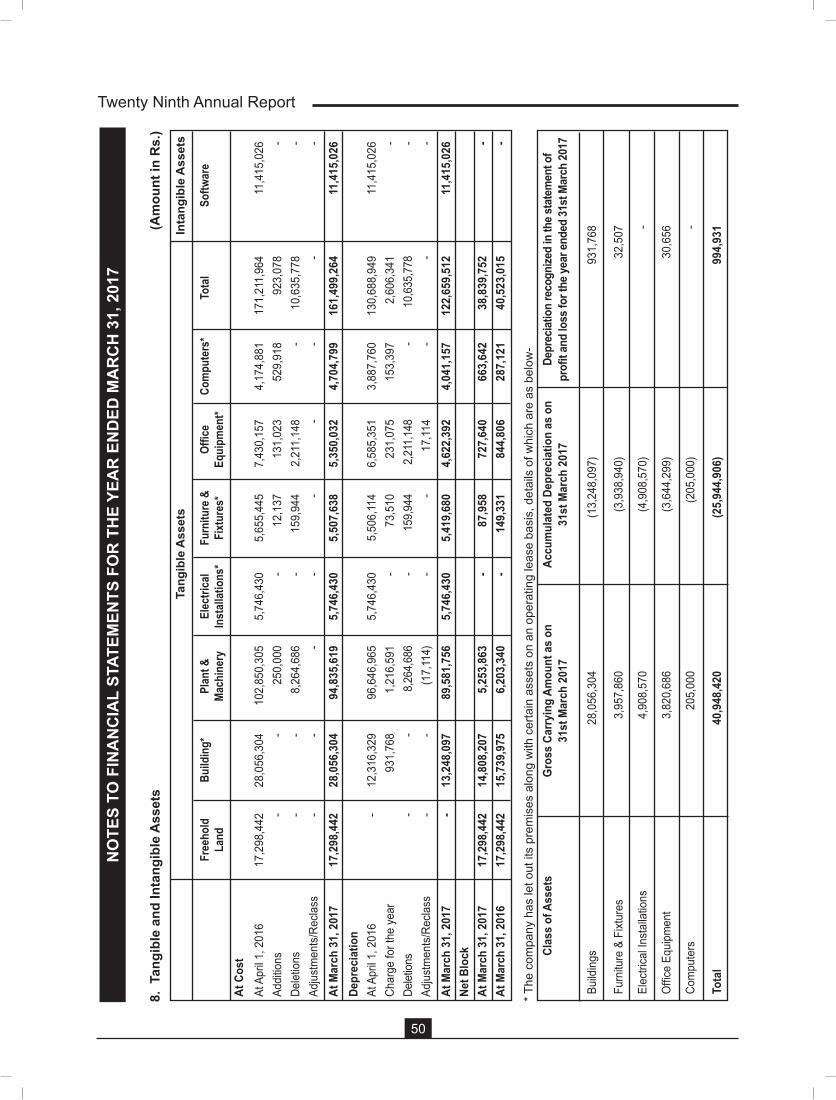
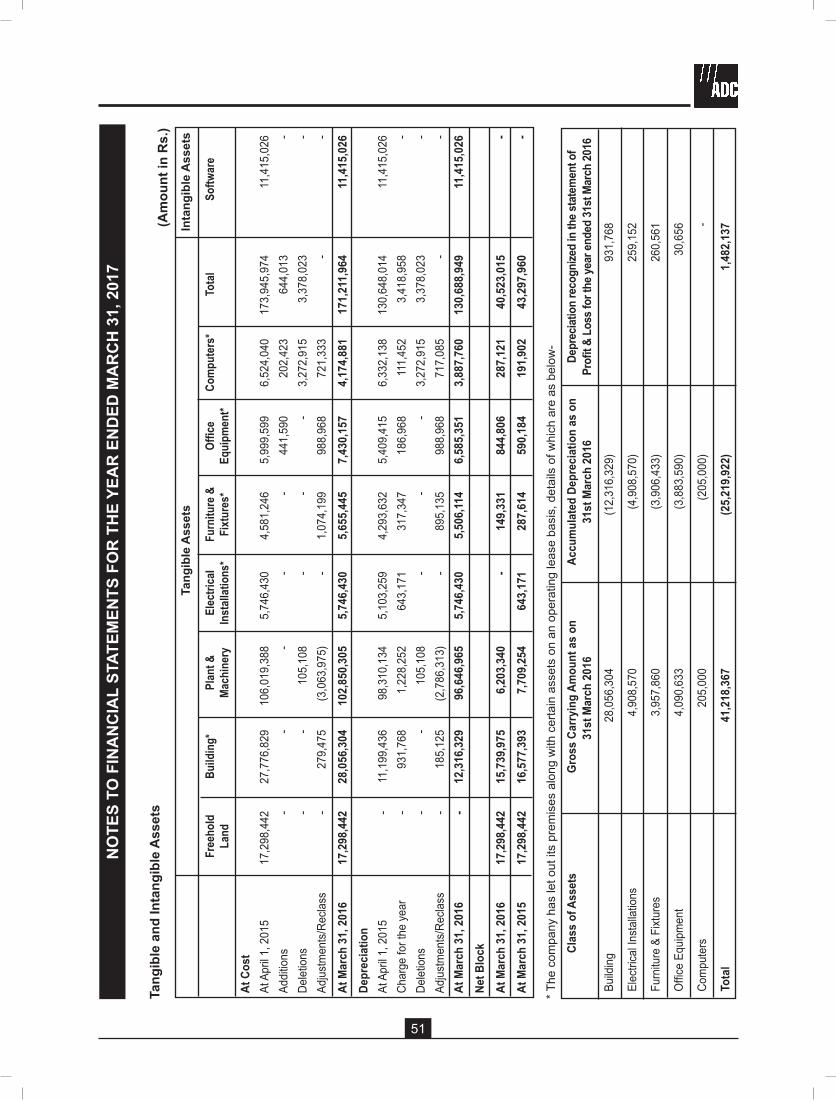
8. T
angi
ble
and
Inta
ngib
le A
sset
s(A
mou
nt in
Rs.
)
Tang
ible
Ass
ets
Inta
ngib
le A
sset
s
Free
hold
Bu
ildin
g*
Plan
t &
Elec
trica
l Fu
rnitu
re &
Of
fice
Com
pute
rs*
Tota
l So
ftwar
e
La
nd
Ma
chin
ery
Inst
allat
ions
* Fi
xtur
es*
Equi
pmen
t*At
Cos
t
At
Apr
il 1, 2
016
17,
298,
442
28,0
56,3
04
102,
850,
305
5,74
6,43
0 5,
655,
445
7,43
0,15
7 4,
174,
881
171,
211,
964
11,4
15,0
26
Addi
tions
-
- 2
50,0
00
- 12
,137
13
1,02
3 52
9,91
8 92
3,07
8 -
Dele
tions
-
- 8
,264
,686
-
159,
944
2,21
1,14
8 -
10,6
35,7
78
-Ad
just
men
ts/R
ecla
ss
- -
- -
- -
- -
-At
Mar
ch 3
1, 2
017
17,
298,
442
28,0
56,3
04
94,8
35,6
19
5,74
6,43
0 5,
507,
638
5,35
0,03
2 4,
704,
799
161,
499,
264
11
,415
,026
De
prec
iatio
n
At
Apr
il 1, 2
016
-
12,3
16,3
29
96,6
46,9
65
5,74
6,43
0 5,
506,
114
6,58
5,35
1 3,
887,
760
130,
688,
949
11,4
15,0
26
Char
ge fo
r the
yea
r
931,
768
1,21
6,59
1 -
73,5
10
231,
075
153,
397
2,60
6,34
1 -
Delet
ions
- -
8,26
4,68
6 -
159,
944
2,21
1,14
8 -
10,6
35,7
78
-Ad
just
men
ts/R
ecla
ss
- -
(17,
114)
-
- 17
,114
-
- -
At M
arch
31,
201
7 -
13,2
48,0
97
89,5
81,7
56
5,74
6,43
0 5,
419,
680
4,62
2,39
2 4,
041,
157
122,
659,
512
11,4
15,0
26Ne
t Blo
ck
At M
arch
31,
201
7 1
7,29
8,44
2
14,8
08,2
07
5,25
3,86
3 -
87,9
58
727
,640
66
3,64
2 38
,839
,752
-
At
Mar
ch 3
1, 2
016
17,
298,
442
15,7
39,9
75
6,20
3,34
0 -
149,
331
844,
806
287,
121
40,5
23,0
15
-
* The
com
pany
has
let o
ut it
s pr
emis
es a
long
with
cer
tain
ass
ets
on a
n op
erat
ing
leas
e ba
sis,
det
ails
of w
hich
are
as
belo
w-
Clas
s of
Ass
ets
Build
ings
28
,056
,304
(1
3,24
8,09
7)
931,
768
Furn
iture
& F
ixtur
es
3,95
7,86
0 (3
,938
,940
) 32
,507
Elec
trica
l Ins
talla
tions
4,
908,
570
(4,9
08,5
70)
-
Offi
ce E
quip
men
t 3,
820,
686
(3,6
44,2
99)
30,6
56
Com
pute
rs
205,
000
(205
,000
) -
Tota
l
40,9
48,4
20
(25,
944,
906)
99
4,93
1
Gros
s Ca
rryin
g Am
ount
as
on
31st
Mar
ch 2
017
Accu
mul
ated
Dep
reci
atio
n as
on
31
st M
arch
201
7De
prec
iatio
n re
cogn
ized
in th
e sta
tem
ent o
f pr
ofit a
nd lo
ss fo
r the
year
ende
d 31
st M
arch
2017
51
(Am
ount
in R
s.)
NO
TES
TO F
INA
NC
IAL
STAT
EMEN
TS F
OR
TH
E YE
AR
EN
DED
MA
RC
H 3
1, 2
017
* The
com
pany
has
let o
ut it
s pr
emis
es a
long
with
cer
tain
ass
ets
on a
n op
erat
ing
leas
e ba
sis,
det
ails
of w
hich
are
as
belo
w-
Clas
s of
Ass
ets
Build
ing
28
,056
,304
(1
2,31
6,32
9)
931,
768
Elec
trica
l Ins
talla
tions
4
,908
,570
(4
,908
,570
) 25
9,15
2
Furn
iture
& F
ixtur
es
3,9
57,8
60
(3,9
06,4
33)
260,
561
Offi
ce E
quip
men
t 4
,090
,633
(3
,883
,590
) 30
,656
Com
pute
rs
205
,000
(2
05,0
00)
-
Tota
l
41,2
18,3
67
(25,
219,
922)
1,
482,
137
Gro
ss C
arry
ing
Amou
nt a
s on
31
st M
arch
201
6Ac
cum
ulat
ed D
epre
ciat
ion
as o
n 31
st M
arch
201
6De
prec
iatio
n re
cogn
ized
in th
e sta
tem
ent o
f Pr
ofit &
Los
s for
the y
ear e
nded
31st
Mar
ch 20
16
Tang
ible
Ass
ets
Inta
ngib
le A
sset
s
Free
hold
Bu
ildin
g*
Plan
t &
Elec
trica
l Fu
rnitu
re &
Of
fice
Com
pute
rs*
Tota
l So
ftwar
e
La
nd
Ma
chin
ery
Inst
allat
ions
* Fi
xtur
es*
Equi
pmen
t*At
Cos
t
At
Apr
il 1, 2
015
17,
298,
442
2
7,77
6,82
9
106
,019
,388
5
,746
,430
4
,581
,246
5
,999
,599
6
,524
,040
1
73,9
45,9
74
11,
415,
026
Addi
tions
-
- -
- -
441,
590
2
02,4
23
644
,013
-
Dele
tions
-
- 10
5,10
8
- -
- 3
,272
,915
3
,378
,023
-
Adju
stm
ents
/Rec
lass
-
279
,475
(3
,063
,975
) -
1,0
74,1
99
988
,968
7
21,3
33
-
-
At M
arch
31,
201
6 1
7,29
8,44
2
28,
056,
304
1
02,8
50,3
05
5,7
46,4
30
5,6
55,4
45
7,4
30,1
57
4,1
74,8
81
171
,211
,964
11
,415
,026
De
prec
iatio
n
At
Apr
il 1, 2
015
-
11,
199,
436
9
8,31
0,13
4
5,1
03,2
59
4,2
93,6
32
5,4
09,4
15
6,3
32,1
38
130
,648
,014
1
1,41
5,02
6 Ch
arge
for t
he y
ear
- 9
31,7
68
1,2
28,2
52
643
,171
3
17,3
47
186
,968
1
11,4
52
3,4
18,9
58
-De
letio
ns
- -
105,
108
-
- -
3,2
72,9
15
3,3
78,0
23
-Ad
just
men
ts/R
ecla
ss
- 1
85,1
25
(2,7
86,3
13)
- 8
95,1
35
988
,968
7
17,0
85
-
-At
Mar
ch 3
1, 2
016
-
12,
316,
329
9
6,64
6,96
5
5,7
46,4
30
5,5
06,11
4
6,5
85,3
51
3,8
87,7
60
130
,688
,949
11
,415
,026
Ne
t Blo
ck
At M
arch
31,
201
6 1
7,29
8,44
2
15,
739,
975
6
,203
,340
-
1
49,3
31
844
,806
2
87,1
21
40,
523,
015
-
At
Mar
ch 3
1, 2
015
17,
298,
442
1
6,57
7,39
3
7,7
09,2
54
643
,171
2
87,6
14
590
,184
1
91,9
02
43,
297,
960
-
Tang
ible
and
Inta
ngib
le A
sset
s
Twenty Ninth Annual Report
52
Non-current Current
March 31, 2017 March 31, 2016 March 31, 2017 March 31, 2016 (Rs.) (Rs.) (Rs.) (Rs.)
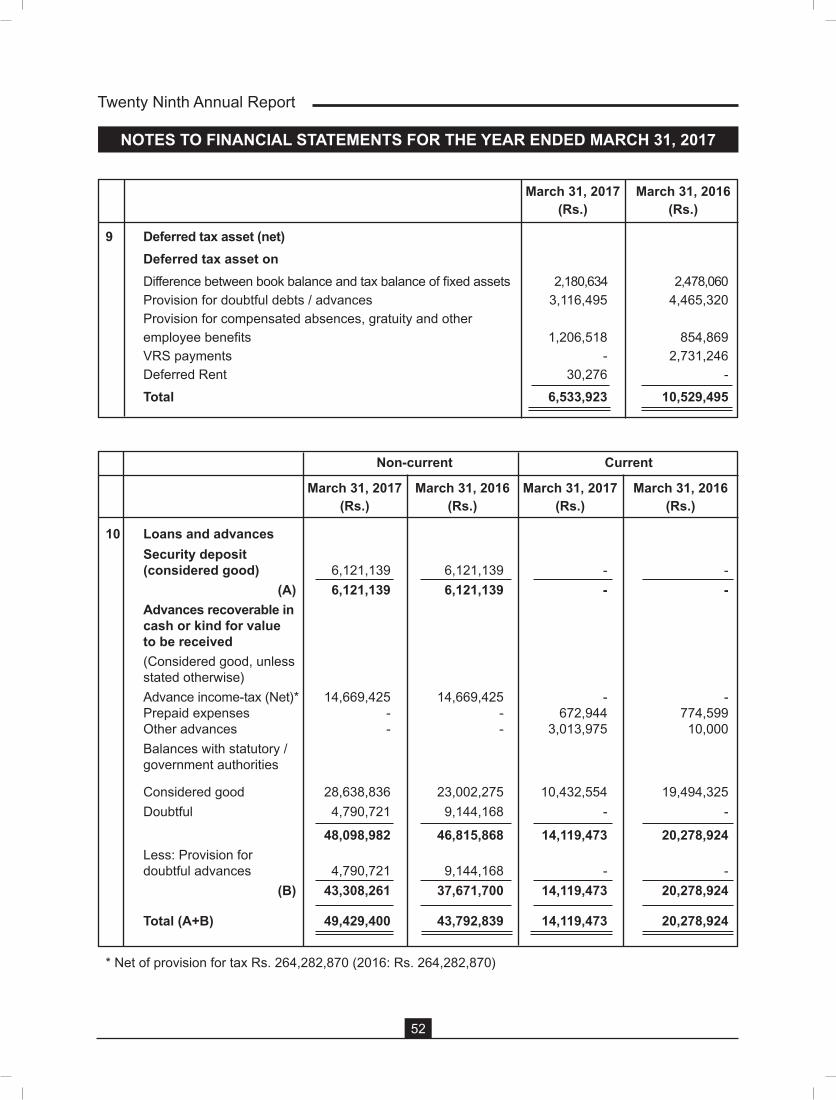
10 Loans and advances Security deposit (considered good) 6,121,139 6,121,139 - - (A) 6,121,139 6,121,139 - - Advances recoverable in cash or kind for value to be received (Considered good, unless stated otherwise) Advance income-tax (Net) * 14,669,425 14,669,425 - - Prepaid expenses - - 672,944 774,599 Other advances - - 3,013,975 10,000 Balances with statutory / government authorities
Considered good 28,638,836 23,002,275 10,432,554 19,494,325 Doubtful 4,790,721 9,144,168 - -
48,098,982 46,815,868 14,119,473 20,278,924 Less: Provision for doubtful advances 4,790,721 9,144,168 - - (B) 43,308,261 37,671,700 14,119,473 20,278,924
Total (A+B) 49,429,400 43,792,839 14,119,473 20,278,924
* Net of provision for tax Rs. 264,282,870 (2016: Rs. 264,282,870)
NOTES TO FINANCIAL STATEMENTS FOR THE YEAR ENDED MARCH 31, 2017
March 31, 2017 March 31, 2016 (Rs.) (Rs.)
9 Deferred tax asset (net) Deferred tax asset on Difference between book balance and tax balance of fixed assets 2,180,634 2,478,060 Provision for doubtful debts / advances 3,116,495 4,465,320 Provision for compensated absences, gratuity and other employee benefits 1,206,518 854,869 VRS payments - 2,731,246 Deferred Rent 30,276 - Total 6,533,923 10,529,495
53
March 31, 2017 March 31, 2016 (Rs.) (Rs.)
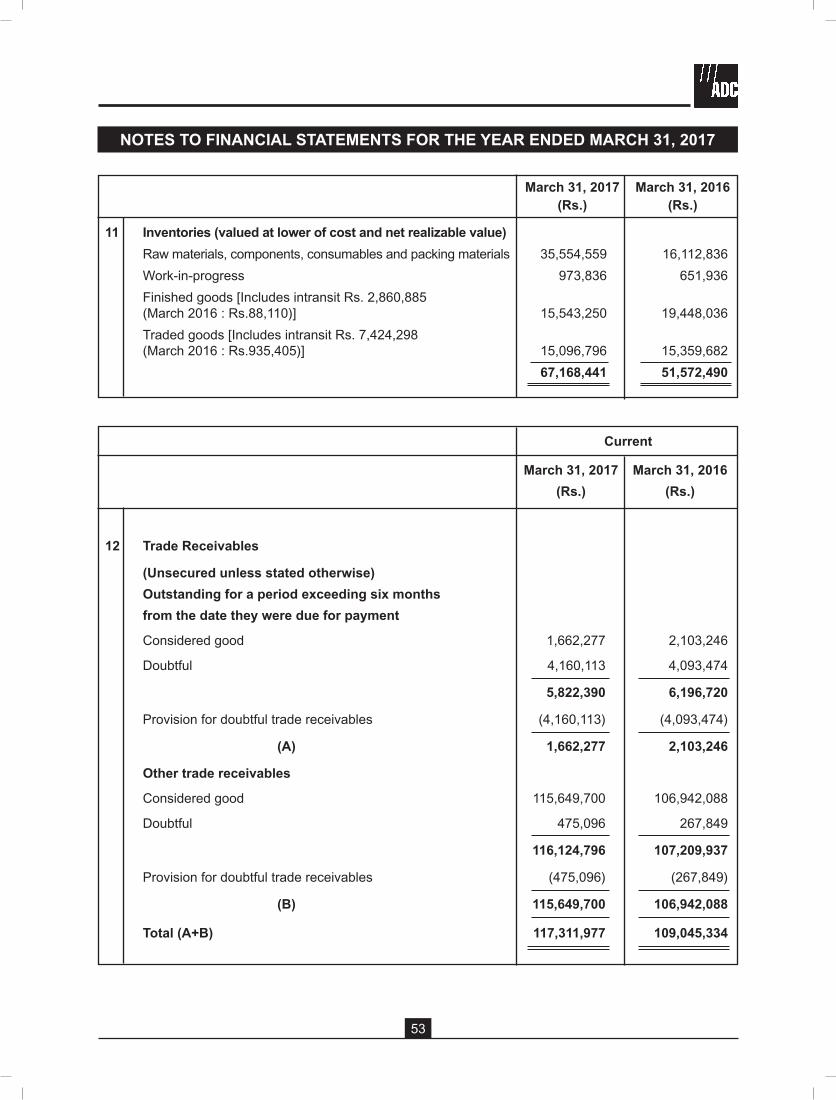
11 Inventories (valued at lower of cost and net realizable value) Raw materials, components, consumables and packing materials 35,554,559 16,112,836 Work-in-progress 973,836 651,936 Finished goods [Includes intransit Rs. 2,860,885 (March 2016 : Rs.88,110)] 15,543,250 19,448,036 Traded goods [Includes intransit Rs. 7,424,298 (March 2016 : Rs.935,405)] 15,096,796 15,359,682 67,168,441 51,572,490
Current
March 31, 2017 March 31, 2016 (Rs.) (Rs.)
12 Trade Receivables
(Unsecured unless stated otherwise) Outstanding for a period exceeding six months from the date they were due for payment
Considered good 1,662,277 2,103,246
Doubtful 4,160,113 4,093,474
5,822,390 6,196,720
Provision for doubtful trade receivables (4,160,113) (4,093,474)
(A) 1,662,277 2,103,246
Other trade receivables
Considered good 115,649,700 106,942,088
Doubtful 475,096 267,849
116,124,796 107,209,937
Provision for doubtful trade receivables (475,096) (267,849)
(B) 115,649,700 106,942,088
Total (A+B) 117,311,977 109,045,334
NOTES TO FINANCIAL STATEMENTS FOR THE YEAR ENDED MARCH 31, 2017
Twenty Ninth Annual Report
54
Current
March 31, 2017 March 31, 2016 (Rs.) (Rs.)
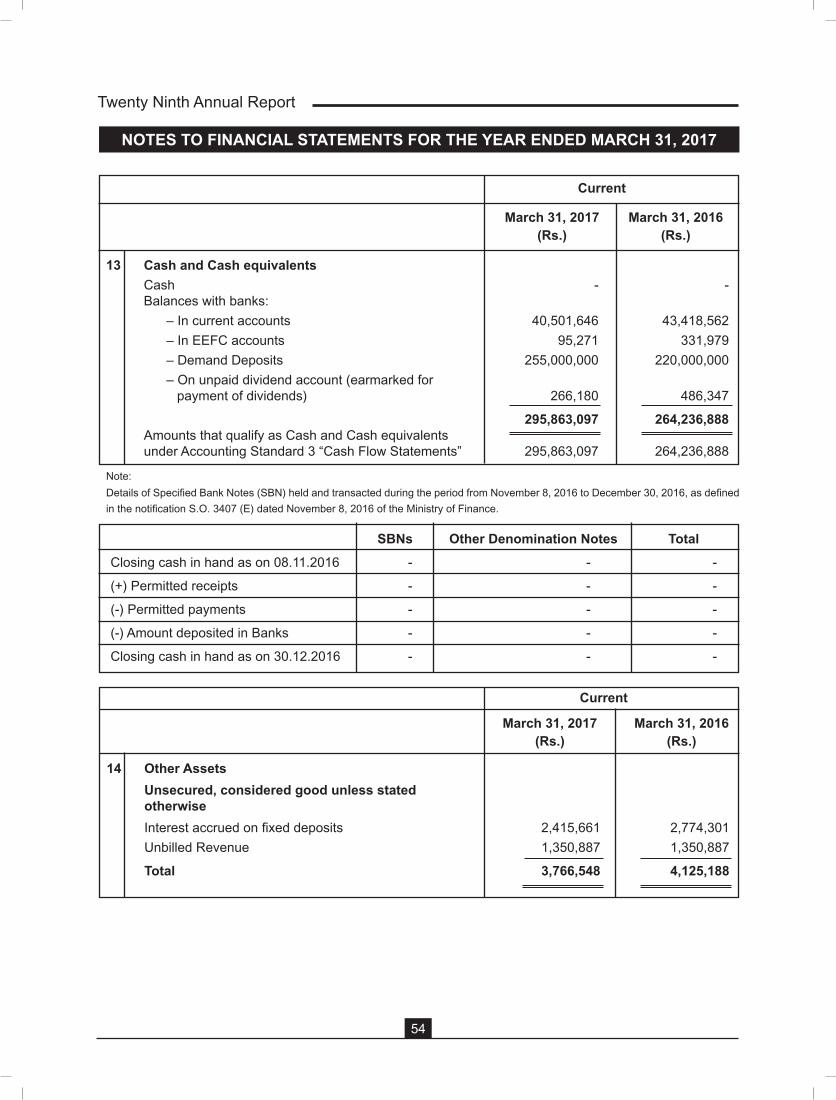
13 Cash and Cash equivalents Cash - - Balances with banks: – In current accounts 40,501,646 43,418,562 – In EEFC accounts 95,271 331,979 – Demand Deposits 255,000,000 220,000,000 – On unpaid dividend account (earmarked for payment of dividends) 266,180 486,347
295,863,097 264,236,888 Amounts that qualify as Cash and Cash equivalents under Accounting Standard 3 “Cash Flow Statements” 295,863,097 264,236,888
Note: Details of Specified Bank Notes (SBN) held and transacted during the period from November 8, 2016 to December 30, 2016, as defined in the notification S.O. 3407 (E) dated November 8, 2016 of the Ministry of Finance.
SBNs Other Denomination Notes TotalClosing cash in hand as on 08.11.2016 - - -
(+) Permitted receipts - - -
(-) Permitted payments - - -
(-) Amount deposited in Banks - - -
Closing cash in hand as on 30.12.2016 - - -
NOTES TO FINANCIAL STATEMENTS FOR THE YEAR ENDED MARCH 31, 2017
Current
March 31, 2017 March 31, 2016 (Rs.) (Rs.)
14 Other Assets Unsecured, considered good unless stated otherwise Interest accrued on fixed deposits 2,415,661 2,774,301 Unbilled Revenue 1,350,887 1,350,887
Total 3,766,548 4,125,188
55
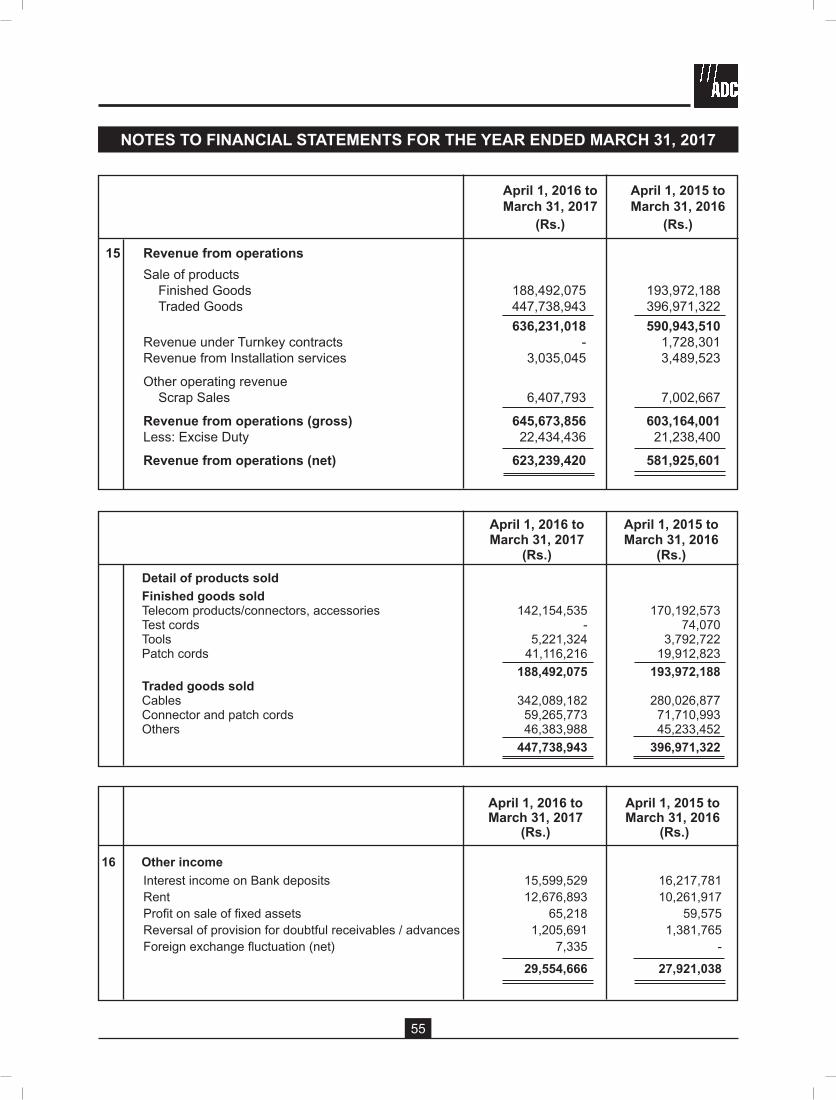
April 1, 2016 to April 1, 2015 to March 31, 2017 March 31, 2016 (Rs.) (Rs.)
15 Revenue from operations Sale of products Finished Goods 188,492,075 193,972,188 Traded Goods 447,738,943 396,971,322 636,231,018 590,943,510 Revenue under Turnkey contracts - 1,728,301 Revenue from Installation services 3,035,045 3,489,523
Other operating revenue Scrap Sales 6,407,793 7,002,667
Revenue from operations (gross) 645,673,856 603,164,001 Less: Excise Duty 22,434,436 21,238,400
Revenue from operations (net) 623,239,420 581,925,601
April 1, 2016 to April 1, 2015 to March 31, 2017 March 31, 2016 (Rs.) (Rs.) Detail of products sold
Finished goods sold Telecom products/connectors, accessories 142,154,535 170,192,573 Test cords - 74,070 Tools 5,221,324 3,792,722 Patch cords 41,116,216 19,912,823 188,492,075 193,972,188 Traded goods sold Cables 342,089,182 280,026,877 Connector and patch cords 59,265,773 71,710,993 Others 46,383,988 45,233,452 447,738,943 396,971,322
April 1, 2016 to April 1, 2015 to March 31, 2017 March 31, 2016 (Rs.) (Rs.)
16 Other income Interest income on Bank deposits 15,599,529 16,217,781 Rent 12,676,893 10,261,917 Profit on sale of fixed assets 65,218 59,575 Reversal of provision for doubtful receivables / advances 1,205,691 1,381,765 Foreign exchange fluctuation (net) 7,335 -
29,554,666 27,921,038
NOTES TO FINANCIAL STATEMENTS FOR THE YEAR ENDED MARCH 31, 2017
Twenty Ninth Annual Report
56
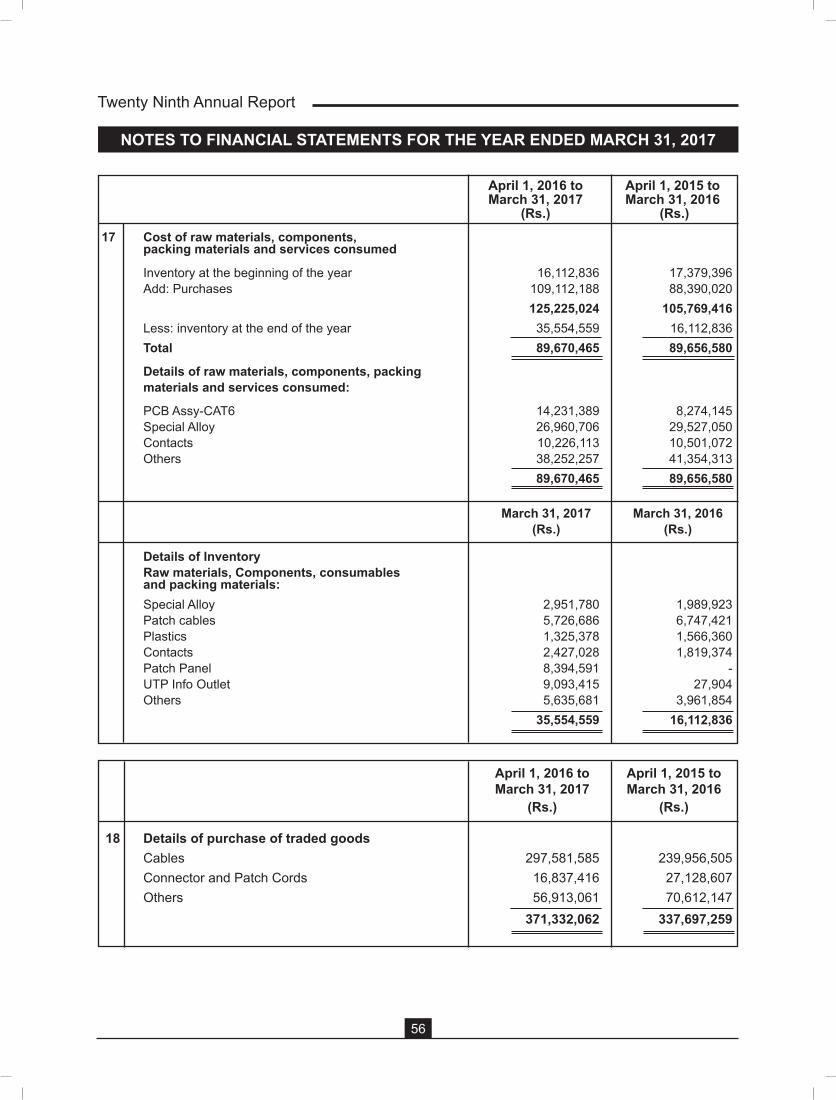
April 1, 2016 to April 1, 2015 to March 31, 2017 March 31, 2016 (Rs.) (Rs.)
18 Details of purchase of traded goods Cables 297,581,585 239,956,505 Connector and Patch Cords 16,837,416 27,128,607 Others 56,913,061 70,612,147 371,332,062 337,697,259
NOTES TO FINANCIAL STATEMENTS FOR THE YEAR ENDED MARCH 31, 2017
April 1, 2016 to April 1, 2015 to March 31, 2017 March 31, 2016 (Rs.) (Rs.) 17 Cost of raw materials, components, packing materials and services consumed
Inventory at the beginning of the year 16,112,836 17,379,396 Add: Purchases 109,112,188 88,390,020 125,225,024 105,769,416 Less: inventory at the end of the year 35,554,559 16,112,836 Total 89,670,465 89,656,580
Details of raw materials, components, packing materials and services consumed:
PCB Assy-CAT6 14,231,389 8,274,145 Special Alloy 26,960,706 29,527,050 Contacts 10,226,113 10,501,072 Others 38,252,257 41,354,313 89,670,465 89,656,580
March 31, 2017 March 31, 2016 (Rs.) (Rs.)
Details of Inventory Raw materials, Components, consumables and packing materials: Special Alloy 2,951,780 1,989,923 Patch cables 5,726,686 6,747,421 Plastics 1,325,378 1,566,360 Contacts 2,427,028 1,819,374 Patch Panel 8,394,591 - UTP Info Outlet 9,093,415 27,904 Others 5,635,681 3,961,854 35,554,559 16,112,836

57
March 31, 2017 March 31, 2016 (Rs.) (Rs.)
19 (Increase)/ decrease in inventories of finished goods, work-in-progress and traded goods
Inventories at the end of the year Traded goods 15,096,796 15,359,682 Work-in-progress 973,836 651,936 Finished goods 15,543,250 19,448,036 31,613,882 35,459,654 Inventories at the beginning of the year Traded goods 15,359,682 20,465,086 Work-in-progress 651,936 1,552,982 Finished goods 19,448,036 14,575,824 35,459,654 36,593,892 Total 3,845,772 1,134,238
Details of inventory
Traded goods Cables 10,186,785 5,651,811 Connector and patch cords 1,008,860 3,022,800 UTP Info Outlets 2,956,731 3,534,729 Others 944,420 3,150,342 15,096,796 15,359,682 Work-in-progress Telecom products/connectors, accessories 973,836 651,936 973,836 651,936
Finished goods Telecom products/connectors, accessories 15,499,214 18,633,444 Test cords - 10,787 Fibre patch cords 44,036 803,805
15,543,250 19,448,036 April 1, 2016 to April 1, 2015 to
March 31, 2017 March 31, 2016 (Rs.) (Rs.)
20 Employee benefit expense
Salaries, wages and bonus 32,978,471 30,403,116 Contribution to provident and other funds 1,401,100 1,262,794 Staff welfare expenses 677,429 663,383
35,057,000 32,329,293
NOTES TO FINANCIAL STATEMENTS FOR THE YEAR ENDED MARCH 31, 2017
Twenty Ninth Annual Report
58
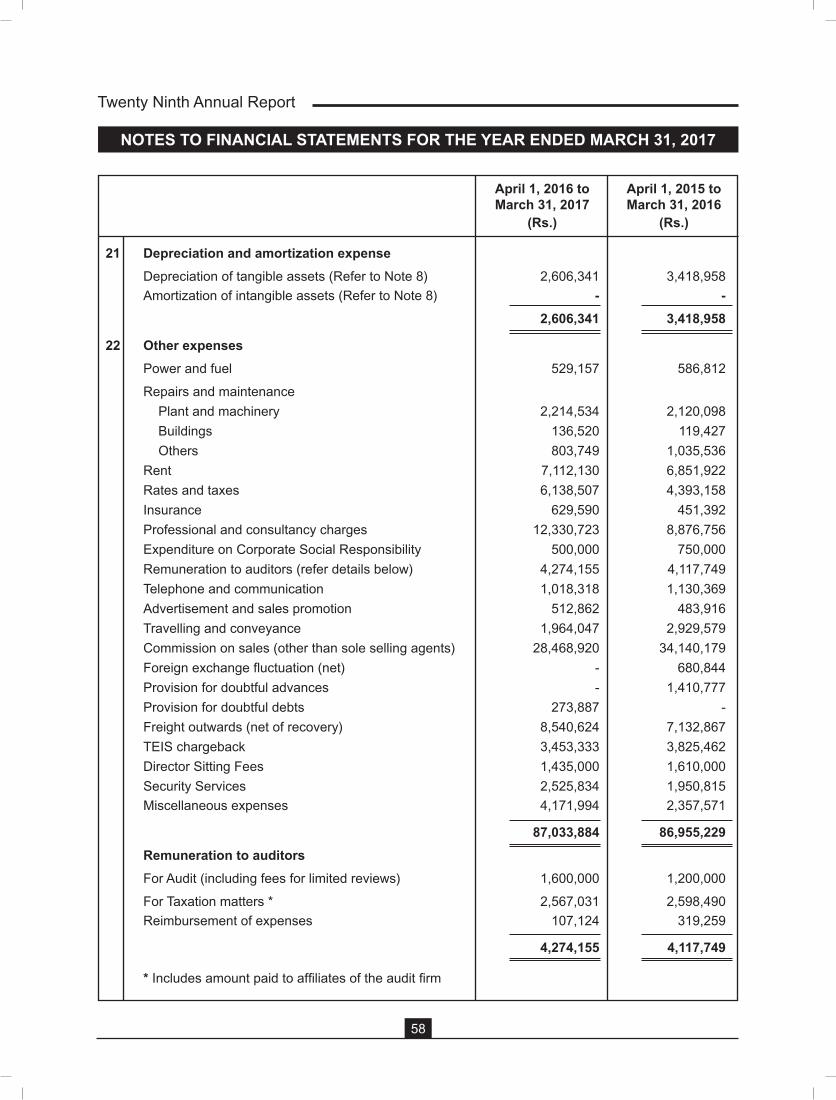
April 1, 2016 to April 1, 2015 to March 31, 2017 March 31, 2016 (Rs.) (Rs.)
21 Depreciation and amortization expense Depreciation of tangible assets (Refer to Note 8) 2,606,341 3,418,958 Amortization of intangible assets (Refer to Note 8) - - 2,606,341 3,418,958
22 Other expenses
Power and fuel 529,157 586,812
Repairs and maintenance Plant and machinery 2,214,534 2,120,098 Buildings 136,520 119,427 Others 803,749 1,035,536 Rent 7,112,130 6,851,922 Rates and taxes 6,138,507 4,393,158 Insurance 629,590 451,392 Professional and consultancy charges 12,330,723 8,876,756 Expenditure on Corporate Social Responsibility 500,000 750,000 Remuneration to auditors (refer details below) 4,274,155 4,117,749 Telephone and communication 1,018,318 1,130,369 Advertisement and sales promotion 512,862 483,916 Travelling and conveyance 1,964,047 2,929,579 Commission on sales (other than sole selling agents) 28,468,920 34,140,179 Foreign exchange fluctuation (net) - 680,844 Provision for doubtful advances - 1,410,777 Provision for doubtful debts 273,887 - Freight outwards (net of recovery) 8,540,624 7,132,867 TEIS chargeback 3,453,333 3,825,462 Director Sitting Fees 1,435,000 1,610,000 Security Services 2,525,834 1,950,815 Miscellaneous expenses 4,171,994 2,357,571
87,033,884 86,955,229 Remuneration to auditors For Audit (including fees for limited reviews) 1,600,000 1,200,000
For Taxation matters * 2,567,031 2,598,490 Reimbursement of expenses 107,124 319,259
4,274,155 4,117,749
* Includes amount paid to affiliates of the audit firm
NOTES TO FINANCIAL STATEMENTS FOR THE YEAR ENDED MARCH 31, 2017
59
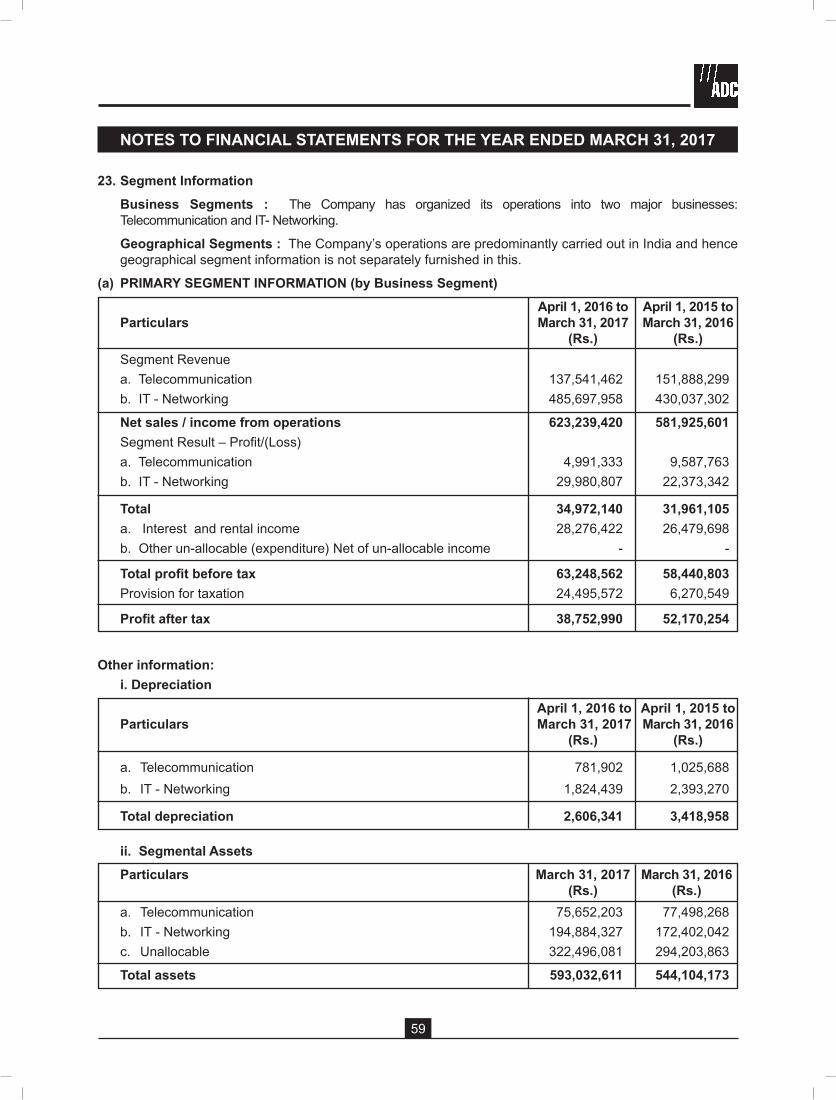
23. Segment Information Business Segments : The Company has organized its operations into two major businesses:
Telecommunication and IT- Networking.
Geographical Segments : The Company’s operations are predominantly carried out in India and hence geographical segment information is not separately furnished in this.
(a) PRIMARY SEGMENT INFORMATION (by Business Segment)
April 1, 2016 to April 1, 2015 to Particulars March 31, 2017 March 31, 2016 (Rs.) (Rs.) Segment Revenue a. Telecommunication 137,541,462 151,888,299 b. IT - Networking 485,697,958 430,037,302
Net sales / income from operations 623,239,420 581,925,601 Segment Result – Profit/(Loss) a. Telecommunication 4,991,333 9,587,763 b. IT - Networking 29,980,807 22,373,342
Total 34,972,140 31,961,105 a. Interest and rental income 28,276,422 26,479,698 b. Other un-allocable (expenditure) Net of un-allocable income - -
Total profit before tax 63,248,562 58,440,803 Provision for taxation 24,495,572 6,270,549
Profit after tax 38,752,990 52,170,254
Other information: i. Depreciation April 1, 2016 to April 1, 2015 to Particulars March 31, 2017 March 31, 2016 (Rs.) (Rs.)
a. Telecommunication 781,902 1,025,688 b. IT - Networking 1,824,439 2,393,270
Total depreciation 2,606,341 3,418,958
ii. Segmental Assets Particulars March 31, 2017 March 31, 2016 (Rs.) (Rs.) a. Telecommunication 75,652,203 77,498,268 b. IT - Networking 194,884,327 172,402,042 c. Unallocable 322,496,081 294,203,863
Total assets 593,032,611 544,104,173
NOTES TO FINANCIAL STATEMENTS FOR THE YEAR ENDED MARCH 31, 2017

Twenty Ninth Annual Report
60
Other information: iii. Segmental liabilities
Particulars March 31, 2017 March 31, 2016 (Rs.) (Rs.) a. Telecommunication 21,204,687 22,810,055 b. IT – Networking 108,797,620 86,527,292 c. Unallocable 19,887,498 30,377,010
Total liabilities 149,889,805 139,714,357
iv. Capital expenditure (excluding capital advances)
April 1, 2016 to April 1, 2015 to Particulars March 31, 2017 March 31, 2016 (Rs.) (Rs.)
a. Telecommunication 276,923 193,204
b. IT – Networking 646,155 450,809
Total capital expenditure 923,078 644,013
NOTES TO FINANCIAL STATEMENTS FOR THE YEAR ENDED MARCH 31, 2017
24. Related Party Disclosures Names of related parties and related party relationship Related parties where control exists
Holding Company CommScope Connectivity LLC
Ultimate Holding Company CommScope Holding Company, Inc.
Related Parties with whom transactions have taken place during the year
Fellow Subsidiaries CommScope Technologies Australia Pty Ltd (formerly ADC Communications (Australia) Pty Ltd.) (CommScope Australia)
CommScope Connectivity Solutions LLC (CommScope USA)
CommScope Technologies LLC
CommScope Connectivity (Wuxi) Co, Ltd. (CommScope Wuxi)
TE Connectivity Global Shared Services India Pvt Ltd. (TEGSS)
TE Connectivity Corporation (TE Corporation)
CommScope Connectivity LLC (CommScope LLC) (formerly ADC Telecommunications Inc.) (w.e.f.27th August 2015)
TE Connectivity Solutions GmbH, Switzerland (TE Switzerland) (upto 27th August 2015)
61
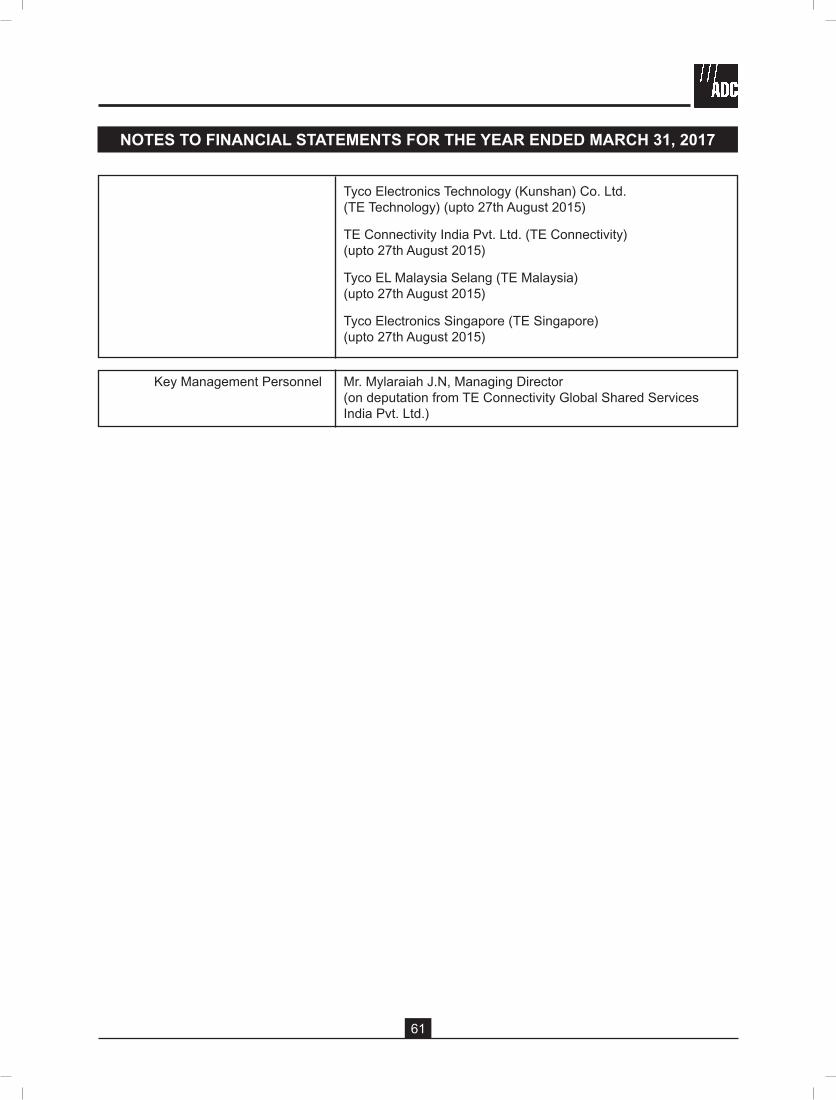
Tyco Electronics Technology (Kunshan) Co. Ltd. (TE Technology) (upto 27th August 2015)
TE Connectivity India Pvt. Ltd. (TE Connectivity) (upto 27th August 2015)
Tyco EL Malaysia Selang (TE Malaysia) (upto 27th August 2015)
Tyco Electronics Singapore (TE Singapore) (upto 27th August 2015)
Key Management Personnel Mr. Mylaraiah J.N, Managing Director (on deputation from TE Connectivity Global Shared Services India Pvt. Ltd.)
NOTES TO FINANCIAL STATEMENTS FOR THE YEAR ENDED MARCH 31, 2017

Twenty Ninth Annual Report
62
NO
TES
TO F
INA
NC
IAL
STAT
EMEN
TS F
OR
TH
E YE
AR
EN
DED
MA
RC
H 3
1, 2
017
Tran
sact
ions
with
rela
ted
part
ies
(
Amou
nt in
Rs.
)
Co
mpan
y Pu
rcha
se of
Sa
le of
good
s TE
IS
Reim
burs
emen
t Co
mmiss
ion
Mana
geria
l Am
ount
s Am
ount
s
go
ods
(IT
Cha
rges
) (L
C Fe
es)
expe
nse
remu
nera
tion
rece
ivable
pa
yable
For t
he ye
ar en
ded M
arch
31, 2
017
As at
Mar
ch 31
, 201
7
Co
mmSc
ope
9,479
,218
- -
825,9
39
- -
- 7,1
09,82
6
Tech
nolog
ies LL
C (-
) (-)
(-)
(-)
(-)
(-)
(-)
(-)
Co
mmSc
ope
- 82
6,458
-
- -
- -
-
Au
strali
a (6
5,094
) (5
83,77
1)
(-)
(-)
(-)
(-)
(100
,774)
(-)
Co
mmSc
ope U
SA
15,01
4,427
-
- -
- -
- -
(3
0,827
,719)
(-)
(-)
(-)
(-)
(-)
(-)
(5
,496,3
87)
TE
Cor
pora
tion
- -
- -
- -
- -
(-)
(-)
(3
,825,4
62)
(-)
(-)
(-)
(-)
(-)
TE
GSS
- -
- -
- -
3,003
,975
-
(-)
(-)
(-)
(-)
(-)
(-)
(-)
(9,40
6,383
)
Co
mmSc
ope W
uxi
72,02
7 3,5
38,29
7 -
- -
- 14
6,970
-
(5
0,636
) (3
,148,8
12)
(-)
(-)
(-)
(-)
(1,63
6,831
) (-)
Co
mmSc
ope L
LC
- -
- -
- -
- -
(1
,903,3
37)
(-)
(-)
(-)
(-)
(-)
(-)
(-)
TE
Swi
tzerla
nd
- -
- -
- -
- -
(4
,459,0
37)
(-)
(-)
(-)
(-)
(-)
(-)
(-)
TE
Tech
nolog
y -
- -
- -
- -
-
(315
,091)
(-)
(-)
(-)
(-)
(-)
(-)
(-)
TE
Con
necti
vity
- -
- -
- -
- -
(1
8,547
,451)
(5
2,980
,807)
(-)
(-)
(2
,787,5
20)
(-)
(-)
(-)
TE
Mala
ysia
- -
- -
- -
- -
(-)
(5
90,61
9)
(-)
(-)
(-)
(-)
(-)
(-)
TE
Sing
apor
e -
- -
- -
- -
-
(-)
(43,0
56)
(-)
(-)
(-)
(-)
(-)
(-)
Mr
. Myla
raiah
-
- -
- -
6,546
,493
- -
(-)
(-)
(-)
(-)
(-)
(7
,283,0
31)
(-)
(-)
1.
Figur
es in
brac
kets
repr
esen
t amo
unts
for pr
eviou
s yea
r end
ed M
arch
31, 2
016.
2.
No am
ounts
in re
spec
t of r
elated
partie
s hav
e bee
n writt
en of
f / ba
ck or
prov
ided f
or du
ring t
he ye
ar.3.
Re
lated
party
relat
ionsh
ips ha
ve be
en id
entifi
ed by
the M
anag
emen
t and
relie
d upo
n by t
he au
ditor
s.

63
25. Leases The Company has entered into non-cancellable operating leases for office premises that are renewable
on a periodic basis. Lease rental expense (net of reimbursements) debited to Statement of profit and loss for the year is Rs. 7,112,130 (March 31, 2016: Rs.6,851,922). The future minimum lease payments under non-cancellable operating leases are as follows
(Amount in Rs.) Particulars March 31, 2017 March 31, 2016 Not later than one year 5,066,992 2,641,086 Later than one year but not later than five years 1,282,010 - Later than five years - -
The Company has given on lease certain assets under cancellable operating leases that are renewable on a periodic basis. Lease rental Income credited to Statement of profit and loss for the year is Rs.12,676,893 (March 31, 2016: Rs. 10,261,917)
26. Contingent Liabilities (Amount in Rs.) Particulars March 31, 2017 March 31, 2016 Central sales tax demands contested by the Company 49,679,182 49,540,849 Income Tax demands contested by the Company 65,648,445 77,073,825 Customs duty, excise duty & service tax demand contested by the Company - -
Total 115,327,627 126,614,674
27. Earnings in foreign currency (accrual basis) (Amount in Rs.) Particulars April 1, 2016 to April 1, 2015 to March 31, 2017 March 31, 2016
Exports at F.O.B. Value 2,665,432 16,422,099
Total 2,665,432 16,422,099
28. Expenditure in foreign currency (accrual basis) (Amount in Rs.) Particulars April 1, 2016 to April 1, 2015 to March 31, 2017 March 31, 2016 TE Information System Charge back 3,453,333 3,825,462
LC Fees Charge back 825,939 -
Total 4,279,272 3,825,462
29. Value of imports calculated on CIF basis (Amount in Rs.) Particulars April 1, 2016 to April 1, 2015 to March 31, 2017 March 31, 2016 Raw materials, components, consumables and packing materials 19,057,942 31,254,460 Traded Goods 25,173,924 46,636,340
Total 44,231,866 77,890,800
NOTES TO FINANCIAL STATEMENTS FOR THE YEAR ENDED MARCH 31, 2017
Twenty Ninth Annual Report
64
NOTES TO FINANCIAL STATEMENTS FOR THE YEAR ENDED MARCH 31, 2017
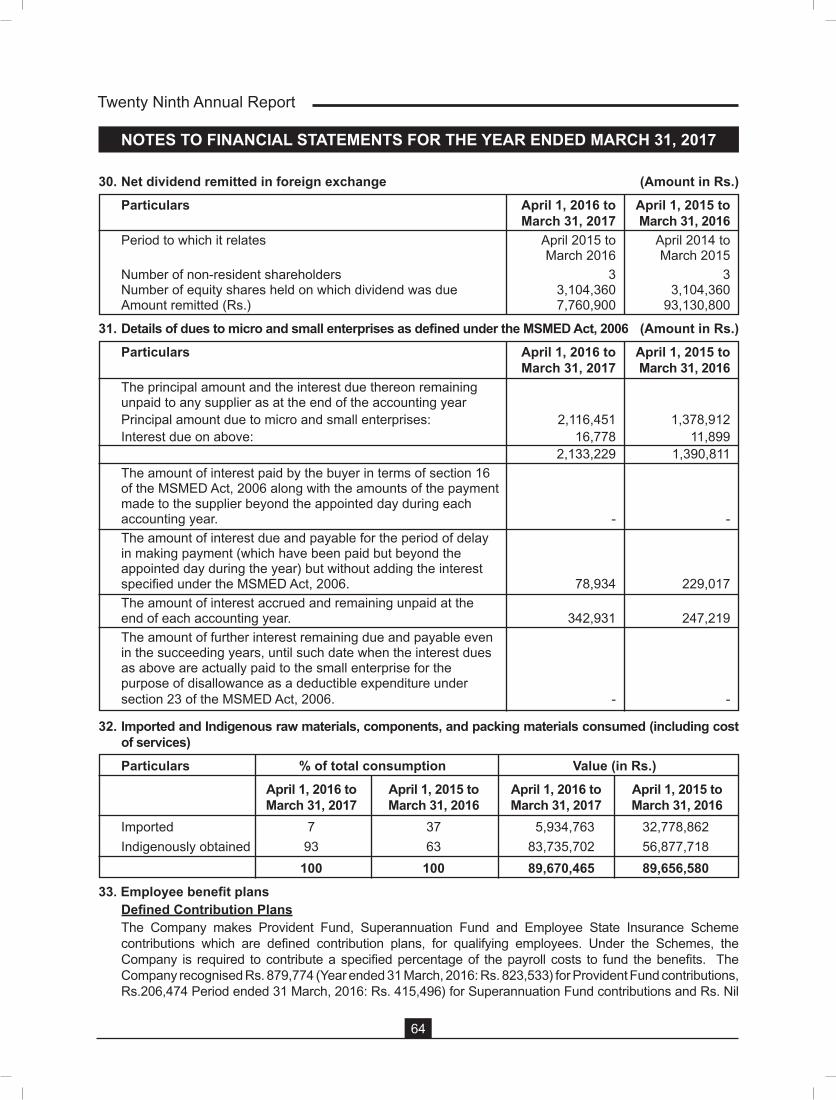
30. Net dividend remitted in foreign exchange (Amount in Rs.) Particulars April 1, 2016 to April 1, 2015 to March 31, 2017 March 31, 2016 Period to which it relates April 2015 to April 2014 to March 2016 March 2015 Number of non-resident shareholders 3 3 Number of equity shares held on which dividend was due 3,104,360 3,104,360 Amount remitted (Rs.) 7,760,900 93,130,800
31. Details of dues to micro and small enterprises as defined under the MSMED Act, 2006 (Amount in Rs.) Particulars April 1, 2016 to April 1, 2015 to March 31, 2017 March 31, 2016 The principal amount and the interest due thereon remaining unpaid to any supplier as at the end of the accounting year Principal amount due to micro and small enterprises: 2,116,451 1,378,912 Interest due on above: 16,778 11,899 2,133,229 1,390,811 The amount of interest paid by the buyer in terms of section 16 of the MSMED Act, 2006 along with the amounts of the payment made to the supplier beyond the appointed day during each accounting year. - - The amount of interest due and payable for the period of delay in making payment (which have been paid but beyond the appointed day during the year) but without adding the interest specified under the MSMED Act, 2006. 78,934 229,017 The amount of interest accrued and remaining unpaid at the end of each accounting year. 342,931 247,219 The amount of further interest remaining due and payable even in the succeeding years, until such date when the interest dues as above are actually paid to the small enterprise for the purpose of disallowance as a deductible expenditure under section 23 of the MSMED Act, 2006. - -
32. Imported and Indigenous raw materials, components, and packing materials consumed (including cost of services)
Particulars % of total consumption Value (in Rs.) April 1, 2016 to April 1, 2015 to April 1, 2016 to April 1, 2015 to March 31, 2017 March 31, 2016 March 31, 2017 March 31, 2016 Imported 7 37 5,934,763 32,778,862 Indigenously obtained 93 63 83,735,702 56,877,718 100 100 89,670,465 89,656,58033. Employee benefit plans Defined Contribution Plans The Company makes Provident Fund, Superannuation Fund and Employee State Insurance Scheme
contributions which are defined contribution plans, for qualifying employees. Under the Schemes, the Company is required to contribute a specified percentage of the payroll costs to fund the benefits. The Company recognised Rs. 879,774 (Year ended 31 March, 2016: Rs. 823,533) for Provident Fund contributions, Rs.206,474 Period ended 31 March, 2016: Rs. 415,496) for Superannuation Fund contributions and Rs. Nil
65
(Period ended 31, March, 2016: Rs. Nil) for Employee State Insurance Scheme contributions in the Statement of Profit and Loss. The contributions payable to these plans by the Company are at rates specified in the rules of the schemes.
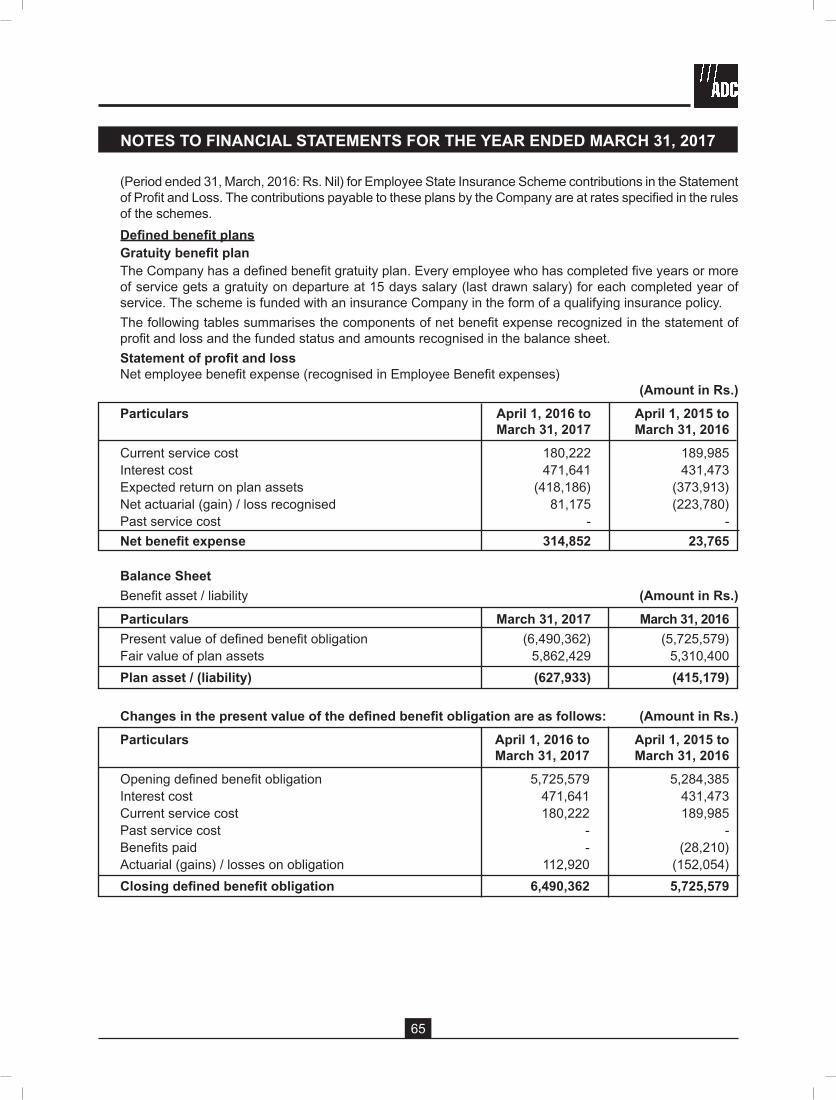
Defined benefit plans Gratuity benefit plan The Company has a defined benefit gratuity plan. Every employee who has completed five years or more
of service gets a gratuity on departure at 15 days salary (last drawn salary) for each completed year of service. The scheme is funded with an insurance Company in the form of a qualifying insurance policy.
The following tables summarises the components of net benefit expense recognized in the statement of profit and loss and the funded status and amounts recognised in the balance sheet.
Statement of profit and loss Net employee benefit expense (recognised in Employee Benefit expenses) (Amount in Rs.) Particulars April 1, 2016 to April 1, 2015 to March 31, 2017 March 31, 2016 Current service cost 180,222 189,985 Interest cost 471,641 431,473 Expected return on plan assets (418,186) (373,913) Net actuarial (gain) / loss recognised 81,175 (223,780) Past service cost - - Net benefit expense 314,852 23,765
Balance Sheet Benefit asset / liability (Amount in Rs.) Particulars March 31, 2017 March 31, 2016 Present value of defined benefit obligation (6,490,362) (5,725,579) Fair value of plan assets 5,862,429 5,310,400 Plan asset / (liability) (627,933) (415,179)
Changes in the present value of the defined benefit obligation are as follows: (Amount in Rs.) Particulars April 1, 2016 to April 1, 2015 to March 31, 2017 March 31, 2016 Opening defined benefit obligation 5,725,579 5,284,385 Interest cost 471,641 431,473 Current service cost 180,222 189,985 Past service cost - - Benefits paid - (28,210) Actuarial (gains) / losses on obligation 112,920 (152,054) Closing defined benefit obligation 6,490,362 5,725,579
NOTES TO FINANCIAL STATEMENTS FOR THE YEAR ENDED MARCH 31, 2017
Twenty Ninth Annual Report
66
NOTES TO FINANCIAL STATEMENTS FOR THE YEAR ENDED MARCH 31, 2017
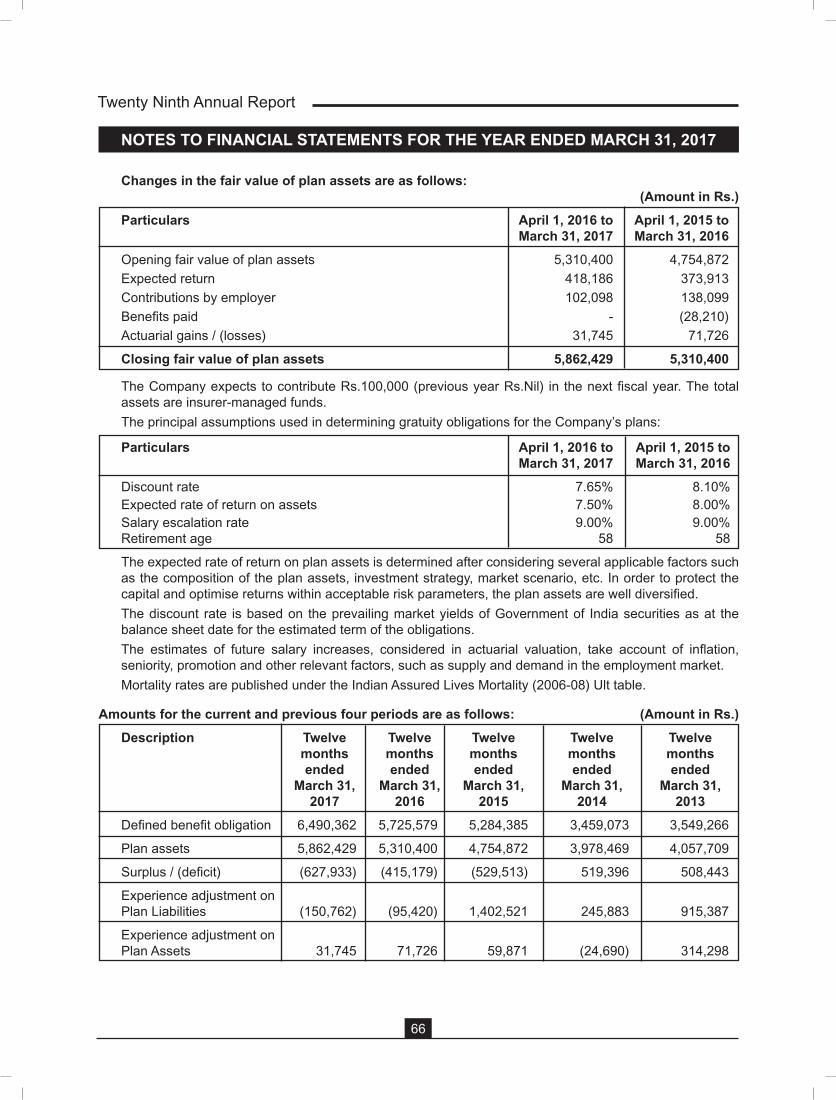
Changes in the fair value of plan assets are as follows: (Amount in Rs.) Particulars April 1, 2016 to April 1, 2015 to March 31, 2017 March 31, 2016 Opening fair value of plan assets 5,310,400 4,754,872 Expected return 418,186 373,913 Contributions by employer 102,098 138,099 Benefits paid - (28,210) Actuarial gains / (losses) 31,745 71,726
Closing fair value of plan assets 5,862,429 5,310,400
The Company expects to contribute Rs.100,000 (previous year Rs.Nil) in the next fiscal year. The total assets are insurer-managed funds.
The principal assumptions used in determining gratuity obligations for the Company’s plans:
Particulars April 1, 2016 to April 1, 2015 to March 31, 2017 March 31, 2016 Discount rate 7.65% 8.10% Expected rate of return on assets 7.50% 8.00% Salary escalation rate 9.00% 9.00% Retirement age 58 58
The expected rate of return on plan assets is determined after considering several applicable factors such as the composition of the plan assets, investment strategy, market scenario, etc. In order to protect the capital and optimise returns within acceptable risk parameters, the plan assets are well diversified.
The discount rate is based on the prevailing market yields of Government of India securities as at the balance sheet date for the estimated term of the obligations.
The estimates of future salary increases, considered in actuarial valuation, take account of inflation, seniority, promotion and other relevant factors, such as supply and demand in the employment market.
Mortality rates are published under the Indian Assured Lives Mortality (2006-08) Ult table.
Amounts for the current and previous four periods are as follows: (Amount in Rs.) Description Twelve Twelve Twelve Twelve Twelve months months months months months ended ended ended ended ended March 31, March 31, March 31, March 31, March 31, 2017 2016 2015 2014 2013 Defined benefit obligation 6,490,362 5,725,579 5,284,385 3,459,073 3,549,266
Plan assets 5,862,429 5,310,400 4,754,872 3,978,469 4,057,709
Surplus / (deficit) (627,933) (415,179) (529,513) 519,396 508,443
Experience adjustment on Plan Liabilities (150,762) (95,420) 1,402,521 245,883 915,387
Experience adjustment on Plan Assets 31,745 71,726 59,871 (24,690) 314,298
67
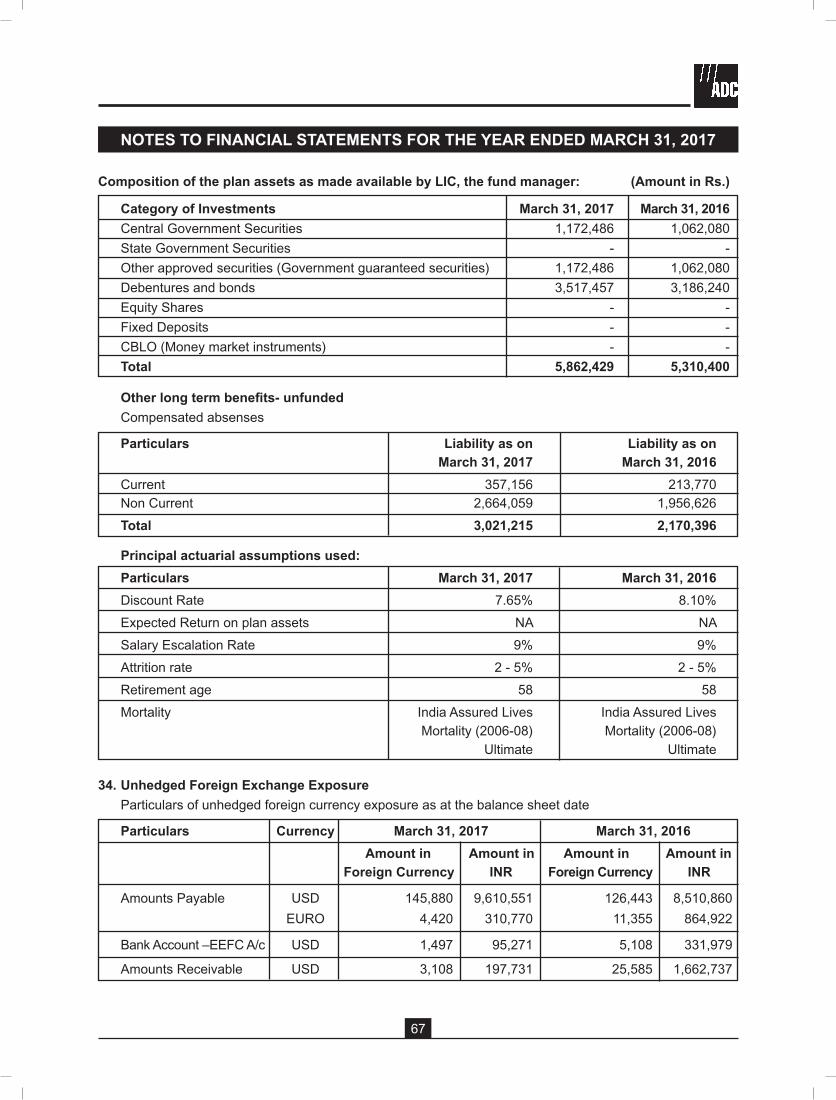
Composition of the plan assets as made available by LIC, the fund manager: (Amount in Rs.)
Category of Investments March 31, 2017 March 31, 2016 Central Government Securities 1,172,486 1,062,080 State Government Securities - - Other approved securities (Government guaranteed securities) 1,172,486 1,062,080 Debentures and bonds 3,517,457 3,186,240 Equity Shares - - Fixed Deposits - - CBLO (Money market instruments) - - Total 5,862,429 5,310,400
Other long term benefits- unfunded Compensated absenses
Particulars Liability as on Liability as on March 31, 2017 March 31, 2016 Current 357,156 213,770 Non Current 2,664,059 1,956,626 Total 3,021,215 2,170,396
Principal actuarial assumptions used: Particulars March 31, 2017 March 31, 2016 Discount Rate 7.65% 8.10% Expected Return on plan assets NA NA Salary Escalation Rate 9% 9% Attrition rate 2 - 5% 2 - 5% Retirement age 58 58 Mortality India Assured Lives India Assured Lives Mortality (2006-08) Mortality (2006-08) Ultimate Ultimate
34. Unhedged Foreign Exchange Exposure Particulars of unhedged foreign currency exposure as at the balance sheet date
Particulars Currency March 31, 2017 March 31, 2016 Amount in Amount in Amount in Amount in Foreign Currency INR Foreign Currency INR
Amounts Payable USD 145,880 9,610,551 126,443 8,510,860 EURO 4,420 310,770 11,355 864,922
Bank Account –EEFC A/c USD 1,497 95,271 5,108 331,979
Amounts Receivable USD 3,108 197,731 25,585 1,662,737
NOTES TO FINANCIAL STATEMENTS FOR THE YEAR ENDED MARCH 31, 2017
Twenty Ninth Annual Report
68
NOTES TO FINANCIAL STATEMENTS FOR THE YEAR ENDED MARCH 31, 2017
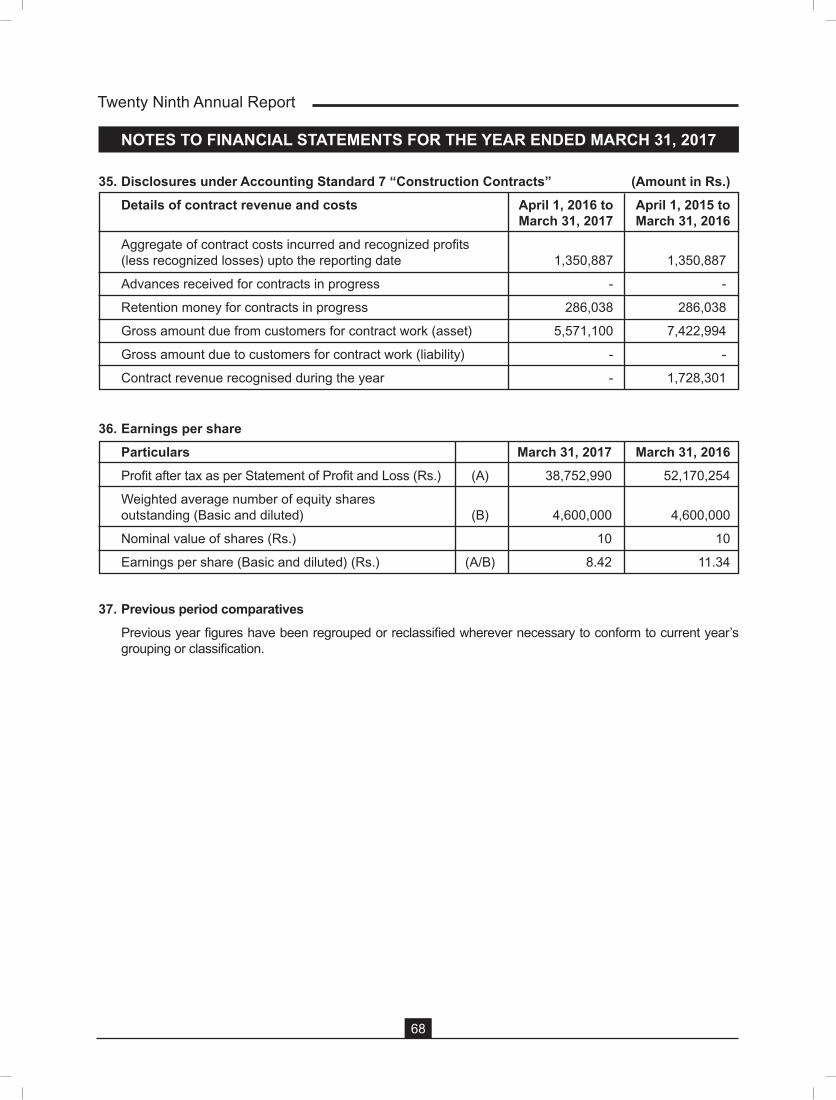
35. Disclosures under Accounting Standard 7 “Construction Contracts” (Amount in Rs.) Details of contract revenue and costs April 1, 2016 to April 1, 2015 to March 31, 2017 March 31, 2016 Aggregate of contract costs incurred and recognized profits (less recognized losses) upto the reporting date 1,350,887 1,350,887
Advances received for contracts in progress - -
Retention money for contracts in progress 286,038 286,038
Gross amount due from customers for contract work (asset) 5,571,100 7,422,994
Gross amount due to customers for contract work (liability) - -
Contract revenue recognised during the year - 1,728,301
36. Earnings per share Particulars March 31, 2017 March 31, 2016 Profit after tax as per Statement of Profit and Loss (Rs.) (A) 38,752,990 52,170,254
Weighted average number of equity shares outstanding (Basic and diluted) (B) 4,600,000 4,600,000
Nominal value of shares (Rs.) 10 10
Earnings per share (Basic and diluted) (Rs.) (A/B) 8.42 11.34
37. Previous period comparatives Previous year figures have been regrouped or reclassified wherever necessary to conform to current year’s
grouping or classification.