tv advertising's killer charts: what every marketer should know
TRANSCRIPT

TV advertising’s killer chartsWhat every marketer should know
46 nickable chartsWith notes
Full Deck
Published: June 2015
Thinkbox is supported by 99% of UK broadcasting
Main shareholders
Associates & supporters

TV Killer Facts
03
01 TV is the best profit generator
02 TV is the lead effectiveness medium
TV has unbeatable scale and reach
05 TV is the most talked about media
06 Multi-screening brings viewers closer to content and brands
We spend more time with TV than any other media04
07 All TV ads can be response ads
08
TV is everywhere09TV is the emotional medium and builds brand fame 10
TV is the catalyst for other media
11 Handy slides

1. TV is the best profit generator

TV is the best profit generator
TV Radio Press Online Display Out of Home£0.00
£0.20
£0.40
£0.60
£0.80
£1.00
£1.20
£1.40
£1.60
£1.80
£2.00
£1.79 £1.52 £1.48
£0.91
£0.37
2008-2011
Pro
fit R
OI
Source: Payback 4, 2008-2011 & 2011-2014, Ebiquity
Payback 4 (2011-2014)

TV is vital for long term profit
TV Other brand Activation-20%
0%
20%
40%
60%
80%
100%
120%
140%
3+ year campaigns onlyA
vera
ge
up
lift i
n p
rofit
effe
cts
Source: ‘Advertising Effectiveness: the long and short of it’, 2013, IPA

We are starting to uncover the payback of TV sponsorship
…a word from our sponsor
Source: Payback 4, 2008-2014, Ebiquity. Retail & FMCG categories only
Ave
rage
Pro
fit R
OI
TV Spot TV Spon Press Radio OOH£0.00
£0.20
£0.40
£0.60
£0.80
£1.00
£1.20
£1.40
£1.60
£1.51
£0.87£0.70 £0.65
£0.50
Based on limited retail and FMCG only
2. TV is the lead effectiveness medium

TV is the lead effectiveness medium
TV Press Radio Online Display Out of Home0%
10%
20%
30%
40%
50%
60%
70%
80%
90%
100%100%
52%
27%
13% 11%
Twice as effective ‘per impact’ as any other medium
Source: Payback 4, 2008-2011 & 2011-2014, Ebiquity
Effe
ctiv
ene
ss I
ndex
TV
Ind
ex =
100

Largest effects accumulate over time
Number of very large business effects
% Very large profit gains0
10
20
30
40
50
60
70
80
90
100
1 year2 year3+ yearsIn
de
x
Source: ‘Advertising Effectiveness: the long and short of it’, 2013, IPA

Nearly half of TV’s sales effects are delivered after the first year of investment
Year 1 Year 2 Year 3 Year 4 Year 50%
20%
40%
60%
80%
100%
Rev
enue
effe
ct a
s %
of
year
1
effe
ct
TV
The effects of TV are long lasting
Source: Payback 1, 2008, PriceWaterhouseCoopers

TV gives the best business results
TVRadio
Press
Posters
Internet
Sponsorship PR0%
5%
10%
15%
20%
25%
30%
35%
40%
45%
Incr
ea
se in
no
. of b
usi
ne
ss e
ffect
s
Source: ‘Advertising Effectiveness: the long and short of it’, 2013, IPA

TV is by far the most trusted form of advertising
37%
TV Set
12%
Newspapers
7%
7%
Radio
7%
Magazines
3% 3% 3%
Websites Search Social media Outdoor
Source: TV Nation, 2014, Ipsos Media CT/Thinkbox. Base: all adults 15+. Question: ‘in which, if any, of the following places are you most likely to find advertising that you trust?’
Media where you’re most likely to find advertising that you trust

3. TV has unbeatable scale and reach

TV has extremely high daily, weekly and monthly reach
Source: BARB, 2014, individuals, reach 1min+
Commercial TV reaches
71.4% of the population in a day
92.8% of the population in a week
98.2% of the population in a month

Commercial reach has remained stable over 5 years
Source: BARB, 2014, reach 1min+
Weekly reach %2010 2011 2012 2014
92.8
93.3
92.3
88.6
92.4
90
Individuals
Adults
ABC1 adults
16-34
Men
Kids
2013
Women 94.2
92.6 93.7 93.5 93.4
93.1 94 93.8 93.8
92.1 93.2 92.8 92.6
88.2 90.1 89.6 89.5
92.3 93 92.9 92.7
89.8 91.6 91.6 91.4
93.9 95 94.7 94.8

TV not only has reach, but also has volume
0.0 0.5 1.0 1.5 2.0 2.5 3.0 3.5 4.00
10
20
30
40
50
60
70
80
90
100TV (any)
Commercial radio
Travelling (OOH)
Social NetworkingNewspaper (any)
Magazine
Cinema
Ave hours per day
% W
eekl
y re
ach
Source: Touchpoints 5, 2014, IPA. Base: adults 15+. TV, radio, newspaper & magazine figures include online/app consumption
Online TV
Commercial TV
InternetRadio (any)
Adults 15+

4. We spend more time with TV than any other media

TV accounts for nearly half of people’s chosen media day
TV 48.0%
Radio 21.2%
Video clips/movies/music online 1.9%
Adults 15+
Includes only media which people choose to consume (i.e. excludes out of home)Source: Touchpoints 5, 2014, IPA. Base: adults 15+. TV, radio, newspaper & magazine figures include online/app consumption
Newspapers 3.9%
Magazines 0.6%Cinema 0.4%
• TV, radio, newspaper & magazine figures include online/app consumption
Other online activity 1.3%
Online games 1.1%
Online buying/product info/banking 1.6%
Online browsing/info seeking 4.6%
Internet for work 3.7%
Email 5.6%
Social networking/messaging 6.2%

TV accounts for over 40% of 15-24s chosen media day
TV 41.3%
Radio 13.1%
Adults 15-24
Newspapers 1.4%Magazines 0.4%
Cinema 1.0%
• TV, radio, newspaper & magazine figures include consumption via internet/appsOther online activity 1.5%
Online games 1.8%
Online buying/product info/banking 1.8%
Online browsing/info seeking 7.4%
Internet for work 3.2%
Email 5.4%
Social networking/messaging 15.7%
Video clips/movies/music online 6.3%
Includes only media which people choose to consume (i.e. excludes out of home)Source: Touchpoints 5, 2014, IPA. Base: adults 15-24. TV, radio, newspaper & magazine figures include online/app consumption
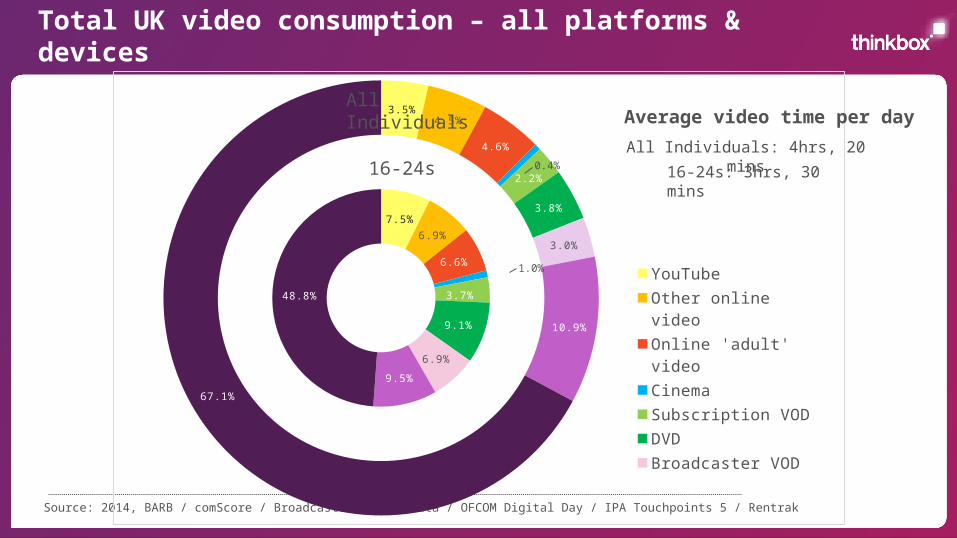
Total UK video consumption – all platforms & devices
Source: 2014, BARB / comScore / Broadcaster stream data / OFCOM Digital Day / IPA Touchpoints 5 / Rentrak
7.5%
6.9%
6.6%
3.7%
9.1%
6.9%
9.5%
48.8%
3.5%4.5%
4.6%
2.2%
3.8%
3.0%
10.9%
67.1%
YouTube
Other online video
Online 'adult' video
Cinema
Subscription VOD
DVD
Broadcaster VOD
Playback TV
Live TV
All Individuals: 4hrs, 20 mins
16-24s: 3hrs, 30 mins
All Individuals
16-24s
Average video time per day
0.4%
1.0%

Commercial TV Online (exc TV, radio, press)
Commercial Radio Newspapers Magazines Cinema
44%
37%
12%
6%
1% 1%
30%
43%
3%
16%
6%
1%
Chosen media day share Ad revenue share
The myth of time spent*
Source: Touchpoints 5, 2014, IPA, and AA/WARC 2014 ad expenditure forecast (Q3) . *Only includes media which people choose to consume (i.e. excludes out of home)
Please note: TV and radio activity is commercial only (i.e. excludes BBC)
Online includes all commercial and non-commercial activity (e.g. BBC, government etc.)

Average daily reach by half hour
6:0
0
6:3
0
7:0
0
7:3
0
8:0
0
8:3
0
9:0
0
9:3
0
10
:00
10
:30
11
:00
11
:30
12
:00
12
:30
13
:00
13
:30
14
:00
14
:30
15
:00
15
:30
16
:00
16
:30
17
:00
17
:30
18
:00
18
:30
19
:00
19
:30
20
:00
20
:30
21
:00
21
:30
22
:00
22
:30
23
:00
23
:30
0
5
10
15
20
25
30
35
40
45
50 TV Radio Newspaper Magazine Internet
Time of day
Source: Touchpoints 5, 2014, IPA. Base: adults 15+. TV, radio, newspaper & magazine figures include online/app consumption
% R
each

We watch 2 hours and 25 mins of commercial TV a day
2004 2005 2006 2007 2008 2009 2010 2011 2012 2013 20140.00
0.50
1.00
1.50
2.00
2.50
3.00
3.50
4.00
4.50
Non-commercial viewing Commercial viewing
No
. of h
ou
rs o
f TV
vie
we
d p
er
da
y
2 hrs 25 m
2 hrs 33 m
2 hrs 34 m
2 hrs 36 m
2 hrs 33 m
1 hr16 m
1 hr19 m
1 hr27 m
1 hr26 m
1 hr29 m
Source: BARB, 2004-2014. Base: individuals
4 hrs 2 m
4 hrs 2 m
4 hrs 1 m
3 hrs 52 m 3 hrs
41 m3 hrs 45 m
3 hrs 44 m
3 hrs 38 m
3 hrs 36 m
3 hrs 39m
3 hrs 42 m
2 hrs 16 m
1 hr26 m
2 hrs 16 m
1 hr23 m
2 hrs 15 m
1 hr21 m
2 hrs 16 m
1 hr22 m
2 hrs 22 m
1 hr22 m
2 hrs 24 m
1 hr21 m

Average person in the UK sees 45 TV ads a day
Source: BARB, 2004 – 2014. Base: individuals*digital switchover complete
Only includes ads viewed at normal speedDaily UK totals are now 2.65 billion TV ads seen every day
2004 2005 2006 2007 2008 2009 2010 2011 2012* 2013 2014
38 39 39 40 42 43 46 47 47 47 45

The majority of TV viewing is live
Source: BARB, 2014. Base: individuals & individuals in DTR homes
Individuals Individuals with DTRs
88%
6%6%
Individuals Individuals with digital recorders (DTRs)
83%
8%
9%
Live Viewed on the same day as live (VOSDAL) Time-shifted viewing within 7 days

Time-shifted viewing stable in DTR homes
Source: ‘Ten Years of Sky Plus’, Q2 2006-Q3 2010, Sky, & BARB Establishment Survey , Q4 2010 onwards, BARB
Q2 06
Q4 06
Q2 07
Q4 07
Q2 08
Q4 08
Q2 09
Q4 09
Q2 10
Q4 10
Q2 11
Q4 11
Q2 12
Q4 12
Q2 13
Q4 13
Q2 14
Q4 14
0
10
20
30
40
50
60
0
10
20
30
40
50
60
DTR penetration (HH) % time-shifted viewing in DTR homes (inds)
% o
f all
vie
win
g
% D
TR
pe
ne
tra
tion
Quarter

Time-shifting is driven by programme genre not ad avoidance
Comm
ercia
l Dra
ma
inc.s
oaps
BBC Dra
ma
inc.s
oaps
Comm
ercia
l Doc
umen
tarie
s
BBC Doc
umen
tarie
s
Comm
ercia
l Film
s
BBC Film
s
Comm
ercia
l Ent
erta
inm
ent
BBC Ent
erta
inm
ent
Comm
ercia
l Kid
s
BBC Kid
s
Comm
ercia
l Spo
rt
BBC Spo
rt
Comm
ercia
l New
s
BBC New
s0%
10%20%30%40%50%60%70%80%90%
100%
65% 64%78% 80% 79% 82% 80% 81%
88% 89% 90% 91% 97% 97%
35% 36%22% 20% 21% 18% 20% 19%
12% 11% 10% 9% 3% 3%
Time-shifted Live
Source: BARB, 2014. Base: individuals in DTR homes, commercial TV vs. BBC

5. TV is the most talked about medium both on and offline

TV ads are the most talked about
Source: TV Nation, 2014, Ipsos Media CT/Thinkbox. Base: all adults 15+. Question: ‘On which medium are you likely to find advertising that you talk about either face to face or over the phone / online?’
On which medium are you likely to find advertising that you talk about…
TV Social networks
Newspapers Websites Online search
Radio Magazines Out of home0%
10%
20%
30%
40%
50%
60%
70%
58%
10% 9% 8% 8%5% 4% 3%
28%
11%
4%8%
5% 3% 3% 2%
Face to face / on the phoneOnline

TV advertising drives 51% of all marketing-generated conversations
Series10%
10%
20%
30%
40%
50%
60%
70%
80%
90%
100%
9%
19%
51%
21%
Paid media TV Brand news, PR & events Product/serviceBase/market/seasonality
Influenced variables
Source: POETIC, 2013, Data2Decisions/Keller Fay/Thinkbox

6. Multi-screening brings viewers closer to content and brands

Multi-screening is a common activity
Source: TouchPoints 5, 2014, IPA. Base: adults 15+
25 mins Using internet while watching TV per day

6:0
06
:30
7:0
07
:30
8:0
08
:30
9:0
09
:30
10
:00
10
:30
11
:00
11
:30
12
:00
12
:30
13
:00
13
:30
14
:00
14
:30
15
:00
15
:30
16
:00
16
:30
17
:00
17
:30
18
:00
18
:30
19
:00
19
:30
20
:00
20
:30
21
:00
21
:30
22
:00
22
:30
23
:00
23
:30
0
5
10
15
20
25
30
35
40
45
50
Watching TV Watching TV and internet use Watching TV and social networking
Time
Ave
. da
ily %
of a
du
ltsMulti-screening usage patterns follow TV
Source: Touchpoints 5, 2014, IPA. Base: adults 15+ who have home internet access

Ad break multi-screeners are more likely to stay in front of ads
% agreeing with each statement
I just stayed where I was and waited for the programme to restart
I left the room during the ad breaks
I found myself watching the adverts almost by accident
57%
36%
35%
49%
41%
28%
Everyone elseMulti-screeners
Source: Screen Life: TV advertising everywhere, 2014, Craft/Thinkbox. Mobile diary 7pm-11pm.

Multi-screening doesn’t reduce ad recall
Average number of adverts recalled from last 15 minutes
Average
I left the room
I fast-forwarded the ads until the programme restarted
I talked to someone else about something unrelated to the adverts on screen
I started using another device
1.9
1.6
1.6
2
2
Source: Screen Life: TV advertising everywhere, 2014, Craft/Thinkbox. Mobile diary 7pm-11pm

7. All TV ads can be response ads

TV is a catalyst for direct response
Source: POETIC, 2013, Data2Decisions/Keller Fay/Thinkbox. % of variables which can be influenced to drive website visits
69%of website visits are
generated by paid media
47%Of these 69% website visits
were generated by paid TV media

People welcome social elements within TV ad campaigns
52% welcome TV campaigns which carry a social media call to action
Source: Screen Life: TV advertising everywhere, 2014, Craft/Thinkbox. Base: individuals 16+
With Facebook and Twitter being the most desired platforms to be directed to

8. TV is the catalyst for other media

TV boosts other advertising channels
Reactive Interactive Active
TV is a multiplier of other awareness building channels
TV to radio is strongest and can be >100%
TV to press and OOH can be up to 50%
Branded search is 33% more responsive to TV in 2011-2014
TV to generic search on average +5% shift in conversion per 100 TVRs
TV helps drive significantly greater promotional effectiveness
Observed multiplier effects up to 100%
Source: Payback 4, 2011-2014, Ebiquity

TV & online synergy is particularly large
Brand + activation channels TV + online0.0
0.2
0.4
0.6
0.8
1.0
1.2A
nn
ua
lise
d E
SO
V e
ffici
en
cy
Source: ‘Advertising Effectiveness: the long and short of it’, 2013, IPA

TV & online are great together…
Brand + activation channels
TV + online0.0
0.2
0.4
0.6
0.8
1.0
1.2
An
nu
alis
ed
ES
OV
effi
cie
ncy
Source: ‘Advertising Effectiveness: the long and short of it’, 2013, IPA

And this combined efficiency has increased over time
Brand + activation channels
TV + online0.0
0.2
0.4
0.6
0.8
1.0
1.2
An
nu
alis
ed
ES
OV
effi
cie
ncy
1998 - 2004 2006 - 20100.0
0.2
0.4
0.6
0.8
1.0
1.2
1.4
1.6
TV + Online campaigns
An
nu
alis
ed
ES
OV
effi
cie
ncy
Source: ‘Advertising Effectiveness: the long and short of it’, 2013, IPA

9. TV is everywhere

New devices enhance viewing and interaction
Source: Ipsos Tech Tracker, Q4 2014, adults 15+. Penetration figures (Laptop and Personal Computer, Any Tablet, Any Smartphone)
35% 63%65%
UK device penetration

Viewers are using all these devices to watch TV
TV with internet connection
Laptop/desktop
Tablet Smartphone
8.3% 12.5%
5.4% 3.5%
Source: Touchpoints 5, 2014, IPA. Base: adults 15+
% of adults watching online TV via device (in a week)

TV viewing is expanding beyond the living room
Bathroom 9% Bedroom 46%
Kitchen 19% Living room 56% Study 24%
Garden 12%
Where people watch television via tablets, laptops and/or smartphones
Source: Screen Life: TV advertising everywhere, 2014, Craft/Thinkbox

TV is viewed in many places outside of the home
Usage of devices to watch TV out of home – location
Someone else's house
Public transport At work Public building In a car Travelling on business
0%
2%
4%
6%
8%
10%
12%
14%
5%
2%
4%3%
1%3%
8%7%
5% 5% 6%5%
11%
13%
9% 10%9%
7%
PC/Laptop Tablet Smartphone
Source: Screen Life: TV advertising everywhere, 2014, Craft/Thinkbox
Net: 17% Net: 13% Net: 12% Net: 10%Net: 13%Net: 16%

Viewing on other devices is small, but on the increase
Source: BARB, 2014, and UK broadcaster data. Base: individuals
2013 20140.00
0.50
1.00
1.50
2.00
2.50
3.00
3.50
4.00
Non-Commercial Linear TV
Commercial Linear TV
TV (streamed & on-demand) viewed on other devices
No
. of h
ou
rs o
f TV
vie
we
d p
er
da
y
1 hour18 mins
3 hours 44 mins30 secs
2 hours 25 mins
1 hour16 mins
2 hours 33 mins
1 hour19 mins
3 hours 52 mins
3 mins3 mins 30 secs

10. TV is the emotional medium and builds brand fame

TV ads evoke emotion more than ads in other media
TV Radio Papers Mags Internet
77%
8% 8% 6% 6%
Source: TV Nation, 2014, Ipsos MediaCT/Thinkbox. Base: all adults 15+.
77% claim TV ads are most likely to make them laugh, cry or feel emotional

TV advertising is most likely to make you laugh
Source: TV Nation, 2014 , Ipsos Media CT/Thinkbox . Base: adults 15+Question: ‘In which, if any, of the following places are you most likely to find advertising that makes you laugh?’
Media where most likely to find advertising that makes you laugh
74%
TV Set Radio
Newspapers
Websites
Outdoor Magazines
Social media
Search
10% 10% 9%
6% 5% 5% 4%

Fame and emotion generate the most sales and profit
Sales Profit0%
10%
20%
30%
40%
50%
60%
70%
58%
39%
Fame
Emotive
Informative
Persuasive
Source: ‘Marketing in the Era of Accountability’, 2007, IPA
Emotive campaigns or ads which achieved fame 50% more likely to gain large business effects

Handy to know!

Source: Advertising Association Expenditure Report , 2000-2010. 2011-2014. Data supplied by the UK broadcasters. constant 2014 prices
TV advertising is at bargain prices
Based on £100k TV spend
19931994
19951996
19971998
19992000
20012002
20032004
20052006
20072008
20092010
20112012
20132014
0
5
10
15
20
25
Adults ABC1 Adults 16-34s
Year
Mill
ion
imp
act
s

Average TV view costs £0.05
Source: BARB, 2014, and data supplied by UK Broadcasters. Constant 2014 prices, based on average adults CPT
The average cost of buying the media space to get one person in the UK to see a TV advert only costs half a penny

An average broadcast TV campaign
of 400 TVRs in the UK gets
234 million views

Thank you.
www.thinkbox.tvHelping you get the best out of television