turnaround academy performance report turnaround academy performance report.pdfturnaround plan at...
TRANSCRIPT
TURNAROUND ACADEMY PERFORMANCE REPORT
2017-2018 ACADEMIC YEAR
Ron Sandlin, Senior Director of School Performance & Transformation Indiana State Board of Education

TABLE OF CONTENTS
PART 1 – OVERVIEW OF INDIANA LAW AND THE HISTORY OF STATE INTERVENTION 1
PART 2 – TURNAROUND ACADEMY PERFORMANCE OVERVIEW & PROFILES 4
OVERVIEW OF SCHOOL PROFILE5 5
SCHOOL PROFILES
7
9
Emma Donnan Middle School
Emmerich Manual High School
T.C. Howe High School 11
Roosevelt College & Career Academy 13
Arlington Community Middle School 15
Glenwood Leadership Academy 17
Lincoln School 19
Caze Elementary 21
Kindezi Academy at Joyce Kilmer 23
Northwest Middle School 25
James Whitcomb Riley Elementary 27
Lewis B. Russel 29
James Russell Lowell 31
George S. Buck 33
Ralph Waldo Emerson 35
Lew Wallace 37
Clarence Farrington 39
APPENDICES
41
42
43
53
APPENDIX A: SUMMARY OF TRANSFORMATION ZONES
APPENDIX B: SUMMARY OF INNOVATION NETWORK SCHOOLS
APPENDIX C: APPROVED TURNAROUND COMMITTEE RECOMMENDATIONS
APPENDIX D: TURNAROUND ACADEMY PERFORMANCE FRAMEWORK
APPENDIX E: SCHOOL LETTER GRADES BY YEAR & INTERVENTION STATUS 55
For the first time, the Indiana State Board of Education (SBOE) has released a report summarizing student achievement and enrollment data for turnaround academies, which are chronically underperforming schools that have been placed under SBOE intervention. The goal of this report is to foster shared
accountability for student
success and promote innovation and collaboration within our public school system to
eliminate the educational inequities that persist in our state. PART 1 – OVERVIEW OF INDIANA LAW AND THE HISTORY OF STATE INTERVENTION
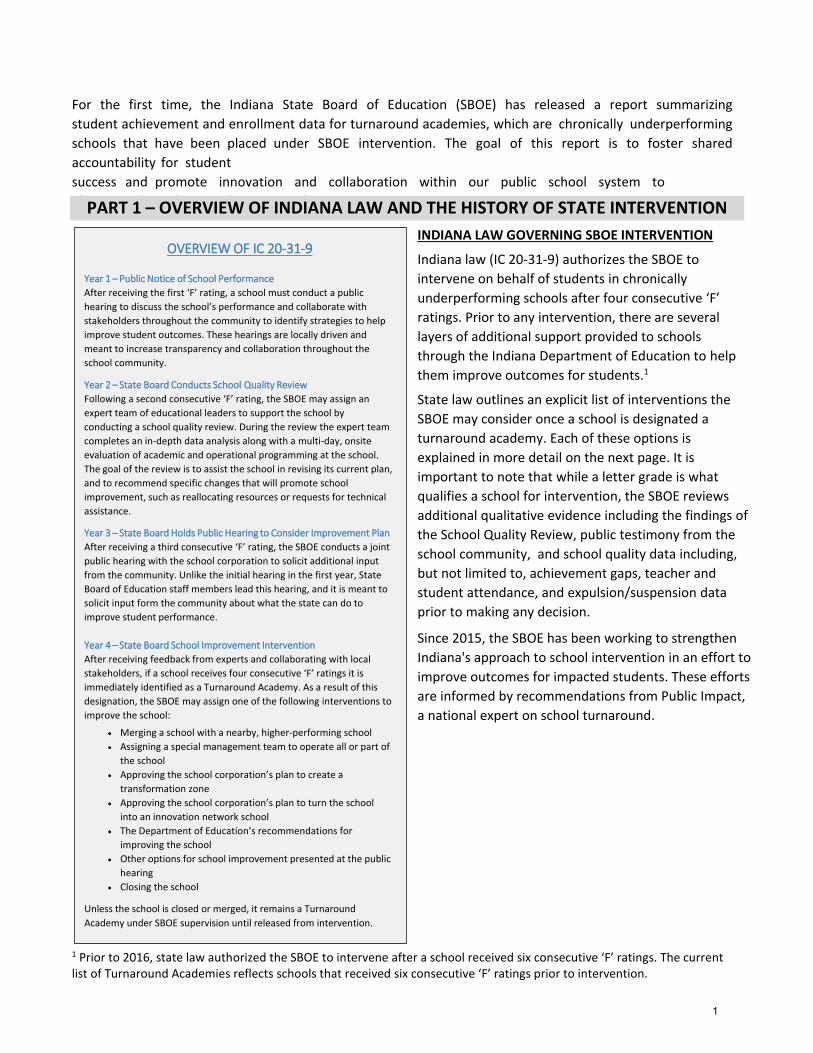
INDIANA LAW GOVERNING SBOE INTERVENTION
Indiana law (IC 20-31-9) authorizes the SBOE to intervene on behalf of students in chronically
underperforming schools after four consecutive ‘F’
ratings. Prior to any intervention, there are several
layers of additional support provided to schools through the Indiana Department of Education to help
them improve outcomes for students.1
State law outlines an explicit list of interventions the SBOE may consider once a school is designated a turnaround academy. Each of these options is explained in more detail on the next page. It is important to note that while a letter grade is what qualifies a school for intervention, the SBOE reviews additional qualitative evidence including the findings of the School Quality Review, public testimony from the school community, and school quality data including, but not limited to, achievement gaps, teacher and student attendance, and expulsion/suspension data prior to making any decision.
Since 2015, the SBOE has been working to strengthen Indiana's approach to school intervention in an effort to improve outcomes for impacted students. These efforts are informed by recommendations from Public Impact, a national expert on school turnaround.
1 Prior to 2016, state law authorized the SBOE to intervene after a school received six consecutive ‘F’ ratings. The current list of Turnaround Academies reflects schools that received six consecutive ‘F’ ratings prior to intervention.
OVERVIEW OF IC 20-31-9
Year 1 – Public Notice of School Performance
After receiving the first ‘F’ rating, a school must conduct a public
hearing to discuss the school’s performance and collaborate with
stakeholders throughout the community to identify strategies to help
improve student outcomes. These hearings are locally driven and
meant to increase transparency and collaboration throughout the
school community.
Year 2 – State Board Conducts School Quality Review
Following a second consecutive ‘F’ rating, the SBOE may assign an
expert team of educational leaders to support the school by
conducting a school quality review. During the review the expert team
completes an in-depth data analysis along with a multi-day, onsite
evaluation of academic and operational programming at the school.
The goal of the review is to assist the school in revising its current plan,
and to recommend specific changes that will promote school
improvement, such as reallocating resources or requests for technical
assistance.
Year 3 – State Board Holds Public Hearing to Consider Improvement Plan
After receiving a third consecutive ‘F’ rating, the SBOE conducts a joint
public hearing with the school corporation to solicit additional input
from the community. Unlike the initial hearing in the first year, State
Board of Education staff members lead this hearing, and it is meant to
solicit input form the community about what the state can do to
improve student performance.
Year 4 – State Board School Improvement Intervention
After receiving feedback from experts and collaborating with local
stakeholders, if a school receives four consecutive ‘F’ ratings it is
immediately identified as a Turnaround Academy. As a result of this
designation, the SBOE may assign one of the following interventions to
improve the school:
• Merging a school with a nearby, higher-performing school
• Assigning a special management team to operate all or part of
the school
• Approving the school corporation’s plan to create a
transformation zone
• Approving the school corporation’s plan to turn the school
into an innovation network school
• The Department of Education’s recommendations for
improving the school
• Other options for school improvement presented at the public
hearing
• Closing the school
Unless the school is closed or merged, it remains a Turnaround
Academy under SBOE supervision until released from intervention.
1
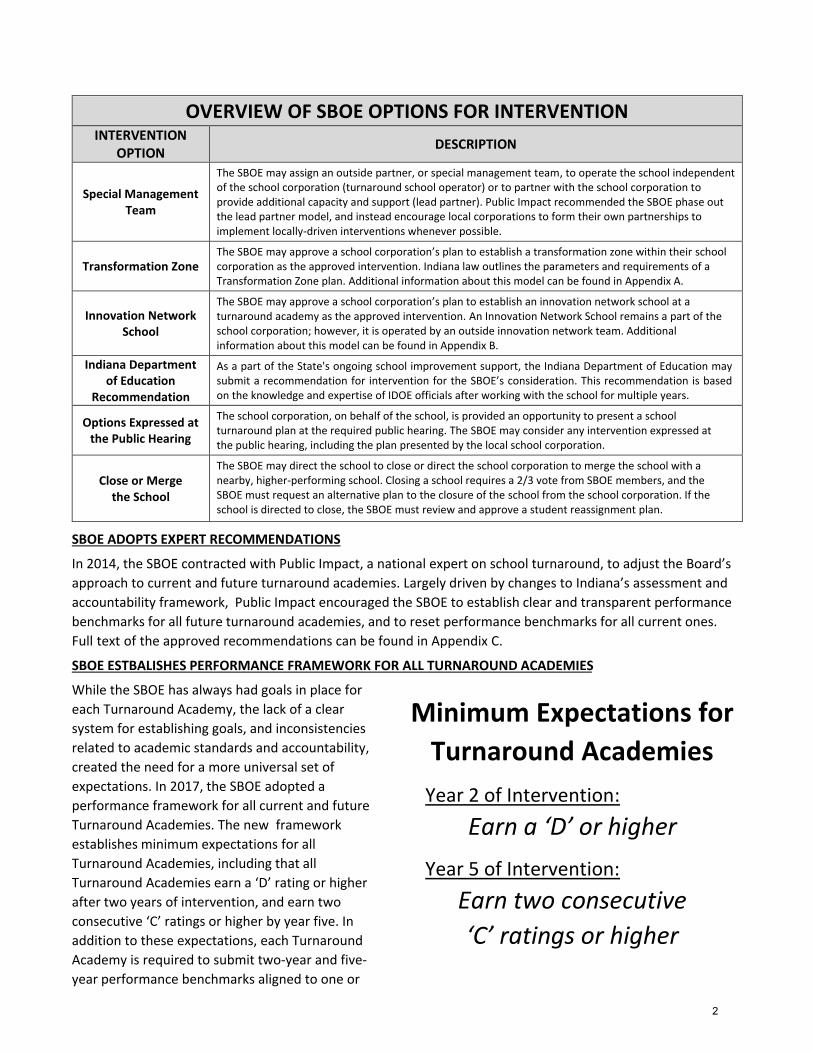
SBOE ADOPTS EXPERT RECOMMENDATIONS
In 2014, the SBOE contracted with Public Impact, a national expert on school turnaround, to adjust the Board’s
approach to current and future turnaround academies. Largely driven by changes to Indiana’s assessment and accountability framework, Public Impact encouraged the SBOE to establish clear and transparent performance
benchmarks for all future turnaround academies, and to reset performance benchmarks for all current ones. Full text of the approved recommendations can be found in Appendix C.
SBOE ESTBALISHES PERFORMANCE FRAMEWORK FOR ALL TURNAROUND ACADEMIES
While the SBOE has always had goals in place for each Turnaround Academy, the lack of a clear system for establishing goals, and inconsistencies related to academic standards and accountability, created the need for a more universal set of expectations. In 2017, the SBOE adopted a performance framework for all current and future
Turnaround Academies. The new framework
establishes minimum expectations for all
Turnaround Academies, including that all
Turnaround Academies earn a ‘D’ rating or higher
after two years of intervention, and earn two
consecutive ‘C’ ratings or higher by year five. In
addition to these expectations, each Turnaround
Academy is required to submit two-year and five-
year performance benchmarks aligned to one or
OVERVIEW OF SBOE OPTIONS FOR INTERVENTIONINTERVENTION
OPTION DESCRIPTION
Special Management Team
The SBOE may assign an outside partner, or special management team, to operate the school independent of the school corporation (turnaround school operator) or to partner with the school corporation to provide additional capacity and support (lead partner). Public Impact recommended the SBOE phase out the lead partner model, and instead encourage local corporations to form their own partnerships to implement locally-driven interventions whenever possible.
Transformation Zone The SBOE may approve a school corporation’s plan to establish a transformation zone within their school corporation as the approved intervention. Indiana law outlines the parameters and requirements of a Transformation Zone plan. Additional information about this model can be found in Appendix A.
Innovation Network School
The SBOE may approve a school corporation’s plan to establish an innovation network school at a turnaround academy as the approved intervention. An Innovation Network School remains a part of the school corporation; however, it is operated by an outside innovation network team. Additional information about this model can be found in Appendix B.
Indiana Department of Education
Recommendation
As a part of the State's ongoing school improvement support, the Indiana Department of Education maysubmit a recommendation for intervention for the SBOE’s consideration. This recommendation is based on the knowledge and expertise of IDOE officials after working with the school for multiple years.
Options Expressed at the Public Hearing
The school corporation, on behalf of the school, is provided an opportunity to present a schoolturnaround plan at the required public hearing. The SBOE may consider any intervention expressed at the public hearing, including the plan presented by the local school corporation.
Close or Merge the School
The SBOE may direct the school to close or direct the school corporation to merge the school with a nearby, higher-performing school. Closing a school requires a 2/3 vote from SBOE members, and the SBOE must request an alternative plan to the closure of the school from the school corporation. If the school is directed to close, the SBOE must review and approve a student reassignment plan.
Minimum Expectations for
Turnaround Academies
Year 2 of Intervention:
Earn a ‘D’ or higher
Year 5 of Intervention:
Earn two consecutive
‘C’ ratings or higher
2
more components of Indiana’s Student-Centered A-F Accountability Model. The complete performance
framework can be found in Appendix D.
Each school’s benchmarks are included on the individual school profiles included in Part 2 of this report.
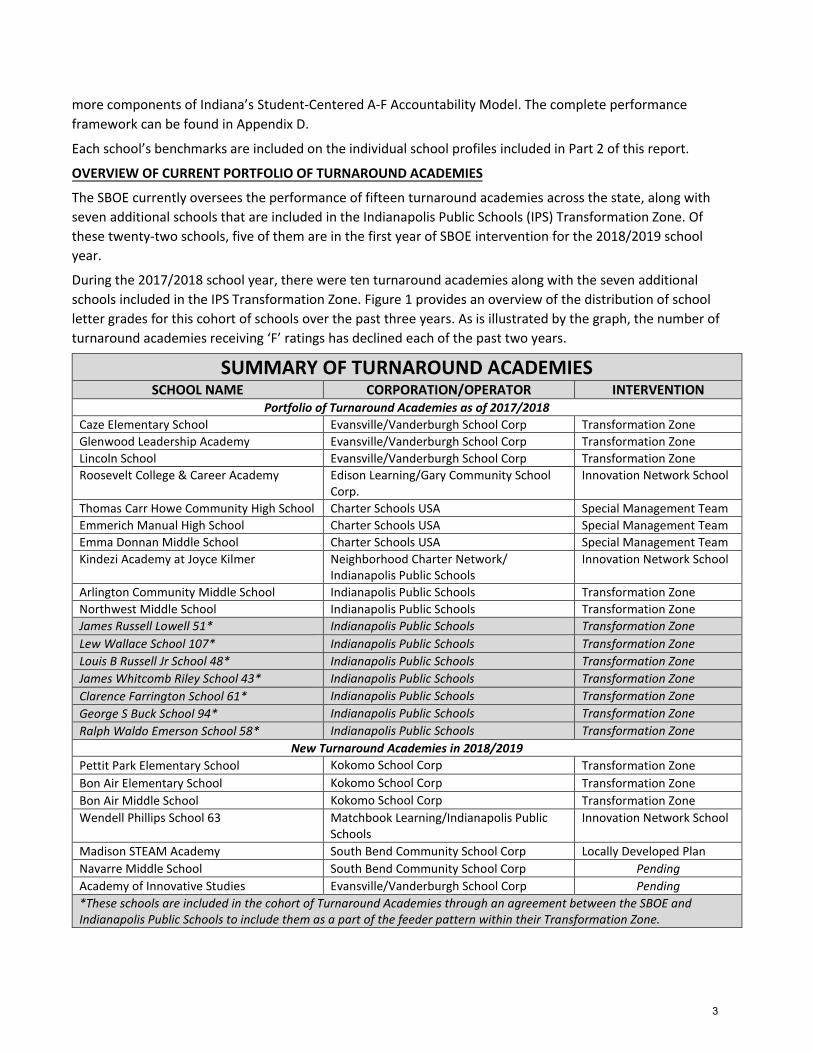
OVERVIEW OF CURRENT PORTFOLIO OF TURNAROUND ACADEMIES
The SBOE currently oversees the performance of fifteen turnaround academies across the state, along with
seven additional schools that are included in the Indianapolis Public Schools (IPS) Transformation Zone. Of
these twenty-two schools, five of them are in the first year of SBOE intervention for the 2018/2019 school
year.
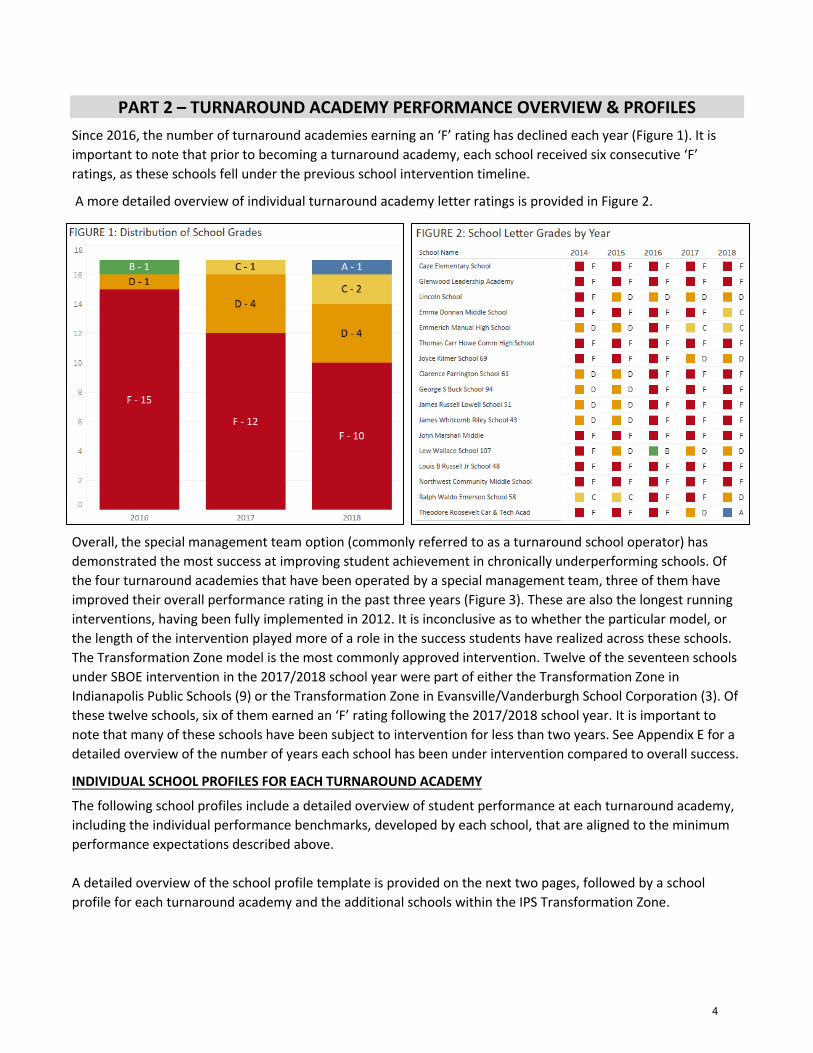
During the 2017/2018 school year, there were ten turnaround academies along with the seven additional
schools included in the IPS Transformation Zone. Figure 1 provides an overview of the distribution of school
letter grades for this cohort of schools over the past three years. As is illustrated by the graph, the number of
turnaround academies receiving ‘F’ ratings has declined each of the past two years.
SUMMARY OF TURNAROUND ACADEMIESSCHOOL NAME CORPORATION/OPERATOR INTERVENTION
Portfolio of Turnaround Academies as of 2017/2018
Caze Elementary School Evansville/Vanderburgh School Corp Transformation Zone
Glenwood Leadership Academy Evansville/Vanderburgh School Corp Transformation Zone
Lincoln School Evansville/Vanderburgh School Corp Transformation Zone
Roosevelt College & Career Academy Edison Learning/Gary Community School Corp.
Innovation Network School
Thomas Carr Howe Community High School Charter Schools USA Special Management Team
Emmerich Manual High School Charter Schools USA Special Management Team
Emma Donnan Middle School Charter Schools USA Special Management Team
Kindezi Academy at Joyce Kilmer Neighborhood Charter Network/ Indianapolis Public Schools
Innovation Network School
Arlington Community Middle School Indianapolis Public Schools Transformation Zone
Northwest Middle School Indianapolis Public Schools Transformation Zone
James Russell Lowell 51* Indianapolis Public Schools Transformation Zone
Lew Wallace School 107* Indianapolis Public Schools Transformation Zone
Louis B Russell Jr School 48* Indianapolis Public Schools Transformation Zone
James Whitcomb Riley School 43* Indianapolis Public Schools Transformation Zone
Clarence Farrington School 61* Indianapolis Public Schools Transformation Zone
George S Buck School 94* Indianapolis Public Schools Transformation Zone
Ralph Waldo Emerson School 58* Indianapolis Public Schools Transformation Zone
New Turnaround Academies in 2018/2019
Pettit Park Elementary School Kokomo School Corp Transformation Zone
Bon Air Elementary School Kokomo School Corp Transformation Zone
Bon Air Middle School Kokomo School Corp Transformation Zone
Wendell Phillips School 63 Matchbook Learning/Indianapolis Public Schools
Innovation Network School
Madison STEAM Academy South Bend Community School Corp Locally Developed Plan
Navarre Middle School South Bend Community School Corp Pending
Academy of Innovative Studies Evansville/Vanderburgh School Corp Pending
*These schools are included in the cohort of Turnaround Academies through an agreement between the SBOE andIndianapolis Public Schools to include them as a part of the feeder pattern within their Transformation Zone.
3
PART 2 – TURNAROUND ACADEMY PERFORMANCE OVERVIEW & PROFILES
Since 2016, the number of turnaround academies earning an ‘F’ rating has declined each year (Figure 1). It is important to note that prior to becoming a turnaround academy, each school received six consecutive ‘F’ ratings, as these schools fell under the previous school intervention timeline.
A more detailed overview of individual turnaround academy letter ratings is provided in Figure 2.
Overall, the special management team option (commonly referred to as a turnaround school operator) has
demonstrated the most success at improving student achievement in chronically underperforming schools. Of
the four turnaround academies that have been operated by a special management team, three of them have
improved their overall performance rating in the past three years (Figure 3). These are also the longest running interventions, having been fully implemented in 2012. It is inconclusive as to whether the particular model, or the length of the intervention played more of a role in the success students have realized across these schools. The Transformation Zone model is the most commonly approved intervention. Twelve of the seventeen schools under SBOE intervention in the 2017/2018 school year were part of either the Transformation Zone in Indianapolis Public Schools (9) or the Transformation Zone in Evansville/Vanderburgh School Corporation (3). Of
these twelve schools, six of them earned an ‘F’ rating following the 2017/2018 school year. It is important to note that many of these schools have been subject to intervention for less than two years. See Appendix E for adetailed overview of the number of years each school has been under intervention compared to overall success.
INDIVIDUAL SCHOOL PROFILES FOR EACH TURNAROUND ACADEMY
The following school profiles include a detailed overview of student performance at each turnaround academy,
including the individual performance benchmarks, developed by each school, that are aligned to the minimum performance expectations described above.
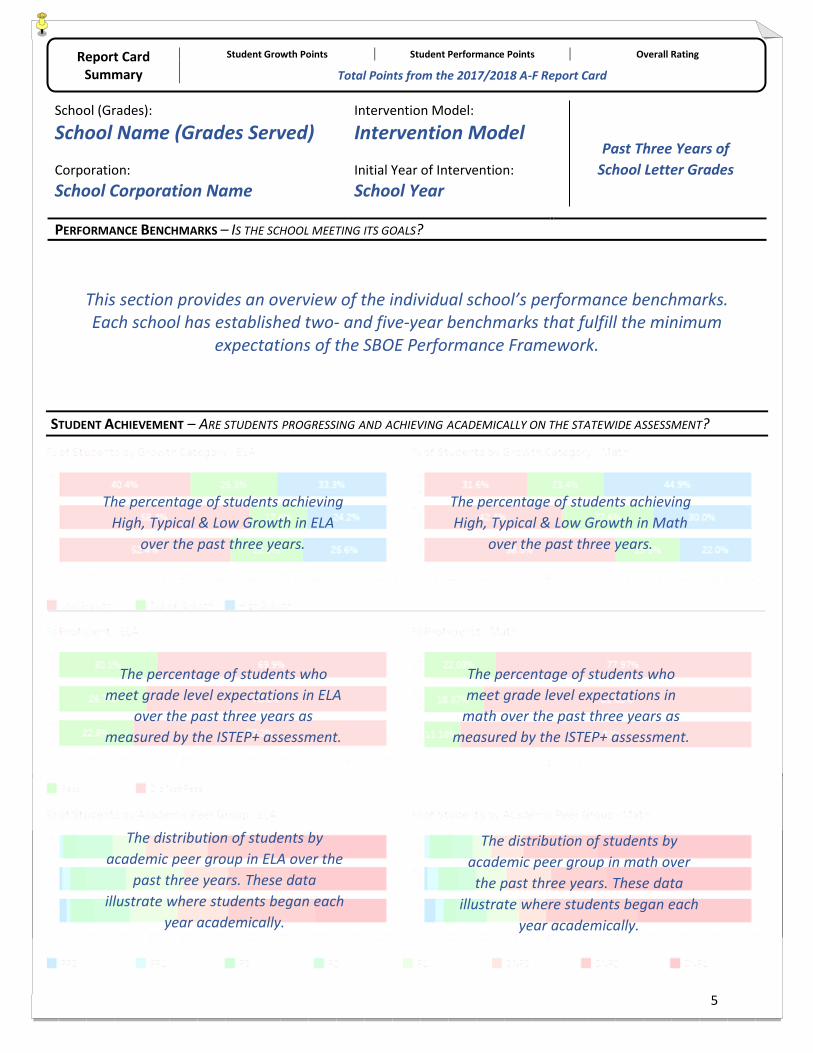
A detailed overview of the school profile template is provided on the next two pages, followed by a school profile for each turnaround academy and the additional schools within the IPS Transformation Zone.
4
Report Card Summary
Student Growth Points Student Performance Points Overall Rating
Total Points from the 2017/2018 A-F Report Card
School (Grades):
School Name (Grades Served)Intervention Model:
Intervention Model
Corporation:
School Corporation NameInitial Year of Intervention:
School Year
PERFORMANCE BENCHMARKS – IS THE SCHOOL MEETING ITS GOALS?
This section provides an overview of the individual school’s performance benchmarks. Each school has established two- and five-year benchmarks that fulfill the minimum
expectations of the SBOE Performance Framework.
STUDENT ACHIEVEMENT – ARE STUDENTS PROGRESSING AND ACHIEVING ACADEMICALLY ON THE STATEWIDE ASSESSMENT?
Past Three Years of
School Letter Grades
The percentage of students achieving
High, Typical & Low Growth in ELA
over the past three years.
The percentage of students achieving
High, Typical & Low Growth in Math
over the past three years.
The percentage of students who meet grade level expectations in ELA
over the past three years as measured by the ISTEP+ assessment.
The percentage of students who meet grade level expectations in
math over the past three years as measured by the ISTEP+ assessment.
The distribution of students by academic peer group in ELA over the
past three years. These data illustrate where students began each
year academically.
The distribution of students by academic peer group in math over the past three years. These data
illustrate where students began each year academically.
5
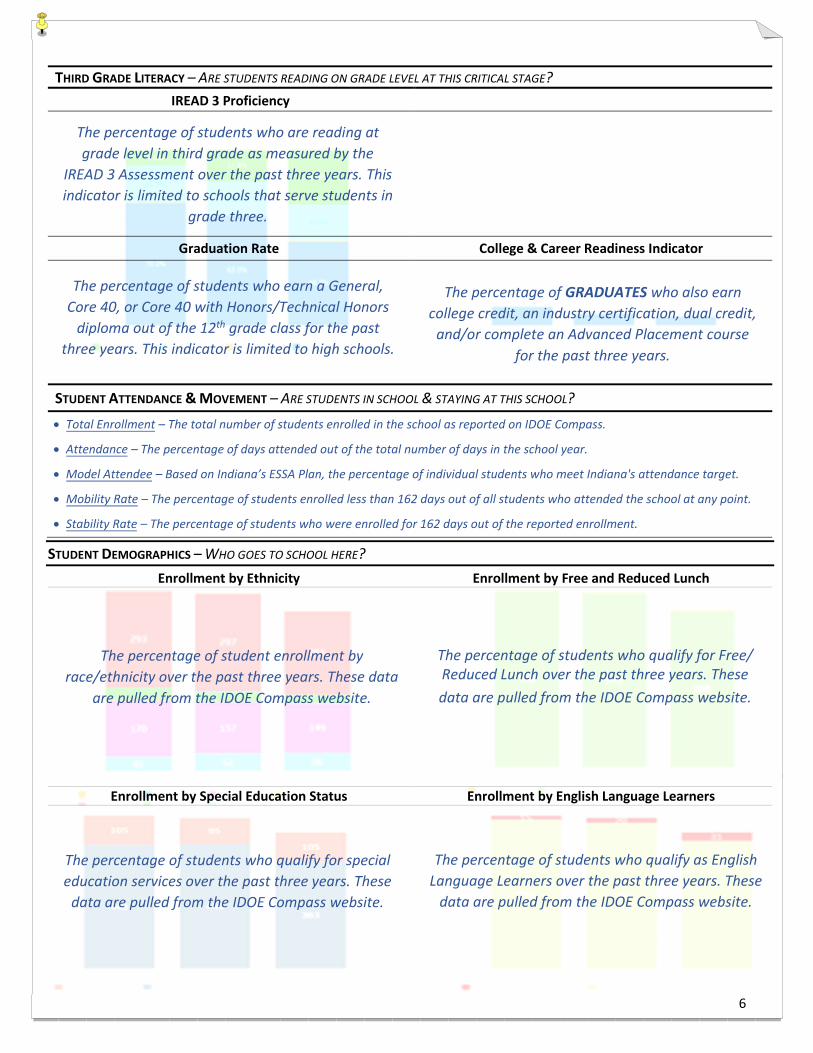
THIRD GRADE LITERACY – ARE STUDENTS READING ON GRADE LEVEL AT THIS CRITICAL STAGE? IREAD 3 Proficiency
Graduation Rate College & Career Readiness Indicator
STUDENT ATTENDANCE & MOVEMENT – ARE STUDENTS IN SCHOOL & STAYING AT THIS SCHOOL?
• Total Enrollment – The total number of students enrolled in the school as reported on IDOE Compass.
• Attendance – The percentage of days attended out of the total number of days in the school year.
• Model Attendee – Based on Indiana’s ESSA Plan, the percentage of individual students who meet Indiana's attendance target.
• Mobility Rate – The percentage of students enrolled less than 162 days out of all students who attended the school at any point.
• Stability Rate – The percentage of students who were enrolled for 162 days out of the reported enrollment.
STUDENT DEMOGRAPHICS – WHO GOES TO SCHOOL HERE?
Enrollment by Ethnicity Enrollment by Free and Reduced Lunch
Enrollment by Special Education Status Enrollment by English Language Learners
The percentage of students who are reading at
grade level in third grade as measured by the
IREAD 3 Assessment over the past three years. This
indicator is limited to schools that serve students in
grade three.
The percentage of students who earn a General,
Core 40, or Core 40 with Honors/Technical Honors
diploma out of the 12th grade class for the past
three years. This indicator is limited to high schools.
The percentage of GRADUATES who also earn
college credit, an industry certification, dual credit,
and/or complete an Advanced Placement course
for the past three years.
The percentage of student enrollment by
race/ethnicity over the past three years. These data
are pulled from the IDOE Compass website.
The percentage of students who qualify for Free/Reduced Lunch over the past three years. These
data are pulled from the IDOE Compass w ebsite.
The percentage of students who qualify for special
education services over the past three years. These
data are pulled from the IDOE Compass website.
The percentage of students who qualify as English Language Learners over the past three years. These
data are pulled from the IDOE Compass website.
6
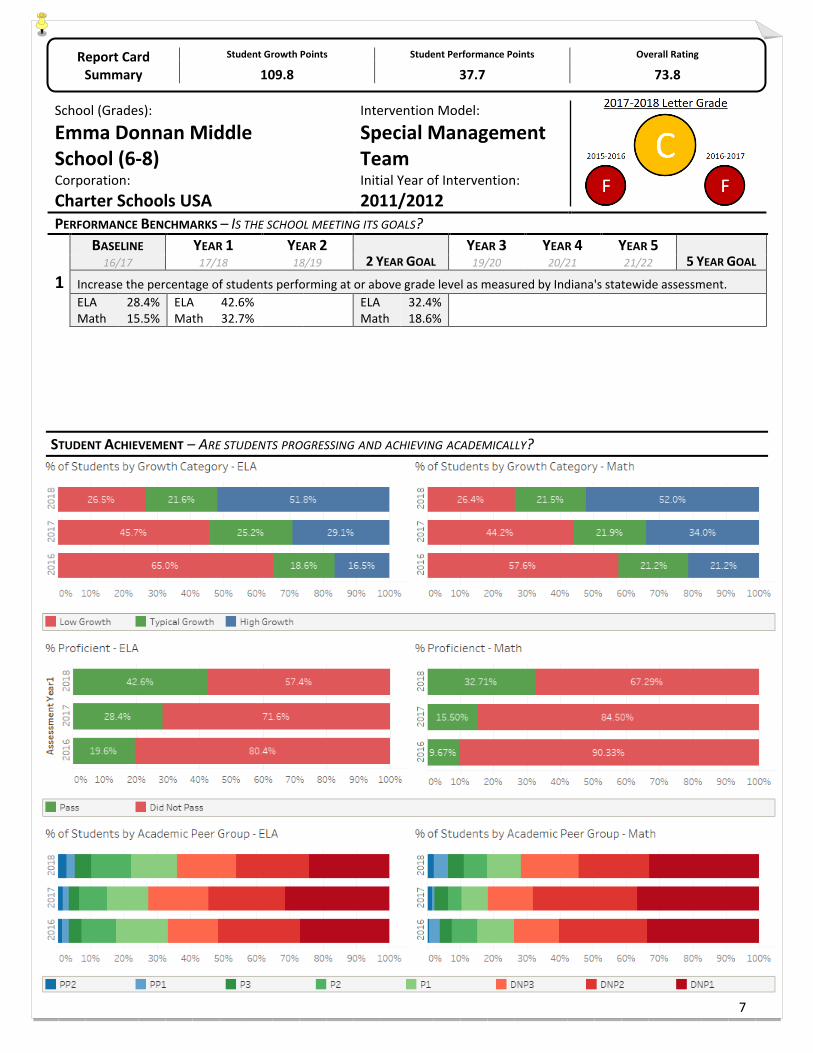
Report Card Summary
Student Growth Points Student Performance Points Overall Rating
109.8 37.7 73.8
School (Grades):
Emma Donnan Middle School (6-8)
Intervention Model:
Special Management Team
Corporation: Charter Schools USA
Initial Year of Intervention: 2011/2012
PERFORMANCE BENCHMARKS – IS THE SCHOOL MEETING ITS GOALS?BASELINE YEAR 1 YEAR 2
2 YEAR GOAL YEAR 3 YEAR 4 YEAR 5
5 YEAR GOAL 16/17 17/18 18/19 19/20 20/21 21/22
1 Increase the percentage of students performing at or above grade level as measured by Indiana's statewide assessment.ELA Math
28.4% 15.5%
ELA Math
42.6% 32.7%
ELA Math
32.4% 18.6%
STUDENT ACHIEVEMENT – ARE STUDENTS PROGRESSING AND ACHIEVING ACADEMICALLY?
7

THIRD GRADE LITERACY – ARE STUDENTS READING ON GRADE LEVEL AT THIS CRITICAL STAGE? IREAD 3 Proficiency
STUDENT ATTENDANCE & MOVEMENT – ARE STUDENTS IN SCHOOL & STAYING AT THIS SCHOOL?
Total Enrollment Attendance Model Attendees Mobility Rate Stability Rate
2017-2018 351 85.5% 32.2% 43.9% 76.9% 2016-2017 392 89.0% - - - 2015-2016 348 84.6% - - -
STUDENT DEMOGRAPHICS – WHO GOES TO SCHOOL HERE?
Enrollment by Ethnicity Enrollment by Free and Reduced Lunch
Enrollment by Special Education Status Enrollment by English Language Learners
8
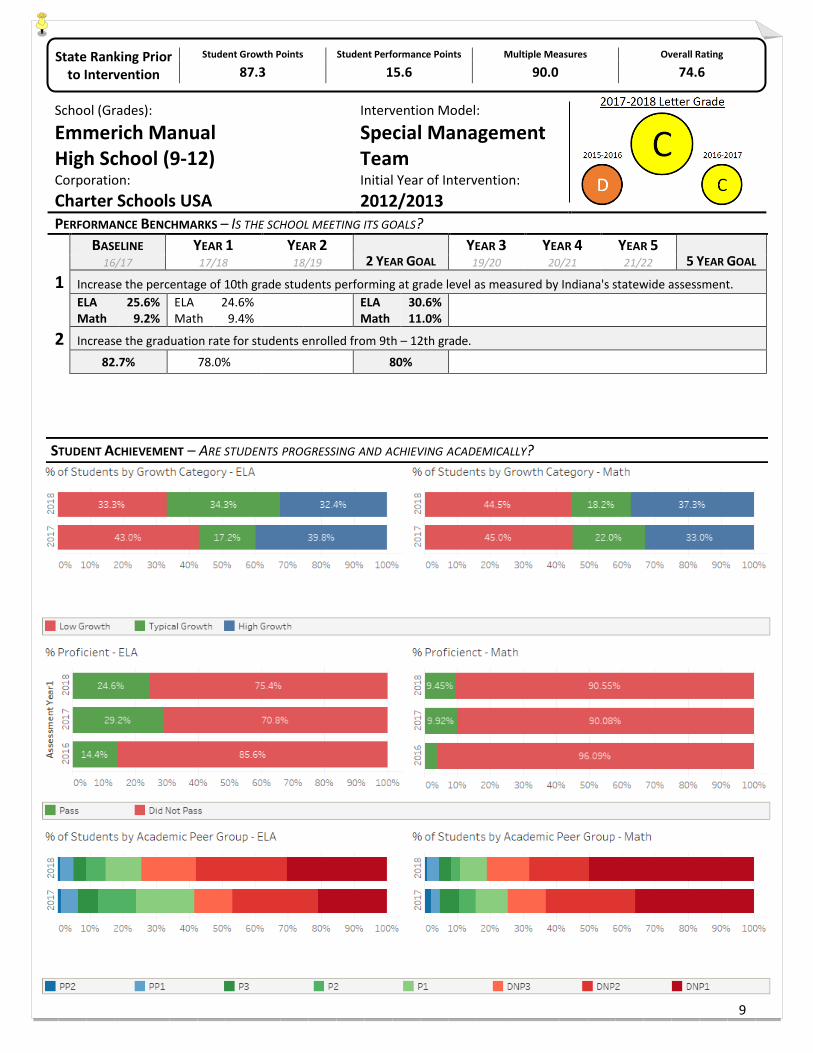
State Ranking Prior to Intervention
Student Growth Points Student Performance Points Multiple Measures Overall Rating
87.3 15.6 90.0 74.6
School (Grades):
Emmerich Manual High School (9-12)
Intervention Model:
Corporation: Charter Schools USA
Special Management TeamInitial Year of Intervention: 2012/2013
PERFORMANCE BENCHMARKS – IS THE SCHOOL MEETING ITS GOALS?BASELINE YEAR 1 YEAR 2
2 YEAR GOAL YEAR 3 YEAR 4 YEAR 5
5 YEAR GOAL 16/17 17/18 18/19 19/20 20/21 21/22
1 Increase the percentage of 10th grade students performing at grade level as measured by Indiana's statewide assessment. ELA Math
25.6% 9.2%
ELA Math
24.6% 9.4%
ELA Math
30.6% 11.0%
2 Increase the graduation rate for students enrolled from 9th – 12th grade.
82.7% 78.0% 80%
STUDENT ACHIEVEMENT – ARE STUDENTS PROGRESSING AND ACHIEVING ACADEMICALLY?
9
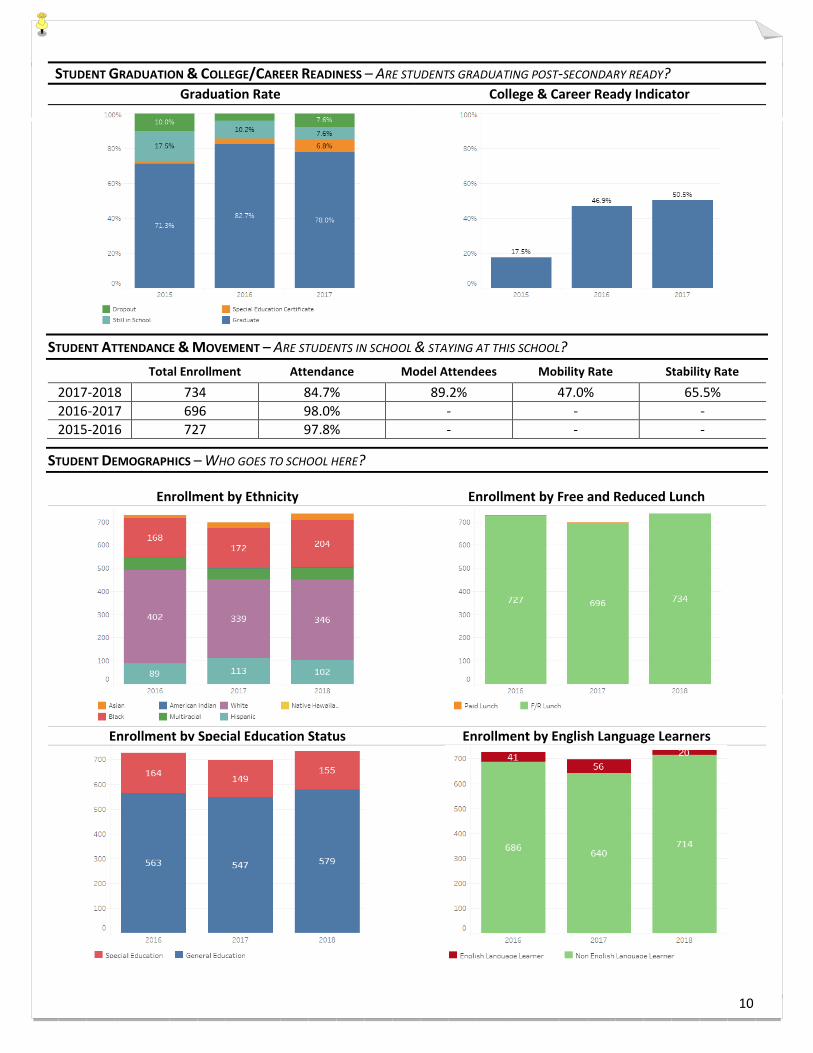
STUDENT GRADUATION & COLLEGE/CAREER READINESS – ARE STUDENTS GRADUATING POST-SECONDARY READY? Graduation Rate College & Career Ready Indicator
STUDENT ATTENDANCE & MOVEMENT – ARE STUDENTS IN SCHOOL & STAYING AT THIS SCHOOL? Total Enrollment Attendance Model Attendees Mobility Rate Stability Rate
2017-2018 734 84.7% 89.2% 47.0% 65.5% 2016-2017 696 98.0% - - - 2015-2016 727 97.8% - - -
STUDENT DEMOGRAPHICS – WHO GOES TO SCHOOL HERE?
Enrollment by Ethnicity Enrollment by Free and Reduced Lunch
Enrollment by Special Education Status Enrollment by English Language Learners
10
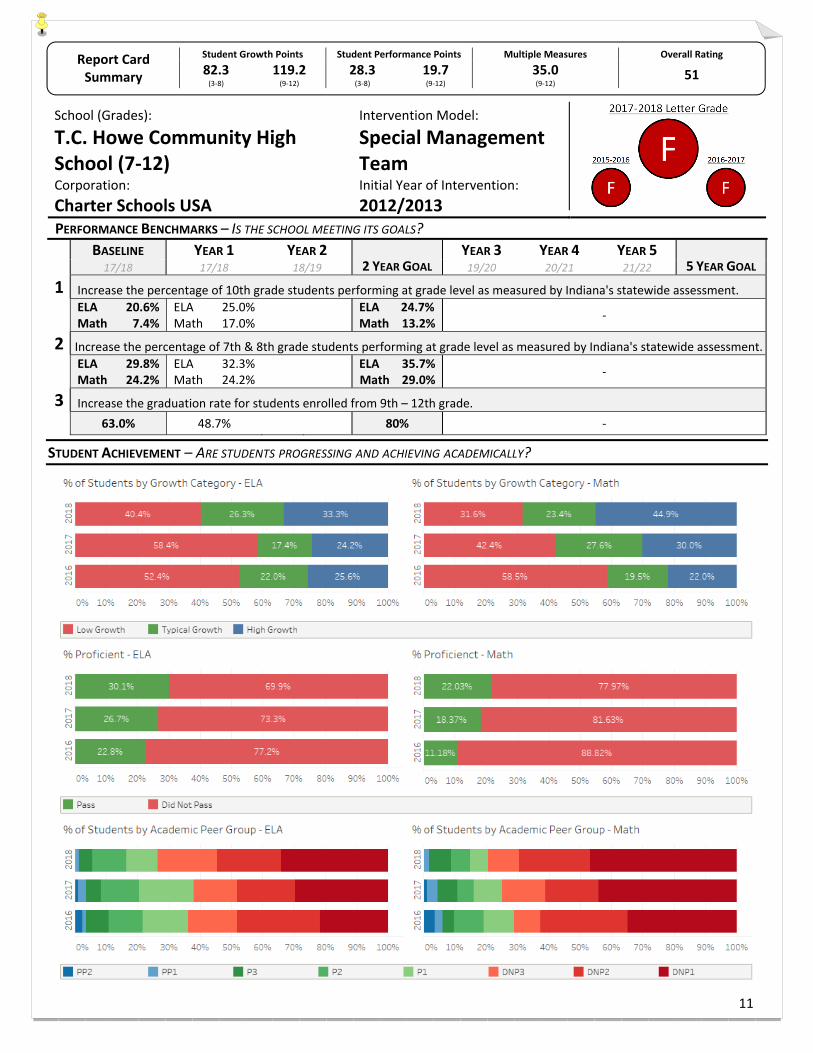
Report Card Summary
Student Growth Points Student Performance Points Multiple Measures Overall Rating
82.3 (3‐8)
119.2 (9‐12)
28.3 (3‐8)
19.7 (9‐12)
35.0 (9‐12)
51
School (Grades):
T.C. Howe Community HighSchool (7‐12)
Intervention Model:
Special Management Team
Corporation: Charter Schools USA
Initial Year of Intervention: 2012/2013
PERFORMANCE BENCHMARKS – IS THE SCHOOL MEETING ITS GOALS?
BASELINE YEAR 1 YEAR 2 2 YEAR GOAL
YEAR 3 YEAR 4 YEAR 5 5 YEAR GOAL 17/18 17/18 18/19 19/20 20/21 21/22
1 Increase the percentage of 10th grade students performing at grade level as measured by Indiana's statewide assessment. ELA Math
20.6% 7.4%
ELA Math
25.0% 17.0% ELA
Math 24.7% 13.2%
‐
2 Increase the percentage of 7th & 8th grade students performing at grade level as measured by Indiana's statewide assessment. ELA Math
29.8% 24.2%
ELA Math
32.3% 24.2% ELA
Math 35.7% 29.0%
‐
3 Increase the graduation rate for students enrolled from 9th – 12th grade. 63.0% 48.7% 80% ‐
STUDENT ACHIEVEMENT – ARE STUDENTS PROGRESSING AND ACHIEVING ACADEMICALLY?
11
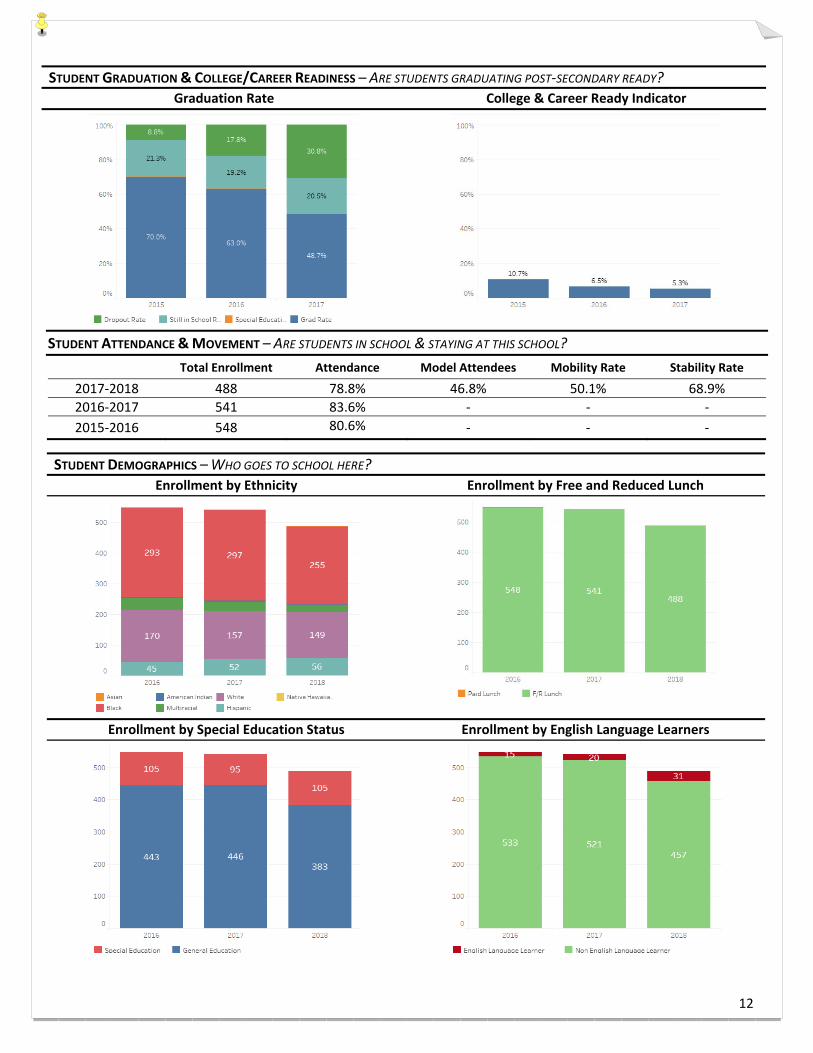
STUDENT GRADUATION & COLLEGE/CAREER READINESS – ARE STUDENTS GRADUATING POST‐SECONDARY READY? Graduation Rate College & Career Ready Indicator
STUDENT ATTENDANCE & MOVEMENT – ARE STUDENTS IN SCHOOL & STAYING AT THIS SCHOOL? Total Enrollment Attendance Model Attendees Mobility Rate Stability Rate
2017‐2018 488 78.8% 46.8% 50.1% 68.9% 2016‐2017 541 83.6% ‐ ‐ ‐ 2015‐2016 548 80.6% ‐ ‐ ‐
STUDENT DEMOGRAPHICS – WHO GOES TO SCHOOL HERE? Enrollment by Ethnicity Enrollment by Free and Reduced Lunch
Enrollment by Special Education Status Enrollment by English Language Learners
12
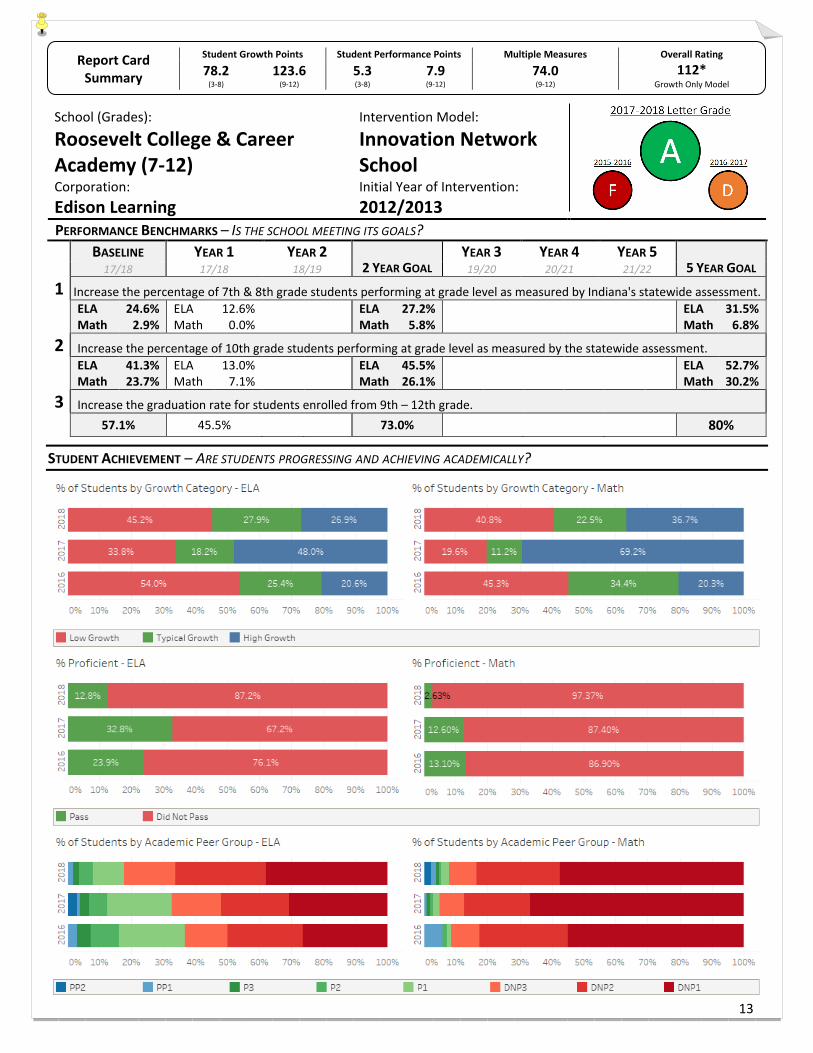
Report Card Summary
Student Growth Points Student Performance Points Multiple Measures Overall Rating
78.2 (3-8)
123.6 (9-12)
5.3 (3-8)
7.9 (9-12)
74.0 (9-12)
112* Growth Only Model
School (Grades):
Roosevelt College & Career Academy (7-12)
Intervention Model:
Innovation Network School
Corporation: Edison Learning
Initial Year of Intervention: 2012/2013
PERFORMANCE BENCHMARKS – IS THE SCHOOL MEETING ITS GOALS?BASELINE YEAR 1 YEAR 2
2 YEAR GOAL YEAR 3 YEAR 4 YEAR 5
5 YEAR GOAL 17/18 17/18 18/19 19/20 20/21 21/22
1 Increase the percentage of 7th & 8th grade students performing at grade level as measured by Indiana's statewide assessment. ELA Math
24.6% 2.9%
ELA Math
12.6% 0.0%
ELA Math
27.2% 5.8%
ELA Math
31.5% 6.8%
2 Increase the percentage of 10th grade students performing at grade level as measured by the statewide assessment. ELA Math
41.3% 23.7%
ELA Math
13.0% 7.1%
ELA Math
45.5% 26.1%
ELA Math
52.7% 30.2%
3 Increase the graduation rate for students enrolled from 9th – 12th grade. 57.1% 45.5% 73.0% 80%
STUDENT ACHIEVEMENT – ARE STUDENTS PROGRESSING AND ACHIEVING ACADEMICALLY?
13
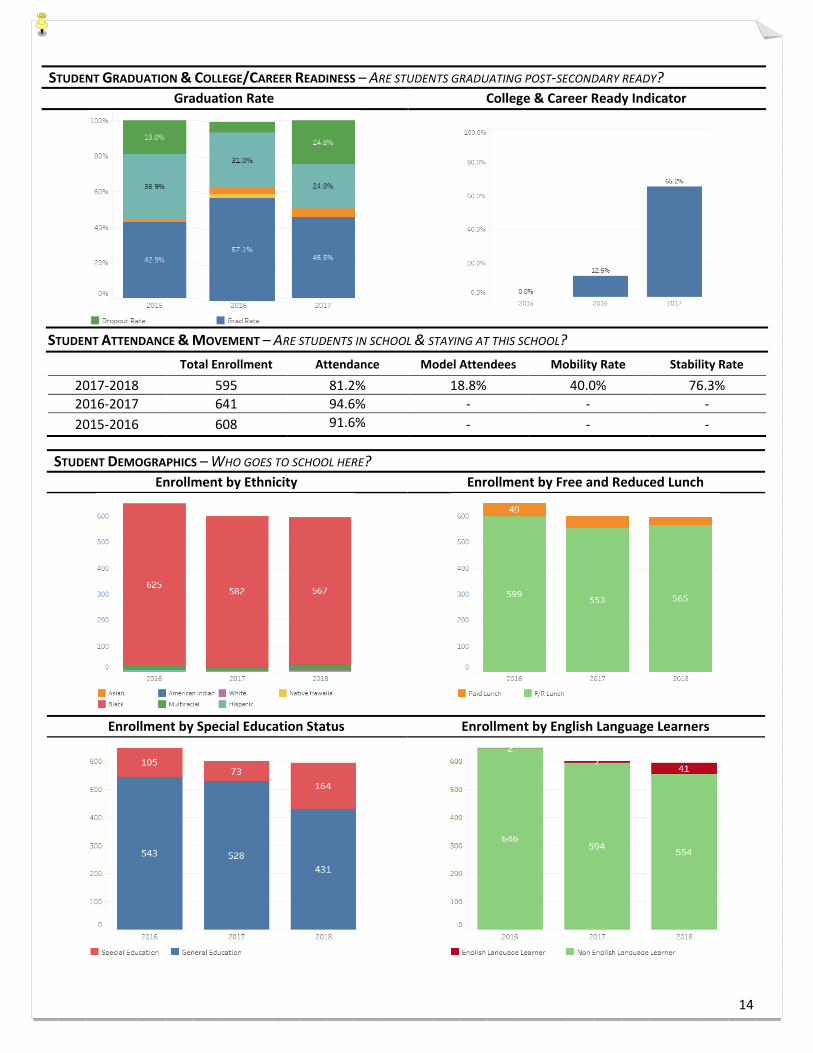
STUDENT GRADUATION & COLLEGE/CAREER READINESS – ARE STUDENTS GRADUATING POST-SECONDARY READY? Graduation Rate College & Career Ready Indicator
STUDENT ATTENDANCE & MOVEMENT – ARE STUDENTS IN SCHOOL & STAYING AT THIS SCHOOL? Total Enrollment Attendance Model Attendees Mobility Rate Stability Rate
2017-2018 595 81.2% 18.8% 40.0% 76.3% 2016-2017 641 94.6% - - - 2015-2016 608 91.6% - - -
STUDENT DEMOGRAPHICS – WHO GOES TO SCHOOL HERE? Enrollment by Ethnicity Enrollment by Free and Reduced Lunch
Enrollment by Special Education Status Enrollment by English Language Learners
14
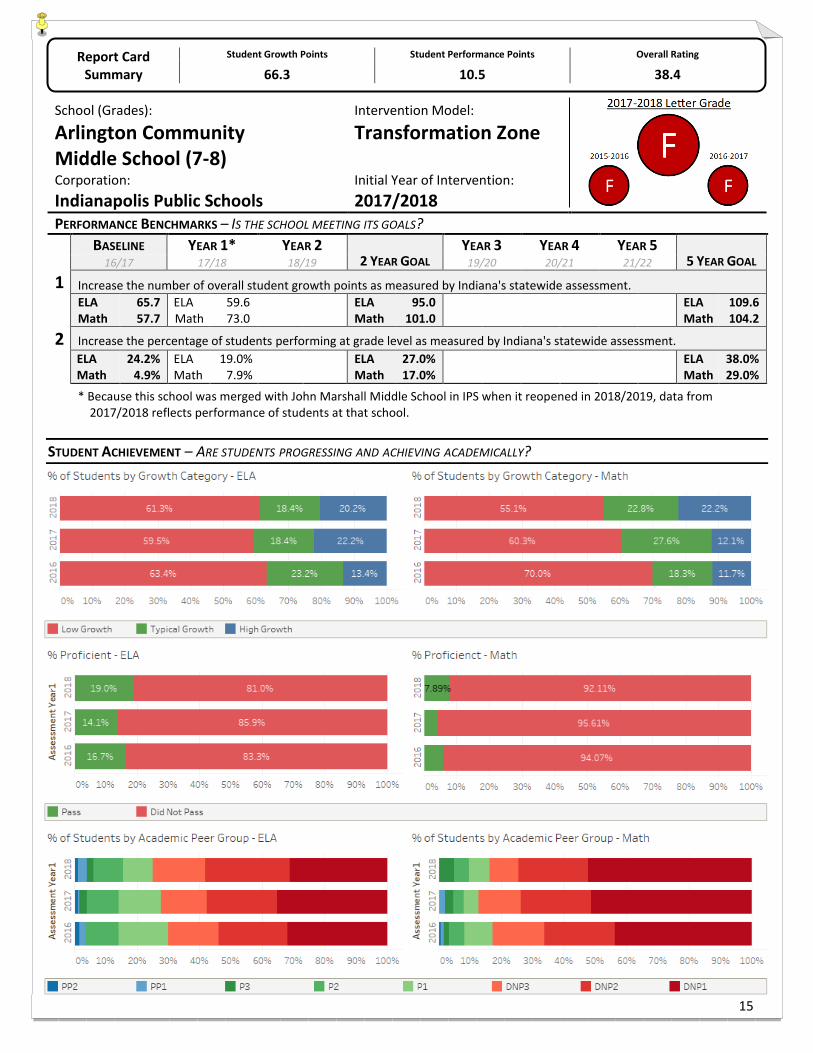
Report Card Summary
Student Growth Points Student Performance Points Overall Rating
66.3 10.5 38.4
School (Grades):
Arlington Community Middle School (7-8)
Intervention Model:
Transformation Zone
Corporation:
Indianapolis Public SchoolsInitial Year of Intervention:
2017/2018 PERFORMANCE BENCHMARKS – IS THE SCHOOL MEETING ITS GOALS?
BASELINE YEAR 1* YEAR 2 2 YEAR GOAL
YEAR 3 YEAR 4 YEAR 5 5 YEAR GOAL 16/17 17/18 18/19 19/20 20/21 21/22
1 Increase the number of overall student growth points as measured by Indiana's statewide assessment. ELA Math
65.7 57.7
ELA Math
59.6 73.0
ELA Math
95.0 101.0
ELA Math
109.6 104.2
2 Increase the percentage of students performing at grade level as measured by Indiana's statewide assessment. ELA Math
24.2% 4.9%
ELA Math
19.0% 7.9%
ELA Math
27.0% 17.0%
ELA Math
38.0% 29.0%
* Because this school was merged with John Marshall Middle School in IPS when it reopened in 2018/2019, data from2017/2018 reflects performance of students at that school.
STUDENT ACHIEVEMENT – ARE STUDENTS PROGRESSING AND ACHIEVING ACADEMICALLY?
15
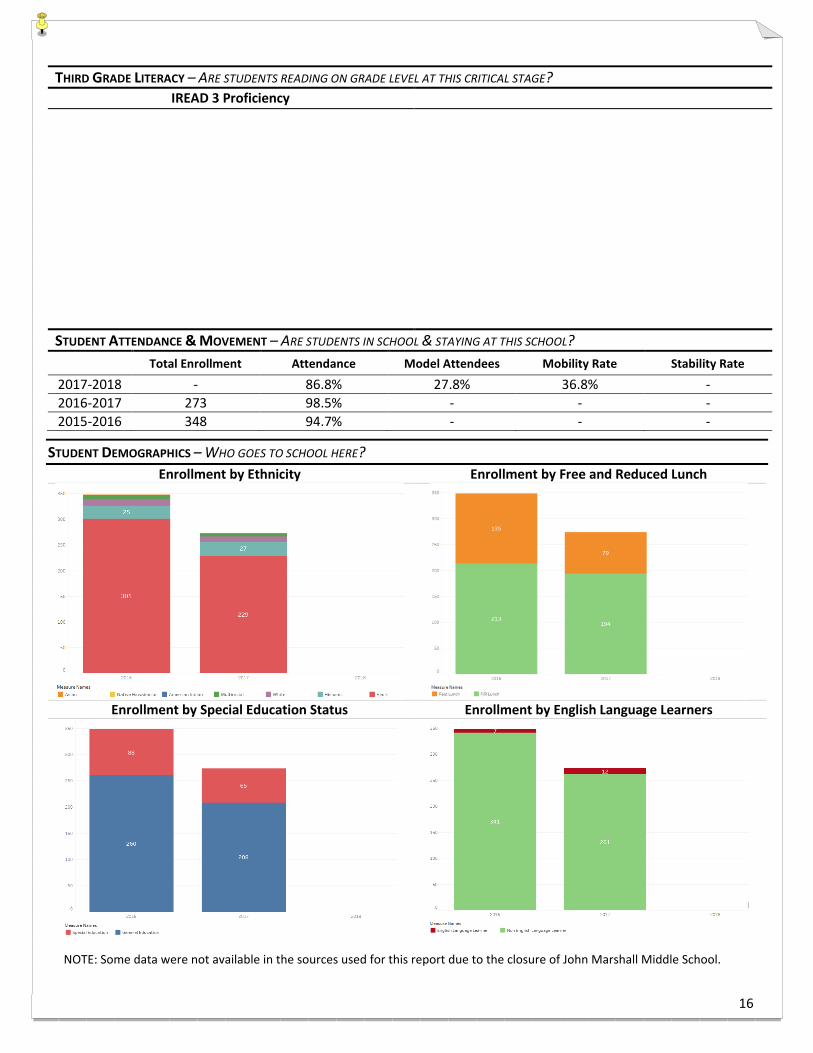
THIRD GRADE LITERACY – ARE STUDENTS READING ON GRADE LEVEL AT THIS CRITICAL STAGE? IREAD 3 Proficiency
STUDENT ATTENDANCE & MOVEMENT – ARE STUDENTS IN SCHOOL & STAYING AT THIS SCHOOL?
Total Enrollment Attendance Model Attendees Mobility Rate Stability Rate
2017-2018 - 86.8% 27.8% 36.8% -
2016-2017 273 98.5% - - -
2015-2016 348 94.7% - - -
STUDENT DEMOGRAPHICS – WHO GOES TO SCHOOL HERE? Enrollment by Ethnicity Enrollment by Free and Reduced Lunch
Enrollment by Special Education Status Enrollment by English Language Learners
NOTE: Some data were not available in the sources used for this report due to the closure of John Marshall Middle School.
16
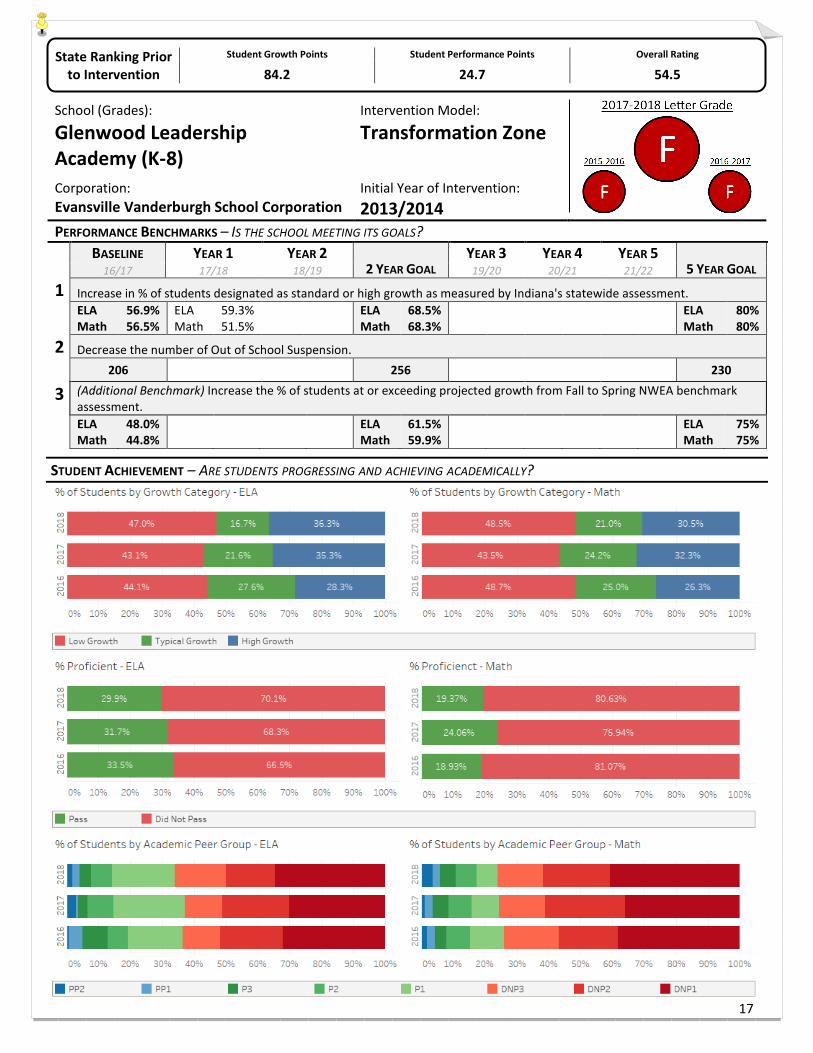
State Ranking Prior to Intervention
Student Growth Points Student Performance Points Overall Rating
84.2 24.7 54.5
School (Grades):
Glenwood Leadership Academy (K-8)
Intervention Model:
Transformation Zone
Corporation: Evansville Vanderburgh School Corporation
Initial Year of Intervention: 2013/2014
PERFORMANCE BENCHMARKS – IS THE SCHOOL MEETING ITS GOALS?BASELINE YEAR 1 YEAR 2
2 YEAR GOAL YEAR 3 YEAR 4 YEAR 5
5 YEAR GOAL 16/17 17/18 18/19 19/20 20/21 21/22
1 Increase in % of students designated as standard or high growth as measured by Indiana's statewide assessment. ELA Math
56.9% 56.5%
ELA Math
59.3% 51.5%
ELA Math
68.5% 68.3%
ELA Math
80% 80%
2 Decrease the number of Out of School Suspension. 206 256 230
3 (Additional Benchmark) Increase the % of students at or exceeding projected growth from Fall to Spring NWEA benchmark assessment. ELA Math
48.0% 44.8%
ELA Math
61.5% 59.9%
ELA Math
75% 75%
STUDENT ACHIEVEMENT – ARE STUDENTS PROGRESSING AND ACHIEVING ACADEMICALLY?
17
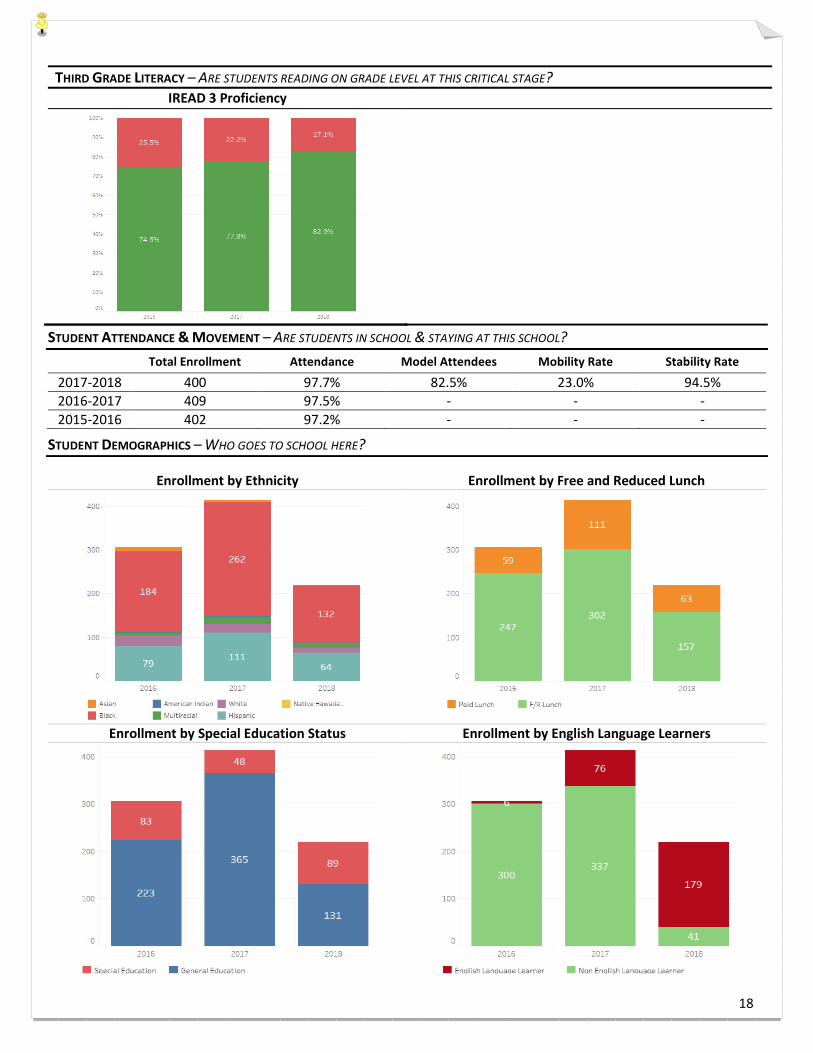
THIRD GRADE LITERACY – ARE STUDENTS READING ON GRADE LEVEL AT THIS CRITICAL STAGE? IREAD 3 Proficiency
STUDENT ATTENDANCE & MOVEMENT – ARE STUDENTS IN SCHOOL & STAYING AT THIS SCHOOL? Total Enrollment Attendance Model Attendees Mobility Rate Stability Rate
2017-2018 400 97.7% 82.5% 23.0% 94.5% 2016-2017 409 97.5% - - - 2015-2016 402 97.2% - - -
STUDENT DEMOGRAPHICS – WHO GOES TO SCHOOL HERE?
Enrollment by Ethnicity Enrollment by Free and Reduced Lunch
Enrollment by Special Education Status Enrollment by English Language Learners
18
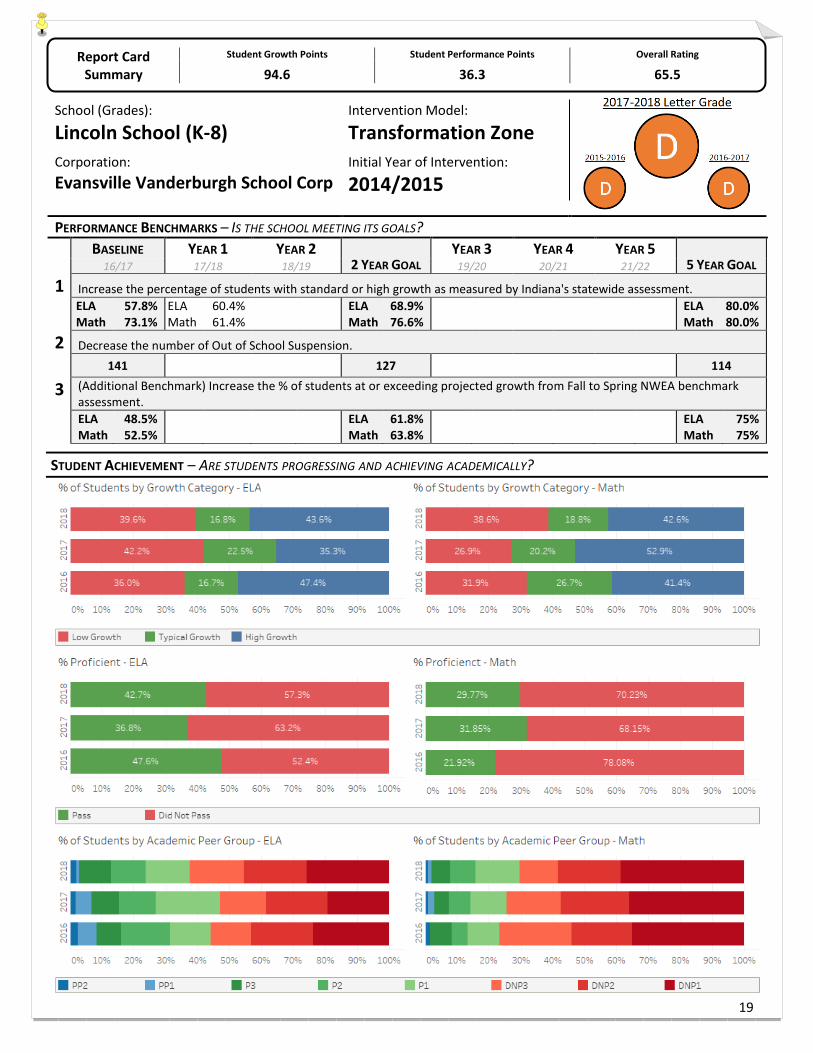
Report Card Summary
Student Growth Points Student Performance Points Overall Rating
94.6 36.3 65.5
School (Grades):
Lincoln School (K-8)Intervention Model:
Transformation ZoneCorporation: Evansville Vanderburgh School Corp
Initial Year of Intervention:
2014/2015
PERFORMANCE BENCHMARKS – IS THE SCHOOL MEETING ITS GOALS?BASELINE YEAR 1 YEAR 2
2 YEAR GOAL YEAR 3 YEAR 4 YEAR 5
5 YEAR GOAL 16/17 17/18 18/19 19/20 20/21 21/22
1 Increase the percentage of students with standard or high growth as measured by Indiana's statewide assessment. ELA Math
57.8% 73.1%
ELA Math
60.4% 61.4%
ELA Math
68.9% 76.6%
ELA Math
80.0% 80.0%
2 Decrease the number of Out of School Suspension. 141 127 114
3 (Additional Benchmark) Increase the % of students at or exceeding projected growth from Fall to Spring NWEA benchmark assessment. ELA Math
48.5% 52.5%
ELA Math
61.8% 63.8%
ELA Math
75% 75%
STUDENT ACHIEVEMENT – ARE STUDENTS PROGRESSING AND ACHIEVING ACADEMICALLY?
19
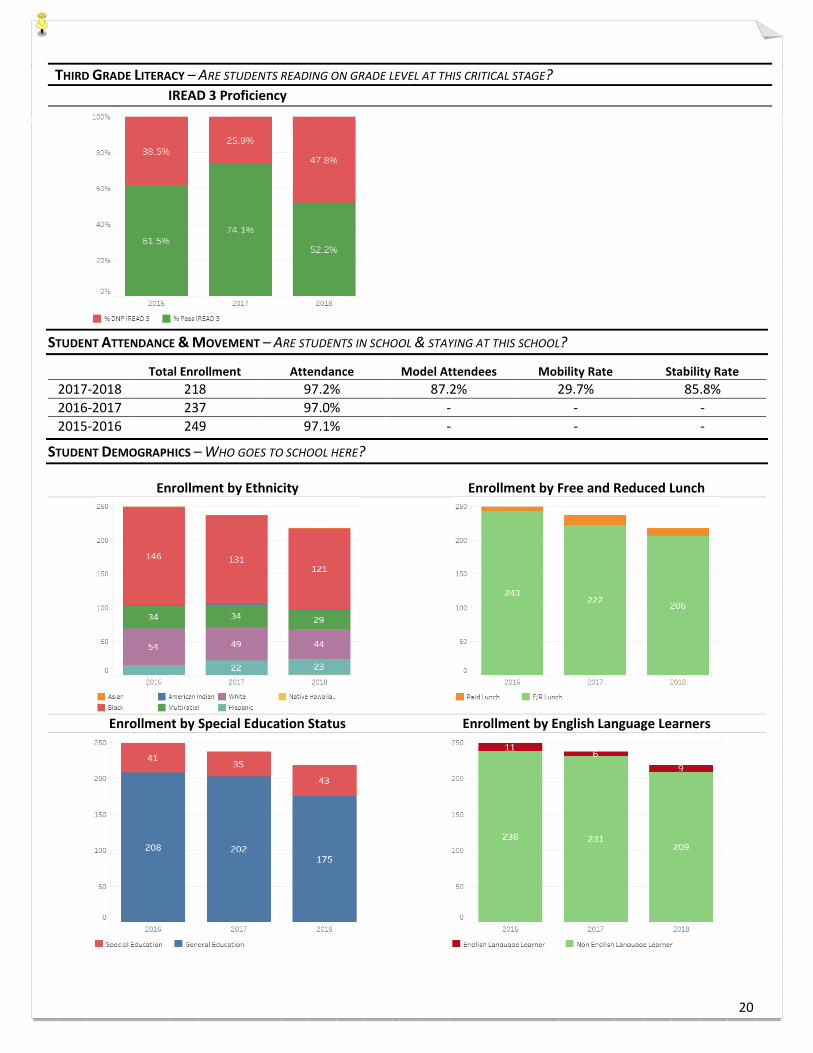
THIRD GRADE LITERACY – ARE STUDENTS READING ON GRADE LEVEL AT THIS CRITICAL STAGE? IREAD 3 Proficiency
STUDENT ATTENDANCE & MOVEMENT – ARE STUDENTS IN SCHOOL & STAYING AT THIS SCHOOL?
Total Enrollment Attendance Model Attendees Mobility Rate Stability Rate 2017-2018 218 97.2% 87.2% 29.7% 85.8% 2016-2017 237 97.0% - - - 2015-2016 249 97.1% - - -
STUDENT DEMOGRAPHICS – WHO GOES TO SCHOOL HERE?
Enrollment by Ethnicity Enrollment by Free and Reduced Lunch
Enrollment by Special Education Status Enrollment by English Language Learners
20
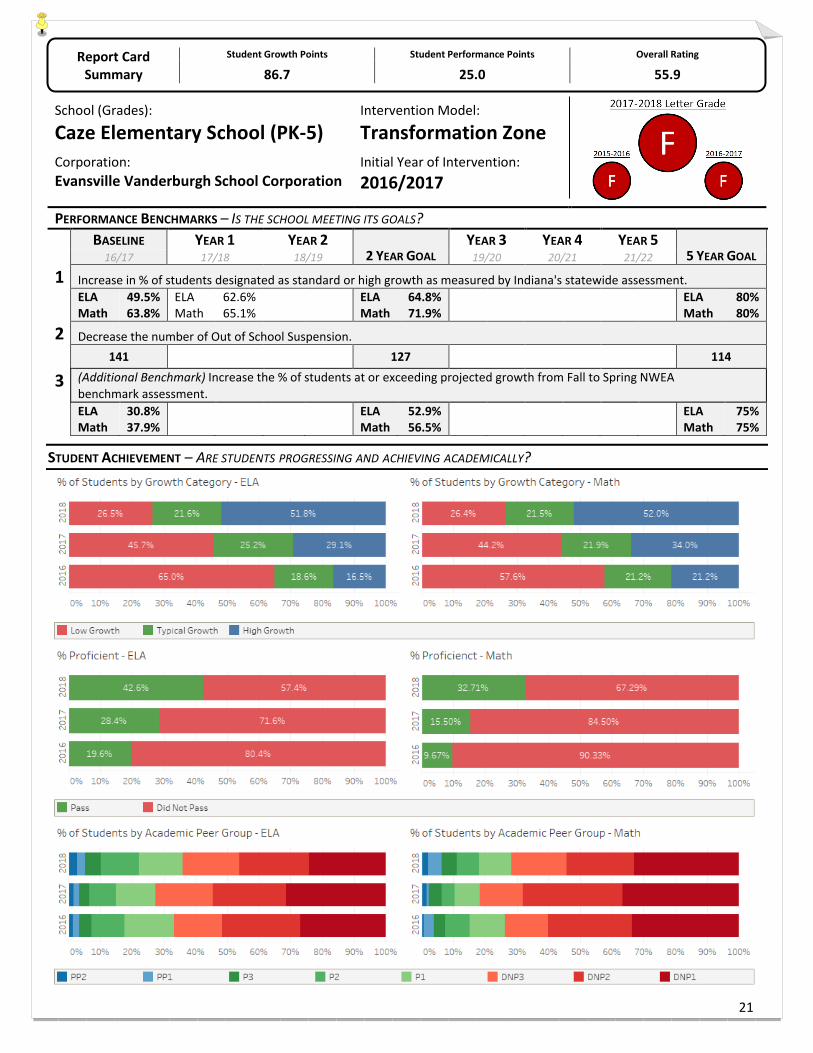
Report Card Summary
Student Growth Points Student Performance Points Overall Rating
86.7 25.0 55.9
School (Grades):
Caze Elementary School (PK-5)Intervention Model:
Transformation ZoneCorporation: Evansville Vanderburgh School Corporation
Initial Year of Intervention: 2016/2017
PERFORMANCE BENCHMARKS – IS THE SCHOOL MEETING ITS GOALS?BASELINE YEAR 1 YEAR 2
2 YEAR GOAL YEAR 3 YEAR 4 YEAR 5
5 YEAR GOAL 16/17 17/18 18/19 19/20 20/21 21/22
1 Increase in % of students designated as standard or high growth as measured by Indiana's statewide assessment. ELA Math
49.5% 63.8%
ELA Math
62.6% 65.1%
ELA Math
64.8% 71.9%
ELA Math
80% 80%
2 Decrease the number of Out of School Suspension. 141 127 114
3 (Additional Benchmark) Increase the % of students at or exceeding projected growth from Fall to Spring NWEA benchmark assessment. ELA Math
30.8% 37.9%
ELA Math
52.9% 56.5%
ELA Math
75% 75%
STUDENT ACHIEVEMENT – ARE STUDENTS PROGRESSING AND ACHIEVING ACADEMICALLY?
21
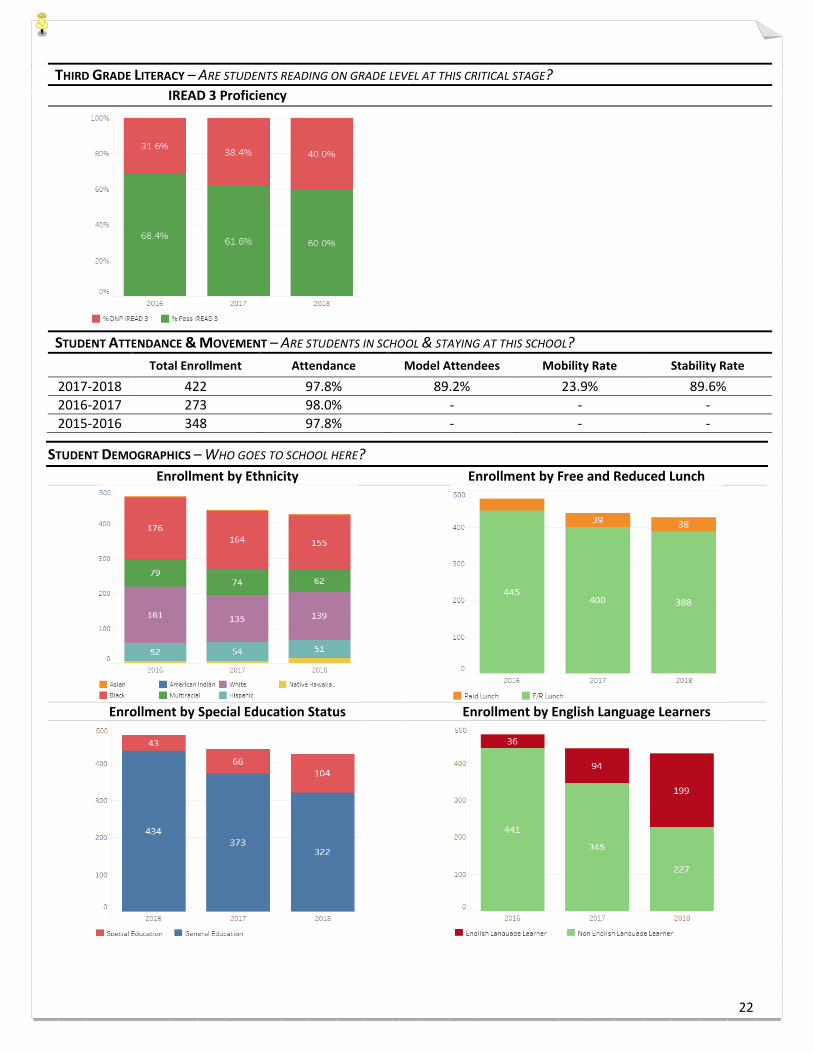
THIRD GRADE LITERACY – ARE STUDENTS READING ON GRADE LEVEL AT THIS CRITICAL STAGE? IREAD 3 Proficiency
STUDENT ATTENDANCE & MOVEMENT – ARE STUDENTS IN SCHOOL & STAYING AT THIS SCHOOL? Total Enrollment Attendance Model Attendees Mobility Rate Stability Rate
2017-2018 422 97.8% 89.2% 23.9% 89.6% 2016-2017 273 98.0% - - - 2015-2016 348 97.8% - - -
STUDENT DEMOGRAPHICS – WHO GOES TO SCHOOL HERE? Enrollment by Ethnicity Enrollment by Free and Reduced Lunch
Enrollment by Special Education Status Enrollment by English Language Learners
22
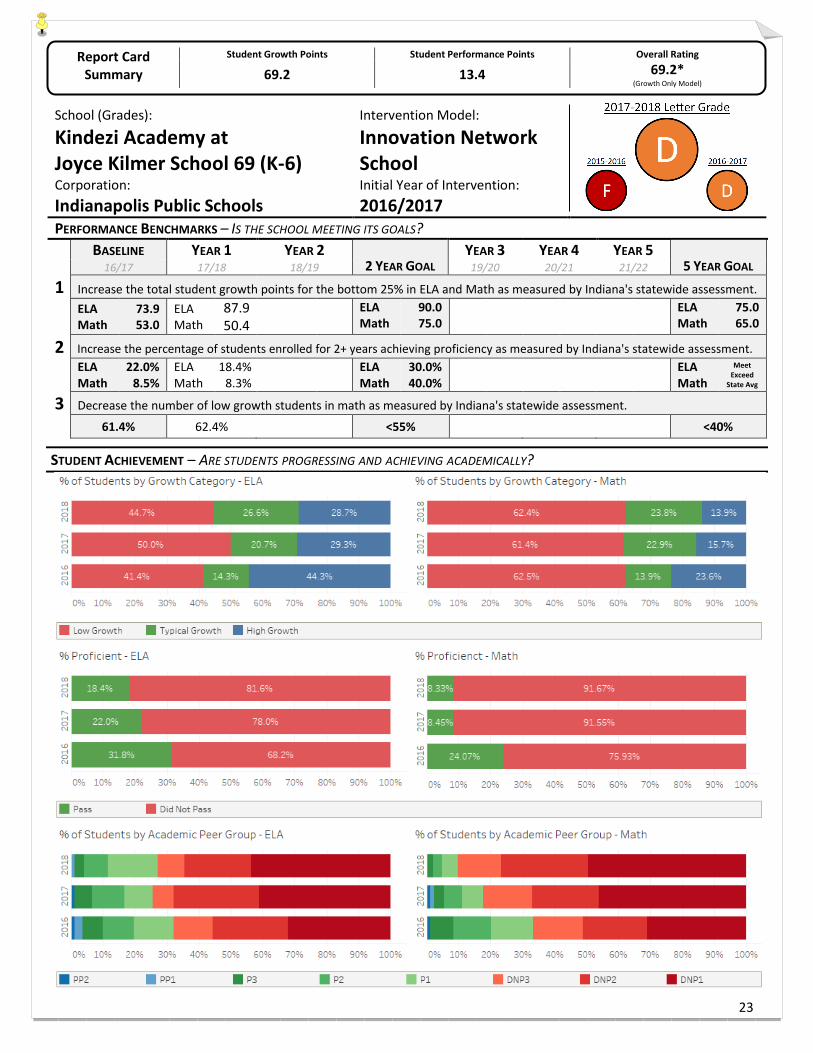
Report Card Summary
Student Growth Points Student Performance Points Overall Rating
69.2 13.4 69.2* (Growth Only Model)
School (Grades):
Kindezi Academy at Joyce Kilmer School 69 (K-6)
Intervention Model:
Innovation NetworkSchool
Corporation: Indianapolis Public Schools
Initial Year of Intervention: 2016/2017
PERFORMANCE BENCHMARKS – IS THE SCHOOL MEETING ITS GOALS?BASELINE YEAR 1 YEAR 2
2 YEAR GOAL YEAR 3 YEAR 4 YEAR 5
5 YEAR GOAL 16/17 17/18 18/19 19/20 20/21 21/22
1 Increase the total student growth points for the bottom 25% in ELA and Math as measured by Indiana's statewide assessment. ELA Math
73.9 53.0
ELA Math
87.9 50.4
ELA Math
90.0 75.0
ELA Math
75.0 65.0
2 Increase the percentage of students enrolled for 2+ years achieving proficiency as measured by Indiana's statewide assessment. ELA Math
22.0% 8.5%
ELA Math
18.4% 8.3%
ELA Math
30.0% 40.0%
ELA Math
Meet Exceed
State Avg
3 Decrease the number of low growth students in math as measured by Indiana's statewide assessment.
61.4% 62.4% <55% <40%
STUDENT ACHIEVEMENT – ARE STUDENTS PROGRESSING AND ACHIEVING ACADEMICALLY?
23
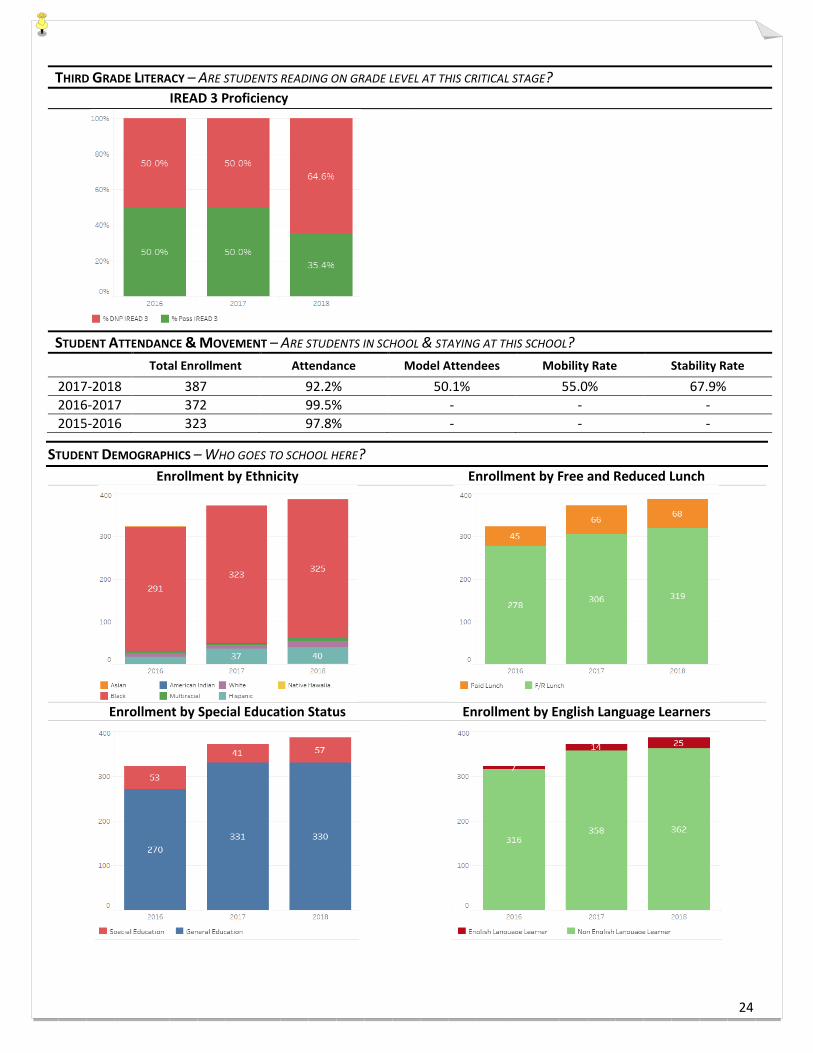
THIRD GRADE LITERACY – ARE STUDENTS READING ON GRADE LEVEL AT THIS CRITICAL STAGE? IREAD 3 Proficiency
STUDENT ATTENDANCE & MOVEMENT – ARE STUDENTS IN SCHOOL & STAYING AT THIS SCHOOL? Total Enrollment Attendance Model Attendees Mobility Rate Stability Rate
2017-2018 387 92.2% 50.1% 55.0% 67.9% 2016-2017 372 99.5% - - - 2015-2016 323 97.8% - - -
STUDENT DEMOGRAPHICS – WHO GOES TO SCHOOL HERE? Enrollment by Ethnicity Enrollment by Free and Reduced Lunch
Enrollment by Special Education Status Enrollment by English Language Learners
24
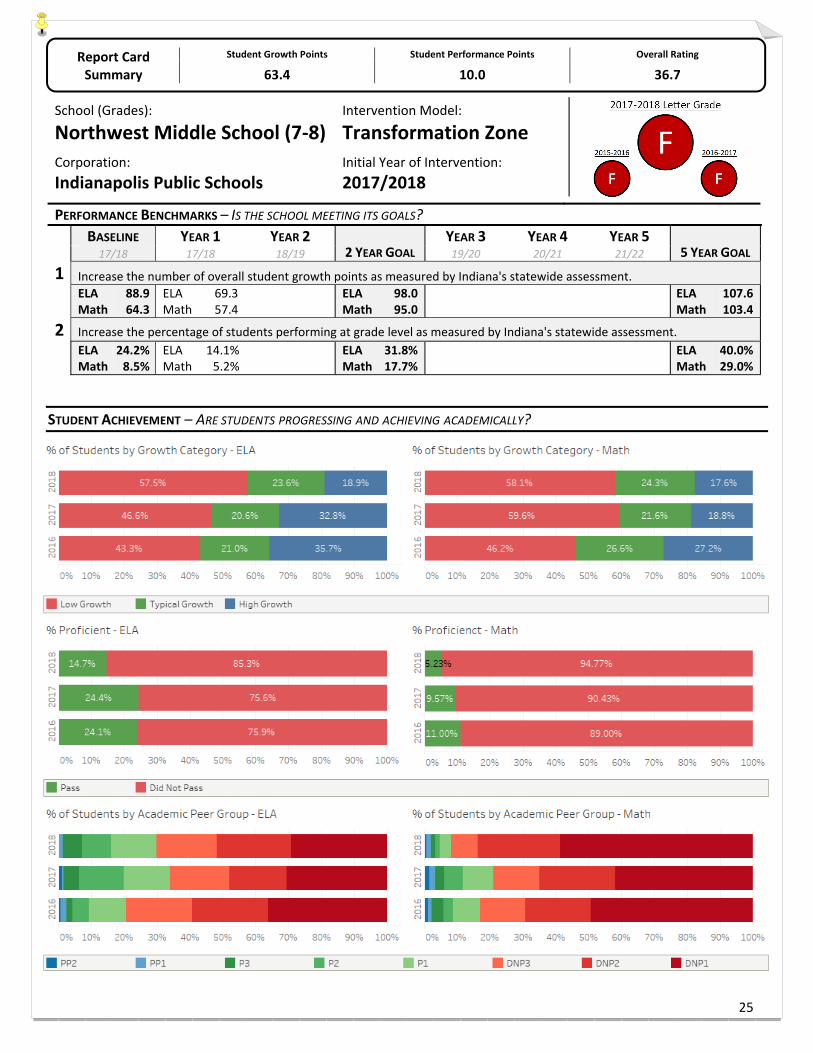
Report Card Summary
Student Growth Points Student Performance Points Overall Rating
63.4 10.0 36.7
School (Grades):
Northwest Middle School (7‐8)Intervention Model:
Transformation Zone
Corporation: Indianapolis Public Schools
Initial Year of Intervention: 2017/2018
PERFORMANCE BENCHMARKS – IS THE SCHOOL MEETING ITS GOALS?
BASELINE YEAR 1 YEAR 2 2 YEAR GOAL
YEAR 3 YEAR 4 YEAR 5 5 YEAR GOAL 17/18 17/18 18/19 19/20 20/21 21/22
1 Increase the number of overall student growth points as measured by Indiana's statewide assessment. ELA Math
88.9 64.3
ELA Math
69.3 57.4 ELA
Math 98.0 95.0
ELA Math
107.6 103.4
2 Increase the percentage of students performing at grade level as measured by Indiana's statewide assessment.ELA Math
24.2% 8.5%
ELA Math
14.1% 5.2% ELA
Math 31.8% 17.7%
ELA Math
40.0% 29.0%
STUDENT ACHIEVEMENT – ARE STUDENTS PROGRESSING AND ACHIEVING ACADEMICALLY?
25
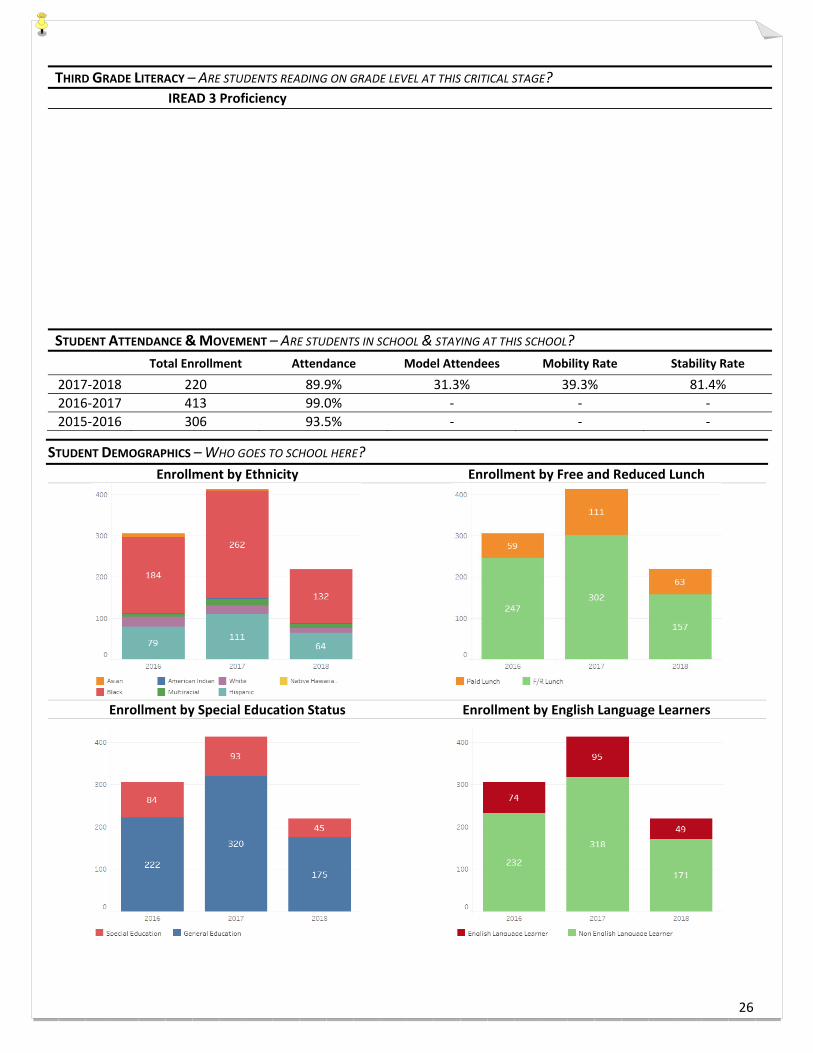
THIRD GRADE LITERACY – ARE STUDENTS READING ON GRADE LEVEL AT THIS CRITICAL STAGE? IREAD 3 Proficiency
STUDENT ATTENDANCE & MOVEMENT – ARE STUDENTS IN SCHOOL & STAYING AT THIS SCHOOL?
Total Enrollment Attendance Model Attendees Mobility Rate Stability Rate
2017‐2018 220 89.9% 31.3% 39.3% 81.4% 2016‐2017 413 99.0% ‐ ‐ ‐ 2015‐2016 306 93.5% ‐ ‐ ‐
STUDENT DEMOGRAPHICS – WHO GOES TO SCHOOL HERE? Enrollment by Ethnicity Enrollment by Free and Reduced Lunch
Enrollment by Special Education Status Enrollment by English Language Learners
26
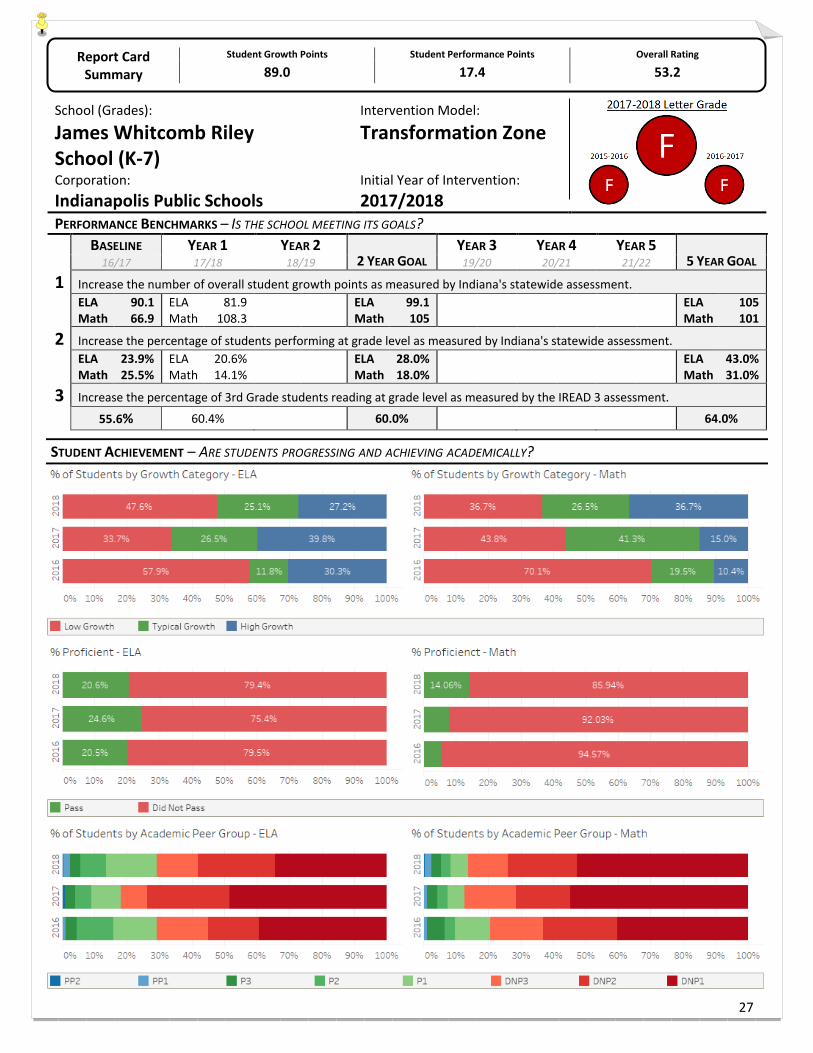
Report Card Summary
Student Growth Points Student Performance Points Overall Rating
89.0 17.4 53.2
School (Grades):
James Whitcomb Riley School (K-7)
Intervention Model:
Transformation Zone
Corporation: Indianapolis Public Schools
Initial Year of Intervention: 2017/2018
PERFORMANCE BENCHMARKS – IS THE SCHOOL MEETING ITS GOALS?BASELINE YEAR 1 YEAR 2
2 YEAR GOAL YEAR 3 YEAR 4 YEAR 5
5 YEAR GOAL 16/17 17/18 18/19 19/20 20/21 21/22
1 Increase the number of overall student growth points as measured by Indiana's statewide assessment. ELA Math
90.1 66.9
ELA Math
81.9 108.3
ELA Math
99.1 105
ELA Math
105 101
2 Increase the percentage of students performing at grade level as measured by Indiana's statewide assessment. ELA Math
23.9% 25.5%
ELA Math
20.6% 14.1%
ELA Math
28.0% 18.0%
ELA Math
43.0% 31.0%
3 Increase the percentage of 3rd Grade students reading at grade level as measured by the IREAD 3 assessment.
55.6% 60.4% 60.0% 64.0%
STUDENT ACHIEVEMENT – ARE STUDENTS PROGRESSING AND ACHIEVING ACADEMICALLY?
27

THIRD GRADE LITERACY – ARE STUDENTS READING ON GRADE LEVEL AT THIS CRITICAL STAGE? IREAD 3 Proficiency
STUDENT ATTENDANCE & MOVEMENT – ARE STUDENTS IN SCHOOL & STAYING AT THIS SCHOOL? Total Enrollment Attendance Model Attendees Mobility Rate Stability Rate
2017-2018 532 91.3% 31.1% 51.5% 68.8% 2016-2017 317 99.4% - - - 2015-2016 396 96.6% - - -
STUDENT DEMOGRAPHICS – WHO GOES TO SCHOOL HERE? Enrollment by Ethnicity Enrollment by Free and Reduced Lunch
Enrollment by Special Education Status Enrollment by English Language Learners
28
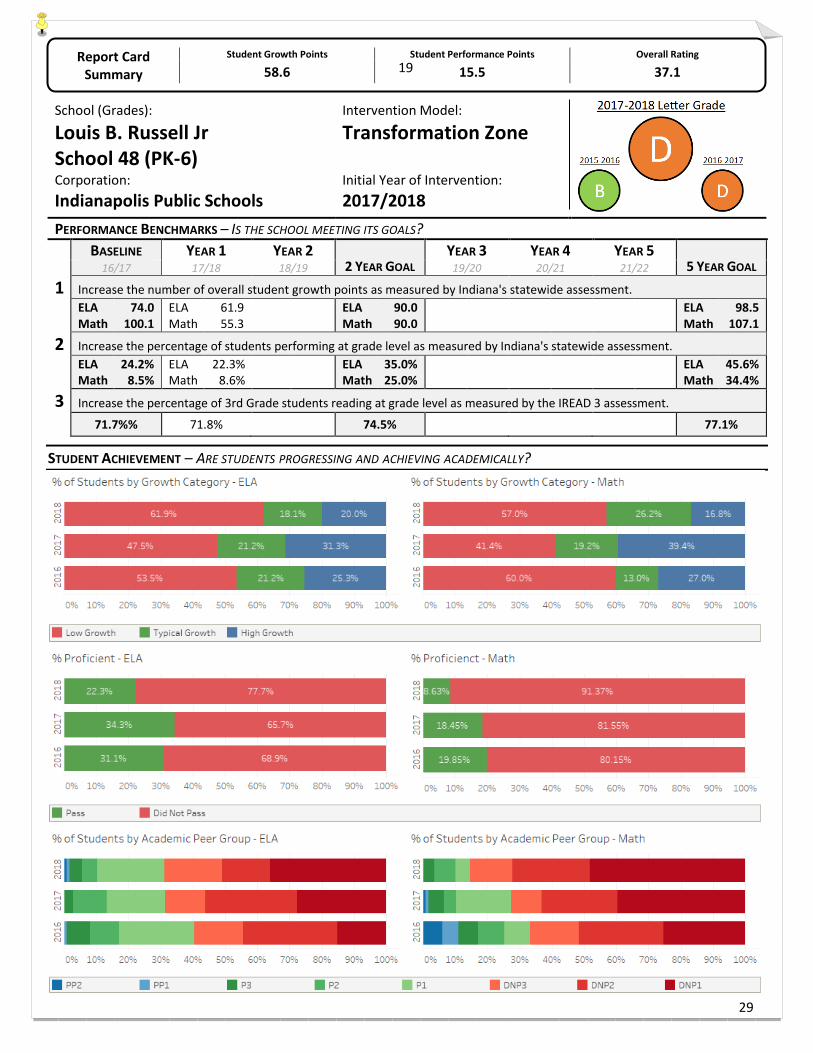
Report Card Summary
Student Growth Points Student Performance Points Overall Rating
58.6 15.5 37.1
School (Grades):
Louis B. Russell Jr School 48 (PK-6)
Intervention Model:
Transformation Zone
Corporation: Indianapolis Public Schools
Initial Year of Intervention: 2017/2018
PERFORMANCE BENCHMARKS – IS THE SCHOOL MEETING ITS GOALS?BASELINE YEAR 1 YEAR 2
2 YEAR GOAL YEAR 3 YEAR 4 YEAR 5
5 YEAR GOAL 16/17 17/18 18/19 19/20 20/21 21/22
1 Increase the number of overall student growth points as measured by Indiana's statewide assessment. ELA Math
74.0 100.1
ELA Math
61.9 55.3
ELA Math
90.0 90.0
ELA Math
98.5 107.1
2 Increase the percentage of students performing at grade level as measured by Indiana's statewide assessment. ELA Math
24.2% 8.5%
ELA Math
22.3% 8.6%
ELA Math
35.0% 25.0%
ELA Math
45.6% 34.4%
3 Increase the percentage of 3rd Grade students reading at grade level as measured by the IREAD 3 assessment.
71.7%% 71.8% 74.5% 77.1%
STUDENT ACHIEVEMENT – ARE STUDENTS PROGRESSING AND ACHIEVING ACADEMICALLY?
19
29
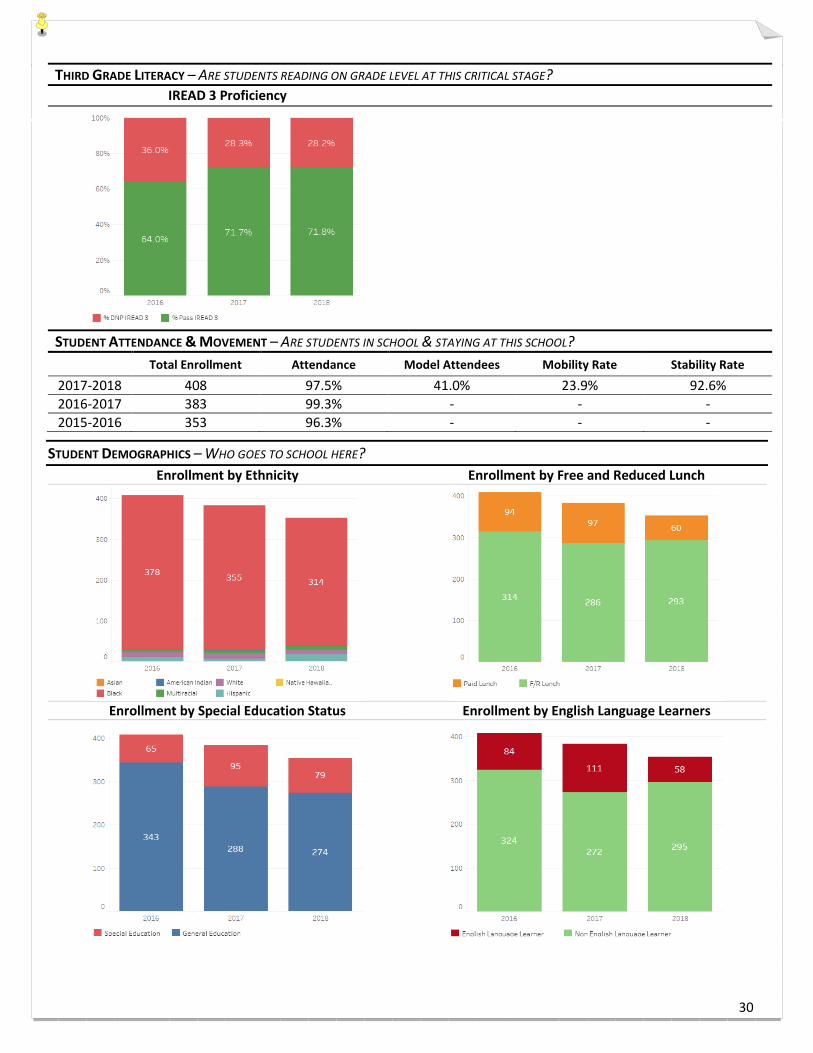
THIRD GRADE LITERACY – ARE STUDENTS READING ON GRADE LEVEL AT THIS CRITICAL STAGE? IREAD 3 Proficiency
STUDENT ATTENDANCE & MOVEMENT – ARE STUDENTS IN SCHOOL & STAYING AT THIS SCHOOL? Total Enrollment Attendance Model Attendees Mobility Rate Stability Rate
2017-2018 408 97.5% 41.0% 23.9% 92.6% 2016-2017 383 99.3% - - - 2015-2016 353 96.3% - - -
STUDENT DEMOGRAPHICS – WHO GOES TO SCHOOL HERE? Enrollment by Ethnicity Enrollment by Free and Reduced Lunch
Enrollment by Special Education Status Enrollment by English Language Learners
30
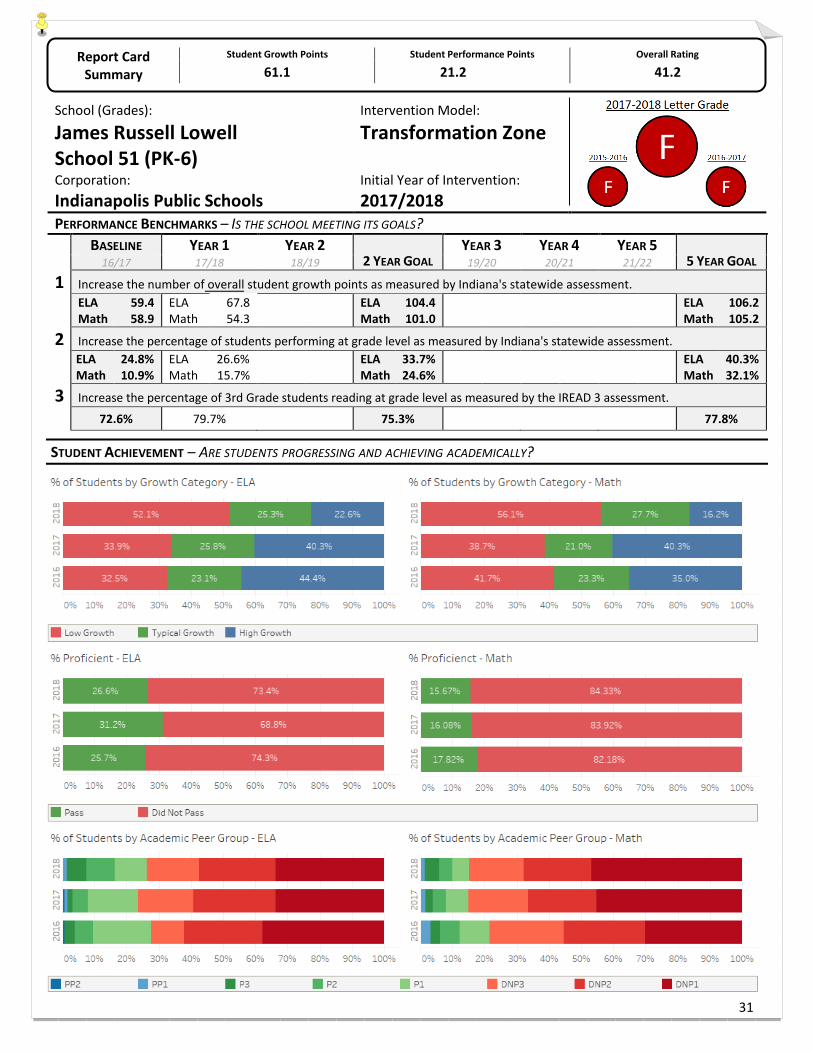
Report Card Summary
Student Performance Points Overall Rating Student Growth Points
61.1 41.2
School (Grades):
James Russell Lowell School 51 (PK-6)Corporation: Indianapolis Public Schools
21.2
Intervention Model:
Transformation Zone
Initial Year of Intervention: 2017/2018
PERFORMANCE BENCHMARKS – IS THE SCHOOL MEETING ITS GOALS?BASELINE YEAR 1 YEAR 2
2 YEAR GOAL YEAR 3 YEAR 4 YEAR 5
5 YEAR GOAL 16/17 17/18 18/19 19/20 20/21 21/22
1 Increase the number of overall student growth points as measured by Indiana's statewide assessment. ELA Math
59.4 58.9
ELA Math
67.8 54.3
ELA Math
104.4 101.0
ELA Math
106.2 105.2
2 Increase the percentage of students performing at grade level as measured by Indiana's statewide assessment. ELA Math
24.8% 10.9%
ELA Math
26.6% 15.7%
ELA Math
33.7% 24.6%
ELA Math
40.3% 32.1%
3 Increase the percentage of 3rd Grade students reading at grade level as measured by the IREAD 3 assessment.
72.6% 79.7% 75.3% 77.8%
STUDENT ACHIEVEMENT – ARE STUDENTS PROGRESSING AND ACHIEVING ACADEMICALLY?
31
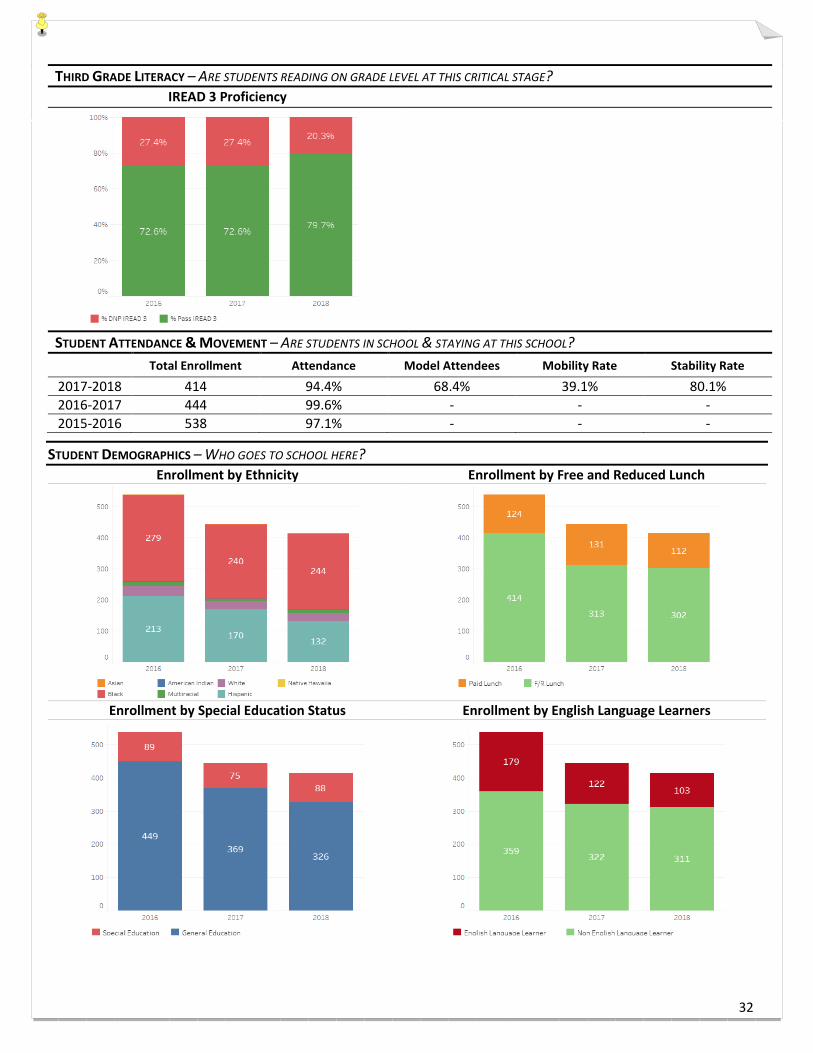
THIRD GRADE LITERACY – ARE STUDENTS READING ON GRADE LEVEL AT THIS CRITICAL STAGE? IREAD 3 Proficiency
STUDENT ATTENDANCE & MOVEMENT – ARE STUDENTS IN SCHOOL & STAYING AT THIS SCHOOL? Total Enrollment Attendance Model Attendees Mobility Rate Stability Rate
2017-2018 414 94.4% 68.4% 39.1% 80.1% 2016-2017 444 99.6% - - - 2015-2016 538 97.1% - - -
STUDENT DEMOGRAPHICS – WHO GOES TO SCHOOL HERE? Enrollment by Ethnicity Enrollment by Free and Reduced Lunch
Enrollment by Special Education Status Enrollment by English Language Learners
32
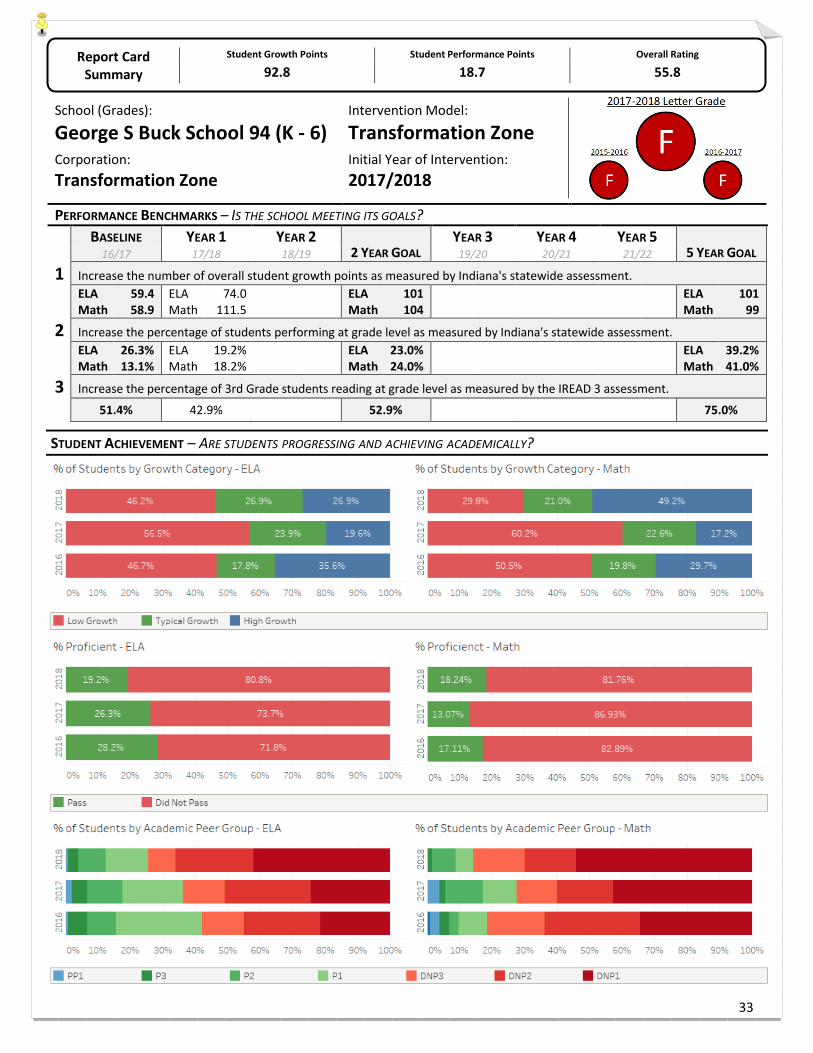
Report Card Summary
Student Growth Points Student Performance Points Overall Rating
92.8 18.7 55.8
School (Grades):
George S Buck School 94 (K - 6)Intervention Model:
Transformation ZoneCorporation: Transformation Zone
Initial Year of Intervention: 2017/2018
PERFORMANCE BENCHMARKS – IS THE SCHOOL MEETING ITS GOALS?BASELINE YEAR 1 YEAR 2
2 YEAR GOAL YEAR 3 YEAR 4 YEAR 5
5 YEAR GOAL 16/17 17/18 18/19 19/20 20/21 21/22
1 Increase the number of overall student growth points as measured by Indiana's statewide assessment. ELA Math
59.4 58.9
ELA Math
74.0 111.5
ELA Math
101 104
ELA Math
101 99
2 Increase the percentage of students performing at grade level as measured by Indiana's statewide assessment. ELA Math
26.3% 13.1%
ELA Math
19.2% 18.2%
ELA Math
23.0% 24.0%
ELA Math
39.2% 41.0%
3 Increase the percentage of 3rd Grade students reading at grade level as measured by the IREAD 3 assessment.
51.4% 42.9% 52.9% 75.0%
STUDENT ACHIEVEMENT – ARE STUDENTS PROGRESSING AND ACHIEVING ACADEMICALLY?
33
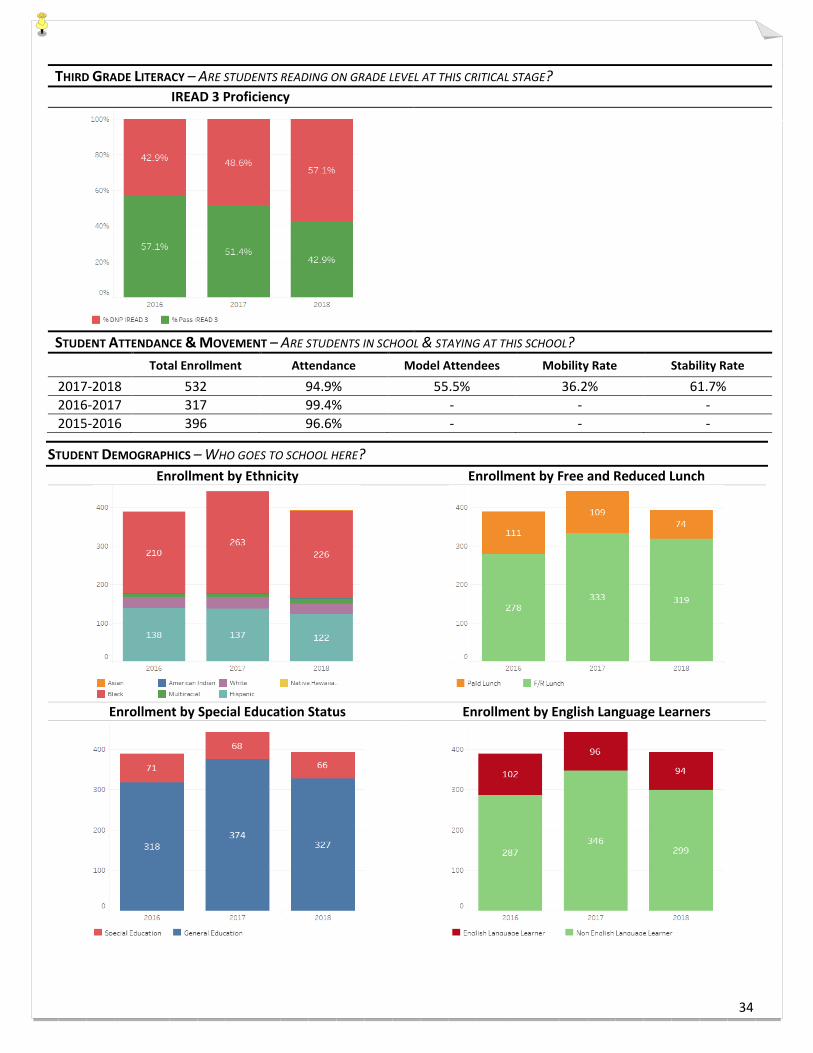
THIRD GRADE LITERACY – ARE STUDENTS READING ON GRADE LEVEL AT THIS CRITICAL STAGE? IREAD 3 Proficiency
STUDENT ATTENDANCE & MOVEMENT – ARE STUDENTS IN SCHOOL & STAYING AT THIS SCHOOL? Total Enrollment Attendance Model Attendees Mobility Rate Stability Rate
2017-2018 532 94.9% 55.5% 36.2% 61.7% 2016-2017 317 99.4% - - - 2015-2016 396 96.6% - - -
STUDENT DEMOGRAPHICS – WHO GOES TO SCHOOL HERE? Enrollment by Ethnicity Enrollment by Free and Reduced Lunch
Enrollment by Special Education Status Enrollment by English Language Learners
34
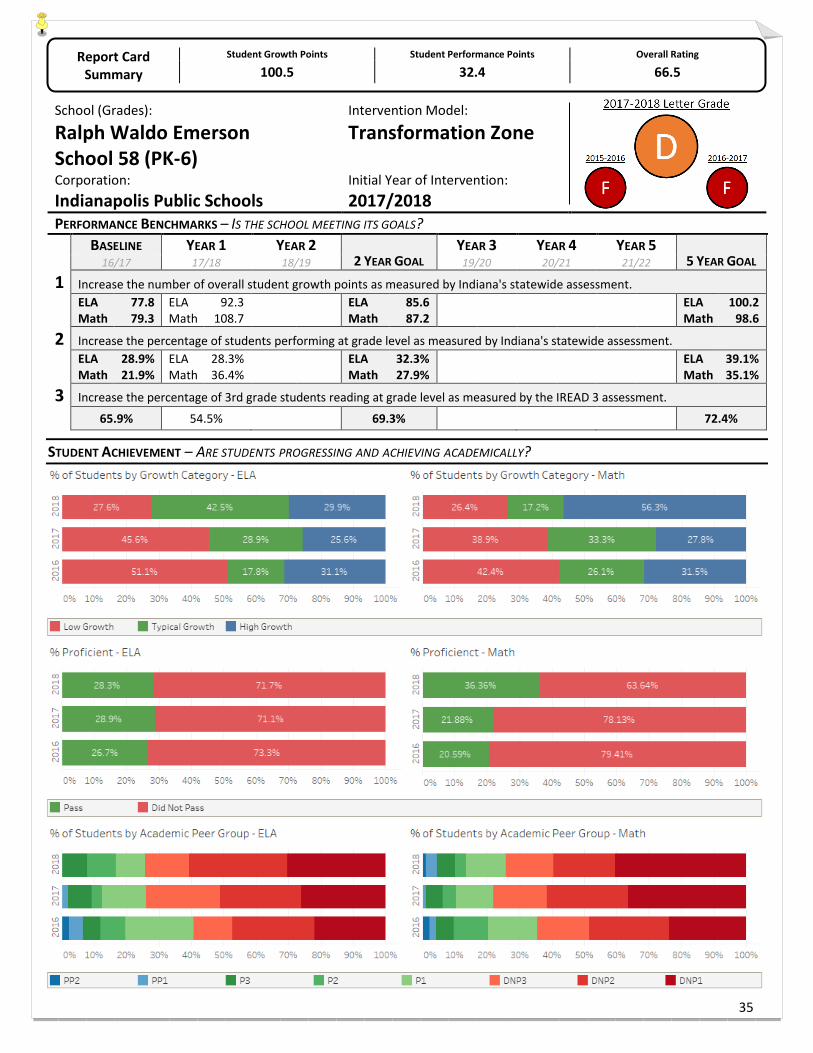
Report Card Summary
Student Growth Points Student Performance Points Overall Rating
100.5 32.4 66.5
School (Grades):
Ralph Waldo Emerson School 58 (PK-6)
Intervention Model:
Transformation Zone
Corporation: Indianapolis Public Schools
Initial Year of Intervention: 2017/2018
PERFORMANCE BENCHMARKS – IS THE SCHOOL MEETING ITS GOALS?BASELINE YEAR 1 YEAR 2
2 YEAR GOAL YEAR 3 YEAR 4 YEAR 5
5 YEAR GOAL 16/17 17/18 18/19 19/20 20/21 21/22
1 Increase the number of overall student growth points as measured by Indiana's statewide assessment.ELA Math
77.8 79.3
ELA Math
92.3 108.7
ELA Math
85.6 87.2
ELA Math
100.2 98.6
2 Increase the percentage of students performing at grade level as measured by Indiana's statewide assessment. ELA Math
28.9% 21.9%
ELA Math
28.3% 36.4%
ELA Math
32.3% 27.9%
ELA Math
39.1% 35.1%
3 Increase the percentage of 3rd grade students reading at grade level as measured by the IREAD 3 assessment.
65.9% 54.5% 69.3% 72.4%
STUDENT ACHIEVEMENT – ARE STUDENTS PROGRESSING AND ACHIEVING ACADEMICALLY?
35
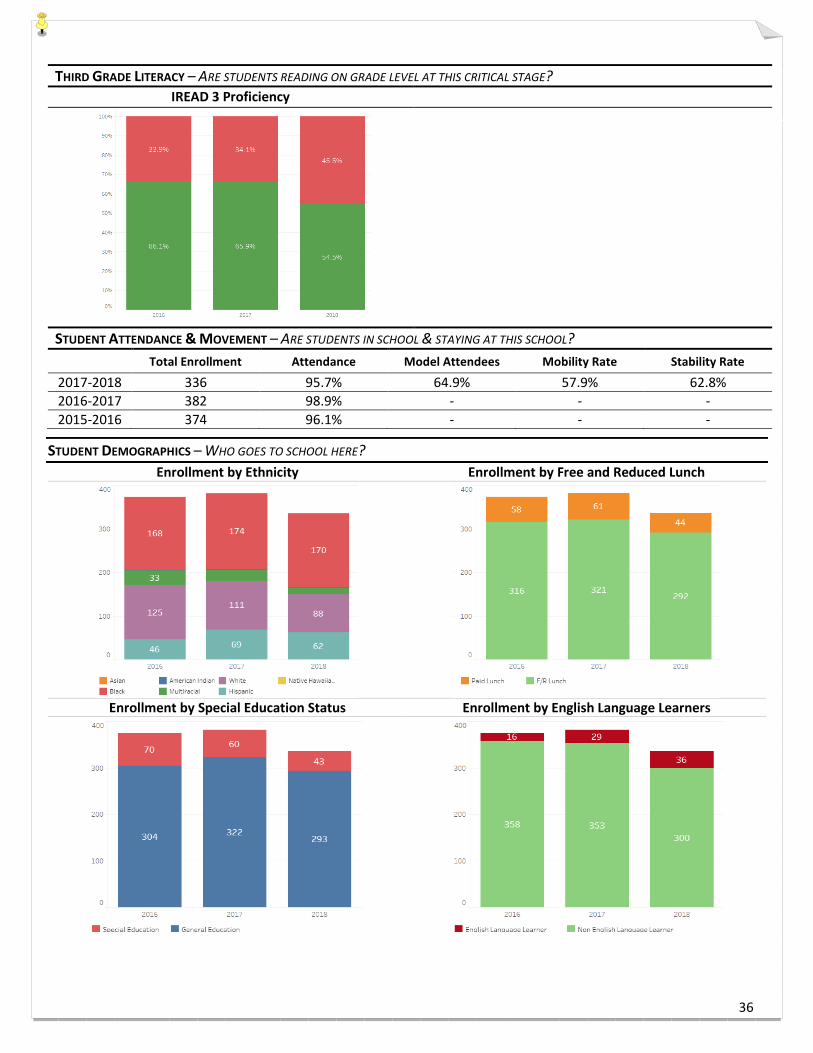
THIRD GRADE LITERACY – ARE STUDENTS READING ON GRADE LEVEL AT THIS CRITICAL STAGE? IREAD 3 Proficiency
STUDENT ATTENDANCE & MOVEMENT – ARE STUDENTS IN SCHOOL & STAYING AT THIS SCHOOL? Total Enrollment Attendance Model Attendees Mobility Rate Stability Rate
2017-2018 336 95.7% 64.9% 57.9% 62.8% 2016-2017 382 98.9% - - - 2015-2016 374 96.1% - - -
STUDENT DEMOGRAPHICS – WHO GOES TO SCHOOL HERE? Enrollment by Ethnicity Enrollment by Free and Reduced Lunch
Enrollment by Special Education Status Enrollment by English Language Learners
36
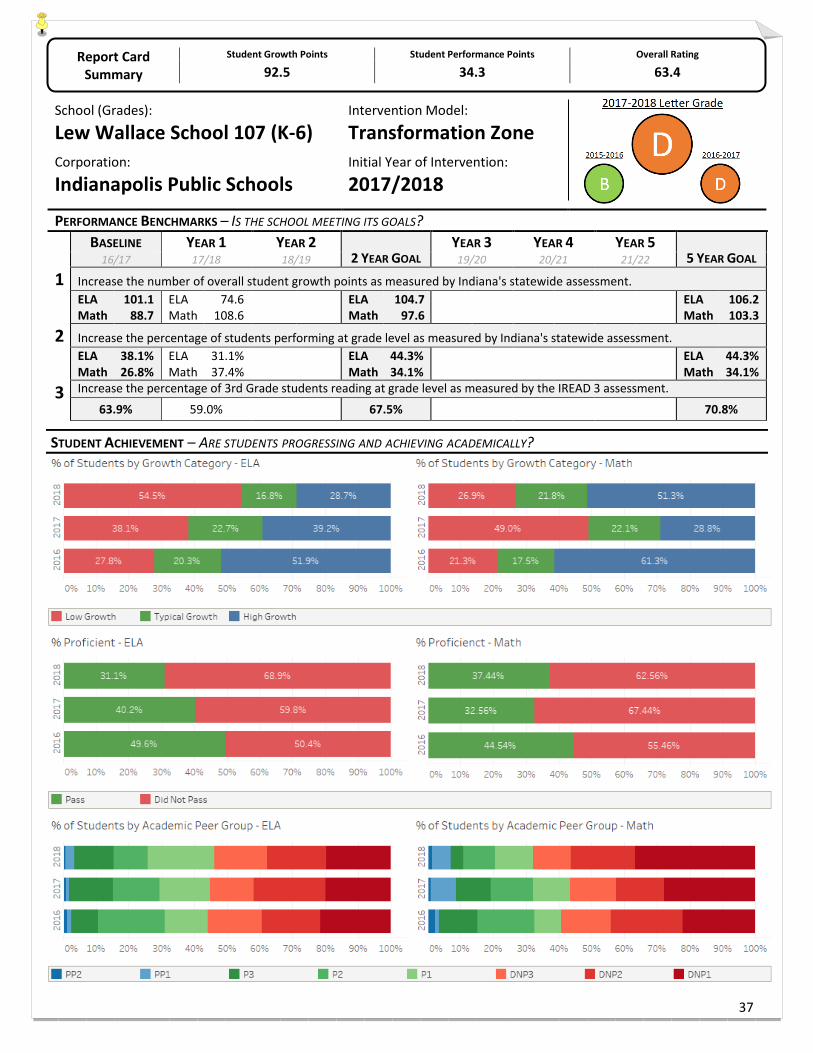
Report Card Summary
Student Growth Points Student Performance Points Overall Rating
92.5 34.3 63.4
School (Grades):
Lew Wallace School 107 (K-6)Intervention Model:
Transformation ZoneCorporation:
Indianapolis Public SchoolsInitial Year of Intervention:
2017/2018
PERFORMANCE BENCHMARKS – IS THE SCHOOL MEETING ITS GOALS?BASELINE YEAR 1 YEAR 2
2 YEAR GOAL YEAR 3 YEAR 4 YEAR 5
5 YEAR GOAL 16/17 17/18 18/19 19/20 20/21 21/22
1 Increase the number of overall student growth points as measured by Indiana's statewide assessment. ELA Math
101.1 88.7
ELA Math
74.6 108.6
ELA Math
104.7 97.6
ELA Math
106.2 103.3
2 Increase the percentage of students performing at grade level as measured by Indiana's statewide assessment. ELA Math
38.1% 26.8%
ELA Math
31.1% 37.4%
ELA Math
44.3% 34.1%
ELA Math
44.3% 34.1%
3 Increase the percentage of 3rd Grade students reading at grade level as measured by the IREAD 3 assessment.
63.9% 59.0% 67.5% 70.8%
STUDENT ACHIEVEMENT – ARE STUDENTS PROGRESSING AND ACHIEVING ACADEMICALLY?
37
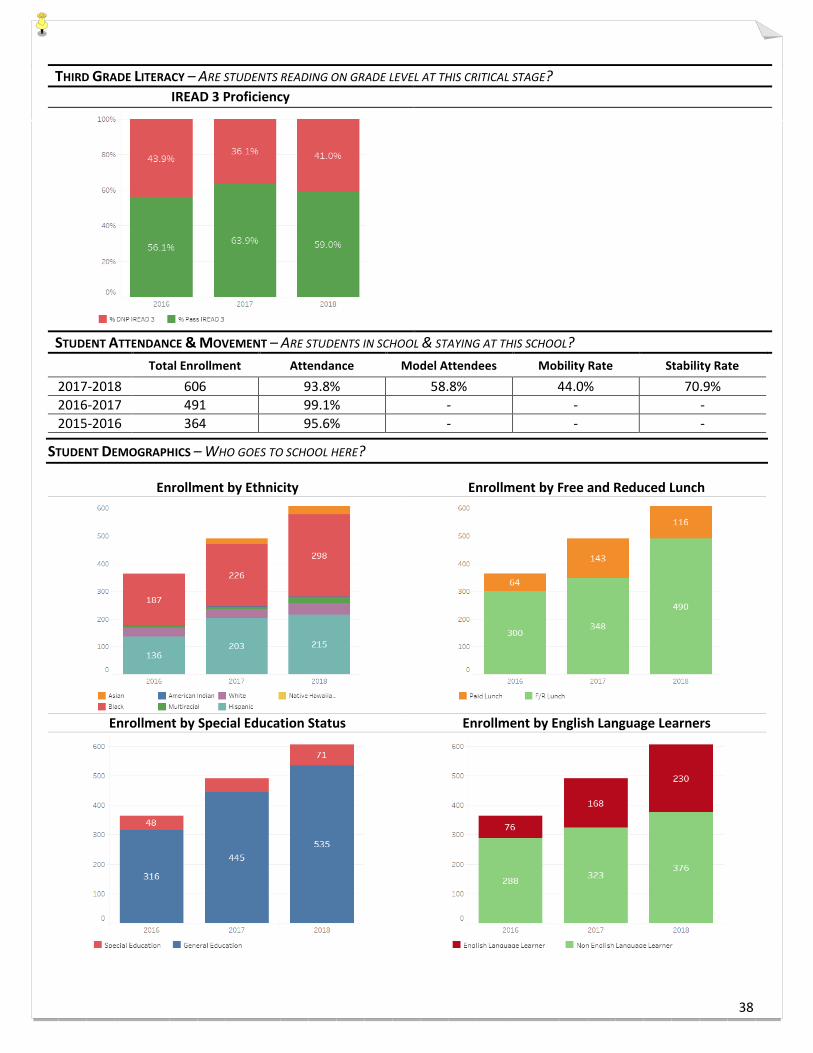
THIRD GRADE LITERACY – ARE STUDENTS READING ON GRADE LEVEL AT THIS CRITICAL STAGE? IREAD 3 Proficiency
STUDENT ATTENDANCE & MOVEMENT – ARE STUDENTS IN SCHOOL & STAYING AT THIS SCHOOL? Total Enrollment Attendance Model Attendees Mobility Rate Stability Rate
2017-2018 606 93.8% 58.8% 44.0% 70.9% 2016-2017 491 99.1% - - - 2015-2016 364 95.6% - - -
STUDENT DEMOGRAPHICS – WHO GOES TO SCHOOL HERE?
Enrollment by Ethnicity Enrollment by Free and Reduced Lunch
Enrollment by Special Education Status Enrollment by English Language Learners
38
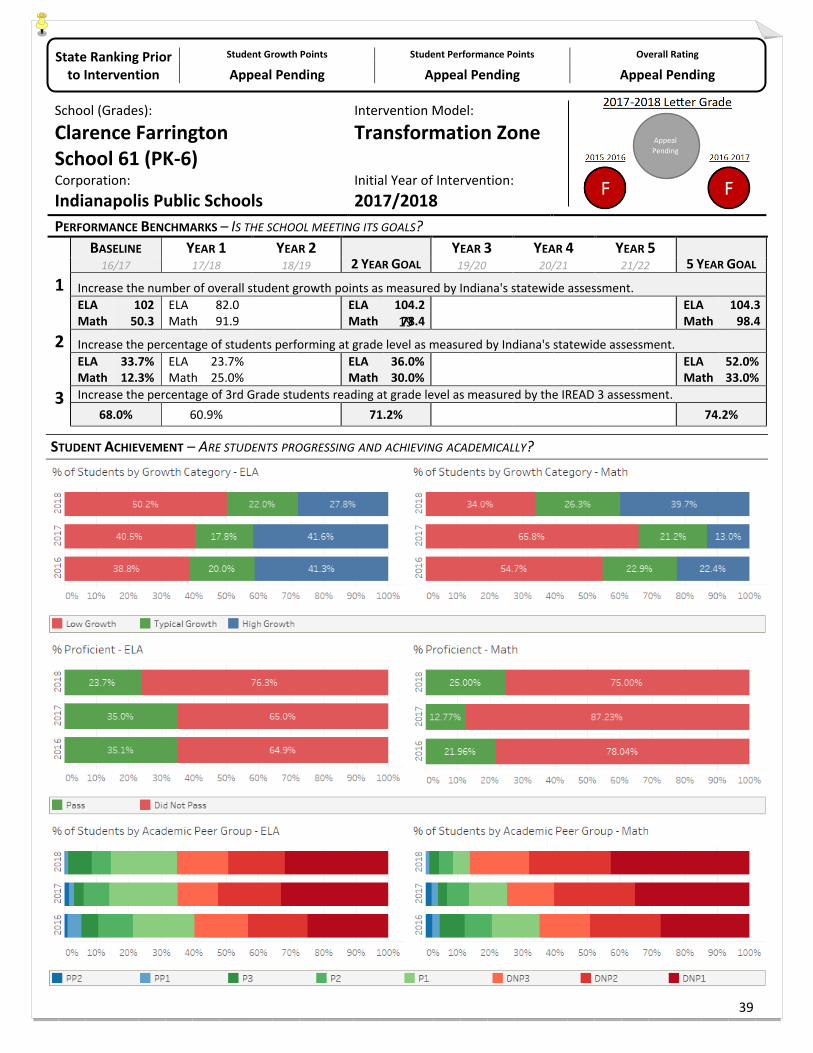
State Ranking Prior to Intervention
Student Growth Points Student Performance Points Overall Rating
Appeal Pending Appeal Pending Appeal Pending
School (Grades):
Clarence Farrington School 61 (PK-6)
Intervention Model:
Transformation Zone
Corporation: Indianapolis Public Schools
Initial Year of Intervention: 2017/2018
PERFORMANCE BENCHMARKS – IS THE SCHOOL MEETING ITS GOALS?BASELINE YEAR 1 YEAR 2
2 YEAR GOAL YEAR 3 YEAR 4 YEAR 5
5 YEAR GOAL 16/17 17/18 18/19 19/20 20/21 21/22
1 Increase the number of overall student growth points as measured by Indiana's statewide assessment. ELA Math
102 50.3
ELA Math
82.0 91.9
ELA Math
104.2 78.4
ELA Math
104.3 98.4
2 Increase the percentage of students performing at grade level as measured by Indiana's statewide assessment. ELA Math
33.7% 12.3%
ELA Math
23.7% 25.0%
ELA Math
36.0% 30.0%
ELA Math
52.0% 33.0%
3 Increase the percentage of 3rd Grade students reading at grade level as measured by the IREAD 3 assessment. 68.0% 60.9% 71.2% 74.2%
STUDENT ACHIEVEMENT – ARE STUDENTS PROGRESSING AND ACHIEVING ACADEMICALLY?
Appeal Pending
19
39
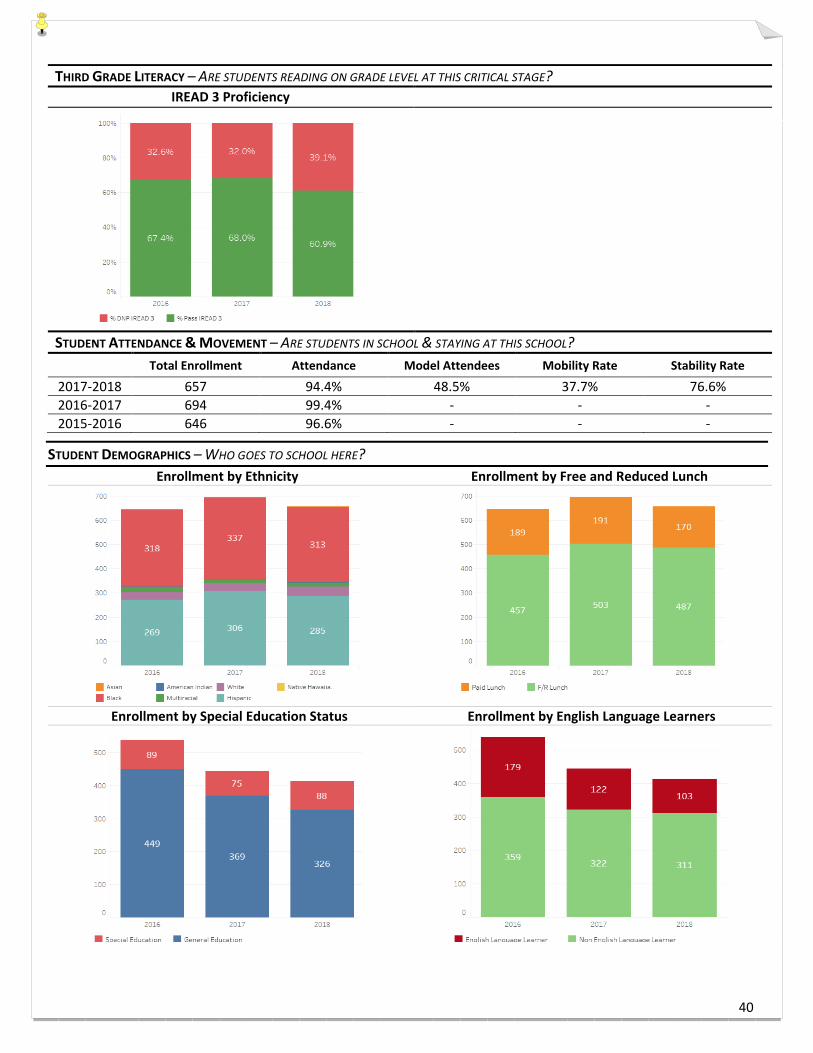
THIRD GRADE LITERACY – ARE STUDENTS READING ON GRADE LEVEL AT THIS CRITICAL STAGE? IREAD 3 Proficiency
STUDENT ATTENDANCE & MOVEMENT – ARE STUDENTS IN SCHOOL & STAYING AT THIS SCHOOL? Total Enrollment Attendance Model Attendees Mobility Rate Stability Rate
2017-2018 657 94.4% 48.5% 37.7% 76.6% 2016-2017 694 99.4% - - - 2015-2016 646 96.6% - - -
STUDENT DEMOGRAPHICS – WHO GOES TO SCHOOL HERE? Enrollment by Ethnicity Enrollment by Free and Reduced Lunch
Enrollment by Special Education Status Enrollment by English Language Learners
40
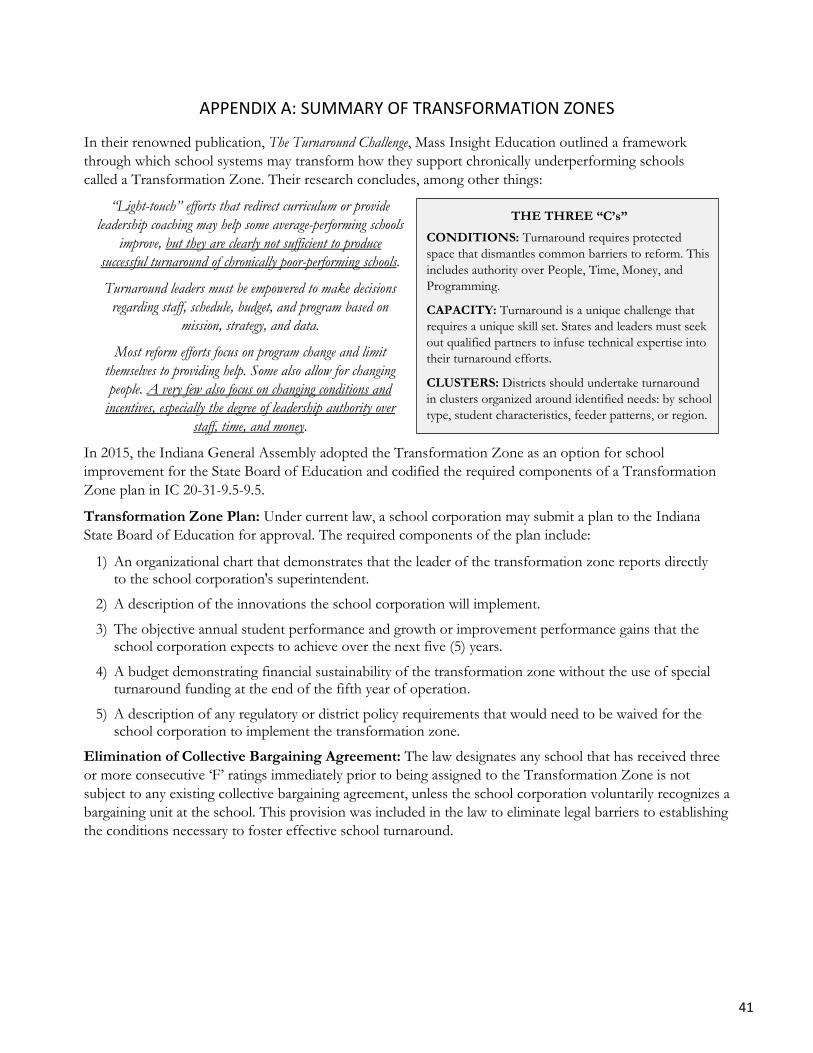
APPENDIX A: SUMMARY OF TRANSFORMATION ZONES
In their renowned publication, The Turnaround Challenge, Mass Insight Education outlined a framework
through which school systems may transform how they support chronically underperforming schools
called a Transformation Zone. Their research concludes, among other things:
“Light-touch” efforts that redirect curriculum or provide
leadership coaching may help some average-performing schools
improve, but they are clearly not sufficient to produce
successful turnaround of chronically poor-performing schools.
Turnaround leaders must be empowered to make decisions
regarding staff, schedule, budget, and program based on
mission, strategy, and data.
Most reform efforts focus on program change and limit
themselves to providing help. Some also allow for changing
people. A very few also focus on changing conditions and
incentives, especially the degree of leadership authority over
staff, time, and money.
In 2015, the Indiana General Assembly adopted the Transformation Zone as an option for school
improvement for the State Board of Education and codified the required components of a Transformation
Zone plan in IC 20-31-9.5-9.5.
Transformation Zone Plan: Under current law, a school corporation may submit a plan to the Indiana
State Board of Education for approval. The required components of the plan include:
1) An organizational chart that demonstrates that the leader of the transformation zone reports directlyto the school corporation's superintendent.
2) A description of the innovations the school corporation will implement.
3) The objective annual student performance and growth or improvement performance gains that theschool corporation expects to achieve over the next five (5) years.
4) A budget demonstrating financial sustainability of the transformation zone without the use of specialturnaround funding at the end of the fifth year of operation.
5) A description of any regulatory or district policy requirements that would need to be waived for theschool corporation to implement the transformation zone.
Elimination of Collective Bargaining Agreement: The law designates any school that has received three
or more consecutive ‘F’ ratings immediately prior to being assigned to the Transformation Zone is not
subject to any existing collective bargaining agreement, unless the school corporation voluntarily recognizes a
bargaining unit at the school. This provision was included in the law to eliminate legal barriers to establishing
the conditions necessary to foster effective school turnaround.
THE THREE “C’s”
CONDITIONS: Turnaround requires protected
space that dismantles common barriers to reform. This
includes authority over People, Time, Money, and
Programming.
CAPACITY: Turnaround is a unique challenge that
requires a unique skill set. States and leaders must seek
out qualified partners to infuse technical expertise into
their turnaround efforts.
CLUSTERS: Districts should undertake turnaround
in clusters organized around identified needs: by school
type, student characteristics, feeder patterns, or region.
41
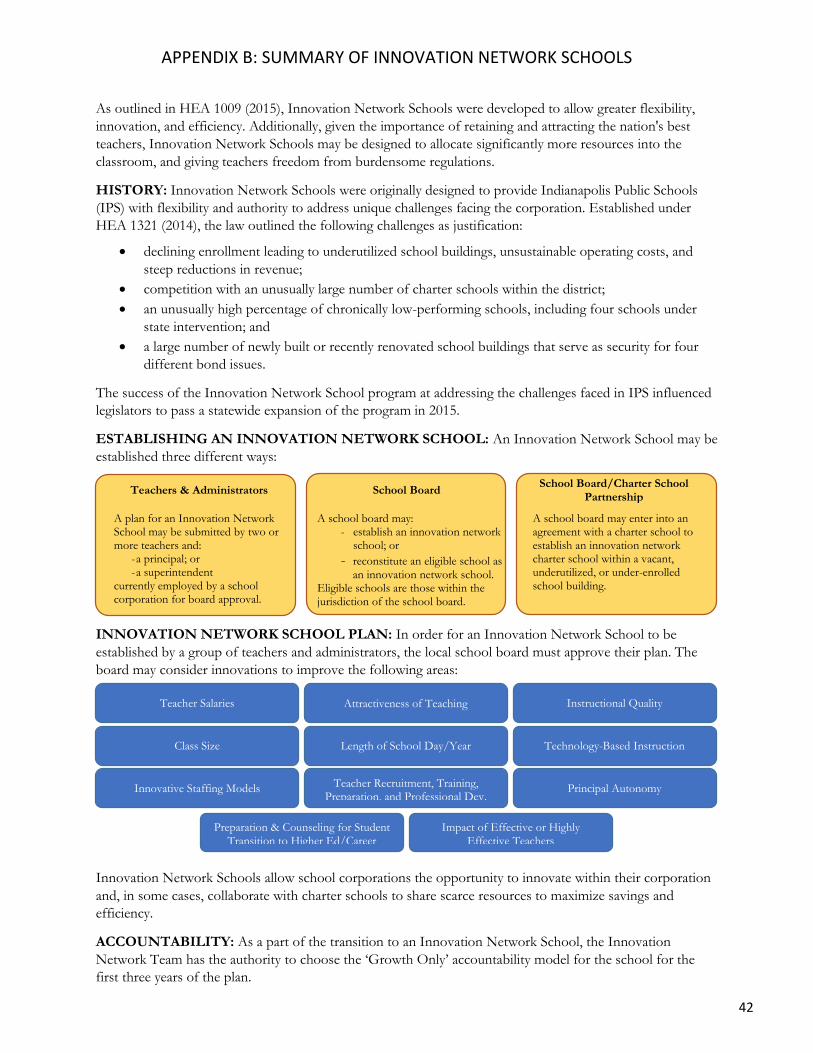
APPENDIX B: SUMMARY OF INNOVATION NETWORK SCHOOLS
As outlined in HEA 1009 (2015), Innovation Network Schools were developed to allow greater flexibility,
innovation, and efficiency. Additionally, given the importance of retaining and attracting the nation's best
teachers, Innovation Network Schools may be designed to allocate significantly more resources into the
classroom, and giving teachers freedom from burdensome regulations.
HISTORY: Innovation Network Schools were originally designed to provide Indianapolis Public Schools
(IPS) with flexibility and authority to address unique challenges facing the corporation. Established under
HEA 1321 (2014), the law outlined the following challenges as justification:
declining enrollment leading to underutilized school buildings, unsustainable operating costs, and
steep reductions in revenue;
competition with an unusually large number of charter schools within the district;
an unusually high percentage of chronically low-performing schools, including four schools under
state intervention; and
a large number of newly built or recently renovated school buildings that serve as security for four
different bond issues.
The success of the Innovation Network School program at addressing the challenges faced in IPS influenced
legislators to pass a statewide expansion of the program in 2015.
ESTABLISHING AN INNOVATION NETWORK SCHOOL: An Innovation Network School may be
established three different ways:
Teachers & Administrators School Board School Board/Charter School
Partnership
A plan for an Innovation Network School may be submitted by two or more teachers and:
- a principal; or- a superintendent
currently employed by a school corporation for board approval.
A school board may: - establish an innovation network
school; or
- reconstitute an eligible school asan innovation network school.
Eligible schools are those within the jurisdiction of the school board.
A school board may enter into an agreement with a charter school to establish an innovation network charter school within a vacant, underutilized, or under-enrolled school building.
INNOVATION NETWORK SCHOOL PLAN: In order for an Innovation Network School to be
established by a group of teachers and administrators, the local school board must approve their plan. The
board may consider innovations to improve the following areas:
Innovation Network Schools allow school corporations the opportunity to innovate within their corporation
and, in some cases, collaborate with charter schools to share scarce resources to maximize savings and
efficiency.
ACCOUNTABILITY: As a part of the transition to an Innovation Network School, the Innovation
Network Team has the authority to choose the ‘Growth Only’ accountability model for the school for the
first three years of the plan.
Teacher Salaries Attractiveness of Teaching Instructional Quality
Class Size Length of School Day/Year Technology-Based Instruction
Innovative Staffing Models Teacher Recruitment, Training, Preparation, and Professional Dev.
Principal Autonomy
Preparation & Counseling for Student Transition to Higher Ed/Career
Impact of Effective or Highly Effective Teachers
42
APPENDIX C: APPROVED TURNAROUND COMMITTEE RECOMMENDATIONS
This page was intentionally left blank. The recommendations can be found on subsequent pages.
43
IN
DIA
NA
ST
AT
E B
OA
RD
OF
ED
UC
AT
ION
▪14
3 W
. Mark
et Street, S
uite 5
00
▪ Ind
ian
apo
lis, Ind
ian
a 46
20
4 ▪
▪ (317)
23
2-2
00
0 ▪ w
ww
.in.g
ov
/sbo
e ▪
TO:
STATE B
OA
RD
OF ED
UC
ATIO
N
FRO
M:
CO
MM
ITTEE ON
SCH
OO
L TUR
NA
RO
UN
DS
DA
TE: D
ECEM
BER
3, 20
14
SU
BJEC
T: C
OM
MITTEE’S R
ECO
MM
END
ATIO
NS FO
R SB
OE – A
CTIO
N ITEM
Actio
ns an
d P
olicies to
Refin
e th
e SB
OE Sch
oo
l Inte
rven
tion
Mo
de
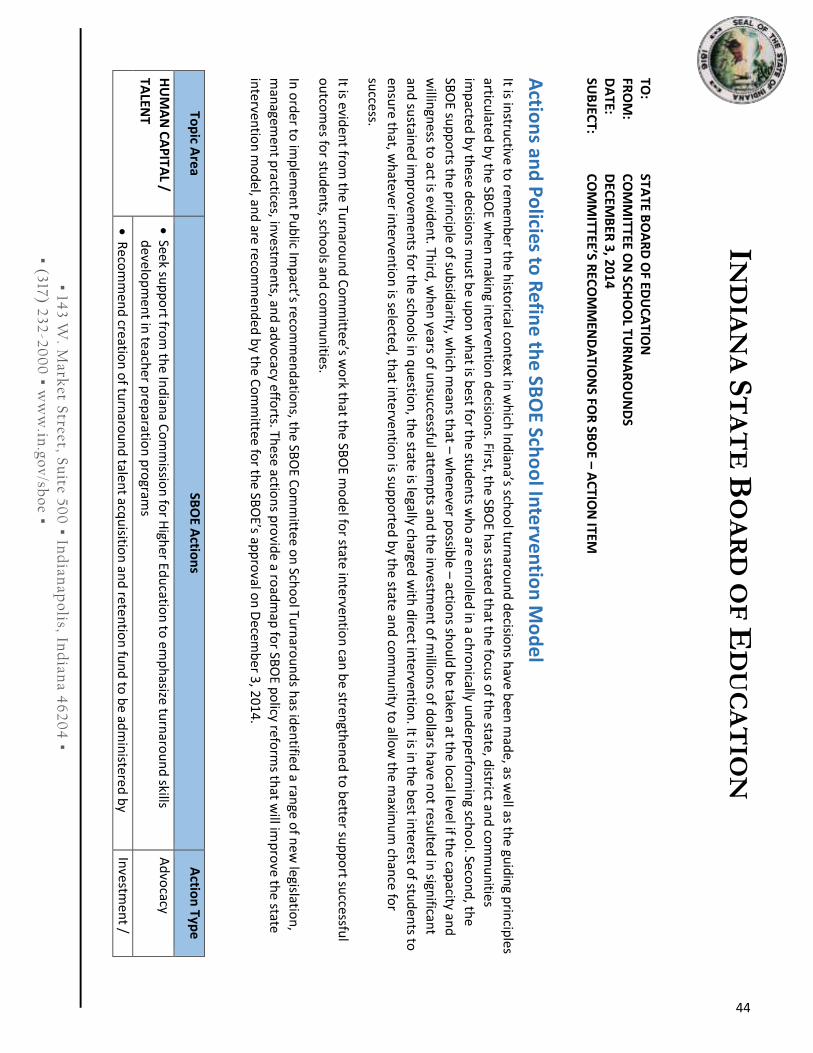
l It is in
structive to
remem
ber th
e histo
rical con
text in w
hich
Ind
iana’s sch
oo
l turn
arou
nd
decisio
ns h
ave been
mad
e, as we
ll as the gu
idin
g prin
ciples
articulated
by th
e SBO
E wh
en m
aking in
terventio
n d
ecision
s. First, the SB
OE h
as stated th
at the fo
cus o
f the state, d
istrict and
com
mu
nities
imp
acted b
y these d
ecision
s mu
st be u
po
n w
hat is b
est for th
e stud
ents w
ho
are enro
lled in
a chro
nically u
nd
erperfo
rmin
g scho
ol. Seco
nd
, the
SBO
E sup
po
rts the p
rincip
le of su
bsid
iarity, wh
ich m
eans th
at – wh
enever p
ossib
le – actio
ns sh
ou
ld b
e taken at th
e local level if th
e capacity an
d
willin
gness to
act is eviden
t. Third
, wh
en years o
f un
successfu
l attemp
ts and
the in
vestmen
t of m
illion
s of d
ollars h
ave no
t resulted
in sign
ificant
and
sustain
ed im
pro
vemen
ts for th
e scho
ols in
qu
estion
, the state
is legally charged
with
direct in
terventio
n. It is in
the b
est interest o
f stud
ents to
ensu
re that, w
hatever in
terventio
n is selecte
d, th
at inte
rventio
n is su
pp
orte
d b
y the state
and
com
mu
nity to
allow
the m
aximu
m ch
ance fo
r
success.
It is eviden
t from
the Tu
rnaro
un
d C
om
mittee
’s wo
rk that th
e SBO
E mo
del fo
r state in
terventio
n can
be stren
gthen
ed to
bette
r sup
po
rt successfu
l
ou
tcom
es fo
r stud
ents, sch
oo
ls and
com
mu
nities.
In o
rder to
imp
lemen
t Pu
blic Im
pact’s reco
mm
end
ation
s, the SB
OE C
om
mittee o
n Sch
oo
l Turn
arou
nd
s has id
entified
a range o
f new
legislation
,
man
agemen
t practices, in
vestmen
ts, and
advo
cacy efforts. Th
ese action
s pro
vide a ro
adm
ap fo
r SBO
E po
licy reform
s that w
ill imp
rove th
e state
inte
rventio
n m
od
el, and
are recom
men
ded
by th
e Co
mm
ittee for th
e SBO
E’s app
roval o
n D
ecemb
er 3, 2
014.
Top
ic Are
a SB
OE A
ction
s A
ction
Type
HU
MA
N C
AP
ITAL /
TALEN
T
Seek su
pp
ort fro
m th
e Ind
iana C
om
missio
n fo
r High
er Edu
cation
to em
ph
asize turn
arou
nd
skillsd
evelop
men
t in te
acher p
reparatio
n p
rogram
s
Ad
vocacy
R
ecom
men
d creatio
n o
f turn
arou
nd
talent acq
uisitio
n an
d re
ten
tion
fun
d to
be ad
min
istered b
yIn
vestmen
t /
44
Top
ic Are
a SB
OE A
ction
s A
ction
Type
SBO
E Legislatio
n
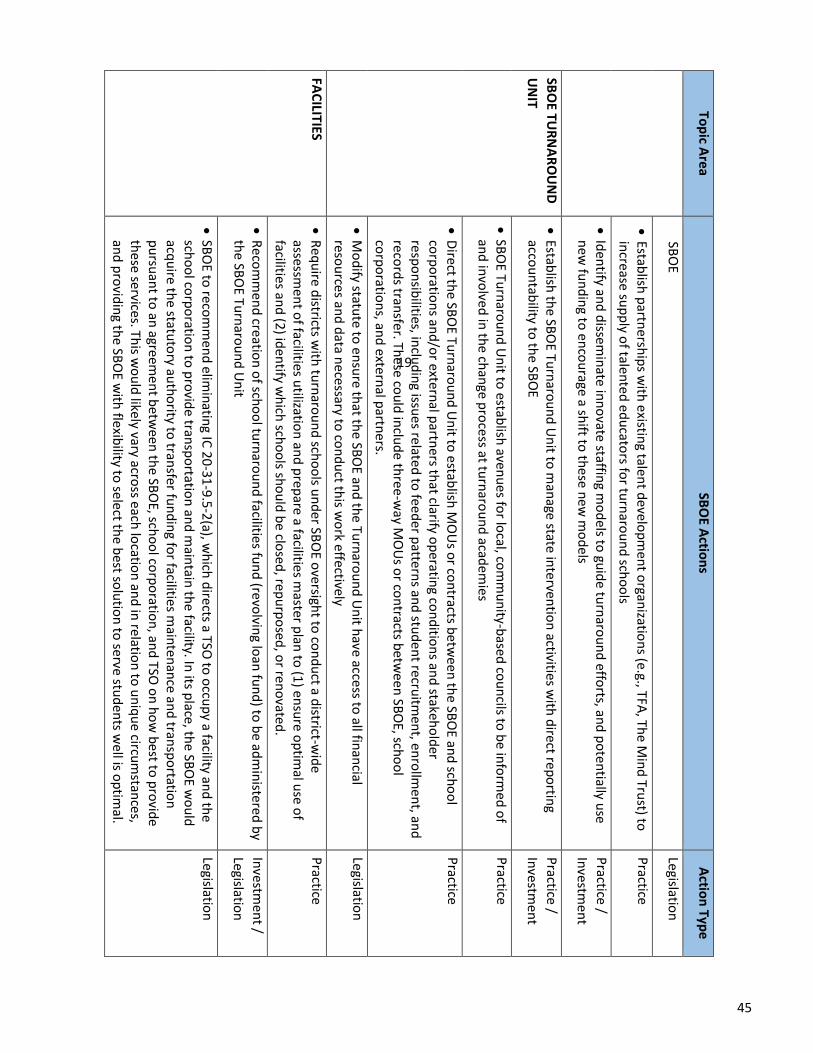
Estab
lish p
artnersh
ips w
ith e
xisting talen
t develo
pm
ent o
rganizatio
ns (e.g., TFA
, The M
ind
Trust) to
increase
sup
ply o
f talente
d e
du
cators fo
r turn
arou
nd
scho
ols
Practice
Id
entify an
d d
issemin
ate inn
ovate staffin
g mo
dels to
guid
e turn
arou
nd
effo
rts, and
po
ten
tially use
new
fun
din
g to e
nco
urage a sh
ift to th
ese n
ew m
od
els
Practice /
Investm
ent
SBO
E TUR
NA
RO
UN
D
UN
IT
Estab
lish th
e SBO
E Turn
arou
nd
Un
it to m
anage
state in
terven
tion
activities with
direct rep
ortin
gacco
un
tability to
the SB
OE
Practice /
Investm
ent
SB
OE Tu
rnaro
un
d U
nit to
establish
avenu
es for lo
cal, com
mu
nity-b
ased co
un
cils to b
e info
rmed
of
and
invo
lved in
the ch
ange p
rocess at tu
rnaro
un
d acad
emies
Practice
D
irect the SB
OE Tu
rnaro
un
d U
nit to
estab
lish M
OU
s or co
ntracts b
etwee
n th
e SBO
E and
scho
ol
corp
oratio
ns an
d/o
r external p
artners th
at clarify op
erating co
nd
ition
s and
stakeho
lder
respo
nsib
ilities, inclu
din
g issues relate
d to
feed
er pattern
s and
stud
ent re
cruitm
ent, en
rollm
ent, an
dreco
rds tran
sfer. These co
uld
inclu
de th
ree-way M
OU
s or co
ntracts b
etwee
n SB
OE, sch
oo
lco
rpo
ration
s, and
external p
artners.
Practice
M
od
ify statute to
en
sure th
at the SB
OE an
d th
e Turn
arou
nd
Un
it have access to
all finan
cialreso
urces an
d d
ata necessary to
con
du
ct this w
ork e
ffectively
Legislation
FAC
ILITIES
Req
uire d
istricts with
turn
arou
nd
scho
ols u
nd
er SBO
E oversigh
t to co
nd
uct a d
istrict-wid
eassessm
ent o
f facilities utilizatio
n an
d p
repare a facilities m
aster plan
to (1
) ensu
re op
timal u
se of
facilities and
(2) id
entify w
hich
scho
ols sh
ou
ld b
e closed
, repu
rpo
sed, o
r reno
vated.
Practice
R
ecom
men
d creatio
n o
f scho
ol tu
rnaro
un
d facilities fu
nd
(revolvin
g loan
fun
d) to
be ad
min
istered b
yth
e SBO
E Turn
arou
nd
Un
it
Investm
ent /
Legislation
SB
OE to
recom
men
d elim
inatin
g IC 20
-31-9
.5-2
(a), wh
ich d
irects a TSO to
occu
py a facility an
d th
esch
oo
l corp
oratio
n to
pro
vide tran
spo
rtation
and
main
tain th
e facility. In its p
lace, the SB
OE w
ou
ldacq
uire th
e statuto
ry auth
ority to
transfer fu
nd
ing fo
r facilities main
ten
ance an
d tran
spo
rtation
pu
rsuan
t to an
agreemen
t betw
een th
e SBO
E, scho
ol co
rpo
ration
, and
TSO o
n h
ow
best to
pro
vide
these
services. This w
ou
ld likely vary acro
ss each
locatio
n an
d in
relation
to u
niq
ue circu
mstan
ces,
and
pro
vidin
g the SB
OE w
ith flexib
ility to se
lect the b
est solu
tion
to se
rve stud
ents w
ell is op
timal.
Legislation
48
19
45
Top
ic Are
a SB
OE A
ction
s A
ction
Type
FUN
DIN
G
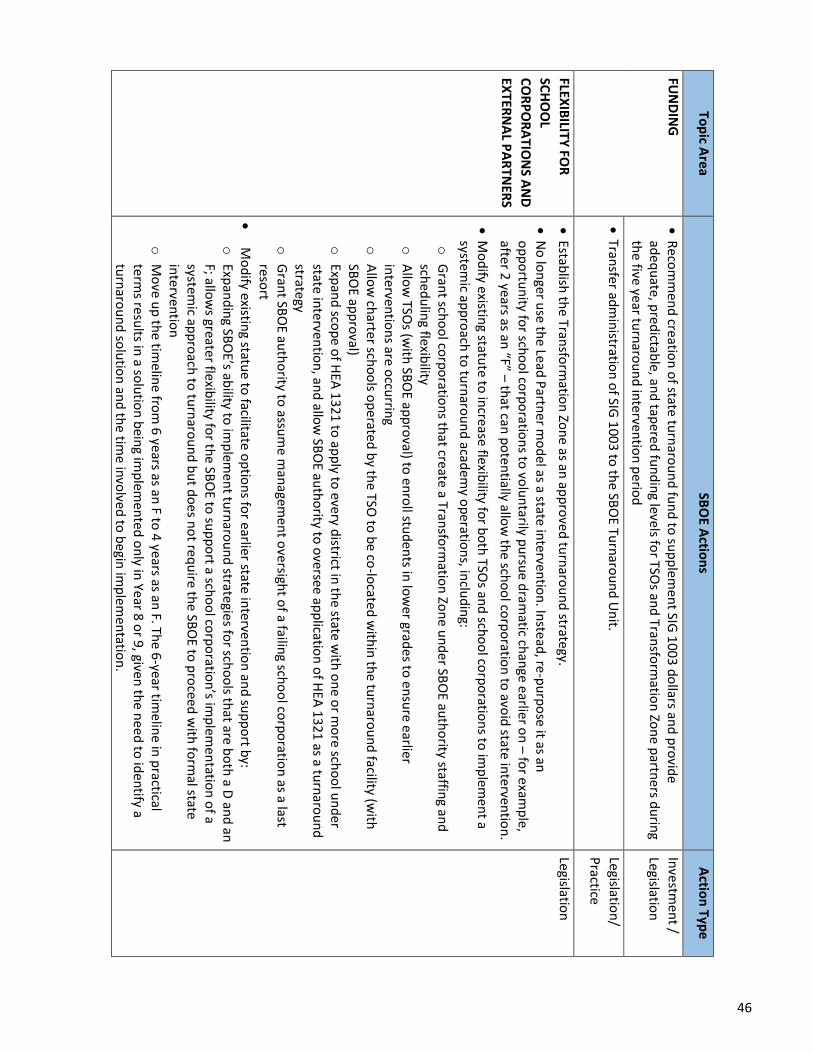
R
ecom
men
d creatio
n o
f state tu
rnaro
un
d fu
nd
to su
pp
lemen
t SIG 1
003
do
llars and
pro
vide
adeq
uate
, pred
ictable, an
d tap
ered fu
nd
ing levels fo
r TSOs an
d Tran
sform
ation
Zon
e partn
ers du
ring
the five year tu
rnaro
un
d in
terven
tion
perio
d
Investm
ent /
Legislation
Tran
sfer adm
inistratio
n o
f SIG 1
003 to
the SB
OE Tu
rnaro
un
d U
nit.
Legislation
/
Practice
FLEXIB
ILITY FO
R
SCH
OO
L
CO
RP
OR
ATIO
NS A
ND
EXTER
NA
L PA
RTN
ERS
Estab
lish th
e Transfo
rmatio
n Zo
ne as an
app
roved
turn
arou
nd
strategy.
N
o lo
nger u
se the Lead
Partn
er mo
del as a state in
terventio
n. In
stead
, re-p
urp
ose it as an
op
po
rtun
ity for sch
oo
l corp
oratio
ns to
volu
ntarily p
ursu
e dram
atic chan
ge earlier on
– for exam
ple,
after 2 years as an
“F” – that can
po
ten
tially allow
the sch
oo
l corp
oratio
n to
avoid
state interven
tion
.
M
od
ify existing statu
te to in
crease flexib
ility for b
oth
TSOs an
d sch
oo
l corp
oratio
ns to
imp
lemen
t asystem
ic app
roach
to tu
rnaro
un
d acad
emy o
peratio
ns, in
clud
ing:
oG
rant sch
oo
l corp
oratio
ns th
at create a Tran
sform
ation
Zon
e un
der SB
OE au
tho
rity staffing an
dsch
edu
ling flexib
ilityo
Allo
w TSO
s (with
SBO
E app
roval) to
en
roll stu
den
ts in lo
wer grad
es to e
nsu
re earlier
inte
rventio
ns are o
ccurrin
go
Allo
w ch
arter scho
ols o
perate
d b
y the TSO
to b
e co-lo
cated
with
in th
e turn
arou
nd
facility (with
SBO
E app
roval)
oExp
and
scop
e of H
EA 1
321 to
app
ly to every d
istrict in th
e state w
ith o
ne o
r mo
re scho
ol u
nd
erstate in
terven
tion
, and
allow
SBO
E auth
ority to
oversee ap
plicatio
n o
f HEA
132
1 as a tu
rnaro
un
dstrate
gyo
Gran
t SBO
E auth
ority to
assum
e m
anagem
ent o
versight o
f a failing sch
oo
l corp
oratio
n as a last
resort
M
od
ify existing statu
e to facilitate o
ptio
ns fo
r earlier state interven
tion
and
sup
po
rt by:
oExp
and
ing SB
OE’s ab
ility to im
plem
ent tu
rnaro
un
d strate
gies for sch
oo
ls that are b
oth
a D an
d an
F; allow
s greater flexibility fo
r the SB
OE to
sup
po
rt a scho
ol co
rpo
ration
’s imp
lemen
tation
of a
systemic ap
pro
ach to
turn
arou
nd
bu
t do
es no
t requ
ire the SB
OE to
pro
ceed w
ith fo
rmal state
inte
rventio
no
Mo
ve up
the tim
eline fro
m 6
years as an F to
4 years as an
F. The 6
-year timelin
e in p
racticalte
rms re
sults in
a solu
tion
bein
g imp
lemen
ted o
nly in
Year 8
or 9
, given th
e need
to id
entify a
turn
arou
nd
solu
tion
and
the tim
e invo
lved to
begin
imp
lemen
tation
.
Legislation
46
Top
ic Are
a SB
OE A
ction
s A
ction
Type
U
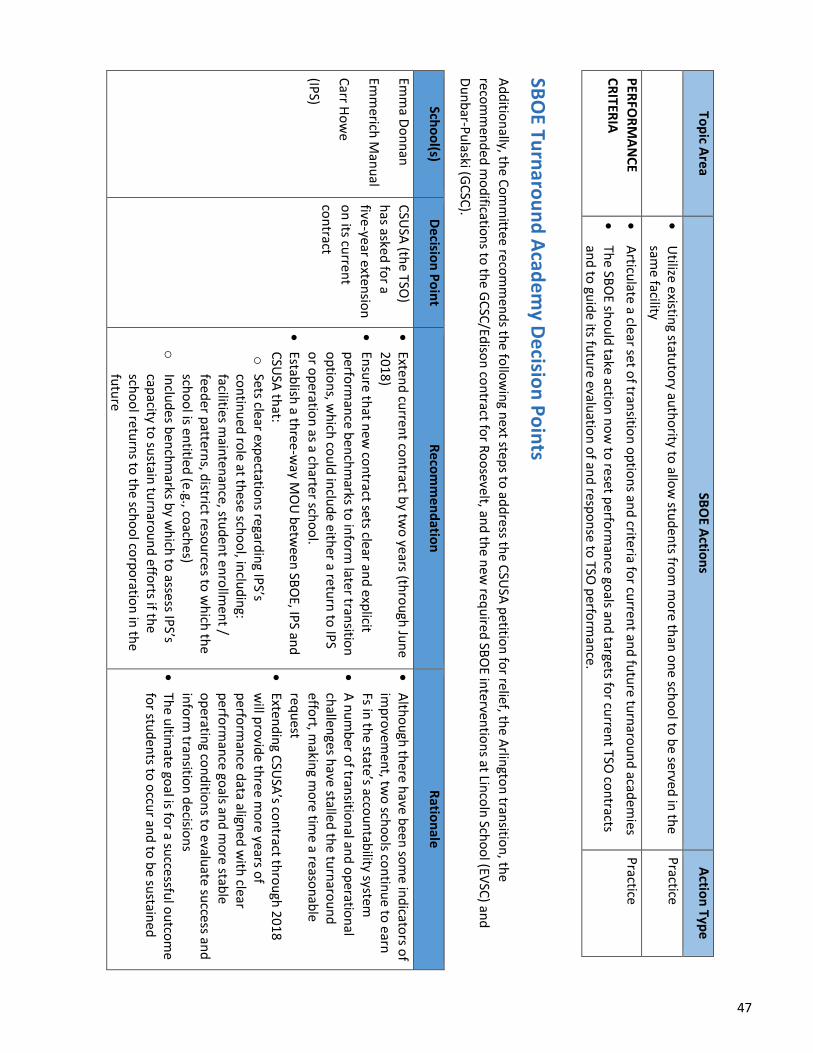
tilize existing statu
tory au
tho
rity to allo
w stu
den
ts from
mo
re than
on
e scho
ol to
be served
in th
esam
e facility
Practice
PER
FOR
MA
NC
E
CR
ITERIA
Articu
late a clear se
t of tran
sition
op
tion
s and
criteria for cu
rrent an
d fu
ture tu
rnaro
un
d acad
emies
Th
e SBO
E sho
uld
take action
no
w to
reset p
erform
ance go
als and
targets for cu
rrent TSO
con
tractsan
d to
guid
e its futu
re evaluatio
n o
f and
respo
nse to
TSO p
erform
ance.
Practice
SBO
E Turn
arou
nd
Acad
em
y De
cision
Po
ints
Ad
ditio
nally, th
e Co
mm
ittee recom
men
ds th
e follo
win
g next ste
ps to
add
ress the C
SUSA
petitio
n fo
r relief, the A
rlingto
n tran
sition
, the
recom
men
ded
mo
dificatio
ns to
the G
CSC
/Ediso
n co
ntract fo
r Ro
osevelt, an
d th
e new
req
uired
SBO
E interven
tion
s at Linco
ln Sch
oo
l (EVSC
) and
Du
nb
ar-Pu
laski (GC
SC).
Scho
ol(s)
De
cision
Po
int
Re
com
me
nd
ation
R
ation
ale
Emm
a Do
nn
an
Emm
erich M
anu
al
Carr H
ow
e
(IPS)
CSU
SA (th
e TSO)
has aske
d fo
r a
five-year exten
sion
on
its curren
t
con
tract
Exten
d cu
rrent co
ntract b
y two
years (thro
ugh
Jun
e2
01
8)
En
sure th
at new
con
tract sets clear and
explicit
perfo
rman
ce ben
chm
arks to in
form
later tran
sition
op
tion
s, wh
ich co
uld
inclu
de eith
er a return
to IP
So
r op
eration
as a charter sch
oo
l.
Estab
lish a th
ree-w
ay MO
U b
etwee
n SB
OE, IP
S and
CSU
SA th
at:o
Sets clear expectatio
ns re
gardin
g IPS’s
con
tinu
ed ro
le at these
scho
ol, in
clud
ing:
facilities main
tenan
ce, stud
ent e
nro
llmen
t /fee
der p
atterns, d
istrict reso
urces to
wh
ich th
esch
oo
l is entitled
(e.g., co
aches)
oIn
clud
es ben
chm
arks by w
hich
to assess IP
S’scap
acity to su
stain tu
rnaro
un
d e
fforts if th
esch
oo
l return
s to th
e scho
ol co
rpo
ration
in th
efu
ture
A
ltho
ugh
there h
ave been
som
e ind
icators o
fim
pro
vemen
t, two
scho
ols co
ntin
ue to
earn
Fs in th
e state’s accou
ntab
ility system
A
nu
mb
er of tran
sition
al and
op
eration
alch
allenges h
ave stalled th
e turn
arou
nd
effort, m
aking m
ore tim
e a reason
able
requ
est
Exten
din
g CSU
SA’s co
ntract th
rou
gh 2
01
8w
ill pro
vide th
ree mo
re years of
perfo
rman
ce data align
ed w
ith clear
perfo
rman
ce goals an
d m
ore stab
leo
peratin
g con
ditio
ns to
evaluate su
ccess and
info
rm tran
sition
decisio
ns
Th
e ultim
ate goal is fo
r a succe
ssful o
utco
me
for stu
den
ts to o
ccur an
d to
be su
stained
47
Scho
ol(s)
De
cision
Po
int
Re
com
me
nd
ation
R
ation
ale
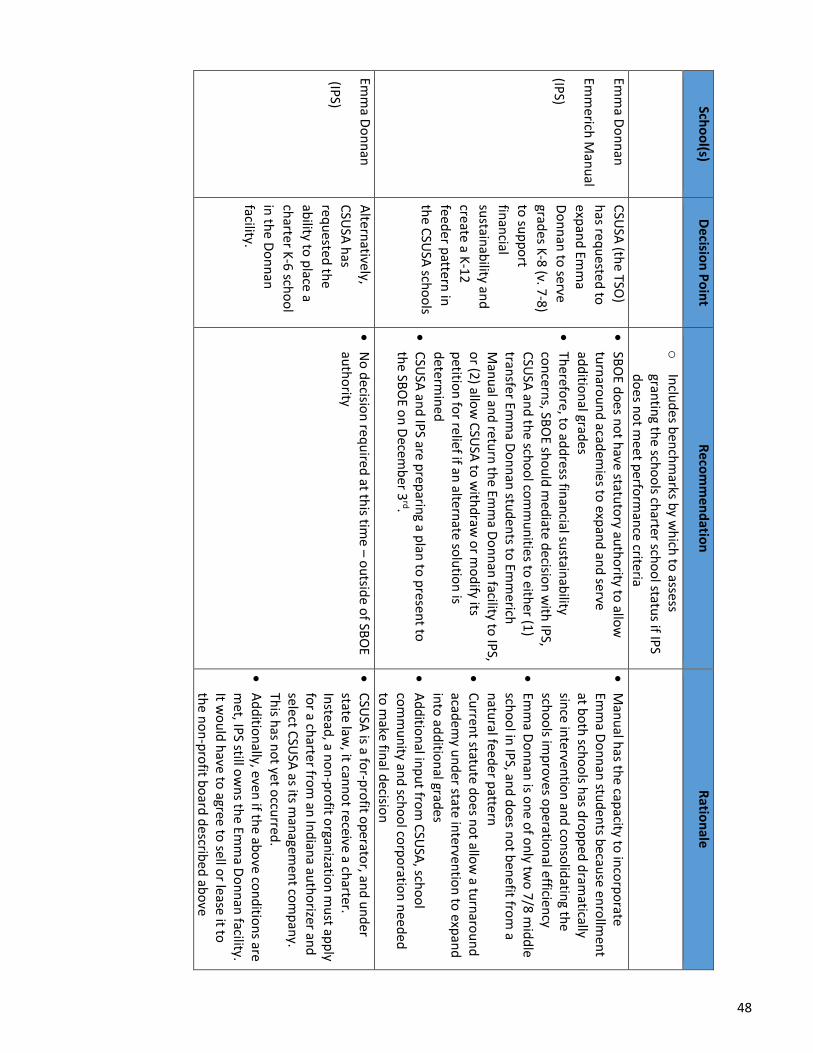
oIn
clud
es ben
chm
arks by w
hich
to assess
grantin
g the sch
oo
ls charter sch
oo
l status if IP
Sd
oes n
ot m
eet p
erform
ance criteria
Emm
a Do
nn
an
Emm
erich M
anu
al
(IPS)
CSU
SA (th
e TSO)
has req
uested
to
expan
d Em
ma
Do
nn
an to
serve
grades K
-8 (v. 7-8
)
to su
pp
ort
finan
cial
sustain
ability an
d
create a K-1
2
feed
er pattern
in
the C
SUSA
scho
ols
SB
OE d
oes n
ot h
ave statu
tory au
tho
rity to allo
wtu
rnaro
un
d acad
emies to
expan
d an
d se
rvead
ditio
nal grad
es
Th
erefore, to
add
ress finan
cial sustain
ability
con
cerns, SB
OE sh
ou
ld m
ediate d
ecision
with
IPS,
CSU
SA an
d th
e scho
ol co
mm
un
ities to e
ither (1
)tran
sfer Emm
a Do
nn
an stu
den
ts to Em
merich
Man
ual an
d retu
rn th
e Emm
a Do
nn
an facility to
IPS,
or (2
) allow
CSU
SA to
with
draw
or m
od
ify itsp
etition
for relief if an
alternate so
lutio
n is
determ
ined
C
SUSA
and
IPS are p
reparin
g a plan
to p
resent to
the SB
OE o
n D
ecemb
er 3rd.
M
anu
al has th
e capacity to
inco
rpo
rateEm
ma D
on
nan
stud
ents b
ecause en
rollm
ent
at bo
th sch
oo
ls has d
rop
ped
dram
aticallysin
ce inte
rventio
n an
d co
nso
lidatin
g the
scho
ols im
pro
ves op
eration
al efficiency
Em
ma D
on
nan
is on
e of o
nly tw
o 7/8
mid
dle
scho
ol in
IPS, an
d d
oes n
ot b
enefit fro
m a
natu
ral feeder p
attern
C
urren
t statute d
oes n
ot allo
w a tu
rnaro
un
dacad
emy u
nd
er state inte
rventio
n to
expan
din
to ad
ditio
nal grad
es
A
dd
ition
al inp
ut fro
m C
SUSA
, scho
ol
com
mu
nity an
d sch
oo
l corp
oratio
n n
eeded
to m
ake final d
ecision
Emm
a Do
nn
an
(IPS)
Alte
rnatively,
CSU
SA h
as
requ
ested th
e
ability to
place a
charter K
-6 sch
oo
l
in th
e Do
nn
an
facility.
N
o d
ecision
req
uired
at this tim
e – ou
tside o
f SBO
Eau
tho
rity
CSU
SA is a fo
r-pro
fit op
erator, an
d u
nd
erstate law
, it cann
ot rece
ive a charter.
Inste
ad, a n
on
-pro
fit organ
ization
mu
st app
lyfo
r a charter fro
m an
Ind
iana au
tho
rizer and
select CSU
SA as its m
anagem
ent co
mp
any.
This h
as no
t yet occu
rred.
A
dd
ition
ally, even if th
e abo
ve con
ditio
ns are
met, IP
S still ow
ns th
e Emm
a Do
nn
an facility.
It wo
uld
have to
agree to sell o
r lease it toth
e no
n-p
rofit b
oard
describ
ed ab
ove
48
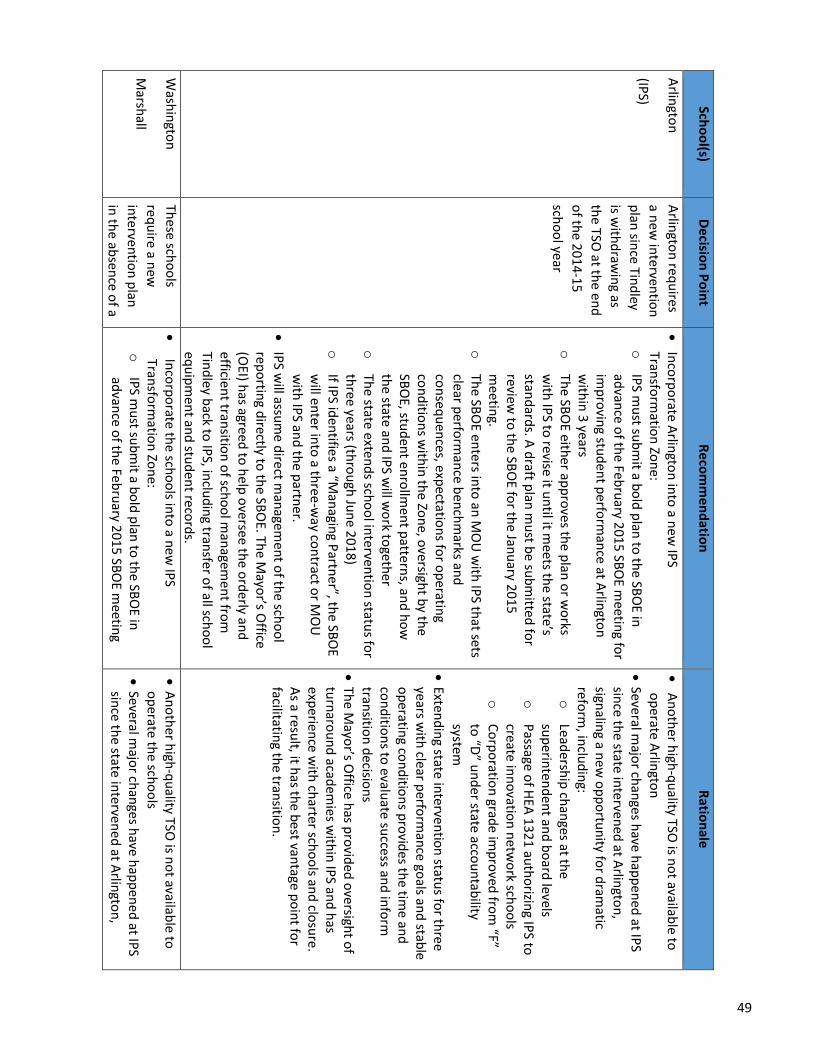
Scho
ol(s)
De
cision
Po
int
Re
com
me
nd
ation
R
ation
ale
Arlin
gton
(IPS)
Arlin
gton
req
uires
a new
interven
tion
plan
since Tin
dley
is with
draw
ing as
the TSO
at the e
nd
of th
e 20
14
-15
scho
ol year
In
corp
orate
Arlin
gton
into
a new
IPS
Transfo
rmatio
n Zo
ne:
oIP
S mu
st sub
mit a b
old
plan
to th
e SBO
E inad
vance o
f the Feb
ruary 2
015
SBO
E meetin
g for
imp
rovin
g stud
ent p
erform
ance at A
rlingto
nw
ithin
3 years
oTh
e SBO
E eith
er app
roves th
e plan
or w
orks
with
IPS to
revise it un
til it meets th
e state’s
stand
ards. A
draft p
lan m
ust b
e sub
mitted
for
review to
the SB
OE fo
r the Jan
uary 20
15m
eeting.
oTh
e SBO
E enters in
to an
MO
U w
ith IP
S that sets
clear perfo
rman
ce ben
chm
arks and
con
sequ
ences, exp
ectation
s for o
peratin
gco
nd
ition
s with
in th
e Zon
e, oversigh
t by th
eSB
OE, stu
den
t enro
llmen
t pattern
s, and
ho
wth
e state an
d IP
S will w
ork to
gether
oTh
e state exten
ds sch
oo
l interven
tion
status fo
rth
ree years (thro
ugh
Jun
e 201
8)
oIf IP
S iden
tifies a “Man
aging P
artner”, th
e SBO
Ew
ill enter in
to a th
ree-w
ay con
tract or M
OU
with
IPS an
d th
e partn
er.
IP
S will assu
me d
irect man
agemen
t of th
e scho
ol
repo
rting d
irectly to th
e SBO
E. The M
ayor’s O
ffice(O
EI) has agreed
to h
elp o
versee the o
rderly an
defficien
t transitio
n o
f scho
ol m
anagem
ent fro
mTin
dley b
ack to IP
S, inclu
din
g transfer o
f all scho
ol
equ
ipm
ent an
d stu
den
t record
s.
A
no
ther h
igh-q
uality TSO
is no
t available to
op
erate Arlin
gton
Several m
ajor ch
anges h
ave hap
pen
ed at IP
Ssin
ce the state in
tervened
at Arlin
gton
,sign
aling a n
ew o
pp
ortu
nity fo
r dram
aticrefo
rm, in
clud
ing:
oLead
ership
chan
ges at the
sup
erinte
nd
ent an
d b
oard
levelso
Passage o
f HEA
1321
auth
orizin
g IPS to
create inn
ovatio
n n
etwo
rk scho
ols
oC
orp
oratio
n grad
e imp
roved
from
“F”to
“D” u
nd
er state accou
ntab
ilitysystem
Exten
din
g state in
terventio
n statu
s for th
reeyears w
ith clear p
erform
ance go
als and
stable
op
erating co
nd
ition
s pro
vides th
e time an
dco
nd
ition
s to evalu
ate success an
d in
form
transitio
n d
ecision
s
Th
e Mayo
r’s Office h
as pro
vided
oversigh
t of
turn
arou
nd
academ
ies with
in IP
S and
has
experien
ce with
charter sch
oo
ls and
closu
re.A
s a result, it h
as the b
est vantage p
oin
t for
facilitating th
e transitio
n.
Wash
ingto
n
Marsh
all
These
scho
ols
requ
ire a new
inte
rventio
n p
lan
in th
e absen
ce of a
In
corp
orate
the sch
oo
ls into
a new
IPS
Transfo
rmatio
n Zo
ne:
oIP
S mu
st sub
mit a b
old
plan
to th
e SBO
E inad
vance o
f the Feb
ruary 2
015
SBO
E meetin
g
A
no
ther h
igh-q
uality TSO
is no
t available to
op
erate the sch
oo
ls
Several m
ajor ch
anges h
ave hap
pen
ed at IP
Ssin
ce the state in
tervened
at Arlin
gton
,
49
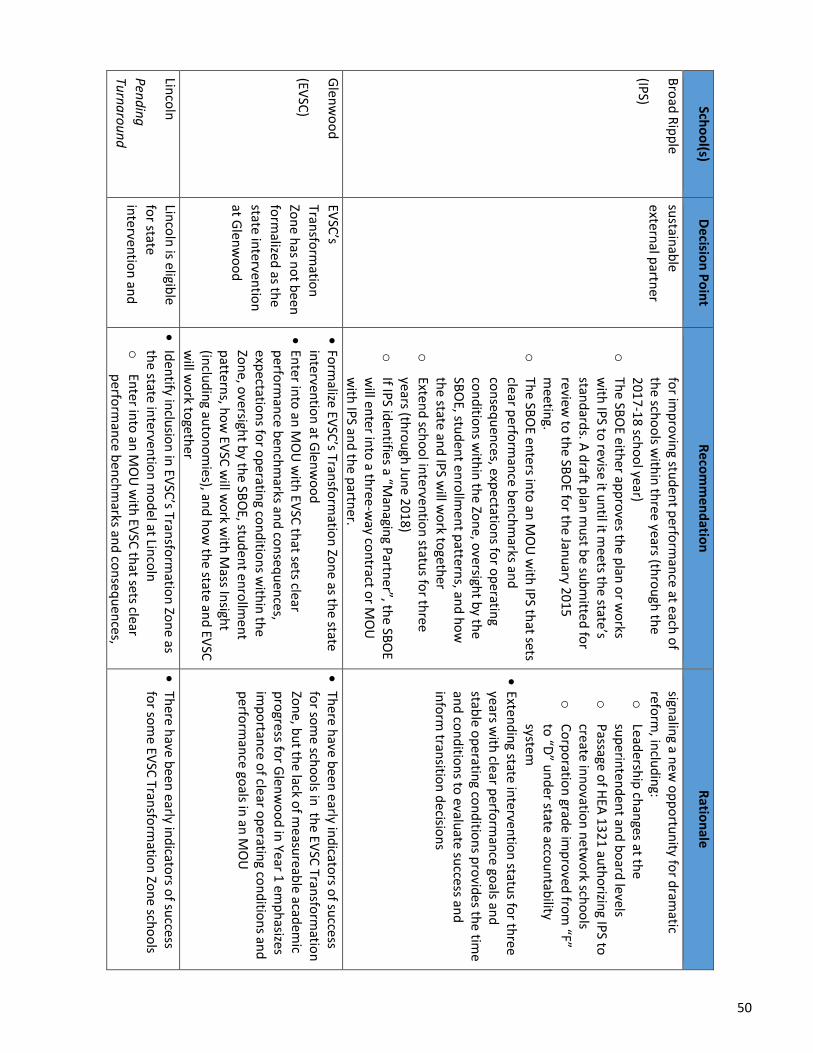
Scho
ol(s)
De
cision
Po
int
Re
com
me
nd
ation
R
ation
ale
Bro
ad R
ipp
le
(IPS)
sustain
able
extern
al partn
er
for im
pro
ving stu
den
t perfo
rman
ce at each o
f th
e scho
ols w
ithin
three years (th
rou
gh th
e 2
017
-18
scho
ol year)
oTh
e SBO
E eith
er app
roves th
e plan
or w
orks
with
IPS to
revise it un
til it meets th
e state’s
stand
ards. A
draft p
lan m
ust b
e sub
mitted
for
review to
the SB
OE fo
r the Jan
uary 20
15m
eeting.
oTh
e SBO
E en
ters into
an M
OU
with
IPS th
at setsclear p
erform
ance b
ench
marks an
dco
nseq
uen
ces, expectatio
ns fo
r op
erating
con
ditio
ns w
ithin
the Zo
ne, o
versight b
y the
SBO
E, stud
ent en
rollm
ent p
atterns, an
d h
ow
the state
and
IPS w
ill wo
rk togeth
ero
Extend
scho
ol in
terven
tion
status fo
r three
years (thro
ugh
Jun
e 20
18)
oIf IP
S iden
tifies a “Man
aging P
artner”, th
e SBO
Ew
ill enter in
to a th
ree-w
ay con
tract or M
OU
with
IPS an
d th
e partn
er.
signalin
g a new
op
po
rtun
ity for d
ramatic
reform
, inclu
din
g: o
Leadersh
ip ch
anges at th
esu
perin
ten
den
t and
bo
ard levels
oP
assage of H
EA 132
1 au
tho
rizing IP
S tocreate in
no
vation
netw
ork sch
oo
lso
Co
rpo
ration
grade im
pro
ved fro
m “F”
to “D
” un
der state acco
un
tability
system
Exten
din
g state in
terventio
n statu
s for th
reeyears w
ith clear p
erform
ance go
als and
stable o
peratin
g con
ditio
ns p
rovid
es the tim
ean
d co
nd
ition
s to evalu
ate success an
din
form
transitio
n d
ecision
s
Glen
wo
od
(EVSC
)
EVSC
’s
Transfo
rmatio
n
Zon
e has n
ot b
een
form
alized as th
e
state inte
rventio
n
at Glen
wo
od
Fo
rmalize EV
SC’s Tran
sform
ation
Zon
e as the state
inte
rventio
n at G
lenw
oo
d
En
ter into
an M
OU
with
EVSC
that sets clear
perfo
rman
ce ben
chm
arks and
con
sequ
ences,
expectatio
ns fo
r op
erating co
nd
ition
s with
in th
eZo
ne, o
versight b
y the SB
OE, stu
den
t en
rollm
ent
pattern
s, ho
w EV
SC w
ill wo
rk with
Mass In
sight
(inclu
din
g auto
no
mies), an
d h
ow
the state an
d EV
SCw
ill wo
rk togeth
er
Th
ere have b
een
early ind
icators o
f success
for so
me sch
oo
ls in th
e EVSC
Transfo
rmatio
nZo
ne, b
ut th
e lack of m
easureab
le academ
icp
rogress fo
r Glen
wo
od
in Year 1
emp
hasizes
imp
ortan
ce of clear o
peratin
g con
ditio
ns an
dp
erform
ance go
als in an
MO
U
Linco
ln
Pen
din
g
Turn
aro
un
d
Linco
ln is e
ligible
for state
inte
rventio
n an
d
Id
entify in
clusio
n in
EVSC
’s Transfo
rmatio
n Zo
ne as
the state
interven
tion
mo
del at Lin
coln
oEn
ter into
an M
OU
with
EVSC
that sets clear
perfo
rman
ce ben
chm
arks and
con
sequ
ences,
Th
ere have b
een
early ind
icators o
f success
for so
me EV
SC Tran
sform
ation
Zon
e scho
ols
50
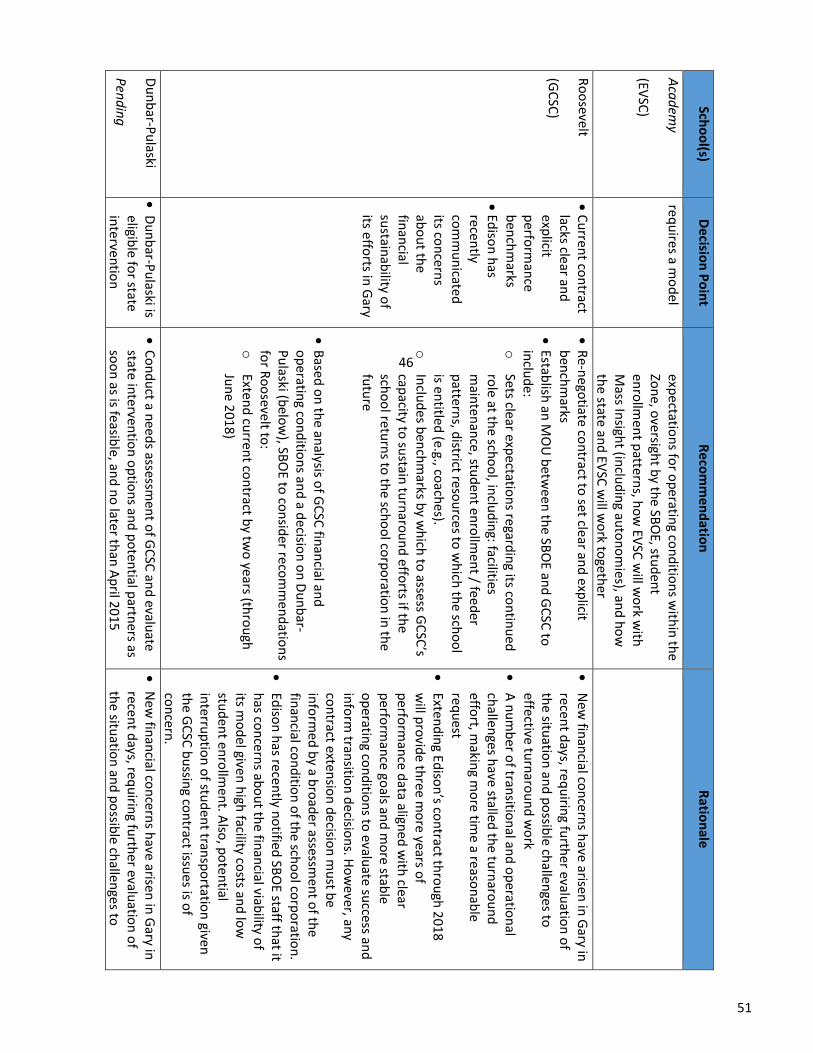
Scho
ol(s)
De
cision
Po
int
Re
com
me
nd
ation
R
ation
ale
Aca
dem
y
(EVSC
)
requ
ires a mo
del
expectatio
ns fo
r op
erating co
nd
ition
s with
in th
e Zo
ne, o
versight b
y the SB
OE, stu
den
t en
rollm
ent p
atterns, h
ow
EVSC
will w
ork w
ith
Mass In
sight (in
clud
ing au
ton
om
ies), and
ho
w
the state
and
EVSC
will w
ork to
gether
Ro
osevelt
(GC
SC)
C
urren
t con
tractlacks clear an
dexp
licitp
erform
ance
ben
chm
arks
Ed
ison
has
recen
tlyco
mm
un
icated
its con
cerns
abo
ut th
efin
ancial
sustain
ability o
fits e
fforts in
Gary
R
e-nego
tiate con
tract to set clear an
d e
xplicit
ben
chm
arks
Estab
lish an
MO
U b
etwee
n th
e SBO
E and
GC
SC to
inclu
de:
oSets clear exp
ectation
s regard
ing its co
ntin
ued
role at th
e scho
ol, in
clud
ing: facilities
main
ten
ance, stu
den
t en
rollm
ent / fee
der
pattern
s, district reso
urces to
wh
ich th
e scho
ol
is entitled
(e.g., coach
es).o
Inclu
des b
ench
marks b
y wh
ich to
assess GC
SC’s
capacity to
sustain
turn
arou
nd
effo
rts if the
scho
ol retu
rns to
the sch
oo
l corp
oratio
n in
the
futu
re
B
ased o
n th
e analysis o
f GC
SC fin
ancial an
do
peratin
g con
ditio
ns an
d a d
ecision
on
Du
nb
ar-P
ulaski (b
elow
), SBO
E to co
nsid
er recom
men
datio
ns
for R
oo
sevelt to:
oExten
d cu
rrent co
ntract b
y two
years (thro
ugh
Jun
e 20
18
)
N
ew fin
ancial co
ncern
s have arisen
in G
ary inrece
nt d
ays, requ
iring fu
rther evalu
ation
of
the situ
ation
and
po
ssible ch
allenges to
effective tu
rnaro
un
d w
ork
A
nu
mb
er of tran
sition
al and
op
eration
alch
allenges h
ave stalled th
e turn
arou
nd
effort, m
aking m
ore tim
e a reason
able
requ
est
Exten
din
g Ediso
n’s co
ntract th
rou
gh 2
01
8w
ill pro
vide th
ree mo
re years of
perfo
rman
ce data align
ed w
ith clear
perfo
rman
ce goals an
d m
ore stab
leo
peratin
g con
ditio
ns to
evaluate su
ccess and
info
rm tran
sition
decisio
ns. H
ow
ever, any
con
tract extensio
n d
ecision
mu
st be
info
rmed
by a b
road
er assessmen
t of th
efin
ancial co
nd
ition
of th
e scho
ol co
rpo
ration
.
Ed
ison
has rece
ntly n
otified
SBO
E staff that it
has co
ncern
s abo
ut th
e finan
cial viability o
fits m
od
el given h
igh facility co
sts and
low
stud
ent e
nro
llmen
t. Also
, po
ten
tialin
terru
ptio
n o
f stud
ent tran
spo
rtation
giventh
e GC
SC b
ussin
g con
tract issues is o
fco
ncern
.
Du
nb
ar-Pu
laski
Pen
din
g
D
un
bar-P
ulaski is
eligible fo
r statein
terven
tion
C
on
du
ct a nee
ds assessm
ent o
f GC
SC an
d evalu
atestate in
terven
tion
op
tion
s and
po
ten
tial partn
ers asso
on
as is feasible, an
d n
o late
r than
Ap
ril 2015
N
ew fin
ancial co
ncern
s have arisen
in G
ary inrece
nt d
ays, requ
iring fu
rther evalu
ation
of
the situ
ation
and
po
ssible ch
allenges to
46
51
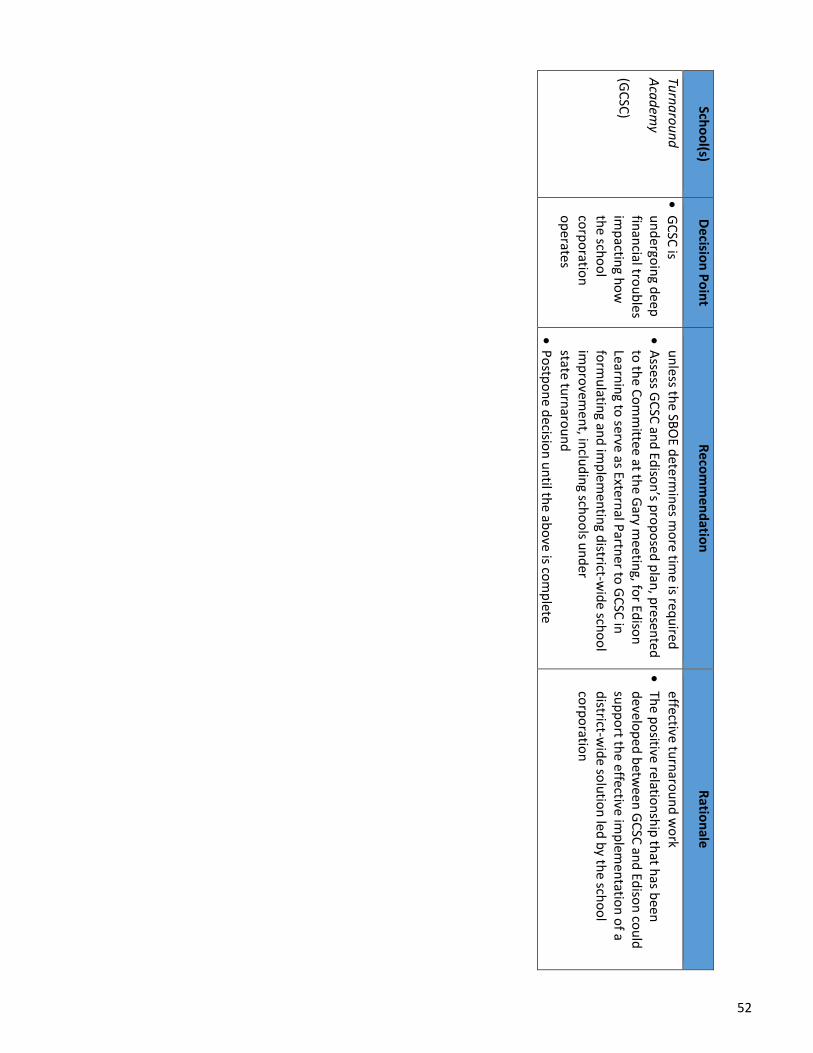
Scho
ol(s)
De
cision
Po
int
Re
com
me
nd
ation
R
ation
ale
Turn
aro
un
d
Aca
dem
y
(GC
SC)
G
CSC
isu
nd
ergoin
g dee
pfin
ancial tro
ub
lesim
pactin
g ho
wth
e scho
ol
corp
oratio
no
perates
un
less the SB
OE d
eterm
ines m
ore tim
e is req
uired
A
ssess GC
SC an
d Ed
ison
’s pro
po
sed p
lan, p
resented
to th
e Co
mm
ittee at the G
ary meetin
g, for Ed
ison
Learnin
g to serve as Extern
al Partn
er to G
CSC
info
rmu
lating an
d im
plem
entin
g district-w
ide sch
oo
lim
pro
vemen
t, inclu
din
g scho
ols u
nd
erstate
turn
arou
nd
P
ostp
on
e decisio
n u
ntil th
e abo
ve is com
plete
effective turn
arou
nd
wo
rk
Th
e po
sitive relation
ship
that h
as been
develo
ped
betw
een
GC
SC an
d Ed
ison
cou
ldsu
pp
ort th
e effective im
plem
entatio
n o
f ad
istrict-wid
e solu
tion
led b
y the sch
oo
lco
rpo
ration
52
performance framework
53
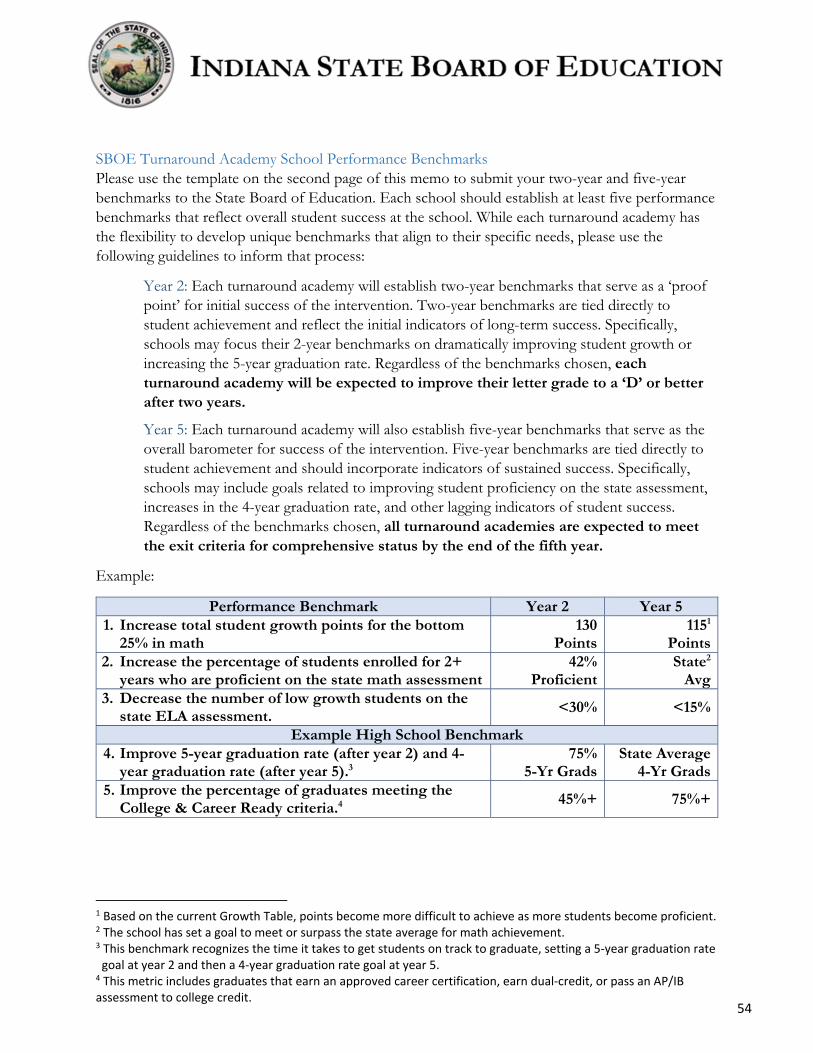
SBOE Turnaround Academy School Performance Benchmarks Please use the template on the second page of this memo to submit your two-year and five-year benchmarks to the State Board of Education. Each school should establish at least five performance benchmarks that reflect overall student success at the school. While each turnaround academy has the flexibility to develop unique benchmarks that align to their specific needs, please use the following guidelines to inform that process:
Year 2: Each turnaround academy will establish two-year benchmarks that serve as a ‘proof point’ for initial success of the intervention. Two-year benchmarks are tied directly to student achievement and reflect the initial indicators of long-term success. Specifically, schools may focus their 2-year benchmarks on dramatically improving student growth or increasing the 5-year graduation rate. Regardless of the benchmarks chosen, each turnaround academy will be expected to improve their letter grade to a ‘D’ or better after two years.
Year 5: Each turnaround academy will also establish five-year benchmarks that serve as the overall barometer for success of the intervention. Five-year benchmarks are tied directly to student achievement and should incorporate indicators of sustained success. Specifically, schools may include goals related to improving student proficiency on the state assessment, increases in the 4-year graduation rate, and other lagging indicators of student success. Regardless of the benchmarks chosen, all turnaround academies are expected to meet the exit criteria for comprehensive status by the end of the fifth year.
Example:
Performance Benchmark Year 2 Year 5 1. Increase total student growth points for the bottom
25% in math130
Points 1151
Points 2. Increase the percentage of students enrolled for 2+
years who are proficient on the state math assessment42%
Proficient State2
Avg 3. Decrease the number of low growth students on the
state ELA assessment.<30% <15%
Example High School Benchmark 4. Improve 5-year graduation rate (after year 2) and 4-
year graduation rate (after year 5).375%
5-Yr GradsState Average
4-Yr Grads5. Improve the percentage of graduates meeting the
College & Career Ready criteria.4 45%+ 75%+
1 Based on the current Growth Table, points become more difficult to achieve as more students become proficient. 2 The school has set a goal to meet or surpass the state average for math achievement. 3 This benchmark recognizes the time it takes to get students on track to graduate, setting a 5‐year graduation rate goal at year 2 and then a 4‐year graduation rate goal at year 5.
4 This metric includes graduates that earn an approved career certification, earn dual‐credit, or pass an AP/IB assessment to college credit.
54
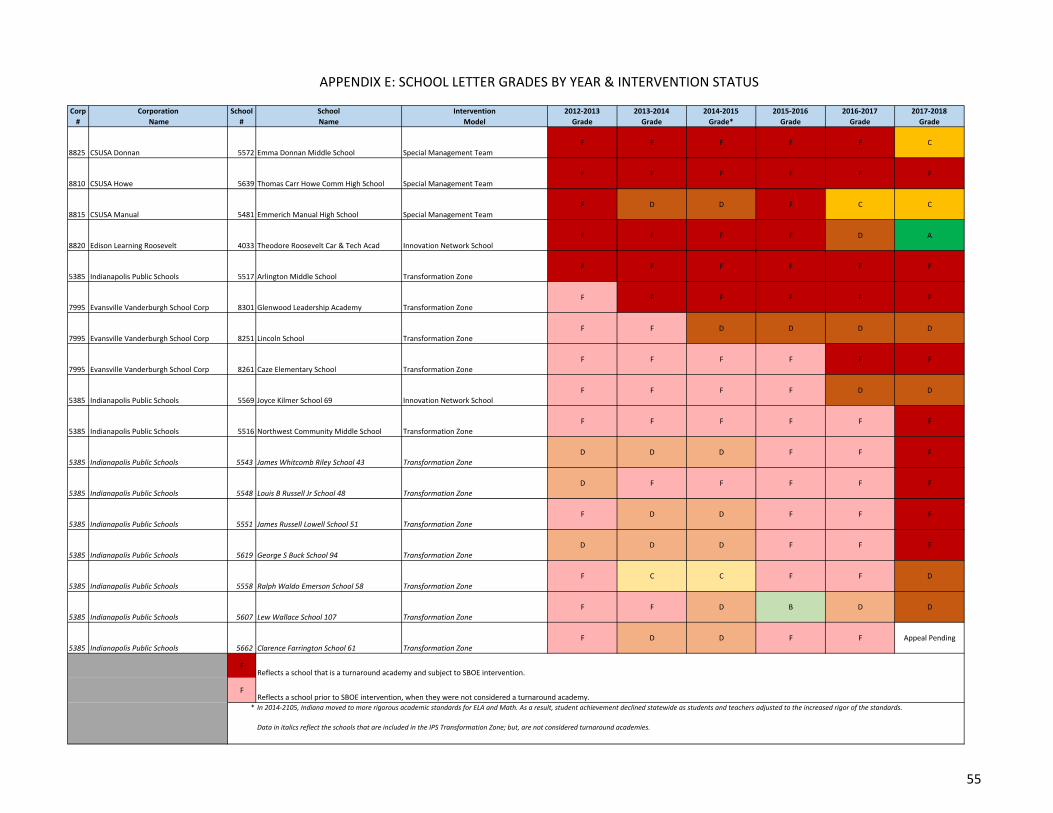
Corp
#
Corporation
Name
School
#
School
Name
Intervention
Model
2012‐2013
Grade
2013‐2014
Grade
2014‐2015
Grade*
2015‐2016
Grade
2016‐2017
Grade
2017‐2018
Grade
8825 CSUSA Donnan 5572 Emma Donnan Middle School Special Management TeamF F F F F C
8810 CSUSA Howe 5639 Thomas Carr Howe Comm High School Special Management TeamF F F F F F
8815 CSUSA Manual 5481 Emmerich Manual High School Special Management TeamF D D F C C
8820 Edison Learning Roosevelt 4033 Theodore Roosevelt Car & Tech Acad Innovation Network SchoolF F F F D A
5385 Indianapolis Public Schools 5517 Arlington Middle School Transformation ZoneF F F F F F
7995 Evansville Vanderburgh School Corp 8301 Glenwood Leadership Academy Transformation ZoneF F F F F F
7995 Evansville Vanderburgh School Corp 8251 Lincoln School Transformation ZoneF F D D D D
7995 Evansville Vanderburgh School Corp 8261 Caze Elementary School Transformation ZoneF F F F F F
5385 Indianapolis Public Schools 5569 Joyce Kilmer School 69 Innovation Network SchoolF F F F D D
5385 Indianapolis Public Schools 5516 Northwest Community Middle School Transformation ZoneF F F F F F
5385 Indianapolis Public Schools 5543 James Whitcomb Riley School 43 Transformation Zone
D D D F F F
5385 Indianapolis Public Schools 5548 Louis B Russell Jr School 48 Transformation Zone
D F F F F F
5385 Indianapolis Public Schools 5551 James Russell Lowell School 51 Transformation Zone
F D D F F F
5385 Indianapolis Public Schools 5619 George S Buck School 94 Transformation Zone
D D D F F F
5385 Indianapolis Public Schools 5558 Ralph Waldo Emerson School 58 Transformation Zone
F C C F F D
5385 Indianapolis Public Schools 5607 Lew Wallace School 107 Transformation Zone
F F D B D D
5385 Indianapolis Public Schools 5662 Clarence Farrington School 61 Transformation Zone
F D D F F Appeal Pending
F
F
* In 2014‐2105, Indiana moved to more rigorous academic standards for ELA and Math. As a result, student achievement declined statewide as students and teachers adjusted to the increased rigor of the standards.
Data in italics reflect the schools that are included in the IPS Transformation Zone; but, are not considered turnaround academies.
Reflects a school prior to SBOE intervention, when they were not considered a turnaround academy.
APPENDIX E: SCHOOL LETTER GRADES BY YEAR & INTERVENTION STATUS
Reflects a school that is a turnaround academy and subject to SBOE intervention.
55