turkey: quarterly banking & financial stability monitor · turkey quarterly banking &...
TRANSCRIPT
Turkey: Quarterly Banking &
Financial Stability Monitor
March 2018 Deniz Ergun
Turkey Quarterly Banking & Financial Stability Monitor-March 2018
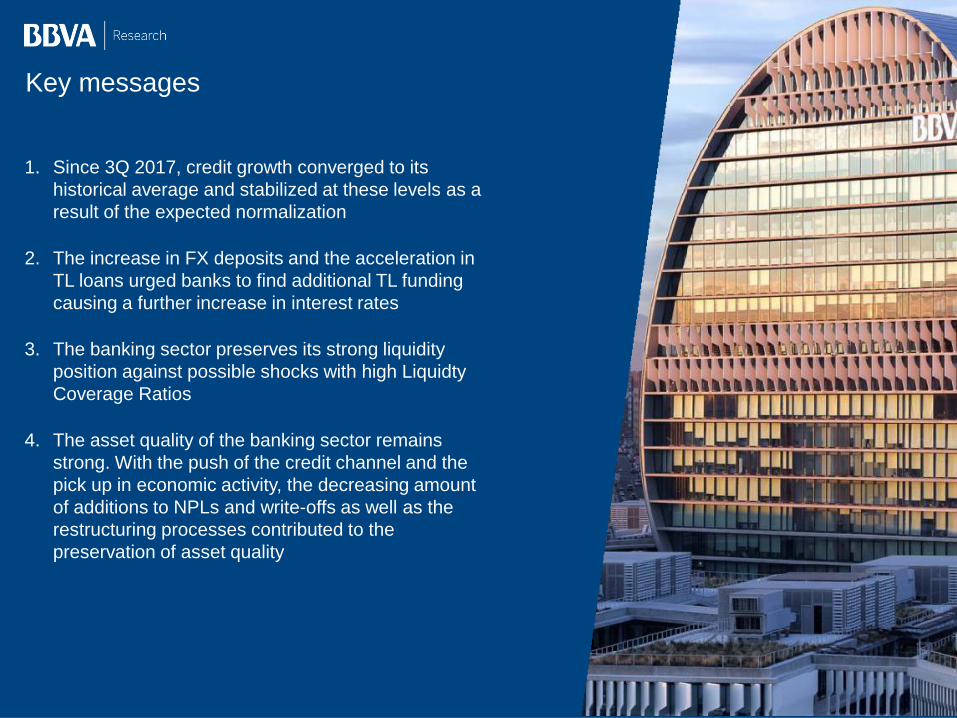
Key messages
1. Since 3Q 2017, credit growth converged to its
historical average and stabilized at these levels as a
result of the expected normalization
2. The increase in FX deposits and the acceleration in
TL loans urged banks to find additional TL funding
causing a further increase in interest rates
3. The banking sector preserves its strong liquidity
position against possible shocks with high Liquidty
Coverage Ratios
4. The asset quality of the banking sector remains
strong. With the push of the credit channel and the
pick up in economic activity, the decreasing amount
of additions to NPLs and write-offs as well as the
restructuring processes contributed to the
preservation of asset quality

Turkey Quarterly Banking & Financial Stability Monitor-March 2018
Global
Improved Bank Lending
Conditions in EMs
Turkey Quarterly Banking & Financial Stability Monitor-March 2018
4 Source: IIF, Garanti Research
EM Bank Lending Conditions (Levels)
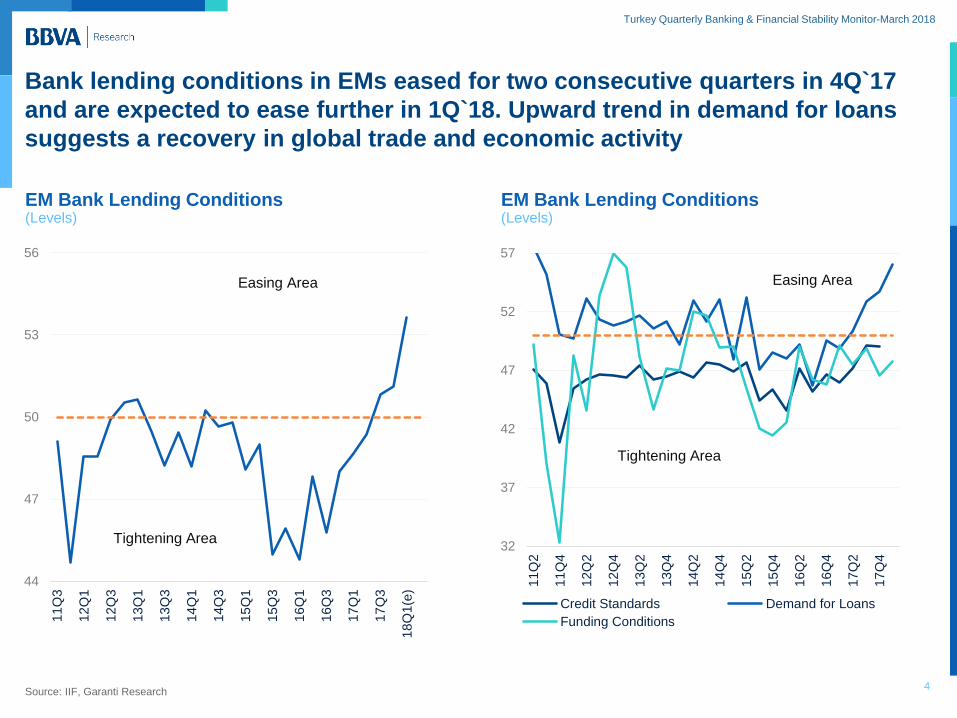
Bank lending conditions in EMs eased for two consecutive quarters in 4Q`17
and are expected to ease further in 1Q`18. Upward trend in demand for loans
suggests a recovery in global trade and economic activity
44
47
50
53
56
11
Q3
12
Q1
12
Q3
13
Q1
13
Q3
14
Q1
14
Q3
15
Q1
15
Q3
16
Q1
16
Q3
17
Q1
17
Q3
18
Q1(e
)
Easing Area
Tightening Area 32
37
42
47
52
57
11
Q2
11
Q4
12
Q2
12
Q4
13
Q2
13
Q4
14
Q2
14
Q4
15
Q2
15
Q4
16
Q2
16
Q4
17
Q2
17
Q4
Credit Standards Demand for Loans
Funding Conditions
Easing Area
Tightening Area
EM Bank Lending Conditions (Levels)
Turkey Quarterly Banking & Financial Stability Monitor-March 2018
5 Source: IIF, Garanti Research
EM Banks International Funding Conditions (Levels)
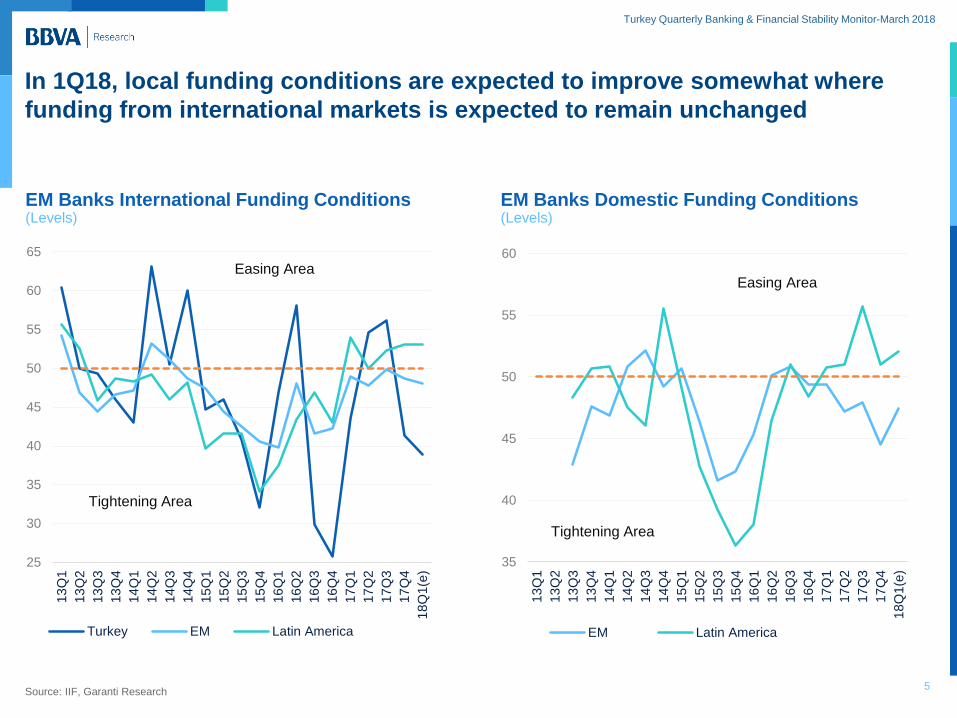
In 1Q18, local funding conditions are expected to improve somewhat where
funding from international markets is expected to remain unchanged
EM Banks Domestic Funding Conditions (Levels)
25
30
35
40
45
50
55
60
65
13
Q1
13
Q2
13
Q3
13
Q4
14
Q1
14
Q2
14
Q3
14
Q4
15
Q1
15
Q2
15
Q3
15
Q4
16
Q1
16
Q2
16
Q3
16
Q4
17
Q1
17
Q2
17
Q3
17
Q4
18
Q1(e
)
Turkey EM Latin America
Easing Area
Tightening Area
35
40
45
50
55
60
13
Q1
13
Q2
13
Q3
13
Q4
14
Q1
14
Q2
14
Q3
14
Q4
15
Q1
15
Q2
15
Q3
15
Q4
16
Q1
16
Q2
16
Q3
16
Q4
17
Q1
17
Q2
17
Q3
17
Q4
18
Q1(e
)
EM Latin America
Easing Area
Tightening Area
Turkey Quarterly Banking & Financial Stability Monitor-March 2018
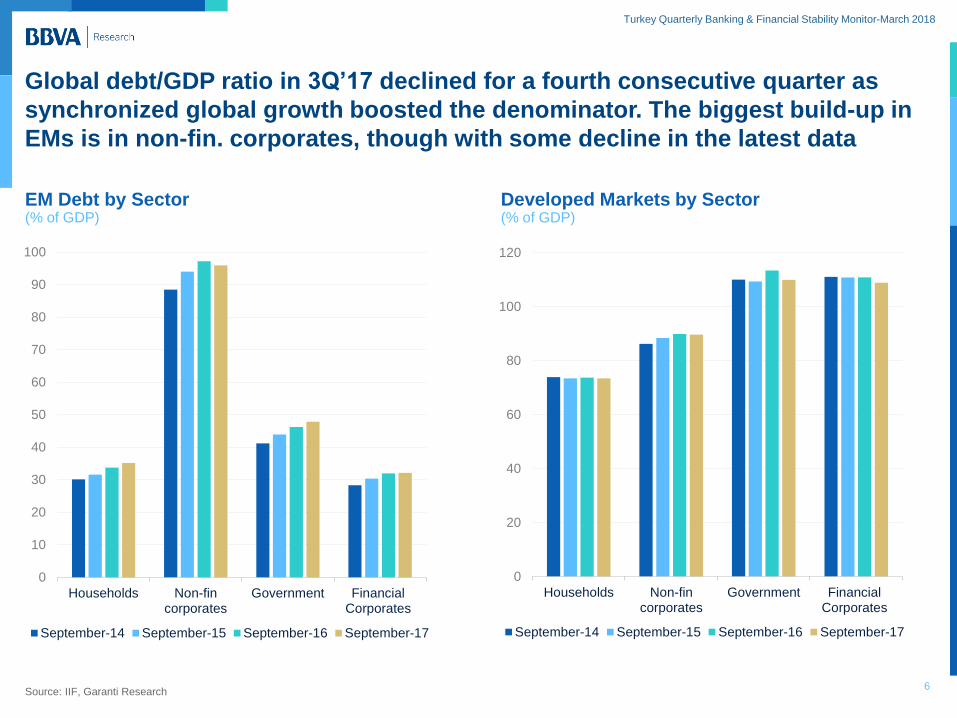
6 Source: IIF, Garanti Research
EM Debt by Sector (% of GDP)
Global debt/GDP ratio in 3Q’17 declined for a fourth consecutive quarter as
synchronized global growth boosted the denominator. The biggest build-up in
EMs is in non-fin. corporates, though with some decline in the latest data
Developed Markets by Sector (% of GDP)
0
10
20
30
40
50
60
70
80
90
100
Households Non-fincorporates
Government FinancialCorporates
September-14 September-15 September-16 September-17
0
20
40
60
80
100
120
Households Non-fincorporates
Government FinancialCorporates
September-14 September-15 September-16 September-17
Turkey Quarterly Banking & Financial Stability Monitor-March 2018
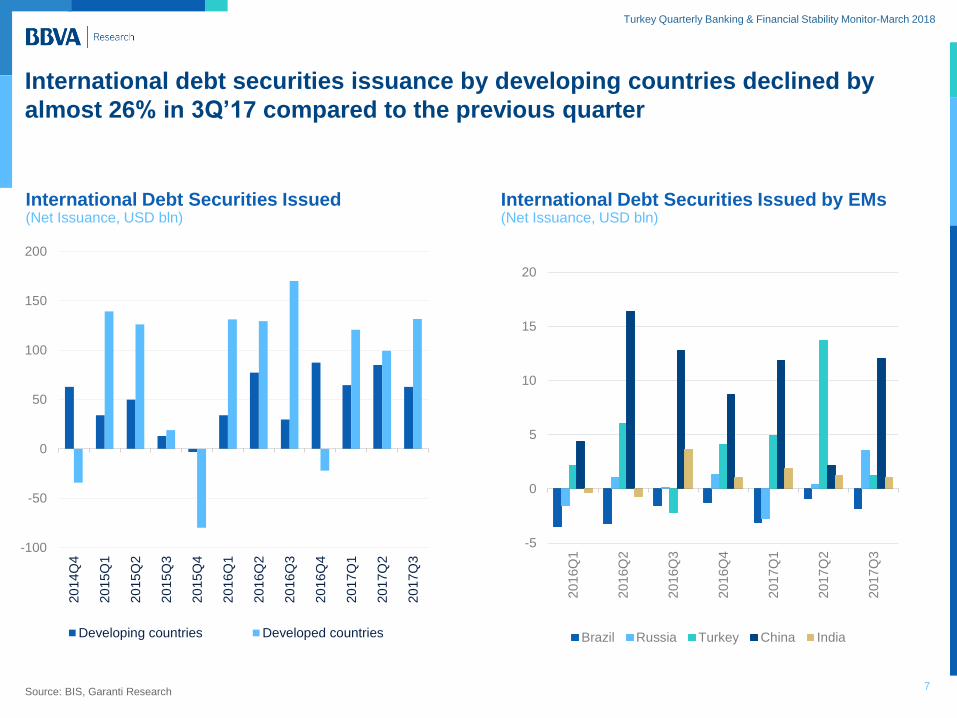
7 Source: BIS, Garanti Research
International Debt Securities Issued (Net Issuance, USD bln)
International debt securities issuance by developing countries declined by
almost 26% in 3Q’17 compared to the previous quarter
International Debt Securities Issued by EMs (Net Issuance, USD bln)
-100
-50
0
50
100
150
200
20
14Q
4
20
15Q
1
20
15Q
2
20
15Q
3
20
15Q
4
20
16Q
1
20
16Q
2
20
16Q
3
20
16Q
4
20
17Q
1
20
17Q
2
20
17Q
3
Developing countries Developed countries
-5
0
5
10
15
20
20
16Q
1
20
16Q
2
20
16Q
3
20
16Q
4
20
17Q
1
20
17Q
2
20
17Q
3
Brazil Russia Turkey China India
Turkey Quarterly Banking & Financial Stability Monitor-March 2018
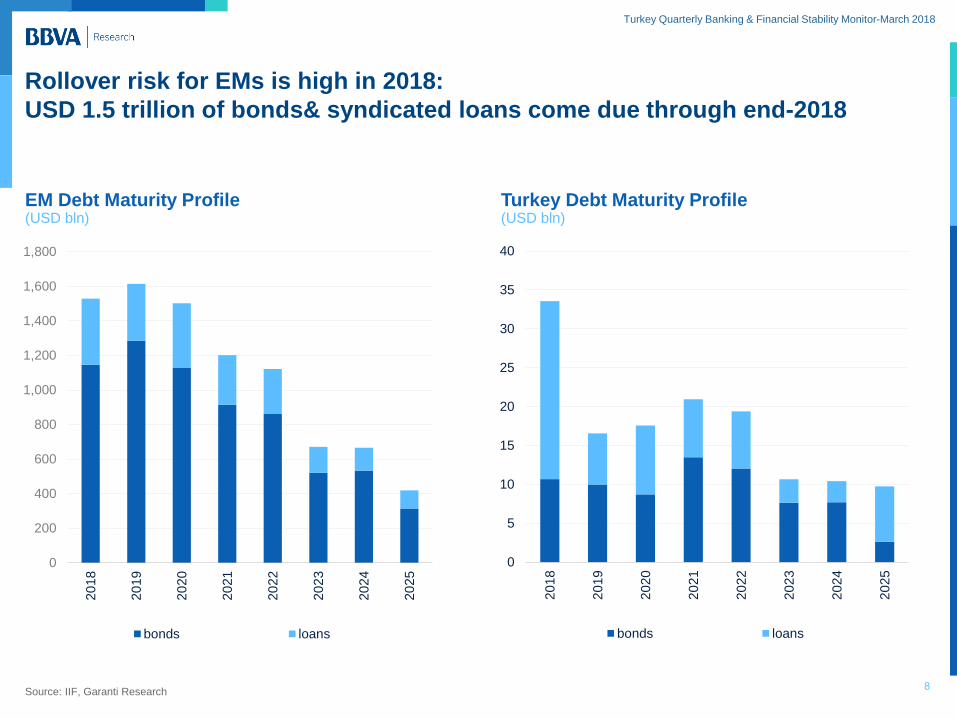
8 Source: IIF, Garanti Research
EM Debt Maturity Profile (USD bln)
Rollover risk for EMs is high in 2018:
USD 1.5 trillion of bonds& syndicated loans come due through end-2018
Turkey Debt Maturity Profile (USD bln)
0
200
400
600
800
1,000
1,200
1,400
1,600
1,800
20
18
20
19
20
20
20
21
20
22
20
23
20
24
20
25
bonds loans
0
5
10
15
20
25
30
35
40
20
18
20
19
20
20
20
21
20
22
20
23
20
24
20
25
bonds loans
Turkey Quarterly Banking & Financial Stability Monitor-March 2018
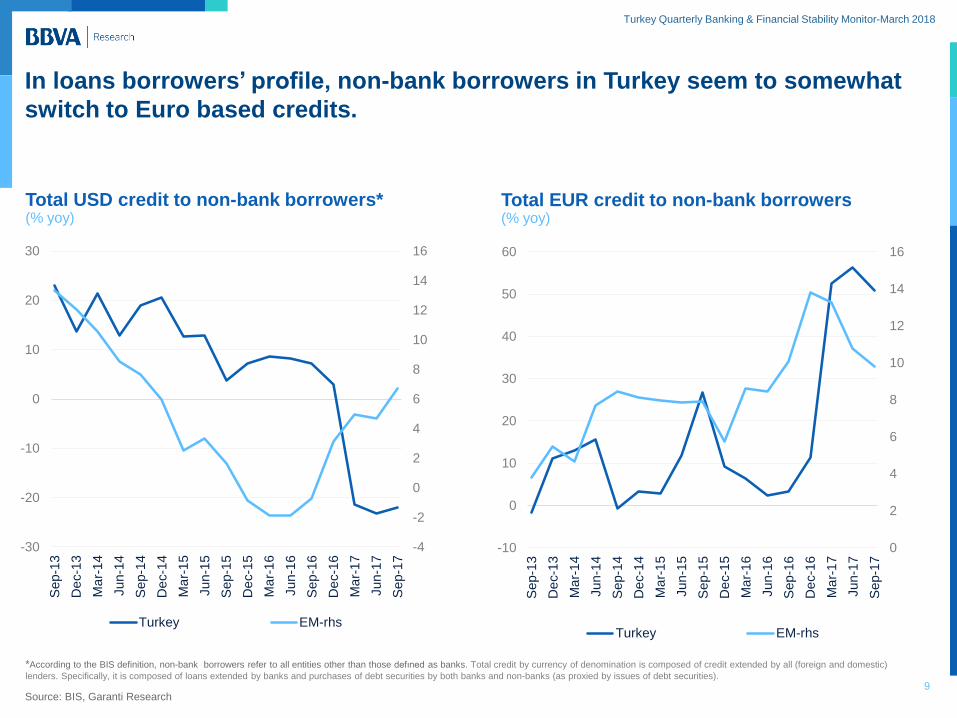
9 Source: BIS, Garanti Research
Total USD credit to non-bank borrowers* (% yoy)
In loans borrowers’ profile, non-bank borrowers in Turkey seem to somewhat
switch to Euro based credits.
Total EUR credit to non-bank borrowers (% yoy)
-4
-2
0
2
4
6
8
10
12
14
16
-30
-20
-10
0
10
20
30
Sep-1
3
De
c-1
3
Ma
r-1
4
Jun-1
4
Sep-1
4
De
c-1
4
Ma
r-1
5
Jun-1
5
Sep-1
5
De
c-1
5
Ma
r-1
6
Jun-1
6
Sep-1
6
De
c-1
6
Ma
r-1
7
Jun-1
7
Sep-1
7
Turkey EM-rhs
0
2
4
6
8
10
12
14
16
-10
0
10
20
30
40
50
60
Sep-1
3
De
c-1
3
Ma
r-1
4
Jun-1
4
Sep-1
4
De
c-1
4
Ma
r-1
5
Jun-1
5
Sep-1
5
De
c-1
5
Ma
r-1
6
Jun-1
6
Sep-1
6
De
c-1
6
Ma
r-1
7
Jun-1
7
Sep-1
7
Turkey EM-rhs
*According to the BIS definition, non-bank borrowers refer to all entities other than those defıned as banks. Total credit by currency of denomination is composed of credit extended by all (foreign and domestic)
lenders. Specifically, it is composed of loans extended by banks and purchases of debt securities by both banks and non-banks (as proxied by issues of debt securities).
Turkey Quarterly Banking & Financial Stability Monitor-March 2018
Turkey:
Monetary Policy
and Interest
Rates
Tight Monetary
Policy Stance,
Contained Monetary
Transmission
Turkey Quarterly Banking & Financial Stability Monitor-March 2018
11
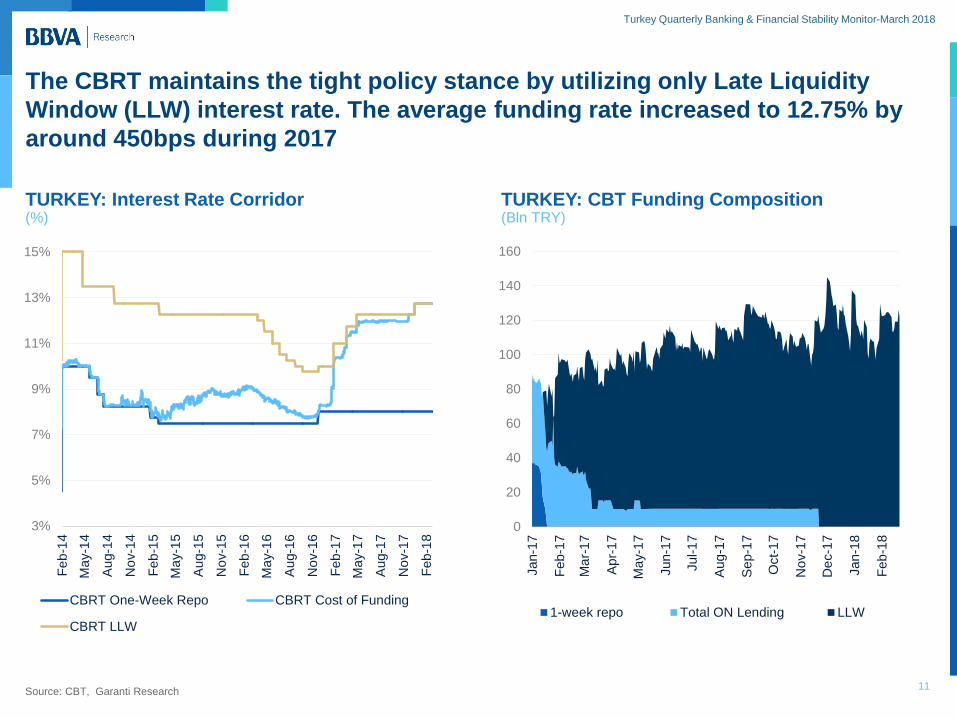
The CBRT maintains the tight policy stance by utilizing only Late Liquidity
Window (LLW) interest rate. The average funding rate increased to 12.75% by
around 450bps during 2017
TURKEY: Interest Rate Corridor (%)
Source: CBT, Garanti Research
TURKEY: CBT Funding Composition (Bln TRY)
3%
5%
7%
9%
11%
13%
15%
Feb
-14
Ma
y-1
4
Aug-1
4
No
v-1
4
Feb
-15
Ma
y-1
5
Aug-1
5
No
v-1
5
Feb
-16
Ma
y-1
6
Aug-1
6
No
v-1
6
Feb
-17
Ma
y-1
7
Aug-1
7
No
v-1
7
Feb
-18
Hu
nd
red
s
CBRT One-Week Repo CBRT Cost of Funding
CBRT LLW
0
20
40
60
80
100
120
140
160
Jan-1
7
Feb
-17
Ma
r-1
7
Apr-
17
Ma
y-1
7
Jun-1
7
Jul-1
7
Aug-1
7
Sep-1
7
Oct-
17
No
v-1
7
De
c-1
7
Jan-1
8
Feb
-18
1-week repo Total ON Lending LLW
Turkey Quarterly Banking & Financial Stability Monitor-March 2018
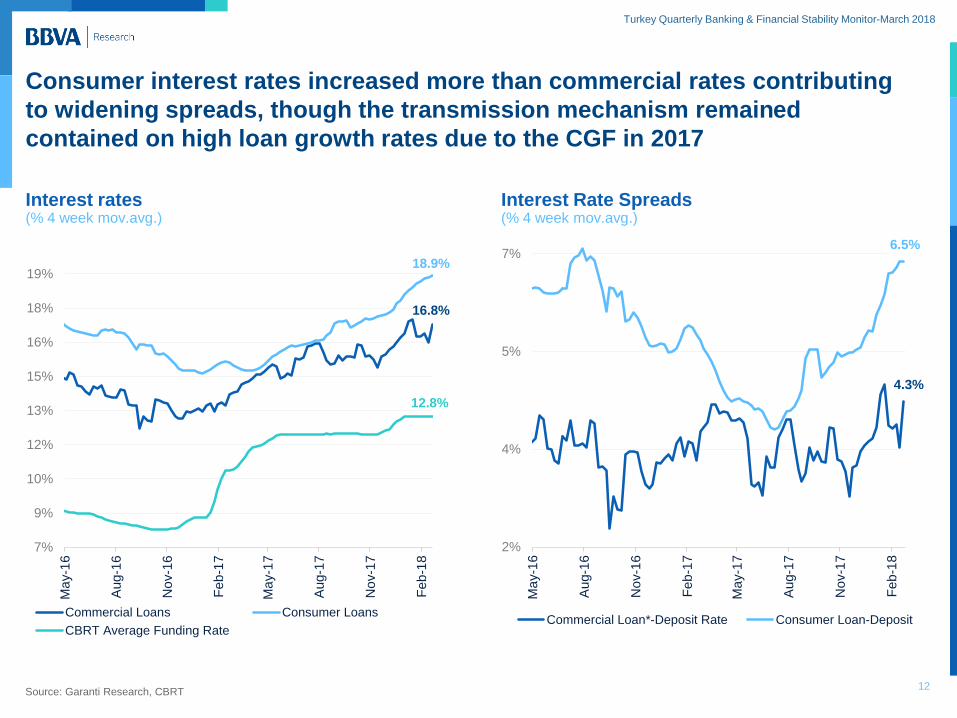
Consumer interest rates increased more than commercial rates contributing
to widening spreads, though the transmission mechanism remained
contained on high loan growth rates due to the CGF in 2017
12 Source: Garanti Research, CBRT
Interest rates (% 4 week mov.avg.)
Interest Rate Spreads (% 4 week mov.avg.)
4.3%
6.5%
2%
4%
5%
7%
Ma
y-1
6
Aug-1
6
No
v-1
6
Feb
-17
Ma
y-1
7
Aug-1
7
No
v-1
7
Feb
-18
Commercial Loan*-Deposit Rate Consumer Loan-Deposit
16.8%
18.9%
12.8%
7%
9%
10%
12%
13%
15%
16%
18%
19%
Ma
y-1
6
Aug-1
6
No
v-1
6
Feb
-17
Ma
y-1
7
Aug-1
7
No
v-1
7
Feb
-18
Commercial Loans Consumer Loans
CBRT Average Funding Rate
Turkey Quarterly Banking & Financial Stability Monitor-March 2018
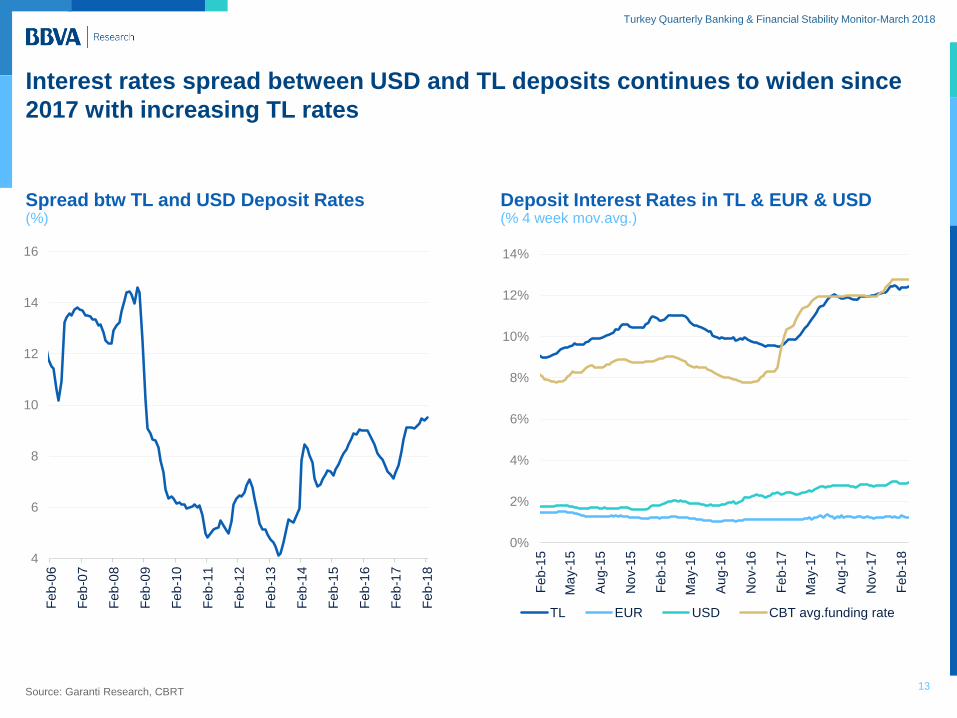
Interest rates spread between USD and TL deposits continues to widen since
2017 with increasing TL rates
13
Spread btw TL and USD Deposit Rates (%)
Deposit Interest Rates in TL & EUR & USD (% 4 week mov.avg.)
4
6
8
10
12
14
16
Feb
-06
Feb
-07
Feb
-08
Feb
-09
Feb
-10
Feb
-11
Feb
-12
Feb
-13
Feb
-14
Feb
-15
Feb
-16
Feb
-17
Feb
-18
0%
2%
4%
6%
8%
10%
12%
14%
Feb
-15
Ma
y-1
5
Aug-1
5
No
v-1
5
Feb
-16
Ma
y-1
6
Aug-1
6
No
v-1
6
Feb
-17
Ma
y-1
7
Aug-1
7
No
v-1
7
Feb
-18
TL EUR USD CBT avg.funding rate
Source: Garanti Research, CBRT
Turkey Quarterly Banking & Financial Stability Monitor-March 2018
Turkish Banking
Sector: Credit
Developments
Normalization in Credits
Decline in NPLs
Turkey Quarterly Banking & Financial Stability Monitor-March 2018
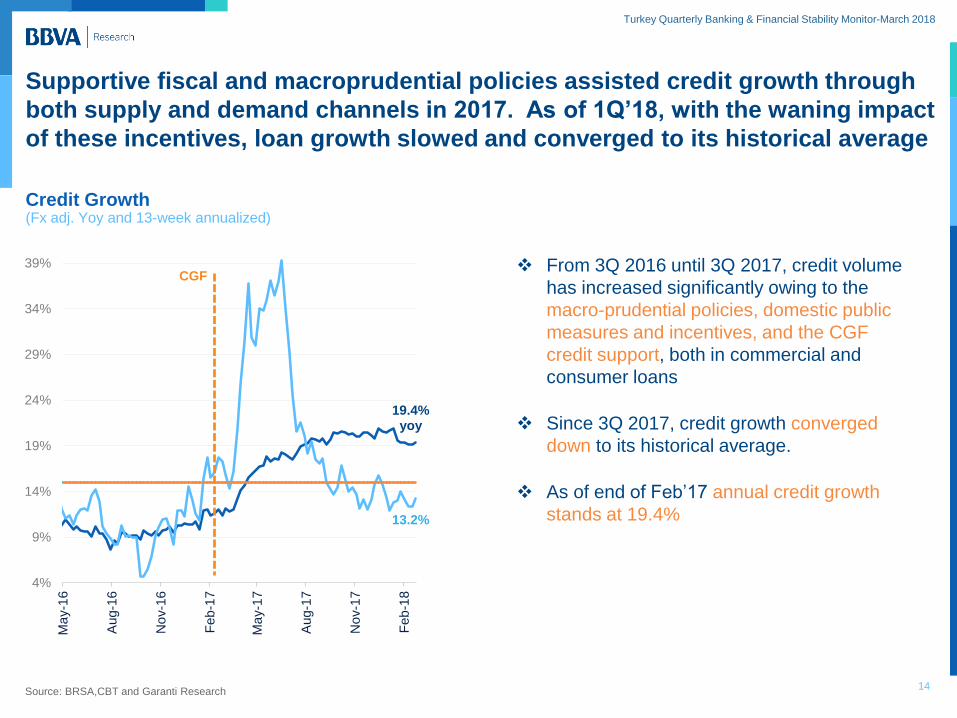
Supportive fiscal and macroprudential policies assisted credit growth through
both supply and demand channels in 2017. As of 1Q’18, with the waning impact
of these incentives, loan growth slowed and converged to its historical average
Credit Growth (Fx adj. Yoy and 13-week annualized)
Source: BRSA,CBT and Garanti Research
19.4% yoy
13.2%
4%
9%
14%
19%
24%
29%
34%
39%
Ma
y-1
6
Aug-1
6
No
v-1
6
Feb
-17
Ma
y-1
7
Aug-1
7
No
v-1
7
Feb
-18
CGF
14
From 3Q 2016 until 3Q 2017, credit volume
has increased significantly owing to the
macro-prudential policies, domestic public
measures and incentives, and the CGF
credit support, both in commercial and
consumer loans
Since 3Q 2017, credit growth converged
down to its historical average.
As of end of Feb’17 annual credit growth
stands at 19.4%
Turkey Quarterly Banking & Financial Stability Monitor-March 2018
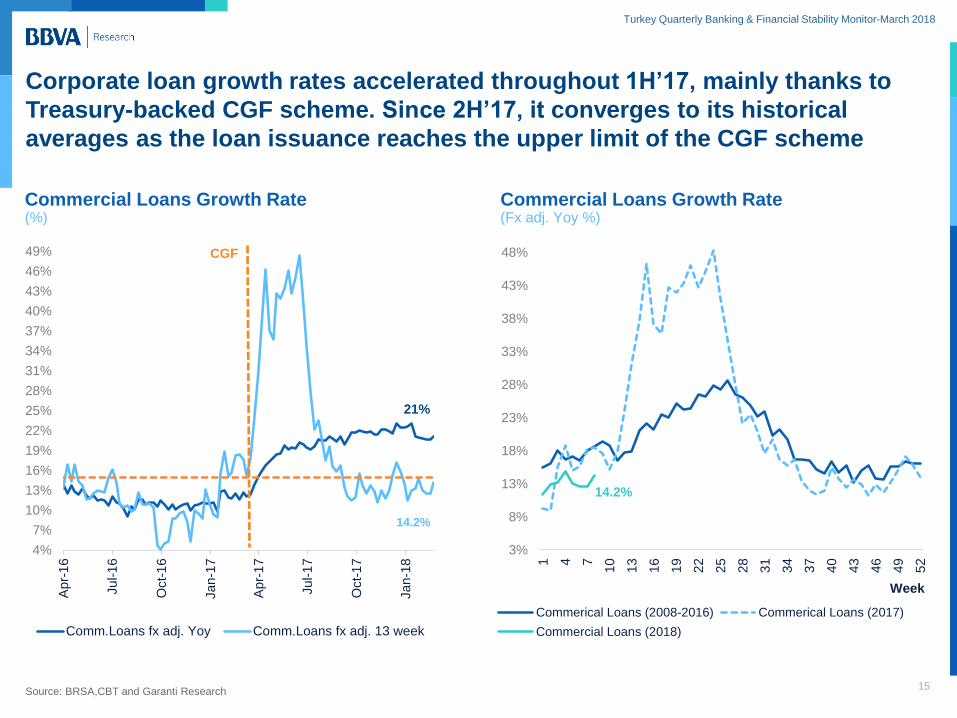
Corporate loan growth rates accelerated throughout 1H’17, mainly thanks to
Treasury-backed CGF scheme. Since 2H’17, it converges to its historical
averages as the loan issuance reaches the upper limit of the CGF scheme
Commercial Loans Growth Rate (%)
Source: BRSA,CBT and Garanti Research
Commercial Loans Growth Rate (Fx adj. Yoy %)
21%
14.2%
4%
7%
10%
13%
16%
19%
22%
25%
28%
31%
34%
37%
40%
43%
46%
49%
Apr-
16
Jul-1
6
Oct-
16
Jan-1
7
Apr-
17
Jul-1
7
Oct-
17
Jan-1
8
CGF
Comm.Loans fx adj. Yoy Comm.Loans fx adj. 13 week
14.2%
3%
8%
13%
18%
23%
28%
33%
38%
43%
48%
1 4 7
10
13
16
19
22
25
28
31
34
37
40
43
46
49
52
Week
Commerical Loans (2008-2016) Commerical Loans (2017)
Commercial Loans (2018)
15
Turkey Quarterly Banking & Financial Stability Monitor-March 2018
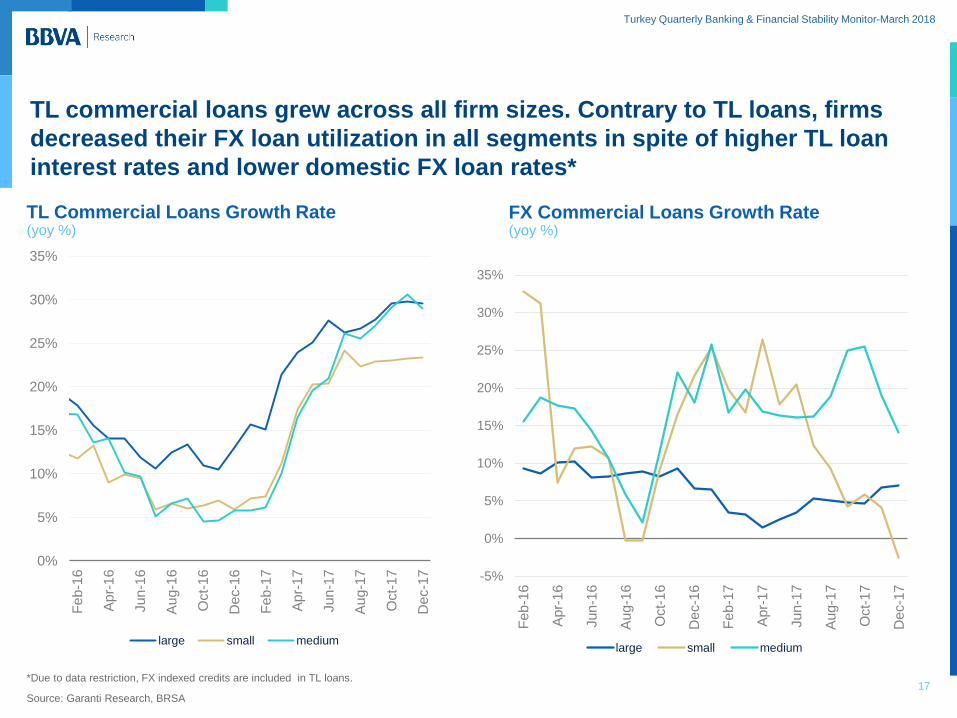
TL commercial loans grew across all firm sizes. Contrary to TL loans, firms
decreased their FX loan utilization in all segments in spite of higher TL loan
interest rates and lower domestic FX loan rates*
17
0%
5%
10%
15%
20%
25%
30%
35%
Fe
b-1
6
Apr-
16
Jun
-16
Au
g-1
6
Oct-
16
De
c-1
6
Fe
b-1
7
Ap
r-1
7
Jun
-17
Aug-1
7
Oct-
17
De
c-1
7
large small medium
-5%
0%
5%
10%
15%
20%
25%
30%
35%
Fe
b-1
6
Ap
r-1
6
Jun
-16
Au
g-1
6
Oct-
16
De
c-1
6
Fe
b-1
7
Ap
r-1
7
Jun
-17
Au
g-1
7
Oct-
17
De
c-1
7
large small medium
Source: Garanti Research, BRSA
*Due to data restriction, FX indexed credits are included in TL loans.
TL Commercial Loans Growth Rate (yoy %)
FX Commercial Loans Growth Rate (yoy %)
Turkey Quarterly Banking & Financial Stability Monitor-March 2018
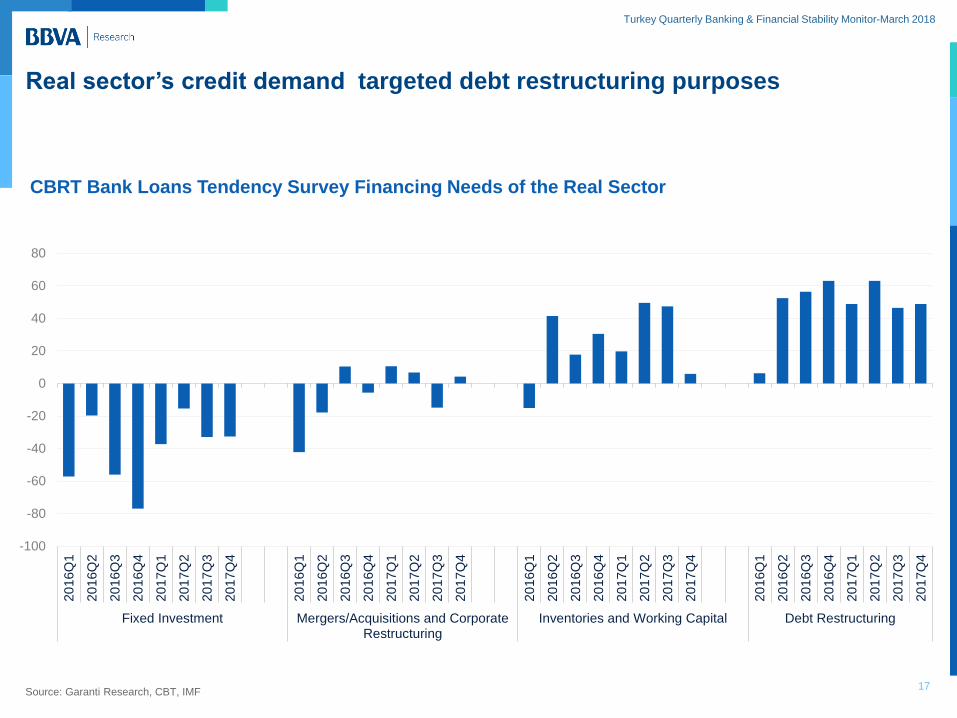
Real sector’s credit demand targeted debt restructuring purposes
Source: Garanti Research, CBT, IMF
-100
-80
-60
-40
-20
0
20
40
60
80
20
16Q
1
20
16Q
2
20
16Q
3
20
16Q
4
20
17Q
1
20
17Q
2
20
17Q
3
20
17Q
4
20
16Q
1
20
16Q
2
20
16Q
3
20
16Q
4
20
17Q
1
20
17Q
2
20
17Q
3
20
17Q
4
20
16Q
1
20
16Q
2
20
16Q
3
20
16Q
4
20
17Q
1
20
17Q
2
20
17Q
3
20
17Q
4
20
16Q
1
20
16Q
2
20
16Q
3
20
16Q
4
20
17Q
1
20
17Q
2
20
17Q
3
20
17Q
4
Fixed Investment Mergers/Acquisitions and CorporateRestructuring
Inventories and Working Capital Debt Restructuring
17
CBRT Bank Loans Tendency Survey Financing Needs of the Real Sector
Turkey Quarterly Banking & Financial Stability Monitor-March 2018
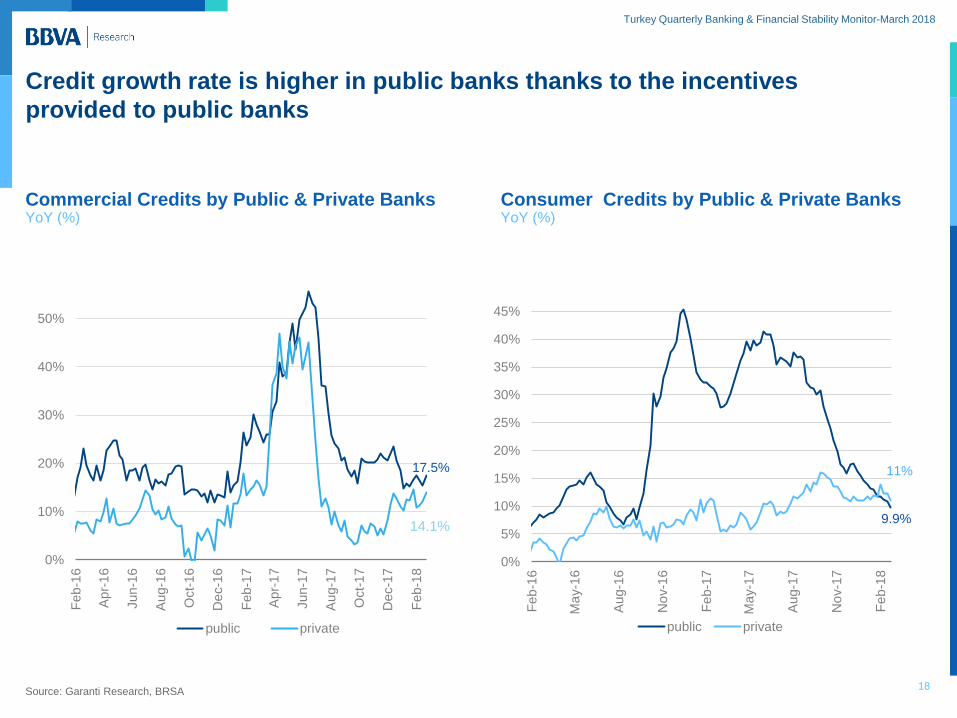
Credit growth rate is higher in public banks thanks to the incentives
provided to public banks
Commercial Credits by Public & Private Banks YoY (%)
Source: Garanti Research, BRSA
Consumer Credits by Public & Private Banks YoY (%)
18
17.5%
14.1%
0%
10%
20%
30%
40%
50%
Feb
-16
Apr-
16
Jun-1
6
Aug-1
6
Oct-
16
De
c-1
6
Feb
-17
Apr-
17
Jun-1
7
Aug-1
7
Oct-
17
De
c-1
7
Feb
-18
public private
11%
9.9%
0%
5%
10%
15%
20%
25%
30%
35%
40%
45%
Feb
-16
Ma
y-1
6
Aug-1
6
No
v-1
6
Feb
-17
Ma
y-1
7
Aug-1
7
No
v-1
7
Feb
-18
public private
Turkey Quarterly Banking & Financial Stability Monitor-March 2018
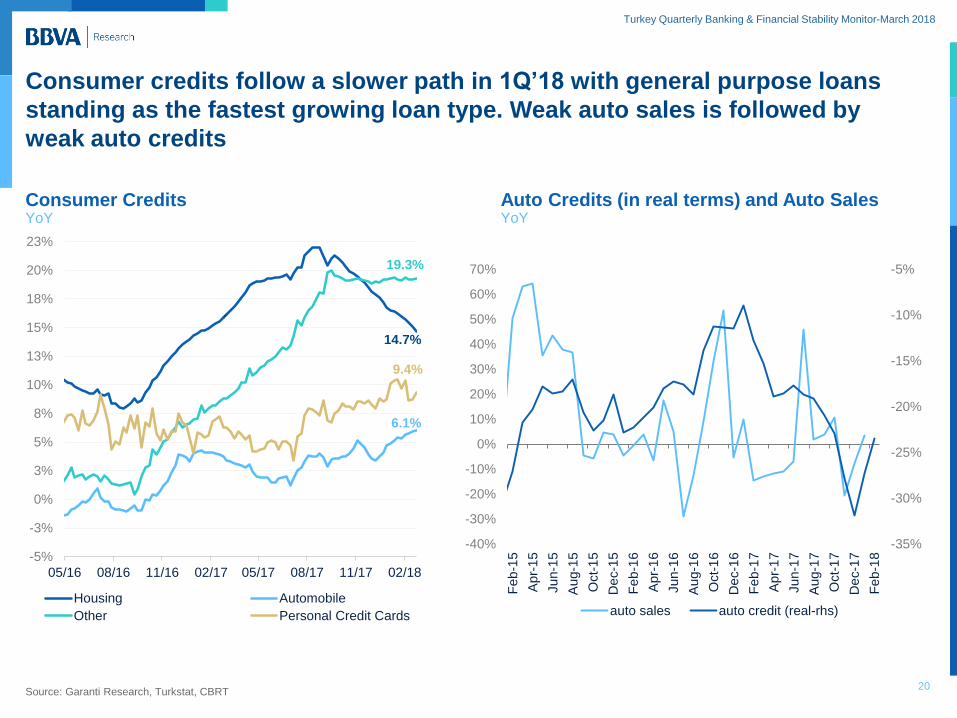
Consumer credits follow a slower path in 1Q’18 with general purpose loans
standing as the fastest growing loan type. Weak auto sales is followed by
weak auto credits
20 Source: Garanti Research, Turkstat, CBRT
Consumer Credits YoY
Auto Credits (in real terms) and Auto Sales YoY
6.1%
14.7%
19.3%
9.4%
-5%
-3%
0%
3%
5%
8%
10%
13%
15%
18%
20%
23%
05/16 08/16 11/16 02/17 05/17 08/17 11/17 02/18
Housing Automobile
Other Personal Credit Cards
Series5
-35%
-30%
-25%
-20%
-15%
-10%
-5%
-40%
-30%
-20%
-10%
0%
10%
20%
30%
40%
50%
60%
70%
Feb
-15
Apr-
15
Jun-1
5
Aug-1
5
Oct-
15
De
c-1
5
Feb
-16
Apr-
16
Jun-1
6
Aug-1
6
Oct-
16
De
c-1
6
Feb
-17
Apr-
17
Jun-1
7
Aug-1
7
Oct-
17
De
c-1
7
Feb
-18
auto sales auto credit (real-rhs)
Turkey Quarterly Banking & Financial Stability Monitor-March 2018
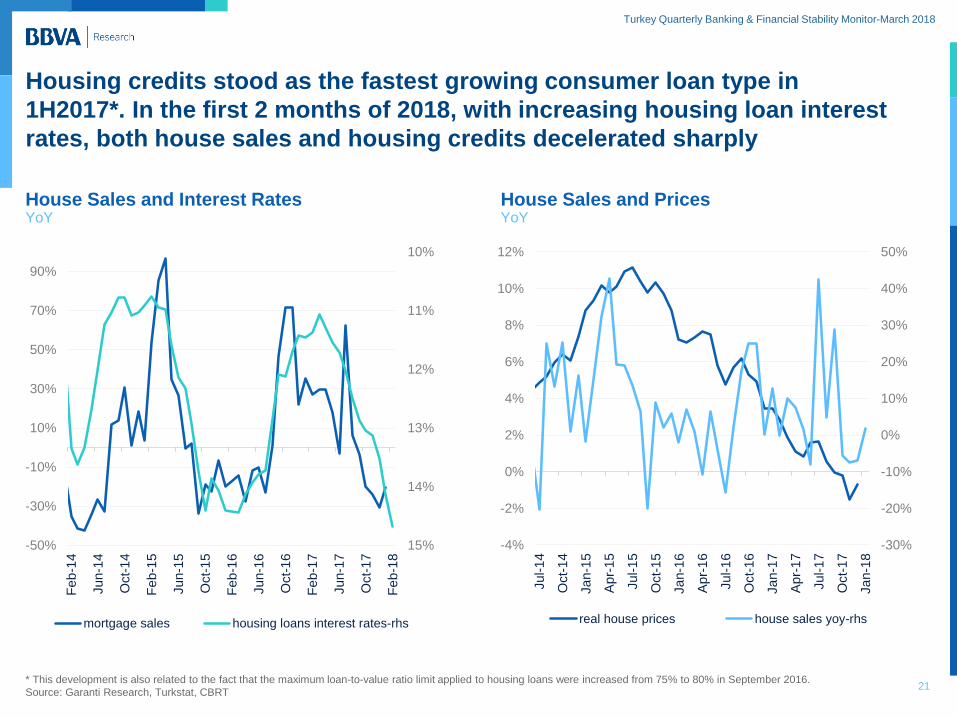
Housing credits stood as the fastest growing consumer loan type in
1H2017*. In the first 2 months of 2018, with increasing housing loan interest
rates, both house sales and housing credits decelerated sharply
21 * This development is also related to the fact that the maximum loan-to-value ratio limit applied to housing loans were increased from 75% to 80% in September 2016.
Source: Garanti Research, Turkstat, CBRT
House Sales and Interest Rates YoY
House Sales and Prices YoY
-30%
-20%
-10%
0%
10%
20%
30%
40%
50%
-4%
-2%
0%
2%
4%
6%
8%
10%
12%
Jul-1
4
Oct-
14
Jan-1
5
Apr-
15
Jul-1
5
Oct-
15
Jan-1
6
Apr-
16
Jul-1
6
Oct-
16
Jan-1
7
Apr-
17
Jul-1
7
Oct-
17
Jan-1
8
real house prices house sales yoy-rhs
10%
11%
12%
13%
14%
15%-50%
-30%
-10%
10%
30%
50%
70%
90%
Feb
-14
Jun-1
4
Oct-
14
Feb
-15
Jun-1
5
Oct-
15
Feb
-16
Jun-1
6
Oct-
16
Feb
-17
Jun-1
7
Oct-
17
Feb
-18
mortgage sales housing loans interest rates-rhs
Turkey Quarterly Banking & Financial Stability Monitor-March 2018
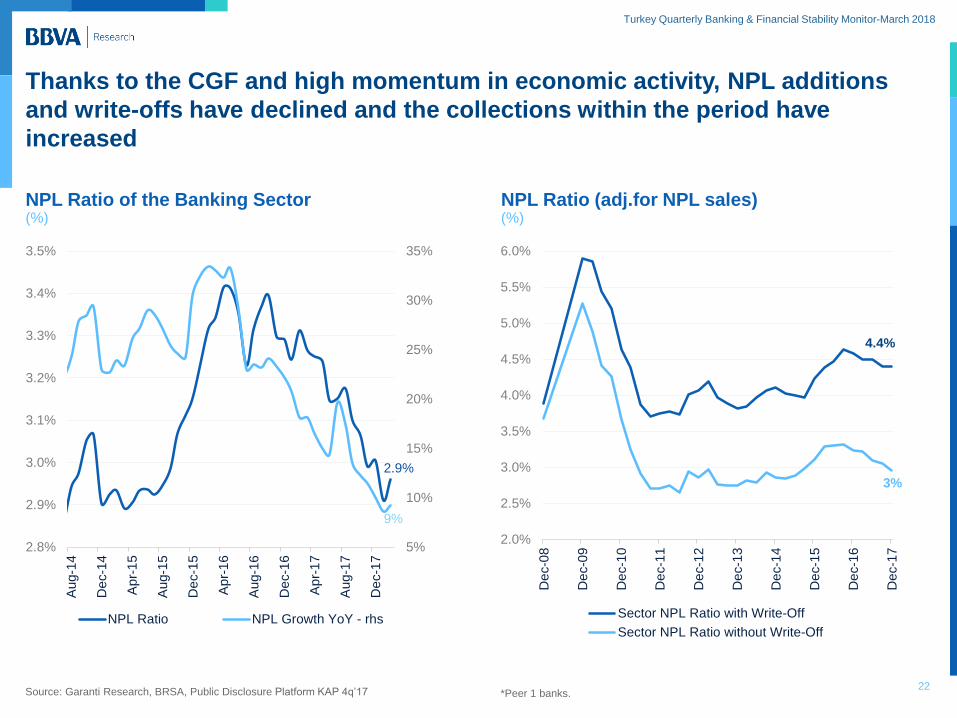
Thanks to the CGF and high momentum in economic activity, NPL additions
and write-offs have declined and the collections within the period have
increased
22 Source: Garanti Research, BRSA, Public Disclosure Platform KAP 4q’17
NPL Ratio of the Banking Sector (%)
NPL Ratio (adj.for NPL sales) (%)
Core
*Peer 1 banks. inflation jumped by 100bps in the last 2 months due to recent
appreciation of euro and second
4.4%
3%
2.0%
2.5%
3.0%
3.5%
4.0%
4.5%
5.0%
5.5%
6.0%
De
c-0
8
De
c-0
9
De
c-1
0
De
c-1
1
De
c-1
2
De
c-1
3
De
c-1
4
De
c-1
5
De
c-1
6
De
c-1
7
Sector NPL Ratio with Write-Off
Sector NPL Ratio without Write-Off
2.9%
9%
5%
10%
15%
20%
25%
30%
35%
2.8%
2.9%
3.0%
3.1%
3.2%
3.3%
3.4%
3.5%
Aug-1
4
De
c-1
4
Apr-
15
Aug-1
5
De
c-1
5
Apr-
16
Aug-1
6
De
c-1
6
Apr-
17
Aug-1
7
De
c-1
7
NPL Ratio NPL Growth YoY - rhs
Turkey Quarterly Banking & Financial Stability Monitor-March 2018
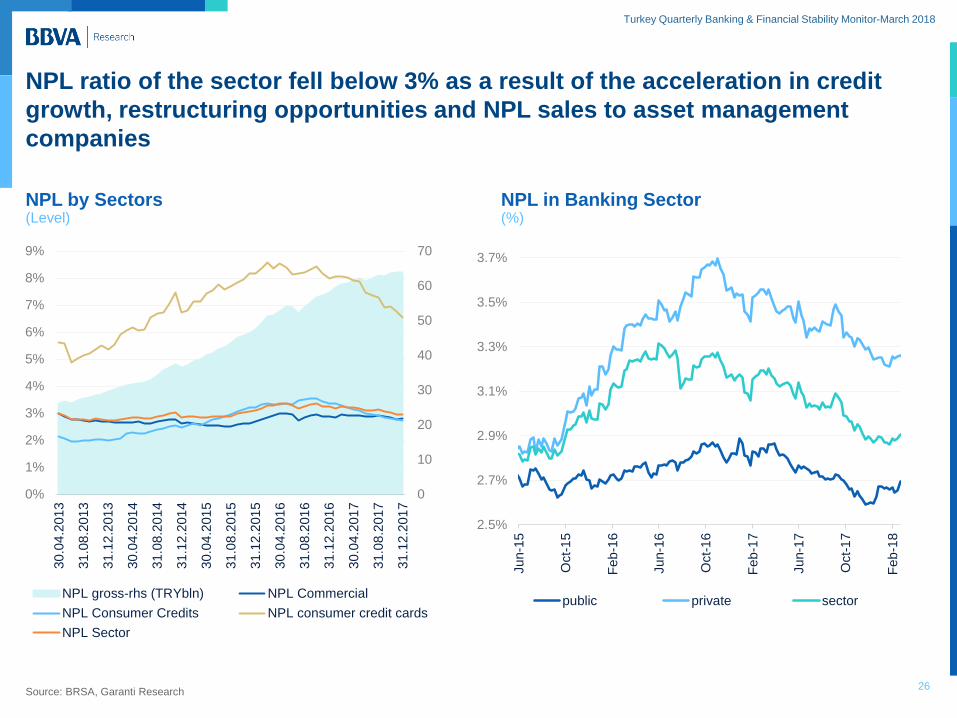
26
NPL ratio of the sector fell below 3% as a result of the acceleration in credit
growth, restructuring opportunities and NPL sales to asset management
companies
Source: BRSA, Garanti Research
0
10
20
30
40
50
60
70
0%
1%
2%
3%
4%
5%
6%
7%
8%
9%
30
.04
.201
3
31
.08
.201
3
31
.12
.201
3
30
.04
.201
4
31
.08
.201
4
31
.12
.201
4
30
.04
.201
5
31
.08
.201
5
31
.12
.201
5
30
.04
.201
6
31
.08
.201
6
31
.12
.201
6
30
.04
.201
7
31
.08
.201
7
31
.12
.201
7
NPL gross-rhs (TRYbln) NPL Commercial
NPL Consumer Credits NPL consumer credit cards
NPL Sector
2.5%
2.7%
2.9%
3.1%
3.3%
3.5%
3.7%
Jun-1
5
Oct-
15
Fe
b-1
6
Jun-1
6
Oct-
16
Feb
-17
Jun-1
7
Oct-
17
Feb
-18
public private sector
NPL by Sectors (Level)
NPL in Banking Sector (%)
Turkey Quarterly Banking & Financial Stability Monitor-March 2018
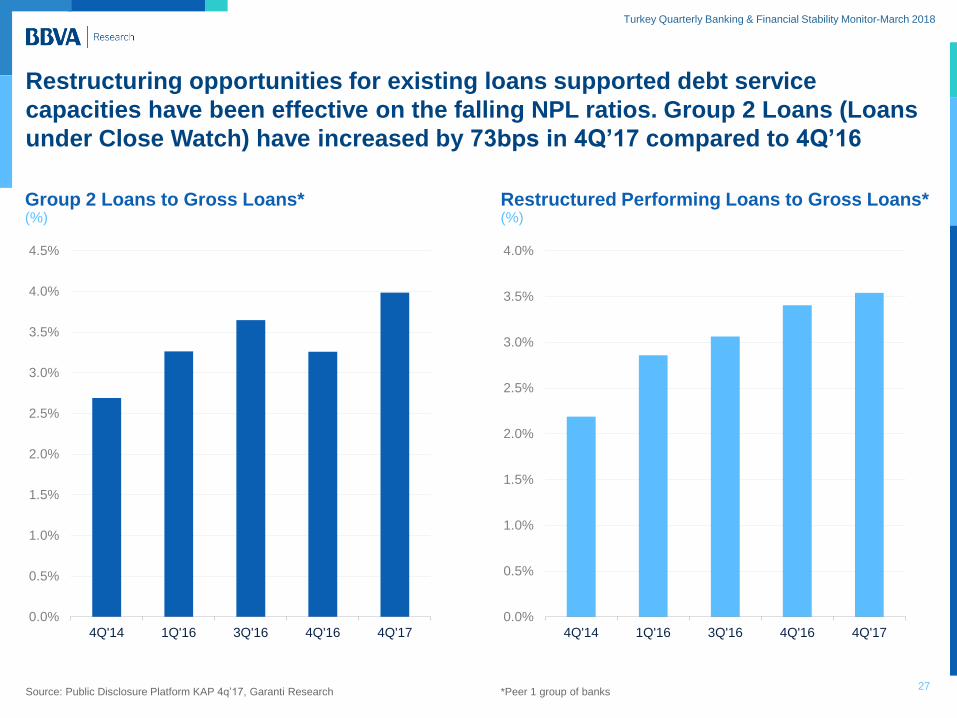
Group 2 Loans to Gross Loans* (%)
27
Restructuring opportunities for existing loans supported debt service
capacities have been effective on the falling NPL ratios. Group 2 Loans (Loans
under Close Watch) have increased by 73bps in 4Q’17 compared to 4Q’16
Restructured Performing Loans to Gross Loans* (%)
Source: Public Disclosure Platform KAP 4q’17, Garanti Research
0.0%
0.5%
1.0%
1.5%
2.0%
2.5%
3.0%
3.5%
4.0%
4Q'14 1Q'16 3Q'16 4Q'16 4Q'17
0.0%
0.5%
1.0%
1.5%
2.0%
2.5%
3.0%
3.5%
4.0%
4.5%
4Q'14 1Q'16 3Q'16 4Q'16 4Q'17
*Peer 1 group of banks

Turkey Quarterly Banking & Financial Stability Monitor-March 2018
Turkish Banking
Sector: Liquidity
Turkey Quarterly Banking & Financial Stability Monitor-March 2018
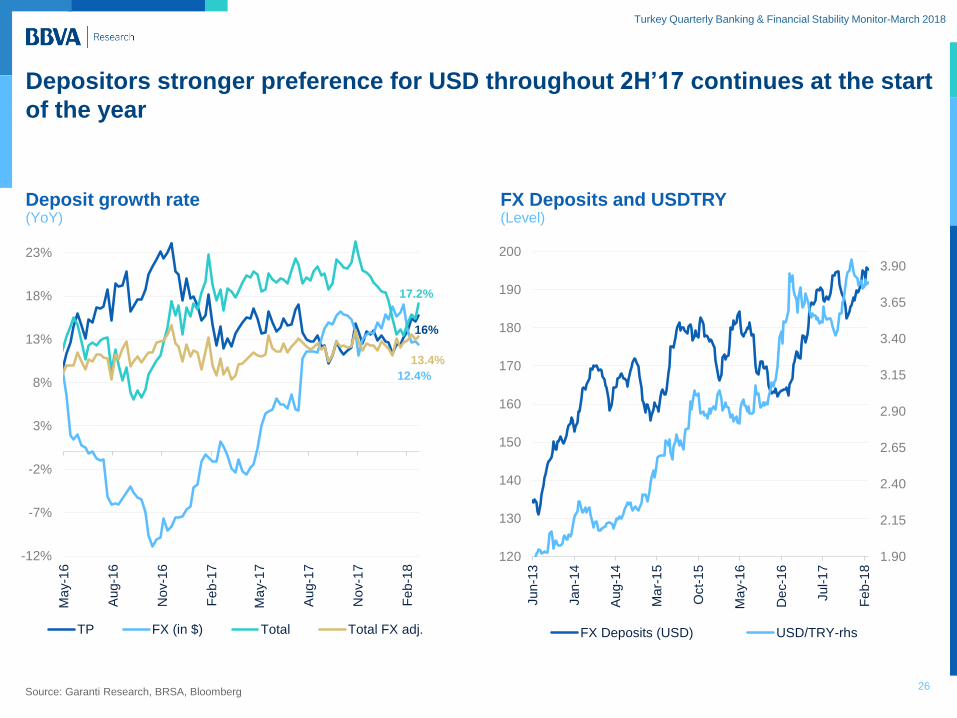
Depositors stronger preference for USD throughout 2H’17 continues at the start
of the year
26 Source: Garanti Research, BRSA, Bloomberg
Deposit growth rate (YoY)
FX Deposits and USDTRY (Level)
17.2%
16%
12.4%
13.4%
-12%
-7%
-2%
3%
8%
13%
18%
23%
Ma
y-1
6
Aug-1
6
No
v-1
6
Feb
-17
Ma
y-1
7
Aug-1
7
No
v-1
7
Feb
-18
TP FX (in $) Total Total FX adj.
1.90
2.15
2.40
2.65
2.90
3.15
3.40
3.65
3.90
120
130
140
150
160
170
180
190
200
Jun-1
3
Jan-1
4
Aug-1
4
Ma
r-1
5
Oct-
15
Ma
y-1
6
De
c-1
6
Jul-1
7
Fe
b-1
8
FX Deposits (USD) USD/TRY-rhs
Turkey Quarterly Banking & Financial Stability Monitor-March 2018
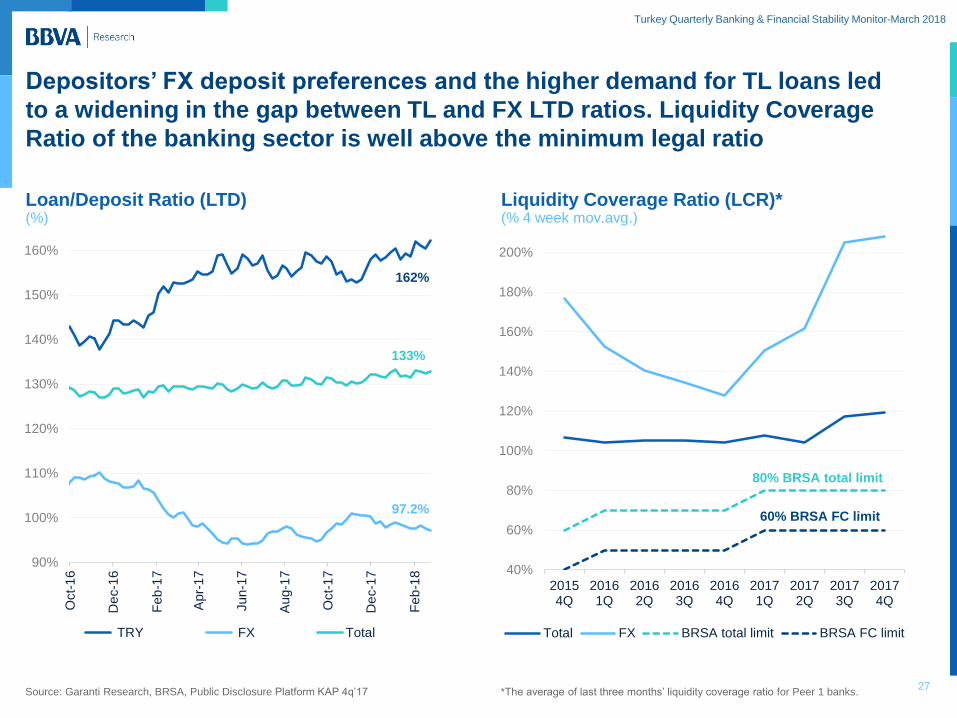
Depositors’ FX deposit preferences and the higher demand for TL loans led
to a widening in the gap between TL and FX LTD ratios. Liquidity Coverage
Ratio of the banking sector is well above the minimum legal ratio
27 Source: Garanti Research, BRSA, Public Disclosure Platform KAP 4q’17
Loan/Deposit Ratio (LTD) (%)
Liquidity Coverage Ratio (LCR)* (% 4 week mov.avg.)
*The average of last three months’ liquidity coverage ratio for Peer 1 banks.on jumped by
100bps in the last 2 months due to recent appreciation of euro and second
40%
60%
80%
100%
120%
140%
160%
180%
200%
20154Q
20161Q
20162Q
20163Q
20164Q
20171Q
20172Q
20173Q
20174Q
Total FX BRSA total limit BRSA FC limit
80% BRSA total limit
60% BRSA FC limit
162%
97.2%
133%
90%
100%
110%
120%
130%
140%
150%
160%
Oct-
16
De
c-1
6
Feb
-17
Apr-
17
Jun-1
7
Aug-1
7
Oct-
17
De
c-1
7
Feb
-18
TRY FX Total
Turkey Quarterly Banking & Financial Stability Monitor-March 2018
Turkish Banking
Sector: Asset
Quality
Sizable Increase in Profit
Asset Quality Improved
Turkey Quarterly Banking & Financial Stability Monitor-March 2018
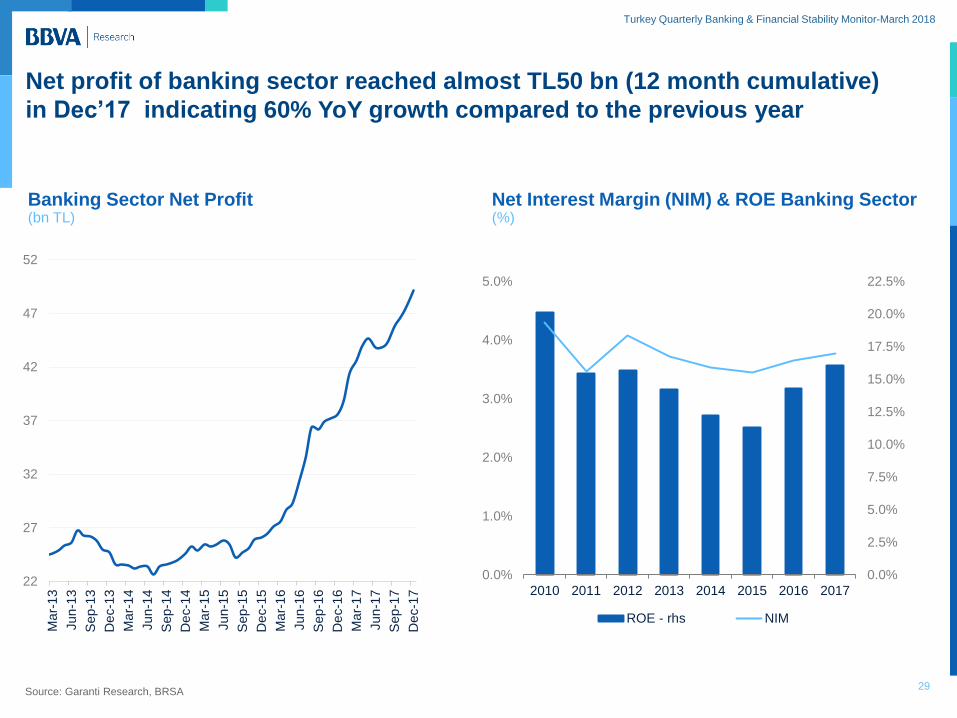
Net profit of banking sector reached almost TL50 bn (12 month cumulative)
in Dec’17 indicating 60% YoY growth compared to the previous year
29 Source: Garanti Research, BRSA
Banking Sector Net Profit (bn TL)
Net Interest Margin (NIM) & ROE Banking Sector (%)
22
27
32
37
42
47
52
Ma
r-1
3
Jun-1
3
Sep-1
3
De
c-1
3
Ma
r-1
4
Jun-1
4
Sep-1
4
De
c-1
4
Ma
r-1
5
Jun-1
5
Sep-1
5
De
c-1
5
Ma
r-1
6
Jun-1
6
Sep-1
6
De
c-1
6
Ma
r-1
7
Jun-1
7
Sep-1
7
De
c-1
7
0.0%
2.5%
5.0%
7.5%
10.0%
12.5%
15.0%
17.5%
20.0%
22.5%
0.0%
1.0%
2.0%
3.0%
4.0%
5.0%
2010 2011 2012 2013 2014 2015 2016 2017
ROE - rhs NIM
Turkey Quarterly Banking & Financial Stability Monitor-March 2018
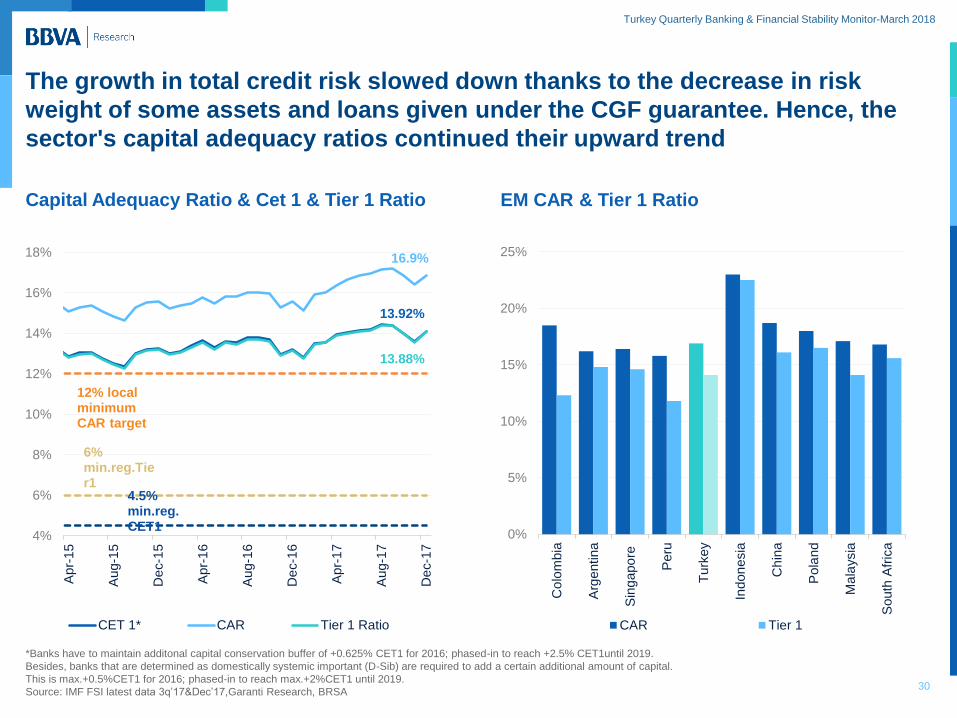
The growth in total credit risk slowed down thanks to the decrease in risk
weight of some assets and loans given under the CGF guarantee. Hence, the
sector's capital adequacy ratios continued their upward trend
30
*Banks have to maintain additonal capital conservation buffer of +0.625% CET1 for 2016; phased-in to reach +2.5% CET1until 2019.
Besides, banks that are determined as domestically systemic important (D-Sib) are required to add a certain additional amount of capital.
This is max.+0.5%CET1 for 2016; phased-in to reach max.+2%CET1 until 2019.
Source: IMF FSI latest data 3q’17&Dec’17,Garanti Research, BRSA
Capital Adequacy Ratio & Cet 1 & Tier 1 Ratio EM CAR & Tier 1 Ratio
16.9%
12% local minimum CAR target
4.5% min.reg. CET1
13.92%
13.88%
6% min.reg.Tier1
4%
6%
8%
10%
12%
14%
16%
18%
Apr-
15
Aug-1
5
De
c-1
5
Apr-
16
Aug-1
6
De
c-1
6
Apr-
17
Aug-1
7
De
c-1
7
CET 1* CAR Tier 1 Ratio
0%
5%
10%
15%
20%
25%
Co
lom
bia
Arg
entina
Sin
gapo
re
Peru
Turk
ey
Indon
esia
Ch
ina
Pola
nd
Ma
laysia
South
Afr
ica
CAR Tier 1
Turkey Quarterly Banking & Financial Stability Monitor-March 2018
External Debt
Indicators
Roll-over Ratios Stand above
100%,
New Regulation on Corporates’
FX loans
Turkey Quarterly Banking & Financial Stability Monitor-March 2018
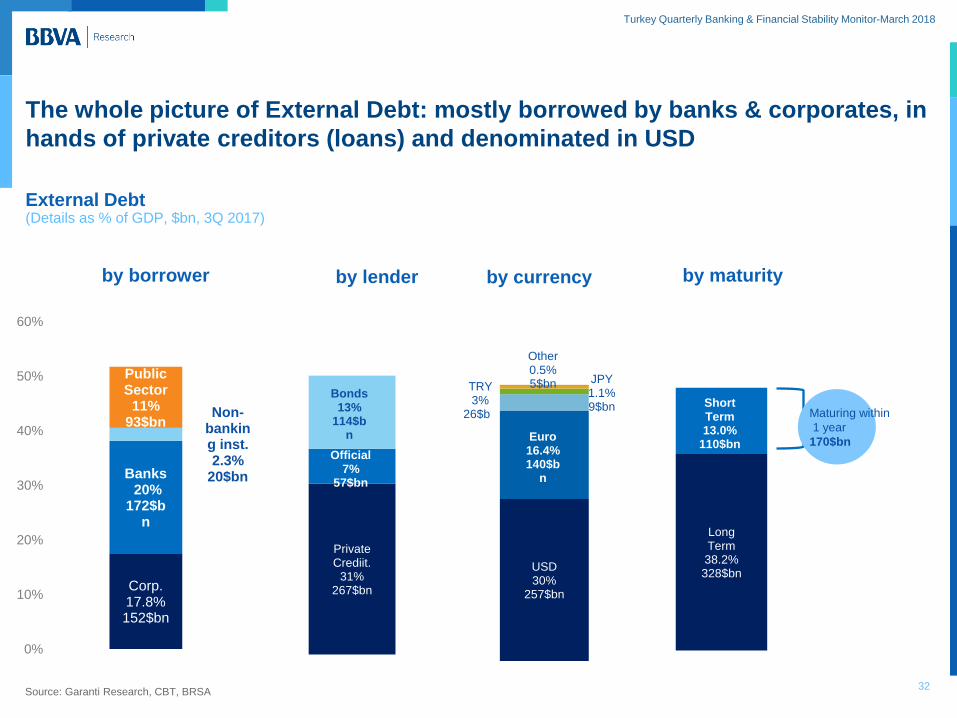
The whole picture of External Debt: mostly borrowed by banks & corporates, in
hands of private creditors (loans) and denominated in USD
32 Source: Garanti Research, CBT, BRSA
External Debt (Details as % of GDP, $bn, 3Q 2017)
Corp. 17.8% 152$bn
Banks 20%
172$bn
Non-banking inst. 2.3%
20$bn
Public Sector
11% 93$bn
0%
10%
20%
30%
40%
50%
60%
by borrower by lender by currency by maturity
Private Crediit.
31% 267$bn
Official 7%
57$bn
Bonds 13%
114$bn
USD 30%
257$bn
Euro 16.4% 140$b
n
TRY 3%
26$bn
JPY 1.1% 9$bn
Other 0.5% 5$bn
Long Term 38.2% 328$bn
Short Term 13.0%
110$bn
Maturing within
1 year
170$bn
Turkey Quarterly Banking & Financial Stability Monitor-March 2018
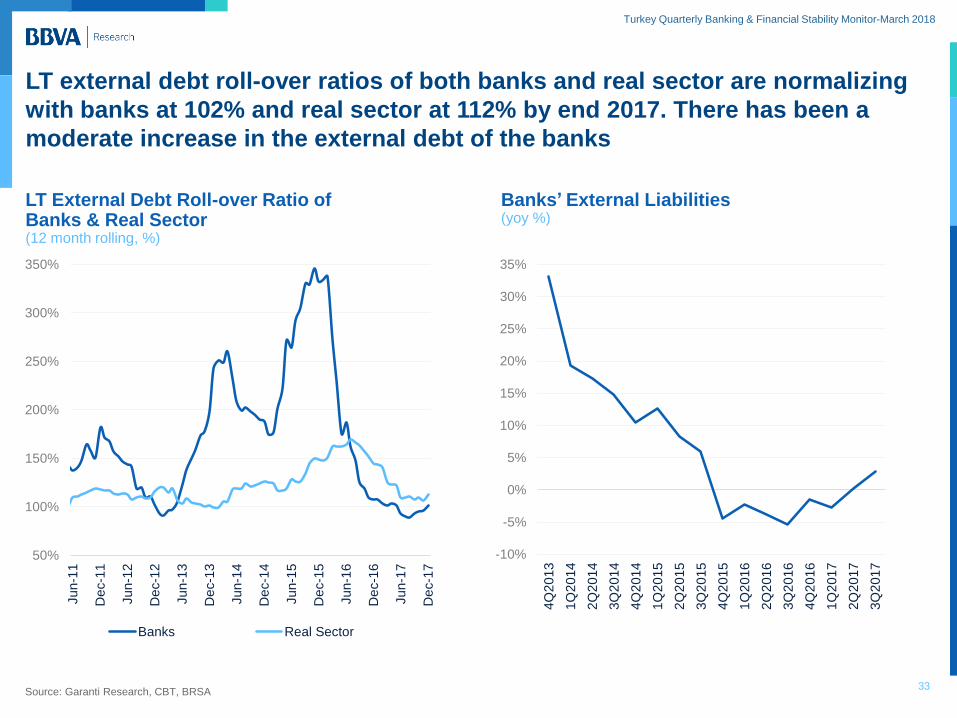
LT external debt roll-over ratios of both banks and real sector are normalizing
with banks at 102% and real sector at 112% by end 2017. There has been a
moderate increase in the external debt of the banks
33 Source: Garanti Research, CBT, BRSA
LT External Debt Roll-over Ratio of Banks & Real Sector (12 month rolling, %)
Banks’ External Liabilities (yoy %)
50%
100%
150%
200%
250%
300%
350%
Jun-1
1
De
c-1
1
Jun-1
2
De
c-1
2
Jun-1
3
De
c-1
3
Jun-1
4
De
c-1
4
Jun-1
5
De
c-1
5
Jun-1
6
De
c-1
6
Jun-1
7
De
c-1
7
Banks Real Sector
-10%
-5%
0%
5%
10%
15%
20%
25%
30%
35%
4Q
2013
1Q
2014
2Q
2014
3Q
2014
4Q
2014
1Q
2015
2Q
2015
3Q
2015
4Q
2015
1Q
2016
2Q
2016
3Q
2016
4Q
2016
1Q
2017
2Q
2017
3Q
2017
Turkey Quarterly Banking & Financial Stability Monitor-March 2018
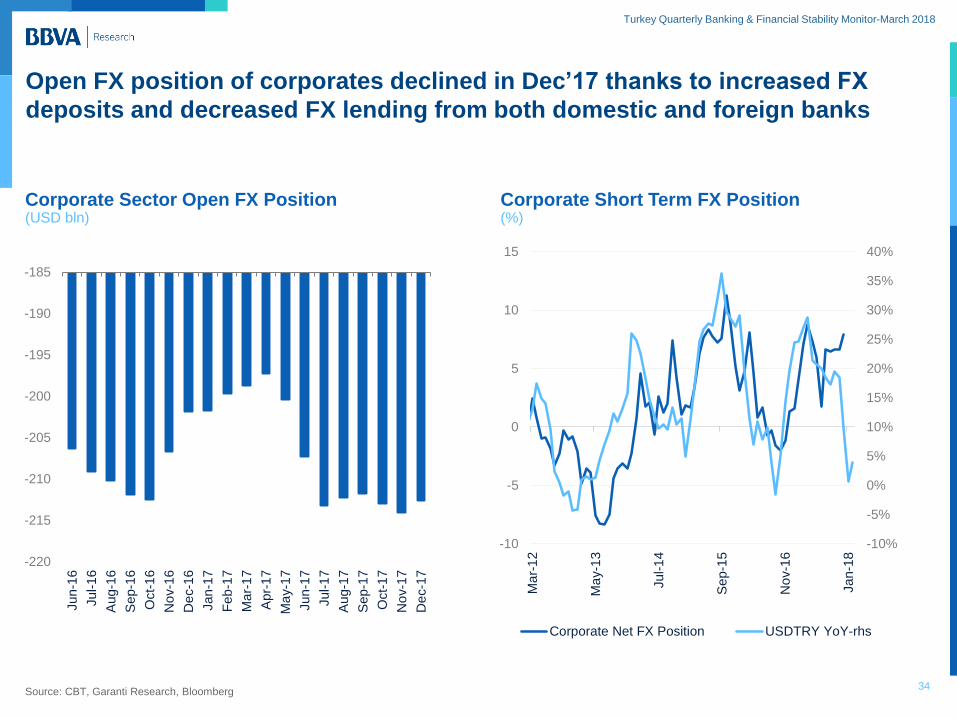
Open FX position of corporates declined in Dec’17 thanks to increased FX
deposits and decreased FX lending from both domestic and foreign banks
34 Source: CBT, Garanti Research, Bloomberg
Corporate Sector Open FX Position (USD bln)
Corporate Short Term FX Position (%)
-10%
-5%
0%
5%
10%
15%
20%
25%
30%
35%
40%
-10
-5
0
5
10
15
Ma
r-1
2
Ma
y-1
3
Jul-1
4
Sep-1
5
No
v-1
6
Jan-1
8
Corporate Net FX Position USDTRY YoY-rhs
-220
-215
-210
-205
-200
-195
-190
-185
Jun-1
6
Jul-1
6
Aug-1
6
Sep-1
6
Oct-
16
No
v-1
6
De
c-1
6
Jan-1
7
Feb
-17
Ma
r-1
7
Apr-
17
Ma
y-1
7
Jun-1
7
Jul-1
7
Aug-1
7
Sep-1
7
Oct-
17
No
v-1
7
De
c-1
7
Turkey Quarterly Banking & Financial Stability Monitor-March 2018
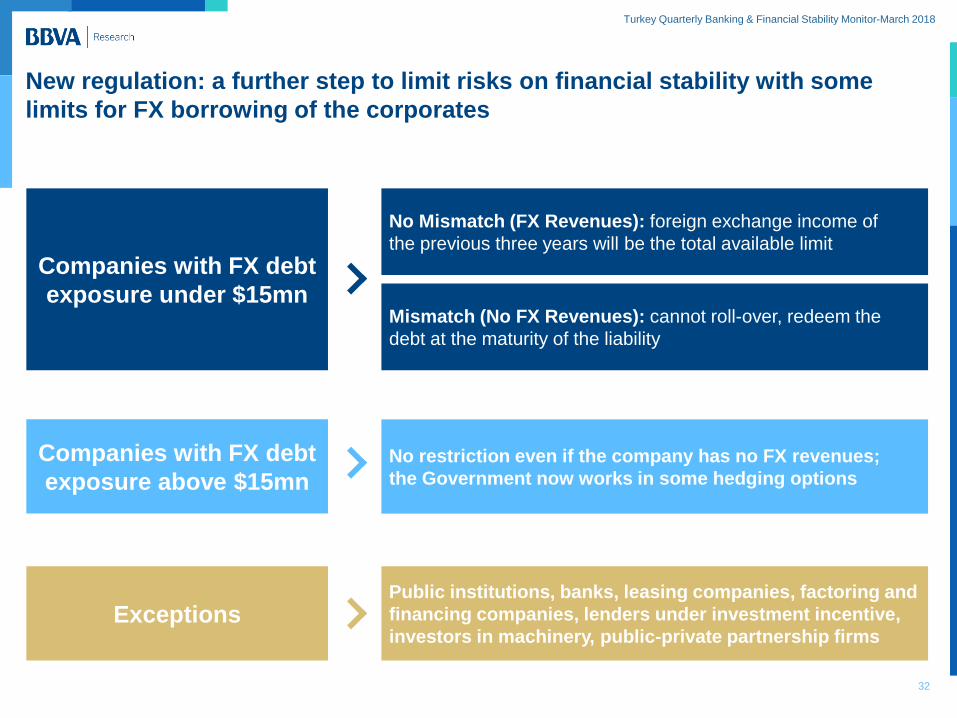
Companies with FX debt
exposure under $15mn
Companies with FX debt
exposure above $15mn
New regulation: a further step to limit risks on financial stability with some
limits for FX borrowing of the corporates
No Mismatch (FX Revenues): foreign exchange income of
the previous three years will be the total available limit
Mismatch (No FX Revenues): cannot roll-over, redeem the
debt at the maturity of the liability
No restriction even if the company has no FX revenues;
the Government now works in some hedging options
Exceptions Public institutions, banks, leasing companies, factoring and
financing companies, lenders under investment incentive,
investors in machinery, public-private partnership firms
32
Turkey Quarterly Banking & Financial Stability Monitor-March 2018
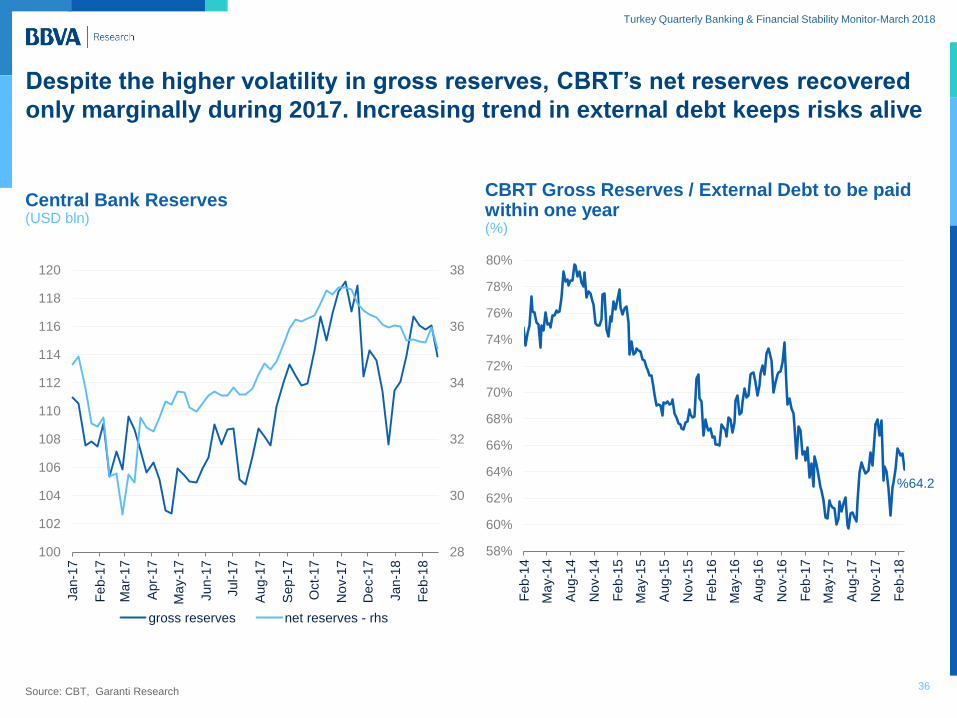
36
Despite the higher volatility in gross reserves, CBRT’s net reserves recovered
only marginally during 2017. Increasing trend in external debt keeps risks alive
Central Bank Reserves (USD bln)
Source: CBT, Garanti Research
CBRT Gross Reserves / External Debt to be paid within one year (%)
28
30
32
34
36
38
100
102
104
106
108
110
112
114
116
118
120
Jan-1
7
Feb
-17
Ma
r-1
7
Apr-
17
Ma
y-1
7
Jun-1
7
Jul-1
7
Aug-1
7
Sep-1
7
Oct-
17
No
v-1
7
De
c-1
7
Jan-1
8
Feb
-18
gross reserves net reserves - rhs
%64.2
58%
60%
62%
64%
66%
68%
70%
72%
74%
76%
78%
80%
Feb
-14
Ma
y-1
4
Aug-1
4
No
v-1
4
Feb
-15
Ma
y-1
5
Aug-1
5
No
v-1
5
Feb
-16
Ma
y-1
6
Aug-1
6
No
v-1
6
Feb
-17
Ma
y-1
7
Aug-1
7
No
v-1
7
Feb
-18
Turkey Quarterly Banking & Financial Stability Monitor-March 2018
This document has been prepared by BBVA Research Department, it is provided for information purposes only and expresses data, opinions or
estimations regarding the date of issue of the report, prepared by BBVA or obtained from or based on sources we consider to be reliable, and have
not been independently verified by BBVA. Therefore, BBVA offers no warranty, either express or implicit, regarding its accuracy, integrity or
correctness.
Estimations this document may contain have been undertaken according to generally accepted methodologies and should be considered as
forecasts or projections. Results obtained in the past, either positive or negative, are no guarantee of future performance.
This document and its contents are subject to changes without prior notice depending on variables such as the economic context or market
fluctuations. BBVA is not responsible for updating these contents or for giving notice of such changes.
BBVA accepts no liability for any loss, direct or indirect, that may result from the use of this document or its contents.
This document and its contents do not constitute an offer, invitation or solicitation to purchase, divest or enter into any interest in financial assets or
instruments. Neither shall this document nor its contents form the basis of any contract, commitment or decision of any kind.
In regard to investment in financial assets related to economic variables this document may cover, readers should be aware that under no
circumstances should they base their investment decisions in the information contained in this document. Those persons or entities offering
investment products to these potential investors are legally required to provide the information needed for them to take an appropriate investment
decision.
The content of this document is protected by intellectual property laws. It is forbidden its reproduction, transformation, distribution, public
communication, making available, extraction, reuse, forwarding or use of any nature by any means or process, except in cases where it is legally
permitted or expressly authorized by BBVA.
DISCLAIMER
34

Turkey: Quarterly Banking &
Financial Stability Monitor
March 2018
Deniz Ergun