tuning ordered pattern of pd species through controlled ...centaur.reading.ac.uk/66600/7/ps peo pd j...
TRANSCRIPT

Tuning ordered pattern of Pd species through controlled block copolymer selfassembly Article
Accepted Version
De Rosa, C., Auriemma, F., Malafronte, A., Di Girolamo, R., Lazzari, M., NietoSuarez, M., HermidaMerino, D., Hamley, I. W. and Portale, G. (2016) Tuning ordered pattern of Pd species through controlled block copolymer selfassembly. Journal of Physical Chemistry B, 120 (27). pp. 68296841. ISSN 15205207 doi: https://doi.org/10.1021/acs.jpcb.6b04380 Available at http://centaur.reading.ac.uk/66600/
It is advisable to refer to the publisher’s version if you intend to cite from the work. See Guidance on citing .
To link to this article DOI: http://dx.doi.org/10.1021/acs.jpcb.6b04380
Publisher: American Chemical Society
All outputs in CentAUR are protected by Intellectual Property Rights law, including copyright law. Copyright and IPR is retained by the creators or other copyright holders. Terms and conditions for use of this material are defined in the End User Agreement .
www.reading.ac.uk/centaur

CentAUR
Central Archive at the University of Reading
Reading’s research outputs online

1
Tuning Ordered Pattern of Pd Species Through
Controlled Block Copolymer Self-assembly
Claudio De Rosa,1 Finizia Auriemma,
1 Anna Malafronte,
1,* Rocco Di Girolamo,
1 Massimo
Lazzari,2 Marina Nieto Suárez,
2 Daniel Hermida-Merino,
3 Ian William Hamley,
4 Giuseppe
Portale5
1Dipartimento di Scienze Chimiche, Universita di Napoli Federico II, Complesso Monte S.
Angelo, Via Cintia, 80126, Napoli, Italy. 2Centro Singular de Investigación en Química
Biolóxica e Materiais Moleculares (CiQUS), Universidade de Santiago de Compostela, Campus
Vida, C/ Jenaro de la Fuente, 15782, Santiago de Compostela, Spain. 3European Synchrotron
Radiation Facility (ESRF), 6 rue Jules Horowitz, BP 220, 38043, Grenoble, Cedex 9, France.
4School of Chemistry, Pharmacy and Food Biosciences, University of Reading, Whiteknights,
Reading RG6 6AD, UK. 5
Macromolecular Chemistry & New Polymeric Materials, Zernike
Institute for Advanced Materials, Nijenborgh 4, 9747 AG Groningen, The Netherlands.
* To whom correspondence should be addressed. Telephone: ++39 081 674309; Fax ++39 081
674090; e-mail: [email protected].

2
ABSTRACT We report a systematic investigation of nanocomposites based on polystyrene-
block-poly(ethylene oxide) copolymers (PS-b-PEO), characterized by selective inclusion of
palladium (Pd) species in the PEO domains. PS-b-PEO samples of different total molecular mass
self-assemble in a cylindrical microphase-separated morphology, where vertically aligned PEO
cylinders with different diameters depending on the molecular mass, are organized in a
hexagonal array of different lateral spacing. The cylindrical nanostructure is maintained after the
selective inclusion of Pd species (Pd-acetate and Pd nanoparticles after reduction of Pd ions of
the salt) in the PEO cylinders, so that the characteristic sizes (diameter and lateral spacing) of the
included Pd species are tuned by the characteristic sizes of the block copolymer template, which
are regulated by the molecular mass. The treatment of the nanocomposites at elevated
temperatures in air removes the polymer matrix and leads to the formation of arrays of PdO
nanoparticles covering a solid support. The pattern of PdO nanoparticles is characterized by
different particles diameters and gap distances, mirroring the pattern and the characteristic
nanodimensions of the parent block copolymers used as template.
INTRODUCTION
Noble-metal nanoparticles (Au, Ag, Pt, Pd) are of substantial interest for various scientific and
technical applications.1-5
Due to the small size effect and extremely large specific surface area,
they exhibit a number of unique optical, electronic and catalytic characteristics compared to bulk
materials. In particular, palladium (Pd) and palladium oxide (PdO) nanoparticles (NPs) synthesis
has gained considerable interest in the last few decades due to their numerous potential
utilizations.3,6-11
Pd NPs, in particular, show high activity and selectivity in numerous catalytic
processes.6-8
Pd is the metal used for the catalytic formation of C-C bonds, one of the most useful
transformations in organic synthesis. Concerning PdO, it has been typically used as catalysts in

3
catalytic combustion of natural gas (methane) 9,10
or liquid-phase oxidation of alcohols with
oxygen.11
For these reasons, since the seventies, a huge variety of homogeneous catalytic
systems based on Pd(II) or Pd(0) have been studied and have become a strategic tool for organic
transformation and total synthesis. Because sustainable development involves the utilization of
reusable catalysts, the search for new catalytic systems to replace existing homogeneous ones is
one important issue.8, 12
In this context, the immobilization of nanoparticles on a solid support is
an interesting alternative since the catalyst can be recycled by simple filtration. Furthermore,
immobilizing nanoparticles onto solid supports can minimize atom-ion leaching from the
particles.8, 12
Palladium has the potential to play a major role in virtually every aspect of the
envisioned hydrogen economy, including hydrogen purification, storage, detection, and fuel
cells.13-14
Palladium is also used as a precoating materials for electroless deposition of copper
used for micro contacts, and many electronic devices, such as resistors, use compositions
containing palladium.
For all these applications, distribution of nanoparticles in a patterned form may be more
suitable and, since the majority of unique nanoparticles properties are highly microstructure-
dependent, forming Pd and PdO arrays on solid supports with a precise control of nanoparticles
dimensions and spacing is an important issue.
In order to fabricate an ordered array of nanoparticles, it is possible to deposit nanoparticles
onto a solid substrate from a solution of nanoparticles. However, a perfect array of nanoparticles
is rarely achieved, particularly over an extended area, because of uncontrolled formation of
defects in the self-assembling process of the nanoparticles induced by the solvent evaporation.15,
16 Alternatively, effective fabrication of a two-dimensional array of nanoparticles on solid

4
substrates has been demonstrated by the utilization of block copolymers in a self-assembled
arrangement.17, 19
A di-block copolymer molecule consists of two polymer chains attached with one end. It can
self-assemble to form a nanoscale structure with a domain spacing that depends on molecular
weight, segment size, and the strength of interaction between the blocks.20-22
A typical
periodicity is in the range of 10-200 nm. In linear AB diblock copolymers, the following four
equilibrium morphologies have been identified in numerous systems: lamellar, hexagonally
packed cylindrical, bicontinuous gyroid, and body-centered cubic, close-packed spherical.20-22
The use of block copolymers trapping nanoparticles has been proposed as a tool to prevent
particles aggregation and produce uniform size nanoparticles.17-19
Advantages arise from the
possibility of inducing long range order in the block copolymers nanostructures and,
correspondingly, in the positioning of nanoparticles. Long-range alignment of nanostructures in
block copolymer films can be obtained through the control of solvent evaporation, using electric
fields or chemical or mechanical patterning.23
Nanodomains of self-assembled BCPs may act as
hosts for sequestering nanofillers producing ordered nanocomposites with different
morphologies,17-19
the size and shape of which may be conveniently tuned by changing the
molecular weights and compositions of the BCPs.24
The key for the engineering of these
materials is the ability to control the final morphology of BCP nanostructures and to achieve a
selective infiltration of nanoparticles in the target nanodomains.
Here, we report a simple method to fabricate arrays of palladium (Pd) species and palladium
oxide (PdO) nanoparticles with tunable dimensions and lateral spacing by using polystyrene-
block-poly(ethylene oxide) copolymers (PS-b-PEO) as both stabilizers for nanoparticles and
templates for controlling their distribution. The volume fraction of PEO blocks in the copolymers

5
has been selected in order to obtain a cylindrical microphase-separated morphology, in which the
PEO blocks form a hexagonal array of cylinders in the PS matrix. Thin films characterized by a
high degree of perpendicular orientation of PEO cylinders over large areas have been obtained.
The cylindrical self-assembled nanostructure formed from PS-b-PEO block copolymers has been
used as host for selectively sequestering a nanoparticles precursor (palladium(II) acetate) in PEO
domains. Then, two different methods have been used to obtain Pd NPs from the precursor in
presence of the BCPs: electron irradiation of the thin films containing the BCPs and palladium
precursor, and reduction in solution by thermal treatment before the preparation of the thin films.
In both cases, highly ordered nanocomposite thin films based on PS-b-PEO matrices and Pd
nanoparticles have been obtained. Furthermore, PdO nanoparticles of improved stability against
aggregation have been obtained onto a solid and conductive support (silicon wafer) by treating
the Pd containing BCP films in air at elevated temperatures. We were able to modulate the
dimensions of Pd nanoclusters and PdO NPs and their inter-distance by using as template two
PS-b-PEO copolymers having different molecular weights of both PS and PEO blocks.
EXPERIMENTAL SECTION
Materials. Two PS-b-PEO copolymers with different molecular mass of both PS and PEO
blocks have been purchased from Polymer Source, Inc. and used without further purification.
The number-average molecular mass of the BCPs are 43.0 Kg mol-1
(MnPS
= 32.0 Kg mol-1
;
MnPEO
= 11.0 Kg mol-1
, polydispersity 1.06) and 136.0 Kg mol-1
(MnPS
= 102.0 Kg mol-1
; MnPEO
= 34.0 Kg mol-1
, polydispersity 1.18). The first PS-b-PEO sample with lower molecular mass
will be denoted as SEO; the second, with higher molecular mass, will be named HSEO (Table 1).
Palladium(II) acetate (Pd(Ac)2) (98 %) and toluene have been purchased from Sigma-Aldrich.
6
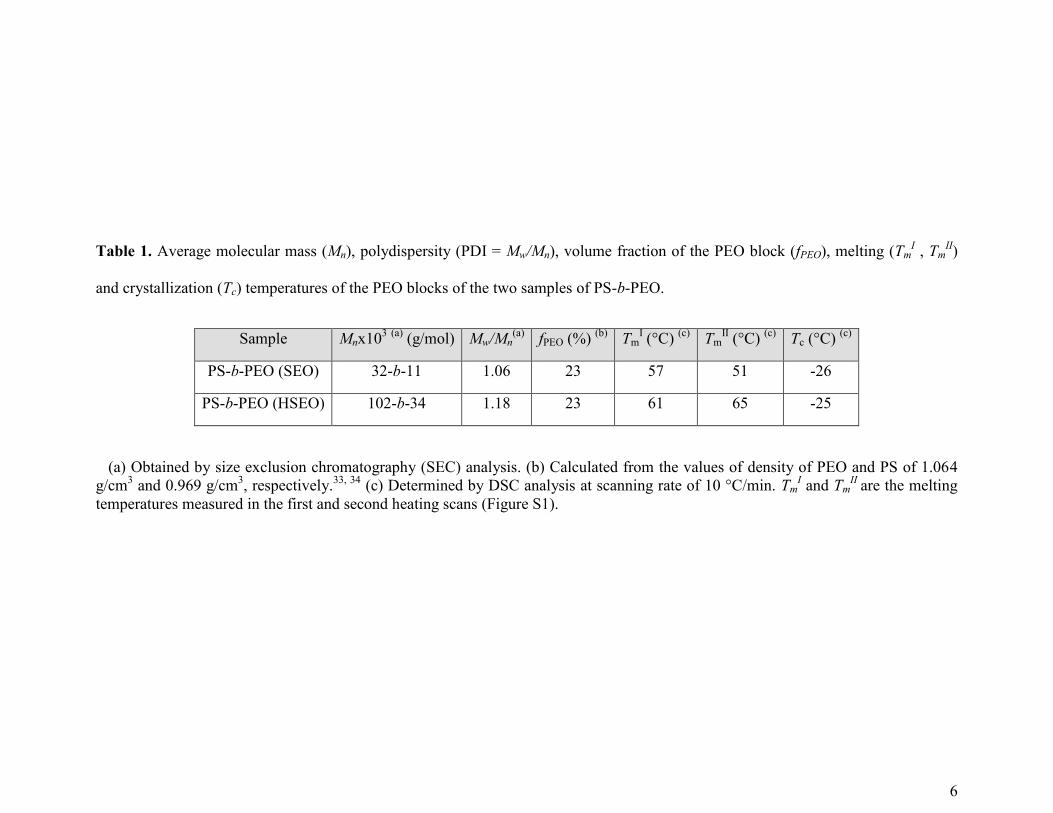
Table 1. Average molecular mass (Mn), polydispersity (PDI = Mw/Mn), volume fraction of the PEO block (fPEO), melting (TmI , Tm
II)
and crystallization (Tc) temperatures of the PEO blocks of the two samples of PS-b-PEO.
Sample Mnx103 (a)
(g/mol) Mw/Mn(a)
fPEO (%) (b)
TmI (°C)
(c) Tm
II (°C)
(c) Tc (°C)
(c)
PS-b-PEO (SEO) 32-b-11 1.06 23 57 51 -26
PS-b-PEO (HSEO) 102-b-34 1.18 23 61 65 -25
(a) Obtained by size exclusion chromatography (SEC) analysis. (b) Calculated from the values of density of PEO and PS of 1.064
g/cm3 and 0.969 g/cm
3, respectively.
33, 34 (c) Determined by DSC analysis at scanning rate of 10 °C/min. Tm
I and Tm
II are the melting
temperatures measured in the first and second heating scans (Figure S1).

7
Characterization of block copolymers. Differential scanning calorimetry (DSC) experiments
have been carried out using a calorimeter Mettler Toledo (DSC-822), calibrated with indium, in a
flowing N2 atmosphere. A scanning rate of 10 °C/min has been used to record the first heating,
cooling and second heating scans. Small- and wide-angle X-ray scattering (SAXS and WAXS)
experiments have been performed at BM26B 25
(DUBBLE) station of the European synchrotron
radiation facility (ESRF), Grenoble, France, with X-ray wavelength of 1.033 Å. The beamline is
particularly suited for SAXS/WAXS experiments on polymers.26
A modified DSC Linkam hot
stage that allows the transmission of X-rays through mica windows has been employed. The
samples have been heated from -50 to 150 °C, then cooled from 150 to -50 °C and finally heated
again to 150 °C. 240 frames have been collected during heating at 5 °C/min (time step/frame
equal to 30 s, corresponding to a change of 2.5 °C per step). The scattering from the empty
sample holder has been subtracted. The thermogravimetric analysis (TGA) has been performed
using a TGA Q5000 IR of TA Instruments, in a 100 ml min-1
N2 flow atmosphere and 10 °C min-
1 heating rate.
Preparation of the nanomaterials. Toluene solutions of HSEO and SEO of 1.5% (w/w)
concentration have been prepared. Pd(Ac)2 has been added into BCP solutions to obtain a
concentration of ≈ 26 and 53 wt% with respect to the BCP, corresponding to mole ratio Pd/PEO
monomeric units equal to 0.20 and 0.40, respectively. The Pd(II) reduction has been performed
by heating the BCP-Pd(Ac)2 solutions at 75 °C or 85 °C under vigorous, continuous stirring until
the color of the solution becomes dark gray. Thin films have been prepared by spin coating
(4000 rpm for 30 s) solutions of neat BCP, solutions of BCP and Pd(Ac)2 immediately after
preparation (BCP-Pd(Ac)2 film) and solution of BCP and Pd(Ac)2 after thermal reduction of
Pd(II) (BCP-PdT film). The oxidative treatments to remove the block copolymer matrix and
8
produce the PdO NPs have been performed by heating the BCP thin films containing Pd species
in air at 600°C for 4 hours.
Thin films characterization. Transmission electron microscopy (TEM) images have been
obtained in bright field mode using a Philips EM 208S TEM with an accelerating voltage of 100
kV. Thin films have been prepared by spin coating the toluene solutions on carbon coated copper
grids. Field emission scanning electron microscopy (FESEM) images have been collected using
Zeiss Ultra Plus field emission SEM (Centro de Apoyo Científico-Tecnológico, Universidade de
Santiago de Compostela), equipped with an Inlens detector and a SE Everhart-Thornley
Secondary Electron Detector, using accelerating voltages of 1.0 or 1.5 kV. The samples for
FESEM observation have been prepared on silicon supports. TEM and FESEM analyses have
been repeated on different regions of the specimens, in order to check that the morphology was
uniform over the macroscopic area of the support. The results have been also confirmed by
repeating the measurements on independent samples. The size and the center-to-center distances
of PEO cylinders and of PdO nanoparticles have been calculated from the corresponding FESEM
images using the ImageJ software (National Institutes of Health, available free of charge at WEB
site rsb.info.nih.gov/ij/). At least 200 independent measurements have been taken in different
locations of the FESEM image of the samples. The measurements have been also confirmed by
repeating the analysis on the FESEM images of independent samples.
Grazing incident wide and small angle X-ray scattering (GIWAXS and GISAXS) experiments
have been performed at station BM26B 25, 26
(DUBBLE) of the European synchrotron radiation
facility (ESRF), Grenoble, France. The samples have been prepared on rectangular (5 x 10 mm)
silicon substrates. For GIWAXS experiments, the employed wavelength and sample-detector
distance have been 1.033 Å and 109.86 mm, respectively. The X-ray incident angle has been set

9
to 0.15° and 0.12° in the case of the BCP nanocomposites containing NPs of Pd species and
support covered by PdO nanoclusters, respectively. For GISAXS experiments, two sample to
detector distances (5 m and 2 m) have been used to acquire data over a large angular range. The
X-ray wavelength of 0.1 nm has been used. GISAXS images have been recorded using a high
sensitive solid state silicon Pilatus P1M detector, with pixel size 172 x 172 microns. The angular
scale and thus the module of the scattering vector q scale (with q = 4πsinθ/λ) have been
calibrated using the diffraction rings from standard silver behenate and rat tail collagen samples.
Images have been recorded at an incident angle of 0.46° (αi > αc), in order to separate the
reflected and the refracted signals. In this approximation, the deviations from the distorted wave
Born approximation (DWBA) with respect to the classical Born approxiamtion (BA) are
minimized. Transverse qy cuts have been calculated at the Yoneda maximum using a Matlab
code and provide in-plane scattering intensity. Best fits for the Pd containing copolymer and for
the PdO sample have been obtained using a unified model introduced originally by Beaucage.27,
28 The possibility to use the unified model for fitting GISAXS data has been discussed in details
in the literature 29, 30
and it has been showed that the model gives realistic results when αi > αc
and the particle diameter is below 15 nm. The thickness of films has been measured with an
Alpha-Step IQ Surface Profiler (KLA TENCOR) by performing at least 5 independent
measurements in different regions of the same sample and over different samples. The relative
error is less than 10%.
UV-Vis spectroscopy. UV-Vis spectra of the solution containing the BCP and palladium
precursor before and after different heating times have been recorded with a JASCO 550 UV-Vis
spectrophotometer. The cell with 1.0 cm path length has been used to record UV-Vis spectra
between 330 and 700 nm. The scan of toluene has been subtracted from the scan of the sample.

10
Spectra have been recorded by adding 2 mL toluene to 1 mL of the initial solution containing 1.5
w/w BCP and 26 wt% Pd(Ac)2 with respect to the BCP.
Suzuki cross-coupling reaction. The thin films of BCP containing Pd species (prepared on
glass substrates) have been placed into a glass flask. A solution of potassium carbonate (414 mg)
in water (2 mL) has been added to a solution of phenylboronic acid (133 mg) and 4-bromanisole
(100 μL) in absolute ethanol (2 mL). The so obtained mixture (total volume 4 mL) has been
added to the glass flask containing the thin films. The system has been heated to reflux by setting
the hotplate temperature to 120 °C. After 1 h, the product has been extracted with
dichloromethane (3 x 10 mL), dried with anhydrous sodium sulfate and concentrated under
vacuum. The obtained solid product has been dissolved in chloroform and analyzed by 1H NMR
using CHCl3 (δ = 7.26 ppm respect to TMS) as internal standard. Test experiments using films of
neat BCP have been also performed as control experiments (vide infra) in Suzuki reaction.
RESULTS AND DISCUSSION
Characterization of block copolymers. We have used two samples of PS-b-PEO block
copolymers, SEO and HSEO, with almost the same composition but different molecular mass of
both PS and PEO blocks (Table 1).
Samples with volume fraction of PEO blocks around 20% have been purposely selected in
order to obtain a cylindrical phase-separated morphology. The PEO block is crystalline with
melting and crystallization temperature of 50-65°C and -25°C, respectively (Table 1, see also
Figure S1 of supporting information). According to literature, the crystallization temperature of
PEO in PS-b-PEO copolymers is lower than that observed in PEO homopolymer (40 °C).31, 32
Wide angle X-ray scattering (WAXS) profiles of the as received SEO and HSEO block
copolymers collected during the first heating scan are reported in Figure 1A and B, respectively.

11
The WAXS profiles at room temperature (curves a of Figure 1A and B) show two distinct peaks
centred at d = 4.6 and 3.7 Å (2θ (λ = 1.033 Å) ≈ 13 and 16°), corresponding to the 120 and 032
planes of the monoclinic form of polyethylene oxide (PEO),35
superposed to an amorphous halo
due to the contribution of amorphous phases of PEO and PS blocks. Increasing the temperature,
the intensity of Bragg peaks decreases, due to gradual melting of PEO crystals, up to disappear at
≈ 60 °C, indicating the complete PEO melting, in agreement with DSC data (curve a and d of
Figure S1).
Small angle X-ray scattering (SAXS) profiles of the as received SEO and HSEO samples,
collected simultaneously to the WAXS data, are reported in Figures 1A’, A’’ and 1B’, B’’,
respectively. In the SAXS profiles recorded at lower temperatures (curves a-c of Figure 1A’ and
B’), the presence of Bragg reflections at values of the scattering vector q = 4πsinθ/λ
corresponding to ratios q/q1 = 1, 41/2
and 121/2
in the case of SEO (Figure 1 A’) and q/q1 = 1 and
71/2
in the case of HSEO (Figure 1 B’) suggests a pseudo-hexagonal arrangements of PEO
cylinders in the PS matrix, in agreement with predictions valid in the strong segregation limit for
BCPs with PEO volume fraction of 20%.36
The SAXS peak positions and the corresponding
domains spacings are reported in Table S1. From the d-spacings values of the first peak q1 it is
possible to determine the center-to-center distance between the PEO cylinders (d1/cos30°), that
results of ≈ 35 nm in the case of SEO copolymer and ≈ 60 nm in the case of HSEO sample in the
hypothesis of hexagonal morphology. As expected, a higher value is obtained in the case of the
HSEO sample, according to the higher copolymer molecular mass.
The peaks of the hexagonal morphology are also visible after the PEO melting at temperatures
higher than 60 °C (curves f and g of Figure 1A’ and curves d-f of Figure 1B’) indicating a phase
separated morphology also in the melt.

12
Figure 1. WAXS (A, B) and SAXS (A’, B’, A’’, B’’) profiles of samples SEO (A-A’’) and
HSEO (B-B’’) recorded at the indicated temperature during the first heating. The arrows in A’
and B’ indicate the peaks at q/q1 ≈ 1, 41/2
, 71/2
, 121/2
typical of the pseudo-hexagonal morphology.
The intensity scale is logarithmic in A’, B’ and is linear in A’’, B’’.

13
At temperatures higher than about 120 °C (curves h-k of Figure 1A’ and k, l of Figure 1B’) the
SAXS peaks disappear indicating a disordered morphology, probably because the order-disorder
transition temperature (TODT) of the samples has been reached. In the case of SEO sample, the
SAXS profiles recorded at temperature higher than 60 °C and lower that TODT (curves f, g of
Figure 1 A’) show only the second order peak at q/q1 = 41/2
of the main reflection at q1 ≈ 0.22
nm-1
due to the increase of packing disorder in the arrangements of PEO cylinders at these
temperatures. In the case of HSEO sample, instead, more defined SAXS peaks are observed at
temperatures lower than TODT and close to the glass transition temperature of PS blocks at ≈ 100-
110 °C (curves h and i of Figure 1B’), suggesting an improvement of the hexagonal morphology
in the melt.
The relative intensity of the main Bragg peak at q1 ≈ 0.20 nm-1
for SEO and 0.12 nm-1
for HSEO
decreases with increasing temperature especially upon melting of PEO crystals due to decrease
of contrast (Figure 1 A’’, B’’).
WAXS and SAXS profiles collected during the cooling from the melt and successive second
heating are reported in Figures S2 and S3, respectively. Only the first order reflection peaks are
observed (q = 0.18 and 0.12 nm-1
for SEO and HSEO, respectively) during cooling (Figure S2),
indicating that a not well defined morphology is obtained by cooled from the isotropic melt at a
cooling rate of 5 °C/min.
From the SAXS data collected during the first heating, cooling and second heating scans we
have evaluated the reduced scattering invariant Q defined as :
max
min
2
2)(
2
1q
q
dqqqIQ
with I(q) the scattered intensity and qmin and qmax the minimum and maximum values of the
scattering vector scanned at low angle. For a biphasic system this parameter is proportional to the

14
contrast and to the product of the volume fraction of the two phases. The so obtained Q values
and corresponding first derivative are reported in Figures 2A, B and A’, B’, respectively, as a
function of the temperature.
Figure 2. Reduced scattering invariant (Q) as a function of temperature (A, B) and
corresponding first derivative (A’, B’) for the samples SEO (A, A’) and HSEO (B, B’) calculated
from the SAXS data collected during the first heating (a), the cooling (b) and the second heating
(c) scans.

15
A drop of Q during the first heating (curves a of Figure 2) is observed at ≈ 60 °C for both SEO
and HSEO confirming that the decrease of intensity in SAXS profiles is due to the PEO melting.
Similarly, a steep increase crease of Q occurs during cooling at T ≈ -30 °C (curves b of Figure 2)
due to PEO crystallization, followed by a new steep decrease during second heating at T ≈ 40 °C
(curves c of Figure 2) due to PEO second melting.
It is worth noting that the value of the reduced scattering invariant relative to the first heating
scan of HSEO (curve a of Figure 2B) shows a shoulder at ≈ 80-90 °C, that is at temperatures
slightly lower than the ordering process occurring at ≈ 100-110 °C (curves h and i of Figure
1B’). This indicates that, after melting of PEO crystals, the ordering process of the nanostructure
occurs only after relaxation of the amorphous PS domains at Tg.
Thin films of neat BCPs and BCP nanocomposites containing Pd precursor. Thin films of
neat SEO and HSEO have been prepared by spin-coating dilute solutions (1.5 wt%) of block
copolymers in toluene. Representative FESEM images are reported in Figure 3A and B,
respectively. The dark regions correspond to PEO nanodomains and the bright regions to the PS
phase. The images denote phase separation in which the PEO blocks form a hexagonal array of
perpendicular cylinders in the PS matrix.
The distributions of diameters (D) and center-to-center distances (dc-c) of PEO cylinders are
reported in the Figure 3C and D, respectively. Sample SEO shows narrower distributions of size
and distances of PEO cylinders than those of HSEO copolymer (Figure 3). The average cylinders
diameters are DSEO ≈ 16 ± 5 nm and DHSEO ≈ 36 ± 9 nm (Figure 3C), and the average cylinder
spacings are dc-c(SEO) 37 ± 4 nm and dc-c(HSEO) 74 ± 10 nm (Figure 3D), in good agreement
with the d values estimated for bulk samples from SAXS data.

16
Figure 3. FESEM images of thin films (≈ 47 nm tick) of neat samples SEO (A) and HSEO (B),
prepared by spin coating toluene solutions of BCP (1.5wt%) on silicon wafers, and distribution
of the values of diameters D (C) and of the center-to-center distances dc-c (D) of PEO cylinders in
SEO and HSEO.
Therefore the use of the two different block copolymers with different molecular mass allows
controlling the size of the cylindrical domains and domain spacing. The perpendicular
orientation of PEO cylinders in both samples (Figure 3) is due both to the high solvent
evaporation rate used during the spin-coating process37,38
and the comparable thickness of the
thin films (≈ 47 nm) with the domain spacing of both SEO (dc-c ≈ 37 ± 4 nm) and HSEO (dc-c ≈
74 ± 10 nm) copolymers (Figure 3D).22

17
Nanocomposites of BCPs containing palladium nanoparticles have been prepared by using
Pd(II) acetate as precursor of Pd NPs. Thin films of BCPs containing Pd(Ac)2 have been
prepared by spin coating of toluene solutions of the BCP (1.5 wt% of BCP) and Pd(Ac)2 (53 wt%
Pd(Ac)2 with respect to the BCPs, corresponding to mole ratio Pd/PEO monomeric units equal to
0.40).
Representative TEM and FESEM images of thin films of these nanocomposites for SEO and
HSEO samples are reported in Figure 4. TEM grids have been observed without resorting to any
staining procedure. Therefore, the high contrast between the dark PEO cylinders and the light PS
matrix (Figure 4A, B) indicates that the palladium species are not uniformly dispersed in the
whole BCP, but they are selectively included in the PEO domains. The palladium precursor,
indeed, due to its hydrophilic nature, preferentially interacts with hydrophilic PEO blocks of the
BCPs, already in the initial solution. This is confirmed by FESEM images (Figure 4A’,B’) where
the palladium species, selectively included in the PEO domains, appear brighter due to elevation.
The diameter D and the center-to-center distances dc-c of PEO cylinders loaded with Pd species
of Figure 4 are D = 17 ± 5 and dc-c = 35 ± 9 nm for SEO (Figure 4A, A’), and D = 37 ± 4 and dc-c
= 75 ± 10 nm for HSEO (Figure 4B, B’). Furthermore, whereas PEO cylinders loaded with
Pd(Ac)2 are oriented vertically to the substrate in HSEO (Figure 4B, B’), they are oriented both
vertically and parallel to the substrate in SEO (Figure 4A, A’).

18
Figure 4. Bright-field TEM (A, B) and FESEM (A’,B’) images of thin films (≈ 50 nm thick) of
BCP-Pd(Ac)2 nanocomposites prepared by spin-coating toluene solutions of samples SEO (A,
A’) or HSEO (B,B’) and Pd(Ac)2 (53 wt% of Pd(Ac)2 with respect to the BCP). No staining
procedure has employed before the TEM observation.
The thickness of the films containing the palladium precursor (≈ 50 nm) (Figure 4) is
comparable with the domain spacing of both HSEO and SEO copolymer (dc-c = 35 ± 9 and 75 ±
10 nm, respectively). Therefore a perpendicular orientation of PEO cylinders is expected in both

19
cases.22
However, the less aligned morphology in SEO-Pd nanocomposites may not be due to the
smaller diameter of PEO cylinders (D ≈ 16 ± 5 nm and ≈ 36 ± 9 nm for neat SEO and HSEO,
respectively) (Figure 3C). In fact the TEM images of BCP-Pd(Ac)2 nanocomposites obtained
using a lower Pd(Ac)2 concentration in solutions (26 wt% with respect to the block copolymers,
corresponding to mole ratio Pd/PEO monomeric units equal to 0.20) (Figure S4) reveal that also
in this case the morphology in the case of SEO (Figure S4A) contains PEO cylinders in the
mixed parallel and perpendicular orientation to the substrate. This indicate that the less ordered
vertical orientation in the low molecular mass sample SEO may be due to the fact that the
segregation strength of PS and PEO domains is not high enough to prevent diffuse interphases at
boundaries of interconnected phases domains. For the sample HSEO the high molecular mass
gives high the segregation strength and prevents interpenetration.
A different route for fabrication of BCP/Pd species nanocomposites has been also tried,
consisting in dipping the thin films of neat BCPs in Pd(Ac)2 solutions with different
concentrations for different amount of time. Preliminary data (not shown) indicate inclusion of
palladium species in PS domains.
It is worth noting that the electron-irradiation during TEM and FESEM observations can
induce the reduction of Pd(II) salt into Pd(0) and possibly consequent formation of Pd
nanoparticles. In this way, Pd NPs are obtained in the films but only in a very small area (the
observed region). Therefore, a facile route to synthesize BCP based nanocomposites
characterized by selective inclusion of Pd NPs in specific domains has been identified, consisting
in the dispersion of a Pd salt in a solution in presence of BCPs, preparation of the thin films and
successive electron irradiation.

20
BCP nanocomposites with Pd nanoparticles. An alternative and more efficient route to
prepare BCP nanocomposites containing Pd NPs has also been used. After addition of Pd(Ac)2 to
the BCPs solutions, the mixtures have been heated at 75 °C in a water bath under vigorous and
continuous stirring. The yellow color of the initial solution becomes brown and finally gray dark,
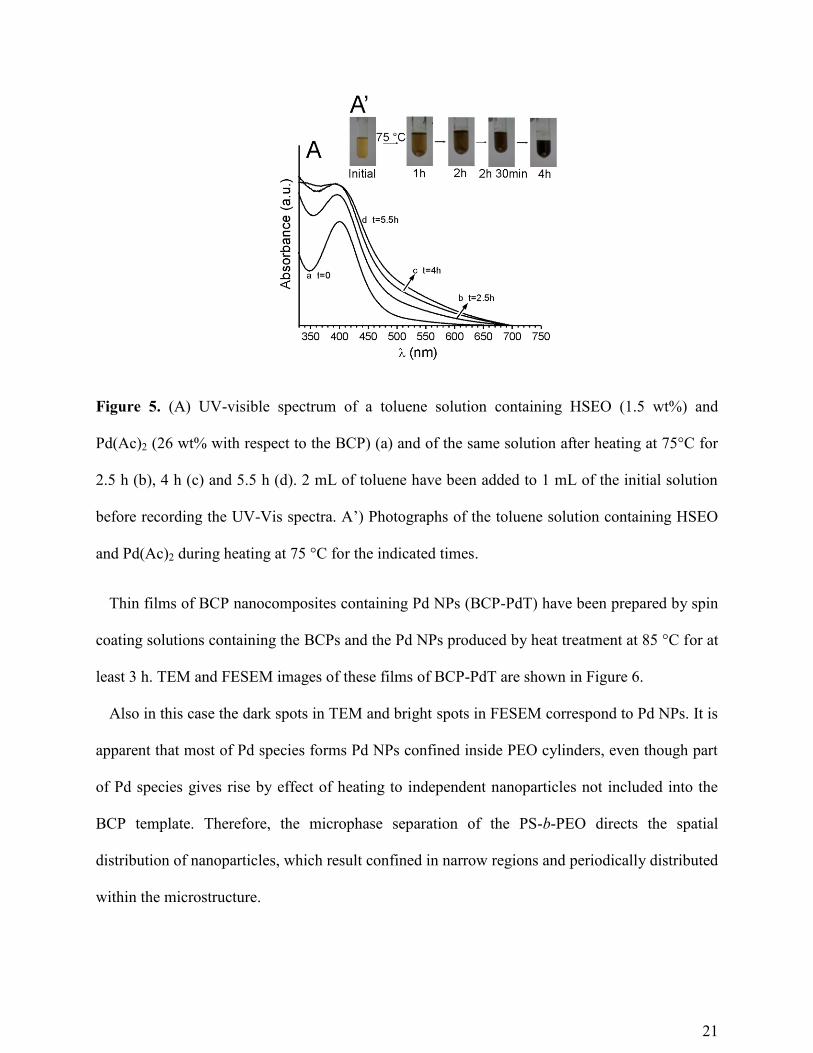
indicating the formation of Pd NPs (Figure 5A’).
The reduction of Pd(II) ions to Pd(0) has been followed by recording UV-visible spectra of the
solution before and after during heating at 75 °C (Figure 5A). The initial toluene solution (1 mL)
containing the BCP (1.5 wt%) and the palladium precursor (26 wt% with respect to BCP) has
been diluted by adding 2 mL of toluene and then UV-Vis spectra of Figure 5A have been
recorded. The initial solution shows absorption maximum at around 400 nm, which is
characteristic of Pd(II) ions (curve a of Figure 5A). The peak completely disappears after around
5h heating at 75 °C (curve d of Figure 5A), and no new plasmon absorption maximum are
shown, in good agreement with the complete conversion of Pd(II) to Pd(0) species. Therefore,
heating of the solution containing the BCP and the palladium precursor results in the direct
formation of Pd(0) species in presence of BCP before thin film preparation. Since data of Figure
4 have indicated infiltration of Pd(Ac)2 into PEO cylinders, the reduction of Pd(II) species to
Pd(0) occurs into PEO cylinders and, according to the literature,39, 40
leads, in presence of PEO,
to formation of nanoparticles. This process is assisted by PEO chains, which, in absence of other
chemical agents, may act both as reducing agent and stabilizer, preventing aggregation.
The required reaction time depends on the temperature, as demonstrated in Figure S5 that
shows from the color of the solutions heated at 75 and 85°C a lower reaction time needed at
higher temperature.
21
Figure 5. (A) UV-visible spectrum of a toluene solution containing HSEO (1.5 wt%) and
Pd(Ac)2 (26 wt% with respect to the BCP) (a) and of the same solution after heating at 75°C for
2.5 h (b), 4 h (c) and 5.5 h (d). 2 mL of toluene have been added to 1 mL of the initial solution
before recording the UV-Vis spectra. A’) Photographs of the toluene solution containing HSEO
and Pd(Ac)2 during heating at 75 °C for the indicated times.
Thin films of BCP nanocomposites containing Pd NPs (BCP-PdT) have been prepared by spin
coating solutions containing the BCPs and the Pd NPs produced by heat treatment at 85 °C for at
least 3 h. TEM and FESEM images of these films of BCP-PdT are shown in Figure 6.
Also in this case the dark spots in TEM and bright spots in FESEM correspond to Pd NPs. It is
apparent that most of Pd species forms Pd NPs confined inside PEO cylinders, even though part
of Pd species gives rise by effect of heating to independent nanoparticles not included into the
BCP template. Therefore, the microphase separation of the PS-b-PEO directs the spatial
distribution of nanoparticles, which result confined in narrow regions and periodically distributed
within the microstructure.

22
Figure 6. Bright-field TEM (A, B) and FESEM (A’, B’) images of thin films (≈ 60 nm thick) of
BCP-PdT nanocomposites prepared by spin-coating a toluene solution of samples SEO (A,A’) or

23
HSEO (B,B’) and Pd NPs and distribution of the values of diameters D (C) and of the center-to-
center distances dc-c (D) of PEO cylinders containing Pd NPs in SEO and HSEO. The Pd NPs
have been prepared by heating at 85°C a 1.5 wt% toluene solution of SEO (A, A’) and HSEO (B,
B’) containing Pd(Ac)2 (≈ 53 wt% with respect to the BCP) resulting in the reduction of Pd(II)
ions in solution. No staining procedure has employed before the TEM observation.
To confirm the BCPs role in directing the distribution of NPs, we have repeated the same
procedure for preparation of BCP nanocomposites of Figure 6 using a PEO homopolymer
(molecular mass 20000) as polymeric matrix. In this case, only large Pd aggregates are formed,
as shown by TEM image of Figure S6.
The distribution of diameters (D) and center-to-center distances (dc-c) of PEO domains,
evaluated from FESEM images of Figure 6A’ and B’, are reported in Figure 6C and D,
respectively. The average PEO-Pd cylinder diameters and the average center-to-center distances
of PEO domains are DSEO ≈ 17 ± 4, DHSEO ≈ 40 ± 10 nm (Figure 6 C), and dc-c(SEO) ≈ 35 ± 5 nm,
dc-c(HSEO) ≈ 75 ± 10 nm (Figure 6 D), similar to those obtained in the case of neat BCPs (Figure
3C and D). Moreover, for HSEO larger distributions are obtained for both the diameters and
center-to-center distances (Figure 6 C, D).
The use of the BCPs with different chain lengths has allowed controlling the dimensions and
the distances between PEO cylinders and, consequently, to obtain BCP-PdT nanocomposites
characterized by Pd nanoclusters placed in domains of controlled average size and distances,
similar to those of parent BCP nanostructures.
The effective presence of Pd(0) NPs has been probed using our BCP-PdT nanocomposites as
catalyst for palladium-catalyzed Suzuki cross-coupling reaction of an aryl halide (4-
bromoanisole) with phenylboronic acid (Scheme 1).

24
Scheme 1. Reaction between the 4-bromoanisole and the phenylboronic acid, catalyzed by Pd
NPs in the presence of a base (potassium carbonate).
Figure 7. 1H NMR spectrum of the mixture obtained after 1 h reaction of scheme 1 between the
4-bromoanisole and the phenylboronic acid in presence of thin films of BCP-PdT (a) and neat
BCP (b). The signal at 6.95 ppm (Ha’) confirms the presence of the product of Suzuki reaction.
The signal at 6.75 ppm (Ha) is due to the proton of unreacted 4-bromoanisole. CHCl3 (δ = 7.26
ppm respect to TMS) has been used as internal standard.
The reaction of Scheme 1 has been carried out placing the thin film of BCP-PdT
nanocomposite (prepared on a glass substrate) into a flask containing the solvent ethanol/water
and the others reagents (4-bromoanisole, phenylboronic acid and the base potassium carbonate,
see experimental part for details). The thin films of BCP-PdT nanocomposite used for the
reaction have been washed with the same solvent used for the reaction (1/1 volume ratio
ethanol/water) for 2-3 times before immersing the substrate into reaction flask.

25
The 1H NMR spectrum of the solid product obtained after 1 h reaction is reported in Figure 7
(curve a). The NMR signal at 6.9 ppm confirms the presence of the Suzuki reaction product,
giving an indirect proof of the presence of Pd NPs in our thin films. We have verified that use of
thin film of neat BCP does not give Suzuki cross-coupling reaction under the same reaction
conditions used for the BCP-PdT substrate (curve b of Figure 7).
Preparation of PdO nanoparticles onto silicon substrates. Thin films of BCP-PdT
nanocomposites containing SEO or HSEO and Pd nanoparticles (Figure 6), prepared on silicon
substrates, have been heated at 600 °C in air for 4 h. The thermogravimetric analysis (TGA) of
the HSEO block copolymer (Figure S7) shows that at ≈ 460 °C degradation of the BCP is almost
complete. This indicates that the 600°C heat treatment of BCP-PdT nanocomposites produces
complete removal of the polymeric matrix. At this temperature, the formation of PdO
nanoparticles is also expected.41,42
Therefore, the treatment of our BCP-PdT nanocomposites
leaves PdO nanoparticles on the solid and conductive support.
FESEM images of the so obtained silicon supports covered by PdO NPs are reported in Figure
8A, B. The distribution of the size (S) and center-to-center distance (dc-c) of the so obtained PdO
NPs are reported in Figure 8C and D, respectively.
The average size S and the average center-to-center distance dc-c of PdO NPs are S 17 ± 5 nm
and dc-c 37 ± 9 for the PdO nanoparticles obtained after the removal of the polymeric matrix
SEO, and S 34 ± 9 nm and dc-c 74 ± 12 nm for the PdO nanoparticles obtained using the
HSEO block copolymer as template (Figure 8 C,D). The obtained values well match the average
diameters and the center-to-center distances of the corresponding PEO cylinders in the BCPs
used as template (Figure 3) and in the corresponding nanocomposites (Figure 6). Therefore, after

26
the polymer removal the resulting PdO NPs maintain the same size and spacing of the PEO
cylinders in the parent block copolymers (Figure 3).
Figure 8. FESEM images of PdO nanoparticles on silicon wafers obtained after the oxidative
treatment at 460 °C of thin films of BCP-PdT nanocomposites of Figure 6 containing Pd NPs
into PEO cylinders of SEO (A) and HSEO (B). The surface coverage is 562 and 245
nanoclusters/µm2
in the case of PdO nanoclusters obtained by using SEO and HSEO as template,
respectively. Distribution of the values of the size S (C) and of the center-to-center distance dc-c
(D) of the obtained PdO NPs using SEO and HSEO as template.
These data indicate that the use of the two BCPs with different chain lengths allows controlling
the dimensions and the distances between microdomains and, consequently, obtaining arrays of

27
PdO NPs on a solid support characterized by tailored NPs diameter and gap distance, mirroring
the pattern and the characteristic nanodimensions of the parent block copolymer template.
The presence of metallic Pd in our BCP-PdT nanocomposites and PdO NPs on the silicon
support after removal of BCP has been confirmed by grazing incidence wide angle scattering
(GIWAXS) experiments. Two dimensional GIWAXS images of our HSEO-PdT nanocomposite
and silicon supports covered by PdO NPs obtained after the heat treatment are reported in Figure
S8. The corresponding intensities read along the vertical cuts (indicated by red lines in Figure
S8) are reported in Figure 9.
Figure 9. Vertical GIWAXS profiles of thin films of HSEO-PdT nanocomposite (a) and of PdO
NPs on the silicon support (b). Profiles have been obtained from cuts of the bidimensional
GIWAXS pattern of Figure S8 taken along the vertical red lines. q is the modulus of the
scattering vector, q = 4π sinθ/λ with λ = 1.033 Å the used radiation wavelength and θ the halved
angle between the incident and the scattered beam in the vertical direction.
A reflection peak is visible at q ≈ 31 nm-1
(curve a of Figure 9), corresponding to the 200
reflection of Pd at d ≈ 0.20 nm.
43 The absence of 111 reflection of Pd at q ≈ 28 nm
-1 (d ≈ 0.22
nm) and the uniform intensity of 200 reflection along a circle in the bi-dimensional pattern of

28
Figure S8A indicate that Pd crystals lay with the 200 plane parallel to the silicon support. In the
GIWAXS profile of silicon supports covered by PdO nanoparticles (curve b of Figure 9), the
002, 101, 110 and 112 reflection peaks of PdO at d ≈ 0.27, 0.26, 0.22 and 0.17 nm are clearly
apparent. They correspond to the most intense reflections of tetragonal crystals of PdO in the
sampled range.44
The uniform intensity distribution of the reflection along circles in Figure S8B
indicates that the orientation of PdO nanocrystals is random.
The morphologies of thin films of neat HSEO, and nanocomposites HSEO-Pd(Ac)2, HSEO-
PdT and PdO NPs on the silicon support have also been investigated via Gracing Incidence
Small Angle X-ray scattering (GISAXS). GISAXS image of the HSEO thin film (Figure 10A) is
in agreement with cylindrical morphology and vertically oriented cylinders, with average lateral
cylinder-cylinder distance of 77 nm, calculated using the Bragg law from the maximum in the qy
cut located at q = 0.082 nm-1
(Figure 10 D). This value is in excellent agreement with FESEM
data (Figure 3B). Incorporation of the PdAc2 and Pd NPs inside the PEO domains for the
samples HSEO-Pd(Ac)2 (Figure 10 B) and HSEO-PdT (Figure 10 C) causes an increase of the
scattering intensity. At low angles, the signal related to the inter-cylinder spacing is now less
clear due to the increased disorder in the nanocomposites including Pd species (compare Figures
3B, 4B,B’ and 6B,B’). At high in-plane angles (qy > 0.2 nm-1
), the scattering of the HSEO-PdT
sample is dominated by the signal from the Pd NPs. Assuming that the NPs are spherical in
shape, the data can be fitted using a unified model adapted to the GISAXS geometry.27-29
The
average dimension for the Pd NPs inside the PEO domains as calculated from the unified model
is 4 nm. GISAXS data for the PdO particles obtained by heat treatment at 600 °C are in
agreement with scattering from PdO nanoparticles supported on the Si substrate with tendency to
assemble in larger aggregates, as denoted by excess of scattering in the low angle region. The

29
average PdO NPs lateral dimension calculated by the unified model fit is about 8 nm, whereas
the average dimension for the PdO aggregates is about 27 nm, in good agreement with FESEM
results (Figure 8C).
Figure 10. GISAXS images of thin films of neat HSEO (A), HSEO-Pd(Ac)2 (B) and HSEO-PdT
(C) and corresponding horizontal GISAXS profiles for HSEO, HSEO-PdAc2, HSEO-PdT and
PdO on silicon (D). Bi-dimensional GISAXS image of PdO is reported in Figure S9. Profiles in
D have been obtained from cuts of the images taken at the Yoneda peak height. The same
incident angle αi = 0.46° (>> αc) has been used for all the samples. Solid lines represent the best
fits.

30
CONCLUSIONS
In this work we have reported a simple and cost effective process for the pattering of a thin
film surface with Pd NPs and for tuning the characteristic size (diameter and lateral spacing) of
Pd nanoclusters and PdO nanoparticles on solid supports. We have selected two samples of PS-
b-PEO block copolymers having different molecular mass as templates, because of the favorable
interaction of PEO blocks with the salt Pd(Ac)2 used as precursor of Pd species. Pd nanoparticles
have been produced by reduction of Pd(II) ion in the presence of BCPs, without disturbing the
regular microdomain structure of block copolymers. The resulting nanocomposite thin films
show the metal Pd nanoparticles selectively included in cylindrical PEO nanodomains, with a
nanoclusters average diameter and gap distance mirroring the parent BCP used as template. The
treatment of the nanocomposites at elevated temperatures in air removes the BCP matrix and
leads to the formation of arrays of PdO NPs covering a solid support. The average diameter and
the center-to-center spacing are still maintained. This work confirms that the ability to control
the length, the spatial distribution and orientational organization of block-copolymer
morphologies makes these materials particularly attractive as scaffolds for engineering of
ordered nanocomposites in which the distribution of the guest particles is guided by the ordering
of the host matrix. The ability to create morphologically and dimensionally controlled Pd and
PdO nanoparticles would be the key point in the process of transforming these systems from
promising materials into integrated devices and the compatibility of these systems with the
existing silicon-based technology makes them even more attractive.
ASSOCIATED CONTENT
Supporting Information. DSC curves of block copolymers. Table listing SAXS peak positions
and d-spacings observed in the SAXS profiles of block copolymers recorded during heating.

31
WAXS and SAXS profiles of block copolymers recorded during cooling from the melt and
during the second heating after crystallization from the melt. TEM images of thin films of BCP-
Pd(Ac)2 nanocomposites prepared by spin-coating toluene solutions of samples SEO or HSEO
and Pd(Ac)2 at concentration of 26 wt% of Pd(Ac)2 with respect to the BCP. Photographs of the
initial toluene solution containing HSEO and Pd(Ac)2 and of the same solution after heating at
75 °C and 85 °C. TEM image of thin films of PEO-Pd nanocomposites. TGA curve of the HSEO
block copolymer. Two dimensional GIWAXS pattern of thin films of HSEO-PdT
nanocomposites and of silicon support covered by PdO NPs. Bi-dimensional GISAXS image of
PdO on silicon support. This material is available free of charge via the Internet at
http://pubs.acs.org.
AUTHOR INFORMATION
Corresponding Author
*E-mail: [email protected]. Phone: ++39081674309.
Notes
The authors declare no competing financial interest.
ACKNOWLEDGMENT
Financial support from the Ministero dell’Istruzione, dell’Universita e della Ricerca of Italy
(FIRB project, Design of nano-heterogeneous materials for solar energy conversion) is gratefully
acknowledged. M.L. and M.N.S. thank the financial support by the Spanish Ministerio de
Educación, Cultura y Deporte (MAT2012-36754-C02-01) and the Xunta de Galicia (GRC2013-
044 FEDER funds). We thank Prof. Francesco Ruffo and Dr. Matteo Lega of the University of
32
Naples Federico II for the assistance in performing the Suzuki cross-coupling experiments and
for the useful discussion.
REFERENCES
(1) Altavilla, C.; Ciliberto, E. Inorganic nanoparticles: synthesis, applications, and
perspectives; CRC Press: Boca Raton, FL, 2011.
(2) Liao, J.; Blok, S.; van der Molen, S. J.; Diefenbach, S.; Holleitner, A. W.; Schönenberger,
C.; Vladyka, A.; Calame, M. Ordered nanoparticle arrays interconnected by molecular linkers:
electronic and optoelectronic properties. Chem. Soc. Rev. 2015, 44, 999-1014.
(3) Langhammer, C.; Yuan, Z.; Zoric, I.; Kasemo, B. Plasmonic properties of supported Pt and
Pd nanostructures. Nano Lett. 2006, 6, 833-838.
(4) Deng, W.; Goldys, E. M. Chemical sensing with nanoparticles as optical reporters: from
noble metal nanoparticles to quantum dots and upconverting nanoparticles. Analyst 2014, 139,
5321-5334.
(5) Guidez, E. B.; Aikens, C. M. Quantum mechanical origin of the plasmon: from molecular
systems to nanoparticles. Nanoscale 2014, 6, 11512-11527.
(6) Balanta, A.; Godard, C.; Claver, C. Pd nanoparticles for C-C coupling reactions. Chem.
Soc. Rev. 2011, 40, 4973-4985.
(7) Nicolaou, K. C.; Bulger, P. G.; Sarlah, D. Palladium-catalyzed cross-coupling reactions in
total synthesis. Angew. Chem. Int. Ed. 2005, 44, 4442-4489.
(8) Astruc, D.; Lu, F.; Aranzaes, J. R. Nanoparticles as recyclable catalysts. The frontier
between homogeneous and heterogeneous catalysis. Angew. Chem. Int. Ed. 2005, 44, 7852-7872.

33
(9) Ozawa, Y.; Tochihara, Y.; Nagai, M.; Omi, S. PdO/Al2O3 in catalytic combustion of
methane: stabilization and deactivation. Chem. Eng. Sci. 2003, 58, 671-677.
(10) McCarty, J. G. Kinetics of PdO combustion catalysis. Catal. Today 1995, 26, 283-293.
(11) Stuchinskaya, T. L.; Kozhevnikov, I. V. Liquid-phase oxidation of alcohols with oxygen
catalysed by modified palladium(II) oxide. Catal. Commun. 2003, 4, 417-422.
(12) Shendage, S. S.; Patil, U. B.; Nagarkar, J. M. Electrochemical synthesis and
characterization of palladium nanoparticles on nafion-graphene support and its application for
Suzuki coupling reaction. Tetrahedron Lett. 2013, 54, 3457-3461.
(13) Adams, B. D.; Chen, A. The role of palladium in a hydrogen economy. Mater. Today
2011, 14, 282-289.
(14) Zeng, X. Q.; Latimer, M. L.; Xiao, Z. L.; Panuganti, S.; Welp, U.; Kwok, W. K.; Xu, T.
Hydrogen Gas Sensing with Networks of Ultrasmall Palladium Nanowires Formed on Filtration
Membranes. Nano Lett. 2011, 11, 262-268.
(15) Santhanam, V.; Andres, R. P. Microcontact Printing of Uniform Nanoparticle Arrays.
Nano Lett. 2004, 4, 41-44.
(16) Rabani, E.; Reichman, D. R.; Geissler, P. L.; Brus, L. E. Drying-mediated self-assembly
of nanoparticles. Nature 2003, 426, 271-274.
(17) Bockstaller, M. R.; Mickiewicz, R. A.; Thomas, E. L. Block copolymer nanocomposites:
Perspectives for tailored functional materials. Adv. Mater. 2005, 17, 1331-1349.

34
(18) De Rosa, C.; Auriemma, F.; Di Girolamo, R.; Pepe, G. P; Napolitano, T.; Scaldaferri, R.
Enabling Strategies in Organic Electronics Using Ordered Block Copolymer Nanostructures.
Adv. Mater. 2010, 22, 5414-5419.
(19) Li, Z.; Sai, H.; Warren, S. C.; Kamperman, M.; Arora, H.; Gruner, S. M.; Wiesner, U.
Metal Nanoparticle-Block Copolymer Composite Assembly and Disassembly. Chem. Mater.
2009, 21, 5578–5584.
(20) Bates, F. S.; Fredrickson, G. H. Block copolymer thermodynamics: theory and
experiment. Annu. Rev. Phys. Chem. 1990, 41, 525-557.
(21) Hamley, I. W. The Physics of Block Copolymers; Oxford University Press: Oxford, 1998.
(22) Fasolka, M. J.; Mayes, A. M. Block copolymer thin films: physics and applications. Annu.
Rev. Mater. Res. 2001, 31, 323-325.
(23) Lazzari, M.; De Rosa, C. In Advanced Nanomaterials; Geckeler, K.E., Nishide, H.;
Wiley-vch: Weinheim, 2009; Chapter 4, pp 111-158.
(24) Hadjichristidis, N.; Pitzikalis, M.; Pispas, S.; Iatrou H. Polymers with Complex
Architecture by Living Anionic Polymerization. Chem. Rev. 2001, 101, 3747-3792.
(25) Bras, W. An SAXS/WAXS beamline at the ESRF and future experiments. J. Macromol.
Sci. B 1998, 37, 557-565.
(26) Portale, G.; Cavallo, D.; Alfonso, G. C.; Hermida-Merino, D.; van Drongelen, M.;
Balzano, L.; Peters, G. W. M.; Goossens, J. G. P.; Bras, W. Polymer crystallization studies under
processing-relevant conditions at the SAXS/WAXS DUBBLE beamline at the ESRF. J. Appl.
Cryst. 2013, 46, 1681-1689.
35
(27) Beaucage, G. Approximations leading to a unified exponential/power-law approach to
small-angle scattering. J. Appl. Crystallogr. 1995, 28, 717-728.
(28) Beaucage, G. Small-angle scattering from polymeric mass fractals of arbitrary mass-
fractal dimension. J. Appl. Crystallogr. 1996, 29, 134-146.
(29) Lenz, S.; Bonini, M.; Nett, S. K.; Memesa, M.; Lechmann, M. C.; Emmerling, S. G. J.;
Kappes, R. S.; Timmann, A.; Roth, S. V.; Gutmann, J. S. Global scattering functions: a tool for
grazing incidence small angle X-ray scattering (GISAXS) data analysis of low correlated lateral
structures. Eur. Phys. J. - Appl. Phys. 2010, 51, 10601.
(30) Portale, G.; Sciortino, L.; Albonetti, C.; Giannici, F.; Martorana, A.; Bras, W.; Biscarini,
F.; Longo, A. Influence of metal–support interaction on the surface structure of gold nanoclusters
deposited on native SiO x/Si substrates. Phys Chem Chem Phys 2014, 16, 6649-6656.
(31) Grulke, E. A.; Brandup, J.; Immergut, E. H. Polymer Handbook; Wiley: New York,1999.
(32) Muller, A.J.; Balsamo, V.; Arnal, M.L.; Jakob, T.; Schmalz, H.; Abetz, V. Homogeneous
Nucleation and Fractionated Crystallization in Block Copolymers. Macromolecules 2002, 35,
3048-3058.
(33) Finch, C. A. Polymer Handbook; Brandrup, J., Immergut, E. H., Eds.; Wiley-Interscience:
Chichester, 1989.
(34) Fetters, L. J.; Lohse, D. J.; Richter, D.; Witten, T. A.; Zirkel, A. Connection between
Polymer Molecular Weight, Density, Chain Dimensions, and Melt Viscoelastic Properties.
Macromolecules 1994, 27, 4639.

36
(35) Lheritier, J.; Chauvet, A.; Masse, J.; Study of SR 33557/PEG 6000 interactions.
Thermochim. Acta 1994, 241, 157-169.
(36) Hamley, I.W.; Castelletto, V. Small-angle scattering of block copolymers. Prog. Polym.
Sci. 2004, 29, 909-948.
(37) Kim, S. H.; Misner, M. J.; Xu, T.; Kimura, M.; Russell, T.P. Highly oriented and ordered
arrays from block copolymers via solvent evaporation. Adv. Mater. 2004, 16, 226-231.
(38) Chieffi, G.; Di Girolamo, R.; Aronne, A.; Pernice, P.; Fanelli, E.; Lazzari, M.; De Rosa,
C.; Auriemma, F. Rapid-flux-solvent-atmosphere method for tailoring the morphology of titania
substrates over a large area via direct self-assembly of block copolymers. RSC Adv. 2014, 4,
16721-16725.
(39) Luo, C.; Zhang, Y.; Wang, Y. Palladium nanoparticles in poly(ethylene glycol): an
efficient and recyclable catalyst for the Heck reaction. J. Mol. Catal. A: Chem. 2005, 229, 7-12.
(40) Harraz, F. A.; El-Hout, S. E.; Killa, H. M.; Ibrahim, I.A. Palladium nanoparticles
stabilized by polyethylene glycol: Efficient, recyclable catalyst for hydrogenation of styrene and
nitrobenzene. J. Catal. 2012, 286, 184-192.
(41) Farrauto, R. J.; Lampert, J. K.; Hobson, M. C.; Waterman E. M. Thermal decomposition
and reformation of PdO catalysts; support effects. Appl. Catal., B 1995, 6, 263-270.
(42) Datye, K.; Bravo, J.; Nelson, T. R.; Atanasova, P.; Lyubovsky, M.; Pfefferle, L. Catalyst
microstructure and methane oxidation reactivity during the Pd↔PdO transformation on alumina
supports. Appl. Catal., A 2000, 198, 179-196.

37
(43) Swanson, H. E.; Tatge, E. Standard X-Ray Diffraction Powder Patterns. Natl. Bur. Stand.
Circ. 539 1953, 1, 21.
(44) Welton-Holzer, J.; McCarthy, G. North Dakota State University, Fargo, North Dakota,
USA. ICDD Grant-in-Aid 1989.
Table of Contents