tulare county, california woodlake and comparison data for the united states, california, and tulare...
TRANSCRIPT

TULARE COUNTY, CALIFORNIA
Demographic, Housing, and Economic Data Graphs
Graphs include detailed data for Dinuba, Exeter, Farmersville, Lindsay, Orosi, Porterville, Tulare City, Visalia,
and Woodlake and comparison data for the United States, California, and Tulare County.
Vantage Point Community Indicators Project, November 2014 Federal Reserve Bank of San Francisco Community Development Department Project Contact: Gabriella Chiarenza – [email protected]

Demographic Data
Source: American Community Survey, 5-year Estimates, 2012.

Source: American Community Survey, 5-year Estimates, 2012.

Source: American Community Survey, 5-year Estimates, 2012.

Source: American Community Survey, 5-year Estimates, 2012.

Education, Income, and Household Financial Stability
Source: American Community Survey, 5-year Estimates, 2012.
Source: American Community Survey, 5-year Estimates, 2012.

Source: American Community Survey, 5-year Estimates, 2012.

Source: American Community Survey, 5-year Estimates, 2012.

Source: American Community Survey, 5-year Estimates, 2012.

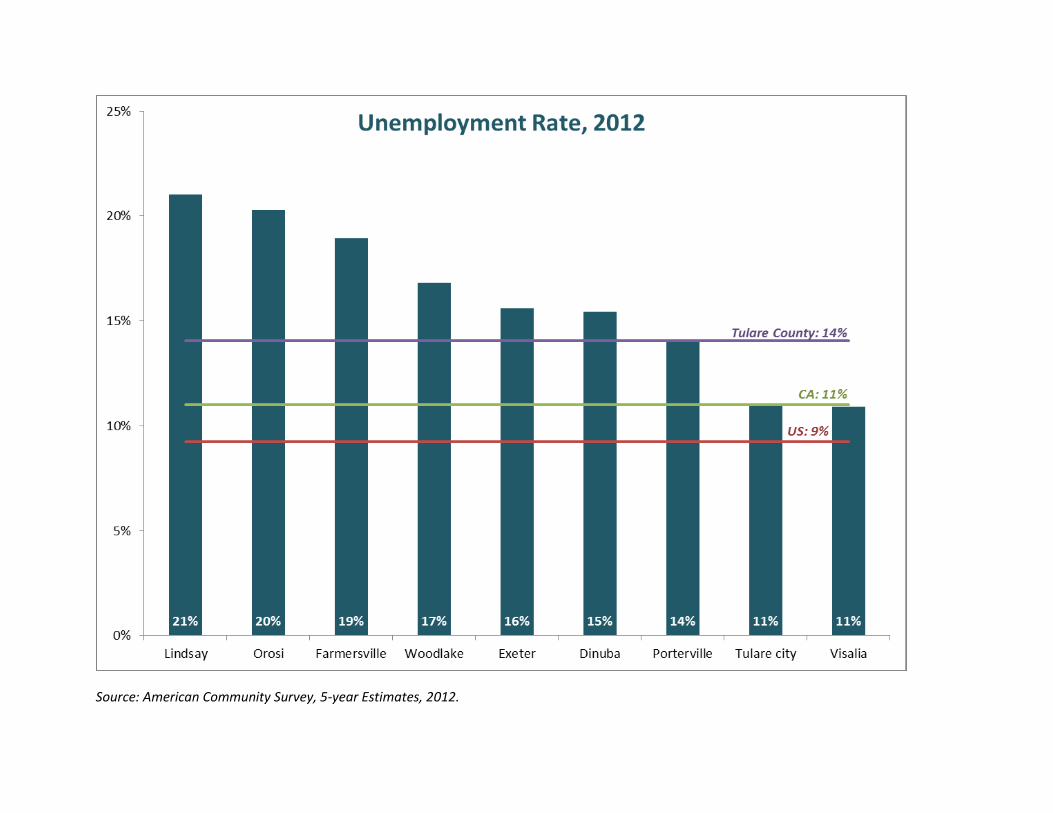
Employment
Source: American Community Survey, 5-year Estimates, 2012.

Source: American Community Survey, 5-year Estimates, 2012.

Source: U.S. Bureau of Labor Statistics, Quarterly Census of Employment and Wages, 2013.

Source: U.S. Bureau of Labor Statistics, Quarterly Census of Employment and Wages, 2013.

Housing
Source: Zillow, 2014.

Source: Zillow, 2014.

Source: American Community Survey 5-year Estimates, 2012; U.S. Department of Housing and Urban Development, A Picture of Subsidized Housing, 2013.

Source: American Community Survey 5-year Estimates, 2012; U.S. Department of Housing and Urban Development, A Picture of Subsidized Housing, 2013.

Data Notes
General:
You are welcome to use this data and these graphics for your data needs. Please be sure to cite the original data source
noted on the graph as well as the Federal Reserve Bank of San Francisco, and provide a link back to the Federal Reserve Bank
of San Francisco’s data tab: http://www.frbsf.org/community-development/data/ Please contact us with any questions
about citations.
Please see source notations for the year and time horizon of the data shown. We have used available 3-year estimate data
(representing 2013) or 5-year estimate data (representing 2012) from the American Community Survey for the selected sub-
county geographies, as more recent data is only available for larger geographies. Please note that the most recent ACS zip
code data available is for 2012. Data sources other than ACS used in the graphs are noted as applicable.
The geographies shown in the graphs are intended to show a selected sample of the cities, towns, and zip codes within the
county and do not include all geographies for that county.
Please assume all percentages shown in the graphs are percentages of the total population, households, or housing units of
that geography, depending on the indicator. Exceptions are noted.
Please contact Gabriella Chiarenza if you have questions about the data or graphs, or if you need assistance locating similar
data for other geographies.
Housing:
“Affordable rent” is defined as no more than 30% of income.
Median home values and rents shown are for September 2014.
HUD data on subsidized housing includes all units funded in part by any of the following programs: public housing, Housing
Choice Vouchers, moderate rehabilitation, project-based Section 8, Section 236 preservation, other federal multifamily
housing funds, and/or the Low Income Housing Tax Credit program.