tsunami early warning system in japan · tsunami early warning system in japan ... the cause ......
TRANSCRIPT
Asian Disaster Reduction Center Visiting researcher program FY 2014B
Tsunami Early Warning System in Japan
Fathmath Shaushan Moosa
Senior Administrative officer
National Disaster Management Centre, Rep of Maldives

Visiting Researcher Program FY2014B
2 | P a g e
Disclaimer
This report was compiled by an ADRC visiting researcher (VR) from ADRC member countries. The views expressed in the report do not necessarily reflect the views of the ADRC. The boundaries and names shown and the designations used on the maps in the report also do not imply official endorsement or acceptance by the ADRC.
Cover photo
The lone-standing tree is acting as a symbol of hope for thousands of people left devastated by
Japan's tsunami in 2011.
Incredibly, it was the sole-surviving fern from a forest of 70,000 levelled in Rikuzentakata, in Iwate
prefecture, along Japan's north-east coast.
Now the so-called 'Miracle Pine', which stands at 88 feet (26.8 metres), has been reconstructed to
commemorate the second anniversary of the "Great East Japan Earthquake" (and tsunami).
The disaster killed nearly 19,000 people.
The tree survived the tsunami but later died in the Takata-Matsubara forest.
The "Miracle Pine" was reconstructed, with leaves and branches recreated out of plastic in a factory
and attached to the towering trunk.
A 3cm x 3cm stamp on the base reads: "Praying for recovery from disaster".

Visiting Researcher Program FY2014B
3 | P a g e
Acknowledgement
I express my gratitude to Asian Disaster Reduction Center, Japan, Government of Maldives and my Organization, National Disaster Management Centre (NDMC) for providing me this opportunity to participate in the Visiting Researcher Program. This program provided me an excellent opportunity to study Disaster Management System of Japan and some other countries as well. Special thanks to the Government of Japan and many Japanese institutions which provided me this opportunity to visit their facilities and offices and learn from their practices. Secondly I would like to thank all the staffs of ADRC, Specially Ms. Yumi Shiomi for her exceptional work in coordinating the program, the visits to facilitate my research studies and assistance during my stay in Japan. Special thanks to Deputy Minister of Defence and National Security Ms.Fathmath Thasneem, Project Director Mr. Hisan Hasan and “team NDMC” for their support and assistance in my study here in Japan. Finally I wish to thank my parents, family and visiting researcher colleagues Ms. Ameerha P Ortega from Philippines and Mr.Yeshi Lotey from Bhutan for their corporation during the program.

Visiting Researcher Program FY2014B
4 | P a g e
Table of Contents Japan ....................................................................................................................................................................... 6
General Information ........................................................................................................................................... 6 Physiography ................................................................................................................................................. 6 Climate........................................................................................................................................................... 7 Natural hazards in Japan ............................................................................................................................... 7
Earthquakes and Shaking ................................................................................................................................... 8 Earthquakes around Japan ............................................................................................................................ 8 Plate Subduction and Earthquake ................................................................................................................. 9
Seismic waves ................................................................................................................................................... 10 P-waves: ...................................................................................................................................................... 10 S-waves: ....................................................................................................................................................... 10
Measuring earthquakes ................................................................................................................................... 11 Japans scale ................................................................................................................................................. 11 Seismic Intensity and Magnitude ................................................................................................................ 12
Tsunami ............................................................................................................................................................ 13 The physics of a tsunami ............................................................................................................................. 14 Tsunami as it approaches land .................................................................................................................... 14
Measuring or observing a tsunami ................................................................................................................... 15 Tide Gauges ................................................................................................................................................. 15 Satellites ...................................................................................................................................................... 15 Open-ocean buoys ....................................................................................................................................... 16 Costal Tsunami monitoring system ............................................................................................................. 17
The Indian Ocean tsunami of 26th December 2004 ............................................................................................. 17 The cause ..................................................................................................................................................... 17 Early Warning .............................................................................................................................................. 18 Deaths .......................................................................................................................................................... 18 Worldwide effect ......................................................................................................................................... 18
Great East Japan Earthquake/ Tsunami (March 2011) ......................................................................................... 19 The cause ..................................................................................................................................................... 19 Early warning ............................................................................................................................................... 19 Deaths .......................................................................................................................................................... 20 Nuclear meltdown ....................................................................................................................................... 20 Worldwide effects ....................................................................................................................................... 20
A Data Collection and Processing System for Assured Communication .......................................................... 21 Earthquake and Tsunami Monitoring ............................................................................................................... 22
Seismometer Network ................................................................................................................................. 22 Seismic Intensity Network ........................................................................................................................... 23
Earthquake Information issued by Japan Meteorological Agency ................................................................... 23 Response to a Earthquake Early Warning System ....................................................................................... 25 Limitations of the Earthquake Early Warning .............................................................................................. 26
Tsunami Monitoring Network .......................................................................................................................... 26 Tsunami Observation ................................................................................................................................... 27
Tsunami Information issued by JMA ................................................................................................................ 28 Flow of information about Earthquake and Tsunami ...................................................................................... 29
Tsunami Warning/Advisory ......................................................................................................................... 30 Tsunami Information ................................................................................................................................... 31 Tsunami Forecast ......................................................................................................................................... 33 Observation, Forecasting and Warning of Disaster Risks ............................................................................ 33
Information and communication system ......................................................................................................... 34 Issuing Evacuation Advisory and Order ....................................................................................................... 34 Central Disaster Prevention Radio Network ................................................................................................ 35 Dissemination of Forecast and EW .............................................................................................................. 36 J-Alert System .............................................................................................................................................. 37
Distant Earthquake Information and International Tsunami Advisories .......................................................... 38 Recommendations when Developing an Early Warning System...................................................................... 39

Visiting Researcher Program FY2014B
5 | P a g e
Table of figures
Figure 1: Map of Japan ............................................................................................................................................ 6 Figure 2: Japan surrounded by sea ......................................................................................................................... 6 Figure 3: Topology of japan ..................................................................................................................................... 6 Figure 4: Climate map of Japan ............................................................................................................................... 7 Figure 5: Loss of life due to natural disasters ......................................................................................................... 8 Figure 6: Types of plate boundary covering the earth ............................................................................................ 9 Figure 7: Plate Tectonics around Japan Source JMA .............................................................................................. 9 Figure 8: Types of earthquake Source JMA ........................................................................................................... 10 Figure 9: Two types of Waves P wave and S wave ................................................................................................ 10 Figure 10: Finding the hypocenter , Source JMA .................................................................................................. 11 Figure 11: Summary of JMA Seismic Intensity scale explained, Source JMA ........................................................ 12 Figure 12: Tsunami ................................................................................................................................................ 13 Figure 13: Tide Gauge source JMA ........................................................................................................................ 15 Figure 14: satellite image captured on 24 December 2004 – Tsunami - source NOAA ..................................... 16 Figure 15: Open ocean buoy - Source JMA ........................................................................................................... 16 Figure 16: Costal tsunami monitoring system....................................................................................................... 17 Figure 17: Indian Ocean tsunami –Map of affected countries .............................................................................. 17 Figure 18: Great East Japan earthquake and Tsunami - Epicenter ....................................................................... 19 Figure 19: Houses, cars , ships were carried away by the tsunami wave, ............................................................ 19 Figure 20: Nuclear accident caused due to Tsunami ............................................................................................ 20 Figure 21: Data collection and Dissemination of information Source JMA .......................................................... 21 Figure 22: Seismic intensity network Source JMA ............................................................................................... 22 Figure 23: JMA Seismic station ............................................................................................................................. 22 Figure 24: Seismic intensity network Source JMA ............................................................................................... 23 Figure 25: earthquake early warning .................................................................................................................... 23 Figure 26: Response to an earthquake early warning........................................................................................... 25 Figure 27: Tsunami Observation Source Tohoku Regional Bureau of MLIT .......................................................... 27 Figure 28: Computer simulated tsunamis are stored on a data base Source JMA ............................................... 28 Figure 29: Issuing of Tsunami warning advisories Source JMA ............................................................................. 28 Figure 30: Flow of information, earthquake and tsunami Source JMA ................................................................ 29 Figure 31: Tsunami warning / Advisory categories and action to be taken Source JMA ...................................... 30 Figure 32: Early Warning System Source – Cabinet office, Government of Japan ................................................ 34 Figure 33: Disaster Pretension communication syste Source – Cabinet office, Government of Japan ................ 35 Figure 34: Flow of information from JMA to the public ........................................................................................ 36 Figure 35: J-Alert system ....................................................................................................................................... 37
Visiting Researcher Program FY2014B
6 | P a g e
Japan
General Information
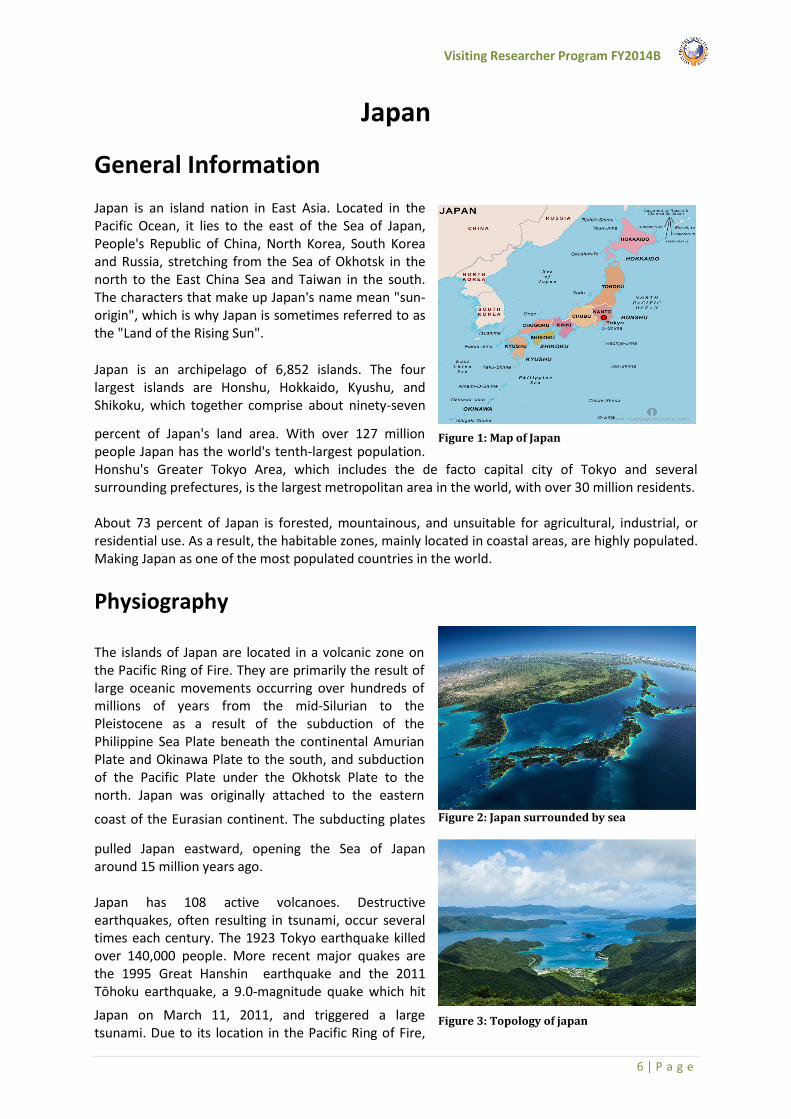
Japan is an island nation in East Asia. Located in the Pacific Ocean, it lies to the east of the Sea of Japan, People's Republic of China, North Korea, South Korea and Russia, stretching from the Sea of Okhotsk in the north to the East China Sea and Taiwan in the south. The characters that make up Japan's name mean "sun-origin", which is why Japan is sometimes referred to as the "Land of the Rising Sun".
Japan is an archipelago of 6,852 islands. The four largest islands are Honshu, Hokkaido, Kyushu, and Shikoku, which together comprise about ninety-seven
percent of Japan's land area. With over 127 million people Japan has the world's tenth-largest population. Honshu's Greater Tokyo Area, which includes the de facto capital city of Tokyo and several surrounding prefectures, is the largest metropolitan area in the world, with over 30 million residents. About 73 percent of Japan is forested, mountainous, and unsuitable for agricultural, industrial, or residential use. As a result, the habitable zones, mainly located in coastal areas, are highly populated. Making Japan as one of the most populated countries in the world.
Physiography
The islands of Japan are located in a volcanic zone on the Pacific Ring of Fire. They are primarily the result of large oceanic movements occurring over hundreds of millions of years from the mid-Silurian to the Pleistocene as a result of the subduction of the Philippine Sea Plate beneath the continental Amurian Plate and Okinawa Plate to the south, and subduction of the Pacific Plate under the Okhotsk Plate to the north. Japan was originally attached to the eastern
coast of the Eurasian continent. The subducting plates
pulled Japan eastward, opening the Sea of Japan around 15 million years ago. Japan has 108 active volcanoes. Destructive earthquakes, often resulting in tsunami, occur several times each century. The 1923 Tokyo earthquake killed over 140,000 people. More recent major quakes are the 1995 Great Hanshin earthquake and the 2011 Tōhoku earthquake, a 9.0-magnitude quake which hit
Japan on March 11, 2011, and triggered a large tsunami. Due to its location in the Pacific Ring of Fire,
Figure 1: Map of Japan
Figure 2: Japan surrounded by sea
Figure 3: Topology of japan

Visiting Researcher Program FY2014B
7 | P a g e
Japan is substantially prone to earthquakes and tsunami, having the highest natural disaster risk in the developed world.
Climate
A major feature of Japan’s climate is the clear-cut temperature changes between the four seasons. In spite of its rather small area, the climate differs in regions from a subarctic climate to a subtropical climate. The side of the country which faces the Sea of Japan has a climate with much snow in winter by seasonal winds from the Siberia. Most of the areas have damp rainy season from May to July by seasonal winds from the Pacific Ocean. Japan is frequently visited by typhoons from July to September.
The average winter temperature in Japan is 5.1 °C (41.2 °F) and the average summer temperature is 25.2 °C (77.4 °F).
The highest temperature ever measured in Japan—40.9 °C (105.6 °F) —was recorded on August 16, 2007. The main rainy season begins in early May in Okinawa, and the rain front gradually moves north until reaching Hokkaido in late July. In most of Honshu, the rainy season begins before the middle of June and lasts about six weeks. In late summer and early autumn, typhoons often bring heavy rain.
Natural hazards in Japan
Japan’s geographical and climatologically the country is vulnerable to frequent natural disasters such as typhoons, torrential rains and heavy snow as well as earthquake, Tsunamis and volcanic eruptions. Japan is located in the circum-Pacific mobile zone where seismic and volcanic activities occur constantly. Although the country covers only 0.25% of the land area on the planet, the number of earthquakes and distribution of active volcanoes is quite high. Due to the geological formation with plate boundaries of the Pacific plate, the Philippine Sea plate, the Eurasian plate, and the North American plate, Japan is substantially prone to earthquakes and tsunami, having the highest natural disaster risk in the developed world. Every year there is a great loss of people’s lives and properties due to natural disasters. As such natural disasters remain a menacing threat to safety and security of the country. However, with the progress of society’s capacity to address disasters and mitigation of vulnerabilities to disasters by developing disaster management systems, promoting national land conservation, improving weather forecasting technologies and upgrading disaster information communication systems, disaster damage has shown a declining tendency.
Figure 4: Climate map of Japan

Visiting Researcher Program FY2014B
8 | P a g e
Figure 5: Loss of life due to natural disasters
Earthquakes and Shaking
What is an earthquake? When people feel the ground shake, they exclaim, "It's an earthquake!" Strictly speaking, what they are feeling is ground motion caused by an earthquake. As a technical term, ground motion is used to distinguish this movement from the earthquake itself. An earthquake is a destructive slip movement inside a rock plate deep under the ground. We call the plane of this movement a fault, and the point at which a destructive slip movement starts is called the hypocenter. Such destructive slip movements cause vibration that propagates in every direction. Since vibration travels in a wave formation, its movement is called a seismic wave. When the vibration reaches the ground surface, people become aware of earthquake motion. Thus, not all places on the surface of the ground shake at the same time. Locations closer to the hypocenter shake first, while distant areas shake later.
Earthquakes around Japan
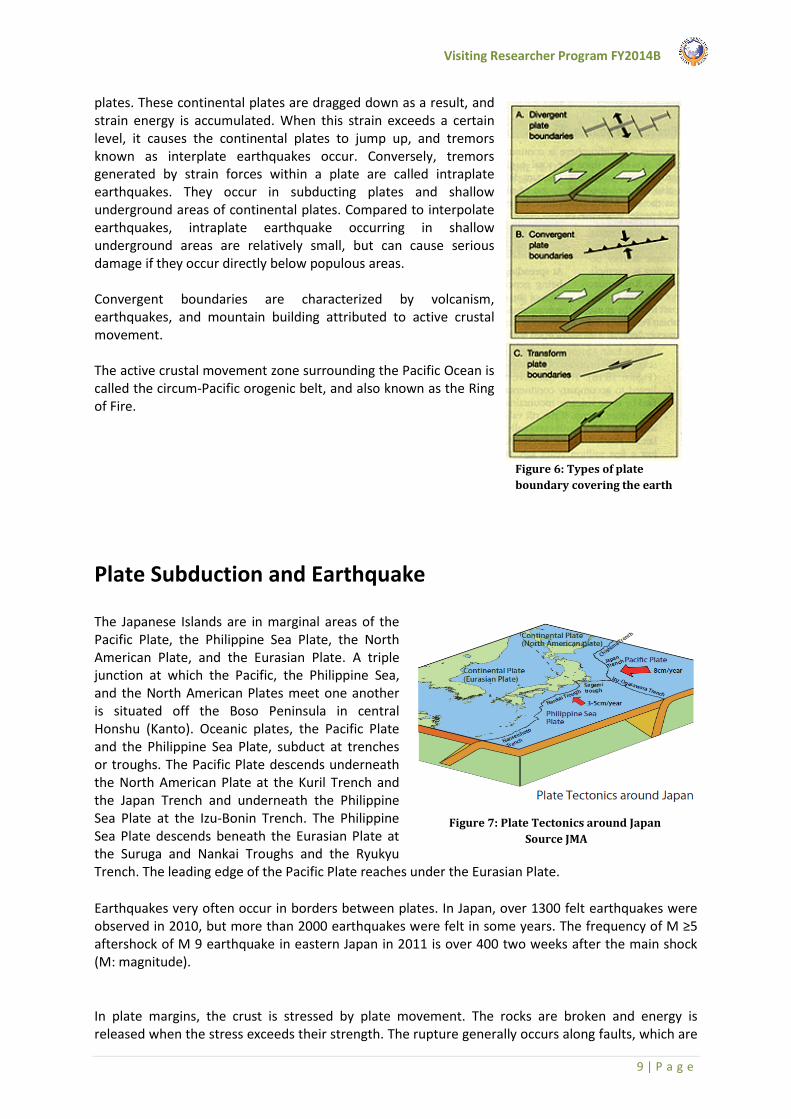
The boundaries of plates covering the surface of the Earth are classified into three types: convergent, divergent, and transform types. Convergent boundaries occur where one plate subducts underneath another plate with density lower than the subducting plate or collides with another plate in the case that both plates are composed of continental material. Continental plates cannot dive into the mantle because their densities are lower than that of the mantle. Divergent boundaries occur where new lithosphere (plate) is produced and plates move away from each other at spreading ridges. Transform boundaries occur where one plate laterally slides past another, displacing spreading ridge. As an oceanic plate subducts underneath another plate at a convergent boundary, such area is called a subduction zone. The Japanese Islands are situated in a subduction zone in the northwestern margin of the Pacific Ocean where the Pacific Plate and Philippine Sea Plate subducting (the North American Plate and the Eurasian Plate) several centimeters annually. These plate movements cause forces to act in various directions around the country, which is the reason behind the extremely high seismic activity in the area. Around Japan, therefore, oceanic plates subduct beneath continental
Visiting Researcher Program FY2014B
9 | P a g e
plates. These continental plates are dragged down as a result, and strain energy is accumulated. When this strain exceeds a certain level, it causes the continental plates to jump up, and tremors known as interplate earthquakes occur. Conversely, tremors generated by strain forces within a plate are called intraplate earthquakes. They occur in subducting plates and shallow underground areas of continental plates. Compared to interpolate earthquakes, intraplate earthquake occurring in shallow underground areas are relatively small, but can cause serious damage if they occur directly below populous areas. Convergent boundaries are characterized by volcanism, earthquakes, and mountain building attributed to active crustal movement. The active crustal movement zone surrounding the Pacific Ocean is called the circum-Pacific orogenic belt, and also known as the Ring of Fire.
Plate Subduction and Earthquake
The Japanese Islands are in marginal areas of the Pacific Plate, the Philippine Sea Plate, the North American Plate, and the Eurasian Plate. A triple junction at which the Pacific, the Philippine Sea, and the North American Plates meet one another is situated off the Boso Peninsula in central Honshu (Kanto). Oceanic plates, the Pacific Plate and the Philippine Sea Plate, subduct at trenches or troughs. The Pacific Plate descends underneath the North American Plate at the Kuril Trench and the Japan Trench and underneath the Philippine Sea Plate at the Izu-Bonin Trench. The Philippine Sea Plate descends beneath the Eurasian Plate at the Suruga and Nankai Troughs and the Ryukyu Trench. The leading edge of the Pacific Plate reaches under the Eurasian Plate.
Earthquakes very often occur in borders between plates. In Japan, over 1300 felt earthquakes were observed in 2010, but more than 2000 earthquakes were felt in some years. The frequency of M ≥5 aftershock of M 9 earthquake in eastern Japan in 2011 is over 400 two weeks after the main shock (M: magnitude).
In plate margins, the crust is stressed by plate movement. The rocks are broken and energy is released when the stress exceeds their strength. The rupture generally occurs along faults, which are
Figure 6: Types of plate
boundary covering the earth
Figure 7: Plate Tectonics around Japan
Source JMA

Visiting Researcher Program FY2014B
10 | P a g e
considered seismic sources. Therefore, the rapid slip of rocks along a fault results in an earthquake. Volcanic activity also causes earthquakes. There are principally three types of fault motion: normal dip-slip, reverse dip-slip, and strike-slip (left or right). Fault movements may include a component of strike-slip and dip-slip.
Seismic waves
For earthquake detection, it is important to understand the two types of seismic waves emitted by earthquakes: P-waves and S-waves. Although these waves are released at the same time, p-waves are less powerful and travel relatively quickly, so early recognition of these waves is critical in order to maximize warning time.
P-waves: P-waves propagate similarly to sound waves by alternating between compressing and
dilating in the same direction that the wave is traveling. This longitudinal motion compresses the Earth’s crust as it moves but causes very little or no destruction These waves travel at a speed of 4-7km/second and can move through gas, liquid, and solids including the molten core of the Earth (P-Waves and S-Waves, 2009). As a result, p-waves move faster than s-waves and can be used to detect the onset of an earthquake before the arrival of the
S-waves: S-waves, or shear waves,
oscillate sinusoidally and move perpendicular to their direction of travel. These waves cause most of the earthquake-induced damage such as the destruction of buildings and landslides. Unlike p-waves, s-waves cannot travel through gas or liquid and travel at a slower rate of 2-5km/second. For an efficient earthquake warning system, it is critical that earthquake technology can quickly detect the p-waves and issue a warning before the arrival of these s-waves.
Figure 9: Two types of Waves P wave and S wave
Figure 8: Types of earthquake
Source JMA

Visiting Researcher Program FY2014B
11 | P a g e
Measuring earthquakes
A seismogram is a record of the seismic waves from an earthquake. A seismograph or seismometer is the measuring instrument that creates the seismogram. Almost all seismometers are based on the principle of inertia: a suspended mass tends to remain still when the ground moves. The relative motion between the suspended mass and the ground will then be a measure of the ground’s motion. On a seismogram from an earthquake, the P-wave is the first signal to arrive, followed by the slower S-wave, then the surface waves. Given that we know the relative speed of P- and S-waves, the time difference between the arrivals of the P- and S-waves determines the distance the earthquake is from the seismograph. Vibration propagates as a wave, so the farther a point is from the hypocenter, the later the wave arrives. As a result, if we can pinpoint where earthquake motion appears first among many monitoring sites (seismometers),the hypocenter can be assumed to near that site. In fact, hypocenters are located by considering the subterranean structure (i.e., the structure of the earth s crust) and comparing differences in the appearance times of P-waves and S-waves.
Japans scale
The JMA scale describes the degree of shaking at a point on the Earth's surface, and is analogous to the Mercalli intensity scale. The intensity of an earthquake is not totally determined by its magnitude, and varies from place to place; for example, a quake may be described as "shindo 4 in
Tokyo, shindo 3 in Yokohama, shindo 2 in Shizuoka". It is measured in units of shindo (震度, seismic intensity, lit. "Degree of shaking"). Japan experiences approximately 400 earthquakes every day, although the vast majority are shindo scale "0" or less and detectable only using specialist apparatus.
The Japan Meteorological Agency (JMA) first assigned a four-stage Shindo in 1884, with the levels: 微
(faint), 弱 (weak), 強 (strong), and 烈 (violent). In 1898 this scale was changed to a numerical system, assigning earthquakes levels 0–7. In 1908, the levels on this scale were given descriptions, and earthquakes were assigned levels based on their perceived effect on people. This scale was widely used during the Meiji period, and revised during the Shōwa period with the descriptions seeing an overhaul. Following the Great Hanshin earthquake in 1995, levels 5 and 6 were divided in two, giving a total of 10 levels of earthquake: 0–4, weak / strong 5, weak / strong 6 and 7. The Shindo scale has been used in Japan from 1996 without change.
Figure 10: Finding the hypocenter , Source JMA

Visiting Researcher Program FY2014B
12 | P a g e
Seismic Intensity and Magnitude
Seismic intensity and magnitude are easily confused because both have similar values. Seismic intensity describes the scale of the ground motion at a particular location. It varies with the distance from the epicenter and the surface geology at each point. JMA s seismic intensity scale has 10 degrees (0 (imperceptible), 1, 2, 3, 4, 5-lower, 5-upper, 6-lower, 6-upper, 7). Magnitude is a numerical value that represents the scale of a fault slip underground. Large earthquakes have high magnitude.
Figure 11: Summary of JMA Seismic Intensity scale explained, Source JMA

Visiting Researcher Program FY2014B
13 | P a g e
Tsunami
Tsunami is a Japanese word with the English translation: "harbour wave". In the past, tsunamis have been referred to as "tidal waves" or "seismic sea waves". The term "tidal wave" is misleading; even though a tsunami's impact upon a coastline is dependent upon the tidal level at the time a tsunami strikes, tsunamis are unrelated to the tides. (Tides result from the gravitational influences of the moon, sun, and planets.) The term "seismic sea wave" is also misleading. "Seismic" implies an earthquake-related generation mechanism, but a tsunami can also be caused by a non-seismic event, such as a landslide or meteorite impact.
Tsunamis are also often confused with storm surges, even though they are quite different phenomena. A storm surge is a rapid rise in coastal sea-level caused by a significant meteorological event - these are often associated with tropical cyclones.
A tsunami is a series of very long waves generated by rapid, large-scale disturbances of the sea—the sudden displacement of a large volume of water, generally from the raising or lowering of the seafloor caused by:
earthquakes landslide volcanic eruptions explosions meteorites
Once a tsunami has been generated, its energy is distributed throughout the water column, regardless of the water depth, and the waves travel outward on the surface of the ocean in all directions away from the source, much like ripples caused by throwing a rock into a pond. The wavelength of the tsunami waves and their period depend on the generating mechanism and the dimensions of the source event.
In the deep ocean, the height of a tsunami from trough to crest can range from a few centimeters to a meter or more depending on the generating source. Tsunami waves in the deep ocean can travel at high speeds for long periods of time over distances of thousands of kilometers and lose very little energy in the process. The deeper the water, the greater the speed of tsunami waves is. A tsunami wave can travel more than 800 kilometers per hour (km/h) in the deep ocean, but slows to 30 to 60 km/h in shallow water near land. But, amazingly, pass under a ship in the ocean with those aboard the vessel hardly noticing. Tsunamis arrive at a coastline as a series of successive crests (high water levels) and troughs (low water levels) usually 10 to 45 minutes apart. As the tsunami waves become compressed near the coast, their wavelengths are shortened, and the wave energy is directed upward—thus considerably increasing the height and force of the waves. Tsunami waves may smash into the shore like a wall of water or move ashore as a fast moving flood or tide—carrying along everything in their path. The historic record shows that many tsunamis have struck with devastating force, sometimes reaching heights of 30 to 50 meters. It should be
Figure 12: Tsunami

Visiting Researcher Program FY2014B
14 | P a g e
remembered that a tsunami run-up of more than 1 meter is dangerous due to the strong force it has. Flooding by individual waves typically lasts from 10 to 30 minutes, but the danger can last for hours. Greater tsunamis tend to move inland with the derbies and sometimes with massive fire.
Generally, coasts and islands with steep fringes or surrounded by barrier reefs are safer than those with gradually rising fringes or those that are exposed to open ocean. This is because reefs can absorb much of the oncoming waves’ impact and deep coastlines do not allow tsunamis to slow down and grow into deadly towers of water.
The physics of a tsunami
Tsunamis can have wavelengths ranging from 10 to 500 km and wave periods of up to an hour. As a result of their long wavelengths, tsunamis act as shallow-water waves. A wave becomes a shallow-water wave when the wavelength is very large compared to the water depth. Shallow-water waves move at a speed, c, that is dependent upon the water depth and is given by the formula:
Where g is the acceleration due to gravity (= 9.8 m/s2) and H is the depth of water.
In the deep ocean, the typical water depth is around 4000 m, so a tsunami will therefore travel at around 200 m/s, or more than 700 km/h.
For tsunamis that are generated by underwater earthquakes, the amplitude of the tsunami is determined by the amount by which the sea-floor is displaced. Similarly, the wavelength and period of the tsunami are determined by the size and shape of the underwater disturbance.
As the tsunami propagates across the ocean, the wave crests can undergo refraction (bending), which is caused by segments of the wave moving at different speeds as the water depth along the wave crest varies.
Tsunami as it approaches land
As a tsunami leaves the deep water of the open-ocean and travels into the shallower water near the coast, it transforms, as the water depth decreases, the tsunami slows. The tsunami's energy flux, which is dependent on both its wave speed and wave height, remains nearly constant. Consequently, as the tsunami's speed diminishes, its height grows. This is called shoaling. Because of this shoaling effect, a tsunami that is unnoticeable at sea, may grow to be several metres or more in height near the coast.
The increase of the tsunami's wave height as it enters shallow water is given by:

Visiting Researcher Program FY2014B
15 | P a g e
where hs and hd are wave heights in shallow and deep water and Hs and Hd are the depths of the shallow and deep water. So a tsunami with a height of 1 m in the open ocean where the water depth is 4000m would have a wave height of 4 to 5 m in water of depth 10 m.
Just like other water waves, tsunamis begin to lose energy as they rush onshore - part of the wave energy is reflected offshore, while the shoreward-propagating wave energy is dissipated through bottom friction and turbulence. Despite these losses, tsunamis still reach the coast with tremendous amounts of energy. Depending on whether the first part of the tsunami to reach the shore is a crest or a trough, it may appear as a rapidly rising or falling tide. Tsunamis may reach a maximum vertical height onshore above sea level, often called a run-up height, of tens of metres.
Measuring or observing a tsunami
In the deep ocean, a tsunami has small amplitude (less than 1 metre) but very long wavelength (hundreds of kilometres). This means that the slope, or steepness of the wave is very small, so it is practically undetectable to the human eye. However, there are ocean observing instruments that are able to detect tsunamis.
Tide Gauges
Tide gauges measure the height of the sea-surface and are primarily used for measuring tide levels. These consist of an acoustic sensor connected to a vertical tube open at the lower end which is in the water. The acoustic sensor emits a sound pulse which travels from the top of the tube down to the water surface, and is then reflected back up the tube. The distance to the water level can then be calculated using the travel time of the pulse. This system filters out small-scale effects like wind-waves and has the capacity to measure sea-level changes within 1mm accuracy.
The tide gauge at Cocos Island observed the tsunami on December 26th 2004 as it passed by the island, as shown in these observations made during December.
Satellites
Satellite altimeters measure the height of the ocean surface directly by the use of electro-magnetic pulses. These are sent down to the ocean surface from the satellite and the height of the ocean surface can be determined by knowing the speed of the pulse, the location of the satellite and measuring the time that the pulse takes to return to the satellite. One problem with this kind of satellite data is that it can be very sparse - some satellites only pass over a particular location about once a month, so you would be lucky to spot a tsunami since they travel so quickly. However, during the Indian Ocean tsunami of December 26th 2004, the Jason satellite altimeter happened to be in the right place at the right time.
Figure 13: Tide Gauge source JMA

Visiting Researcher Program FY2014B
16 | P a g e
The picture below shows the height of the sea surface (in blue) measured by the Jason satellite two hours after the initial earthquake hit the region southeast of Sumatra (shown in red) on December 26, 2004. The data were taken by a radar altimeter on board the satellite along a track traversing the Indian Ocean when the tsunami waves had just filled the entire Bay of Bengal. The data shown are the differences in sea surface height from previous observations made along the same track 20-30 days before the earthquake, showing the signals of the tsunami.
Open-ocean buoys
An array of stations is deployed in the Ocean. These stations give detailed information about tsunamis while they are still far off shore. Each station consists of a sea-bed bottom pressure recorder which detects the passage of a tsunami. (The pressure of the water column is related to the height of the sea-surface) . The data is then transmitted to a surface buoy via sonar. The surface buoy then radios the information to the Tsunami Warning Center via satellite. The system has considerably improved the forecasting and
warning of tsunamis.
Figure 14: satellite image captured on 24 December 2004 –
Tsunami - source NOAA
Figure 15: Open ocean buoy - Source JMA

Visiting Researcher Program FY2014B
17 | P a g e
Costal Tsunami monitoring system
This system can operate a wireless network with a PV system and a storage battery system even in the event of a disaster, when commercial power and wired information networks are inaccessible. With the coastal tsunami monitoring system, network cameras were installed at different places to monitor the coasts. The plan is to transmit realtime video data to the City Hall Disaster Prevention Headquarters via a wireless system, along with data from the wave height gauge set up on the Coast. At the heart of this wireless system is a multi-service access concentrator capable of handling data transfer over three wireless networks—a 5G wireless link capable of transmitting videos, a 920MHz band specified low-power wireless system suitable for transmitting wave height data, and WiFi. The system is also powered by a self-sustaining power supply system consisting of PV panels and a lithium ion storage battery unit.
The Indian Ocean tsunami of 26th December 2004
An undersea earthquake in the Indian Ocean on 26th December 2004 produced a tsunami that caused one of the biggest natural disasters in modern history.
The earthquake took place at about 1am UTC (8am local time) in the Indian Ocean off the western coast of northern Sumatra. With a magnitude of 9.0 on the Richter scale, it was the largest since the 1964 earthquake off Alaska and equal fourth largest since 1900, when accurate global seismographic record-keeping began.
The cause
The epicentre of the earthquake was located about 250 km south-southeast of the Indonesian city of Banda Aceh. It was a rare megathrust earthquake and occurred on the interface of the India and Burma tectonic plates. This was caused by the release of stresses that develop as the India plate
Figure 16: Costal tsunami
monitoring system
Figure 17: Indian Ocean tsunami –Map of affected
countries

Visiting Researcher Program FY2014B
18 | P a g e
subducts beneath the overriding Burma plate. A megathrust earthquake is where one tectonic plate slips beneath another, causing vertical motion of the plates. This large vertical displacement of the sea-floor generated the devastating tsunami, which caused damage over such a large area around the Indian Ocean.
The earthquake was also unusually large in geographical extent. An estimated 1200 km of faultline slipped about 15 m along the subduction zone over a period of several minutes. Because the 1,200 km of faultline affected by the quake was in a nearly north-south orientation, the greatest strength of the waves was in an east-west direction.
Early Warning
The large tsunami which struck 11 of the nations that border the Indian Ocean was a complete surprise for the people living on the area, but not for the scientists who are aware of the tectonic interactions in the region. Many seismic networks recorded the massive earthquake, but there was no tide gauges or other wave sensors to provide confirmation as to whether a tsunami had been generated. There was no established communications network or organizational infrastructure to pass a warning of any kind to the people on the coastlines. Non existence of an early warning system is considered as the main cause of the huge number of casualties in the effected countries, in this disaster.
Deaths
The tsunami had its greatest impact and casualties in Indonesia, Thailand, India, Sri-Lanka, Malaysia, Myanmar, Maldives and Somalia. Eleven (11) countries reported deaths, some in tens of thousands. Over 226,000 people are known to have lost their lives including tourists from different parts of the world that came to these countries on vacation. Thousands are missing and many more may have been killed in remote islands. More than 1.5 million people were left homeless around the region.
Worldwide effect
The tsunami waves caused considerable destruction and killed people more than 2,000 kilometers away. Over 226,000 people are known to have lost their lives from different parts of the world.
Due to the distances involved, the tsunami took anywhere from fifteen minutes to seven hours (for Somalia) to reach the various coastlines. The northern regions of the Indonesian island of Sumatra were hit very quickly, while Maldives, Sri Lanka and the east coast of India were hit roughly two hours later. Thailand was also struck about two hours later, despite being closer to the epicentre, because the tsunami travelled more slowly in the shallow Andaman Sea off its western coast.
Waves of up to 10.5 meters in height struck Northern Sumatra, the Nicobar and Andaman Islands, Thailand, Sri Lanka, India. Destructive waves also struck the Maldives, Somalia, Kenya and the islands off the African coast, 4500 km west of the epicenter..

Visiting Researcher Program FY2014B
19 | P a g e
Great East Japan Earthquake/ Tsunami (March 2011) The 2011 earthquake off the Pacific coast of Tōhoku often referred to in Japan as Higashi nihon daishinsai and also known as the 2011 Tohoku earthquake, the Great East Japan Earthquake, and the 3.11 Earthquake, was a magnitude 9.03 (Mw) undersea mega thrust earthquake off the coast of Japan that occurred at 14:46 on 11 March 2011, with the epicentre approximately 70 kilometres (43 mi) east of the Oshika Peninsula of Tōhoku and the hypocenter at an underwater depth of approximately 30 km (19 mi). It was the most powerful known earthquake ever to have hit Japan, and the fifth most powerful earthquake in the world since modern record-keeping began in 1900. The earthquake triggered powerful tsunami waves that reached heights of up to
40.5 metres (133 ft) in Miyako in Tōhoku's Iwate Prefecture, and which, in the Sendai area, travelled up to 10 km (6 mi) inland. The earthquake moved Honshu (the main island of Japan) 2.4 m (8 ft) east and shifted the Earth on its axis by estimates of between 10 cm (4 in) and 25 cm (10 in). Japan Meteorological Agency reported that the type of earthquake source fault was the reverse fault, the size of fault was about 450 km long and 200 km wide, the fault slippage was 20 to 30 meters (maximum), and the duration of main failure was about three minutes.
The cause
The 2011 Tohoku earthquake struck offshore of Japan, along a subduction zone where two of Earth's tectonic plates collide. In a subduction zone, one plate slides beneath another into the mantle, the hotter layer beneath the crust. The great plates stick and slip, causing earthquakes. East of Japan, the Pacific plate dives beneath the overriding Eurasian plate. The temblor completely released centuries of built up stress between the two
tectonic plates.
Early warning
Residents of Tokyo received a minute of warning before the strong shaking hit the city, thanks to Japan's earthquake early warning system. The country's stringent seismic building codes and early warning system prevented many deaths from the earthquake, by stopping high-speed trains and factory assembly lines. People in Japan also received texted alerts of the earthquake warning on their cell phones.
Figure 18: Great East Japan earthquake and
Tsunami - Epicenter
Figure 19: Houses, cars , ships were carried
away by the tsunami wave,

Visiting Researcher Program FY2014B
20 | P a g e
Deaths
More than 18,000 people were killed in the disaster. Most died by drowning.
Less than an hour after the earthquake, the first of many tsunami waves hit Japan's coastline. The tsunami waves reached run-up heights (how far the wave surges inland above sea level) of up to 128 feet (39 meters) at Miyako city and traveled inland as far as 6 miles (10 km) in Sendai. The tsunami flooded an estimated area of approximately 217 square miles (561 square kilometers) in Japan.
The waves overtopped and destroyed protective tsunami seawalls at several locations. The massive surge destroyed many evacuation centers where people had gathered for safety. Near Oarai, the tsunami generated a huge whirlpool offshore, captured on video.
Nuclear meltdown
The tsunami caused nuclear accidents, primarily the level 7 meltdowns at three reactors in the Fukushima Daiichi Nuclear Power Plant complex, and the associated evacuation zones affecting hundreds of thousands of residents. Many electrical generators were taken down, and at least three nuclear reactors suffered explosions due to hydrogen gas that had built up within their outer containment buildings after cooling system failure. Residents within a 20 km (12 mi) radius of the Fukushima Daiichi Nuclear Power Plant and a 10 km (6.2 mi) radius of the Fukushima Daiichi Nuclear Power Plant were evacuated. About 300 tons of radioactive water continues to leak from the plant every day into the Pacific Ocean, affecting fish and other marine life.
Worldwide effects
The tsunami waves also traveled across the Pacific, reaching Alaska, Hawaii and Chile. In Chile, some 11,000 miles (17,000 km) distant, the tsunami was 6.6 feet (2 meters) high when they reached the shore.
The surge of water carried tons of debris out to sea as it receded. Japanese docks and ships, and countless household items, have arrived on U.S. and Canadian shores in the ensuing years.
Figure 20: Nuclear accident caused due to
Tsunami

Visiting Researcher Program FY2014B
21 | P a g e
A Data Collection and Processing System for Assured Communication
Japan is hyperaware of its shaky ground. The country withstands some thousand tremors a year, and they’ve got 180 seismographs and 600 seismic intensity meters constantly tuned to what’s going on in the underworld. They also have around 30 sea level gauges operated by the coast guard and around 80 operated by the JMA that work in chorus to provide feedback to a Data Processing and Communication system. The sensors take a reading, upload it to a central processing system using old-fashioned wires and/or satellite uplink, and that central system sends updates to the government, police, coast guard, telephone companies, and the media. Sea level gauges also report disturbances in real time and help organisations model trajectory and size of the oncoming waves.
And then there are more specialised tools. There are tsunami detection buoys that help rule out false alarms and give monitoring agencies a better idea of what they’re in for – or what they’re not. Deep Ocean Assessment and Reporting of Tsunami system, is made up of an anchored sea floor bottom pressure recorder and accompanying fiberglass and foam buoy on the surface. The recorder on the ocean floor, which takes a note of temperature and pressure every 15 seconds, sends data via an acoustic link to the surface buoy. The buoy then sends information by satellite to Tsunami warning centres.
JMA monitors seismic activity and issues Warnings/Advisories and information on a 24-hour basis. To provide these resources urgently and precisely, JMA needs to collect various seismic data and analyze them quickly. To this end, the Agency operates a comprehensive system called EPOS (the Earthquake Phenomena Observation System). This is responsible for issuing Earthquake Early Warnings, Tsunami Warnings/Advisories, and Earthquake Information.
Figure 21: Data collection and Dissemination of information
Source JMA

Visiting Researcher Program FY2014B
22 | P a g e
Warnings/Advisories and information issued by JMA are transmitted to disaster management authorities, local governments and the broadcasting media over a nationwide computer network immediately. Disaster management authorities and local governments take action to mitigate disasters based on these resources. Such action is also announced to the public through the media and the Internet.
Earthquake and Tsunami Monitoring
Located in one of the most active seismic and volcanic zones in the world, Japan is frequently affected by earthquakes and volcanic disasters. JMA operationally monitors seismic and volcanic activity throughout the country and issues relevant warnings and information to mitigate damage caused by disasters related to earthquakes, tsunamis and volcanic eruptions. To monitor earthquakes, JMA operates an earthquake observation network comprised of about 200 seismographs and 600 seismic intensity meters. It also collects data from over 3,600 seismic intensity meters managed by local governments and the National Research Institute for Earth Science and Disaster Prevention (NIED). The data collected are input to the Earthquake Phenomena Observation System (EPOS) at the headquarters in Tokyo and the Osaka District Meteorological Observatory on a real-time basis.
Seismometer Network
When an earthquake occurs, it is important to know its location and magnitude. To achieve this, JMA observe its waves and analyze its hypocenter and magnitude; an instrument used to observe earthquake waves is called a seismometer. JMA operates a seismic network consisting of about 200 seismometers and collects seismic waveform data in real time around the clock. The Agency also uses seismometers belonging to the National Research Institute for Earth Science and Disaster Prevention (NIED), and issues Earthquake Early Warnings, Tsunami Warnings / Advisories and Earthquake Information. JMA also collects and analyzes seismic data from NIED, universities and related institutes in order to conduct comprehensive assessment of seismic activity for the promotion of research activities in cooperation with the Ministry of Education, Culture, Sports, Science and Technology (MEXT). The products of this analysis are shared with the relevant organizations.
Figure 22: Seismic intensity network
Source JMA
Figure 23: JMA Seismic station

Visiting Researcher Program FY2014B
23 | P a g e
Seismic Intensity Network
A seismic intensity meter is an instrument that measures and records the seismic intensity of ground motion. JMA has installed about 600 seismic intensity meters throughout the country, and also collects seismic intensity data from another 3,600 stations (as of Apr. 1, 2009) operated by local governments and the National Research Institute for Earth Science and Disaster Prevention (NIED). These data are used for Earthquake Information issued by JMA.
Earthquake Information issued by Japan Meteorological Agency
Earthquake Early Warnings (EEWs) are issued slightly after an earthquake occurs. There are no earthquake predictions which tell us occurrence of earthquake in advance.
As soon as an earthquake occurs, the EEW system uses seismometers located near the epicenter to calculate the hypocenter, magnitude and P-wave data detected by the area that will be subjected to strong shaking, and provides a first announcement. EEWs are transmitted promptly. A sophisticated observation system to detect seismic waves quickly, technology that enables forecasting from very weak shaking and communication technology for prompt dissemination are the elements that enable JMA to issue EEWs. The Earthquake Early Warning is aimed at mitigating earthquake-related damage by allowing
Figure 24: Seismic intensity network
Source JMA
Figure 25: earthquake early warning

Visiting Researcher Program FY2014B
24 | P a g e
countermeasures such as promptly slowing down trains, controlling elevators to avoid danger and enabling people to quickly protect themselves in various environments such as factories, offices, and houses and near cliffs.
Title Content and Timing to be issued
Seismic Intensity Information
This information is issued within about two minutes from an earthquake to provide information on the regions where seismic intensity of 3 or more was observed. Each prefecture is divided into 2 or more regions.
Earthquake Information
The location and magnitude of an earthquake is determined within about three minutes. In case of no tsunamigenic earthquake, the message of “Tsunami is not expected” is added.
Earthquake and Seismic Intensity Information
This information indicates the location of the hypocenter, magnitude, and name of regions, cities, towns and villages in which intensity of 3 or more was observed.
Information on seismic intensity at each site
All stations which observed intensity of 1 or more, hypocenter location and magnitude of the earthquake are provided.
Shake Map Just after an earthquake, the shaking-intensity map is prepared. This map is produced taking into account local geological conditions and observed seismic intensity
Information on the number of earthquakes
When earthquakes occur frequently in a same place called earthquake swarm, hourly/daily number of earthquakes is provided.

Visiting Researcher Program FY2014B
25 | P a g e
Response to a Earthquake Early Warning System
The period between the Earthquake Early Warning and the arrival of strong tremors is very short, i.e. a matter of seconds (or between several seconds and a few tens of seconds). As a result, areas that are close to the focus of the earthquake may not receive the Earthquake Early Warning transmission before strong tremors hit. And there are limits to the accuracy of the Earthquake Early Warning, such as the estimated seismic intensity. This is because the system is necessarily dependent on very short-term data. It is important to be aware of these features and limitations when responding to Earthquake Early Warnings.
Figure 26: Response to an earthquake early warning

Visiting Researcher Program FY2014B
26 | P a g e
Limitations of the Earthquake Early Warning
Timing The window of time from the announcement of an Earthquake Early Warning until the arrival of the main tremors is very short, i.e. a matter of seconds (or between several seconds and a few tens of seconds). In areas that are close to the focus of the earthquake, the warning may not be transmitted before strong tremors hit. False alarms When using data from only one seismograph, false Earthquake Early Warnings may occur as a result of noise from accidents, lightning or device failure. Magnitude estimation There are limits to the accuracy of estimating magnitude, especially for large earthquakes. It is difficult to separate earthquakes and provide accurate warnings when multiple earthquakes occur almost simultaneously or in close proximity to each other. Seismic intensity estimation There are limits to the accuracy of estimating seismic intensity by statistical attenuation formula, as well as limits to the prediction of land surface amplification. The Japan Meteorological Agency plans to continue improving the accuracy and timing of the Earthquake Early Warning through joint research with the National Research Institute for Earth Science and Disaster Prevention, and also intends to make further efforts toward publicizing the Earthquake Early Warning.
Tsunami Monitoring Network
When tsunamis are observed, JMA issues tsunami observation information including observation points, tsunami heights and expected times of arrival. The Agency operates about 70 tidal gauge stations and also collects real-time sea-level data from stations operated by the Ports and Harbors Bureau (Ministry of Land, Infrastructure, Transport

Visiting Researcher Program FY2014B
27 | P a g e
and Tourism), the Geographical Survey Institute and the Japan Coast Guard. Currently, JMA issues tsunami information using data from about 170 stations.
Tsunami Observation
Tide gauges and tsunami meters are used to observe sea levels and tsunamis in coastal areas. When a very large tsunami with heights exceeding the measurement range of these instruments is generated, huge-tsunami meters are used. GPS buoys are installed offshore to detect tsunamis promptly, and offshore-water-pressure gauges are installed farther offshore to help clarify the situation of tsunamis in their early stages.
Figure 27: Tsunami Observation
Source Tohoku Regional Bureau of MLIT

Visiting Researcher Program FY2014B
28 | P a g e
Tsunami Information issued by JMA
When a large earthquake occurs in a sea area, JMA issues a Tsunami Warning/Advisory. A numerical simulation technique is used to estimate tsunami potential and propagation. After an earthquake occurs, Tsunami Warnings / Advisories must be issued immediately to enable evacuation before the wave strikes coastal areas. To enable immediate issuance of Tsunami Warnings / Advisories, JMA has conducted computer simulation of tsunamis with earthquake scenarios involving various locations and magnitudes, and the resulting information on tsunami arrival times and heights is stored on a database. If a large earthquake occurs, the operation system quickly calculates its hypocenter and magnitude, searches the tsunami database referring to these calculations, and selects the closest-matching results from the database. Using the estimated height of the tsunami for each coastal region, JMA issues a Tsunami Warning/Advisory.
Figure 28: Computer simulated tsunamis are stored on a
data base
Source JMA
Figure 29: Issuing of Tsunami warning advisories
Source JMA

Visiting Researcher Program FY2014B
29 | P a g e
Flow of information about Earthquake and Tsunami
When an earthquake occurs, the Japan Meteorological Agency (JMA) estimates the possibility of tsunami generation from seismic observation data. If disastrous waves are expected in coastal regions, JMA issues a Tsunami Warning/Advisory for each region expected to be affected based on estimated tsunami heights. JMA also issues information on tsunami details such as estimated arrival times and heights.
Figure 30: Flow of information, earthquake and tsunami
Source JMA

Visiting Researcher Program FY2014B
30 | P a g e
Tsunami Warning/Advisory
When an earthquake occurs that could generate a disastrous tsunami in coastal regions of Japan, JMA issues Major Tsunami Warnings, Tsunami Warnings and/or Tsunami Advisories for individual regions based on estimated tsunami heights around three minutes after the quake (or as early as two minutes in some cases). Immediately after an earthquake occurs, JMA promptly establishes its location, magnitude and the related tsunami risk. However, it takes time to determine the exact scale of earthquakes with a magnitude of 8 or more. In such cases, JMA issues an initial warning based on the predefined maximum magnitude to avoid underestimation. When such values are used, estimated maximum tsunami heights are expressed in qualitative terms such as "Huge" and "High" in initial warnings rather than as quantitative expressions. Once the exact magnitude is determined, JMA updates the warning with estimated maximum tsunami heights expressed in quantitative terms.
Figure 31: Tsunami warning / Advisory categories and action to be taken
Source JMA
Visiting Researcher Program FY2014B
31 | P a g e
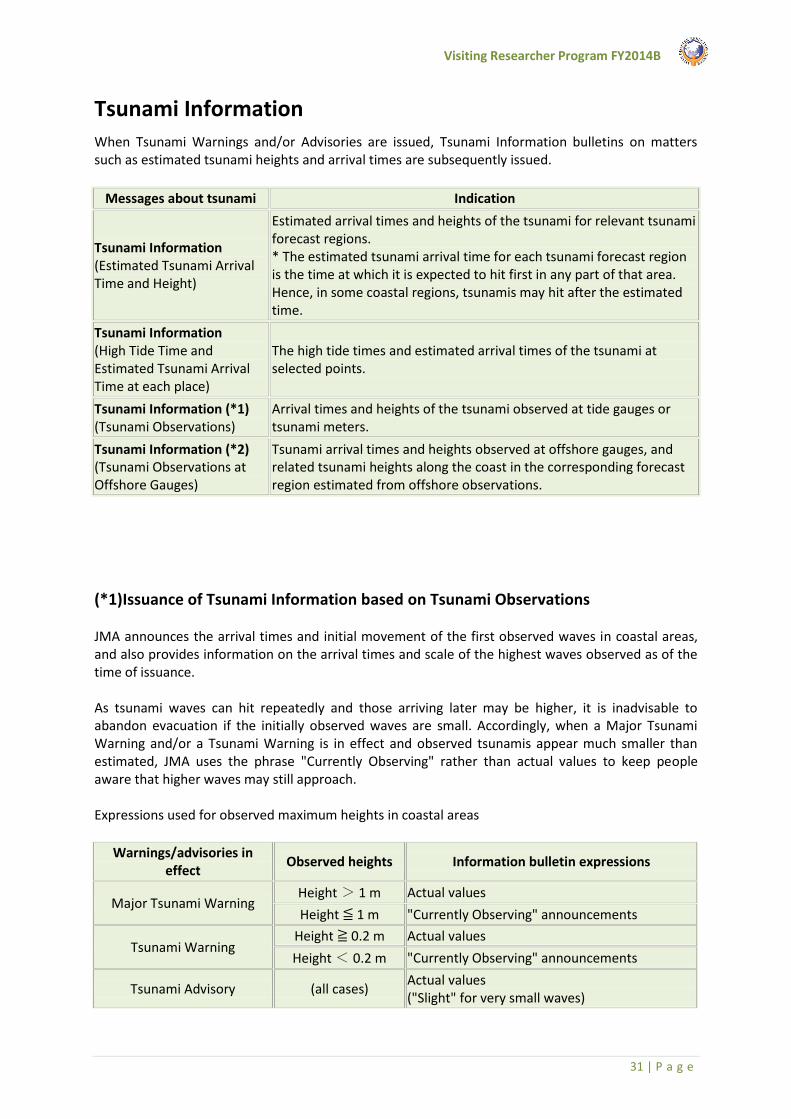
Tsunami Information
When Tsunami Warnings and/or Advisories are issued, Tsunami Information bulletins on matters such as estimated tsunami heights and arrival times are subsequently issued.
Messages about tsunami Indication
Tsunami Information (Estimated Tsunami Arrival Time and Height)
Estimated arrival times and heights of the tsunami for relevant tsunami forecast regions. * The estimated tsunami arrival time for each tsunami forecast region is the time at which it is expected to hit first in any part of that area. Hence, in some coastal regions, tsunamis may hit after the estimated time.
Tsunami Information (High Tide Time and Estimated Tsunami Arrival Time at each place)
The high tide times and estimated arrival times of the tsunami at selected points.
Tsunami Information (*1) (Tsunami Observations)
Arrival times and heights of the tsunami observed at tide gauges or tsunami meters.
Tsunami Information (*2) (Tsunami Observations at Offshore Gauges)
Tsunami arrival times and heights observed at offshore gauges, and related tsunami heights along the coast in the corresponding forecast region estimated from offshore observations.
(*1)Issuance of Tsunami Information based on Tsunami Observations JMA announces the arrival times and initial movement of the first observed waves in coastal areas, and also provides information on the arrival times and scale of the highest waves observed as of the time of issuance. As tsunami waves can hit repeatedly and those arriving later may be higher, it is inadvisable to abandon evacuation if the initially observed waves are small. Accordingly, when a Major Tsunami Warning and/or a Tsunami Warning is in effect and observed tsunamis appear much smaller than estimated, JMA uses the phrase "Currently Observing" rather than actual values to keep people aware that higher waves may still approach. Expressions used for observed maximum heights in coastal areas
Warnings/advisories in effect
Observed heights Information bulletin expressions
Major Tsunami Warning Height > 1 m Actual values
Height ≦ 1 m "Currently Observing" announcements
Tsunami Warning Height ≧ 0.2 m Actual values
Height < 0.2 m "Currently Observing" announcements
Tsunami Advisory (all cases) Actual values ("Slight" for very small waves)

Visiting Researcher Program FY2014B
32 | P a g e
(*2)Issuance of Tsunami Information based on Tsunami Observations at Offshore Gauges
JMA announces the arrival times and initial movements of the first observed waves offshore, and also provides information on the arrival times and scale of the highest waves observed as of the time of issuance. JMA also announces estimated data for tsunami waves in coastal areas (arrival times of initial waves and arrival times/heights of maximum waves) for each tsunami forecast region expected to be affected.
JMA does not provide actual values for observed tsunami heights offshore or estimated maximum tsunami heights for coastal areas until the thresholds for issuance are reached (in the same way as those for coastal areas) in consideration of the related influence on people's evacuation. When a Major Tsunami Warning and/or a Tsunami Warning is in effect and estimated tsunami heights for coastal areas are small, JMA uses the phrase "Currently Observing" for observed heights offshore and "Currently Investigating" for estimated heights in coastal areas to keep people aware that higher waves may still approach.
Expressions used for observed maximum heights at offshore gauges and estimated maximum heights in coastal areas.
Warnings/advisories in effect
Estimated tsunami heights for coastal
areas Information bulletin expressions
Major Tsunami Warning
Height > 3 m Actual values for observed heights at offshore gauges and estimated heights in coastal areas
Height ≦ 3 m "Currently Observing" for offshore observations and "Currently Investigating" for estimated heights in coastal areas
Tsunami Warning
Height > 1 m Actual values for observed heights at offshore gauges and estimated heights in coastal areas
Height ≦ 1 m "Currently Observing" for offshore observations and "Currently Investigating" for estimated heights in coastal areas
Tsunami Advisory (all cases) Actual values for observed heights at offshore gauges and estimated heights in coastal areas
For gauges more than 100 km offshore, JMA does not announce the relevant estimated tsunami heights for coastal areas due to the difficulty of determining which tsunami forecast regions waves will reach from offshore gauges. Announcement of tsunami heights observed at such gauges is begun when JMA issues an information bulletin detailing actual values for observed and estimated heights from other offshore gauges closer to the coast. Until this time, the phrase "Currently Observing" is used.

Visiting Researcher Program FY2014B
33 | P a g e
Tsunami Forecast
After an earthquake occurs, if no damage is expected, JMA issues Tsunami Forecasts.
Forecasted sea level changes Message
No tsunami is expected "No tsunami is expected." (To be included in Earthquake Information.)
Tsunami height less than 0.2 meters is expected
No damage is expected because sea level changes will be less than 0.2 m, and no special action is needed.
Slight sea level changes are expected to continue
after Tsunami Warnings/advisories are
cleared
Particular attention is needed when fishing, swimming or engaging in other marine activities because tsunami-related sea level changes have been observed and may continue for a while.
Observation, Forecasting and Warning of Disaster Risks
Observation systems that can accurately detect disaster risks in real-time have been progressively improved for establishing early warning systems, supporting early evacuation and response activities, and thereby reducing disaster damage. Organizations involved in disaster reduction, especially the JMA, use 24-hour systems to carefully monitor various natural phenomena and weather conditions. In addition to observed information the JMA issues a wide range of forecasts, warnings and advisories. Furthermore, in August 2013, it started to issue “Emergency Warnings” in case that a severe disaster far exceeding the past level of issuing warnings is anticipated.
Visiting Researcher Program FY2014B
34 | P a g e
Information and communication system
Issuing Evacuation Advisory and Order
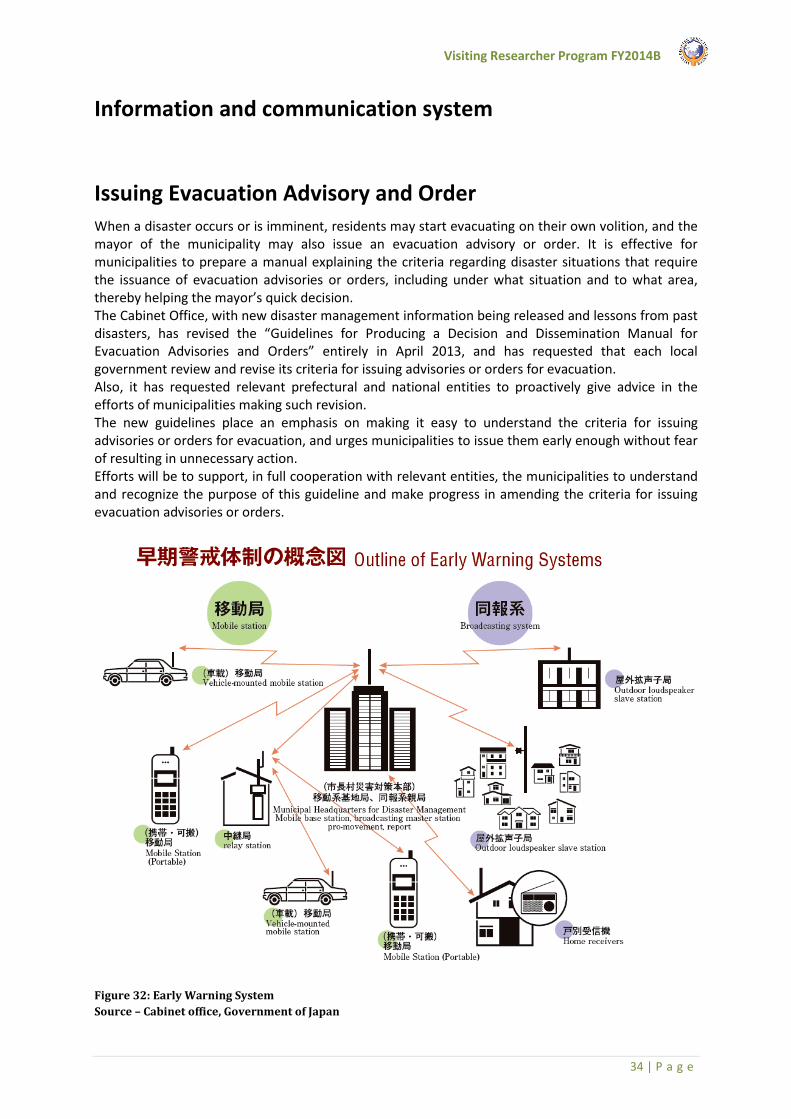
When a disaster occurs or is imminent, residents may start evacuating on their own volition, and the mayor of the municipality may also issue an evacuation advisory or order. It is effective for municipalities to prepare a manual explaining the criteria regarding disaster situations that require the issuance of evacuation advisories or orders, including under what situation and to what area, thereby helping the mayor’s quick decision. The Cabinet Office, with new disaster management information being released and lessons from past disasters, has revised the “Guidelines for Producing a Decision and Dissemination Manual for Evacuation Advisories and Orders” entirely in April 2013, and has requested that each local government review and revise its criteria for issuing advisories or orders for evacuation. Also, it has requested relevant prefectural and national entities to proactively give advice in the efforts of municipalities making such revision. The new guidelines place an emphasis on making it easy to understand the criteria for issuing advisories or orders for evacuation, and urges municipalities to issue them early enough without fear of resulting in unnecessary action. Efforts will be to support, in full cooperation with relevant entities, the municipalities to understand and recognize the purpose of this guideline and make progress in amending the criteria for issuing evacuation advisories or orders.
Figure 32: Early Warning System
Source – Cabinet office, Government of Japan

Visiting Researcher Program FY2014B
35 | P a g e
Central Disaster Prevention Radio Network
The development of a quick and accurate communications system is essential for the effective use of disaster early warning information. For this purpose an online system has been built, linking the JMA with disaster management organizations of the national and local governments and media organizations. Disaster management organizations have also been developing radio communications networks exclusively for disasters: the CAO's Disaster Prevention Radio Communication System, which connects national organizations; the Fire Disaster Management Radio Communication System, which connects firefighting organizations across the country; and prefectural and municipal disaster management radio communications systems, which connect local disaster management organizations and residents. The Cabinet Office has established the CAO's Disaster Prevention Radio Communication System to link with designated government organizations, designated public corporations and prefectural governments, providing communications by telephone, fax, data transmission, video conferencing and video transmission of disaster situations from helicopters and other sources. Simultaneous wireless communications systems using outdoor loudspeakers and indoor radio receivers are used to disseminate disaster information to residents. Tsunami and severe weather warnings are widely provided to citizens via TV and radio broadcasts.
Figure 33: Disaster Pretension communication syste
Source – Cabinet office, Government of Japan

Visiting Researcher Program FY2014B
36 | P a g e
Dissemination of Forecast and EW
In order to prevent and mitigate damage caused by natural disasters and support prompt disaster prevention activities, JMA disseminates weather information and warnings via various channels to government disaster prevention agencies, local governments, the mass media and the public. For this purpose, the Agency maintains direct communication links with meteorological offices and central/local governments. Strong communication with municipal governments that play direct roles in disaster management and mitigation in affected areas is essential. Such communication is ensured via various channels for information dissemination, such as prefectural governments, NTT (Nippon Telegraph and Telephone Corporation), J-ALERT (an instant information broadcasting system introduced by the Fire and Disaster Management Agency (FDMA) and the Internet. To support prompt disaster mitigation activities by local governments, the Agency has introduced a new information provision system called the Information Network for Disaster Prevention (INDiP), which enables effective and rapid dissemination of data in both text and graphic form. INDiP connects disaster prevention agencies and local governments with JMA headquarters via the Internet and provides detailed weather information and warnings tailored to individual municipalities. Information for maritime users is transmitted via the JMH radio facsimile broadcast service operated by JMA and fishery radio communications services. Such information is also disseminated within the framework of the Global Maritime Distress and Safety System (GMDSS), i.e. via the NAVTEX broadcast service of the Japan Coast Guard for seas in the vicinity of Japan, and via the Safety-Net broadcast service for ships in the high seas via the maritime satellite INMARSAT. Nowadays, the Internet plays a vital role for JMA in the public dissemination of a wide range of meteorological information not only on forecasts but also on historical and current observation data.
Figure 34: Flow of information from JMA to the public
Visiting Researcher Program FY2014B
37 | P a g e
J-Alert System
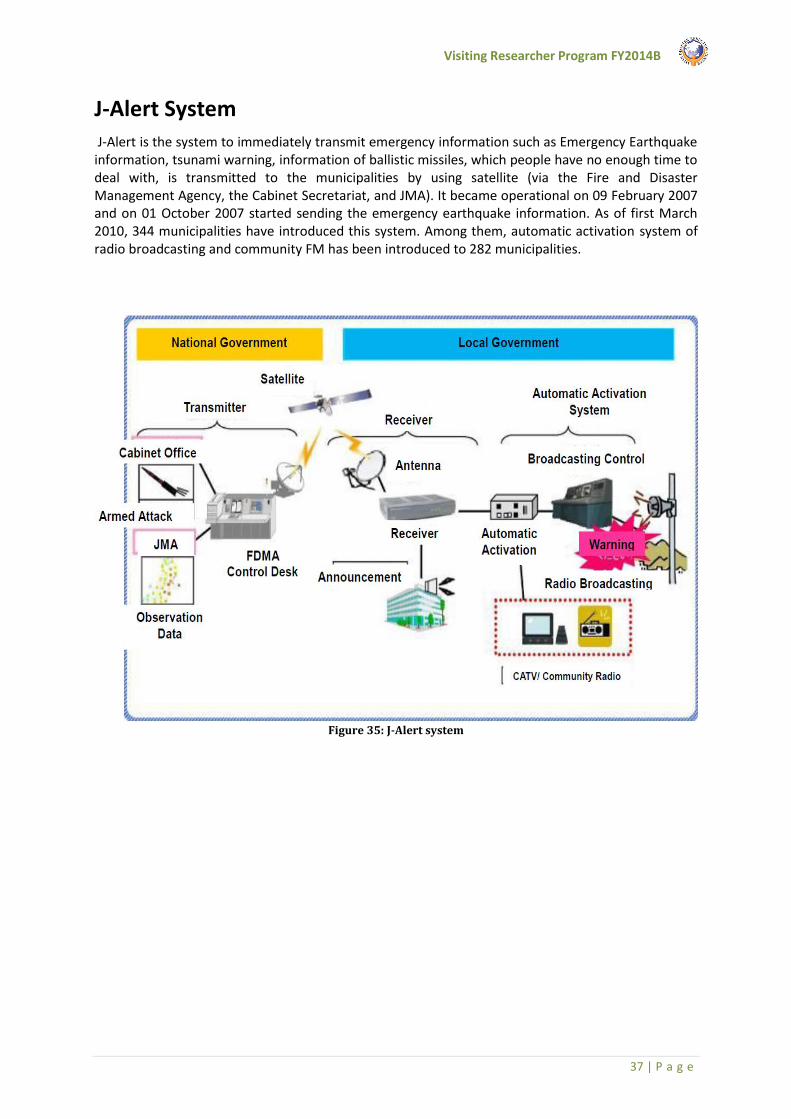
J-Alert is the system to immediately transmit emergency information such as Emergency Earthquake information, tsunami warning, information of ballistic missiles, which people have no enough time to deal with, is transmitted to the municipalities by using satellite (via the Fire and Disaster Management Agency, the Cabinet Secretariat, and JMA). It became operational on 09 February 2007 and on 01 October 2007 started sending the emergency earthquake information. As of first March 2010, 344 municipalities have introduced this system. Among them, automatic activation system of radio broadcasting and community FM has been introduced to 282 municipalities.
Figure 35: J-Alert system

Visiting Researcher Program FY2014B
38 | P a g e
Distant Earthquake Information and International Tsunami Advisories
JMA monitors seismic activity not only around Japan but also worldwide. If a tsunami generated by a distant earthquake is expected to hit the Japanese coast and possibly cause disastrous conditions, JMA issues Tsunami Warnings/Advisories in the same way as for local tsunamis. When a major earthquake occurs somewhere far from Japan, the Agency issues Distant Earthquake Information to the public. Tsunamis spread ocean-wide regardless of the borders of countries, and can cause serious damage in multiple coastal areas. In order to protect human life and property against tsunami hazards, we must work together with overseas related organizations. Within a worldwide framework for a tsunami warning system, countries exchange observational data and information to enable earthquake/tsunami detection and measures against expected tsunamis as early as possible. Japan has a wealth of experience and knowledge on tsunamis, and JMA, in such an international partnership role, plays a major part in contributing to tsunami disaster management measures in other countries. When a large earthquake occurs in the Sea of Japan, the northwestern Pacific region or the Indian Ocean, the Agency analyzes the related observation data and quickly provides International Tsunami Advisories to the countries in each region. These advisories contain information on the earthquake and the possibility of tsunamis, and are used in the recipient countries for the implementation of emergency action such as nationwide tsunami warnings and official evacuation.

Visiting Researcher Program FY2014B
39 | P a g e
Recommendations when Developing an Early Warning System
Early Warning Systems plays a major role in saving human lives and reduce economic losses caused due to natural disasters such as earthquakes, floods, tsunamis, landslides, and other events. And it gives time for people living on risk areas to escape to higher ground, protecting themselves from falling objects and stopping trains before they are overtaken by these events. But it’s important to start early warning systems in sustainable way for them to have a positive effect on the community on the long run. Link with community-based activities: Warning systems and other measures organized by communities may be particularly relevant in developing countries where government capacity and resources are limited. Start with low-cost systems: Start Warning systems with simple methods. Low-cost equipment, such as fire bells and sirens can be used. And they can evolve by replacing equipment, such as automatic monitoring equipment and telemeter systems, based on these basic systems. Conduct Communication drills: Communities, governments, and experts should exchange information and ideas about potential risks. Communities should be able to understand the information delivered in the warning, while also being aware of the system’s limitations. Also, government staff must understand communities’ response to disasters to design warning systems. Understand the limitations of technology: Although various technologies, such as flood prediction, tsunami simulations, communication systems, and earthquake monitoring are all needed to develop effective warning systems, their limitations must be taken into account. Guidelines for quick decision making: disaster related organizations and government agencies should have a user manual or SOP for quick decision making. explaining when to disseminate the evacuation orders. Understand communities’ coping mechanisms: Since warning systems are meant to benefit communities on the ground and to inform their actions, the responsible organizations should understand how local people cope with and respond to disasters. Community members decide on their own when, where, and how to escape. The organizations should tailor the contents of warning messages to the users’ needs and points of view. Such messages need to be simple, timely, and encourage evacuation. Establish uninterrupted systems: To ensure that warnings reach the communities at risk. Multiple communication channels should be established so that information keeps flowing in case of power and communication failures. (eg: SMS, loudspeakers, sirens.. etc) Ensure services are available 24/7: Since natural events can happen at any time, the organizations concerned are required to function around the clock—24 hours a day, 7 days a week. Staff duty rotation should be arranged in the organizations.

Visiting Researcher Program FY2014B
40 | P a g e
Reference A3 - brochure_earthquake_and_tsunami.pdf. (n.d.). Retrieved from
http://www.jma.go.jp/jma/en/Activities/brochure_earthquake_and_tsunami.pdf
Asia Watch:About Asia:Japan. (n.d.). Retrieved March 2, 2015, from http://asia-
watch.info/eg/html/aboutasia/aboutasia_japan.html
brochure201203.pdf. (n.d.). Retrieved from
http://www.jma.go.jp/jma/en/Activities/brochure201203.pdf
corporateName=Bureau of Meteorology; address=GPO Box 1289, M. (n.d.). Joint Australian Tsunami
Warning Centre. Retrieved March 9, 2015, from http://www.bom.gov.au/tsunami/info/
Environmental Management and Disaster Preparedness: Lessons Learnt from the Tokage Typhoon
(Typhoon 23 of 2004) in Japan. (2005). UNEP/Earthprint.
Giz Explains: How Earthquake And Tsunami Warning Systems Work. (n.d.). Retrieved March 30,
2015, from http://www.gizmodo.com.au/2011/03/giz-explains-how-earthquake-and-tsunami-
warning-systems-work/
Higashimatsushima Coastal Tsunami Monitoring System | Panasonic’s solutions | Panasonic. (n.d.).
Retrieved March 30, 2015, from http://panasonic.net/es/solution-works/higashimatsushima/
How a tsunami works | How It Works Magazine. (n.d.). Retrieved March 9, 2015, from
http://www.howitworksdaily.com/how-a-tsunami-works/
japan and platonic tectones - Google Search. (n.d.). Retrieved March 2, 2015, from
https://www.google.co.jp/?gfe_rd=cr&ei=7K3zVPSuCpD-8wf5-
IGQBw&gws_rd=ssl#q=japan+and+platonic+tectones
Japan in a subduction zone (1) -- GLGArcs. (n.d.). Retrieved April 3, 2015, from
http://www.glgarcs.net/intro/subduction.html
Japan - Japan.pdf. (n.d.). Retrieved from
http://www.nidm.gov.in/easindia2014/err/pdf/country_profile/Japan.pdf
Leaflet Tsunami Warning (Japan) - tsunamiwarning-leaflet.pdf. (n.d.). Retrieved from
http://www.data.jma.go.jp/svd/eqev/data/en/tsunami/tsunamiwarning-leaflet.pdf

Visiting Researcher Program FY2014B
41 | P a g e
PAPER FORMAT FOR THE INTERNATIONAL SYMPOSIUM on MANAGEMENTS SYSTEMS
FOR DISASTER PREVENTION - IWPM_Kazusa.pdf. (n.d.). Retrieved from
http://management.kochi-tech.ac.jp/PDF/IWPM/IWPM_Kazusa.pdf
Rauhala, E. (2011, March 11). How Japan Became a Leader in Disaster Preparation. Time. Retrieved
from http://content.time.com/time/world/article/0,8599,2058390,00.html
Reviews, C. T. (2012). e-Study Guide for: Diversity Amid Globalization by Rowntree, ISBN
9780131330467. Cram101 Textbook Reviews.
Tsunami 101: How a Tsunami Forms. (n.d.). Retrieved March 9, 2015, from
http://www.canadiangeographic.ca/tsunami/tsunamis101.asp
TSUNAMI MALDIVES LAYOUT - TSUNAMI_MALDIVES_LAYOUT.pdf. (n.d.). Retrieved from
http://www.unep.org/tsunami/reports/TSUNAMI_MALDIVES_LAYOUT.pdf
What We Can Learn From Japan’s Early Earthquake Warning System - viewcontent.cgi. (n.d.).
Retrieved from
http://repository.upenn.edu/cgi/viewcontent.cgi?article=1022&context=momentum
日本の災害対策_入稿.indd - saigaipanf_e.pdf. (n.d.). Retrieved from
http://www.bousai.go.jp/1info/pdf/saigaipanf_e.pdf