tropical cyclone report: hurricane arthur · goes-east visible satellite image of hurricane arthur...
TRANSCRIPT
NATIONAL HURRICANE CENTER TROPICAL CYCLONE REPORT
HURRICANE ARTHUR (AL012014) 1 – 5 July 2014
Robbie Berg National Hurricane Center
20 April 20151
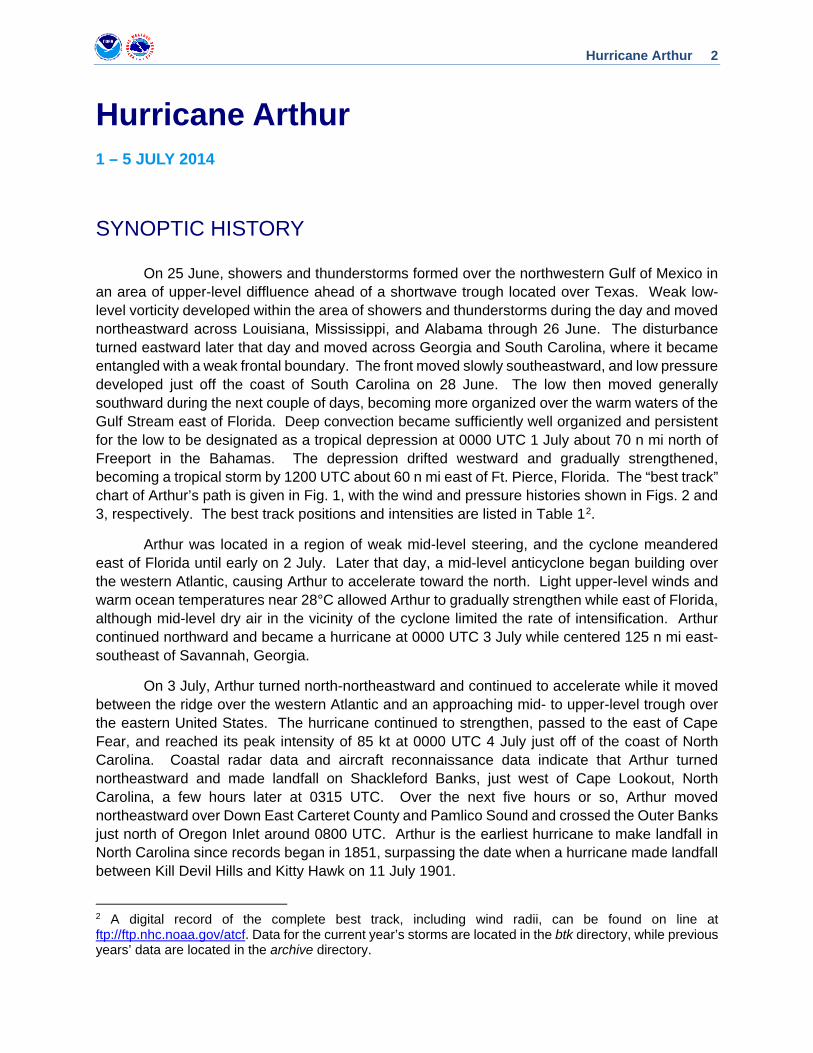
GOES-EAST VISIBLE SATELLITE IMAGE OF HURRICANE ARTHUR AT 1945 UTC 3 JULY 2014 BEFORE ITS LANDFALL
ALONG THE NORTH CAROLINA COAST.
Having non-tropical origins, Arthur formed east of Florida and made landfall along
the North Carolina coast as a category 2 hurricane (on the Saffir-Simpson Hurricane Wind Scale). After producing storm surge flooding and high winds on the Outer Banks, Arthur continued northeastward but stayed offshore of the Mid-Atlantic coast and New England, bringing minor impacts to southeastern Massachusetts. Arthur became an extratropical cyclone by the time it reached the Bay of Fundy just west of Nova Scotia and caused extensive tree damage and power outages across Atlantic Canada.
1 Original report date 20 January 2015. Updated 20 April 2015 to revise Weatherflow observations in Table 3 and Arthur’s minimum central pressure from 972 mb to 973 mb.
Hurricane Arthur 2
Hurricane Arthur 1 – 5 JULY 2014
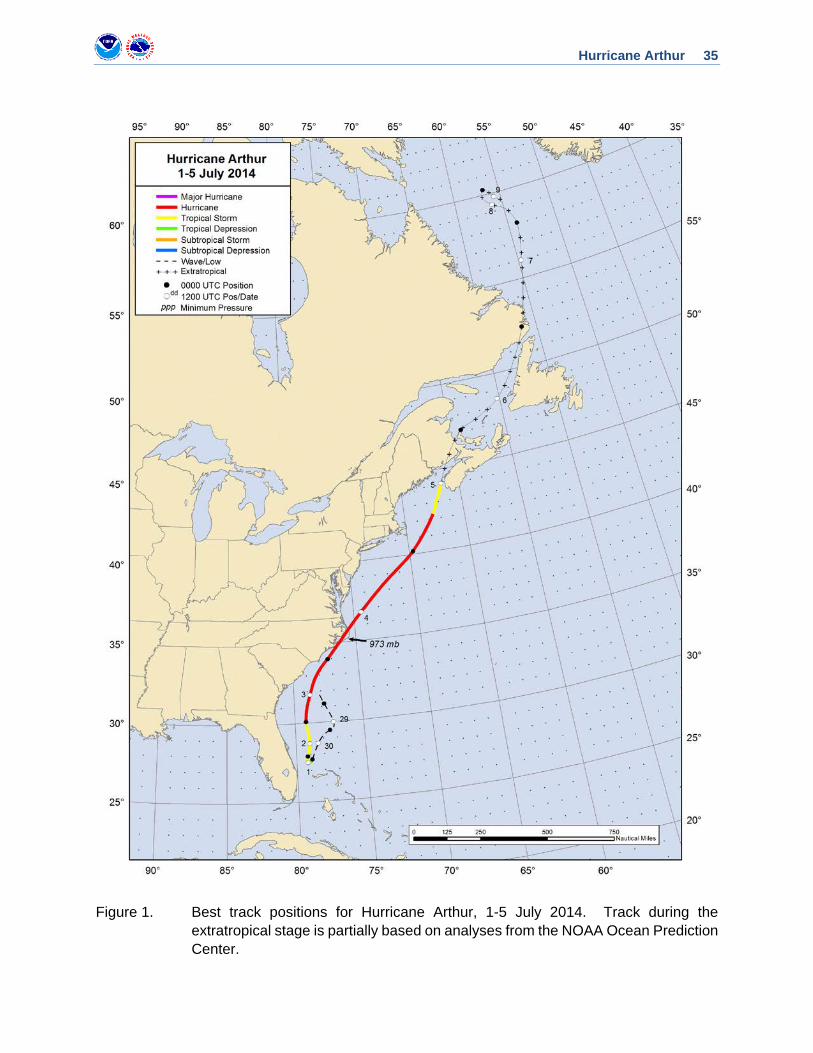
SYNOPTIC HISTORY On 25 June, showers and thunderstorms formed over the northwestern Gulf of Mexico in an area of upper-level diffluence ahead of a shortwave trough located over Texas. Weak low-level vorticity developed within the area of showers and thunderstorms during the day and moved northeastward across Louisiana, Mississippi, and Alabama through 26 June. The disturbance turned eastward later that day and moved across Georgia and South Carolina, where it became entangled with a weak frontal boundary. The front moved slowly southeastward, and low pressure developed just off the coast of South Carolina on 28 June. The low then moved generally southward during the next couple of days, becoming more organized over the warm waters of the Gulf Stream east of Florida. Deep convection became sufficiently well organized and persistent for the low to be designated as a tropical depression at 0000 UTC 1 July about 70 n mi north of Freeport in the Bahamas. The depression drifted westward and gradually strengthened, becoming a tropical storm by 1200 UTC about 60 n mi east of Ft. Pierce, Florida. The “best track” chart of Arthur’s path is given in Fig. 1, with the wind and pressure histories shown in Figs. 2 and 3, respectively. The best track positions and intensities are listed in Table 12.
Arthur was located in a region of weak mid-level steering, and the cyclone meandered east of Florida until early on 2 July. Later that day, a mid-level anticyclone began building over the western Atlantic, causing Arthur to accelerate toward the north. Light upper-level winds and warm ocean temperatures near 28°C allowed Arthur to gradually strengthen while east of Florida, although mid-level dry air in the vicinity of the cyclone limited the rate of intensification. Arthur continued northward and became a hurricane at 0000 UTC 3 July while centered 125 n mi east-southeast of Savannah, Georgia.
On 3 July, Arthur turned north-northeastward and continued to accelerate while it moved between the ridge over the western Atlantic and an approaching mid- to upper-level trough over the eastern United States. The hurricane continued to strengthen, passed to the east of Cape Fear, and reached its peak intensity of 85 kt at 0000 UTC 4 July just off of the coast of North Carolina. Coastal radar data and aircraft reconnaissance data indicate that Arthur turned northeastward and made landfall on Shackleford Banks, just west of Cape Lookout, North Carolina, a few hours later at 0315 UTC. Over the next five hours or so, Arthur moved northeastward over Down East Carteret County and Pamlico Sound and crossed the Outer Banks just north of Oregon Inlet around 0800 UTC. Arthur is the earliest hurricane to make landfall in North Carolina since records began in 1851, surpassing the date when a hurricane made landfall between Kill Devil Hills and Kitty Hawk on 11 July 1901.
2 A digital record of the complete best track, including wind radii, can be found on line at ftp://ftp.nhc.noaa.gov/atcf. Data for the current year’s storms are located in the btk directory, while previous years’ data are located in the archive directory.
Hurricane Arthur 3
After crossing the Outer Banks, Arthur became increasingly embedded in the mid-latitude flow, and the hurricane accelerated northeastward over the western Atlantic late on 4 July and early on 5 July. At the same time, strong upper-level winds and much colder sea surface temperatures caused Arthur to lose some strength and begin extratropical transition, and the cyclone weakened to a tropical storm at 0600 UTC 5 July while located about 115 n mi east of Provincetown, Massachusetts (Cape Cod). Arthur became an extratropical cyclone 6 h later while over the Bay of Fundy just west of Nova Scotia.
The extratropical low continued generally northeastward toward the Gulf of St. Lawrence through 6 July, producing gale-force winds and heavy rain over portions of Nova Scotia, Prince Edward Island, and New Brunswick. The low then reached eastern Labrador (Newfoundland) late on 6 July and crossed into the far northwestern Atlantic over the Labrador Sea on 7 July. Over the next couple of days, the extratropical low’s winds decreased below gale force, and the system dissipated off the eastern coast of Labrador by 0000 UTC 10 July.
METEOROLOGICAL STATISTICS Observations in Arthur (Figs. 2 and 3) include subjective satellite-based Dvorak technique intensity estimates from the Tropical Analysis and Forecast Branch (TAFB) and the Satellite Analysis Branch (SAB). Data and imagery from NOAA polar-orbiting satellites including the Advanced Microwave Sounding Unit (AMSU), the NASA Tropical Rainfall Measuring Mission (TRMM), the European Space Agency’s Advanced Scatterometer (ASCAT), and Defense Meteorological Satellite Program (DMSP) satellites, among others, were also useful in constructing the best track of Arthur.
Aircraft observations include flight-level, stepped frequency microwave radiometer (SFMR), and dropwindsonde observations from ten flights of the 53rd Weather Reconnaissance Squadron of the U. S. Air Force Reserve Command and five flights of the NOAA Aircraft Operations Center (AOC) WP-3D aircraft. In addition, the NOAA AOC G-IV aircraft flew four synoptic surveillance flights around Arthur.
National Weather Service WSR-88D Doppler radar data from Melbourne, Florida; Jacksonville, Florida; Charleston, South Carolina; Wilmington, North Carolina; Morehead City, North Carolina; Wakefield, Virginia; Dover, Delaware; and Boston, Massachusetts, were used to make center fixes and obtain velocity data while Arthur was near the U. S. coast.
Ship reports of winds of tropical storm force associated with Arthur are given in Table 2, and selected surface observations from land stations and data buoys are given in Table 3.
Winds and Pressure Although there were no aircraft missions during the morning hours of 1 July, a NOAA C-MAN site at Settlement Point on Grand Bahama Island measured a two-minute wind of 33 kt at 1220 UTC, supporting Arthur’s upgrade to a 35-kt tropical storm at 1200 UTC.
Hurricane Arthur 4
Arthur is estimated to have become a hurricane around 0000 UTC 3 July. An Air Force reconnaissance mission measured a peak 850-mb flight-level wind of 75 kt at 2137 UTC 2 July, which is suggestive of peak surface winds around 60 kt. However, the SFMR also provided surface wind measurements between 65-70 kt on two separate missions during the day on 2 July. In addition, satellite intensity estimates from TAFB and SAB were T4.0 (65 kt) at 0000 UTC 3 July, and AMSU intensity estimates around that time ranged from 65 kt to 74 kt. A blend of these data supports the 65-kt estimate at 0000 UTC 3 July.
Arthur’s estimated peak intensity of 85 kt beginning at 0000 UTC 4 July is based on a peak 700-mb flight-level wind of 94 kt at 0017 UTC 4 July, as well as SFMR measurements of 82 kt at 1837 UTC 3 July and 83 kt at 0313 UTC 4 July. Since Arthur made landfall along the North Carolina coast at 0315 UTC, these data also support the estimated 85-kt landfall intensity.
Arthur does not appear to have decreased in intensity while it was moving across Pamlico Sound and the Outer Banks. In fact, dropsonde data and surface observations suggest that the hurricane’s minimum pressure occurred after it had made landfall and while the center was over Pamlico Sound. Data from a dropsonde released at 0008 UTC 4 July, a few hours before landfall, suggested that the minimum pressure was about 975 mb. A dropsonde released a few hours later at 0513 UTC while the center of Arthur was over southern Pamlico Sound suggested the minimum pressure had fallen to 973 mb. In addition, a Weatherflow station at Oregon Inlet measured a minimum pressure of 973.7 mb at 0817 UTC around the time of Arthur’s second landfall. Therefore, Arthur’s minimum pressure is estimated to be 973 mb around 0600 UTC. The central pressure began to gradually rise just after Arthur crossed the Outer Banks into the western Atlantic.
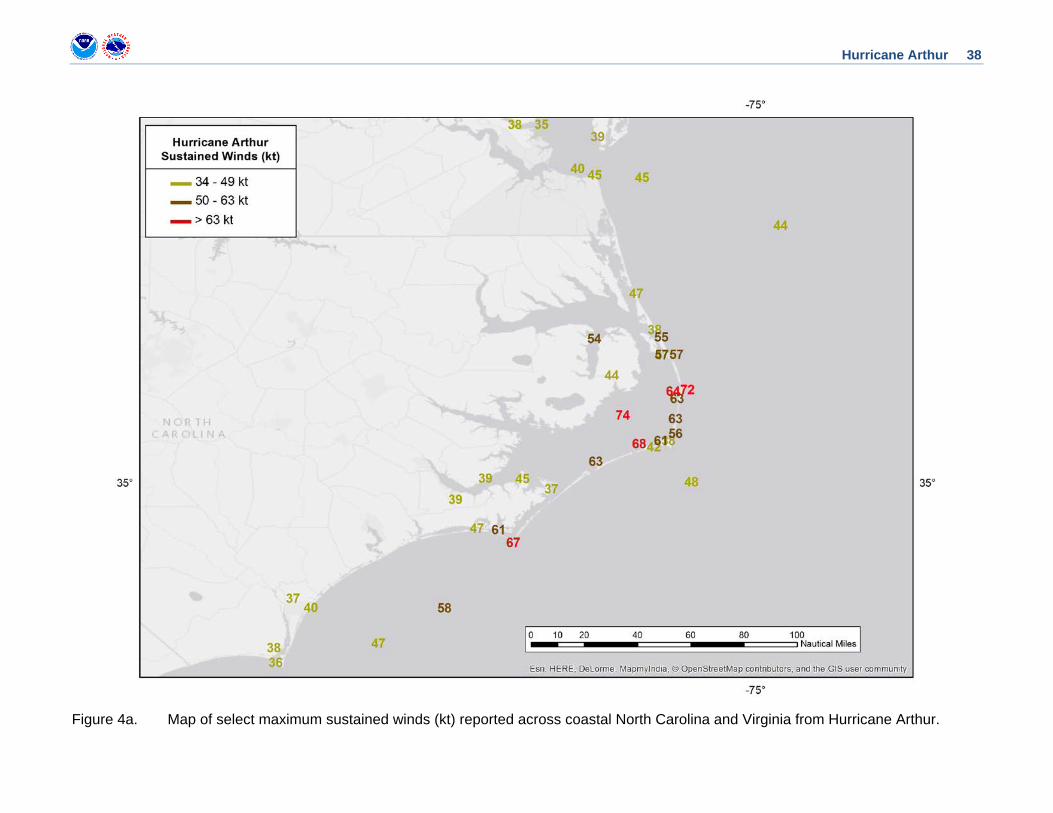
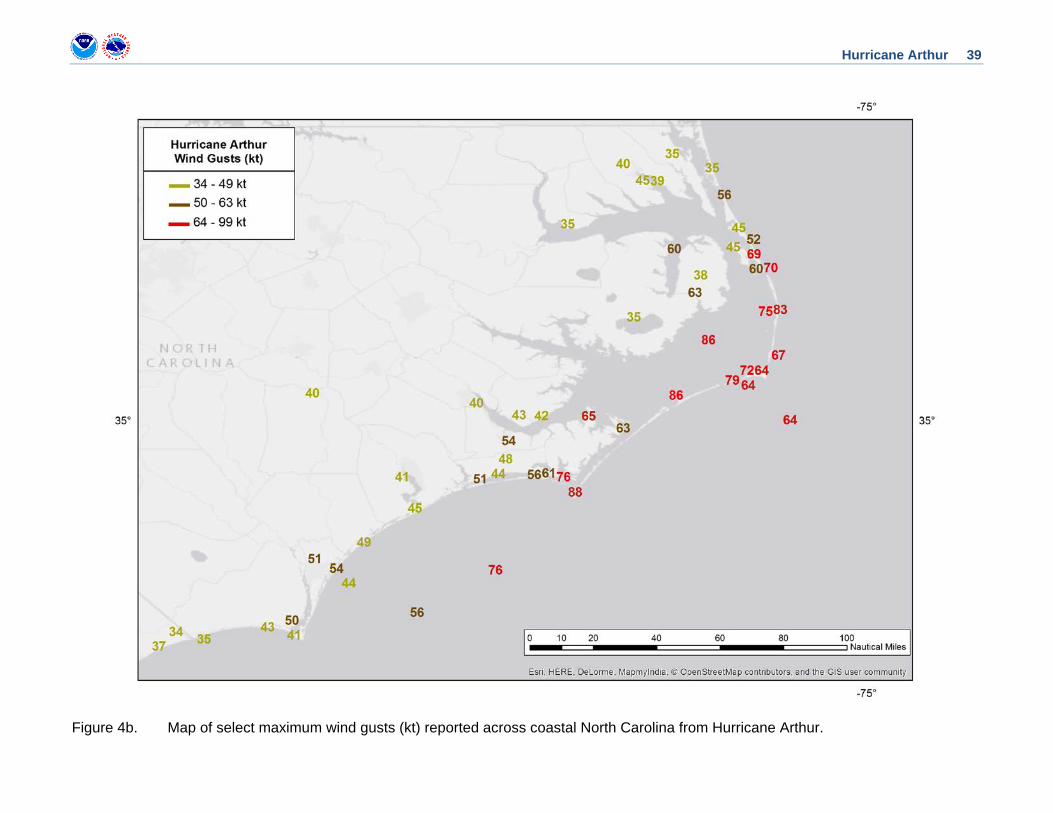
Sustained category 1 winds occurred across portions of extreme eastern North Carolina, especially the Outer Banks, while sustained category 2 winds were limited to marine areas of Pamlico Sound and offshore of the North Carolina coast. The highest sustained winds measured by surface stations were one-minute winds of 74 kt by a Weatherflow station in Pamlico Sound at 0552 UTC and 72 kt by a Weatherflow station in Salvo at 0753 UTC 4 July, and a two-minute wind of 67 kt by the C-MAN station at Cape Lookout at 0220 UTC. The highest measured wind gust was 88 kt at Cape Lookout, while the Weatherflow stations in Pamlico Sound and on Ocracoke Island each measured gusts to 86 kt. Figures 4a and 4b show the maximum sustained winds and gusts, respectively, that were observed across eastern North Carolina from Arthur.
Arthur steadily weakened after it moved away from North Carolina over the western Atlantic. Data from an Air Force mission during the morning of 4 July indicated that while there were still strong winds at flight level (95 kt measured at 1226 UTC), these winds were not effectively mixing down to the ocean surface. The highest surface winds measured by the SFMR on that mission were just under 70 kt. Still, the hurricane was large enough to produce tropical-storm-force winds, especially in gusts, along the coasts of southeastern Virginia and the Delmarva Peninsula. Several stations in southeastern Virginia measured wind gusts around 50 kt.
Farther north, Arthur produced tropical-storm-force wind gusts along the coast of New England from Rhode Island to Maine from late on 4 July through 5 July. Sustained tropical-storm-force winds were confined to extreme southeastern Massachusetts and coastal Maine. In Massachusetts, Nantucket reported a two-minute wind of 43 kt with a gust to 55 kt, and Buzzards Bay reported a two-minute wind of 36 kt with a gust to 43 kt. In Maine, the C-MAN station at
Hurricane Arthur 5
Matinicus Rock measured a two-minute wind of 39 kt with a gust to 47 kt, while a two-minute wind of 33 kt and a gust to 50 kt occurred at Eastport (both measurements occurred while Arthur was still a tropical cyclone).
Arthur produced strong winds across parts of Atlantic Canada during the last hours of its tropical phase and after it became extratropical; the strongest winds occurred east of Arthur’s center over Nova Scotia on 5 July. On the coast, Brier Island measured a two-minute wind of 56 kt with a gust to 66 kt, while Yarmouth measured a gust to 61 kt. Farther inland, a wind gust to 75 kt was measured at Greenwood. Wind gusts to 50 kt were reported farther east in the Halifax area. On Prince Edward Island, the highest wind observation was a two-minute wind was 41 kt with a gust to 55 kt at Charlottetown. In New Brunswick, a two-minute wind of 37 kt with a gust to 57 kt was measured at Fredericton.
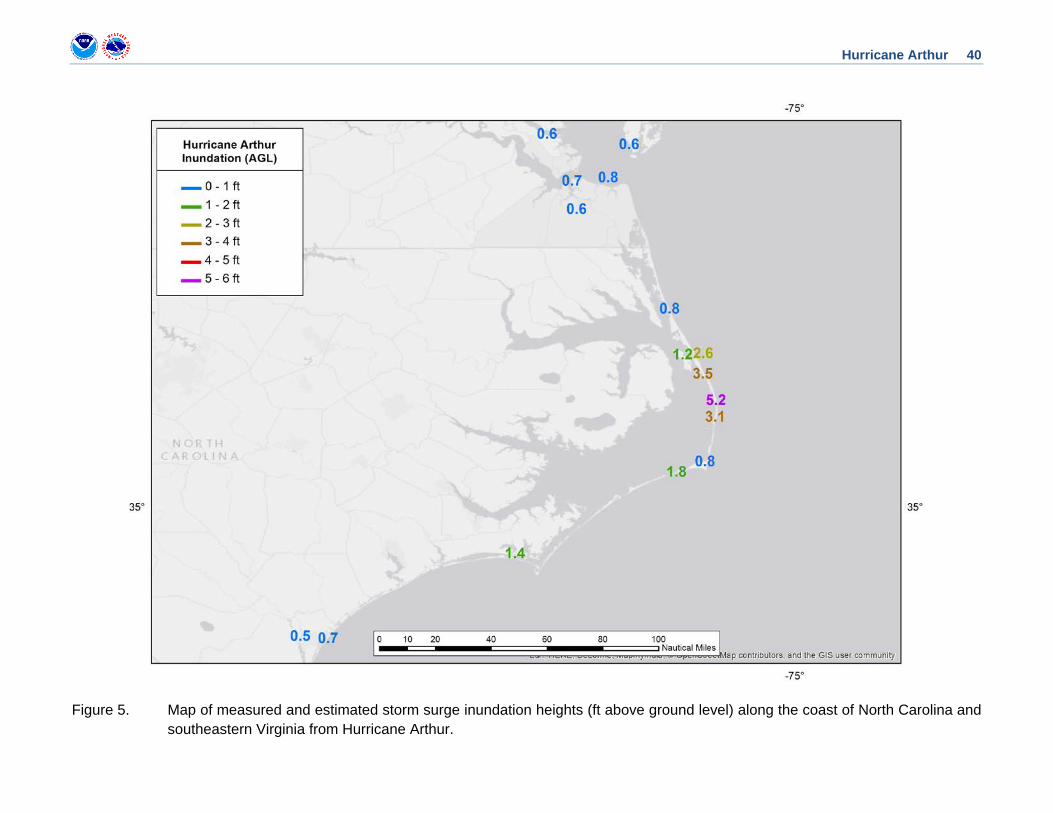
Storm Surge3 Arthur produced significant storm surge flooding along portions of the North Carolina coast, especially on the Outer Banks. The highest storm surge measured by an NOS tide gauge was 4.48 ft above normal tide levels at the Oregon Inlet Marina (sound-side). Storm surges between 2.0 and 2.6 ft were measured by the NOS gauges at Wrightsville Beach, Beaufort, Cape Hatteras (sound-side), and Duck (ocean-side).
Combined with the normal tide, Arthur’s storm surge produced inundation of 3 to 5 ft above ground level on portions of the Outer Banks. The Oregon Inlet NOS tide gauge measured a storm tide of 3.47 ft above Mean Higher High Water (MHHW), suggestive of inundation levels between 3 and 4 ft above ground level in that area. A survey crew from the NWS office in Morehead City, NC, measured a high water mark of 5.2 ft above ground level farther south in Rodanthe. The crew also measured inundation levels of 3 ft in Salvo, 2.5 ft in Nags Head, and 2 ft in Buxton. Significant storm surge flooding also occurred on Roanoke Island at Manteo (5 ft above Mean Sea Level) and Down East Carteret County (up to 3 ft above Mean Sea Level). Figure 5 provides a map showing measured and estimated storm surge inundation heights along the coast of North Carolina from Arthur.
Arthur produced storm surges of 1 to 2 ft across extreme southeastern Massachusetts, but it did not result in any major flooding. The NOS tide gauge on Nantucket Island measured a storm surge of 2.02 ft, resulting in a storm tide of only 0.6 ft above MHHW.
3 Several terms are used to describe water levels due to a storm. Storm surge is defined as the abnormal rise of water generated by a storm, over and above the predicted astronomical tide, and is expressed in terms of height above normal tide levels. Because storm surge represents the deviation from normal water levels, it is not referenced to a vertical datum. Storm tide is defined as the water level due to the combination of storm surge and the astronomical tide, and is expressed in terms of height above a vertical datum, i.e. the North American Vertical Datum of 1988 (NAVD88) or Mean Lower Low Water (MLLW). Inundation is the total water level that occurs on normally dry ground as a result of the storm tide, and is expressed in terms of height above ground level. At the coast, normally dry land is roughly defined as areas higher than the normal high tide line, or Mean Higher High Water (MHHW).
Hurricane Arthur 6
Rainfall and Flooding Arthur generally produced storm-total rainfall of 3-5 inches across portions of eastern
North Carolina after it had become a tropical cyclone. The highest rainfall report was 4.53 inches near St. James in Brunswick County, along the coast south of Wilmington. Over 4 inches of rain was also reported farther inland at several locations in the Kinston area. The disturbance which became Arthur had originally moved across the Carolinas and produced heavy rainfall several days earlier. Over the entire period in which the incipient disturbance and Arthur affected the area, Myrtle Beach, Sound Carolina, reported a total of 8.73 inches of rain.
Heavy rainfall and minor flooding occurred across extreme southeastern Massachusetts and Down East Maine. Several locations in Massachusetts reported storm-total amounts of 6-8 inches, with a maximum of 8.00 inches being reported in New Bedford. Many locations in Down East Maine measured 4-6 inches of rain. The highest reported amount was 6.48 inches just west of Eastport near the town of Whiting.
While Nova Scotia experienced the strongest winds, the heaviest rain occurred on the back side of Arthur due to enhancement along a frontal boundary. Much like in Maine, many locations in New Brunswick measured 4-6 inches of rain. The highest rain amount reported by Environment Canada was 5.91 inches near Gagetown.
Tornadoes Two tornadoes in North Carolina and two tornadoes in Virginia were reported in association with Arthur. An EF-1 (on the Enhanced Fujita Scale) tornado near Rose Hill in Duplin County, North Carolina, on 3 July damaged trees and two structures south of the town. A second EF-1 tornado occurred near Hamilton in Martin County, North Carolina, and snapped several large trees, blowing one down onto a house and causing an estimated $26,000 damage. Two EF-0 tornadoes were briefly on the ground in the cities of Virginia Beach and Norfolk, Virginia, each snapping and uprooting numerous trees.
CASUALTY AND DAMAGE STATISTICS There were no reports of casualties associated with Arthur. Arthur is the strongest hurricane to make landfall in the mainland United States without being responsible for any direct deaths4 since Hurricane Bret, which made landfall in a sparsely populated area of South Texas as a category 3 hurricane in 1999.
4 Deaths occurring as a direct result of the forces of the tropical cyclone are referred to as “direct” deaths. These would include those persons who drowned in storm surge, rough seas, rip currents, and freshwater floods. Direct deaths also include casualties resulting from lightning and wind-related events (e.g., collapsing structures). Deaths occurring from such factors as heart attacks, house fires, electrocutions from downed power lines, vehicle accidents on wet roads, etc., are considered indirect” deaths.
Hurricane Arthur 7
Arthur spared the United States significant damage, even though it made landfall as a category 2 hurricane. It should be noted, however, that the strongest sustained winds to affect land were of category 1 intensity, with sustained category 2 winds being limited to marine areas of Pamlico Sound and the western Atlantic Ocean. Property Claim Services (PCS) determined that Arthur did not meet their $25 million threshold in claims to be considered a “catastrophe” (Gregory 2014). Insurance broker BMS Group determined that Arthur is only the second category 2 hurricane to make landfall in the U.S. and not receive a PCS catastrophe designation (along with Hurricane Gerda, which made landfall in Down East Maine as a category 2 hurricane in 1969) (Siffert 2014).
Despite the relatively modest damage, one of the hardest hit areas was Dare County, North Carolina, which includes the Outer Banks. A report from the Dare County damage assessment officer indicated that most of the damage in the county was the result of sound-side storm surge flooding, but strong winds also downed trees and caused damage to shingles, siding, and roofs. Sixteen structures in the county had major damage, and 145 sustained minor damage. The worst damage occurred south of Oregon Inlet on Hatteras Island, especially in the Rodanthe, Salvo, and Waves areas, where wind and water damaged numerous residences, businesses, and campgrounds. More significant damage also occurred in Manteo, where sound-side flooding inundated businesses in the downtown area. Immediately after the storm, Dare County reported that total property damage in the county was just under $2 million (Dare County 2014). Duke Energy estimated that about 83,400 customers in North Carolina were without power at some point during the hurricane (Blythe 2014). Some parts of North Carolina Highway 12 were covered by sand due to storm surge, and the highway buckled near the Pea Island Bridge on Hatteras Island where the barrier island was breached during Hurricane Irene in 2011 (Dalesio 2014).
In New England, heavy rainfall caused flooding in parts of southeastern Massachusetts. Numerous roads were impassible and covered by up to a foot of water. A little more than 10,000 customers lost power, especially on Cape Cod. Fourth of July celebrations across the area were cancelled or rescheduled due to the inclement weather (Andersen and McNeill 2014). In Maine, strong winds and heavy rain helped to topple numerous large trees and power lines, causing extensive damage and knocking out power for about 20,000 customers (Gluckman 2014).
Arthur knocked down numerous large trees and caused extensive power outages across Atlantic Canada due to strong winds during its post-tropical stage. About 290,000 homes and businesses lost power, including more than 140,000 NB Power customers in New Brunswick, 144,000 Nova Scotia Power customers, and 1,500 Marine Electric customers on Prince Edward Island (CBC News 2014a). Some customers in Nova Scotia and New Brunswick went without power for a week. Nova Scotia Power commented that the damage to the electrical grid caused by Arthur in some areas was as bad as that caused by category 2 Hurricane Juan in 2003 (CBC News 2014c). Heavy rain in New Brunswick resulted in localized flooding, with some streets being closed in the province’s largest city of Saint John. Damage totals in New Brunswick alone were estimated to be C$12.6 million (Canadian Press 2014). The Gaspé region and Magdalen Islands of Quebec were also hit hard. Hydro Québec reported about 23,000 customers without power, and downed trees and power lines, as well as flooding, caused the closure of parts of Routes 123 and 198, major roads in the region (CBC News 2014b). Environment Canada reported that damage was particularly bad in the Carleton-sur-Mer area.

Hurricane Arthur 8
FORECAST AND WARNING CRITIQUE
The genesis of Arthur was well forecast, especially given its non-tropical origins. The possibility of genesis was first indicated in the Tropical Weather Outlook 5 days (120 h) before Arthur formed, when the incipient disturbance was located over the extreme northwestern Gulf of Mexico. The five-day chance of formation was raised to the “medium” category 3 days (72 h) before genesis and the “high” category just over 2 days (54 h) before genesis. Arthur was given a “low” chance of genesis in the 48-h Tropical Weather Outlook 78 h before it formed, which is considerably longer than the average lead time of 27 h for systems of non-tropical origin (Kimberlain 2014). The table below indicates how far in advance of genesis the NHC official genesis forecasts first reached the indicated likelihood categories:
Hours Before Genesis
48-Hour Outlook 120-Hour Outlook
Low (<30%) 78 120
Medium (30%-50%) 60 72
High (>50%) 30 54
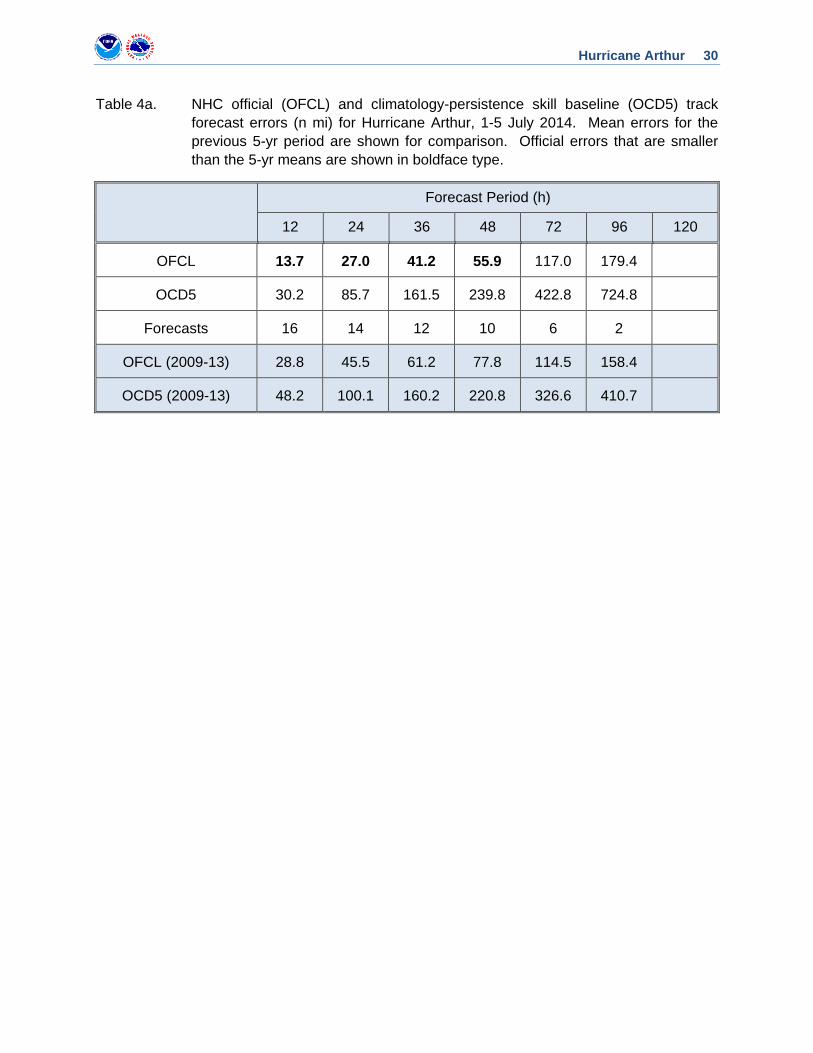
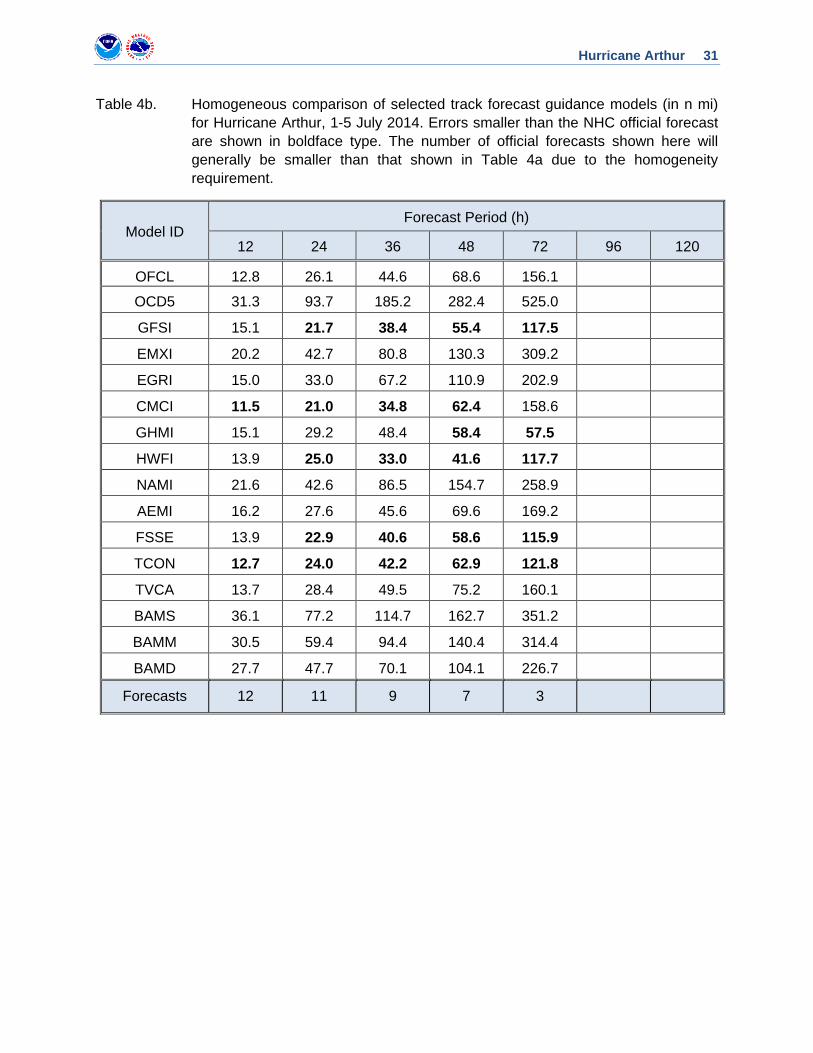
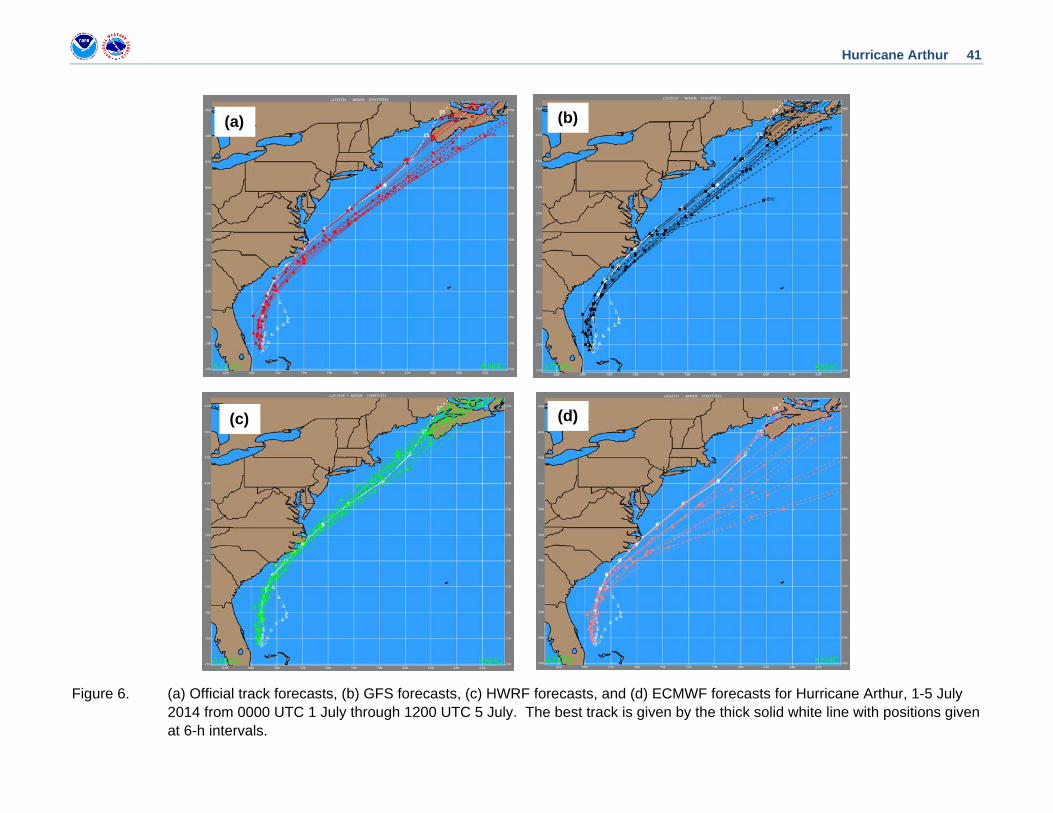
A verification of NHC official track forecasts for Arthur is given in Table 4a. Official forecast track errors were lower than the mean official errors for the previous 5-yr period for the 12- to 48-hr forecast times. The official track forecast errors were comparable to the previous 5-yr errors at 72 h and a little higher at 96 h. Figure 6(a) shows that the official forecasts had a slight eastward bias, initially keeping the center of Arthur farther offshore the coasts of North Carolina and Massachusetts. A homogeneous comparison of the official track errors with selected guidance models is given in Table 4b. Among the dynamical model guidance, the National Weather Service’s Global Forecast System (GFSI) and Hurricane Weather Research and Forecasting Model (HWFI), as well as Environment Canada’s Global Environmental Multiscale Model (CMCI), performed well and had lower errors than the NHC official forecast at most forecast times. Figures 6(b) and 6(c) reveal that the GFS had a slight eastward bias in the forecast track of Arthur, especially off the coast of North Carolina, while the HWRF was highly consistent and displayed no apparent cross-track bias during Arthur’s tropical phase. The Florida State Superensemble (FSSE) and the TCON fixed multi-model consensus also had lower errors than the official forecasts. The usually well-performing European Centre for Medium-range Weather Forecasting model (EMXI), on the other hand, had errors that were about two times larger than the official forecast errors, and Fig. 6(d) shows that the model had a significant eastward bias, keeping Arthur offshore of the coast of North Carolina and south of Nova Scotia. The official forecast track errors were consequently lower than the TVCA variable multi-model consensus, which includes EMXI as one of its member models, at all forecast times.
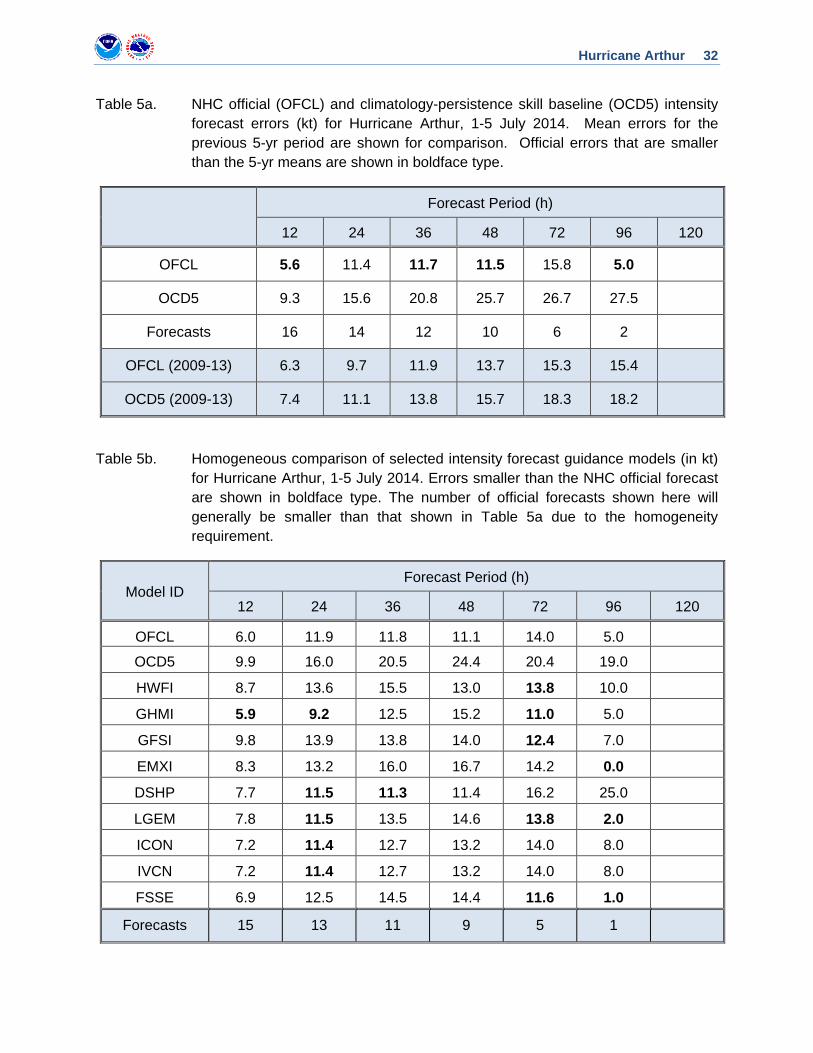
A verification of NHC official intensity forecasts for Arthur is given in Table 5a. Official forecast intensity errors were lower than the mean official errors for the previous 5-yr period for

Hurricane Arthur 9
the 12-, 36-, 48-, and 96-h forecast periods. A homogeneous comparison of the official intensity errors with selected guidance models is given in Table 5b. In general, the official intensity forecasts had comparable or lower errors than the individual intensity models.
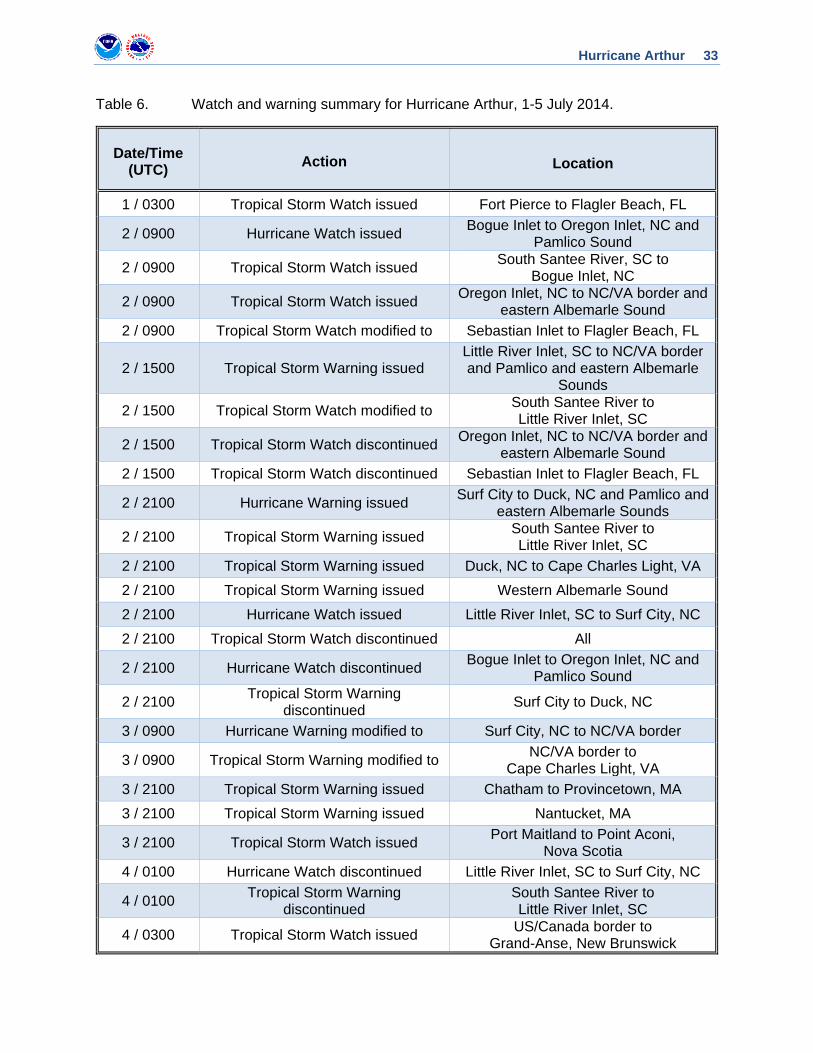
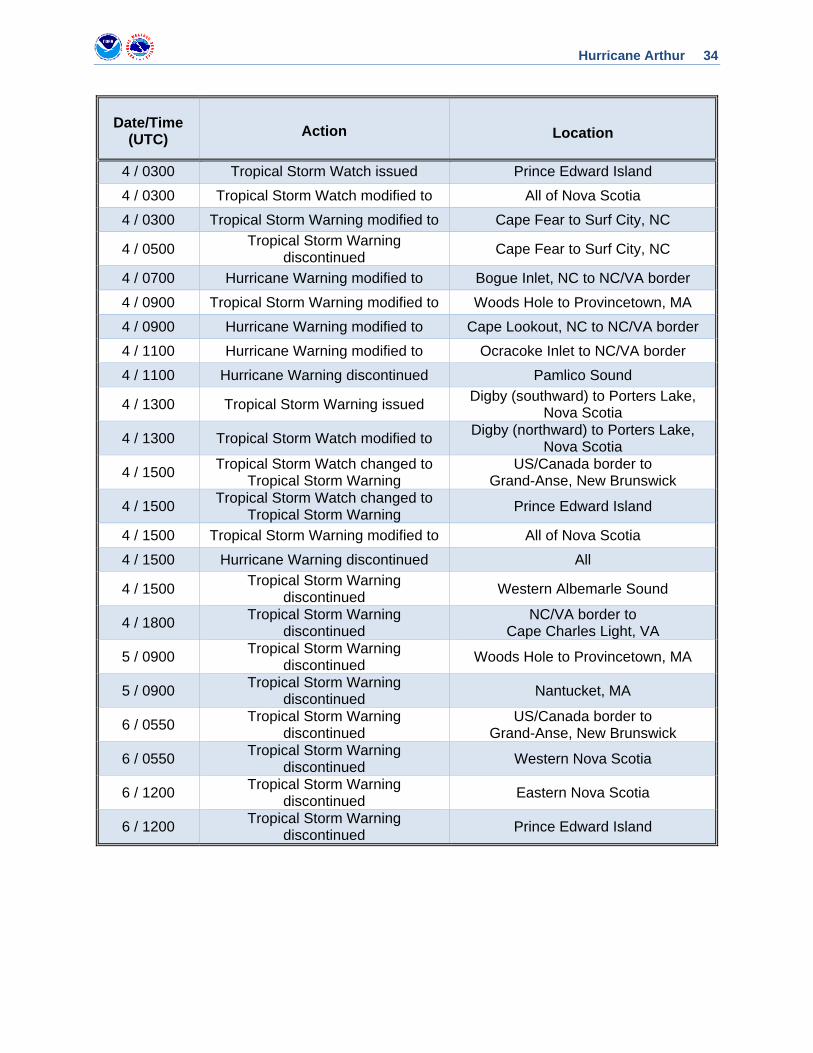
Watches and warnings associated with Arthur are given in Table 6. Coastal watches and warnings were not issued for North Carolina with the desired lead times, largely due to uncertainties of whether Arthur would move far enough west to produce strong winds along the coast. A hurricane watch was first issued from Bogue Inlet to Oregon Inlet, North Carolina, (including Pamlico Sound) at 0900 UTC 2 July. Tropical-storm-force winds first arrived on the coast of North Carolina by 2100 UTC 3 July, which means the hurricane watch only provided a lead time of about 36 h, instead of the normal 48 h. Likewise, a hurricane warning was issued from Surf City to Duck, North Carolina, (including Pamlico and eastern Albemarle Sounds) at 2100 UTC 2 July, which was only 24 h before the arrival of tropical-storm-force winds (instead of the typical 36 h). In New England, a tropical storm watch was not issued for extreme southeastern Massachusetts, but a tropical storm warning was eventually issued for Nantucket and from Chatham to Provincetown at 2100 UTC 3 July. The lead time for the warning was about 24 h, as sustained tropical-storm-force winds occurred at Buzzards Bay by 2300 UTC 4 July.
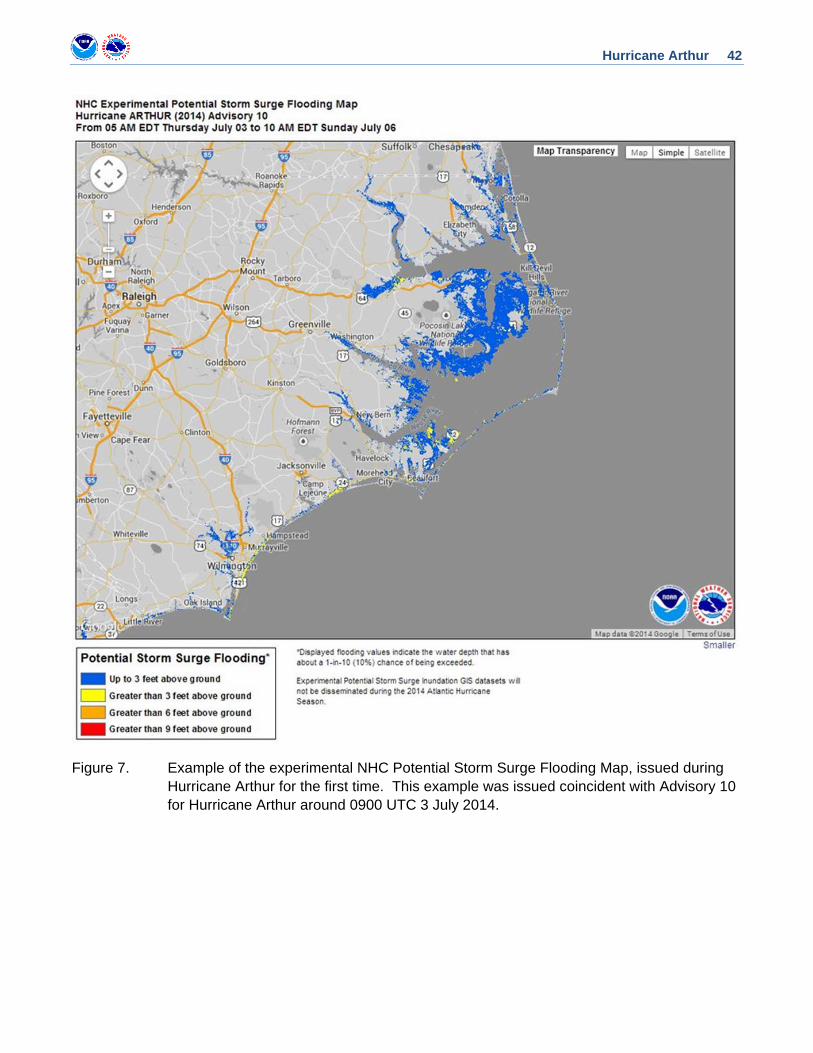
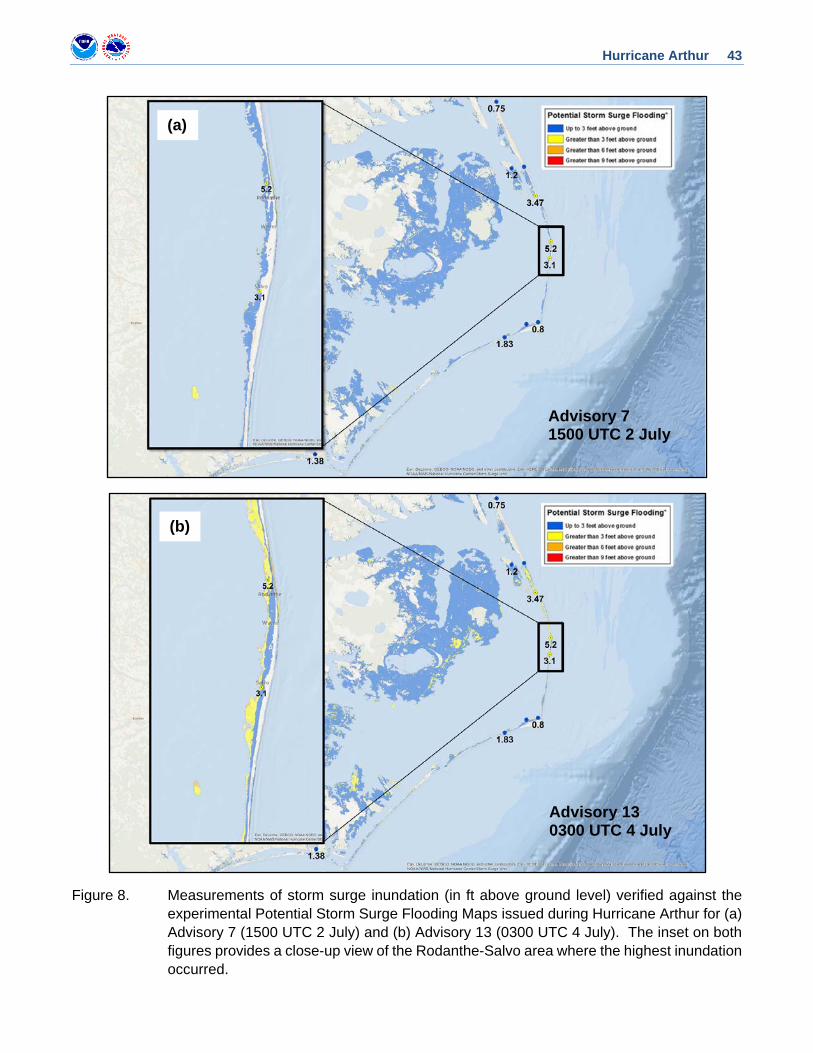
Hurricane Arthur provided the first opportunity for NHC to issue its experimental Potential Storm Surge Flooding Map to highlight areas near the coast that could experience inundation from storm surge. Figure 7 provides an example of the map that was available for Advisory 10 at 0900 UTC 3 July. In conjunction with the map, NHC first provided a storm surge forecast of 2 to 4 ft above ground level along the coast of North Carolina at 1500 UTC 2 July. The forecast was increased to 3 to 5 ft above ground level at 1500 UTC 3 July after there was more certainty that Arthur would not stay offshore of the coast of North Carolina. The earliest storm surge forecasts verified a little low (only by a foot or so), but the maximum inundation measurements of 5.2 ft at Rodanthe and 3.1 ft at Salvo on the Outer Banks verified well against the updated forecasts of 3 to 5 ft above ground level. Figure 8 compares measured inundation heights along the coast of North Carolina against the experimental Potential Storm Surge Flooding Map at (a) 1500 UTC 2 July and (b) 0300 UTC 4 July.
REFERENCES
Andersen, T. and McNeill, C., 5 July 2014: Arthur douses, but does little damage. The Boston Globe. [Available online at http://www.bostonglobe.com/metro/2014/07/04/hurricane-arthur-brings-rain-flooding-massachusetts/TzrTAAWKJtBwMWNFDkSU8N/story.html]
Blythe, A., 4 July 2014: Damage but no casualties as Arthur hit some, missed some NC beaches. News and Observer. [Available online at http://www.newsobserver.com/2014/07/04/3984271_fast-moving-hurricane-arthur-pummeling.html?rh=1]
Canadian Press, 19 November 2014: Province to help pay for damage caused by post-tropical storm Arthur. The Canadian Press. [Available online at

Hurricane Arthur 10
http://globalnews.ca/news/1681031/new-brunswick-to-help-pay-for-damage-caused-by-post-tropical-storm-arthur/]
CBC News, 5 July 2014a: Arthur hits Maritimes: Post-tropical storm causes widespread blackouts. [Available online at http://www.cbc.ca/news/canada/new-brunswick/arthur-hits-maritimes-post-tropical-storm-causes-widespread-blackouts-1.2697339]
CBC News, 5 July 2014b: Gaspé, Magdalen Islands endure storm Arthur. [Available online at http://www.cbc.ca/news/canada/montreal/gasp%C3%A9-magdalen-islands-endure-storm-arthur-1.2697436]
CBC News, 7 July 2014c: Storm Arthur damage ‘as bad as Hurricane Juan.’ [Available online at http://www.cbc.ca/news/canada/nova-scotia/storm-arthur-damage-as-bad-as-hurricane-juan-1.2698380]
Dalesio, E. P., 4 July 2014: North Carolina survives Hurricane Arthur. AP. [Available online at http://bigstory.ap.org/article/arthur-zeroes-nc-coast-july-4-holiday]
Dare County, cited 2014: Dare County preliminary property damage report, Hurricane Arthur. [Available online at http://islandfreepress.org/2014Archives/07.07.2014-HurricaneArthurPreliminaryDamageReportAndDetail.pdf]
Gluckman, N., 5 July 2014: More than 17,000 in Maine, 250,000 in Canada without power as storm moves north. Bangor Daily News. [Available at http://bangordailynews.com/2014/07/05/news/down-east/high-winds-from-hurricane-arthur-leave-more-than-4000-without-power/]
Gregory, T., cited 2014: Hurricane Arthur was not U.S. catastrophe. [Available online at http://www.verisk.com/blog/claims-2/hurricane-arthur-was-not-u-s-catastrophe/]
Kimberlain, T., 17 December 2014: Hurricane Fay Tropical Cyclone Report. NOAA National Hurricane Center. [Available online at http://www.nhc.noaa.gov/data/tcr/AL072014_Fay.pdf]
Siffert, A. J., cited 2014: Arthur’s amazing facts are a positive for the insurance industry. [Available online at http://media.bmsgroup.com/?p=4207]
Hurricane Arthur 11
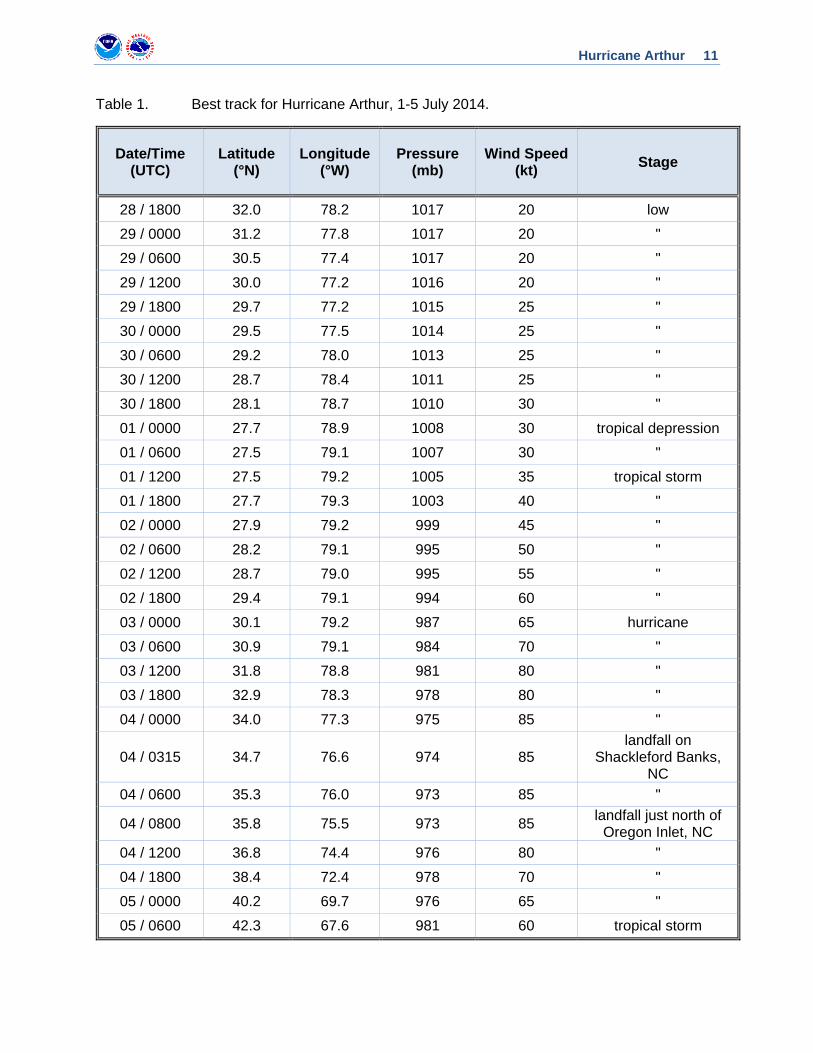
Table 1. Best track for Hurricane Arthur, 1-5 July 2014.
Date/Time (UTC)
Latitude (°N)
Longitude (°W)
Pressure (mb)
Wind Speed (kt) Stage
28 / 1800 32.0 78.2 1017 20 low 29 / 0000 31.2 77.8 1017 20 " 29 / 0600 30.5 77.4 1017 20 "
29 / 1200 30.0 77.2 1016 20 " 29 / 1800 29.7 77.2 1015 25 " 30 / 0000 29.5 77.5 1014 25 " 30 / 0600 29.2 78.0 1013 25 " 30 / 1200 28.7 78.4 1011 25 " 30 / 1800 28.1 78.7 1010 30 "
01 / 0000 27.7 78.9 1008 30 tropical depression 01 / 0600 27.5 79.1 1007 30 " 01 / 1200 27.5 79.2 1005 35 tropical storm 01 / 1800 27.7 79.3 1003 40 " 02 / 0000 27.9 79.2 999 45 " 02 / 0600 28.2 79.1 995 50 "
02 / 1200 28.7 79.0 995 55 " 02 / 1800 29.4 79.1 994 60 " 03 / 0000 30.1 79.2 987 65 hurricane 03 / 0600 30.9 79.1 984 70 " 03 / 1200 31.8 78.8 981 80 " 03 / 1800 32.9 78.3 978 80 "
04 / 0000 34.0 77.3 975 85 "
04 / 0315 34.7 76.6 974 85 landfall on
Shackleford Banks, NC
04 / 0600 35.3 76.0 973 85 "
04 / 0800 35.8 75.5 973 85 landfall just north of Oregon Inlet, NC
04 / 1200 36.8 74.4 976 80 "
04 / 1800 38.4 72.4 978 70 " 05 / 0000 40.2 69.7 976 65 " 05 / 0600 42.3 67.6 981 60 tropical storm

Hurricane Arthur 12
Date/Time (UTC)
Latitude (°N)
Longitude (°W)
Pressure (mb)
Wind Speed (kt) Stage
05 / 1200 44.1 66.5 982 60 extratropical 05 / 1800 45.9 65.3 980 55 " 06 / 0000 47.1 64.0 981 50 " 06 / 0600 47.6 62.4 982 45 "
06 / 1200 48.5 60.2 986 40 " 06 / 1800 50.3 58.1 989 35 " 07 / 0000 52.3 56.4 988 35 " 07 / 0600 54.2 55.4 985 35 " 07 / 1200 56.0 54.7 984 35 " 07 / 1800 57.3 54.2 985 40 "
08 / 0000 58.1 54.1 988 45 " 08 / 0600 58.9 54.7 991 40 " 08 / 1200 59.4 56.1 993 35 " 08 / 1800 60.0 57.0 995 30 " 09 / 0000 60.3 56.7 997 30 " 09 / 0600 60.1 56.2 1001 25 "
09 / 1200 59.8 55.7 1005 25 " 09 / 1800 59.5 55.0 1008 25 " 10 / 0000 dissipated
04 / 0600 35.3 76.0 973 85 minimum pressure and maximum winds
04 / 0315 34.7 76.6 974 85 landfall on
Shackleford Banks, NC
04 / 0800 35.8 75.5 973 85 landfall just north of Oregon Inlet, NC
Hurricane Arthur 13
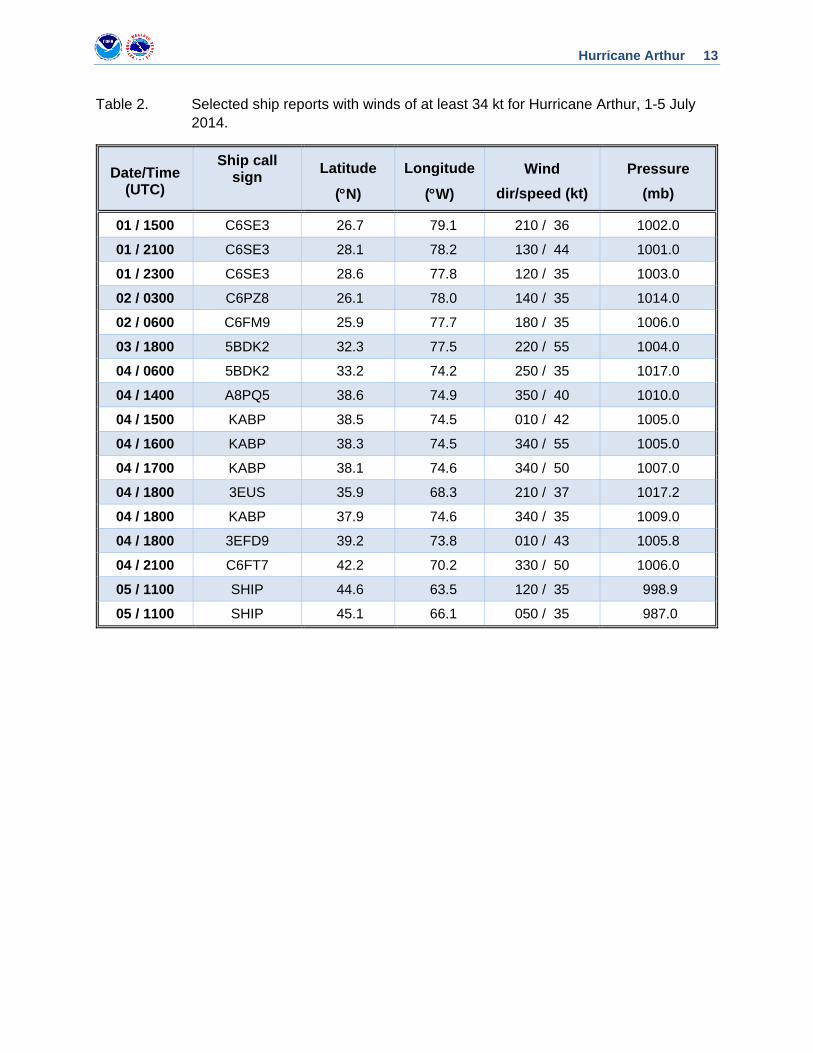
Table 2. Selected ship reports with winds of at least 34 kt for Hurricane Arthur, 1-5 July 2014.
Date/Time (UTC)
Ship call sign
Latitude
(°N)
Longitude
(°W) Wind
dir/speed (kt) Pressure
(mb)
01 / 1500 C6SE3 26.7 79.1 210 / 36 1002.0
01 / 2100 C6SE3 28.1 78.2 130 / 44 1001.0
01 / 2300 C6SE3 28.6 77.8 120 / 35 1003.0
02 / 0300 C6PZ8 26.1 78.0 140 / 35 1014.0
02 / 0600 C6FM9 25.9 77.7 180 / 35 1006.0
03 / 1800 5BDK2 32.3 77.5 220 / 55 1004.0
04 / 0600 5BDK2 33.2 74.2 250 / 35 1017.0
04 / 1400 A8PQ5 38.6 74.9 350 / 40 1010.0
04 / 1500 KABP 38.5 74.5 010 / 42 1005.0
04 / 1600 KABP 38.3 74.5 340 / 55 1005.0
04 / 1700 KABP 38.1 74.6 340 / 50 1007.0
04 / 1800 3EUS 35.9 68.3 210 / 37 1017.2
04 / 1800 KABP 37.9 74.6 340 / 35 1009.0
04 / 1800 3EFD9 39.2 73.8 010 / 43 1005.8
04 / 2100 C6FT7 42.2 70.2 330 / 50 1006.0
05 / 1100 SHIP 44.6 63.5 120 / 35 998.9
05 / 1100 SHIP 45.1 66.1 050 / 35 987.0
Hurricane Arthur 14
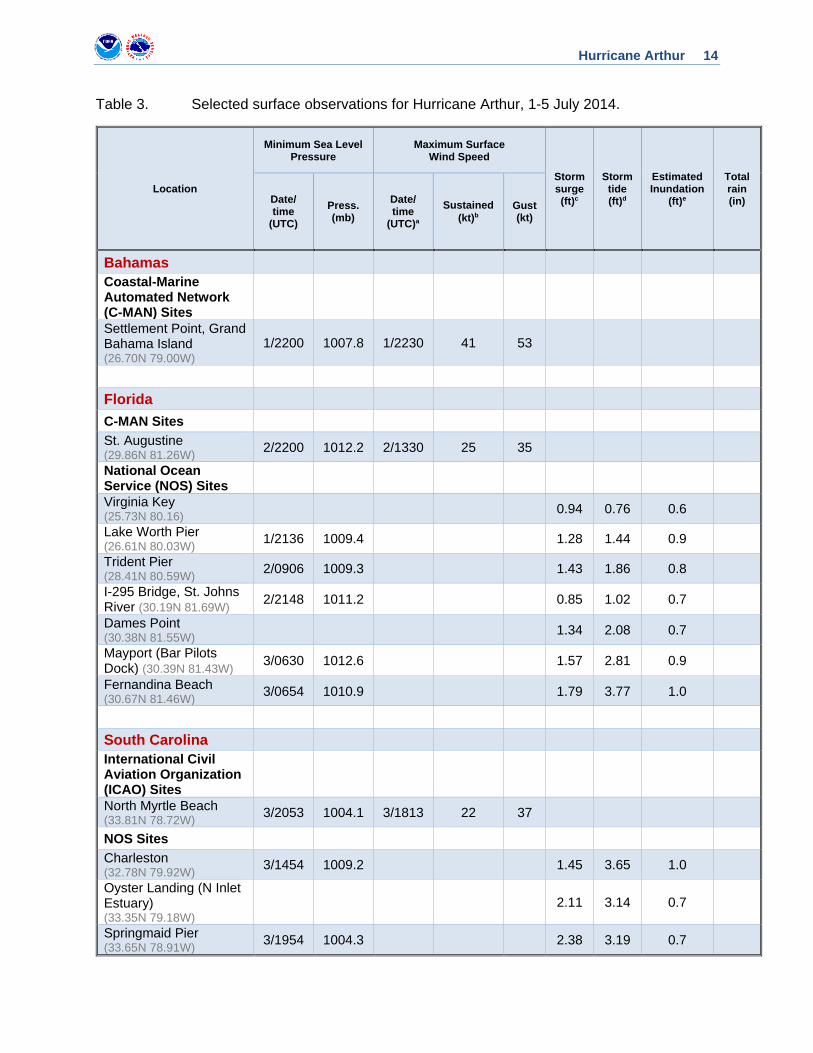
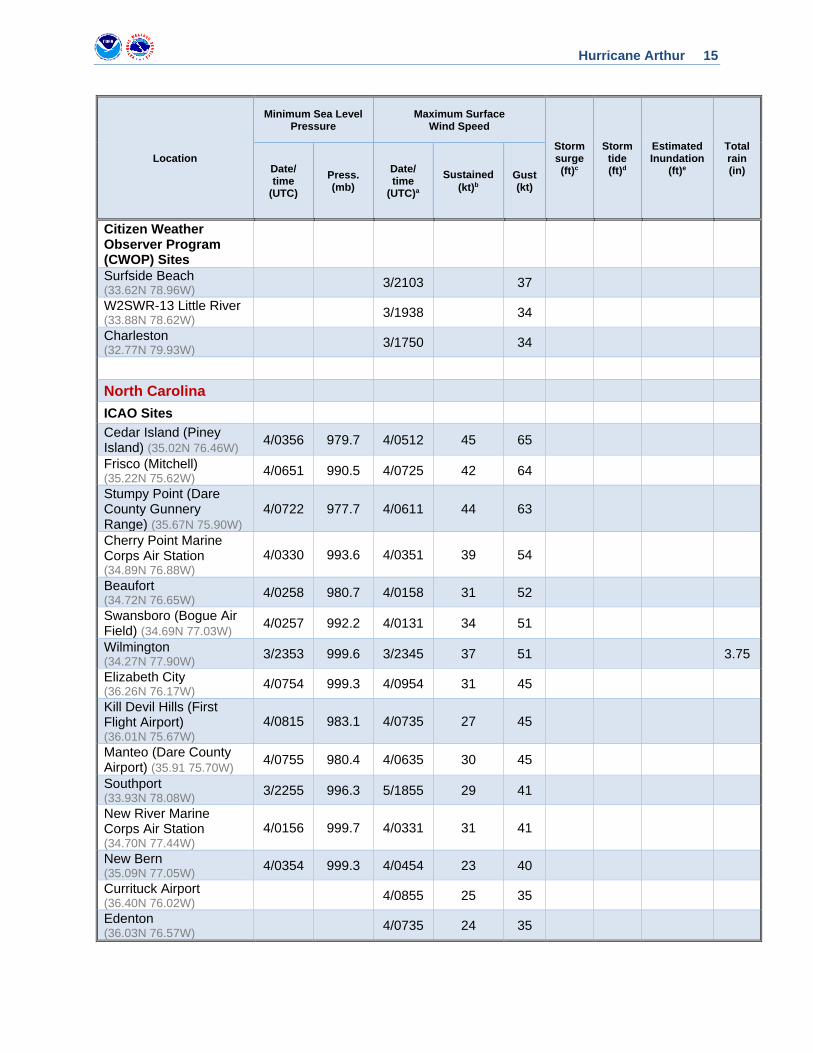
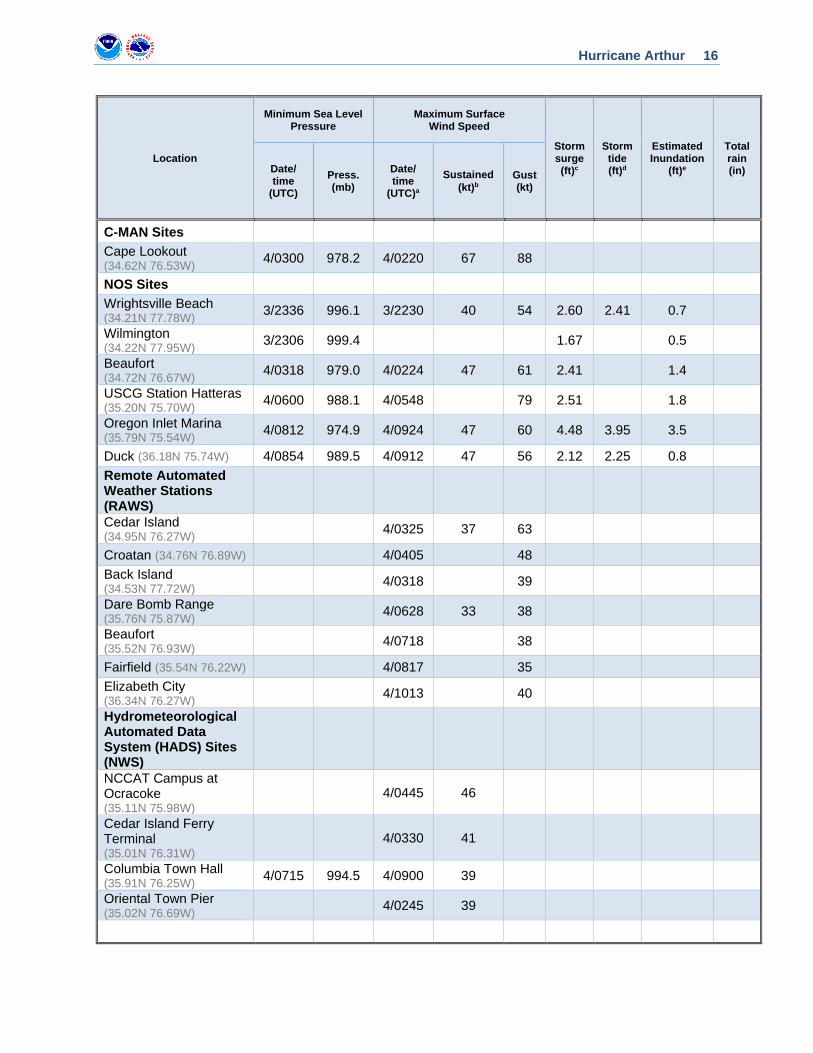
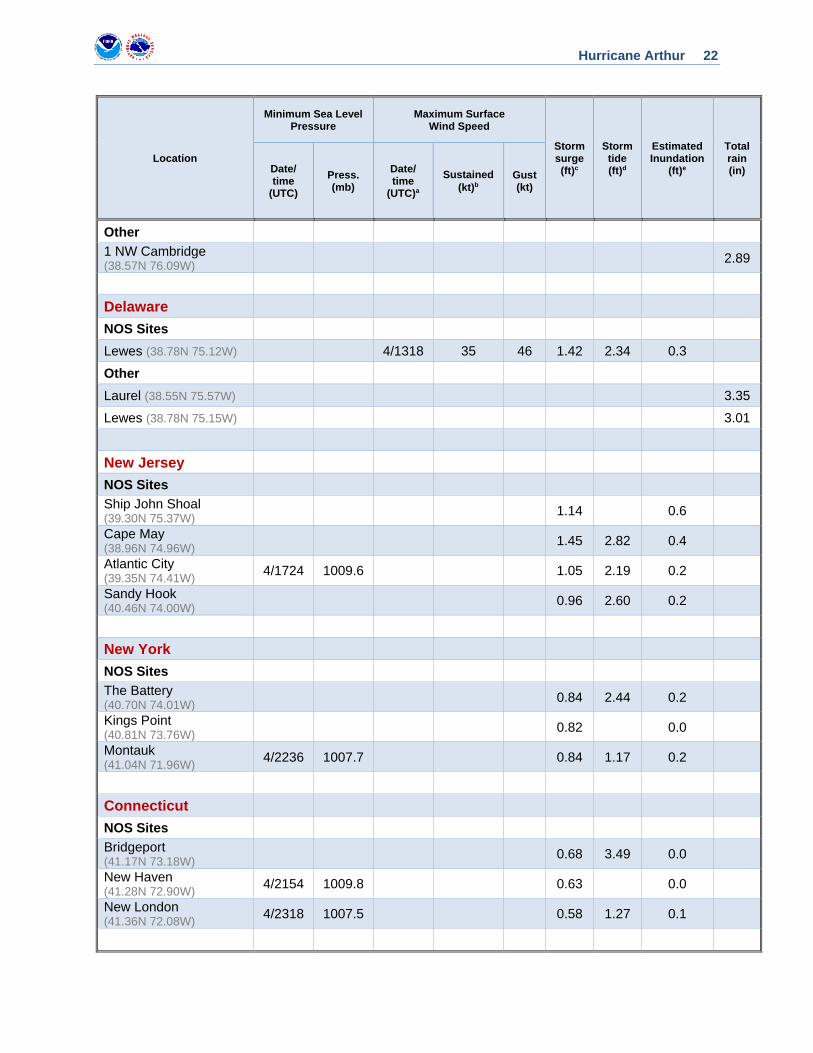
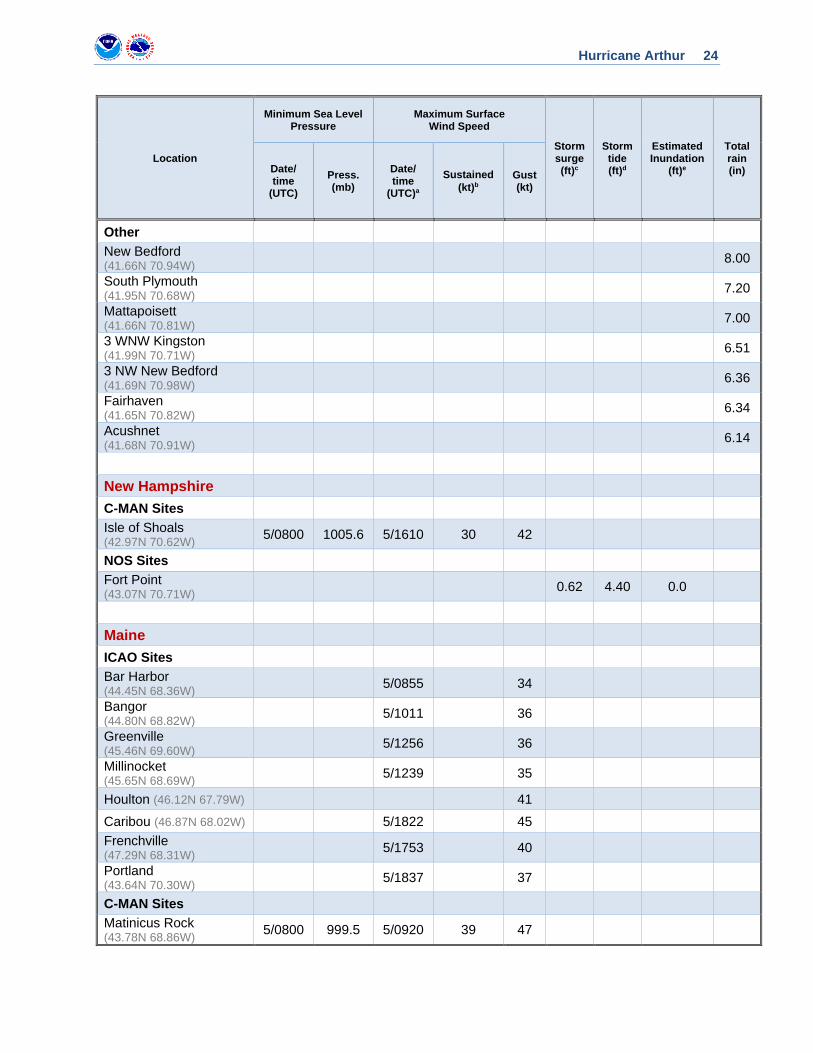
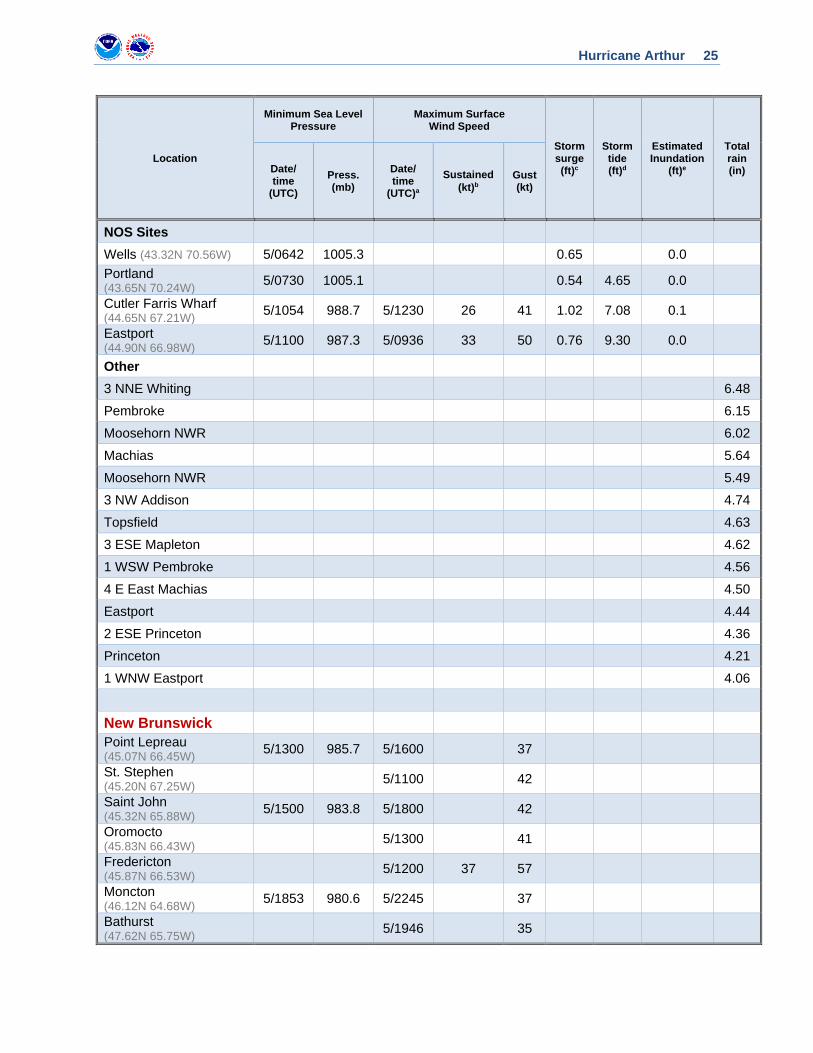
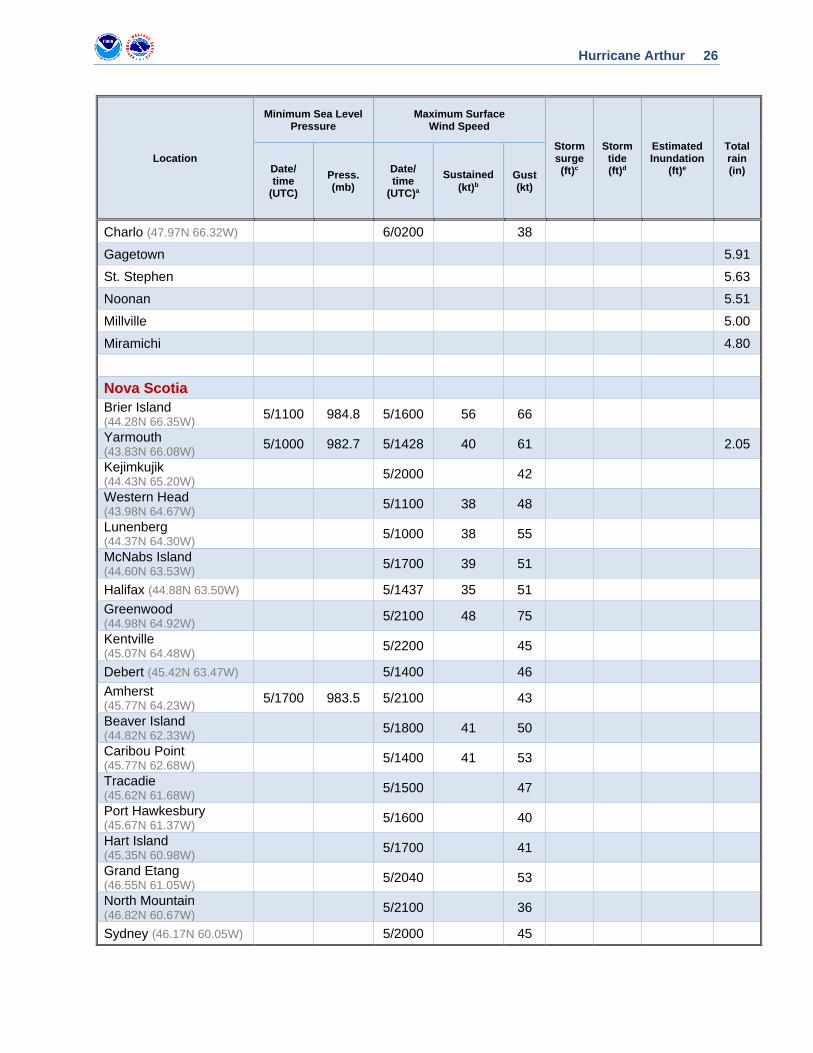
Table 3. Selected surface observations for Hurricane Arthur, 1-5 July 2014.
Location
Minimum Sea Level Pressure
Maximum Surface Wind Speed
Storm surge (ft)c
Storm tide (ft)d
Estimated Inundation
(ft)e
Total rain (in) Date/
time (UTC)
Press. (mb)
Date/ time
(UTC)a
Sustained (kt)b
Gust (kt)
Bahamas Coastal-Marine Automated Network (C-MAN) Sites
Settlement Point, Grand Bahama Island (26.70N 79.00W)
1/2200 1007.8 1/2230 41 53
Florida C-MAN Sites St. Augustine (29.86N 81.26W) 2/2200 1012.2 2/1330 25 35
National Ocean Service (NOS) Sites Virginia Key (25.73N 80.16) 0.94 0.76 0.6
Lake Worth Pier (26.61N 80.03W) 1/2136 1009.4 1.28 1.44 0.9
Trident Pier (28.41N 80.59W) 2/0906 1009.3 1.43 1.86 0.8
I-295 Bridge, St. Johns River (30.19N 81.69W) 2/2148 1011.2 0.85 1.02 0.7
Dames Point (30.38N 81.55W) 1.34 2.08 0.7
Mayport (Bar Pilots Dock) (30.39N 81.43W) 3/0630 1012.6 1.57 2.81 0.9
Fernandina Beach (30.67N 81.46W) 3/0654 1010.9 1.79 3.77 1.0
South Carolina International Civil Aviation Organization (ICAO) Sites
North Myrtle Beach (33.81N 78.72W) 3/2053 1004.1 3/1813 22 37
NOS Sites Charleston (32.78N 79.92W) 3/1454 1009.2 1.45 3.65 1.0
Oyster Landing (N Inlet Estuary) (33.35N 79.18W)
2.11 3.14 0.7
Springmaid Pier (33.65N 78.91W) 3/1954 1004.3 2.38 3.19 0.7
Hurricane Arthur 15
Location
Minimum Sea Level Pressure
Maximum Surface Wind Speed
Storm surge (ft)c
Storm tide (ft)d
Estimated Inundation
(ft)e
Total rain (in) Date/
time (UTC)
Press. (mb)
Date/ time
(UTC)a
Sustained (kt)b
Gust (kt)
Citizen Weather Observer Program (CWOP) Sites
Surfside Beach (33.62N 78.96W) 3/2103 37
W2SWR-13 Little River (33.88N 78.62W) 3/1938 34
Charleston (32.77N 79.93W) 3/1750 34
North Carolina ICAO Sites Cedar Island (Piney Island) (35.02N 76.46W) 4/0356 979.7 4/0512 45 65
Frisco (Mitchell) (35.22N 75.62W) 4/0651 990.5 4/0725 42 64
Stumpy Point (Dare County Gunnery Range) (35.67N 75.90W)
4/0722 977.7 4/0611 44 63
Cherry Point Marine Corps Air Station (34.89N 76.88W)
4/0330 993.6 4/0351 39 54
Beaufort (34.72N 76.65W) 4/0258 980.7 4/0158 31 52
Swansboro (Bogue Air Field) (34.69N 77.03W) 4/0257 992.2 4/0131 34 51
Wilmington (34.27N 77.90W) 3/2353 999.6 3/2345 37 51 3.75
Elizabeth City (36.26N 76.17W) 4/0754 999.3 4/0954 31 45
Kill Devil Hills (First Flight Airport) (36.01N 75.67W)
4/0815 983.1 4/0735 27 45
Manteo (Dare County Airport) (35.91 75.70W) 4/0755 980.4 4/0635 30 45
Southport (33.93N 78.08W) 3/2255 996.3 5/1855 29 41
New River Marine Corps Air Station (34.70N 77.44W)
4/0156 999.7 4/0331 31 41
New Bern (35.09N 77.05W) 4/0354 999.3 4/0454 23 40
Currituck Airport (36.40N 76.02W) 4/0855 25 35
Edenton (36.03N 76.57W) 4/0735 24 35
Hurricane Arthur 16
Location
Minimum Sea Level Pressure
Maximum Surface Wind Speed
Storm surge (ft)c
Storm tide (ft)d
Estimated Inundation
(ft)e
Total rain (in) Date/
time (UTC)
Press. (mb)
Date/ time
(UTC)a
Sustained (kt)b
Gust (kt)
C-MAN Sites Cape Lookout (34.62N 76.53W) 4/0300 978.2 4/0220 67 88
NOS Sites Wrightsville Beach (34.21N 77.78W) 3/2336 996.1 3/2230 40 54 2.60 2.41 0.7
Wilmington (34.22N 77.95W) 3/2306 999.4 1.67 0.5
Beaufort (34.72N 76.67W) 4/0318 979.0 4/0224 47 61 2.41 1.4
USCG Station Hatteras (35.20N 75.70W) 4/0600 988.1 4/0548 79 2.51 1.8
Oregon Inlet Marina (35.79N 75.54W) 4/0812 974.9 4/0924 47 60 4.48 3.95 3.5
Duck (36.18N 75.74W) 4/0854 989.5 4/0912 47 56 2.12 2.25 0.8 Remote Automated Weather Stations (RAWS)
Cedar Island (34.95N 76.27W) 4/0325 37 63
Croatan (34.76N 76.89W) 4/0405 48 Back Island (34.53N 77.72W) 4/0318 39
Dare Bomb Range (35.76N 75.87W) 4/0628 33 38
Beaufort (35.52N 76.93W) 4/0718 38
Fairfield (35.54N 76.22W) 4/0817 35 Elizabeth City (36.34N 76.27W) 4/1013 40
Hydrometeorological Automated Data System (HADS) Sites (NWS)
NCCAT Campus at Ocracoke (35.11N 75.98W)
4/0445 46
Cedar Island Ferry Terminal (35.01N 76.31W)
4/0330 41
Columbia Town Hall (35.91N 76.25W) 4/0715 994.5 4/0900 39
Oriental Town Pier (35.02N 76.69W) 4/0245 39
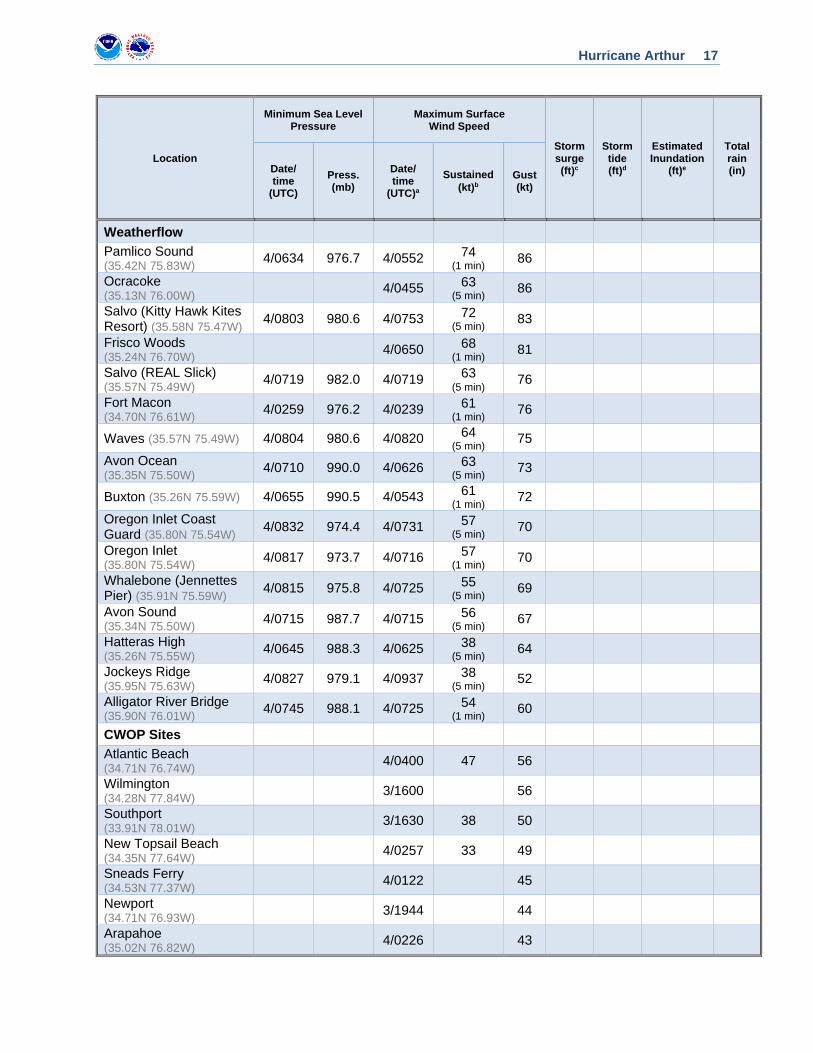
Hurricane Arthur 17
Location
Minimum Sea Level Pressure
Maximum Surface Wind Speed
Storm surge (ft)c
Storm tide (ft)d
Estimated Inundation
(ft)e
Total rain (in) Date/
time (UTC)
Press. (mb)
Date/ time
(UTC)a
Sustained (kt)b
Gust (kt)
Weatherflow Pamlico Sound (35.42N 75.83W) 4/0634 976.7 4/0552 74
(1 min) 86
Ocracoke (35.13N 76.00W) 4/0455 63
(5 min) 86
Salvo (Kitty Hawk Kites Resort) (35.58N 75.47W) 4/0803 980.6 4/0753 72
(5 min) 83
Frisco Woods (35.24N 76.70W) 4/0650 68
(1 min) 81
Salvo (REAL Slick) (35.57N 75.49W) 4/0719 982.0 4/0719 63
(5 min) 76
Fort Macon (34.70N 76.61W) 4/0259 976.2 4/0239 61
(1 min) 76
Waves (35.57N 75.49W) 4/0804 980.6 4/0820 64 (5 min) 75
Avon Ocean (35.35N 75.50W) 4/0710 990.0 4/0626 63
(5 min) 73
Buxton (35.26N 75.59W) 4/0655 990.5 4/0543 61 (1 min) 72
Oregon Inlet Coast Guard (35.80N 75.54W) 4/0832 974.4 4/0731 57
(5 min) 70
Oregon Inlet (35.80N 75.54W) 4/0817 973.7 4/0716 57
(1 min) 70
Whalebone (Jennettes Pier) (35.91N 75.59W) 4/0815 975.8 4/0725 55
(5 min) 69
Avon Sound (35.34N 75.50W) 4/0715 987.7 4/0715 56
(5 min) 67
Hatteras High (35.26N 75.55W) 4/0645 988.3 4/0625 38
(5 min) 64
Jockeys Ridge (35.95N 75.63W) 4/0827 979.1 4/0937 38
(5 min) 52
Alligator River Bridge (35.90N 76.01W) 4/0745 988.1 4/0725 54
(1 min) 60
CWOP Sites Atlantic Beach (34.71N 76.74W) 4/0400 47 56
Wilmington (34.28N 77.84W) 3/1600 56
Southport (33.91N 78.01W) 3/1630 38 50
New Topsail Beach (34.35N 77.64W) 4/0257 33 49
Sneads Ferry (34.53N 77.37W) 4/0122 45
Newport (34.71N 76.93W) 3/1944 44
Arapahoe (35.02N 76.82W) 4/0226 43
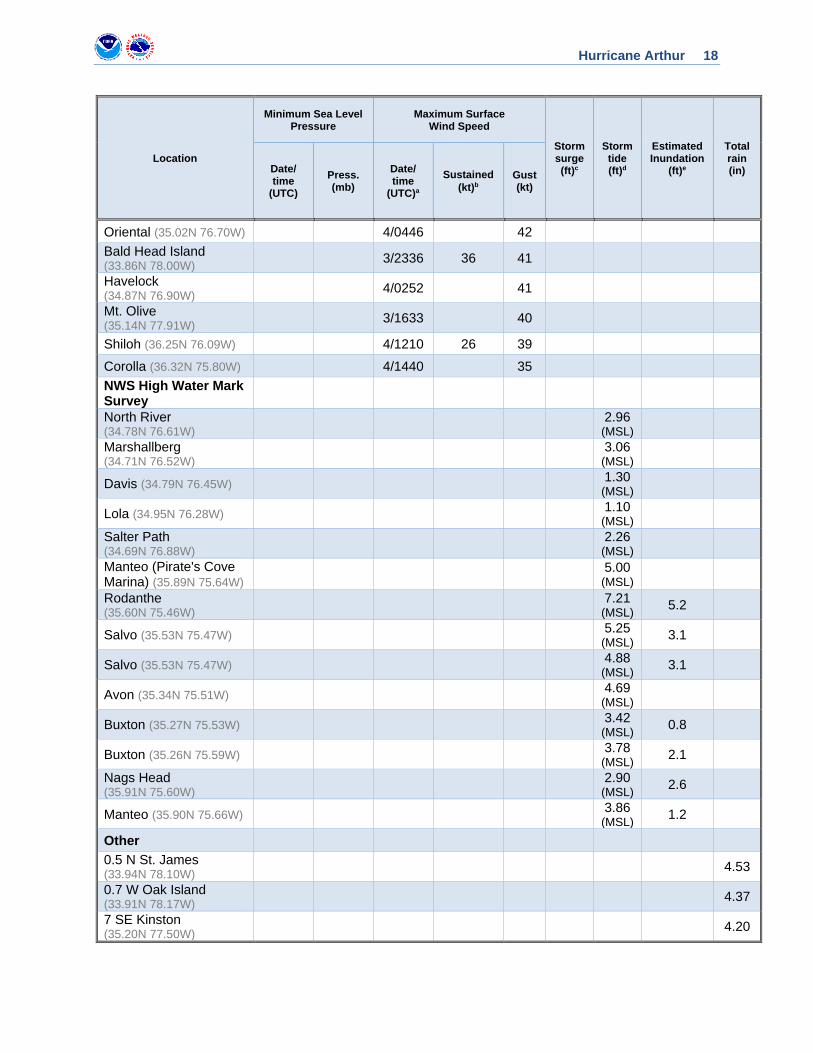
Hurricane Arthur 18
Location
Minimum Sea Level Pressure
Maximum Surface Wind Speed
Storm surge (ft)c
Storm tide (ft)d
Estimated Inundation
(ft)e
Total rain (in) Date/
time (UTC)
Press. (mb)
Date/ time
(UTC)a
Sustained (kt)b
Gust (kt)
Oriental (35.02N 76.70W) 4/0446 42 Bald Head Island (33.86N 78.00W) 3/2336 36 41
Havelock (34.87N 76.90W) 4/0252 41
Mt. Olive (35.14N 77.91W) 3/1633 40
Shiloh (36.25N 76.09W) 4/1210 26 39
Corolla (36.32N 75.80W) 4/1440 35 NWS High Water Mark Survey North River (34.78N 76.61W) 2.96
(MSL)
Marshallberg (34.71N 76.52W) 3.06
(MSL)
Davis (34.79N 76.45W) 1.30 (MSL)
Lola (34.95N 76.28W) 1.10 (MSL)
Salter Path (34.69N 76.88W) 2.26
(MSL)
Manteo (Pirate's Cove Marina) (35.89N 75.64W) 5.00
(MSL)
Rodanthe (35.60N 75.46W) 7.21
(MSL) 5.2
Salvo (35.53N 75.47W) 5.25 (MSL) 3.1
Salvo (35.53N 75.47W) 4.88 (MSL) 3.1
Avon (35.34N 75.51W) 4.69 (MSL)
Buxton (35.27N 75.53W) 3.42 (MSL) 0.8
Buxton (35.26N 75.59W) 3.78 (MSL) 2.1
Nags Head (35.91N 75.60W) 2.90
(MSL) 2.6
Manteo (35.90N 75.66W) 3.86 (MSL) 1.2
Other 0.5 N St. James (33.94N 78.10W) 4.53
0.7 W Oak Island (33.91N 78.17W) 4.37
7 SE Kinston (35.20N 77.50W) 4.20
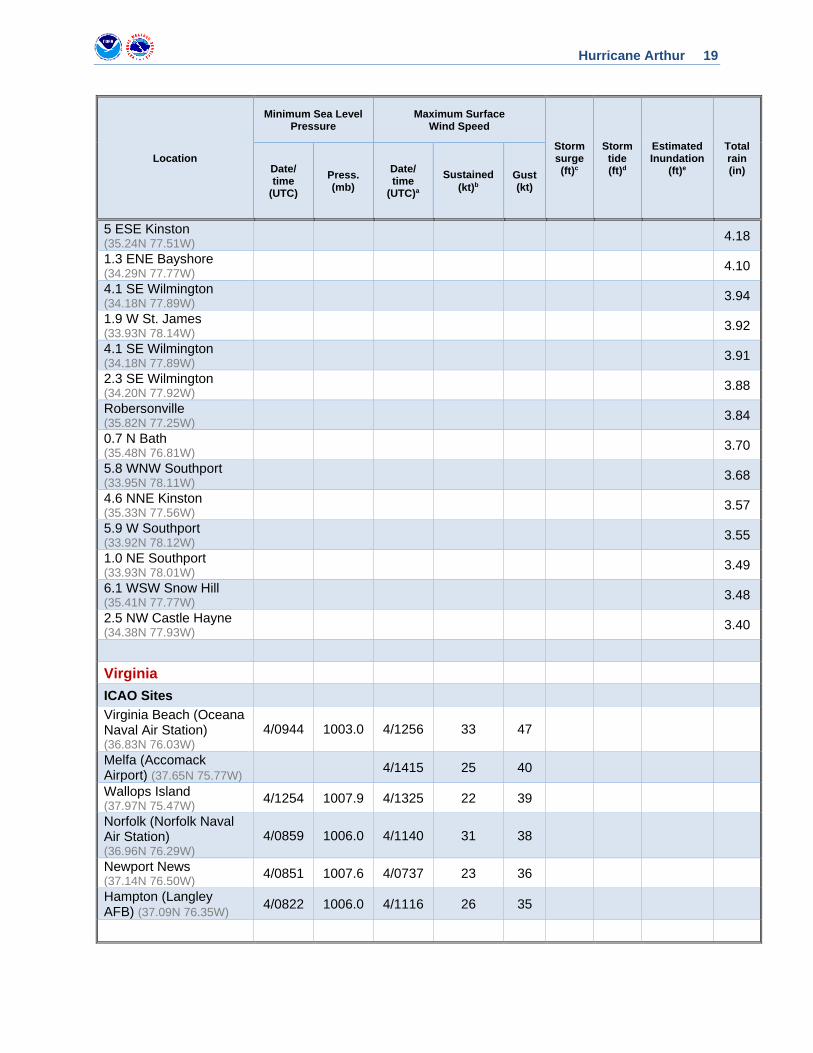
Hurricane Arthur 19
Location
Minimum Sea Level Pressure
Maximum Surface Wind Speed
Storm surge (ft)c
Storm tide (ft)d
Estimated Inundation
(ft)e
Total rain (in) Date/
time (UTC)
Press. (mb)
Date/ time
(UTC)a
Sustained (kt)b
Gust (kt)
5 ESE Kinston (35.24N 77.51W) 4.18
1.3 ENE Bayshore (34.29N 77.77W) 4.10
4.1 SE Wilmington (34.18N 77.89W) 3.94
1.9 W St. James (33.93N 78.14W) 3.92
4.1 SE Wilmington (34.18N 77.89W) 3.91
2.3 SE Wilmington (34.20N 77.92W) 3.88
Robersonville (35.82N 77.25W) 3.84
0.7 N Bath (35.48N 76.81W) 3.70
5.8 WNW Southport (33.95N 78.11W) 3.68
4.6 NNE Kinston (35.33N 77.56W) 3.57
5.9 W Southport (33.92N 78.12W) 3.55
1.0 NE Southport (33.93N 78.01W) 3.49
6.1 WSW Snow Hill (35.41N 77.77W) 3.48
2.5 NW Castle Hayne (34.38N 77.93W) 3.40
Virginia ICAO Sites Virginia Beach (Oceana Naval Air Station) (36.83N 76.03W)
4/0944 1003.0 4/1256 33 47
Melfa (Accomack Airport) (37.65N 75.77W) 4/1415 25 40
Wallops Island (37.97N 75.47W) 4/1254 1007.9 4/1325 22 39
Norfolk (Norfolk Naval Air Station) (36.96N 76.29W)
4/0859 1006.0 4/1140 31 38
Newport News (37.14N 76.50W) 4/0851 1007.6 4/0737 23 36
Hampton (Langley AFB) (37.09N 76.35W) 4/0822 1006.0 4/1116 26 35

Hurricane Arthur 20
Location
Minimum Sea Level Pressure
Maximum Surface Wind Speed
Storm surge (ft)c
Storm tide (ft)d
Estimated Inundation
(ft)e
Total rain (in) Date/
time (UTC)
Press. (mb)
Date/ time
(UTC)a
Sustained (kt)b
Gust (kt)
C-MAN Sites Chesapeake Light (36.91N 75.71W) 4/1000 1001.1 4/1340 45 52
NOS Sites Money Point (36.77N 76.30W) 4/0854 1004.3 4/1436 20 32 2.38 0.6
Chesapeake Bay Bridge Tunnel (36.96N 76.11W)
4/0854 1003.9 4/1148 40 53 2.12 0.9
Sewells Point (36.94N 76.33W) 4/0830 1005.3 2.10 2.28 0.7
Yorktown USCG Training Center (37.22N 76.47W)
4/0924 1007.4 4/1506 30 36 1.66 0.6
Windmill Point (37.61N 76.29W) 1.36 1.1
Lewisetta (37.99N 76.46W) 4/0848 1010.6 4/2124 21 30 1.08 1.64 1.0
Kiptopeke (37.16N 75.98W) 4/1312 39 49 1.82 1.66 0.6
Wachapreague (37.60N 75.68W) 4/1106 1006.8 4/1406 34 1.44 0.3
Rappahannock Light (37.53N 76.01W) 4/1300 47 52
York River East Rear Range Light (37.25N 76.34W)
4/1200 35 43
Willoughby Degaussing Station (36.97N 76.31W) 4/1342 30 37
Cape Henry (27.9 m) (36.92N 76.00W) 4/1324 45 52
Dominion Terminal Associates (36.96N 76.42W)
4/1518 27 39
Chesapeake Bay Interpretive Buoy System
Stingray Point (3 m) (37.55N 76.25W) 4/0920 31 36
First Landing (3 m) (36.97N 76.04W) 4/1330 34 47
Norfolk (3 m) (36.84N 76.29W) 4/1120 35
Virginia Department of Transportation Coleman (37.24N 76.50W) 4/1506 38 39
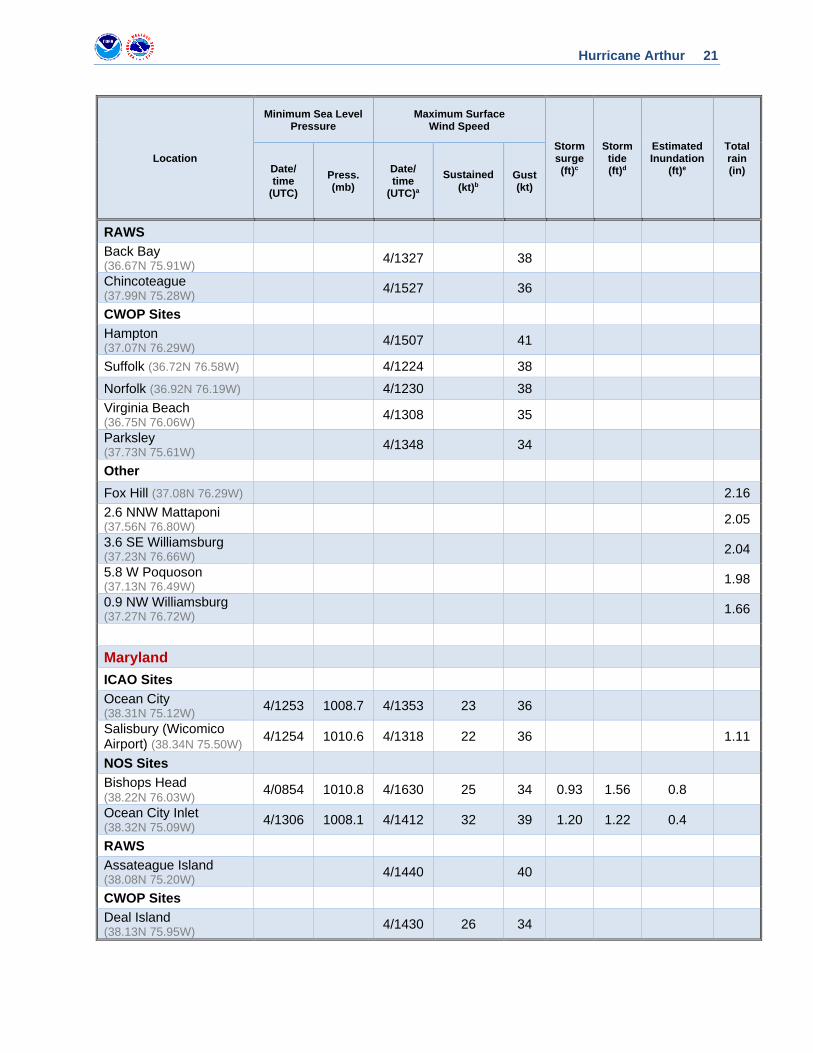
Hurricane Arthur 21
Location
Minimum Sea Level Pressure
Maximum Surface Wind Speed
Storm surge (ft)c
Storm tide (ft)d
Estimated Inundation
(ft)e
Total rain (in) Date/
time (UTC)
Press. (mb)
Date/ time
(UTC)a
Sustained (kt)b
Gust (kt)
RAWS Back Bay (36.67N 75.91W) 4/1327 38
Chincoteague (37.99N 75.28W) 4/1527 36
CWOP Sites Hampton (37.07N 76.29W) 4/1507 41
Suffolk (36.72N 76.58W) 4/1224 38
Norfolk (36.92N 76.19W) 4/1230 38 Virginia Beach (36.75N 76.06W) 4/1308 35
Parksley (37.73N 75.61W) 4/1348 34
Other Fox Hill (37.08N 76.29W) 2.16 2.6 NNW Mattaponi (37.56N 76.80W) 2.05
3.6 SE Williamsburg (37.23N 76.66W) 2.04
5.8 W Poquoson (37.13N 76.49W) 1.98
0.9 NW Williamsburg (37.27N 76.72W) 1.66
Maryland ICAO Sites Ocean City (38.31N 75.12W) 4/1253 1008.7 4/1353 23 36
Salisbury (Wicomico Airport) (38.34N 75.50W) 4/1254 1010.6 4/1318 22 36 1.11
NOS Sites Bishops Head (38.22N 76.03W) 4/0854 1010.8 4/1630 25 34 0.93 1.56 0.8
Ocean City Inlet (38.32N 75.09W) 4/1306 1008.1 4/1412 32 39 1.20 1.22 0.4
RAWS Assateague Island (38.08N 75.20W) 4/1440 40
CWOP Sites Deal Island (38.13N 75.95W) 4/1430 26 34
Hurricane Arthur 22
Location
Minimum Sea Level Pressure
Maximum Surface Wind Speed
Storm surge (ft)c
Storm tide (ft)d
Estimated Inundation
(ft)e
Total rain (in) Date/
time (UTC)
Press. (mb)
Date/ time
(UTC)a
Sustained (kt)b
Gust (kt)
Other 1 NW Cambridge (38.57N 76.09W)
2.89
Delaware NOS Sites Lewes (38.78N 75.12W) 4/1318 35 46 1.42 2.34 0.3
Other
Laurel (38.55N 75.57W) 3.35
Lewes (38.78N 75.15W) 3.01
New Jersey NOS Sites Ship John Shoal (39.30N 75.37W) 1.14 0.6
Cape May (38.96N 74.96W) 1.45 2.82 0.4
Atlantic City (39.35N 74.41W) 4/1724 1009.6 1.05 2.19 0.2
Sandy Hook (40.46N 74.00W) 0.96 2.60 0.2
New York NOS Sites The Battery (40.70N 74.01W) 0.84 2.44 0.2
Kings Point (40.81N 73.76W) 0.82 0.0
Montauk (41.04N 71.96W) 4/2236 1007.7 0.84 1.17 0.2
Connecticut NOS Sites Bridgeport (41.17N 73.18W) 0.68 3.49 0.0
New Haven (41.28N 72.90W) 4/2154 1009.8 0.63 0.0
New London (41.36N 72.08W) 4/2318 1007.5 0.58 1.27 0.1

Hurricane Arthur 23
Location
Minimum Sea Level Pressure
Maximum Surface Wind Speed
Storm surge (ft)c
Storm tide (ft)d
Estimated Inundation
(ft)e
Total rain (in) Date/
time (UTC)
Press. (mb)
Date/ time
(UTC)a
Sustained (kt)b
Gust (kt)
Rhode Island NOS Sites Quonset Point (41.58N 71.41W) 5/0048 1007.4 4/2236 28 34 0.56 0.0
Providence (41.80N 71.40W) 5/0100 1007.5 0.80 2.26 0.0
Conimicut Light (41.71N 71.34W) 5/0106 1007.4 4/2254 30 37 0.64 0.0
Newport (41.50N 71.32W) 5/0054 1005.9 0.66 2.00 0.0
Other Little Compton (41.50N 71.17W) 4.40
South Kingstown (41.43N 71.55W) 3.98
Massachusetts ICAO Sites Nantucket (41.25N 70.06W) 5/0053 998.8 5/0153 43 55
Martha's Vineyard (41.39N 70.61W) 5/0153 1002.8 4/2353 27 44
Hyannis (41.66N 70.28W) 5/0256 1002.8 5/0230 25 41
Chatham (41.68N 69.99W) 5/0252 1002.3 5/0352 17 39
Milton (42.21N 71.11W) 5/0454 1008.9 5/0954 18 36 Plymouth (41.90N 70.73W) 5/0152 1007.0 5/0121 23 34
C-MAN Sites Buzzards Bay (41.40N 71.03W) 5/0100 1005.0 4/2250 36 43
NOS Sites Nantucket Island (41.28N 70.09W) 5/0106 999.9 5/0048 32 49 2.02 0.6
Woods Hole (41.52N 70.67W) 5/0142 1003.5 0.78 0.96 0.1
Chatham (41.68N 69.95W) 1.51 2.89 0.0
Fall River (41.70N 71.16W) 5/0048 1007.0 0.78 0.0
Boston (42.35N 71.05W) 5/0518 1006.7 0.97 4.77 0.0
Hurricane Arthur 24
Location
Minimum Sea Level Pressure
Maximum Surface Wind Speed
Storm surge (ft)c
Storm tide (ft)d
Estimated Inundation
(ft)e
Total rain (in) Date/
time (UTC)
Press. (mb)
Date/ time
(UTC)a
Sustained (kt)b
Gust (kt)
Other New Bedford (41.66N 70.94W) 8.00
South Plymouth (41.95N 70.68W) 7.20
Mattapoisett (41.66N 70.81W) 7.00
3 WNW Kingston (41.99N 70.71W) 6.51
3 NW New Bedford (41.69N 70.98W) 6.36
Fairhaven (41.65N 70.82W) 6.34
Acushnet (41.68N 70.91W) 6.14
New Hampshire C-MAN Sites Isle of Shoals (42.97N 70.62W) 5/0800 1005.6 5/1610 30 42
NOS Sites Fort Point (43.07N 70.71W) 0.62 4.40 0.0
Maine ICAO Sites Bar Harbor (44.45N 68.36W) 5/0855 34
Bangor (44.80N 68.82W) 5/1011 36
Greenville (45.46N 69.60W) 5/1256 36
Millinocket (45.65N 68.69W) 5/1239 35
Houlton (46.12N 67.79W) 41
Caribou (46.87N 68.02W) 5/1822 45 Frenchville (47.29N 68.31W) 5/1753 40
Portland (43.64N 70.30W) 5/1837 37
C-MAN Sites Matinicus Rock (43.78N 68.86W) 5/0800 999.5 5/0920 39 47
Hurricane Arthur 25
Location
Minimum Sea Level Pressure
Maximum Surface Wind Speed
Storm surge (ft)c
Storm tide (ft)d
Estimated Inundation
(ft)e
Total rain (in) Date/
time (UTC)
Press. (mb)
Date/ time
(UTC)a
Sustained (kt)b
Gust (kt)
NOS Sites
Wells (43.32N 70.56W) 5/0642 1005.3 0.65 0.0 Portland (43.65N 70.24W) 5/0730 1005.1 0.54 4.65 0.0
Cutler Farris Wharf (44.65N 67.21W) 5/1054 988.7 5/1230 26 41 1.02 7.08 0.1
Eastport (44.90N 66.98W) 5/1100 987.3 5/0936 33 50 0.76 9.30 0.0
Other
3 NNE Whiting 6.48
Pembroke 6.15
Moosehorn NWR 6.02
Machias 5.64
Moosehorn NWR 5.49
3 NW Addison 4.74
Topsfield 4.63
3 ESE Mapleton 4.62
1 WSW Pembroke 4.56
4 E East Machias 4.50
Eastport 4.44
2 ESE Princeton 4.36
Princeton 4.21
1 WNW Eastport 4.06
New Brunswick Point Lepreau (45.07N 66.45W) 5/1300 985.7 5/1600 37
St. Stephen (45.20N 67.25W) 5/1100 42
Saint John (45.32N 65.88W) 5/1500 983.8 5/1800 42
Oromocto (45.83N 66.43W) 5/1300 41
Fredericton (45.87N 66.53W) 5/1200 37 57
Moncton (46.12N 64.68W) 5/1853 980.6 5/2245 37
Bathurst (47.62N 65.75W) 5/1946 35
Hurricane Arthur 26
Location
Minimum Sea Level Pressure
Maximum Surface Wind Speed
Storm surge (ft)c
Storm tide (ft)d
Estimated Inundation
(ft)e
Total rain (in) Date/
time (UTC)
Press. (mb)
Date/ time
(UTC)a
Sustained (kt)b
Gust (kt)
Charlo (47.97N 66.32W) 6/0200 38
Gagetown 5.91
St. Stephen 5.63
Noonan 5.51
Millville 5.00
Miramichi 4.80
Nova Scotia Brier Island (44.28N 66.35W) 5/1100 984.8 5/1600 56 66
Yarmouth (43.83N 66.08W) 5/1000 982.7 5/1428 40 61 2.05
Kejimkujik (44.43N 65.20W) 5/2000 42
Western Head (43.98N 64.67W) 5/1100 38 48
Lunenberg (44.37N 64.30W) 5/1000 38 55
McNabs Island (44.60N 63.53W) 5/1700 39 51
Halifax (44.88N 63.50W) 5/1437 35 51 Greenwood (44.98N 64.92W) 5/2100 48 75
Kentville (45.07N 64.48W) 5/2200 45
Debert (45.42N 63.47W) 5/1400 46 Amherst (45.77N 64.23W) 5/1700 983.5 5/2100 43
Beaver Island (44.82N 62.33W) 5/1800 41 50
Caribou Point (45.77N 62.68W) 5/1400 41 53
Tracadie (45.62N 61.68W) 5/1500 47
Port Hawkesbury (45.67N 61.37W) 5/1600 40
Hart Island (45.35N 60.98W) 5/1700 41
Grand Etang (46.55N 61.05W) 5/2040 53
North Mountain (46.82N 60.67W) 5/2100 36
Sydney (46.17N 60.05W) 5/2000 45
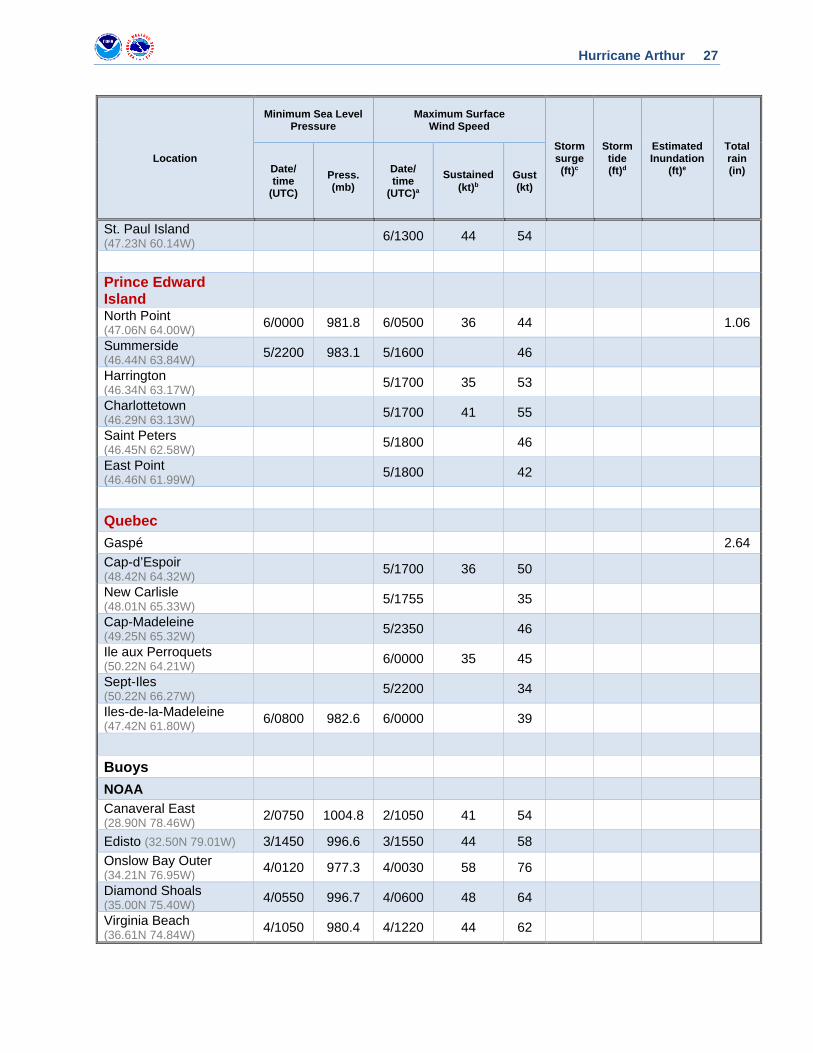
Hurricane Arthur 27
Location
Minimum Sea Level Pressure
Maximum Surface Wind Speed
Storm surge (ft)c
Storm tide (ft)d
Estimated Inundation
(ft)e
Total rain (in) Date/
time (UTC)
Press. (mb)
Date/ time
(UTC)a
Sustained (kt)b
Gust (kt)
St. Paul Island (47.23N 60.14W) 6/1300 44 54
Prince Edward Island
North Point (47.06N 64.00W) 6/0000 981.8 6/0500 36 44 1.06
Summerside (46.44N 63.84W) 5/2200 983.1 5/1600 46
Harrington (46.34N 63.17W) 5/1700 35 53
Charlottetown (46.29N 63.13W) 5/1700 41 55
Saint Peters (46.45N 62.58W) 5/1800 46
East Point (46.46N 61.99W) 5/1800 42
Quebec
Gaspé 2.64 Cap-d’Espoir (48.42N 64.32W) 5/1700 36 50
New Carlisle (48.01N 65.33W) 5/1755 35
Cap-Madeleine (49.25N 65.32W) 5/2350 46
Ile aux Perroquets (50.22N 64.21W) 6/0000 35 45
Sept-Iles (50.22N 66.27W) 5/2200 34
Iles-de-la-Madeleine (47.42N 61.80W) 6/0800 982.6 6/0000 39
Buoys NOAA Canaveral East (28.90N 78.46W) 2/0750 1004.8 2/1050 41 54
Edisto (32.50N 79.01W) 3/1450 996.6 3/1550 44 58 Onslow Bay Outer (34.21N 76.95W) 4/0120 977.3 4/0030 58 76
Diamond Shoals (35.00N 75.40W) 4/0550 996.7 4/0600 48 64
Virginia Beach (36.61N 74.84W) 4/1050 980.4 4/1220 44 62
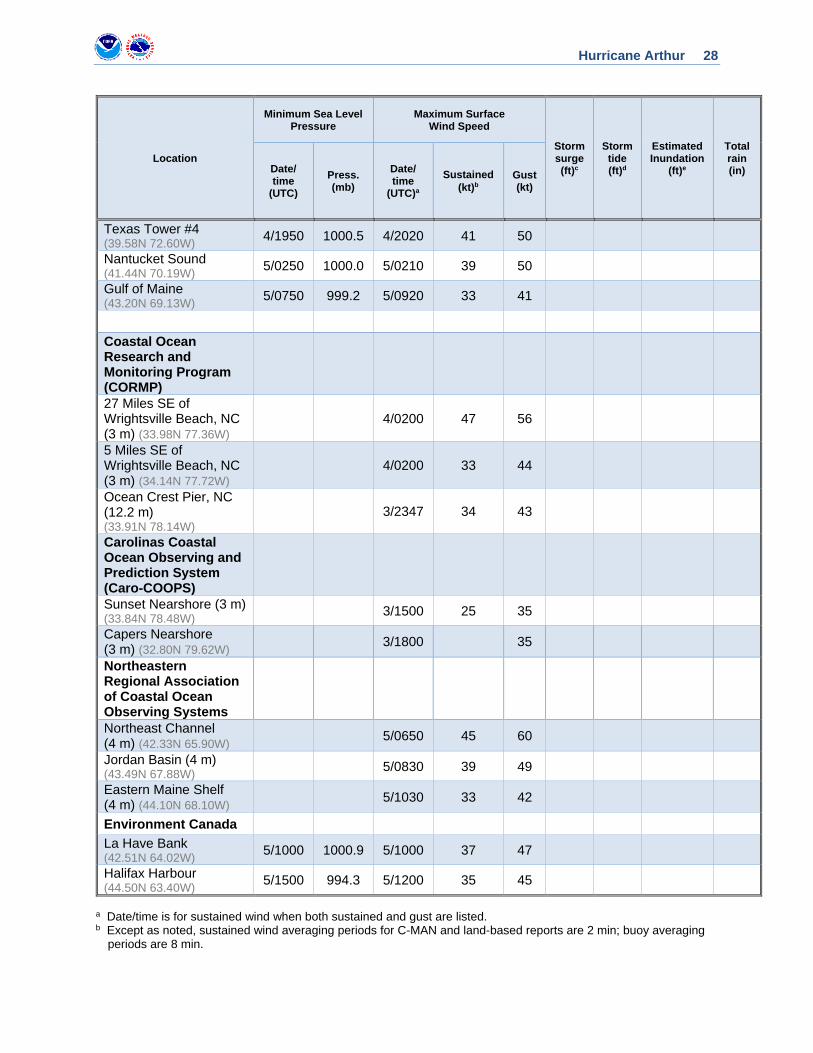
Hurricane Arthur 28
Location
Minimum Sea Level Pressure
Maximum Surface Wind Speed
Storm surge (ft)c
Storm tide (ft)d
Estimated Inundation
(ft)e
Total rain (in) Date/
time (UTC)
Press. (mb)
Date/ time
(UTC)a
Sustained (kt)b
Gust (kt)
Texas Tower #4 (39.58N 72.60W) 4/1950 1000.5 4/2020 41 50
Nantucket Sound (41.44N 70.19W) 5/0250 1000.0 5/0210 39 50
Gulf of Maine (43.20N 69.13W) 5/0750 999.2 5/0920 33 41
Coastal Ocean Research and Monitoring Program (CORMP)
27 Miles SE of Wrightsville Beach, NC (3 m) (33.98N 77.36W)
4/0200 47 56
5 Miles SE of Wrightsville Beach, NC (3 m) (34.14N 77.72W)
4/0200 33 44
Ocean Crest Pier, NC (12.2 m) (33.91N 78.14W)
3/2347 34 43
Carolinas Coastal Ocean Observing and Prediction System (Caro-COOPS)
Sunset Nearshore (3 m) (33.84N 78.48W) 3/1500 25 35
Capers Nearshore (3 m) (32.80N 79.62W) 3/1800 35
Northeastern Regional Association of Coastal Ocean Observing Systems
Northeast Channel (4 m) (42.33N 65.90W) 5/0650 45 60
Jordan Basin (4 m) (43.49N 67.88W) 5/0830 39 49
Eastern Maine Shelf (4 m) (44.10N 68.10W) 5/1030 33 42
Environment Canada La Have Bank (42.51N 64.02W) 5/1000 1000.9 5/1000 37 47
Halifax Harbour (44.50N 63.40W) 5/1500 994.3 5/1200 35 45
a Date/time is for sustained wind when both sustained and gust are listed. b Except as noted, sustained wind averaging periods for C-MAN and land-based reports are 2 min; buoy averaging
periods are 8 min.

Hurricane Arthur 29
c Storm surge is water height above normal astronomical tide level. d For most locations, storm tide is water height above the North American Vertical Datum of 1988 (NAVD88). e Estimated inundation is the maximum height of water above ground. For NOS tide gauges, the height of the water
above Mean Higher High Water (MHHW) is used as a proxy for inundation.
Hurricane Arthur 30
Table 4a. NHC official (OFCL) and climatology-persistence skill baseline (OCD5) track forecast errors (n mi) for Hurricane Arthur, 1-5 July 2014. Mean errors for the previous 5-yr period are shown for comparison. Official errors that are smaller than the 5-yr means are shown in boldface type.
Forecast Period (h)
12 24 36 48 72 96 120
OFCL 13.7 27.0 41.2 55.9 117.0 179.4
OCD5 30.2 85.7 161.5 239.8 422.8 724.8
Forecasts 16 14 12 10 6 2
OFCL (2009-13) 28.8 45.5 61.2 77.8 114.5 158.4
OCD5 (2009-13) 48.2 100.1 160.2 220.8 326.6 410.7
Hurricane Arthur 31
Table 4b. Homogeneous comparison of selected track forecast guidance models (in n mi) for Hurricane Arthur, 1-5 July 2014. Errors smaller than the NHC official forecast are shown in boldface type. The number of official forecasts shown here will generally be smaller than that shown in Table 4a due to the homogeneity requirement.
Model ID Forecast Period (h)
12 24 36 48 72 96 120
OFCL 12.8 26.1 44.6 68.6 156.1
OCD5 31.3 93.7 185.2 282.4 525.0
GFSI 15.1 21.7 38.4 55.4 117.5
EMXI 20.2 42.7 80.8 130.3 309.2
EGRI 15.0 33.0 67.2 110.9 202.9
CMCI 11.5 21.0 34.8 62.4 158.6
GHMI 15.1 29.2 48.4 58.4 57.5
HWFI 13.9 25.0 33.0 41.6 117.7
NAMI 21.6 42.6 86.5 154.7 258.9
AEMI 16.2 27.6 45.6 69.6 169.2
FSSE 13.9 22.9 40.6 58.6 115.9
TCON 12.7 24.0 42.2 62.9 121.8
TVCA 13.7 28.4 49.5 75.2 160.1
BAMS 36.1 77.2 114.7 162.7 351.2
BAMM 30.5 59.4 94.4 140.4 314.4
BAMD 27.7 47.7 70.1 104.1 226.7
Forecasts 12 11 9 7 3
Hurricane Arthur 32
Table 5a. NHC official (OFCL) and climatology-persistence skill baseline (OCD5) intensity forecast errors (kt) for Hurricane Arthur, 1-5 July 2014. Mean errors for the previous 5-yr period are shown for comparison. Official errors that are smaller than the 5-yr means are shown in boldface type.
Forecast Period (h)
12 24 36 48 72 96 120
OFCL 5.6 11.4 11.7 11.5 15.8 5.0
OCD5 9.3 15.6 20.8 25.7 26.7 27.5
Forecasts 16 14 12 10 6 2
OFCL (2009-13) 6.3 9.7 11.9 13.7 15.3 15.4
OCD5 (2009-13) 7.4 11.1 13.8 15.7 18.3 18.2
Table 5b. Homogeneous comparison of selected intensity forecast guidance models (in kt) for Hurricane Arthur, 1-5 July 2014. Errors smaller than the NHC official forecast are shown in boldface type. The number of official forecasts shown here will generally be smaller than that shown in Table 5a due to the homogeneity requirement.
Model ID Forecast Period (h)
12 24 36 48 72 96 120
OFCL 6.0 11.9 11.8 11.1 14.0 5.0
OCD5 9.9 16.0 20.5 24.4 20.4 19.0
HWFI 8.7 13.6 15.5 13.0 13.8 10.0
GHMI 5.9 9.2 12.5 15.2 11.0 5.0
GFSI 9.8 13.9 13.8 14.0 12.4 7.0
EMXI 8.3 13.2 16.0 16.7 14.2 0.0
DSHP 7.7 11.5 11.3 11.4 16.2 25.0
LGEM 7.8 11.5 13.5 14.6 13.8 2.0
ICON 7.2 11.4 12.7 13.2 14.0 8.0
IVCN 7.2 11.4 12.7 13.2 14.0 8.0
FSSE 6.9 12.5 14.5 14.4 11.6 1.0
Forecasts 15 13 11 9 5 1
Hurricane Arthur 33
Table 6. Watch and warning summary for Hurricane Arthur, 1-5 July 2014.
Date/Time (UTC) Action Location
1 / 0300 Tropical Storm Watch issued Fort Pierce to Flagler Beach, FL
2 / 0900 Hurricane Watch issued Bogue Inlet to Oregon Inlet, NC and Pamlico Sound
2 / 0900 Tropical Storm Watch issued South Santee River, SC to Bogue Inlet, NC
2 / 0900 Tropical Storm Watch issued Oregon Inlet, NC to NC/VA border and eastern Albemarle Sound
2 / 0900 Tropical Storm Watch modified to Sebastian Inlet to Flagler Beach, FL
2 / 1500 Tropical Storm Warning issued Little River Inlet, SC to NC/VA border and Pamlico and eastern Albemarle
Sounds
2 / 1500 Tropical Storm Watch modified to South Santee River to Little River Inlet, SC
2 / 1500 Tropical Storm Watch discontinued Oregon Inlet, NC to NC/VA border and eastern Albemarle Sound
2 / 1500 Tropical Storm Watch discontinued Sebastian Inlet to Flagler Beach, FL
2 / 2100 Hurricane Warning issued Surf City to Duck, NC and Pamlico and eastern Albemarle Sounds
2 / 2100 Tropical Storm Warning issued South Santee River to Little River Inlet, SC
2 / 2100 Tropical Storm Warning issued Duck, NC to Cape Charles Light, VA 2 / 2100 Tropical Storm Warning issued Western Albemarle Sound 2 / 2100 Hurricane Watch issued Little River Inlet, SC to Surf City, NC
2 / 2100 Tropical Storm Watch discontinued All
2 / 2100 Hurricane Watch discontinued Bogue Inlet to Oregon Inlet, NC and Pamlico Sound
2 / 2100 Tropical Storm Warning discontinued Surf City to Duck, NC
3 / 0900 Hurricane Warning modified to Surf City, NC to NC/VA border
3 / 0900 Tropical Storm Warning modified to NC/VA border to Cape Charles Light, VA
3 / 2100 Tropical Storm Warning issued Chatham to Provincetown, MA 3 / 2100 Tropical Storm Warning issued Nantucket, MA
3 / 2100 Tropical Storm Watch issued Port Maitland to Point Aconi, Nova Scotia
4 / 0100 Hurricane Watch discontinued Little River Inlet, SC to Surf City, NC
4 / 0100 Tropical Storm Warning discontinued
South Santee River to Little River Inlet, SC
4 / 0300 Tropical Storm Watch issued US/Canada border to Grand-Anse, New Brunswick
Hurricane Arthur 34
Date/Time (UTC) Action Location
4 / 0300 Tropical Storm Watch issued Prince Edward Island 4 / 0300 Tropical Storm Watch modified to All of Nova Scotia 4 / 0300 Tropical Storm Warning modified to Cape Fear to Surf City, NC
4 / 0500 Tropical Storm Warning discontinued Cape Fear to Surf City, NC
4 / 0700 Hurricane Warning modified to Bogue Inlet, NC to NC/VA border
4 / 0900 Tropical Storm Warning modified to Woods Hole to Provincetown, MA 4 / 0900 Hurricane Warning modified to Cape Lookout, NC to NC/VA border 4 / 1100 Hurricane Warning modified to Ocracoke Inlet to NC/VA border 4 / 1100 Hurricane Warning discontinued Pamlico Sound
4 / 1300 Tropical Storm Warning issued Digby (southward) to Porters Lake, Nova Scotia
4 / 1300 Tropical Storm Watch modified to Digby (northward) to Porters Lake, Nova Scotia
4 / 1500 Tropical Storm Watch changed to Tropical Storm Warning
US/Canada border to Grand-Anse, New Brunswick
4 / 1500 Tropical Storm Watch changed to Tropical Storm Warning Prince Edward Island
4 / 1500 Tropical Storm Warning modified to All of Nova Scotia
4 / 1500 Hurricane Warning discontinued All
4 / 1500 Tropical Storm Warning discontinued Western Albemarle Sound
4 / 1800 Tropical Storm Warning discontinued
NC/VA border to Cape Charles Light, VA
5 / 0900 Tropical Storm Warning discontinued Woods Hole to Provincetown, MA
5 / 0900 Tropical Storm Warning discontinued Nantucket, MA
6 / 0550 Tropical Storm Warning discontinued
US/Canada border to Grand-Anse, New Brunswick
6 / 0550 Tropical Storm Warning discontinued Western Nova Scotia
6 / 1200 Tropical Storm Warning discontinued Eastern Nova Scotia
6 / 1200 Tropical Storm Warning discontinued Prince Edward Island
Hurricane Arthur 35
Figure 1. Best track positions for Hurricane Arthur, 1-5 July 2014. Track during the extratropical stage is partially based on analyses from the NOAA Ocean Prediction Center.
Hurricane Arthur 36
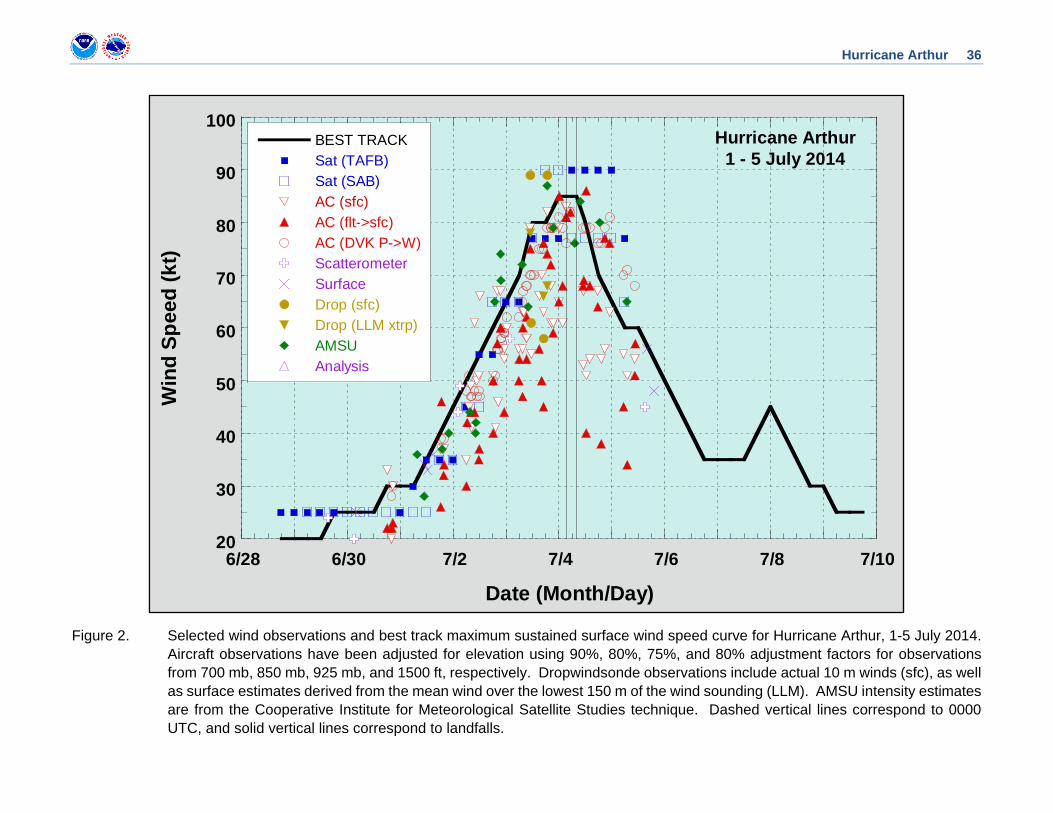
Figure 2. Selected wind observations and best track maximum sustained surface wind speed curve for Hurricane Arthur, 1-5 July 2014. Aircraft observations have been adjusted for elevation using 90%, 80%, 75%, and 80% adjustment factors for observations from 700 mb, 850 mb, 925 mb, and 1500 ft, respectively. Dropwindsonde observations include actual 10 m winds (sfc), as well as surface estimates derived from the mean wind over the lowest 150 m of the wind sounding (LLM). AMSU intensity estimates are from the Cooperative Institute for Meteorological Satellite Studies technique. Dashed vertical lines correspond to 0000 UTC, and solid vertical lines correspond to landfalls.
20
30
40
50
60
70
80
90
100
6/28 6/30 7/2 7/4 7/6 7/8 7/10
BEST TRACKSat (TAFB)Sat (SAB)AC (sfc)AC (flt->sfc)AC (DVK P->W)ScatterometerSurfaceDrop (sfc)Drop (LLM xtrp)AMSUAnalysis
Win
d Sp
eed
(kt)
Date (Month/Day)
Hurricane Arthur1 - 5 July 2014
Hurricane Arthur 37
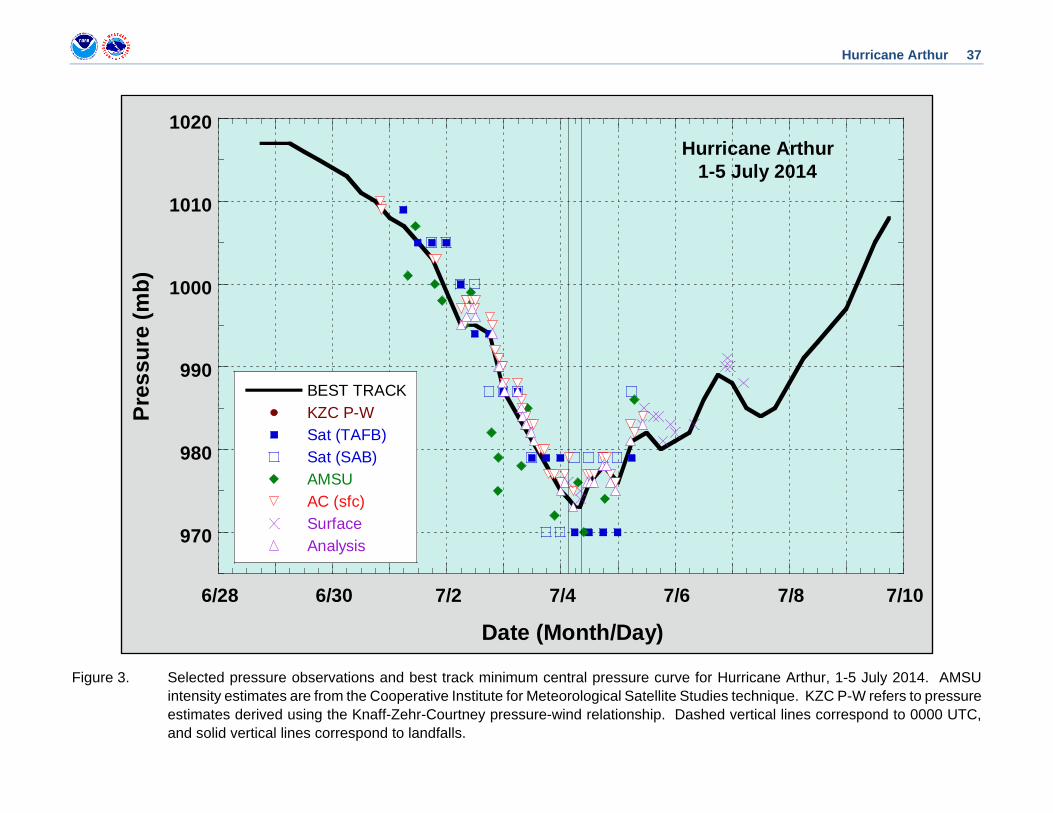
Figure 3. Selected pressure observations and best track minimum central pressure curve for Hurricane Arthur, 1-5 July 2014. AMSU intensity estimates are from the Cooperative Institute for Meteorological Satellite Studies technique. KZC P-W refers to pressure estimates derived using the Knaff-Zehr-Courtney pressure-wind relationship. Dashed vertical lines correspond to 0000 UTC, and solid vertical lines correspond to landfalls.
970
980
990
1000
1010
1020
6/28 6/30 7/2 7/4 7/6 7/8 7/10
BEST TRACKKZC P-WSat (TAFB)Sat (SAB)AMSUAC (sfc)SurfaceAnalysis
Pres
sure
(mb)
Date (Month/Day)
Hurricane Arthur1-5 July 2014
Hurricane Arthur 38
Figure 4a. Map of select maximum sustained winds (kt) reported across coastal North Carolina and Virginia from Hurricane Arthur.
Hurricane Arthur 39
Figure 4b. Map of select maximum wind gusts (kt) reported across coastal North Carolina from Hurricane Arthur.
Hurricane Arthur 40
Figure 5. Map of measured and estimated storm surge inundation heights (ft above ground level) along the coast of North Carolina and southeastern Virginia from Hurricane Arthur.
Hurricane Arthur 41
Figure 6. (a) Official track forecasts, (b) GFS forecasts, (c) HWRF forecasts, and (d) ECMWF forecasts for Hurricane Arthur, 1-5 July 2014 from 0000 UTC 1 July through 1200 UTC 5 July. The best track is given by the thick solid white line with positions given at 6-h intervals.
(a) (b)
(c) (d)
Hurricane Arthur 42
Figure 7. Example of the experimental NHC Potential Storm Surge Flooding Map, issued during Hurricane Arthur for the first time. This example was issued coincident with Advisory 10 for Hurricane Arthur around 0900 UTC 3 July 2014.
Hurricane Arthur 43
Figure 8. Measurements of storm surge inundation (in ft above ground level) verified against the experimental Potential Storm Surge Flooding Maps issued during Hurricane Arthur for (a) Advisory 7 (1500 UTC 2 July) and (b) Advisory 13 (0300 UTC 4 July). The inset on both figures provides a close-up view of the Rodanthe-Salvo area where the highest inundation occurred.
Advisory 13 0300 UTC 4 July
Advisory 7 1500 UTC 2 July
(a)
(b)