trois essais de la politique de distribution de dividendes · trois essais de la politique de...
TRANSCRIPT
Trois essais de la politique de distribution de dividendes
Quoc Trung Tran
To cite this version:
Quoc Trung Tran. Trois essais de la politique de distribution de dividendes. Economies etfinances. Universite du Droit et de la Sante - Lille II, 2016. Francais. <NNT : 2016LIL20006>.<tel-01391436>
HAL Id: tel-01391436
https://tel.archives-ouvertes.fr/tel-01391436
Submitted on 3 Nov 2016
HAL is a multi-disciplinary open accessarchive for the deposit and dissemination of sci-entific research documents, whether they are pub-lished or not. The documents may come fromteaching and research institutions in France orabroad, or from public or private research centers.
L’archive ouverte pluridisciplinaire HAL, estdestinee au depot et a la diffusion de documentsscientifiques de niveau recherche, publies ou non,emanant des etablissements d’enseignement et derecherche francais ou etrangers, des laboratoirespublics ou prives.

ComUE Lille Nord de France
Thèse délivrée par
L’Université Lille 2 – Droit et Santé
N° attribué par la bibliothèque
__|__|__|__|__|__|__|__|__|__|
THÈSE
Pour obtenir le grade de Docteur en Sciences de Gestion Présentée et soutenue publiquement par
Quoc Trung TRAN
Le 29-01-2016
JURY
Directeur de thèse: Monsieur Pascal ALPHONSE - Professeur à L’Université Lille 2
Membres du jury:
Monsieur Jérôme MAATI, Professeur à L’Université Lille 1
Monsieur Jean-Francois GAJEWSKI, Professeur à L’Université Savoie Mont Blanc
Monsieur Alain CHEVALIER, Professeur à ESCP Europe
Monsieur Frédéric LOBEZ, Professeur à L’Université de Lille 2
Three essays on dividend policy

i
This page is intentionally left blank

ii
ACKNOWLEDGEMENTS
First and foremost I would like to sincerely thank Professor Pascal Alphonse, one of the
greatest teachers in my life, for his enthusiastic guidance, heartfelt sympathy and valuable
comments on my work. It is my honor to be his student. He taught me how to do research from
developing research ideas to writing research papers. He never stopped motivating me to
overcome obstacles with his own kind supports. I am also thankful for the excellent example he
has provided as a gentle and enthusiastic professor.
I would like to express my deepest and sincere gratitude to my family for their love, support,
and continuous encouragement. My parents have sacrificed their time and spared no efforts to
create the best physical and psychological environment for my study for years. My wife has
sacrificed most of her free time to take care of our beloved children and shared with me many
difficulties that I have during the time of research. In addition, my father and mother in law also
gave me precious encouragement and heartfelt sympathy.
Moreover, I would also like to gratefully thank the leaders of University Lille 2, the Doctoral
School and the French - Vietnamese Center for Management Education (CFVG); Ms. Françoise
Menu Vanhulle and Ms. Sophie Ranchy Desrumaux for their kind supports.
I would like to show my sincere gratitude to my colleagues in Foreign Trade University for
their sympathy and valuable encouragement during the time I conducted this research.
Finally, I would like to thank my friends in Lille for their help and support over the time I study
here and scholars who gave me valuable comments on my work.

iii
This page is intentionally left blank
iv
TABLE OF CONTENTS
AKNOWLEDGEMENT
Chapter 1: INTRODUCTION .................................................................................................. 1
Chapter 2: LITERATURE REVIEW ....................................................................................... 9
2.1. Theories of dividend policy .......................................................................................... 9
2.1.1. Signaling theory ..................................................................................................... 9
2.1.2. Agency theory ...................................................................................................... 14
2.1.3. Transaction cost theory, residual theory and pecking order theory ................. 18
2.1.4. Life cycle theory .................................................................................................. 20
2.1.5. Catering theory ................................................................................................... 22
2.1.6. Tax clientele theory ............................................................................................. 24
2.2. Theories of stock price behavior on the ex-dividend day ......................................... 26
2.2.1. Tax clientele theory ............................................................................................. 26
2.2.2. Short-term trading theory .................................................................................. 29
2.2.3. Microstructure theories ...................................................................................... 32
2.3. Shareholder rights, creditor rights and dividend policy ........................................... 34
Chapter 3: A TWO-STEP APPROACH TO INVESTIGATE DIVIDEND POLICY:
EVIDENCE FROM VIETNAMES STOCK MARKET ......................................................... 41
3.1. Introduction ............................................................................................................... 41
3.2. Background information on Vietnamese stock market ............................................ 42
3.3. Literature review and hypothesis development ........................................................ 43
3.3.1. The decision of paying or not paying dividends ................................................. 43
3.3.2. The decision of dividend levels ............................................................................ 44
3.4. Data............................................................................................................................. 46
3.4.1. Sample selection .................................................................................................. 46
3.4.2. Variable definitions ............................................................................................. 48
v
3.5. Methodology ............................................................................................................... 52
3.6. Findings ...................................................................................................................... 53
3.7. Robustness checks ...................................................................................................... 56
3.8. Conclusion .................................................................................................................. 57
Chapter 4: NEW EVIDENCE OF DIVIDEND CAPTURE ON THE EX-DIVIDEND DAY 58
4.1. Introduction ............................................................................................................... 59
4.2. Literature review........................................................................................................ 60
4.3. Institutional environment .......................................................................................... 61
4.3.1. Trading regulations ............................................................................................. 62
4.3.2. Taxation of dividends and capital gains ............................................................. 64
4.4. Research design .......................................................................................................... 65
4.1.1. Ex-dividend stock price behavior ....................................................................... 65
4.1.2. Ex-dividend trading volume behavior ................................................................ 67
4.1.3. The relationship between dividend yield and abnormal return ........................ 67
4.5. Research data ............................................................................................................. 69
4.5.1. Sample selection .................................................................................................. 69
4.5.2. Descriptive statistics ............................................................................................ 70
4.6. Empirical findings ...................................................................................................... 71
4.6.1. Ex-dividend stock price behavior ....................................................................... 71
4.6.2. Ex-dividend trading volume behavior ................................................................ 75
4.6.3. The relationship between dividend yield and abnormal return ........................ 78
4.7. Conclusion .................................................................................................................. 80
Chapter 5: SHAREHOLDER RIGHTS, CREDITOR RIGHTS AND DIVIDEND POLICY:
DOES THE GLOBAL FINANCIAL CRISIS MATTER? ..................................................... 81
5.1. Introduction ............................................................................................................... 81
5.2. Literature review and research hypotheses .............................................................. 82
vi
5.3. Methodology ............................................................................................................... 85
5.3.1. Research model ................................................................................................... 85
5.3.2. Data sources and sample selection ...................................................................... 87
5.4. Empirical results ........................................................................................................ 87
5.4.1. Summary statistics .............................................................................................. 87
5.4.2. Differences in the effects of shareholder rights, creditor rights on dividend
policy between the pre- and post-crisis periods ........................................................... 91
5.4.3. Differences in the effects of creditor rights on dividend policy between the pre-
and post-crisis periods by level of shareholder rights ................................................. 94
5.4.4. The differences in the effects of shareholder rights on dividend policy between
the pre- and post-crisis periods by level of creditor rights .......................................... 96
5.5. Additional analyses .................................................................................................... 98
5.6. Conclusion ................................................................................................................ 102
Chapter 6: CONCLUSION .................................................................................................. 105
BIBLIOGRAPHY
SUMMARY IN FRENCH

vii
This page is intentionally left blank
viii
TABLES AND FIGURES
Table 3.1. Counts of listed firms in Vietnamese stock market ................................................. 42
Table 3.2. Distribution of non-financial observations in Vietnamese stock market and the
research sample ...................................................................................................................... 47
Table 3.3. Research variable definitions .................................................................................. 48
Table 3.4. Counts and percentage of firms in various dividend groups .................................... 49
Table 3.5. Counts and percentage of non-payers and payers by industry sector ....................... 50
Table 3.6. Summary statistics of research variables of dividend paying decisions ................... 51
Table 3.7. Summary statistics of paying firms’ research variables grouped by into quartiles by
dividend payout ratio .............................................................................................................. 52
Table 3.8. Results of Heckman’s two step regression with year and industry dummies ........... 54
Table 3.9. Robustness check of the second step by OLS regression ......................................... 56
Table 4.1. Price range for buy and sell orders in Ho Chi Minh City Stock Exchange ............... 63
Table 4.2. Tick size in Ho Chi Minh City Stock Exchange ...................................................... 63
Table 4.3. Expected price drop to dividend ratios under the impact of tax policy .................... 64
Table 4.4. Descriptive statistics of dividend, dividend yield, price drop and price drop ratio ... 70
Table 4.5. Ex-dividend day stock price behavior ..................................................................... 72
Table 4.6. Abnormal returns (%) and cumulative abnormal returns (%) around ex-dividend day
............................................................................................................................................... 73
Table 4.7. Abnormal trading volume (%) and cumulative abnormal trading volume (%) around
ex-dividend days. around ex-dividend days ............................................................................. 75
Table 4.8. Descriptive statistics for regression analysis ........................................................... 77
Table 4.9. Regression results .................................................................................................. 79
Table 5.1. Summary statistics ................................................................................................. 88
Table 5.2. Differences in the effects of shareholder rights, creditor rights on dividend policy
between the pre- and post-crisis periods .................................................................................. 92
ix
Table 5.3. Differences in the effects of creditor rights on dividend policy by level of
shareholder rights between the pre- and post-crisis periods ..................................................... 94
Table 5.4. Differences in the effects of shareholder rights on dividend policy by level of
creditor rights between the pre- and post-crisis periods ........................................................... 96
Table 5.5. Additional analyses for the differences in the effects of shareholder rights, creditor
rights on dividend policy between the pre- and post-crisis periods .......................................... 98
Table 5.6. Additional analyses for the differences in the effects of shareholder rights (creditor
rights) on dividend policy by level of creditor rights (shareholder rights) .............................. 100
Figure 1.1. Boeing Corporation’s earnings per share (EPS), dividend per share (DPS) and stock
price ......................................................................................................................................... 2
Figure 4.1. Performance of VN-INDEX and HNX-INDEX from 2006 to 2011 ....................... 62
1
Chapter 1: INTRODUCTION
“Our goal is to increase enterprise value. Which would you rather have us be? A company with
our stock price, and $40 billion in the bank? Or a company with our stock price and no cash in
the bank?” - Steve Jobs replied when he was asked about Apple’s dividend policy. Under this
philosophy, the world’s largest technology company did not pay dividend from 1996 to 2011.
Apple’s dividend philosophy is mainly consistent with the residual theory of dividend policy
stated as follows: Firms’ operations and investment opportunities are financed from two sources
of funds: internal funds (i.e. retained earnings) and external funds (i.e. debt and new equity).
Managers who try to maximize shareholder wealth prefer retention of earnings to dividend
payment due to significant transaction costs of external financing. Therefore, firms only pay
dividends as a residual after financing all available investment opportunities (Higgins, 1972).
After Tim Cook succeeded Jobs to be the CEO, Apple started to pay dividends in 2012. Despite
Cook’s statement “We can still maintain a war chest for strategic opportunities and have plenty
of cash to run our business" (dividends are also considered as residuals), to some extent this
dividend payment was interpreted that Cook “actually meets with and listens to investors and
shareholders” (Paczkowski, 2012). Apple’s dividend philosophy is mainly consistent with the
residual theory of dividend policy stated as follows: Firms’ operations and investment
opportunities are financed from two sources of funds: internal funds (i.e. retained earnings) and
external funds (i.e. debt and new equity). Managers who try to maximize shareholder wealth
prefer retention of earnings to dividend payment since investments due to significant
transaction costs of external financing. Therefore, firms only pay dividends as a residual after
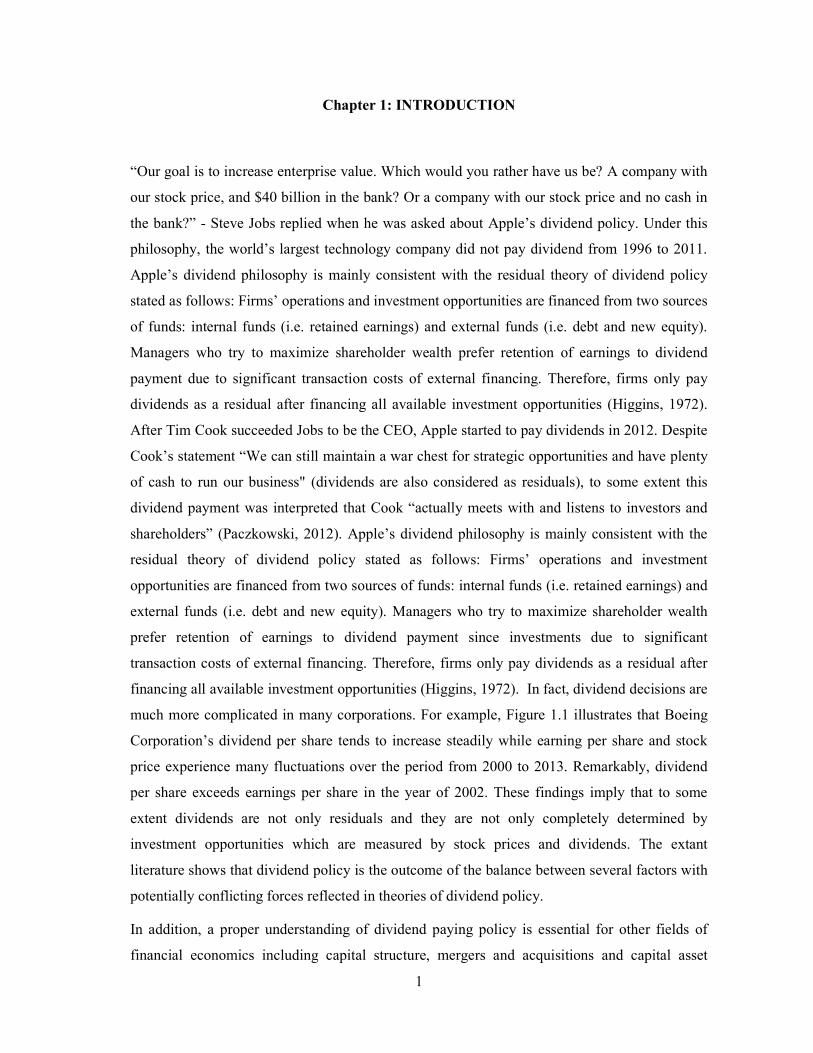
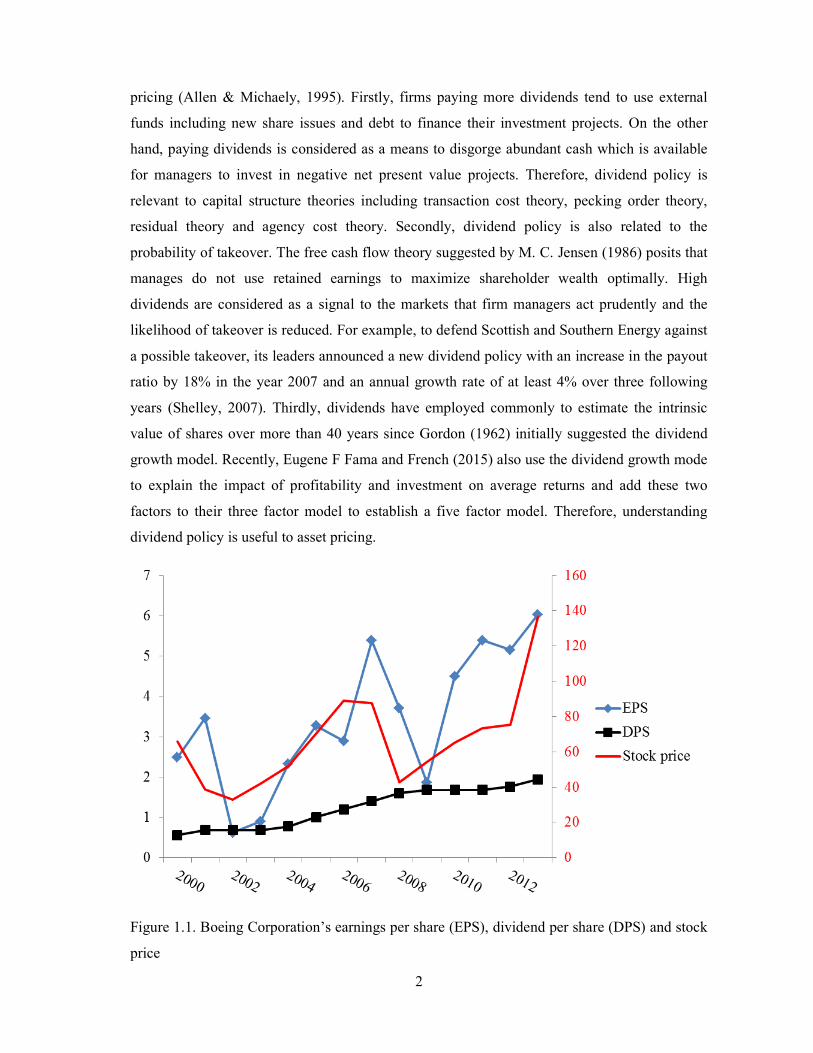
financing all available investment opportunities (Higgins, 1972). In fact, dividend decisions are
much more complicated in many corporations. For example, Figure 1.1 illustrates that Boeing
Corporation’s dividend per share tends to increase steadily while earning per share and stock
price experience many fluctuations over the period from 2000 to 2013. Remarkably, dividend
per share exceeds earnings per share in the year of 2002. These findings imply that to some
extent dividends are not only residuals and they are not only completely determined by
investment opportunities which are measured by stock prices and dividends. The extant
literature shows that dividend policy is the outcome of the balance between several factors with
potentially conflicting forces reflected in theories of dividend policy.
In addition, a proper understanding of dividend paying policy is essential for other fields of
financial economics including capital structure, mergers and acquisitions and capital asset
2
pricing (Allen & Michaely, 1995). Firstly, firms paying more dividends tend to use external
funds including new share issues and debt to finance their investment projects. On the other
hand, paying dividends is considered as a means to disgorge abundant cash which is available
for managers to invest in negative net present value projects. Therefore, dividend policy is
relevant to capital structure theories including transaction cost theory, pecking order theory,
residual theory and agency cost theory. Secondly, dividend policy is also related to the
probability of takeover. The free cash flow theory suggested by M. C. Jensen (1986) posits that
manages do not use retained earnings to maximize shareholder wealth optimally. High
dividends are considered as a signal to the markets that firm managers act prudently and the
likelihood of takeover is reduced. For example, to defend Scottish and Southern Energy against
a possible takeover, its leaders announced a new dividend policy with an increase in the payout
ratio by 18% in the year 2007 and an annual growth rate of at least 4% over three following
years (Shelley, 2007). Thirdly, dividends have employed commonly to estimate the intrinsic
value of shares over more than 40 years since Gordon (1962) initially suggested the dividend
growth model. Recently, Eugene F Fama and French (2015) also use the dividend growth mode
to explain the impact of profitability and investment on average returns and add these two
factors to their three factor model to establish a five factor model. Therefore, understanding
dividend policy is useful to asset pricing.
Figure 1.1. Boeing Corporation’s earnings per share (EPS), dividend per share (DPS) and stock
price
3
In a classic work, Black (1976) fails to find a reasonable argument to explain why firms
distribute cash dividends to their stockholders and consider dividends as a “puzzle”. Since then,
dividend policy is studied intensely by financial economists and it becomes one of the most
debatable topics in corporate finance. Initially, Miller and Modigliani (1961) propose the
irrelevance theory of dividend policy assuming that capital markets are perfect and complete.
However, later studies find that market is not perfect and complete, hence dividend policy is
affected by market frictions including information asymmetry, agency problems, transaction
costs, firm maturity, catering incentives and taxes. From these market fictions, many theories of
dividend policy are developed to explain the dividend puzzle. The signaling theory argues that
there is asymmetric information between corporate managers and outside investors, thus
managers use dividends as a signal of corporate expected profitability (Bhattacharya, 1979;
Heinkel, 1978; John & Williams, 1985). Agency theory focuses on the conflicts of interest
between managers and shareholders and considers dividend payment is a device to mitigate
agency problems and reduce agency costs (Easterbrook, 1984; M. C. Jensen, 1986; M. C.
Jensen & Meckling, 1976). Transaction cost theory, residual theory and pecking order theory
argue that firms prefer financing business projects with retained earnings to external financing;
therefore firms do not want to pay dividend when they have available investment opportunities
(Higgins, 1972; Stewart C. Myers & Nicholas S. Majluf, 1984; Rozeff, 1982; Weston &
Brigham, 1979). Life cycle theory states that mature and established firms pay more dividends
due to abundant resources and fewer investment projects whilst young firms with limited
resources tend to pay less dividends to finance their investment opportunities (DeAngelo &
DeAngelo, 2006; Grullon, Michaely, & Swaminathan, 2002). Catering theory argues that firms
pay dividends since they follow investors’ demand (M. Baker & Wurgler, 2004b). Tax clientele
theory explains dividend policy by the difference between tax rates imposed on capital gains
and dividends. The favorable treatment of capital gains to dividends makes firms minimize
dividends to maximize their shareholders’ wealth (Litzenberger & Ramaswamy, 1979). In
addition, the change in stock price on the ex-dividend day is also an anomaly. Many studies
find that the stock price drop on the day stocks go ex-dividend is lower than dividend amount
while it is hypothesized to be equal to dividend amount under the irrelevance theory of
dividends. This anomaly is commonly explained by three groups of factors including taxation
(Elton & Gruber, 1970), transaction costs (Kalay, 1982a) and market microstructure (Bali &
Hite, 1998; Dubofsky, 1992; Frank & Jagannathan, 1998). Moreover, there has recently been a
new trend of international corporate governance research focusing dividend policy across legal
regimes. Dividend policy is examined with a pair of opposite models including the outcome
4
model based on agency costs of equity and the substitute model based on agency costs of debt
(Brockman & Unlu, 2009; La Porta, Lopez-De-Silanes, Shleifer, & Vishny, 2000). The former
predicts that firms pay dividends as the outcome of the pressure from shareholders. By contrast,
the latter predicts that firms pay dividends as the substitute for the weak protection of creditors
since they want to earn a good reputation on fair treatment of creditors and meet creditors’
demand to restrict dividends under private credit contracts. This PhD dissertation provides new
evidence of the above-mentioned dividend policy theories with three separate essays as follows:
The first essay investigates dividend policy in Vietnamese stock market with a two-step
approach. This study chooses Vietnamese stock market to examine dividend policy due to three
following reasons: (1) It is a newly established stock market in which the regulations and
investors’ experience to control agency problems are likely incomplete, hence this is a good
environment to investigate the agency theory; (2) With short booming and crashing periods,
there are rapid changes in transaction costs of raising external funds and the need to use
dividends as signals to outside investors in the market. Therefore, testing the transaction cost
theory and the signaling theory of dividends is more convenient; (3) State-controlled firms
account for a large percentage in listed firms, this is an opportunity to examine dividend policy
under the impact of state control which is relevant to “double principal-agent problem” (Gugler,
2003) and the demand of more cash to finance other financially constrained state-owned
enterprises or public projects (D. Chen, Jian, & Xu, 2009). Moreover, we argue that dividend
policy is not just a simple decision of how much firms should distribute their earnings in form
of cash. Dividend policy is a complex decision making process including two steps, namely the
decision to pay or not to pay and the decision of dividend payouts. Besides, from econometric
perspective, selection bias arises when OLS regression is used for the full sample of non-payers
and payers or the subsample of payers since dividends are continuous to the right of zero.
Therefore, this study examines dividend policy in Vietnamese stock market with Heckman’s
two-step regression approach which fixes the selection bias. Research findings show that
dividend payment decision is determined by firm characteristics including profitability,
investment opportunities, firm size, maturity, stock liquidity, insider ownership and state
control. In addition, dividend levels measured by dividend payout ratio and dividend yield are
explained by investment opportunities and agency problem. These findings show the following
implications in Vietnamese stock market: (1) investors are expropriated more in firms with
higher insider ownership; (2) Investors tend to receive smaller dividends paid as a signal of
expected profitability when information asymmetry is lower; (3) investors in state-controlled
5
firms are more likely to receive dividends than those in non-state-controlled firms. Besides,
they are less likely to gain dividends when firms have higher investment opportunities, larger
size and higher maturity.
The second essay provides new evidence of dividend capture on the ex-dividend day despite
much debatable evidence of this anomaly. The extant literature shows that the ex-dividend day
anomaly of stock price can be explained by three groups of factors including taxation,
transaction costs and market microstructure. Tax clientele theory argues that an investor is
indifferent to selling his stocks before or after the ex-dividend day if the benefits from these two
activities are equal; therefore, the tax treatment of capital gains to dividends leads to different
values of the ex-day price drop to dividend ratio (Elton & Gruber, 1970). However, Kalay
(1982a) propose the short-term trading theory with an argument that marginal investors on the
ex-day are tax-indifferent arbitragers, the gap between price drop and dividend amount is
caused by transaction costs (e.g. transaction fees, brokerage fees or commissions paid to
brokerage firms or other intermediaries). If the expected price drop is greater than the dividend
amount by more than transaction costs, investors tend to short-sell their stocks before the ex-
day and then buy them back to obtain a profit. By contrast, if the expected price drop is smaller
than dividend amount by more than transaction costs, investors are more likely to buy stocks
before the ex-day and sell them latter to gain a profit. As a result, the difference between the
price drop and dividend per share is explained by transaction costs. In addition, market
microstructure theories argue that the characteristics of institutional environment including limit
order adjustment (Dubofsky, 1992, 1997), bid-ask bounce (Frank & Jagannathan, 1998) and
price discreteness (Bali & Hite, 1998) are explanations of this anomaly. This study posits that
Vietnamese stock market is a promising laboratory to investigate the ex-day behavior of stock
price due to its special features: Firstly, the market uses periodic call auction mechanism for
determining both opening and closing prices and there is no market maker. Secondly, tick size
is much smaller than dividend amount. These imply that market micro-structure theories based
on ask-bid spread and tick size are not applicable explanations. Thirdly, unlike many markets’
taxation of capital gains and dividends, there is no considerably preferential treatment of capital
gains to dividends. Finally, short-selling is prohibited. After comparing the observed values of
price drop to dividend ratio and their expected values under the impact of tax policy suggested
by Elton and Gruber (1970), we find that tax treatment fails to explain the anomaly in the
research framework. As a result, dividend capture trading is applicable. The research findings
show that abnormal returns are significantly positive and negative in the pre and the post ex-
6
dividend day period respectively; in addition, abnormal trading volume are positive before and
after stocks go ex-dividend. Moreover, OLS regression analysis finds consistent evidence that
dividend yield and ex-day abnormal trading volume ex-day are negatively and positively related
to ex-day abnormal return respectively. These results imply that investors in Vietnamese stock
market is indifferent to the difference in tax treatment of capital gains to dividends, they try to
capture dividends if they find profit opportunities. Therefore, investors buy stocks on the cum-
dividend day and sell them on the ex-dividend to exploit profit opportunities created by
dividend payment.
The third essay examines the effects of shareholder rights and creditor rights on dividend policy
when agency costs of shareholders and creditors tend to increase. La Porta et al. (2000) initially
propose the two opposite models of dividend policy based on agency costs of equity (i.e. the
outcome model and the substitute model) and find supporting evidence of the outcome model
based on agency costs of shareholders. Brockman and Unlu (2009) extend this line of research
for agency costs of creditors and find that the substitute model based on agency costs of
creditors is empirically supported. This study uses the global financial crisis as an exogenous
shock to test the two agency models of dividends due to the following reasons: Firstly, under
the impact of a financial crisis, there is lower investment return in the market, hence insiders
experience lower marginal costs of expropriation of minority shareholders and agency costs of
equity tend to increase. Secondly, firms experiencing more external financial constraints are
less willing and able to build up a reputation of fair treatment of creditors. On the other hands,
firms are more likely to fail to meet creditors’ demand of dividend constraints due to their
willingness of earning a reputation of good business. Therefore, agency costs of debt also tend
to increase. These increases in both types of agency costs are a good opportunity to examine the
outcome model based on agency costs of equity and the substitute model based on agency costs
of debt. After firm characteristics including profitability, cash holdings, firm growth, debt ratio,
asset tangibility, firm size and maturity are controlled, we find that both the outcome model
based on agency costs of equity and the substitute model based on agency costs of debt are less
effective in the post-crisis period than in the pre-crisis period. Furthermore, the decline in the
effect of creditor rights (shareholder rights) on both the probability of paying dividends and
dividend payouts is larger in the group of stronger shareholder (creditor) protection. These
findings imply that when both types of agency costs: (1) both shareholders and creditors are
more expropriated; (2) the increase in the expropriation of creditors (shareholders) is higher if
shareholders (creditors) are protected strongly by law.
7
This PhD dissertation is organized in six chapters. Chapter 1 is the introduction of research
background and summary of the three essays on dividend policy. Chapter 2 is the literature
review presenting theories of dividend policy, theories of stock price behavior on the ex-
dividend day and arguments on the effect of shareholder rights and creditor rights on dividend
policy. Chapter 3 is the essay on a two-step approach to investigate dividend policy in
Vietnamese stock market. Chapter 4 is the essay on new evidence of dividend capture on the
ex-dividend day in Vietnamese stock market. Chapter 5 is the essay on the changes in the
effects of legal protection of shareholders and creditors on dividend policy across countries
before and after the global financial crisis. Chapter 6 is the conclusion.

8
9
Chapter 2: LITERATURE REVIEW
As one of the most important contents in corporate finance, dividend policy is studied intensely
by financial economists with different theoretical and empirical studies. This chapter includes
three main sections presenting theories of dividend policy, theories of stock price behavior on
the ex-dividend day and arguments on the effect of shareholder rights and creditor rights on
dividend policy and corporate governance in a financial crisis.
2.1. Theories of dividend policy
Miller and Modigliani (1961) posit that under perfect and complete capital markets, market
value of firms’ equity is irrelevant to its dividend policy. They propose a model in which
market value is determined by firms’ decisions on optimal investments. Net payouts (i.e.
dividends and equity issues) or share repurchases are a residual after firms using their earnings
for investments. Levels of dividends can take any value since the change in shares outstanding
caused by share issues can offset them. Therefore, market value is not affected by dividends at
all; it is only affected by investment decisions. However, in practice, capital markets are not
perfect and complete due to information asymmetry, agency problems, transaction costs, firm
maturity, catering incentives and taxes, hence dividend policy is a complicated decision-making
process. These market fictions are reflected in several theories of dividend policy such as
signaling theory, agency theory, transaction cost theory, residual theory, pecking order theory,
life cycle theory, catering theory and tax clientele theory.
2.1.1. Signaling theory
Main arguments
The signaling theory of dividends policy is developed in the late 1970s with the key argument
that there is asymmetric information between firms’ managers and outside investors. Managers
can have more information about firms’ expected profitability which investors cannot observe.
Therefore, dividend policy is employed as a signal of the firm’s forecasted profitability.
Heinkel (1978) initially proposes an asymmetric information model stating that firm value is a
function of cash dividend. The model is based on two assumptions: (1) The number of firms
with high expected profitability is limited and (2) The volatility of firm value is negatively
related to the expected profitability. Under the asymmetric information framework, cash
dividends imply firms’ expected cash flows; hence, firms with higher dividends are considered
10
to have better performance than those with lower ones. Investors use these signals to make their
investment decisions and value firms’ stocks.
Bhattacharya (1979) develops this line of research with a two-period model where there is no
agency problem between managers and shareholders. At the beginning of the first period,
managers decide to invest in a business opportunity and they have full information on the
expected profitability which is unknown to outside investors. At this moment, managers also
promise to pay investors a certain amount of dividend. At the end of the first period, if the
payoff created by the investment is less than the committed dividend amount, firms need
external funds for the second period and incur transaction costs. Therefore, managers can signal
investors in stock markets on the quality of the business opportunity by paying large dividend
amount for the first period and the firm can avoid transaction costs arising from external
financing. From this model, Bhattacharya (1979) posit that firms decide to pay cash dividends
as a signal to outsiders regardless of the tax disadvantage for dividend.
John and Williams (1985) and Miller and Rock (1985) support the dividend signaling theory;
however, they explain the theory with different arguments. John and Williams (1985) claim that
information revealed by corporate audits about future performance is unreliable since they fail
to illustrate firms’ future profitable investment opportunities completely. Given imperfect
information on firms’ expected profitability, firms can communicate perfectly with outside
investors only by paying cash dividends or issuing new shares. When private information about
firms’ future profits is favorable, a dilution of proportional ownership is not beneficial to
current stockholders. As a result, insiders acting for existing stockholders’ benefit may choose
to distribute dividends instead of selling new shares. Outside investors are convinced by these
signals and offer higher prices for firms’ stocks. In this case, although there is a higher tax rate
on dividends than on capital gains, tax disadvantages for dividends are compensated by
increases in stock prices while insiders maintain their fractional ownership. Using a two period
model, Miller and Rock (1985) posit that cash dividends contain information about expected
profits; however, they communicate with outsiders indirectly and need not reflect intentional
policy of firms’ managers to convey the information about future performance. At the
beginning of the first period, managers invest in a business project of which expected
profitability are not observed by outside investors. At the end of this period, the project
generates earnings which are allocated for both dividend payment and investment for the
second period. Investors cannot have information on both earnings and future investment. At
the end of the second period, the project generates earnings again. Therefore, dividend
11
declarations only supply investors with the missing information about corporations’ current
profits. Then, these profits are used to forecast future earnings.
Ambarish, John, and Williams (1987) criticize the signaling equilibrium model of John and
Williams (1985) and develop an efficient model presenting the relationship between dividend
payment, investment, and new share issuances. They argue that in the previous models an
efficient signaling equilibrium maximizes stockholders’ wealth among all possible respective
equilibria because firms have different marginal benefits of avoiding ownership dilution. The
new model states that managers can communicate with outsiders through two types of
combination: The first is dividend payment and disclosed investment; the second is dividend
payment and new stock issuance. Analyzing this model, Ambarish et al. (1987) generate two
main properties. The former is that for firms distributing cash dividends there is a positive
relationship between dividend declaration and stock price if there is fixed investment. The latter
is if firms pay fixed dividends, the effect of declaration of investment or net new shares is
negative for those with superior information arising mainly from assets in place and positive for
those with superior information chiefly from investment opportunities.
Furthermore, Bar-Yosef and Huffman (1986) develop an incentive-signaling model with the
assumption that firms’ owners have managerial reward-penalty scheme to ensure accurate
signals from managers’ announcements. They claim that under the optimal equilibrium of
dividend policy the dividend payout is an increasing function of future cash flow.
Stulz (1990) examines financing policies of firms with atomistic stockholders and claims that
the predictability of dividends about expected cash flows is higher for underinvesting and
overinvesting firms than for those with maximized value. This argument is supported by the
empirical study of Koch and Shenoy (1999). In consistence with Stulz’s argument, their
findings show a distinct U-shaped association between Tobin's q and the predictability of
information conveyed by dividends.
In addition, Rozeff (1982) and Eades (1982) propose cash dividends as a signal of the
uncertainty of expected cash flows with the implication that firms with higher variability of
cash flows have more difficulties in financing future business activities. Bar-Yosef and
Huffman (1986) argue that considerable variations of dividend payout ratios across industries
are explained by differences of industry risk exposure. They develop a model stating that the
dividend payout ratio is a function of the volatility of cash flow and find that there is a negative
relationship between the dividend payout ratio and the risk level of cash flows.
12
While previous studies examine the impact of unsystematic risk of cash flows on dividend
policy, Kale and Noe (1990) suggest a model where dividends are consider as a signal of both
systematic and unsystematic uncertainty of firm cash flows. This model supports the dividend
signaling theory with the unsystematic risk and implies that cash dividend levels have a
negative association with the market risk of cash flows.
Empirical studies
There are several empirical studies with various research methods supporting the dividend
signaling theory in different countries. H. Kent Baker, Farrelly, and Edelman (1985) use mail
questionnaires addressed to chief financial officers of 562 corporations listed in NYSE during
the period from February to April 1983 to collect information about dividend policy. Their
findings show that respondents seem to agree on the signaling mechanism of dividend and
investors use dividend declaration to value firms’ securities. H. Kent Baker and Powell (1999),
H. Kent Baker and Powell (2000) survey listed firms in NYSE in 1997 with various dividend
hypotheses and compare the results with those of the survey in 1983. They conclude that
current and forecasted earnings are one in two the most important determinants of firms’
dividend policy and they have highly similar explanatory power in the two studies conducted in
1983 and 1997. In addition, H. Kent Baker, Powell, and Veit (2001) conduct a survey with a
sample of 188 managers of firms listed in NASDAQ and find that the factors which are
significant with NYSE-listed firms are also significant to NASDAQ-listed firms. Similar
findings with the survey method are released in Australia (Partington, 1989), Norway (H. Kent
Baker, Mukherjee, & Paskelian, 2006), France (Albouy, Bah, Bonnet, & Thévenin, 2012),
Canada (H. K. Baker, Saadi, Dutta, & Gandhi, 2007), and 16 European countries (Bancel,
Bhattacharyya, Mittoo, & Baker, 2009).
Moreover, the dividend signaling mechanism is found significant in many empirical studies
with statistical methods. Examining the impact of dividend policy on shareholders’ wealth with
a sample of 168 firms paying dividends for the first time or after 10-year hiatus in USA,
Asquith and Mullins Jr (1983) assert that dividends are more attractive than other accounting
data in transmitting information with two main characteristics. Firstly, dividends are a simple
and comprehensive signal for managers to convey firms’ current and expected performance.
Secondly, dividend announcements are supported by cash; thus, dividends are clearly more
visible than other announcements. Healy and Palepu (1988) use a sample of 131 US firms
including 37 firms those are removed from Asquith and Mullins’ sample to test the information
contents of dividend policy changes about future prospects. Their findings are consistent with
13
the signaling explanation of dividends. Adjaoud (1984), Ahmed and Javid (2009); Raaballe and
Hedensted (2008) find supporting empirical evidence for the signaling hypothesis in Canada,
Denmark and Pakistan respectively.
However, there are empirical studies stating that managers do not communicate with the market
through dividends. Watts (1973) investigates the hypothesis that current and past cash
dividends are stronger estimates of future earnings than current and past earnings with a sample
of 310 U.S firms and concludes that the information conveyed by dividends is insignificant.
Gonedes (1978) argues that dividend signals do not represent any special information of
managers about forecasted distributions of earnings. Moreover, DeAngelo, DeAngelo, and
Skinner (1996) also find no supporting evidence for the dividend signaling hypothesis with two
explanations. Firstly, managers tend to overestimate future earnings because they are
overoptimistic. Secondly, managers tend to make limited cash commitments when they raise
dividends.
Furthermore, Benartzi, Michaely, and Thaler (1997) find that an increase in dividends leads to a
positive abnormal and a decrease in dividends causes an negative abnormal return at the time of
dividend announcement. However, examining returns of firms changing dividends for the next
three years, they also discover that there are insignificant abnormal returns for firms cutting
dividends while firms with dividend increases have significant positive excess abnormal
returns. These results indicate that even if firms convey signals to the market, these signals are
not about firms expected performance and the market fail to perceive them. Besides, Grullon et
al. (2002) find that an increase in dividends leads to a decrease in future profits and Brav,
Graham, Harvey, and Michaely (2005) use survey results to reject the hypothesis on
information content of dividends. In addition, there are empirical findings showing no
supporting evidence for the dividend signaling mechanism in others countries. Daunfeldt,
Selander, & Wikström’s study (2009) based on the data of Swedish listed companies from 1991
to 1995 reveals that the cash dividend yield is negatively related to the market to book value.
They explain that companies with more favorable prospects should save cash to finance future
business investments and exploit growth prospects. However, their findings are inconsistent
with the signaling hypothesis. J. Chen and Dhiensiri (2009) analyzing determinants of dividend
policies with a sample of 76 firms listed in New Zealand Stock Exchange between 1991 and
1999 show no evidence to support the signaling theory. Recently, Al Shabibi and Ramesh
(2011) use a sample of 120 non-financial listed corporations in United Kingdom to test
dividend theories including signaling one. The result shows a rather strong association between
14
corporations’ cash dividends and business risk. They claim that managers of firms with higher
level of risk tend to communicate stability to outside investors; hence, insiders decide to
distribute dividends.
2.1.2. Agency theory
Main arguments
Agency theory is initially developed by Berle and Means (1932) to describe the impact of the
gap between ownership and control on modern companies. Agency relationship is defined as an
agreement under which agents perform some service on behalf of principals who delegate
decision-making authority agents (M. C. Jensen & Meckling, 1976). Agency problems arise
from the information asymmetry between agents and principals. Although agents are not
owners of resources, they can manage and control resources. Therefore, agents tend to make
business decisions on their own interest instead of maximizing principals’ wealth. According to
M. C. Jensen and Meckling (1976), there are two types of agency problems: (1) The conflict of
interest between mangers and shareholders; (2) The conflict of interest between shareholders
and bondholders.
The extant literature shows that the conflict of interest between managers and shareholders
leads to agency costs borne by the two parties. According to M. C. Jensen and Meckling (1976)
agency costs include monitoring costs, bonding costs and residual loss. Firstly, monitoring costs
are incurred by principals to reduce managers’ activities which benefit themselves instead of
shareholders. Secondly, bonding costs are incurred by managers to guarantee that they will not
conduct behaviors which harm shareholders’ welfare. Finally, residual loss represents the
divergence between managers’ decisions and those maximizing shareholders’ wealth.
Easterbrook (1984) argues that in addition to monitoring costs, agency costs arise from the risk
aversion problem. Shareholders can eliminate non-systematic risk with diversified portfolios
and expect managers to make business decisions as risk preferrers at the expense of
bondholders. However, managers’ personal interest is significantly connected to their firms.
When firms have lower profitability or go bankrupt, managers will lose their jobs and relevant
benefits. Therefore, managers tend to be risk-averse and conduct low-risk projects which have
lower returns than riskier ones. Furthermore, M. C. Jensen (1986); Rozeff (1982) posit that
excessive funds which are available to managers are another source of agency costs. If firms’
cash flow exceeds that required to finance profitable business projects, corporate managers are
motivated to invest in negative net present value projects.
15
In the presence of agency problems between mangers and firm owners, dividend payment is a
device to mitigate agency problems and reduce agency costs. According to Easterbrook (1984),
both monitoring costs and costs arising from managers’ risk-aversion become less serious with
firms paying cash dividend to shareholders. When firms issues new shares or debt securities to
finance business opportunities, their affairs are monitored by investment banks, outside
investors and other monitoring institutions in the market. In addition, issuing firms can adjust
leverage level so that shareholders cannot exploit bondholders’ welfare. M. C. Jensen (1986);
Rozeff (1982) propose the free cash flow hypothesis which states that firms pay cash dividend
is to decrease free cash flows of which managers can take advantage to fund unprofitable
projects. Furthermore, Gugler (2003) argues that there is a “double principal-agent problem” in
state-controlled firms whose ultimate owners are citizens. Managers are delegated to manage
state-controlled firms by elected politicians who may not have active monitoring activities.
Thus, state-owned firms experiencing more serious agency problems tend to pay more
dividends to decrease agency costs. In contrast, family-controlled firms have lower dividend
payout ratios because they have less need to control managers.
In addition, the conflict of interest between shareholders and bondholders is also relevant to
dividend policy. M. C. Jensen and Meckling (1976); Myers (1977) posit that in some cases,
shareholders try to expropriate bondholders in the form of excessive dividends. Firms pay more
dividends by reducing funds allocated for business investments or raising debt to finance their
dividend payment. These actions transfer wealth from bondholders to shareholders but they are
not anticipated by bondholders. Since dividend payment increases the agency costs of debt,
both equity and debt claimants may have an agreement on limiting dividends. Most bond
covenants are structured to constrain both investment-financed and debt-financed dividends.
Empirical studies
Empirical studies yield mixed results in the impact of free cash flows on dividend policy.
Holder, Langrehr, and Hexter (1998) initially use free cash flow to investigate the impact of
agency problems on dividend decisions. With the sample of 477 US listed firms during the
period from 1983 to 1990, they find strong supporting evidence for the free cash flow
hypothesis which implies that firms with more free cash flows have higher dividend payout
ratios to reduce agency conflicts. Adjaoud and Ben-Amar (2010) also find that free cash flows
are positively correlated with dividend payment in Canadian stock market. Recently, the
positive relationship between free cash flows and dividend policy is found in Ghana (Amidu &
Abor, 2006) and Thailand (Thanatawee, 2011). However, examining effects of agency cost of
16
free cash flows on dividend policy with a sample of 26 firms listed in Indonesia from 1994 to
2007, Utami and Inanga (2011) find no significant evidence to support the free cash flow
hypothesis. Al-Najjar and Hussainey (2009) show that levels of free cash flows are negatively
related to dividend distribution but this relationship is not significant in UK stock market.
Moreover, several empirical studies investigating the relationship between corporate
governance as a proxy of agency problems and dividend decisions show various findings.
Rozeff (1982) argues that corporate governance is a device to reduce agency cost; therefore,
firms with stronger corporate governance do not need to use dividend payment to mitigate
agency cost. Using a sample of 1000 listed firms in US from 1974 to 1980 with two variables
including insider ownership and dispersion of ownership to measure agency problems between
managers and shareholders, Rozeff (1982) finds that the former and the latter are negatively and
positively associated with dividend payout ratios respectively. In line with Rozeff’s results,
Holder et al. (1998) find that both insider ownership and concentration of ownership have
significantly negative effect on dividend payout policy in US market. Alli, Khan, and Ramirez
(1993) and Al-Malkawi (2007) test the agency cost theory of dividends with 150 listed firms in
US and 160 firms listed in Jordan respectively. Their research results show that insider
ownership has negative relationship with dividend decisions but there is no significant
relationship between spread of ownership and dividend policy. However, using governance data
of The Institutional Shareholder Services with 4,771 firm-year observations of dividend paying
firms in US stock markets from 2001 to 2004, Pornsit Jiraporn (2006) find that strength of
corporate governance is positively related to dividend policy. In addition, Bebczuk (2005);
Kowalewski, Stetsyuk, and Talavera (2007) employ Transparency and Disclosure Index as a
proxy for agency conflicts and conclude that there is a positive association between
Transparency and Disclosure Index and dividend payout policy in Argentina and Poland
respectively. This implies that firms with stronger corporate governance pay more cash
dividends. Moreover, testing the impact of corporate governance on dividend policy in
Canadian market from 2002 to 2012 with 714 firm-year observations, Adjaoud and Ben-Amar
(2010) find that Corporate Governance Score is positively related to dividend payout ratio. Al
Shabibi and Ramesh (2011) hypothesize that board size, board independence and audit
reputation have positive effect on dividend per share when they conduct an empirical research
on determinants of dividend policy in UK. Nevertheless, their results show supporting evidence
for board independence and no significant evidence for board size and audit reputation. The
positive relationship between board independence and dividends are found significant in US
17
(Kaplan & Reishus, 1990; Schellenger, Wood, & Tashakori, 1989) but insignificant in Australia
(Cotter & Silvester, 2003). Besides, investigating the relationship between ownership structure
and dividend policy of Austrian firms over the period from 1991 to 1999, Gugler (2003)
concludes that state ownership is positively related to dividends. This result is supported by
studies in China (Wei, Zhang, & Xiao, 2004) and Jordan (Al-Malkawi, 2007).
Besides, Ang, Cole, and Lin (2000) use a zero agency-cost firm as a base case to measure both
absolute and relative agency costs of equity under various ownership and management
structures. With a sample of 1,708 small firms from the data of the Federal Reserve Board
released its National Survey of Small Business Finances in 1997, they find that agency costs of
equity are higher with managers who are outsiders than insider managers, negatively related to
the managers’ ownership, positively related to the number of non-manager shareholders and
lower with greater bank monitoring.
Furthermore, the agency costs of debt are tested empirically in many studies and the results are
also mixed. Handjinicolaou and Kalay (1984) investigate the impact of dividend change
information on both bond prices and equity prices. Using a research sample with 255 straight
bonds randomly selected from the NYSE and 1,967 dividend announcements over the period
1975 – 1976, they find that bond prices fall significantly with dividend decrease announcements
and remain significantly constant with dividend increase announcements. These findings are not
consistent with the shareholder - bondholder agency hypothesis and support the information
content of dividends. Kalay (1982a) examines the constraints of dividends under the impact of
bond covenants between shareholders and bondholders and also find no supporting evidence for
the wealth transfer hypothesis. With the data of debt indentures of 150 firms randomly selected
from Moody’s Industrial Mutual, their results show that firms hold considerably more cash or
cash equivalents than the lowest cash level which is in accordance with the bond covenants. In
addition, Nash, Netter, and Poulsen (2003) investigate the costs and benefits of bond covenants
for bonds issued in 1989 and 1996 and find that firms with high firm growth tend to preserve
flexibility in their future financing options by ignoring dividend or debt issuance constraints in
their bond contracts. These also imply that contractual relations between shareholders and
bondholders represent the specific needs of the both parties. However, Anderson, Mansi, and
Reeb (2003) find supporting evidence for the shareholder - bondholder agency hypothesis when
investigating the relationship between founding family ownership structure and the agency cost
of debt. Their research results show that founding family ownership is common in publicly
traded and large firms and these characteristics help firms incur both statistically and
18
economically lower cost of debt financing. This is consistent with the wealth transfer
hypothesis that these firms have incentive structures leading less severe agency conflicts
between shareholders and creditors.
2.1.3. Transaction cost theory, residual theory and pecking order theory
Main arguments
Three theories of dividend including transaction cost theory, residual theory and pecking order
theory describe firms’ decisions on investment and financing activities which affect dividend
policy. Firstly, according to transaction cost theory, transaction costs are incurred by firms and
investors when firms have to resort to raising external funds due to dividend payment (Manos,
2001). Dhrymes and Kurz (1967); Meyer and Kuh (1957) posit that financing business
activities with internal funds are cheaper than issuing new securities. If transaction costs are
significant, firms tend to retain more earnings to finance investment opportunities. Firms paying
more dividends have to incur higher transaction costs of external financing (Higgins, 1972;
Rozeff, 1982). Secondly, residual theory asserts that firms only pay dividends after financing all
available investment opportunities (Weston & Brigham, 1979). According to Higgins (1972),
dividends should be considered as a residual because investments maximize owners’ wealth in
an environment of differential taxes and significant transaction costs. This indicates that firms
with abundant positive net present value projects have high intention rates (Ghosh &
Woolridge, 1989). Thirdly, pecking order theory also postulates that firms prefer to finance
dividends and investment by internal equity to external funds. Even if external financing is
necessary, firms prefer debt to new share issues. Donaldson (1961) explains these preferences
by significant flotation costs. However, Stewart C. Myers and Nicholas S. Majluf (1984) argue
that the net benefits of raising funds from debt in terms of tax shield and financial distress may
exceed flotation costs. Firms prefer internal equity since they want to maximize the wealth of
shareholders. Stewart C. Myers and Nicolas S. Majluf (1984) propose a model describing
managers’ decisions on investment and financing activities when they have superior
information about their firms’ current investment and future business opportunities. They
recognize two properties relating to cash dividends: On the one hand, firms should not
distribute dividends if they have to recover cash through issuing new shares or other risky
securities although dividends are signals to the financial market. On the other hand, limiting
dividends is one way to create financial slack and cash can be saved as tradable securities or
reserve power.
19
Empirical studies
In prior studies investment opportunities, firm leverage and firm size are commonly used to test
the above-mentioned theories of dividend. There are several studies supporting the negative
relationship between investment opportunities and dividend decisions. Higgins (1972) uses
cross-section tests for the data including from 117 to 123 US firms in the years of 1961, 1963
and 1965 to investigate the impact of investment on dividends and finds that firms with higher
investment opportunities pay less dividends. In addition, with the sample of 1000 US firms
listed over the period from 1974 to 1981, Rozeff’s research (1982) shows supporting evidence
for the three theories of dividend. This is consistent with several findings from studies
conducted in US (Alli et al., 1993; Chang & Rhee, 1990; Holder et al., 1998; P. Jiraporn, Kim,
& Kim, 2011), Canada (H. K. Baker et al., 2007) and Ghana (Amidu & Abor, 2006). In
addition, investigate the effects of firm characteristics and propensity to pay on disappearing
dividends in the U.S. market from 1978 to 1999 Eugene F. Fama and French (2001) find that
this phenomenon is partly due to firm characteristics. Firms which have never paid dividends
experience the best growth opportunities with much higher asset growth and market-to-book
ratio. Denis and Osobov (2008) examine determinants of dividend policy with a sample of
firms listed in US, Canada, UK, Germany, France, and Japan over the period from 1994 to 2002
and find consistent results for investment opportunities. Moreover, Thanatawee (2011) tests the
effect of investment requirements on dividend policy of 416 non-financial firms between 2002
and 2008 in Thai market with two variables for investment opportunities, namely total assets
growth and market to book value ratio. The findings indicate that the latter is negatively
associated with dividend policy while the former has insignificant correlation with dividend
policy. Nevertheless, there are researches illustrating no significant relationship between
investment and dividend decisions. Al-Najjar and Hussainey (2009); Al Shabibi and Ramesh
(2011) find no evidence to support the three theories in UK stock markets. Similar findings are
found in Canada (Adjaoud & Ben-Amar, 2010), Indonesia (Utami & Inanga, 2011) and Jordan
(Al-Malkawi, 2007).
Moreover, transaction cost theory, residual theory and pecking order theory argue that firms
prefer internal financing with earnings to external financing which consists of debt and new
share issues. Besides, debt and dividend payment are means to reduce agency costs between
mangers and shareholders (Al-Najjar & Hussainey, 2009). These arguments imply that firms
with higher leverage have lower dividend payout ratios. Empirical evidence on the negative
relationship between debt level and dividends are found in both developed and emerging
20
markets (Aivazian, Booth, & Cleary, 2003; Al-Malkawi, 2007; G. R. Jensen, Solberg, & Zorn,
1992; Kowalewski et al., 2007; Thanatawee, 2011). However, Chang and Rhee (1990); Utami
and Inanga (2011) and P. Jiraporn et al. (2011) prove the opposite empirical result which
describes the positive impact of firm leverage on dividend payment. This positive impact can be
explained by signaling theory which indicates that financing dividends by debt is a signal for
high levels of future earnings (Al-Najjar & Hussainey, 2009). On the other hand, there are
researches illustrating no significant correlation between debt ratio and dividend payout ratio
(Adjaoud & Ben-Amar, 2010; Al-Najjar & Hussainey, 2009; Al Shabibi & Ramesh, 2011;
Bebczuk, 2005).
According to Chang and Rhee (1990); Holder et al. (1998), large and well-established firms
have easier access to capital markets. This implies that large-sized firms can raise funds to
finance business activities from the public with more flexibility and lower costs while small
firms mainly depend on debts to finance both investment and dividends. Hence, larger firms
tend to pay higher dividends to shareholders. Empirical evidence on the positive relationship
between firm size and dividend policy are showed in many stock markets in US (Chang &
Rhee, 1990), UK (Al-Najjar & Hussainey, 2009; Al Shabibi & Ramesh, 2011), Canada
(Adjaoud & Ben-Amar, 2010), Poland (Kowalewski et al., 2007), Thailand (Thanatawee,
2011), Jordan (Al-Malkawi, 2007), and Bangladesh (Mollah, 2001). However, Aivazian et al.
(2003) find little support for the impact of firm size on dividends when investigating dividend
policies in US and emerging markets including Korea, India, Malaysia, Thailand, Zimbabwe,
Jordan, Pakistan and Turkey. Bebczuk (2005) and Utami and Inanga (2011) assert that there is
no significant association between firm size and dividend payment in Argentina and Indonesia
respectively.
2.1.4. Life cycle theory
Main arguments
Eugene F. Fama and French (2001) examining determinants of dividend disappearing in the US
market and find an interesting phenomenon that firms with high current profitability and low
firm growth are more likely to pay dividends while firms with low profitability high growth
tend to retain more earnings. Then, Grullon et al. (2002) investigate 7,642 dividend change
announcements in US stock markets from 1967 to1993 find two remarkable results. Firstly,
after an increase in dividend there is a decrease instead of an increase in firm profitability. This
rejects the argument of signaling theory. Secondly, dividend-increasing firms experience
decreases in systematic risk which leads to a decline in cost of capital. Grullon et al. (2002)
21
assert that both theory of dividend smoothing proposed by Lintner (1956) and free cash flow
hypothesis suggested by M. C. Jensen (1986) cannot explain the two findings completely and
develop an alternate theory. They explain these phenomena with a life cycle argument as
follows: Firms have more profitable projects in the growth phase; therefore, they have high
levels of economic profits, capital expenditure, growth in retained earnings and low levels of
free cash flows. If firms’ growth is maintained, there are more competitors entering the
industry. Hence, existing firms have less positive net present value projects, capital
expenditures and more free cash flows. Moreover, due to fewer growth options, assets become
more important to determine firm value and systematic risk is reduced.
The life cycle theory of dividends posit that mature and established firms tend to pay more
dividends due to fewer investment opportunities and abundant resources while young firms
with limited resources tend to retain more earnings to finance abundant investment projects.
Life cycle explanations are implicitly or explicitly based on the trade-off between the costs
(e.g., flotation costs) and the benefits of dividend payment (e.g., reducing agency costs of free
cash flow). When firms are more mature, more profits are accumulated and investment
opportunities decline. Accordingly, the benefits of dividend distribution tend to exceed the costs
of dividend payment and firms pay more dividends (DeAngelo & DeAngelo, 2006; Grullon et
al., 2002).
Empirical studies
DeAngelo, DeAngelo, and Stulz (2006) use the earned/contributed capital mix which are
measured by retained earnings to total equity or retained earnings to total assets as a proxy for
firm maturity to test life cycle hypothesis in US markets from 1973 to 2002. Their findings
show that firms with higher earned/contributed capital mix have higher probability to pay
dividends. The positive relationship between maturity of firm and the probability of dividend
payment is a supporting evidence for life cycle hypothesis. Furthermore, Denis and Osobov
(2008) investigate the predictability of firm maturity on the propensity to pay dividend in six
developed countries, namely US, Canada, UK, Germany, France, and Japan over the period
from 1989 to 2002. Their results illustrate that firms with greater proportion of retained
earnings to total equity are more likely to pay dividends. Brockman and Unlu (2009) also find
that retained earnings scaled by the book value of assets ratio is positively related to both the
likelihood of paying dividends and dividend payout ratio across 52 countries with 120,507 firm-
year observations.
22
2.1.5. Catering theory
Main arguments
Catering theory of dividends is initially developed by M. Baker and Wurgler (2004b). The
essence of this theory is that managers follow investor demand. They propose a view of
dividend policy based on loosening the assumption of market efficiency in the dividend
irrelevance proposition. They argue that the demand of investors stocks paying dividends varies
over time; therefore, the relative prices of dividend payers and non-payers fluctuate.
Consequently, managers tend to satisfy investor demand for dividends by initiating dividends
when investors give a relatively high stock price on dividend-paying stocks and omitting
dividends when investors prefer non-paying stocks.
Li and Lie (2006) criticize the study of M. Baker and Wurgler (2004b) on its explanation
ability. They argue that Baker and Wurgler's model only explains dividend initiations or
omissions, it cannot explain dividend changes. There empirical model is decrete with only two
groups of firms including dividend payers and non-payers. In practice, managers make
decisions related to changes in dividend payouts which are more informative than dividend
initiations or omissions. Therefore, they extend the caterting theory with continous dividend
levels and suggest that firms should be classified only by their decisions of paying or not paying
but also their dividend levels. Accordingly, catering implies that mangers change dividend
policy to satisfy investor demand.
Empirical studies
M. Baker and Wurgler (2004b) proposed a discrete model to test the catering theory of
dividends. They investigate the effect of the current dividend premium on the rates of firms
initiating and omitting dividends in the US market over the period from 1963 to 2000. Dividend
premium is defined as the difference between the current share prices of paying firms and non-
paying firms. Using four different stock price-based measures for the dividend premium, they
find that the total initiation rate has a significantly positive relationship with all of their proxies.
Furthermore, they find that the rate of omission has a significantly negative relationship with
two out of four dividend premium proxies. However, they conclude that catering effects are the
most natural explanations after reviewing alternative hypotheses.
In addition, M. Baker and Wurgler (2004a) examine the relationship between the propensity of
paying dividends and catering incentives. Firstly, they use Fama and French’s methodology
(2001) to recognize four distinct trends in the propensity of paying dividends from 1963 to
23
2000 and find that there are two appearances and two disappearances over the period. Secondly,
they report that each of these trends is related to a corresponding change in catering incentives
when dividend premium variable is measured in line with M. Baker and Wurgler (2004b).
Li and Lie (2006) argue that the empirical study conducted by M. Baker and Wurgler (2004b)
contains two drawbacks. Firstly, their discrete model cannot explain the catering effects on
dividend levels. Secondly, their empirical findings show no supporting evidence for the catering
theory with a statistically insignificant relationship between dividend announcement returns and
dividend premium. Therefore, they extend the dividend catering model with continuous
dividend levels. Using a research sample of 20,779 dividend announcements (1,815 decreases
and 18,964 increases) over the period from 1963 to 2000, they find that both the likelihood of
decreases and increases in dividends and the amount of the dividend changes are associated
with the dividend premium. Particularly, the likelihood of dividend decreases is higher for the
group of low dividend premium and the probability of dividend increases is higher for the
group of high dividend premium. In addition, dividends decrease with higher rates if the
dividend premium is low and increase with higher rates if the dividend premium is high. They
also find supporting evidence for the catering theory with a significantly negative relationship
between the announcement returns arising from dividend decreases and the dividend premium
and a significantly positive relationship between the announcement returns arising from
dividends increases and the dividend premium.
Although the catering theory of dividends is supported empirically in the US market, the
evidence of dividend catering is mixed across countries. Stephen P. Ferris, Nilanjan Sen, and
Ho Pei Yui (2006) examine whether the dividend disappearing is the United Kingdom which
has a comparable capital market to that of the United States in terms of maturity and
sophistication. They find that the number of payers also falls from 75.9% to 54.5% over the
period from 1988 through 2002. After firm size and profitability are controlled, their results
show a decline in the propensity of paying dividends over the sub-period 1998 - 2002.
Interestingly, a shift in catering incentives is considered most likely explanations for the
changes in dividend policy in the UK market from 1998 to 2002. However, von Eije and
Megginson (2008) investigate cash dividends and share repurchases of firms listed from 1989
to 2005 in the 15 EU members and find that there is no systematic impacts of a country-specific
catering variable on dividend policy in EU companies. This implies that catering fail to play an
important role in European dividend policy. With a sample of firms listed in six developed
markets including US, Canada, UK, Germany, France, and Japan from 1989 to 2002, Denis and
24
Osobov (2008) also report no supporting evidence for the dividend incentives. They find that
unexpected reductions in the paying proportion are determined by newly listed firms which
have low proportions of dividend initiations. Moreover, Ferris, Jayaraman, and Sabherwal
(2009) attempt a more ambitious research on international catering incentives with a large
dataset of 24,298 firm-year observations collected from 23 countries including both common
law and civil law systems between 1995 and 2004. They only find supporting evidence of
catering incentives for the sub-sample of common law countries but not fot the group of civil
law countries. Even when the effect of firm life cycle is controlled, catering incentives remain
persistent. They explain that stockholders of firms incorporated in common law countries
experience a wider range of rights and protections, thus they are more able to discipline
managers who cannot cater to investor demand.
2.1.6. Tax clientele theory
Main arguments
Taxes are another market friction making dividend policy relevant to market value. Tax
clientele theory is developed in 1970s with an pioneer after-tax capital assets pricing model
proposed by Brennan (1970). This model is extented with the elimination of some assumptions
by Litzenberger and Ramaswamy (1979). These two after-tax capital assets pricing models
show that after-tax expected returns rely on both dividend yield and systematic risk and the
benefits investors obtain from diivdends are not optimal due to tax-related reasons. The income
tax rate imposed on dividends is commonly higher than that imposed on long-term capital
gains. This favorable treatment of capital gains to dividends makes investors prefer a low
dividend payout to a high dividend payout. Therefore, if firms want to maximize their
shareholders’ wealth, they should minimize their dividends.
Black and Scholes (1974) argue that the effect of taxes is not uniform for all investors since
different groups of investors experience different tax treatment of dividends over capital gains.
Therefore, investors have various preferences of dividends to retained earnings: Investors for
whom dividends are taxed at lower effective brackets than captital gains prefer dividends,
investors whose dividends are tax disadvataged tend to prefer retained earnings and for whom
taxes on dividends and capital gains are effectively equal are indifferent to them.
Empirical studies
Empirical studies show a mixture of relationship between taxes and dividends. Pettit (1977)
investigates the impacts of transaction costs and taxes on individual investors’ portfolios with
25
actual portfolio positions and demographic information and finds supporting evidence of tax
clientele effects. The research results show that investors charged with low tax rates and
investors with considerable gaps between the tax rates imposed on their ordinary income and
capital gains prefer to keep high dividend yield stocks. Litzenberger and Ramaswamy (1979)
test the extended after-tax capital assets pricing model for NYSE stocks over the period from
January 1936 to December 1977 and find supporting evidence of tax clientele hypothesis. In
addition, Poterba and Summers (1984) employ British data to investigate the effects of tax
policy on investors' comparative valuation of dividends and capital gain between 1955 and
1981. This research period offers a promising opportunity to test the tax clientele theory since it
experiences two radical changes and many minor reforms in dividend tax policy. Using daily
data on a limited sample and monthly data on a broad sample, they find empirical evidence of
tax clientele hypothesis with a significant impact of taxes on the equilibrium relationship
between market return rates and dividend yields.
However, Lewellen, Stanley, Lease, and Schlarbaum (1978) using the same database as Pettit
Pettit (1977) show only a weak effect of maginal tax rates on dividend yields of investors’
portfolios. In addition, Black and Scholes (1974) applying the best available empirical methods
fail to find supporting evidence of the tax clientele theory. Their research findings show that the
differences between the expected return rates on high yield common shares and on low yield
common shares are not significant both before and after taxes. An investor who is taxable
(exempt from taxes) focusing on his portfolio in low (high) yield shares cannot know whether
his expected after-tax returns will increase or decrease. Miller and Scholes (1982) continue to
test the whether investors for whom the taxes on dividend payments are the heavier than those
on long-term capital receive higher risk-adjusted returns with higher dividend yields. Utilizing
short-run measures of dividend yield to deduce the dividend tax treatment from differences in
return rates of non-paying shares, they find no empirical support for the theory.
There are other studies examining the relationship between tax policy and dividend policy with
changes in tax regimes including Tax Reform Act of 1986 in the United States and Canadian
Tax Reform. These changes supply natural experiments to test the tax clientele hypothesis.
However, they also find mixed results for the effect of taxes on dividend policy (Bolster &
Janjigian, 1991; Casey & Dickens, 2000; Means, Charoenwong, & Kang, 1992; Papaioannou &
Savarese, 1994; Saadi & Chkir, 2008).
The above-mentioned theories of dividend policy provide a wide range of explanations of
corporate dividend decisions in both developed and emerging stock markets. The first essay
26
posits that Vietnamese stock market is a good environment to investigate of dividend policy.
Firstly, in a newly established stock market, legal regulations and shareholders’ experience to
control expropriation by insiders may be less effective, thus the agency problem tend to be
more severe. Secondly, short booming and crashing periods in the market lead to fluctuations in
both transaction costs of external financing and the need to use dividends as a signal to outside
investors. Thirdly, about 30% listed firms are state-controlled firms which may experience
“double principal-agent problem” or tend to pay more cash dividends to finance other state-
owned projects. As a result, these characteristics are promising to test agency theory,
transaction cost theory and the signaling theory. Moreover, we argue that dividend policy
includes two steps: the first is to pay or not to pay; the second is how much should be paid.
Therefore, we use the two-step approach to examine dividend policy with Heckman two-step
model which can eliminate the problem of selection bias. Due to the availability of information
in Vietnamese stock market, we cannot mention the catering theory in this study.
2.2. Theories of stock price behavior on the ex-dividend day
According to Miller and Modigliani (1961), in an ideal environment dividend policy is not
significantly related to both firm market value and shareholder wealth. Therefore, stock prices
should fall precisely by dividend magnitude on the ex-dividend day. However, many theoretical
and empirical studies show that the price drop on the ex-dividend day is not equal to dividend
amount due to various reasons including tax clientele effects, short-term trading activities and
market microstructure.
2.2.1. Tax clientele theory
Main arguments
Elton and Gruber (1970) initially proposed tax clientele theory stating that ex-day behavior of a
firm’s common stock should be associated with its marginal stockholders’ tax rates. An investor
selling his stocks before the ex-day loses the right of receiving dividends. However, if he holds
them until they go ex-dividend, he should expect to sell them at lower price due to his dividend
retention. This stockholder is indifferent to the time of selling his stocks only if the benefits
from two cases are equal. Accordingly, Elton and Gruber (1970) develop the following
expression:
Pc – tg(Pc – Po) = Pe – tg(Pc – Po) + D(1 – td) (Eq.2.1)
Rearranging (Eq.2.1) they get
27
(Eq.2.2)
Where Pc is stock price on the last cum-day. Pe is expected stock price on the ex‐day. Po is cum-
dividend price at which stocks were purchased. td is the marginal tax rate on dividends. tg is the
marginal tax rate on capital gains. D is the magnitude of dividend.
Subject to this analysis, the ratio of price drop to dividend (Pc – Pe)/D always reflects the
comparative marginal tax rates on stockholders’ dividends and capital gains. If there is
favorable tax treatment of capital gains to dividends, the price drop is less than dividend paid
and the ratio is smaller than one. Therefore, Elton and Gruber (1970) posit that the relative
marginal tax rates can be inferred by studying the stock price drop to dividend ratio on the ex-
dividend day. Moreover, they investigate the relationship between relative tax bracket and
dividend yield in the U.S. market by sorting the research sample into deciles by dividend yield
and calculate the mean of (Pc – Pe)/D for each group. Their findings show that the mean of price
drop to dividend ratio is 0.778 and the ratio is be positively related to dividend yield. The
former is consistent with the U.S. tax policy and the latter is in consistence with the presence of
tax clientele effect which states that investors with low relative tax brackets are more likely to
hold low yield stocks.
Jerry (1980) extends the Elton-Gruber analysis with abnormal trading volume around ex-
dividend days. He argues that delaying or advancing a transaction due to tax-related reasons is
costly. Therefore, high tax bracket investors who want to advance selling their stocks tend sell
on the cum-dividend day whist high tax bracket investors who want to postpone a purchase of
stocks tend to buy on the first day when stocks go ex-dividend. Based on these arguments, they
posit that some positive abnormal trading volume should be observable on the ex-dividend day
and the day before while negative abnormal trading volume should appear on other days.
Empirical studies
Using Elton and Gruber’s model, Barclay (1987) tests the tax-effect hypothesis by investigating
the ex-dividend behavior of stock prices in the US market before the enforcement of the federal
income tax over the period from 1900 to 1910. They find that during the pre-tax period, price
drops are, on average, equal to the full amount of dividends paid. This is consistent with the tax
clientele hypothesis. In addition, Lamdin (1993) study the ex-dividend day behavior of share
prices before and after the US Tax Reform Act of 1986 which increase tax rates on capital
gains. With the research data collected from 1982 to 1991, they find empirical evidence
supporting the traditional view that different tax treatment of dividends over capital gains
28
significantly affects their valuation. The price drop to dividend ratio on the ex-dividend day, on
average, is lower in the post-reform period than the pre-reform period. Moreover, Roni
Michaely and Vila (1995) extends Elton and Gruber’s analysis by developing a dynamic tax-
induced clientele model. They posit that investors with preferential taxation of dividends tend to
hold and buy stocks before the ex-day whist investors with tax disadvantages on dividends tend
to sell stocks on cum-dividend days and buy them back on the ex-day. As a result, investors
trade with each other around the ex-dividend day due to their different valuation of dividends.
In this model, dividend yields and tax heterogeneity indicate gains from tax arbitrage trading
activities whist risk and transaction costs prevent these activities. In equilibrium, the price drop
to dividend ratio is shaped by the average investors’ preference for dividends to capital gains,
rather than by a single group of investors. Graham, Michaely, and Roberts (2003) take the
opportunity of decimalization of price quotations from 1/8s and 1/16s to decimals in the US
stock market to test the microstructure hypothesis. However, they find that abnormal stock
returns on the ex-dividend day increase in both the 1/16 and decimal pricing periods, relative to
the 1/8 period. This implies there is no supporting evidence of the price discreetness effect and
transaction costs theory. They show that a May 1997 decrease in the capital gains tax rate can
explain the abnormal returns increase as stated by Elton and Gruber (1970).
Furthermore, there are many empirical supports for the tax clientele theory in non-U.S. stock
markets. Booth and Johnston (1984) extends this line of research to Canadian stock market
where the tax policy of dividends over capital gains are is absolutely different from the tax
system in the U.S. stock market. They estimate the price drop ratio for four separate tax periods
including 1970-1971, 1972-1976, 1977, and 1978-1980 and find that the price drop ratio on the
ex-dividend day is not equal to from zero or one. This implies that taxes have significant effects
on investor preferences for dividends over capital gains. Besides, the behavior of the price drop
ratio on the ex-dividend day under different tax regimes support the argument that individuals
of effectively low dividend tax brackets are marginal traders in the stock market. Moreover,
Kato, Kato, Loewenstein, and Loewenstein (1995) argue that investigation of stock price and
trading volume behavior around the ex-dividend day in Japan can provide more understandings
on the tax clientele effect since the Japanese stock market is different from the U.S. market in
terms of tax code (i.e. short-term and long-term trading activities are imposed the same tax rate
and there is significant change in tax policy in the tax reform of 1988) and the means of
information dissemination. With a comprehensive empirical analysis of the ex-dividend day
stock price behavior, they find that prices increase on the ex-dividend day and the effects of
29
taxes on the ex-day stock price behavior seem to be secondary. Stock returns around the ex-
dividend day are dominated by the fiscal year end effect. Milonas, Travlos, Xiao, and Tan
(2006) choose the Chinese stock market where cash dividends are either taxable or non-taxable
based on their magnitude comparative to the annual interest to examine the ex-dividend day
behavior of stock price. After neutralizing potential factors which can affect the stock price
behavior, they find that the ex-dividend price drop to dividend ratio of non-taxable stocks is not
significantly different from one while that of taxable stocks is significantly less than one. For
stocks with high dividend yield, the price adjustment relies on the effective dividend tax rate.
These overall findings support the tax clientele hypothesis. Besides, empirical supporting
evidence of the tax effect on the ex-day stock behavior is also documented in Finland (Hietala,
1990), Italy (R. Michaely, Michaely, Murgia, & Murgia, 1995), Germany (McDonald, 2001),
the Netherlands (Florentsen & Rydqvist, 2002), Sweden (Daunfeldt et al., 2009) and Taiwan
(H.-L. Chen, Chow, & Shiu, 2013).
2.2.2. Short-term trading theory
Main arguments
In Elton and Gruber’s model, marginal investors are long-term investors. Their decisions of
buying or selling are irrelevant to dividends; therefore, transaction costs are considered as fixed
costs and fail to affect the equilibrium. However, Kalay (1982a) argues that in the absence of
the tax clientele effect (i.e. tax rates on dividends and capital gains are equal), there are
investors who are different to the timing of sale and trade due to dividends. In this case,
transaction costs become relevant to the price drop to dividend ratio. If the expected price drop
on the ex-day exceeds the dividend per share by more than the costs of buying and selling
stocks, investors could short-sell their stocks on cum-dividend days and buy them back when
they go ex-dividend to make a profit. This can be presented as follows:
(1 – to)(Pc – Pe – D – αP) > 0 (Eq.2.3)
Where to is tax rate on ordinary income, α is expected transactions costs of a round-trip
transaction and P = (Pc + Pe)/2
On the other hand, if the expected price drop on the ex-day is less than dividend per share by
more than transaction costs, investors tend to buy stocks on cum-dividend days and sell them on
ex-dividend days to gain a profit. This can be expressed as follows:
(1 – to)[D – (Pc – Pe) – αP] > 0 (Eq.2.4)
30
According to Kalay (1982a), a profit is realized only if it is not exploited by arbitrage activities.
As a result, the condition of non-profit opportunities is presented as follows:
| D – (Pc – Pe) | ≤ αP (Eq.2.5)
Rearrange (Eq.2.5) we get
1 – ≤ ≤ 1 + (Eq.2.6)
Accordingly, the non-profit opportunity range of (Pc – Pe)/D is negatively proportional to
dividend yield and stockholders’ marginal tax rates cannot be estimated from the price drop to
dividend ratio. If transaction costs are zero, the value of (Pc – Pe)/D will be limited to unity.
Nevertheless, Kalay (1982a) posit that transaction costs are not negligible. When the ratio
varies within the allowable range, there is presence of arbitrageur.
Eades, Hess, and Kim (1984) the ex-dividend day behavior of stock price on New York Stock
Exchange from July 2nd, 1962 to December 31st, 1980 and find that the preferential treatment of
capital gains to dividends cannot explain completely abnormal returns on ex-dividend days.
Consequently, one cannot infer marginal tax rates on dividends and capital gains from the ratio
of stock price drop to dividend. This is consistent with Kalay’s arguments. Moreover, contrary
to the tax clientele theory, they show that abnormal returns are present on days other than ex-
dividend days.
Empirical studies
Lakonishok and Vermaelen (1986) argue that trading volume around the ex-dividend day also
provide information on marginal investors on the ex-day. Their findings show that trading
volume increases considerably on days around the ex-dividend day. This increase tends to be
stronger for high yield, active stocks and over the period after the launch of negotiable
brokerage commissions. In addition, they find that abnormal returns are positive before ex-
dividend days and negative after ex-dividend days and abnormal increases in stock prices are
positively related to dividend yield. These results are supporting evidence for transaction cost
theory.
Karpoff and Walkling (1988) investigating short-term trading before and after ex-dividend days
on New York Stock Exchange from 1964 to 1985 find that ex-day returns are impacted by
arbitrage trading and positively related to transaction costs. Arbitrageurs are marginal investors
in stocks with high dividend yield whilst arbitrage trading is not present with low-yield stocks
and before negotiated commissions. Moreover, Karpoff and Walkling (1990) confirm that
31
dividend capture trading plays an important role in dividend puzzle and the explanation of ex-
day returns is more complex than indicated by Elton and Gruber’s tax-induced hypothesis. Ex-
dividend day returns of stocks with dividend capture reflect arbitrageurs’ marginal transaction
costs whilst those without dividend capture may reflect long-term investors’ marginal tax rates.
Supporting evidence for the short-term trading theory is mainly from the U.S. market. Boyd and
Jagannathan (1994) develop an equilibrium model based on three stylized facts: (1) transaction
costs are significant; (2) there are different groups of traders (i.e. taxable individuals, tax-
favorable dividend capturing traders, and tax-neutral arbitrageurs) with various transactions
costs and/or tax brackets and (3) high-yield stocks experience dividend capture. They argue that
when the price data includes a mixture of observations of different traders the relationship
between dividend yield and the ex-dividend price drop is not linear and find supporting
evidence of this prediction. Moreover, after eliminating low dividend observations, they find
that the proportion of data points at which short-term trading to capture dividend is appearing
tend to increase. Naranjo, Nimalendran, and Ryngaert (2000) reexamine and extend the study of
Eades et al. (1984) by focusing on the inter-temporal behavior of stock returns on the ex-day for
high-yield stocks which are potentially attractive to corporate dividend capture. They find that
find that abnormal ex-day returns are, on average, uniformly negative during the years after the
launch of negotiable commission rates and the variation of time in ex-day returns over the
negotiable commission rates period is in line with the tax-based dividend capture hypothesis.
Returns on ex-days are more negative when the tax advantage to short-term trading is greatest
and more positive when transaction costs and risk of dividend capture increase.
Furthermore, Castillo and Jakob (2006) investigate the ex-day behavior of stock prices on the
major Chilean exchange and find that the price drop is, on average, equal to only 81.5%
dividend amount. With the absence of discreteness, they test the dividend clientele effects with
five sub-samples classified by dividend yield but find no significant relationship between the
price drop to dividend ratio and dividend yield. In addition, they use regression analysis to
investigate the effect of dividend yield on the price drop ratio and the ex-day abnormal return
but there is no consistent evidence with the tax hypothesis. This is explained that the dividend
payment requirement stipulated by the Chilean Government makes the dividend clientele effect
less prevalent. Consequently, they suggest that transactions costs for short-term traders may
ultimately be the friction restricting the price adjustment on the ex-dividend day in Chile.
Moreover, Dasilas (2009) find that the data collected from the Athens Stock Exchange over the
period from 2000 to 2004 is a good laboratory to investigate the reaction of stock prices on the
32
ex-dividend day due to its special dividend distribution mechanism: (1) dividends are paid
annually instead of quarterly or semi-annually; (2) according to corporate laws 2190/1920 and
148/1967, the minimum amount of dividend shall be paid from the taxed corporate profits; (3)
dividends are exempt from personal taxes over the research period; (4) commission costs are
deregulated and tick size is significantly small and (5) opening stock prices are deducted
artificially by the dividend amount on the ex-day. Their results show that stock prices fall less
than the dividend amount on the ex-day and the behavior of both abnormal returns and
abnormal trading volume around the ex-dividend day support the presence of short-term
trading.
2.2.3. Microstructure theories
Main arguments
Dubofsky (1992, 1997) propose the limit order adjustment model to explain ex‐dividend day
behavior of stock price based on regulations of New York Stock Exchange. If the bid and asked
prices are constant during intra-ex-day trading, and market orders on the ex-dividend day have
equal likelihood to be a buy order or a sell order filled at with the ask price PAe and the bid
price PBe on the last cum-dividend day respectively, then the average closing price on the ex-
day Pe is calculated as (PAe + PBe)/2 and the stock's mean return is as follows:
(Eq.2.7)
Where Pc is the mean closing price on the cum-dividend day. Pe is the mean closing price on
the ex-dividend day. D is the cash dividend paid per share.
In a perfect capital market, the diffences between PAe and PBe and their corresponding cum-
dividend levels are precisely equal to the dividend amount; therefore R is equal to zero.
Nevertheless, stocks are trade at 1/8 increments but dividend amounts are commonly not
multiple increments of eighths. According to Rule 118, all limit buy orders existing on the
exchange are compulsorily reduced by the amount of paid dividend. If resulting prices are not
equal to a multiple of a tick, prices of limit buy orders will be reduced to the next tick.
Meanwhile, limit sell orders are not subject to the price adjustment mechanism. Price
adjustment of limit orders leads to less than one price drop to dividend ratio.
Moreover, Frank and Jagannathan (1998) develop microstructure model to explain ex‐day
puzzle based on the spread between bid price and ask price. Studying behavior of stock price on
33
ex-days on the Hong Kong stock market which has no taxes on both dividends and capital gains
and no market makers until 1993, they find that price drop to dividend ratio is about a half. The
mean value of dividend per share is HK $0.12 while that of the price drop on the ex-dividend
day is only HK $0.06 per share. To explain this phenomenon they propose an investor behavior
model in which there are two types of prices in the stock market including the price for buying
(i.e. ask price) and the price for selling (i.e. bid price). In the bid-ask bounce model, rational
investors who have decided to purchase stocks would prefer to conduct their behavior on the
ex-day instead of on the last cum-day (i.e., they would rather delay their trading activity by a
day) due to costs arising from dividend collection. Meanwhile, market makers with lower
collection costs tend to purchase stocks before ex-dividend days and resell them on ex-dividend
days. Therefore, most trades are conducted at bid prices on cum-dividend days and at ask prices
on ex-dividend days. These bid-ask spreads imply that price drops on ex-days are lower than
dividend amounts.
Using the data on share prices, dividends, and ex-dividend dates of 351 firms provided by the
Pacific Basin Capital Markets Research Center in the period from January 1980 to December
1993, Frank and Jagannathan (1998) find supporting evidence of the bid-ask bounce hypothesis.
In addition, Bali and Hite (1998) argue that stock price behavior on ex-dividend days is
determined by price discreteness. Dividends are commonly small; therefore, price discreteness
is an important factor to explain observed the reaction of stock price on the ex-dividend day.
Frank and Jagannathan (1998) develop a simple model of trading activities around the ex-day
with the prediction that the price drop tend to be smaller than the dividend amount but greater
than or equal to the difference between the dividend amount and one tick. According to the
price discreteness hypothesis, if stock prices are restricted to discrete ticks and dividends are
continuous, dividend amounts are always rounded down to ticks next to dividends. This
adjustment makes in ex-day price drops less than dividend amounts in most cases. If tick size is
larger, price drop ratio will be higher. Using data from American Stock Exchange over the
period from July 2nd, 1962 to December 31st, 1994 they find supporting evidence for the price
discreteness hypothesis.
Empirical studies
K. Jakob and Ma (2004) conduct direct empirical tests of the price discreteness hypothesis and
the limit order adjustment hypothesis with the data from New York Stock Exchange between
January 1993 and December 2001. The two models are tested with all three tick size regimes
during the research period. Five major findings are reported as follows: (1) For the most
34
commonly paid dividends, the likelihood that the price drop in the ex-day is the tick above is
just equal to the likelihood that the ex-day price drop is the tick below the dividend; (2)
Regression results show that the average price drop is different from the tick below the
dividend; (3) Under three tick size regulations, the average difference in bid price between the
cum-day and the ex-day is larger than the average dividend, which is larger than the average
difference in ask price between the cum-day and the ex-day; (4) The opening bid-ask bounce is
larger on the ex-day than on the cum-day and (5) There is no significant decrease in the
difference between the dividend amount and the average price drop when the tick size is
decreased. All of these findings support the price discreteness model and is not consistent with
the limit order adjustment model.
Al Yahyaee, Pham, and Walter (2008) examine the ex-dividend reaction of stock prices in
Oman stock market which is characterized as follows: (1) Either dividends or capital gains are
taxable; (2) stock prices are decimalized; (3) dividends are paid annually; and (4) the data is
available to investigate the bid-ask bounce hypothesis. Under this institutional environment,
lower than one price drop to dividend ratio is not caused by taxes and price discreteness. In line
with prior studies, they find that the stock price drops are less than less than dividend amounts
and ex-day returns are significantly positive. However, when they examine the behavior of
abnormal trading volume around the ex-day, there is no supporting evidence of the short-term
trading hypothesis. Then, they take the market microstructure effect into account and they find
that the ex-dividend price drop is not significantly different from the dividend magnitude.
As presented, there are three groups of theories including taxation, transaction costs and market
microstructure to explain that ex-dividend day anomaly of stock price. We find that Vietnamese
stock market is a good laboratory to examine this anomaly due to its special features: Firstly,
both opening and closing prices are determined by periodic call auction mechanism and there is
no market maker. Secondly, tick size on which the microstruture theories are based is
significantly smaller than dividend magnitude. Thirdly, unlike many markets’ tax systems, there
is no favorable treatment of capital gains to dividends. Finally, short-selling is prohibited.
2.3. Shareholder rights, creditor rights and dividend policy
Based on the agency problem suggested by M. C. Jensen and Meckling (1976). Later studies
develop the agency model in broad terms with two types of interest conflicts: the conflicts
among equity claimants and the conflicts between equity and debt claimants (Brockman &
Unlu, 2009). Accordingly, there are two types of agency costs, namely agency costs of
shareholders and agency costs of creditors. Beside many studies explaining agency costs
35
corporate dividend decisions at firm level, there are studies investigating the effect of
shareholder and creditor rights which are considered as proxies of agency costs on dividend
policy across countries with the argument that legal regimes are enormously different in terms
of shareholder and creditor protection around the world.
La Porta, Lopez-de-Silanes, Shleifer, and Vishny (1998) define legal protection as both the
legal content and the quality of enforcement. Examining company laws and
bankruptcy/reorganization laws of 49 countries, they exhibit that countries in different legal
origins including English common law, and French, German and Scandinavian civil law have
various levels of shareholder and creditor rights. Countries with English common law origin are
the most shareholder-friendly; however, countries with French and German origin are the least
shareholder-friendly and countries with Scandinavian origin are somewhere in between the two
extremes. Since creditor protection is more complex than shareholder protection due to various
kinds of creditors and strategies of handling bankrupt firms but they also find that legal origin
matters to many creditor right variables. French civil law countries have the weakest creditor
protection. Djankov, McLiesh, and Shleifer (2007) construct a revised measure of legal creditor
rights based on La Porta et al. (1998) with minor differences in 129 countries for every year
over the period from 1978 to 2003.They find that creditor protection varies systematically
across legal families. Particularly, creditor protection is stronger in common law family than in
French civil law family, German civil law family has strong creditor rights and French legal
origin countries have the weakest creditor protection. These findings are consistent with those
of the original creditor index. In addition, they show that is the average creditor rights score
tend to remain unchanged over time in all legal families. This implies that creditor rights reflect
relatively permanent characteristics of the institutional environment which is deeply rooted in
countries’ legislative traditions. Moreover, Djankov, La Porta, Lopez-de-Silanes, and Shleifer
(2008) criticize that that La Porta et al. (1998) only predict financial outcome on the basis of
investor protection measures across countries and fail to explicitly focus on self-dealing defined
as the problem of investor expropriation. Therefore, they propose a new measure of shareholder
rights representing legal prevention of corporate insiders’ expropriation: the anti-self-dealing
index. The index measures private enforcement mechanisms including disclosure, approval, and
litigation which govern a specific self-dealing activity in accordance with prevailing legal rules
of 72 countries in 2003. This theoretically grounded index generally has better predictability
than the prior index of anti-director rights in terms of stock market outcomes. Besides, in this
study, Djankov et al. (2008) also revise the LLSV original anti-director rights index which is
36
criticized by many scholars due to its ad hoc nature, coding mistakes and conceptual
ambiguity. The revised anti-director index is calculated with more precise definitions of
corporate law dimensions based on applicable laws and regulations for publicly traded firms in
May 2003 in 72 countries instead of 49 countries. Remarkably, the differences in both the anti-
self-dealing index and the revised anti-director index shows across legal families are consistent
with those reported by La Porta et al. (1998).
La Porta et al. (2000) argue that controlling shareholders can conduct policies for their own
interest and expropriate minority shareholders. Minority shareholders are always victims of
expropriation regardless of who insiders are defined, hence they typically prefer dividends.
However, the law is one of important remedies to agency problems. Legal regime provides
investors specific powers to prevent their investment from insiders’ expropriation. Shareholder
powers are rights to receive dividends which are equal to those of insiders, to vote on important
issues of firms, to sue firms for damages. This legal protection make minority shareholders
more confident to implememt their investment strategies. In addition, recognizing the variety of
legal protection of shareholders around the world, they La Porta et al. (2000) initially
investigate the effect of shareholder rights on dividend policy across countries. In this study,
they propose a pair of opposite agency models of dividends, namely the outcome model and the
substitute model. The former argue that dividends are paid as an outcome of an effective legal
mechanism of shareholder protection. Under this effective mechanism, minority shareholders
use their legislative powers to pressure insiders to disgorge cash by voting for directors who
pay higher dividends, by selling shares with low dividends to potential hostile raiders or by
suing firms which benefit insiders too much. Therefore, stronger minority shareholder
protection leads to more dividends paid from corporate earnings. In an alternative view, the
latter model argues that dividends are paid as a substitute for shareholder protection by laws.
This view is based on firms’ demand for external financing, at least occasionally. To raise
external funds with favorable conditions firms should earn a reputation of fair treatment of
shareholders and one approach to establish a good reputation is paying dividends which are
considered as a means to mitigate insiders’ expropriation. A reputation for fair treatment of
shareholders is more important in countries where legal protection of minority shareholders is
weak; therefore the need to pay dividends in these countries is greater. This view indicates that,
ceteris paribus, when legal protection of shareholders is stronger, dividend payouts are lower.
Tesing the two models with a research data of 4,000 companies incorporated in 33 countries
37
with a wide range of minority shareholder rights, La Porta et al. (2000) find empirical
supporting evidence of the outcome agency model of dividends.
Brockman and Unlu (2009) broaden the analysis of the substitute model by investigating the
ability of creditor protection to decrease agency costs of debt. They find that creditor rights vary
considerably across countries in similar legal families and with similar shareholder rights. For
instance, four common law countries including the U.S., Canada, the U.K., and Australia have
high shareholders rights index; however the two former are of the top creditor protection while
the two latter are of the bottom. Moreover, the U.K. and Australia firm has 87% likelihood of
paying dividends and 2.80 times of dividend to sales ratio higher than the U.S. and Canada
typical firm. Consequently, weak creditor protection may result in lower probability to pay and
dividend payouts. Brockman and Unlu (2009) argue that creditor rights can have an effect on
corporate decisions as they give the ground rules for the conflicts of interest between
shareholders and creditors. Beside the reputation-building mechanism, dividend restrictions are
also a compensation for weak creditor protection. When creditors are insufficiently protected,
they are not confident that they can recover claims over the period of bankruptcy proceedings.
Therefore, creditors have a stronger incentive to demand more powers to control the corporate
decision-making process via private credit agreements in which the two contracting parties are
agree to restrict dividends. The empirical test for the substitute model based on agency costs of
debt is conducted with a large sample including 120,507 firm-year observations from 16,525
unique firms incorporated in 52 countries during the period from 1990 to 2006. Firstly, they
investigate the impact of creditor rights on the probability of paying dividends while controlling
firm level variables (i.e. firm maturity, debt ratio, profitability, sales growth, firm size, cash
holdings, and shareholder protection). As predicted, their research findings show supporting
evidence of the substitute model with a significantly positive relationship between creditor
rights and the likelihood of dividend payment. In addition, they continue to test the hypothesis
with dividend payout ratios and find that creditor rights also have a positive association with
dividend payouts. After finding supporting evidence for dividend payouts, they investigate
additional implications of the substitute model and show three findings which are consistent
with the substitute model as follows: (1) Firms from weak creditor protection countries are
more likely to omit dividends; (2) Firms with high credit worthiness have less demand to
restrict dividend payouts as a substitute for weak creditor rights and (3) Creditor rights exert a
stronger impact on dividend payouts when free cash flows are positive.
38
Byrne and O’Connor (2012) argue that if creditor rights have the greatest impact on corporate
dividend policy as suggested by Brockman and Unlu (2009), the likelihood of paying dividends
and the dividend payout may be much lower under poor creditor protection even when
shareholder protection is strong. This implies the ability of shareholders to force insiders to
disgorge cash dividends is diminished under weak creditor protection even when legal rights
are strong. Accordingly, they extend the line of research by examining whether shareholders
are, by their legal rights measured at both the country level and the firm level, more capable of
extracting larger dividends from firms even when creditors are likely to claim for them
otherwise. Using a sample of 22,374 firms incorporated in 35 countries with pooled logit and
Tobit analysis, they find that while creditor protection, shareholder protection and corporate
governance all affect both the likelihood of paying dividends and dividend payouts, creditors
exhibit the greatest effect. This finding is consistent with Brockman and Unlu (2009).
Moreover, the regression results show that shareholder rights variables at the firm level and the
country level also affect dividend policy, in particular the latter dominates. The outcome model
based on agency costs of equity is most effective in countries which have strong creditor
protection and it is much less relevant in countries with poor creditor rights. When creditors are
insufficiently protected, they demand dividend restrictions and firms agree to do so.
Shao, Kwok, and Guedhami (2013) argue that from perspective of corporate governance,
corporate dividend policy is a decision on which there are conflicts of interest between minority
shareholders and creditors. Minority shareholders like more dividends paid as a means to
decrease the risk of expropriation by insiders whilst creditors demand dividend restrictions as
means to reduce the risk of expropriation by shareholders. Consequently, a change in dividend
decisions tends to be the benefit of one side and the cost of the other side. This indicates that
insiders cannot reduce the agency costs of equity and debt at the same time by adjusting
dividends. An optimal dividend decision balancing the interest of both shareholders and
creditors can minimize the total costs arising from two types of agency problems. With such a
balancing mechanism when the agency problem among equity claimants is not severe, insiders
are expected to use dividends to mitigate the agency problem between equity and debt
claimants; in contrast, when the agency problem between equity and debt claimants is not
severe, insiders are expected to use dividends to mitigate the agency problem among equity
claimants. Based on these arguments, Shao et al. (2013) suggest that either the outcome model
based on agency costs of equity or the substitute model based on agency costs of debt fail to
provide a full picture of dividend policy and agency costs. When creditor rights are stronger,
39
firms have more discretion to pay dividends as a substitute only if shareholder rights are
sufficiently strong that firms are forced to disgorge free cash flows. Similarly, when
shareholder rights are improved, firms tend to pay more dividends if they have flexibility to
change dividend payment under strong creditor protection. They conduct an empirical test of a
model of dividends with the interaction between the agency costs of shareholders and creditors
using a sample of 139,168 observations from 39 countries over the period between 1991 and
2010. After firm level variables including debt ratio, firm growth, firm maturity, profitability,
firm size and cash holdings are controlled, their research findings show that the positive effect
of creditor protection on both the propensity to pay and dividend payouts is more significant
when minority shareholder protection is stronger. These results persist with additional controls,
potential sample composition problem, and alternative regression techniques. Furthermore, they
analyze the role of shareholder protection on the validity of the substitute model by
investigating whether the impact of creditor protection on dividend initiations and omissions
changes across shareholder rights. The results report that strong creditor protection more
dramatically increases the likelihood of dividend initiations when shareholder protection is
strong and decreases the incidence of dividend omissions only when shareholder protection is
strong. Finally, using the same procedures to examine the predictability of the outcome model
by levels of creditor rights, they find that the positive impact of shareholder protection on both
the probability of dividend payment and dividend payouts is stronger for countries which have
strong creditor protection.
This study poists that the global financial crisis is a good exogenous shock to investigate how
firms react to the increases in both types of agency costs. Worse economic prospects lead to a
decline in expected return rates on investment and this creates more opportunities for insiders to
expropriate minority shareholders (Johnson, Boone, Breach, & Friedman, 2000). Moreover,
under the impact of a financial crisis, firms are less willing and able to establish a reputation of
fair treatment of creditors due to more external financial constraints and they are also less
willing to meet creditor demand to restrict dividends due to using dividends to establish a good
reputation on their business activities. This study is shedding new light on the effects of
shareholder and creditor rights on dividend policy when agency costs of shareholders and
creditors tend to increase under the impact of an exogenous shock in macro-environment.
In conclusion, the extant literature shows that dividend policy is determined by a wide range of
potentially conflicting factors. This PhD dissertation provides a new approach to investigate

40
dividend policy, new evidence of stock price anomaly in Vietnamese stock market and new
evidence of the two agency models of dividends under the impact of agency cost increases.
41
Chapter 3: A TWO-STEP APPROACH TO INVESTIGATE DIVIDEND POLICY:
EVIDENCE FROM VIETNAMES STOCK MARKET
3.1. Introduction
Dividend policy is one of the most debatable topics in corporate finance. Miller and Modigliani
(1961); Miller and Scholes (1978) posit that under perfect markets, dividends do not matter
since they can be offset by the change in shares outstanding with equity issues. However, in
practice capital markets are not perfect and complete due to many frictions including
information asymmetry, agency problems, transaction costs, firm maturity, catering incentives
and taxes. Later theoretical and empirical studies find that dividend policy is determined by
market frictions in both developed and emerging stock markets. In this study, we find that
Vietnamese stock market is a good environment to investigate dividend policy due to following
reasons: Firstly, as a newly established stock market, Vietnamese stock market may lack of
effective regulations and experience to control expropriation by insiders, thus this is an
opportunity to test the agency theory. Secondly, the market experiences short booming and
crashing periods. In the former period, both transaction costs of external financing and the need
to signal outside investors by dividends are low. However, they are much higher in the latter
period. Therefore, these fluctuations are important to test the transaction cost theory and the
signaling theory. Thirdly, a large proportion of listed firms are state-controlled. State-controlled
firms experience “double principal-agent problem” (Gugler, 2003) and may need more cash to
finance other financially constrained SOEs or public projects (D. Chen et al., 2009).
Consequently, we can investigate the impact of state control on dividend policy.
Moreover, the extant literature show that several prior studies focus on determinants of the
likelihood of paying dividends (DeAngelo et al., 2006; Eugene F. Fama & French, 2001;
Grullon & Michaely, 2002) or dividend payouts (Chang & Rhee, 1990; Holder et al., 1998;
Rozeff, 1982). We argue that dividend policy is a two-step decision-making process. The first
step is the decision on paying or not paying dividends and the second step is the decision on
dividend payouts if firms decide to pay. In addition, from econometric perspective, the research
data is censored since dividends are continuous to the right of zero. There is selection bias when
OLS regression is applied for the full sample of non-payers and payers or the subsample of
payers.
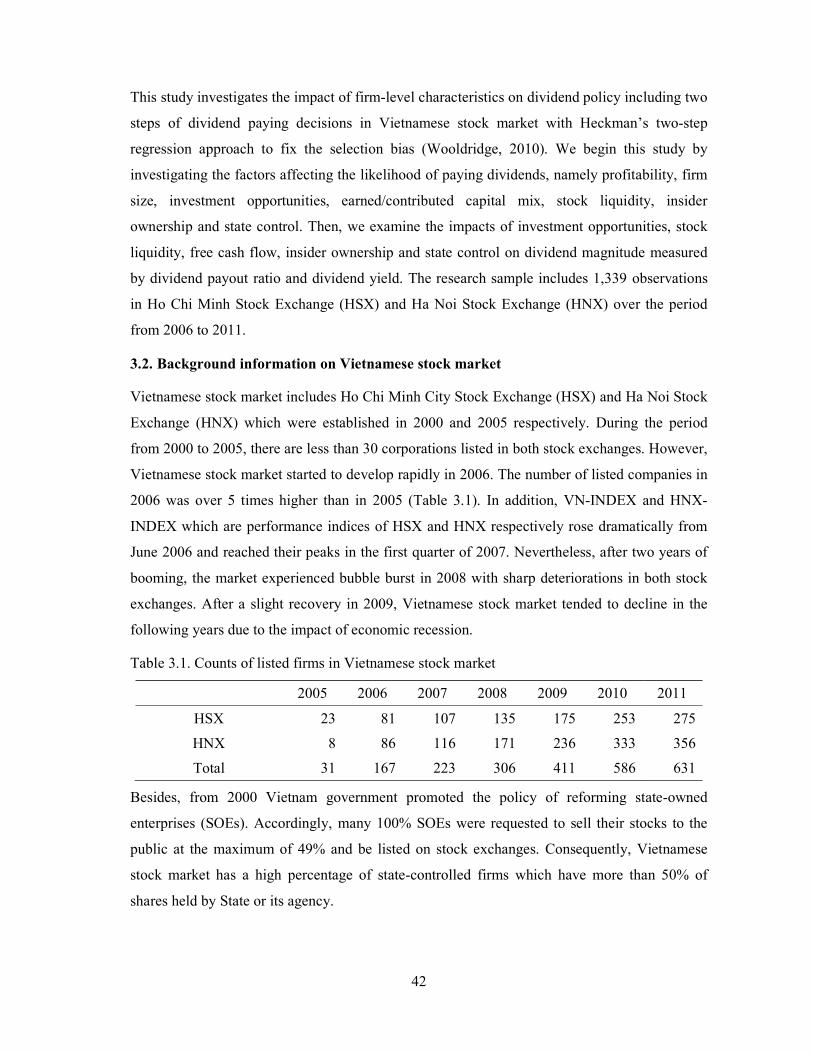
42
This study investigates the impact of firm-level characteristics on dividend policy including two
steps of dividend paying decisions in Vietnamese stock market with Heckman’s two-step
regression approach to fix the selection bias (Wooldridge, 2010). We begin this study by
investigating the factors affecting the likelihood of paying dividends, namely profitability, firm
size, investment opportunities, earned/contributed capital mix, stock liquidity, insider
ownership and state control. Then, we examine the impacts of investment opportunities, stock
liquidity, free cash flow, insider ownership and state control on dividend magnitude measured
by dividend payout ratio and dividend yield. The research sample includes 1,339 observations
in Ho Chi Minh Stock Exchange (HSX) and Ha Noi Stock Exchange (HNX) over the period
from 2006 to 2011.
3.2. Background information on Vietnamese stock market
Vietnamese stock market includes Ho Chi Minh City Stock Exchange (HSX) and Ha Noi Stock
Exchange (HNX) which were established in 2000 and 2005 respectively. During the period
from 2000 to 2005, there are less than 30 corporations listed in both stock exchanges. However,
Vietnamese stock market started to develop rapidly in 2006. The number of listed companies in
2006 was over 5 times higher than in 2005 (Table 3.1). In addition, VN-INDEX and HNX-
INDEX which are performance indices of HSX and HNX respectively rose dramatically from
June 2006 and reached their peaks in the first quarter of 2007. Nevertheless, after two years of
booming, the market experienced bubble burst in 2008 with sharp deteriorations in both stock
exchanges. After a slight recovery in 2009, Vietnamese stock market tended to decline in the
following years due to the impact of economic recession.
Table 3.1. Counts of listed firms in Vietnamese stock market
2005 2006 2007 2008 2009 2010 2011
HSX 23 81 107 135 175 253 275
HNX 8 86 116 171 236 333 356
Total 31 167 223 306 411 586 631
Besides, from 2000 Vietnam government promoted the policy of reforming state-owned
enterprises (SOEs). Accordingly, many 100% SOEs were requested to sell their stocks to the
public at the maximum of 49% and be listed on stock exchanges. Consequently, Vietnamese
stock market has a high percentage of state-controlled firms which have more than 50% of
shares held by State or its agency.
43
According to Vietnam Enterprise Law, firms are allowed to retain 100% earnings or distribute
their earnings in forms of cash dividends, retained earnings, stock dividends and share
repurchases. Like other emerging markets, Vietnamese stock market has a high proportion of
paying firms which is over 80% during the period from 2006 to 2011.
3.3. Literature review and hypothesis development
3.3.1. The decision of paying or not paying dividends
Eugene F. Fama and French (2001) examining the phenomenon of disappearing dividends of
listed firms on NYSE, AMEX, and NASDAQ from 1978 to 1999 find that there are two reasons
for the decline in the proportion of paying firms, namely changing firm characteristics and
lower propensity to pay. The former includes profitability, firm size and investment
opportunities. Grullon and Michaely (2002) make a contribution to explain “disappearing
dividends puzzle” with the substitution of share repurchases for dividends. Moreover,
propensity to pay dividend is also explained by catering incentives (M. Baker & Wurgler,
2004b). Due to the availability of information in Vietnamese stock market, this study
investigates the effect of firm characteristics on paying behavior. Return on assets, log of sales
revenue, asset growth and market-to-book ratio are used as proxies for profitability, firm size
and investment opportunities with the following hypotheses:
H1a: Return on assets is positively related to the likelihood of paying dividends.
H1b: Sales revenue is positively related to the likelihood of paying dividends.
H1c: Asset growth is negatively related to the likelihood of paying dividends.
H1d: Market-to-book ratio is negatively related to the likelihood of paying dividends.
In addition, Grullon et al. (2002) argue that younger firms which have more investment
opportunities but lower profitability have more probability of paying dividends than older ones.
The former prefer retention of earnings to distribution of earnings because their savings of
transaction costs exceed agency costs. DeAngelo et al. (2006) test the life cycle hypothesis with
listed firms in U.S. market and find that the earned/contributed capital mix is positively
correlated to the probability of dividend payment. Denis and Osobov (2008) investigate the
probability of paying dividends in developed markets and show supporting evidence for the
impact of profitability, firm size, investment opportunities and earned/contributed capital mix
on decisions of paying or not paying dividends. Therefore, earned/contributed capital mix is
hypothesized to have positive relationship with probability to pay dividends.
44
H1e: Earned/contributed capital mix is positively related to the likelihood of paying dividends.
Besides, Banerjee, Gatchev, and Spindt (2007) examine the relationship between stock market
liquidity and dividend policy with a sample of a sample of NYSE and AMEX listed firms from
1963 to 2003. Their findings show that after controlling other firm characteristics, firms with
higher stock liquidity are less likely to pay dividends. Bartov and Bodnar (1996) posit that stock
liquidity is a potential proxy for the degree of information asymmetry since investors buy
stocks with less information asymmetry more than those with higher level of information
asymmetry. Bid-ask spread and share turnover are commonly employed as measures of stock
liquidity; however, due to the availability of information, this study uses annual share turnover
to measure stock liquidity.
H1f: Annual share turnover is negatively related to the likelihood of paying dividends.
Moreover, M. C. Jensen and Meckling (1976) posit that there is agency problem between
shareholders and managers. Managers tend to use free cash flows to finance unprofitable
projects. Consequently, dividends are a mean to reduce agency problem (Rozeff, 1982). When
agency problem is more serious, firms are more likely to pay dividends. This study employs
insider ownership to investigate the impact of agency problem on paying decisions. If insider
ownership is higher, agency problem is lower. Therefore, it is hypothesized that there is a
negative relationship between insider ownership and the probability of paying dividends.
H1g: Insider ownership is negatively related to the likelihood of paying dividends.
According to D. Chen et al. (2009), state-related shareholders tend to need more cash to finance
other financially constrained SOEs or public projects. Hence, state-controlled firms tend to have
higher probability to pay dividends. We use a dummy variable assigned one for state-controlled
firms and hypothesize that state control have a positive impact on paying decisions.
H1h: State control is positively related to the likelihood of paying dividends.
3.3.2. The decision of dividend levels
Transaction cost theory, residual theory, and pecking order theory have the same argument that
firms prefer internal financing to external financing. Firstly, if transaction costs of issuing debt
or equity are significant, firms with higher transaction costs will retain more earnings to finance
business activities and hence pay lower dividends. Secondly, according to residual theory, firms
will pay dividends only if they do not have profitable investment opportunities (Ghosh &
Woolridge, 1989). Thirdly, pecking order argument developed by Stewart C. Myers and
45
Nicolas S. Majluf (1984) states that firms prioritize sources of financing from internal funds to
equity due to information asymmetry between managers and outside investors. Therefore, when
firms have more investment opportunities, they tend to retained more earnings and payless
dividends. Higgins (1972); Rozeff (1982) find significant negative impacts of investment
expenditures on dividend levels in US stock markets. The extant literature shows that asset
growth and market-to-book value ratio are commonly used proxies for current and future
investment opportunities (Eugene F. Fama & French, 2001). Hence, this study hypothesizes that
both market to book ratio and asset growth have negative effects on dividend payout ratio.
H2a: Asset growth is negatively related to dividend level.
H2b: Market-to-book ratio is negatively related to dividend level.
Moreover, when firms are more likely to use internal earnings to finance investment
opportunities than external funds, firms with higher leverage tend to pay lower dividends. G. R.
Jensen et al. (1992) find negative impact of firm leverage on dividend policy. Therefore,
leverage is hypothesized to have negative relationship with dividend levels.
H2c: Leverage is negatively related to dividend level.
In stock markets, insiders have more information on firms’ profitability than outside investors
(Miller & Rock, 1985). Bhattacharya (1979) argues that cash dividends are a signal of firms’
future performance and firms paying higher levels of dividends are considered to be more
profitable in the future. It implies that when information asymmetry is reduced, firms pay lower
levels of dividends. We use stock liquidity measured by annual share turnover as a proxy for
information asymmetry to examine the relationship between information asymmetry and
dividend policy.
H2d: Annual share turnover is negatively related to dividend level.
Based on the argument of agency problem, Rozeff (1982) develops free cash flow hypothesis
stating that dividend payment is a device to mitigate excessive funds which managers can use to
invest in negative net present value projects. Holder et al. (1998) initially employ free cash flow
to test agency theory with the sample of 477 firms listed in US stock market between 1983 and
1990. Their research findings show firms with higher free cash flows pay lower levels of
dividends. Therefore, this study hypothesizes that there is a positive relationship between free
cash flow and dividend payout ratio.
H2e: Free cash flow is positively related to dividend level.
46
In addition, Rozeff (1982) posit that insider ownership is a measure of agency costs. Lower
insider ownership indicates higher agency costs; therefore, outsiders who hold larger percentage
of shares will demand higher dividends to reduce agency costs. Holder et al. (1998); Rozeff
(1982) find empirical evidence supporting the negative relationship between the percentage of
insider ownership and dividend levels.
H2f: Insider ownership is negatively related to dividend level.
D. Chen et al. (2009) argue that state-controlled firms pay higher levels of dividends than non-
state-controlled firms since they need more funds to finance other financially constrained SOEs
or public projects. In addition, Gugler (2003) argue that the “double principal-agent problem”
arises in state-controlled firms. These firms are operated by managers who are appointed by
politicians. Politicians are elected by citizens who are real owners of state-controlled firms.
Consequently, they pay higher dividends to mitigate agency costs. Wei et al. (2004) also find
the positive effect of state control on dividend payout ratio. However, the “double principal-
agent problem” may lead to lower dividend levels if managers are not well-controlled.
H2g: State control is positively related to dividend level.
3.4. Data
3.4.1. Sample selection
In the period from 2006 to 2011, there are 2,131 non-financial observations in both Ho Chi
Minh Stock Exchange (HSX) and Ha Noi Stock Exchange (HNX). However, to improve the
accuracy of research findings, observations which are subject to one of the following criteria
are eliminated from the research data:
Observations belonging to the period from 2000 to 2005 since the number of listed firms
was extremely limited and the information of dividend payment is not available;
Observations of the listing year;
Observations with missing or incomplete information;
Observations with dividend payout ratios greater than one as outliers (Grullon &
Michaely, 2002).
The final research sample includes 1,339 observations including 284 non-payers and 1055
payers.
In Table 3.2, Panel A shows distribution of non-financial observations in the population and the
research sample by year. In the first booming year of 2006, 163 non-financial firms are listed in
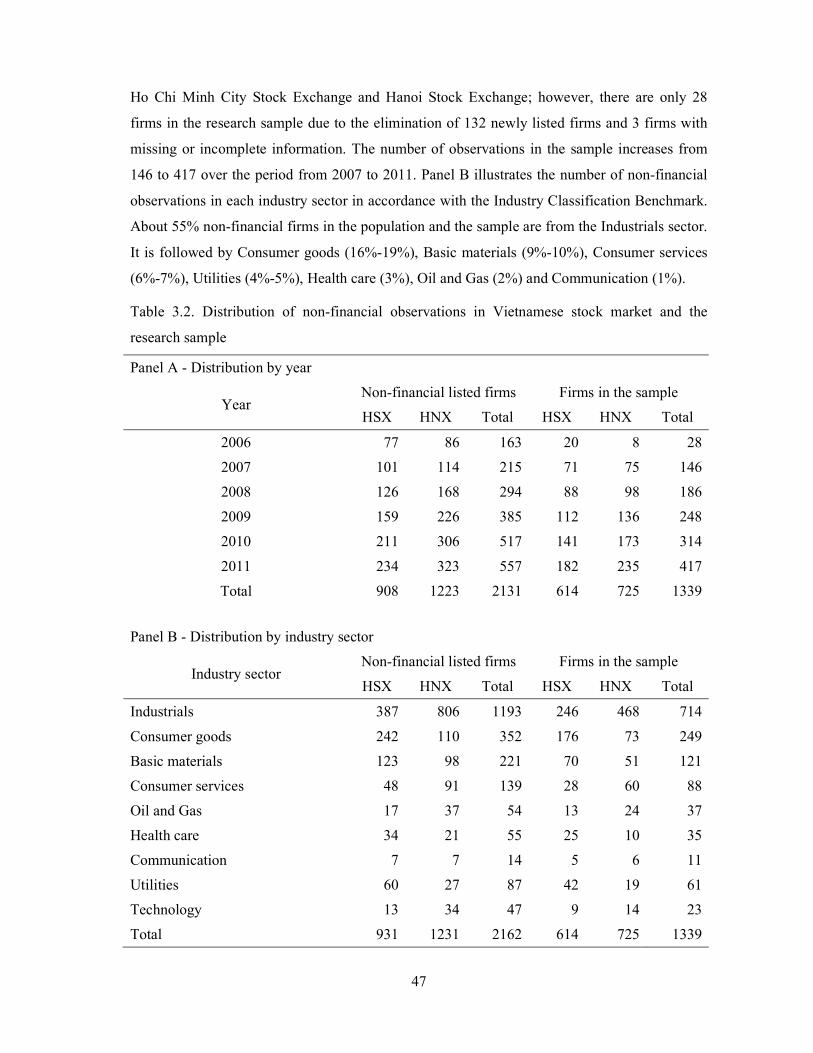
47
Ho Chi Minh City Stock Exchange and Hanoi Stock Exchange; however, there are only 28
firms in the research sample due to the elimination of 132 newly listed firms and 3 firms with
missing or incomplete information. The number of observations in the sample increases from
146 to 417 over the period from 2007 to 2011. Panel B illustrates the number of non-financial
observations in each industry sector in accordance with the Industry Classification Benchmark.
About 55% non-financial firms in the population and the sample are from the Industrials sector.
It is followed by Consumer goods (16%-19%), Basic materials (9%-10%), Consumer services
(6%-7%), Utilities (4%-5%), Health care (3%), Oil and Gas (2%) and Communication (1%).
Table 3.2. Distribution of non-financial observations in Vietnamese stock market and the
research sample
Panel A - Distribution by year
Year Non-financial listed firms Firms in the sample
HSX HNX Total HSX HNX Total
2006 77 86 163 20 8 28
2007 101 114 215 71 75 146
2008 126 168 294 88 98 186
2009 159 226 385 112 136 248
2010 211 306 517 141 173 314
2011 234 323 557 182 235 417
Total 908 1223 2131 614 725 1339
Panel B - Distribution by industry sector
Industry sector Non-financial listed firms Firms in the sample
HSX HNX Total HSX HNX Total
Industrials 387 806 1193 246 468 714
Consumer goods 242 110 352 176 73 249
Basic materials 123 98 221 70 51 121
Consumer services 48 91 139 28 60 88
Oil and Gas 17 37 54 13 24 37
Health care 34 21 55 25 10 35
Communication 7 7 14 5 6 11
Utilities 60 27 87 42 19 61
Technology 13 34 47 9 14 23
Total 931 1231 2162 614 725 1339
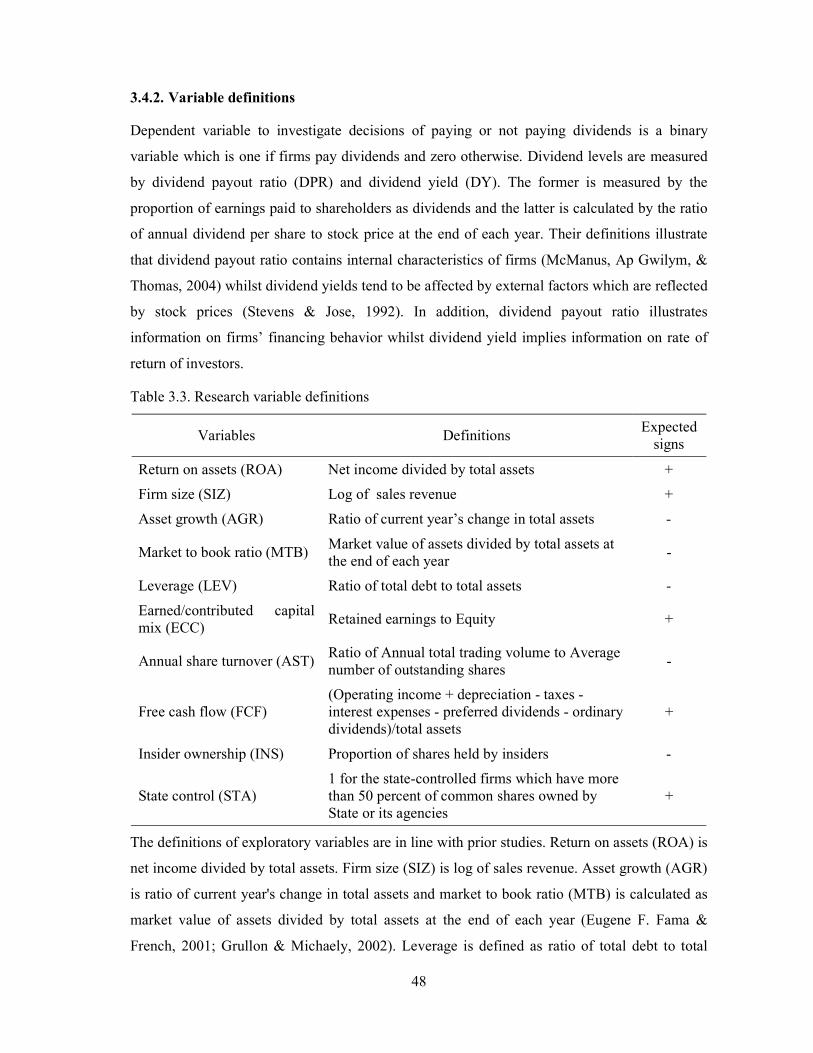
48
3.4.2. Variable definitions
Dependent variable to investigate decisions of paying or not paying dividends is a binary
variable which is one if firms pay dividends and zero otherwise. Dividend levels are measured
by dividend payout ratio (DPR) and dividend yield (DY). The former is measured by the
proportion of earnings paid to shareholders as dividends and the latter is calculated by the ratio
of annual dividend per share to stock price at the end of each year. Their definitions illustrate
that dividend payout ratio contains internal characteristics of firms (McManus, Ap Gwilym, &
Thomas, 2004) whilst dividend yields tend to be affected by external factors which are reflected
by stock prices (Stevens & Jose, 1992). In addition, dividend payout ratio illustrates
information on firms’ financing behavior whilst dividend yield implies information on rate of
return of investors.
Table 3.3. Research variable definitions
Variables Definitions Expected
signs
Return on assets (ROA) Net income divided by total assets +
Firm size (SIZ) Log of sales revenue +
Asset growth (AGR) Ratio of current year’s change in total assets -
Market to book ratio (MTB) Market value of assets divided by total assets at the end of each year
-
Leverage (LEV) Ratio of total debt to total assets -
Earned/contributed capital mix (ECC)
Retained earnings to Equity +
Annual share turnover (AST) Ratio of Annual total trading volume to Average number of outstanding shares
-
Free cash flow (FCF) (Operating income + depreciation - taxes - interest expenses - preferred dividends - ordinary dividends)/total assets
+
Insider ownership (INS) Proportion of shares held by insiders -
State control (STA) 1 for the state-controlled firms which have more than 50 percent of common shares owned by State or its agencies
+
The definitions of exploratory variables are in line with prior studies. Return on assets (ROA) is
net income divided by total assets. Firm size (SIZ) is log of sales revenue. Asset growth (AGR)
is ratio of current year's change in total assets and market to book ratio (MTB) is calculated as
market value of assets divided by total assets at the end of each year (Eugene F. Fama &
French, 2001; Grullon & Michaely, 2002). Leverage is defined as ratio of total debt to total
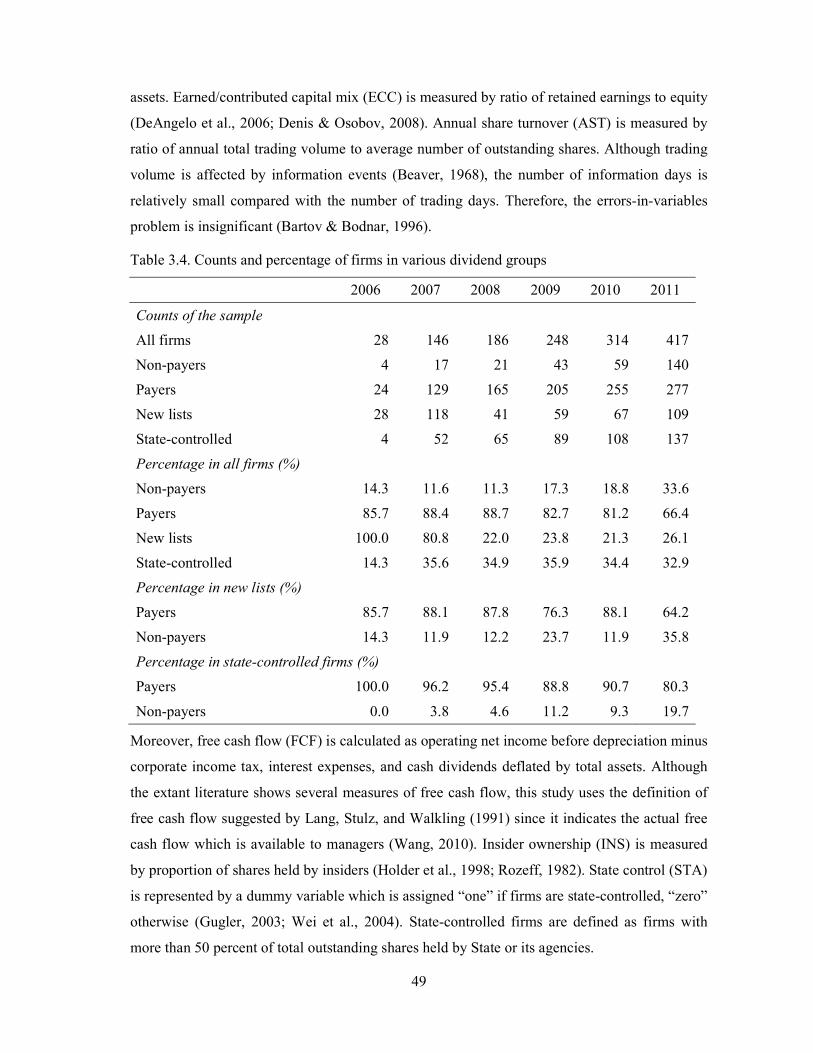
49
assets. Earned/contributed capital mix (ECC) is measured by ratio of retained earnings to equity
(DeAngelo et al., 2006; Denis & Osobov, 2008). Annual share turnover (AST) is measured by
ratio of annual total trading volume to average number of outstanding shares. Although trading
volume is affected by information events (Beaver, 1968), the number of information days is
relatively small compared with the number of trading days. Therefore, the errors-in-variables
problem is insignificant (Bartov & Bodnar, 1996).
Table 3.4. Counts and percentage of firms in various dividend groups
2006 2007 2008 2009 2010 2011
Counts of the sample
All firms 28 146 186 248 314 417
Non-payers 4 17 21 43 59 140
Payers 24 129 165 205 255 277
New lists 28 118 41 59 67 109
State-controlled 4 52 65 89 108 137
Percentage in all firms (%)
Non-payers 14.3 11.6 11.3 17.3 18.8 33.6
Payers 85.7 88.4 88.7 82.7 81.2 66.4
New lists 100.0 80.8 22.0 23.8 21.3 26.1
State-controlled 14.3 35.6 34.9 35.9 34.4 32.9
Percentage in new lists (%)
Payers 85.7 88.1 87.8 76.3 88.1 64.2
Non-payers 14.3 11.9 12.2 23.7 11.9 35.8
Percentage in state-controlled firms (%)
Payers 100.0 96.2 95.4 88.8 90.7 80.3
Non-payers 0.0 3.8 4.6 11.2 9.3 19.7
Moreover, free cash flow (FCF) is calculated as operating net income before depreciation minus
corporate income tax, interest expenses, and cash dividends deflated by total assets. Although
the extant literature shows several measures of free cash flow, this study uses the definition of
free cash flow suggested by Lang, Stulz, and Walkling (1991) since it indicates the actual free
cash flow which is available to managers (Wang, 2010). Insider ownership (INS) is measured
by proportion of shares held by insiders (Holder et al., 1998; Rozeff, 1982). State control (STA)
is represented by a dummy variable which is assigned “one” if firms are state-controlled, “zero”
otherwise (Gugler, 2003; Wei et al., 2004). State-controlled firms are defined as firms with
more than 50 percent of total outstanding shares held by State or its agencies.
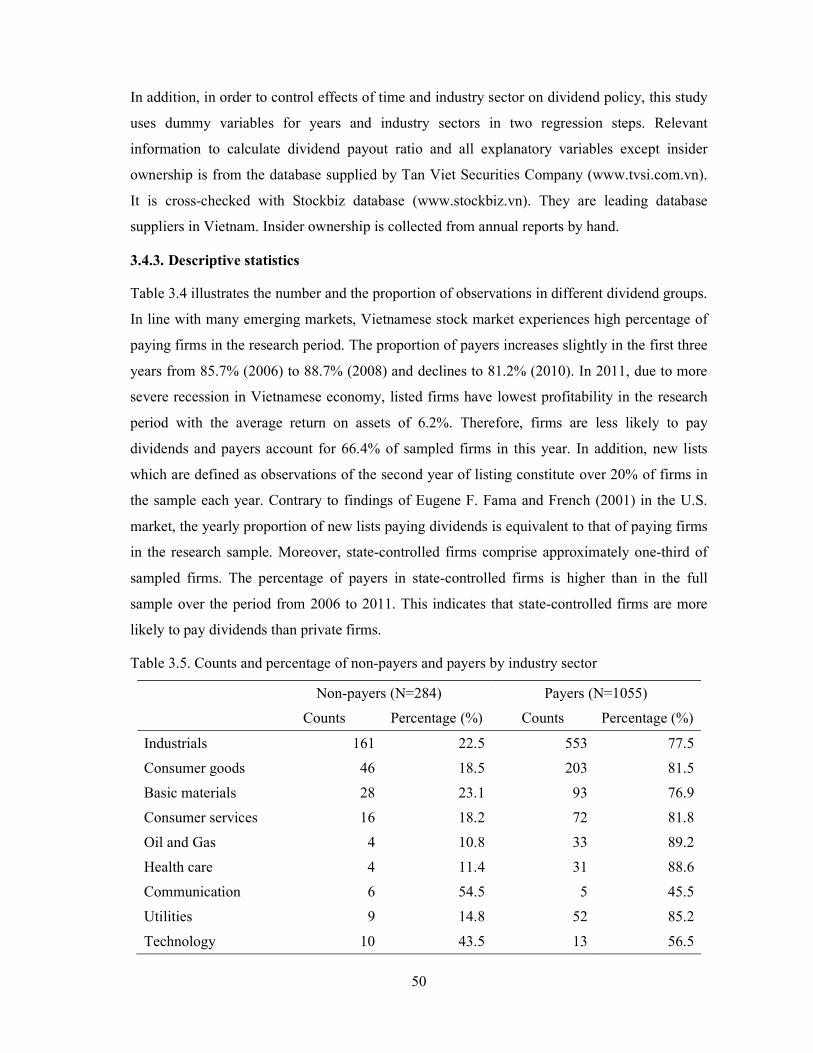
50
In addition, in order to control effects of time and industry sector on dividend policy, this study
uses dummy variables for years and industry sectors in two regression steps. Relevant
information to calculate dividend payout ratio and all explanatory variables except insider
ownership is from the database supplied by Tan Viet Securities Company (www.tvsi.com.vn).
It is cross-checked with Stockbiz database (www.stockbiz.vn). They are leading database
suppliers in Vietnam. Insider ownership is collected from annual reports by hand.
3.4.3. Descriptive statistics
Table 3.4 illustrates the number and the proportion of observations in different dividend groups.
In line with many emerging markets, Vietnamese stock market experiences high percentage of
paying firms in the research period. The proportion of payers increases slightly in the first three
years from 85.7% (2006) to 88.7% (2008) and declines to 81.2% (2010). In 2011, due to more
severe recession in Vietnamese economy, listed firms have lowest profitability in the research
period with the average return on assets of 6.2%. Therefore, firms are less likely to pay
dividends and payers account for 66.4% of sampled firms in this year. In addition, new lists
which are defined as observations of the second year of listing constitute over 20% of firms in
the sample each year. Contrary to findings of Eugene F. Fama and French (2001) in the U.S.
market, the yearly proportion of new lists paying dividends is equivalent to that of paying firms
in the research sample. Moreover, state-controlled firms comprise approximately one-third of
sampled firms. The percentage of payers in state-controlled firms is higher than in the full
sample over the period from 2006 to 2011. This indicates that state-controlled firms are more
likely to pay dividends than private firms.
Table 3.5. Counts and percentage of non-payers and payers by industry sector
Non-payers (N=284) Payers (N=1055)
Counts Percentage (%) Counts Percentage (%)
Industrials 161 22.5 553 77.5
Consumer goods 46 18.5 203 81.5
Basic materials 28 23.1 93 76.9
Consumer services 16 18.2 72 81.8
Oil and Gas 4 10.8 33 89.2
Health care 4 11.4 31 88.6
Communication 6 54.5 5 45.5
Utilities 9 14.8 52 85.2
Technology 10 43.5 13 56.5
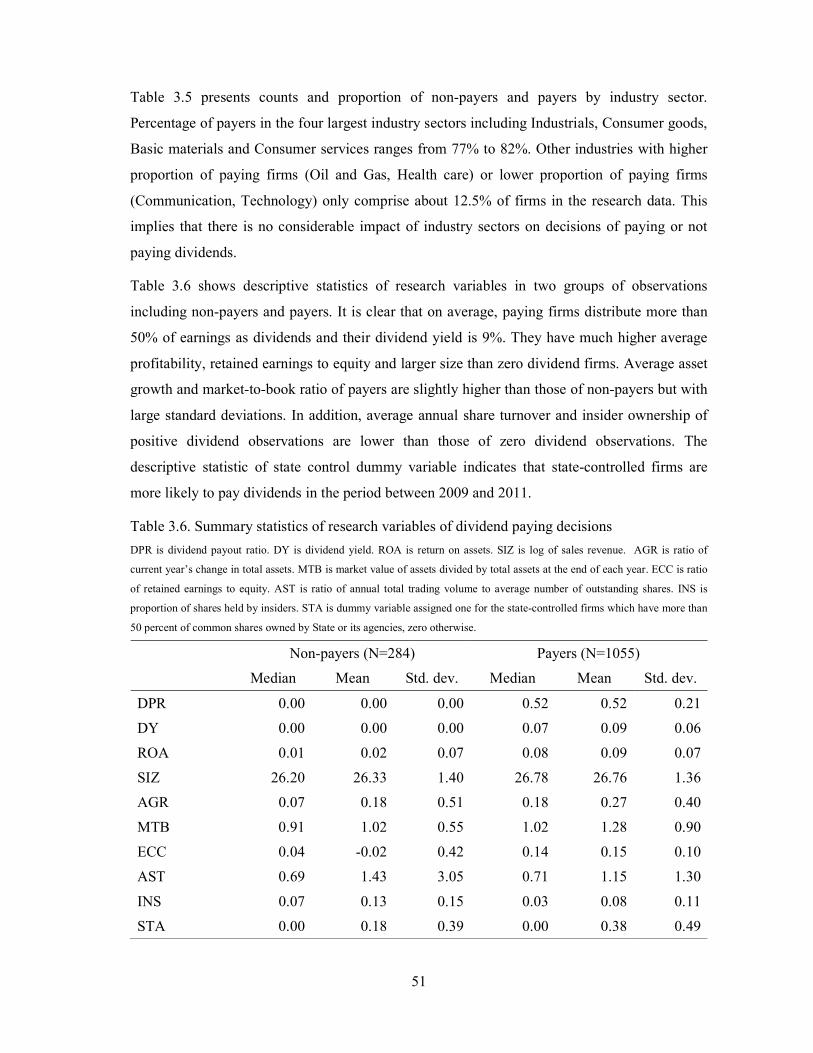
51
Table 3.5 presents counts and proportion of non-payers and payers by industry sector.
Percentage of payers in the four largest industry sectors including Industrials, Consumer goods,
Basic materials and Consumer services ranges from 77% to 82%. Other industries with higher
proportion of paying firms (Oil and Gas, Health care) or lower proportion of paying firms
(Communication, Technology) only comprise about 12.5% of firms in the research data. This
implies that there is no considerable impact of industry sectors on decisions of paying or not
paying dividends.
Table 3.6 shows descriptive statistics of research variables in two groups of observations
including non-payers and payers. It is clear that on average, paying firms distribute more than
50% of earnings as dividends and their dividend yield is 9%. They have much higher average
profitability, retained earnings to equity and larger size than zero dividend firms. Average asset
growth and market-to-book ratio of payers are slightly higher than those of non-payers but with
large standard deviations. In addition, average annual share turnover and insider ownership of
positive dividend observations are lower than those of zero dividend observations. The
descriptive statistic of state control dummy variable indicates that state-controlled firms are
more likely to pay dividends in the period between 2009 and 2011.
Table 3.6. Summary statistics of research variables of dividend paying decisions
DPR is dividend payout ratio. DY is dividend yield. ROA is return on assets. SIZ is log of sales revenue. AGR is ratio of
current year’s change in total assets. MTB is market value of assets divided by total assets at the end of each year. ECC is ratio
of retained earnings to equity. AST is ratio of annual total trading volume to average number of outstanding shares. INS is
proportion of shares held by insiders. STA is dummy variable assigned one for the state-controlled firms which have more than
50 percent of common shares owned by State or its agencies, zero otherwise.
Non-payers (N=284) Payers (N=1055)
Median Mean Std. dev. Median Mean Std. dev.
DPR 0.00 0.00 0.00 0.52 0.52 0.21
DY 0.00 0.00 0.00 0.07 0.09 0.06
ROA 0.01 0.02 0.07 0.08 0.09 0.07
SIZ 26.20 26.33 1.40 26.78 26.76 1.36
AGR 0.07 0.18 0.51 0.18 0.27 0.40
MTB 0.91 1.02 0.55 1.02 1.28 0.90
ECC 0.04 -0.02 0.42 0.14 0.15 0.10
AST 0.69 1.43 3.05 0.71 1.15 1.30
INS 0.07 0.13 0.15 0.03 0.08 0.11
STA 0.00 0.18 0.39 0.00 0.38 0.49
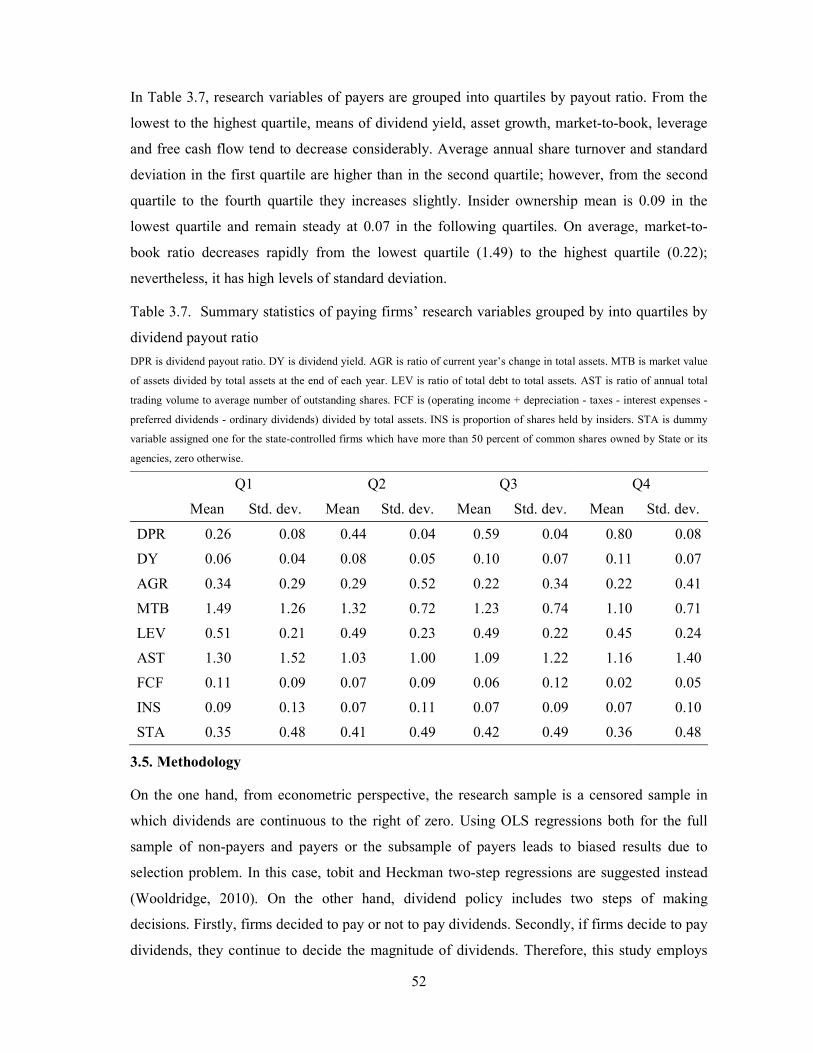
52
In Table 3.7, research variables of payers are grouped into quartiles by payout ratio. From the
lowest to the highest quartile, means of dividend yield, asset growth, market-to-book, leverage
and free cash flow tend to decrease considerably. Average annual share turnover and standard
deviation in the first quartile are higher than in the second quartile; however, from the second
quartile to the fourth quartile they increases slightly. Insider ownership mean is 0.09 in the
lowest quartile and remain steady at 0.07 in the following quartiles. On average, market-to-
book ratio decreases rapidly from the lowest quartile (1.49) to the highest quartile (0.22);
nevertheless, it has high levels of standard deviation.
Table 3.7. Summary statistics of paying firms’ research variables grouped by into quartiles by
dividend payout ratio
DPR is dividend payout ratio. DY is dividend yield. AGR is ratio of current year’s change in total assets. MTB is market value
of assets divided by total assets at the end of each year. LEV is ratio of total debt to total assets. AST is ratio of annual total
trading volume to average number of outstanding shares. FCF is (operating income + depreciation - taxes - interest expenses -
preferred dividends - ordinary dividends) divided by total assets. INS is proportion of shares held by insiders. STA is dummy
variable assigned one for the state-controlled firms which have more than 50 percent of common shares owned by State or its
agencies, zero otherwise.
Q1 Q2 Q3 Q4
Mean Std. dev. Mean Std. dev. Mean Std. dev. Mean Std. dev.
DPR 0.26 0.08 0.44 0.04 0.59 0.04 0.80 0.08
DY 0.06 0.04 0.08 0.05 0.10 0.07 0.11 0.07
AGR 0.34 0.29 0.29 0.52 0.22 0.34 0.22 0.41
MTB 1.49 1.26 1.32 0.72 1.23 0.74 1.10 0.71
LEV 0.51 0.21 0.49 0.23 0.49 0.22 0.45 0.24
AST 1.30 1.52 1.03 1.00 1.09 1.22 1.16 1.40
FCF 0.11 0.09 0.07 0.09 0.06 0.12 0.02 0.05
INS 0.09 0.13 0.07 0.11 0.07 0.09 0.07 0.10
STA 0.35 0.48 0.41 0.49 0.42 0.49 0.36 0.48
3.5. Methodology
On the one hand, from econometric perspective, the research sample is a censored sample in
which dividends are continuous to the right of zero. Using OLS regressions both for the full
sample of non-payers and payers or the subsample of payers leads to biased results due to
selection problem. In this case, tobit and Heckman two-step regressions are suggested instead
(Wooldridge, 2010). On the other hand, dividend policy includes two steps of making
decisions. Firstly, firms decided to pay or not to pay dividends. Secondly, if firms decide to pay
dividends, they continue to decide the magnitude of dividends. Therefore, this study employs
53
Heckman two-step selection approach to investigate dividend policy with two steps of their
decision making process.
In the first step, a probit regression model is used to estimate the probability of dividend
payments as follows:
PPDi = (Eq.3.1)
Where PPDi is the observable dependent variable which takes one if PPD*>0 and zero
otherwise. PPD* is the latent variable: PPDi* = α + βX1i + ui; ui ~ N(0,σ2). Xit is the column
vector of explanatory variables of firm i. The vector contains ROA, SIZ, AGR, MTB, ECC,
AST, INS and STA. ui is the residual term of firm i.
The first step probit regression also generates the inverse Mill’s ratio (IMR) which is denoted as
λ and measured by the following formula:
λi = φ(X1iβ)/Ф(X1iβ) (Eq.3.2)
Where φ is the standard normal density function and Φ is the standard normal cumulative
distribution function.
In the second step, pooled OLS regression model is applied to estimate relationships between
dividend payout ratio and its determinants by regressing payout ratio on X2i and λi. Where X2i is
the explanatory variables of firm i. The vector X2i contains AGR, MTB, LEV, AST, FCF, INS
and STA. If the IMR is significant, there is a selection bias which is fixed by the two-step
selection approach.
3.6. Findings
In Table 3.8, Panel A presents results of Heckman’s first step probit regression with both year
and industry dummy variables. Consistent with Denis and Osobov (2008); Eugene F. Fama and
French (2001), market-to-book ratio, a measure of investment opportunities, is negatively
related to probability of paying dividends while profitability and firm size have significantly
positive impacts on probability of dividend payments. Firms prefer internal financing to
external financing; therefore, they are less likely to pay dividends when they have more
investment opportunities. In addition, firms with higher profitability are more likely to have
residual cash flows after financing their investment projects; therefore, they are more likely to
distribute dividends. Moreover, larger firms can raise external funds to finance investment
opportunities more easily in capital markets as they are well-establish and have good reputation
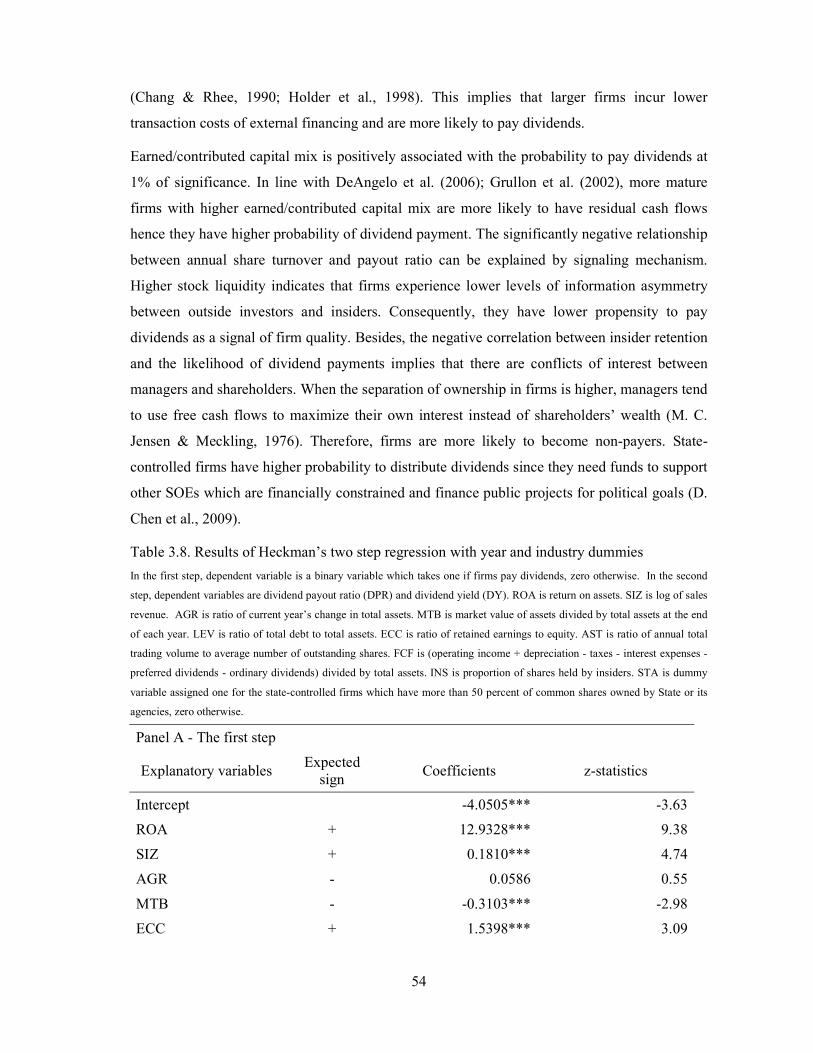
54
(Chang & Rhee, 1990; Holder et al., 1998). This implies that larger firms incur lower
transaction costs of external financing and are more likely to pay dividends.
Earned/contributed capital mix is positively associated with the probability to pay dividends at
1% of significance. In line with DeAngelo et al. (2006); Grullon et al. (2002), more mature
firms with higher earned/contributed capital mix are more likely to have residual cash flows
hence they have higher probability of dividend payment. The significantly negative relationship
between annual share turnover and payout ratio can be explained by signaling mechanism.
Higher stock liquidity indicates that firms experience lower levels of information asymmetry
between outside investors and insiders. Consequently, they have lower propensity to pay
dividends as a signal of firm quality. Besides, the negative correlation between insider retention
and the likelihood of dividend payments implies that there are conflicts of interest between
managers and shareholders. When the separation of ownership in firms is higher, managers tend
to use free cash flows to maximize their own interest instead of shareholders’ wealth (M. C.
Jensen & Meckling, 1976). Therefore, firms are more likely to become non-payers. State-
controlled firms have higher probability to distribute dividends since they need funds to support
other SOEs which are financially constrained and finance public projects for political goals (D.
Chen et al., 2009).
Table 3.8. Results of Heckman’s two step regression with year and industry dummies
In the first step, dependent variable is a binary variable which takes one if firms pay dividends, zero otherwise. In the second
step, dependent variables are dividend payout ratio (DPR) and dividend yield (DY). ROA is return on assets. SIZ is log of sales
revenue. AGR is ratio of current year’s change in total assets. MTB is market value of assets divided by total assets at the end
of each year. LEV is ratio of total debt to total assets. ECC is ratio of retained earnings to equity. AST is ratio of annual total
trading volume to average number of outstanding shares. FCF is (operating income + depreciation - taxes - interest expenses -
preferred dividends - ordinary dividends) divided by total assets. INS is proportion of shares held by insiders. STA is dummy
variable assigned one for the state-controlled firms which have more than 50 percent of common shares owned by State or its
agencies, zero otherwise.
Panel A - The first step
Explanatory variables Expected
sign Coefficients z-statistics
Intercept -4.0505*** -3.63
ROA + 12.9328*** 9.38
SIZ + 0.1810*** 4.74
AGR - 0.0586 0.55
MTB - -0.3103*** -2.98
ECC + 1.5398*** 3.09
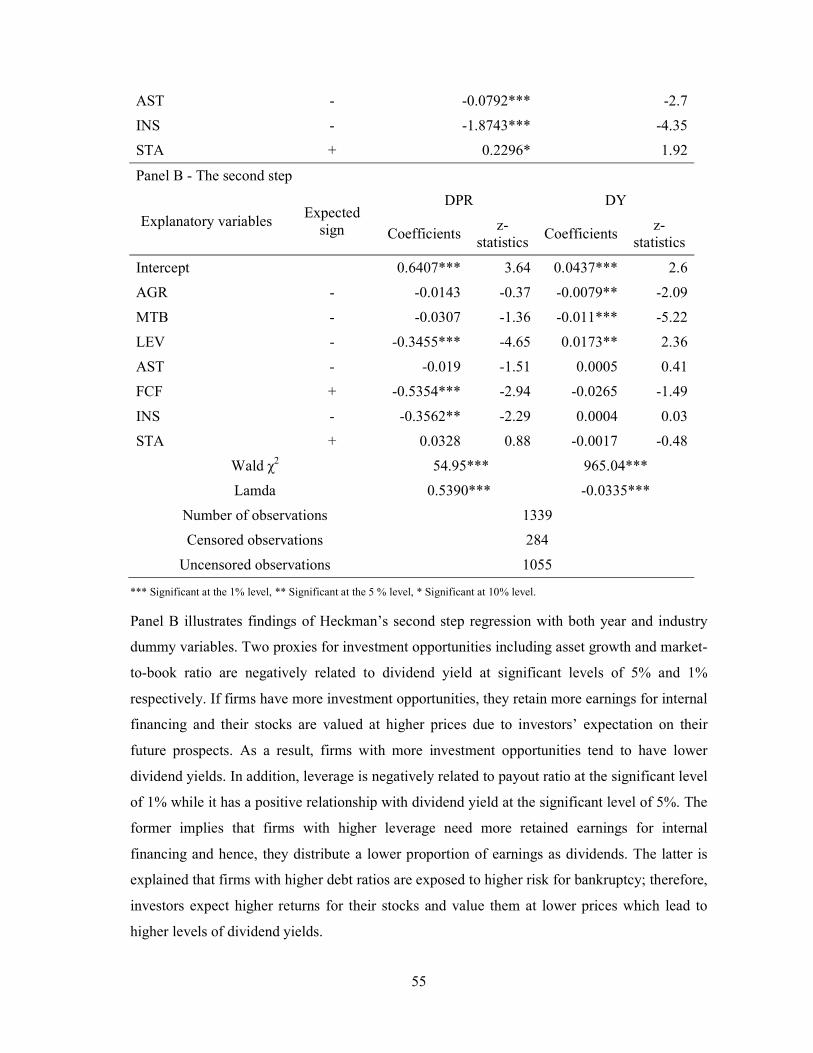
55
AST - -0.0792*** -2.7
INS - -1.8743*** -4.35
STA + 0.2296* 1.92
Panel B - The second step
Explanatory variables Expected
sign
DPR DY
Coefficients z-
statistics Coefficients
z-statistics
Intercept 0.6407*** 3.64 0.0437*** 2.6
AGR - -0.0143 -0.37 -0.0079** -2.09
MTB - -0.0307 -1.36 -0.011*** -5.22
LEV - -0.3455*** -4.65 0.0173** 2.36
AST - -0.019 -1.51 0.0005 0.41
FCF + -0.5354*** -2.94 -0.0265 -1.49
INS - -0.3562** -2.29 0.0004 0.03
STA + 0.0328 0.88 -0.0017 -0.48
Wald χ2 54.95*** 965.04***
Lamda 0.5390*** -0.0335***
Number of observations 1339
Censored observations 284
Uncensored observations 1055
*** Significant at the 1% level, ** Significant at the 5 % level, * Significant at 10% level.
Panel B illustrates findings of Heckman’s second step regression with both year and industry
dummy variables. Two proxies for investment opportunities including asset growth and market-
to-book ratio are negatively related to dividend yield at significant levels of 5% and 1%
respectively. If firms have more investment opportunities, they retain more earnings for internal
financing and their stocks are valued at higher prices due to investors’ expectation on their
future prospects. As a result, firms with more investment opportunities tend to have lower
dividend yields. In addition, leverage is negatively related to payout ratio at the significant level
of 1% while it has a positive relationship with dividend yield at the significant level of 5%. The
former implies that firms with higher leverage need more retained earnings for internal
financing and hence, they distribute a lower proportion of earnings as dividends. The latter is
explained that firms with higher debt ratios are exposed to higher risk for bankruptcy; therefore,
investors expect higher returns for their stocks and value them at lower prices which lead to
higher levels of dividend yields.
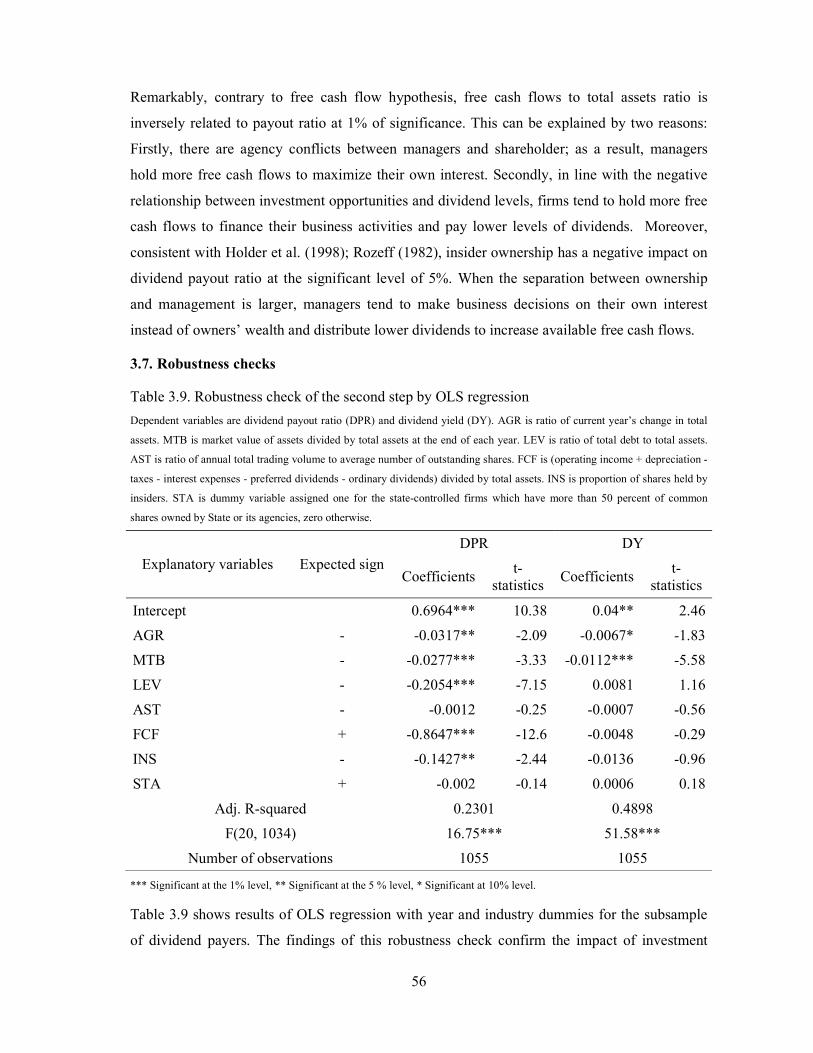
56
Remarkably, contrary to free cash flow hypothesis, free cash flows to total assets ratio is
inversely related to payout ratio at 1% of significance. This can be explained by two reasons:
Firstly, there are agency conflicts between managers and shareholder; as a result, managers
hold more free cash flows to maximize their own interest. Secondly, in line with the negative
relationship between investment opportunities and dividend levels, firms tend to hold more free
cash flows to finance their business activities and pay lower levels of dividends. Moreover,
consistent with Holder et al. (1998); Rozeff (1982), insider ownership has a negative impact on
dividend payout ratio at the significant level of 5%. When the separation between ownership
and management is larger, managers tend to make business decisions on their own interest
instead of owners’ wealth and distribute lower dividends to increase available free cash flows.
3.7. Robustness checks
Table 3.9. Robustness check of the second step by OLS regression
Dependent variables are dividend payout ratio (DPR) and dividend yield (DY). AGR is ratio of current year’s change in total
assets. MTB is market value of assets divided by total assets at the end of each year. LEV is ratio of total debt to total assets.
AST is ratio of annual total trading volume to average number of outstanding shares. FCF is (operating income + depreciation -
taxes - interest expenses - preferred dividends - ordinary dividends) divided by total assets. INS is proportion of shares held by
insiders. STA is dummy variable assigned one for the state-controlled firms which have more than 50 percent of common
shares owned by State or its agencies, zero otherwise.
Explanatory variables Expected sign
DPR DY
Coefficients t-
statistics Coefficients
t-statistics
Intercept 0.6964*** 10.38 0.04** 2.46
AGR - -0.0317** -2.09 -0.0067* -1.83
MTB - -0.0277*** -3.33 -0.0112*** -5.58
LEV - -0.2054*** -7.15 0.0081 1.16
AST - -0.0012 -0.25 -0.0007 -0.56
FCF + -0.8647*** -12.6 -0.0048 -0.29
INS - -0.1427** -2.44 -0.0136 -0.96
STA + -0.002 -0.14 0.0006 0.18
Adj. R-squared 0.2301 0.4898
F(20, 1034) 16.75*** 51.58***
Number of observations 1055 1055
*** Significant at the 1% level, ** Significant at the 5 % level, * Significant at 10% level.
Table 3.9 shows results of OLS regression with year and industry dummies for the subsample
of dividend payers. The findings of this robustness check confirm the impact of investment
57
opportunities and agency problem on dividend levels. However, compared with Heckman’s
second step regression, OLS regression has differences in significant levels of coefficients due
to the presence of selection bias which is indicated by significant IMRs. Asset growth and
market-to-book ratio are negatively related to dividend payout ratio at 5% and 1% of
significance respectively. In addition, asset growth and leverage have lower explanatory power
for dividend yield.
3.8. Conclusion
This study investigates dividend policy with two steps including decisions of paying dividends
and decisions of dividend levels. Heckman’s two-step regression approach is applied to fix the
selection bias caused by censored research data. The first step regression results are consistent
with Eugene F. Fama and French (2001) that firms with higher profitability, larger firm size and
less available investment opportunities have higher likelihood of paying dividends. In addition,
more mature firms with higher retained earnings to equity ratio have higher probability of
paying dividends. Moreover, in line with Banerjee et al. (2007) and Rozeff (1982), firms with
higher stock liquidity and insider ownership have lower likelihood of paying dividends
respectively. State-controlled firms are more likely to pay dividends than non-state-controlled
firms, this implies that they need funds to finance other financially constrained SOEs or public
projects (D. Chen et al., 2009). The second step regression illustrates that firms with higher
asset growth and market-to-book ratio have lower dividend yields. Besides, leverage has
negative and positive impacts on payout ratio and dividend yield respectively. Contrary to free
cash flow hypothesis, free cash flows to total assets ratio is negatively related to payout ratio
which can be explained by agency conflicts between managers and shareholder and firms’
investment opportunities. The agency theory is supported with the negative relationship
between insider ownership and dividend payout ratio. The research findings show the following
implications in Vietnamese stock market: Firstly, investors experience more expropriation by
insiders when insider ownership is higher. Secondly, investors obtain lower levels of dividends
paid as a signal of future prospect in firms which experience lower information asymmetry
between insiders and outsiders. Thirdly, investors of state-controlled corporations have higher
probability to receive dividends than those in firms which are not controlled by state. Besides,
firms with higher investment opportunities, larger size and higher maturity are less likely to pay
dividends.

58
This page is intentionally left blank
59
Chapter 4: NEW EVIDENCE OF DIVIDEND CAPTURE ON THE EX-DIVIDEND DAY
4.1. Introduction
Ex-dividend day anomaly of stock price is one of the most debatable issues in corporate finance
with several theoretical and empirical studies in various institutional environments. Miller and
Modigliani (1961) posit that in a perfect stock market without taxes, transaction costs and risk,
stock prices should drop precisely by dividend amount on the ex-dividend day. However, many
prior studies conducted in both developed and emerging markets show that the price drop is
different from the dividend magnitude. There are three categories of theory on ex-dividend
behavior of stock price. Firstly, tax clientele theory explains the difference between the stock
price drop and the dividend paid only by tax treatment of capital gains to dividends. Secondly,
short-term trading theory argues that tax indifferent arbitrageurs are marginal investors in the
market; therefore, profit opportunities are exploited until the difference between price drop and
dividend amount is equal to transaction costs. Thirdly, market microstructure theories explain
ex-day price behavior with non-tax market frictions including limit order adjustment, price
discreteness and bid-ask bounce. The explanatory power of these microstructure theories
significantly relies on the institutional environment of a stock market.
Although Vietnamese stock market is a small market, it is a promising laboratory to examine
ex-day behavior of stock price because of its institutional environment regarding trading
regulations and tax policy. Firstly, the market uses periodic call auction mechanism for
determining both opening and closing prices and there is no market maker. Secondly, tick size
is much smaller than dividend amount. These imply that market microstructure theories based
on limit order adjustment, price discreteness and bid-ask spread are not applicable explanations.
Thirdly, unlike many markets’ taxation of capital gains and dividends, there is no considerably
preferential treatment of capital gains to dividends. Finally, short-selling is prohibited.
Therefore, tax-induced hypothesis and dividend capture hypothesis are possible to explain the
ex-day behavior of stock price. However, after comparing the observed values of price drop to
dividend ratio and their expected values under the impact of tax policy, we conclude that tax
treatment fails to explain the anomaly in the research frame work and only dividend capture
hypothesis is applicable.
The remainder of this study is presented as follows: Section 2 reviews the extant literature on
ex-dividend day anomaly of stock price. Section 3 discusses the unique characteristics
60
concerning trading regulations and taxation of dividends and capital gains in Vietnamese stock
market. Section 4 demonstrates the research design to investigate the reaction of stock price and
trading volume around the ex-dividend day. Section 5 describes the data collection method and
descriptive statistics. Section 6 shows research findings and implications. Section 7 presents
main conclusions.
4.2. Literature review
Elton and Gruber (1970) initially proposed tax clientele theory stating that ex-day behavior of a
firm’s common stock should be associated with its marginal stockholders’ tax rates. An investor
selling his stocks before the ex-day loses the right of receiving dividends. However, if he holds
them until they go ex-dividend, he should expect to sell them at lower price due to his dividend
retention. This stockholder is indifferent to the time of selling his stocks only if the benefits
from two cases are equal. Accordingly, Elton and Gruber (1970) develop the following
expression:
(Eq.4.1)
Where Pc is stock price on the last cum-day, Pe is expected stock price on the ex‐day, td is the
marginal tax rate on dividends, tg is the marginal tax rate on capital gains and D is the
magnitude of dividend.
Subject to this analysis, the ratio of price drop to dividend (Pc – Pe)/D always reflects the
comparative marginal tax rates on stockholders’ dividends and capital gains. Elton and Gruber
(1970) posit that the relative marginal tax rates can be inferred by studying the stock price drop
to dividend ratio on the ex-dividend day. In their model, marginal investors are long-term
investors whose decisions of buying or selling are irrelevant to dividends.
However, Kalay (1982a) argues that in the absence of the tax clientele effect (i.e. tax rates on
dividends and capital gains are equal), there are investors who are different to the timing of sale
and trade due to dividends. In this case, transaction costs become relevant to the price drop to
dividend ratio. If the expected price drop on the ex-day exceeds the dividend per share by more
than the costs of buying and selling stocks, investors could short-sell their stocks on cum-
dividend days and buy them back when they go ex-dividend to make a profit. On the other
hand, if the expected price drop on the ex-day is less than dividend per share by more than
transaction costs, investors tend to buy stocks on cum-dividend days and sell them on ex-
dividend days to gain a profit. Therefore, a profit is realized only if it is not exploited by
arbitrage activities and the condition of non-profit opportunities is presented as follows:
61
1 – ≤ ≤ 1 + (Eq.4.2)
Where α is expected transactions costs of a round-trip transaction, P = (Pc + Pe)/2.
Eades et al. (1984) the ex-dividend day behavior of stock price on New York Stock Exchange
from July 2nd, 1962 to December 31st, 1980 and find that the preferential treatment of capital
gains to dividends cannot explain completely abnormal returns on ex-dividend days.
Consequently, one cannot infer marginal tax rates on dividends and capital gains from the ratio
of stock price drop to dividend.
Moreover, ex-day stock price behavior is also explained by market microstructure. Based on
Rule 118 of New York Stock Exchange, Dubofsky (1992, 1997) argues that rounding down the
price of existing limit buy orders to a multiple of a tick leads to less-than-one price drop to
dividend ratio on the ex-dividend day. In addition, Frank and Jagannathan (1998) posit that
investors consider dividends as a nuisance due to costs arising from dividend collection whilst
market makers with lower collection costs tend to purchase stocks before ex-dividend days and
resell them on ex-dividend days. Therefore, most trades are conducted at bid prices on cum-
dividend days and at ask prices on ex-dividend days. These bid-ask spreads imply that price
drops on ex-days are lower than dividend amounts. Furthermore, Bali and Hite (1998) argue
that stock price behavior on ex-dividend days is determined by price discreteness. If stock
prices are restricted to discrete ticks and dividends are continuous, dividend amounts are always
rounded down to ticks next to dividends. This adjustment makes in ex-day price drops less than
dividend amounts in most cases. If tick size is larger, price drop ratio will be higher.
4.3. Institutional environment
Vietnam stock market was established in July 2000 with Ho Chi Minh City Stock Exchange
(HSX) and expanded in 2005 with Ha Noi Stock Exchange (HNX). Over the first five years
from 2000 to 2005, financial activities in the market were not remarkable with only about 30
listed stocks; however, since 2006 more firms were listed and the market started to grow
rapidly. In two years of booming, VN-INDEX and HNX-INDEX which are market indices of
HSX and HNX respectively increased dramatically from January 2006 to reach their peaks in
March 2007 and maintain at high levels until the end of 2007 (Figure 4.1). After that, the
market plunged into recession during the year of 2008. Despite a slight recovery in 2009,
Vietnamese stock market continued its downward trend in the two following years. Until
December 31st, 2011 there were 694 firms listed in the market (e.i. 301 firms on HSX and 393
firms on HNX) and their market capitalization is equal to about 21% GDP.
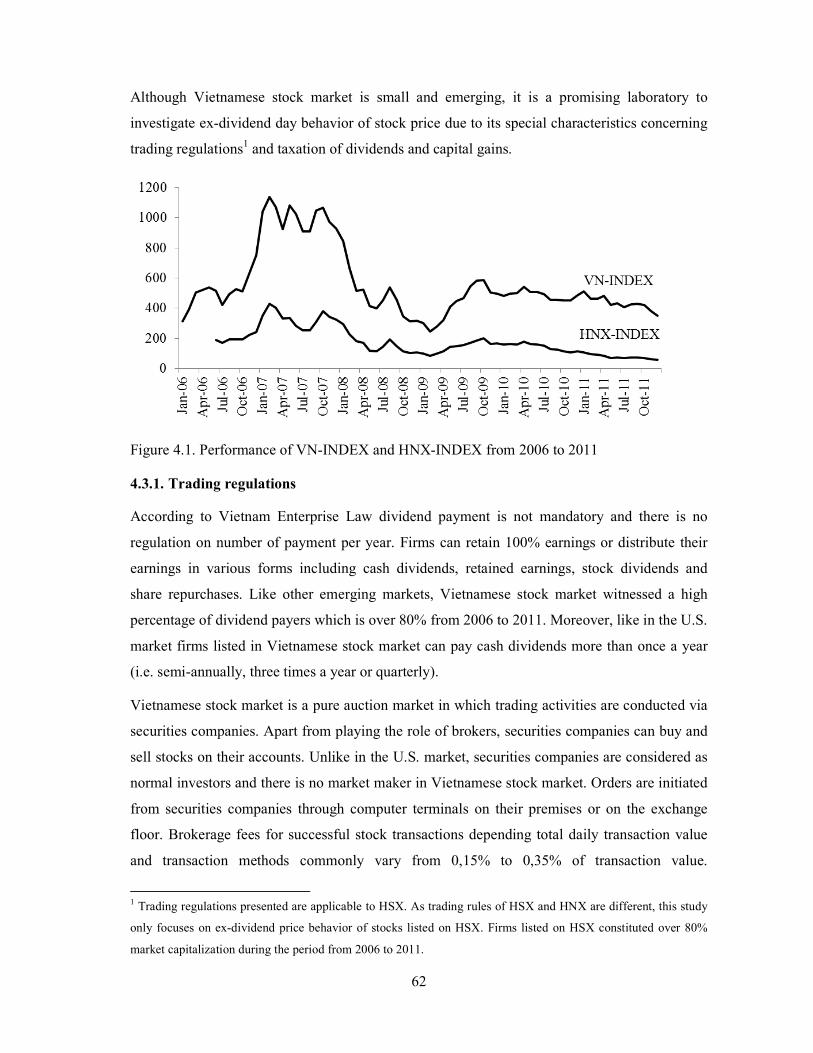
62
Although Vietnamese stock market is small and emerging, it is a promising laboratory to
investigate ex-dividend day behavior of stock price due to its special characteristics concerning
trading regulations1 and taxation of dividends and capital gains.
Figure 4.1. Performance of VN-INDEX and HNX-INDEX from 2006 to 2011
4.3.1. Trading regulations
According to Vietnam Enterprise Law dividend payment is not mandatory and there is no
regulation on number of payment per year. Firms can retain 100% earnings or distribute their
earnings in various forms including cash dividends, retained earnings, stock dividends and
share repurchases. Like other emerging markets, Vietnamese stock market witnessed a high
percentage of dividend payers which is over 80% from 2006 to 2011. Moreover, like in the U.S.
market firms listed in Vietnamese stock market can pay cash dividends more than once a year
(i.e. semi-annually, three times a year or quarterly).
Vietnamese stock market is a pure auction market in which trading activities are conducted via
securities companies. Apart from playing the role of brokers, securities companies can buy and
sell stocks on their accounts. Unlike in the U.S. market, securities companies are considered as
normal investors and there is no market maker in Vietnamese stock market. Orders are initiated
from securities companies through computer terminals on their premises or on the exchange
floor. Brokerage fees for successful stock transactions depending total daily transaction value
and transaction methods commonly vary from 0,15% to 0,35% of transaction value.
1 Trading regulations presented are applicable to HSX. As trading rules of HSX and HNX are different, this study
only focuses on ex-dividend price behavior of stocks listed on HSX. Firms listed on HSX constituted over 80%
market capitalization during the period from 2006 to 2011.
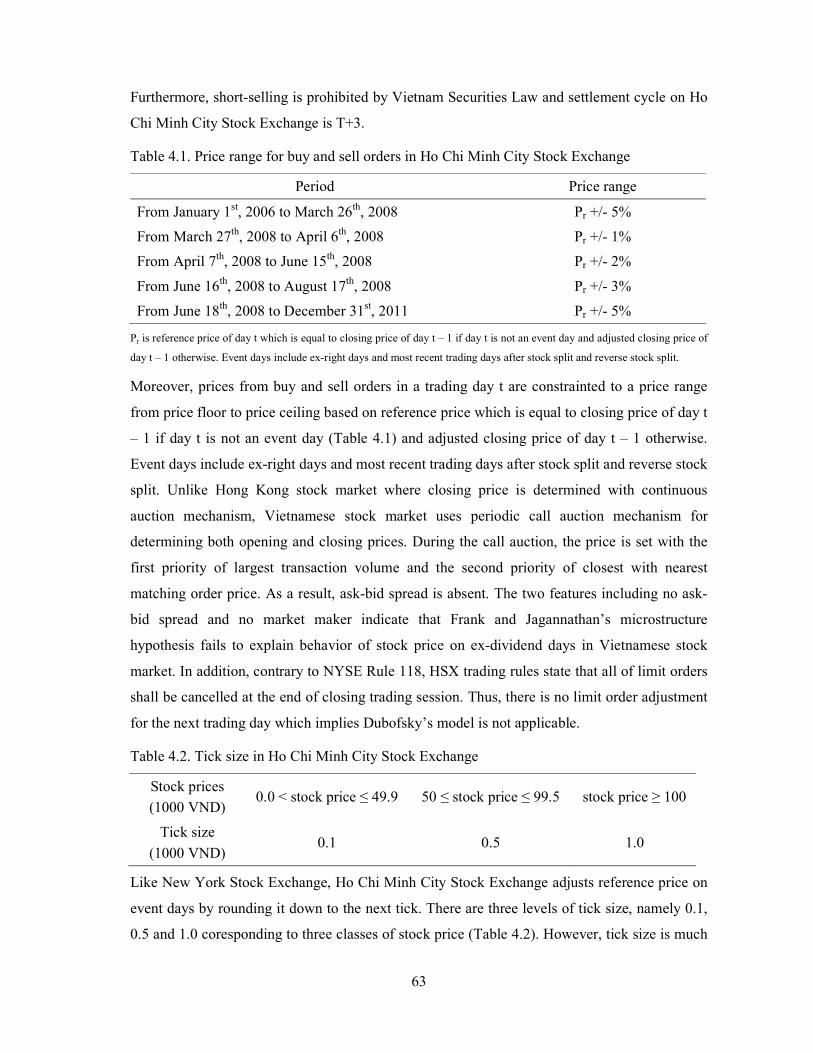
63
Furthermore, short-selling is prohibited by Vietnam Securities Law and settlement cycle on Ho
Chi Minh City Stock Exchange is T+3.
Table 4.1. Price range for buy and sell orders in Ho Chi Minh City Stock Exchange
Period Price range
From January 1st, 2006 to March 26th, 2008 Pr +/- 5%
From March 27th, 2008 to April 6th, 2008 Pr +/- 1%
From April 7th, 2008 to June 15th, 2008 Pr +/- 2%
From June 16th, 2008 to August 17th, 2008 Pr +/- 3%
From June 18th, 2008 to December 31st, 2011 Pr +/- 5%
Pr is reference price of day t which is equal to closing price of day t – 1 if day t is not an event day and adjusted closing price of
day t – 1 otherwise. Event days include ex-right days and most recent trading days after stock split and reverse stock split.
Moreover, prices from buy and sell orders in a trading day t are constrainted to a price range
from price floor to price ceiling based on reference price which is equal to closing price of day t
– 1 if day t is not an event day (Table 4.1) and adjusted closing price of day t – 1 otherwise.
Event days include ex-right days and most recent trading days after stock split and reverse stock
split. Unlike Hong Kong stock market where closing price is determined with continuous
auction mechanism, Vietnamese stock market uses periodic call auction mechanism for
determining both opening and closing prices. During the call auction, the price is set with the
first priority of largest transaction volume and the second priority of closest with nearest
matching order price. As a result, ask-bid spread is absent. The two features including no ask-
bid spread and no market maker indicate that Frank and Jagannathan’s microstructure
hypothesis fails to explain behavior of stock price on ex-dividend days in Vietnamese stock
market. In addition, contrary to NYSE Rule 118, HSX trading rules state that all of limit orders
shall be cancelled at the end of closing trading session. Thus, there is no limit order adjustment
for the next trading day which implies Dubofsky’s model is not applicable.
Table 4.2. Tick size in Ho Chi Minh City Stock Exchange
Stock prices
(1000 VND) 0.0 < stock price ≤ 49.9 50 ≤ stock price ≤ 99.5 stock price ≥ 100
Tick size
(1000 VND) 0.1 0.5 1.0
Like New York Stock Exchange, Ho Chi Minh City Stock Exchange adjusts reference price on
event days by rounding it down to the next tick. There are three levels of tick size, namely 0.1,
0.5 and 1.0 coresponding to three classes of stock price (Table 4.2). However, tick size is much
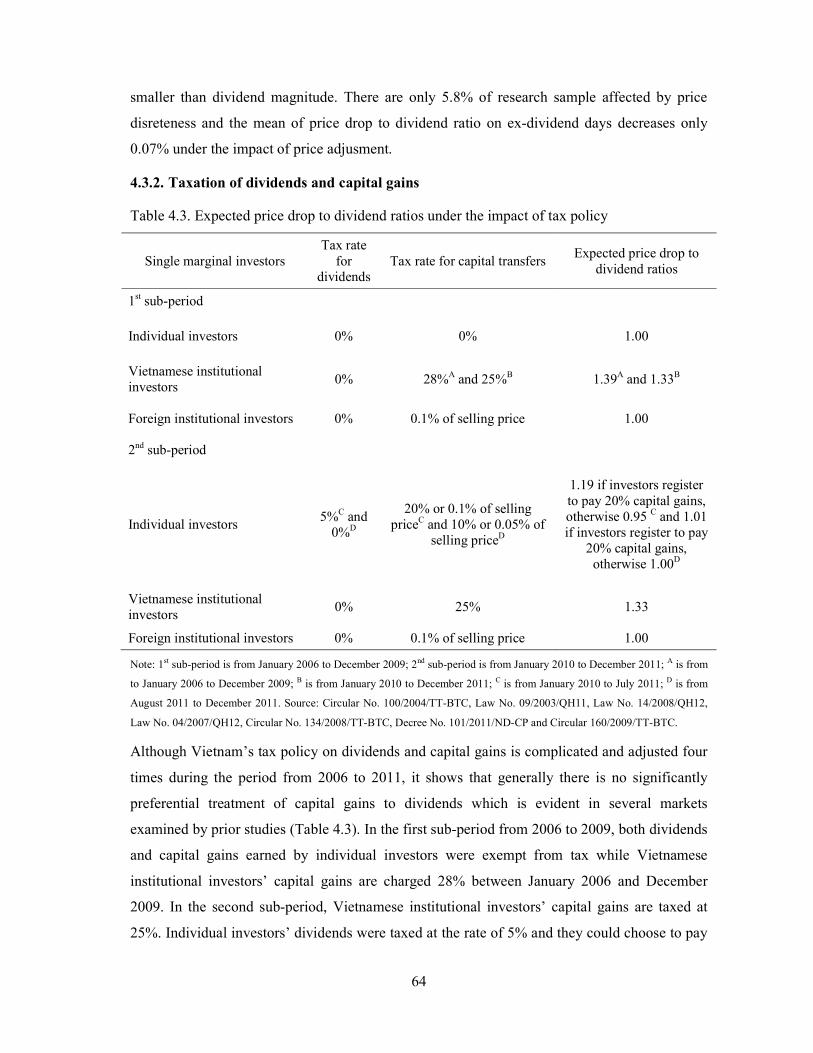
64
smaller than dividend magnitude. There are only 5.8% of research sample affected by price
disreteness and the mean of price drop to dividend ratio on ex-dividend days decreases only
0.07% under the impact of price adjusment.
4.3.2. Taxation of dividends and capital gains
Table 4.3. Expected price drop to dividend ratios under the impact of tax policy
Single marginal investors Tax rate
for dividends
Tax rate for capital transfers Expected price drop to
dividend ratios
1st sub-period
Individual investors 0% 0% 1.00
Vietnamese institutional investors
0% 28%A and 25%B 1.39A and 1.33B
Foreign institutional investors 0% 0.1% of selling price 1.00
2nd sub-period
Individual investors 5%C and
0%D
20% or 0.1% of selling priceC and 10% or 0.05% of
selling priceD
1.19 if investors register to pay 20% capital gains, otherwise 0.95 C and 1.01 if investors register to pay
20% capital gains, otherwise 1.00D
Vietnamese institutional investors
0% 25% 1.33
Foreign institutional investors 0% 0.1% of selling price 1.00
Note: 1st sub-period is from January 2006 to December 2009; 2nd sub-period is from January 2010 to December 2011; A is from
to January 2006 to December 2009; B is from January 2010 to December 2011; C is from January 2010 to July 2011; D is from
August 2011 to December 2011. Source: Circular No. 100/2004/TT-BTC, Law No. 09/2003/QH11, Law No. 14/2008/QH12,
Law No. 04/2007/QH12, Circular No. 134/2008/TT-BTC, Decree No. 101/2011/ND-CP and Circular 160/2009/TT-BTC.
Although Vietnam’s tax policy on dividends and capital gains is complicated and adjusted four
times during the period from 2006 to 2011, it shows that generally there is no significantly
preferential treatment of capital gains to dividends which is evident in several markets
examined by prior studies (Table 4.3). In the first sub-period from 2006 to 2009, both dividends
and capital gains earned by individual investors were exempt from tax while Vietnamese
institutional investors’ capital gains are charged 28% between January 2006 and December
2009. In the second sub-period, Vietnamese institutional investors’ capital gains are taxed at
25%. Individual investors’ dividends were taxed at the rate of 5% and they could choose to pay
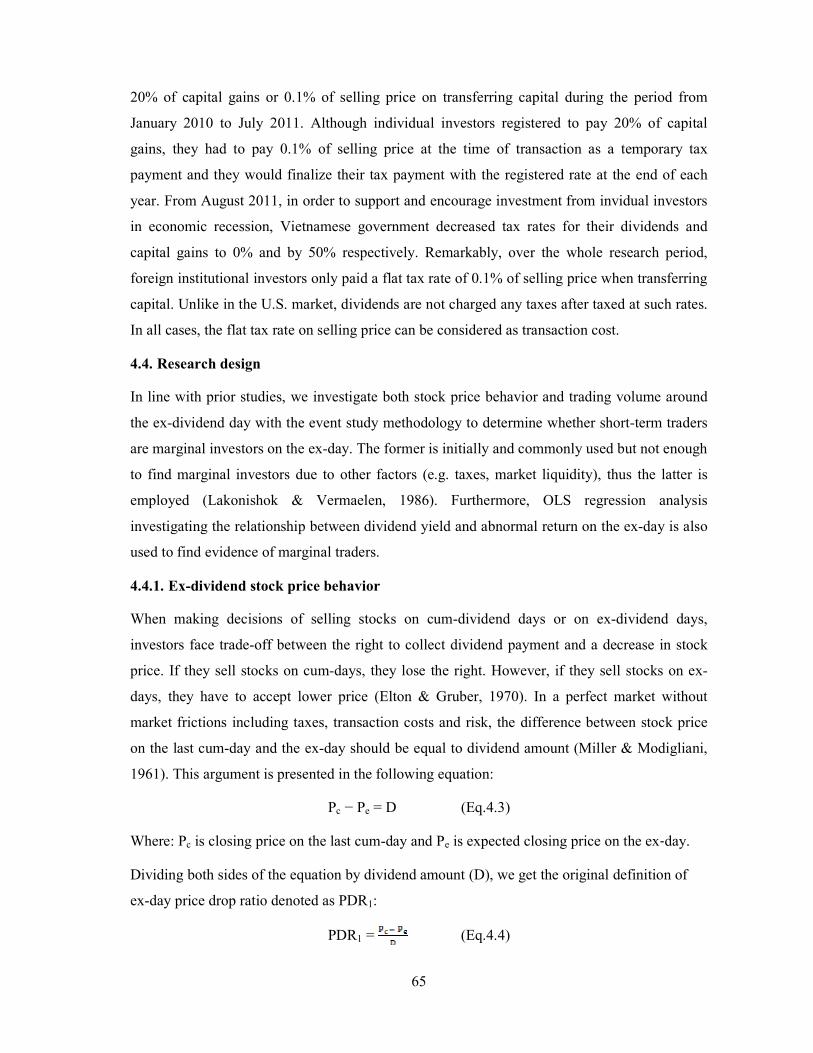
65
20% of capital gains or 0.1% of selling price on transferring capital during the period from
January 2010 to July 2011. Although individual investors registered to pay 20% of capital
gains, they had to pay 0.1% of selling price at the time of transaction as a temporary tax
payment and they would finalize their tax payment with the registered rate at the end of each
year. From August 2011, in order to support and encourage investment from invidual investors
in economic recession, Vietnamese government decreased tax rates for their dividends and
capital gains to 0% and by 50% respectively. Remarkably, over the whole research period,
foreign institutional investors only paid a flat tax rate of 0.1% of selling price when transferring
capital. Unlike in the U.S. market, dividends are not charged any taxes after taxed at such rates.
In all cases, the flat tax rate on selling price can be considered as transaction cost.
4.4. Research design
In line with prior studies, we investigate both stock price behavior and trading volume around
the ex-dividend day with the event study methodology to determine whether short-term traders
are marginal investors on the ex-day. The former is initially and commonly used but not enough
to find marginal investors due to other factors (e.g. taxes, market liquidity), thus the latter is
employed (Lakonishok & Vermaelen, 1986). Furthermore, OLS regression analysis
investigating the relationship between dividend yield and abnormal return on the ex-day is also
used to find evidence of marginal traders.
4.4.1. Ex-dividend stock price behavior
When making decisions of selling stocks on cum-dividend days or on ex-dividend days,
investors face trade-off between the right to collect dividend payment and a decrease in stock
price. If they sell stocks on cum-days, they lose the right. However, if they sell stocks on ex-
days, they have to accept lower price (Elton & Gruber, 1970). In a perfect market without
market frictions including taxes, transaction costs and risk, the difference between stock price
on the last cum-day and the ex-day should be equal to dividend amount (Miller & Modigliani,
1961). This argument is presented in the following equation:
Pc − Pe = D (Eq.4.3)
Where: Pc is closing price on the last cum-day and Pe is expected closing price on the ex‐day.
Dividing both sides of the equation by dividend amount (D), we get the original definition of
ex-day price drop ratio denoted as PDR1:
PDR1 = (Eq.4.4)
66
According to Kalay (1982a); Naranjo et al. (2000), closing price of a stock is significantly
impacted by its daily normal return; therefore, this price should be adjusted. The most
commonly used measure to adjust ex-day closing price in prior studies is daily market return
(Rm). In this study, daily return of VN-INDEX is used as a proxy for daily market return. The
market-adjusted ratio (APDR1) is as follows:
APDR1 = (Eq.4.5)
Moreover, it is more likely that using the price drop to dividend ratio leads to heteroscedasticity
(Boyd & Jagannathan, 1994; Eades et al., 1984; Roni Michaely, 1991). When dividend amount
is used as a deflator, the weight allocated to changes in observations which have low dividends
is extremely large. In line with Milonas et al. (2006), we scale the ex-dividend day price drop
by the stock price on the last cum-day and obtain the new ratio as follows:
PDR2 = (Eq.4.6)
Similarly, market-adjusted price drop is deflated by cum-day price.
APDR2 = (Eq.4.7)
Moreover, following prior studies, we also investigate behavior of stock price around ex-
dividend days with event-study methodology proposed by Brown and Warner (1985). Event
window to examine stock price behavior is 21 days from Day -10 to Day +10 where the ex-day
is considered as Day 0. Abnormal returns (AR) and cumulative abnormal returns (CAR) are
computed based on an estimation window of 120 days starting from Day -130 and ending on
Day -11. Estimation methods include market-adjusted return model and market model where
VN-INDEX is used to measure daily market return.
According to Miller & Modigliani (1961), the price drop is equal to dividend amount in a
perfect market. Therefore, the theoretical value of price drop ratios scaled by dividend amount
is one, theoretical value of those deflated by cum-day price is dividend yield and theoretical
value of abnormal returns is zero. In case the observed value of these measures are no equal to
the theoretical ones, two theories including tax-induced clientele theory and transaction cost
theory can explain behavior of stock price due to the trading regulations of Vietnamese stock
market presented in Section 3.1. Firstly, if the stock price behavior is affected by different
taxation of dividends and capital gains, in consistence with Elton and Gruber’s model illustrated
in Eq.4.2, price drop to dividend ratios with corresponding single marginal investors are
demonstrated in Table 4.3. In addition, although according to Elton and Gruber’s original
67
theory abnormal returns (ARs) on ex-days and cumulative abnormal returns (CARs) in the pre
and the post ex-day period should be constrained to zero, the extensive analysis developed by
Jerry (1980) shows that abnormal returns may be present on and around ex-days. Jerry (1980)
argues that when delaying or advancing a transaction due to tax policy is expensive, investors
charged with high tax rates tend to sell stocks on the last cum-day and buy stocks on the ex-day.
This leads to positive abnormal returns and negative abnormal returns in the pre and the post
ex-dividend periods respectively.
Secondly, if the stock price behavior is impacted by transaction costs, possible marginal
investors whose dividends and capital gains are charged at the same tax rate are individual
investors (except over the period from January 2010 to July 2011) and foreign institutional
investors due to tax policy. Moreover, most arbitrage trading activities are conducted to capture
dividends (i.e. buying shares before ex-days and selling shares after ex-days) since short-selling
is prohibited. This indicates that abnormal returns (ARs) and cumulative abnormal returns
(CARs) are positive over the period before stocks go ex-dividend and negative after stocks go
ex-dividend (Lakonishok & Vermaelen, 1986).
4.4.2. Ex-dividend trading volume behavior
Lakonishok and Vermaelen (1986) posit that examining the reaction of stock price around ex-
dividend days is not applicable to recognize whether ex-dividend day behavior of stock price is
explained by long-term or short-term trading theories. Therefore, they propose using trading
volume as a new evidence to point out marginal investors affecting stock prices on ex-dividend
days. If excessive trading volume is found around ex-dividend days, the stock market is
dominated by short-term traders. However, if abnormal trading volume is found positive before
and on ex-days but negative after ex-days, long-term traders are marginal investors (Jerry,
1980). In line with prior studies, this study uses the methodology of event study to calculate
abnormal trading volume (AV) around ex-days mean-adjusted model (Kato et al., 1995;
Lakonishok & Vermaelen, 1986). Event window is 21 days from Day -10 to Day +10 and
estimation window contains 30 observations from Day -40 to Day -11. Trading volume (%) is
proxied by daily share turnover measured by total trading volume each day divided by number
of shares outstanding.
4.4.3. The relationship between dividend yield and abnormal return
Prior studies show that relationship between dividend yield and abnormal return is also
evidence to clarify whether ex-dividend stock price anomaly is present and which group of
68
investors dominates the market on ex-dividend days (Al-Yahyaee, 2007; Kato et al., 1995; Roni
Michaely, 1996; Naranjo et al., 2000).
Where long-term investors are marginal traders on the ex-day, rearranging Eq.4.1 we calculate
the ex-day return (Re) by the following equation:
Re = = (Eq.4.8)
This equation implies that the relationship between dividend yield and abnormal return
measured by its last term relies on the difference between the tax rate on dividends (td) and the
tax rate on capital gains (tg) with three possible cases. Firstly, if there is no different taxation
between dividends and capital gains, the abnormal return is zero. Secondly, if the difference is
positive, dividend yield is positively correlated to abnormal return. Thirdly, if the difference is
negative, dividend yield is negatively related to abnormal return.
However, determination of the relationship between dividend yield and abnormal return is more
complicated if marginal traders are short-term traders. According to Kalay (1982a), when tax
rates on dividends and capital gains are equal (t0), investors buy stocks on cum-days and sell
them on ex-dividend days to make a profit unless:
(1 – t0)[D – (Pc – Pe) – αP] ≤ 0 (Eq.4.9)
In Vietnamese stock market, t0 is equal to zero, rearranging Eq.4.9 we get:
Re = ≤ ≡ Rc (Eq.4.10)
Where Rc is the maximum ex-day return in line with equilibrium when dividend capture
investors are present.
When dividend capture investors determine the ex-day return, Pe = (1 + Rc)Pc – D. In line with
Karpoff and Walkling (1990), substituting for Pe in Eq.4.10 and differentiating Rc with respect
to dividend yield (D/Pc) we obtain:
= – (Eq.4.11)
Eq.4.11 indicates three cases for the relationship between dividend yield and abnormal return
on the ex-day. Firstly, if α < 1/2, there is a negative relationship between dividend yield and the
value of Rc. Consequently, stocks with higher dividend yields have higher abnormal returns.
Secondly, if α > 1/2, dividend yield is positively related to the value of Rc. This leads to a
negative relationship between dividend yield and abnormal return. Thirdly, if α =1/2, dividend
yield and abnormal return have no association. However, according to Vietnamese institutional
69
environment, the transaction costs include brokerage fees for successful stock varing from
0,15% to 0,35% of transaction value and flat tax rate of selling price (if any). Hence, α is less
than 50%. This indicates that if dividend capture investors are marginal traders on the ex-day,
dividend yield is negatively related to abnormal return on the ex-day.
In consistence with Al-Yahyaee (2007); Dasilas and Leventis (2011); Kato et al. (1995); Roni
Michaely (1996); Naranjo et al. (2000), we develop a regression model to investigate the
relationship between dividend yield and abnormal return while controlling for the effects of
stock liquidity, abnormal trading volume2, firm size and dividend payment frequency. The
regression model is presented as follows:
AR0 = β0 + β1DY + β2AVV + β3AV0 + β4SIZ + β5YEA + β6SEM (Eq.4.12)
Where: AR0 is the abnormal return on the ex-day. DY is dividend yield. AVV is average
trading volume calculated from the estimation window of 30 observations from Day -40 to Day
-11. AV0 is the abnormal trading volume on the ex-day. SIZ is firm size measured by natural
logarithm of market capitalization. YEA is a dummy variable assigned 1 if the dividend is paid
annually, 0 otherwise. SEM is a dummy variable assigned 1 if the dividend is paid semi-
annually, 0 otherwise.
4.5. Research data
4.5.1. Sample selection
Database for this study is provided by Tan Viet Securities Company (www.tvsi.com.vn) and
cross-checked with Stockbiz’s (www.stockbiz.vn). The sample period is from January 1st, 2006
to December 31st, 2011. To avoid bias in the research findings, observations are eliminated
from the research sample if they meet the following criteria:
Observations experiencing events, namely stock splits, stock dividends, share repurchases
and right issues within 21 days from Day -10 to Day +10;
Observations with missing or incomplete information including price data, trading
volume data and dividends;
Observations without transactions for more than 10 days in the estimation period.
2 According to Karpoff and Walkling (1990); Lakonishok and Vermaelen (1986), stocks with higher liquidity tend to have higher abnormal returns if short-term trading activities are present on the ex-dividend day. Thus, in this study we use the average trading volume (AVV) to proxy for stock liquidity. On the other hand, when short-term traders affect the ex-day return, short-term trading exists on and around the ex-day (Dasilas & Leventis, 2011); therefore, abnormal trading volume (AV) tends to have a positive relationship with abnormal return on the ex-day.
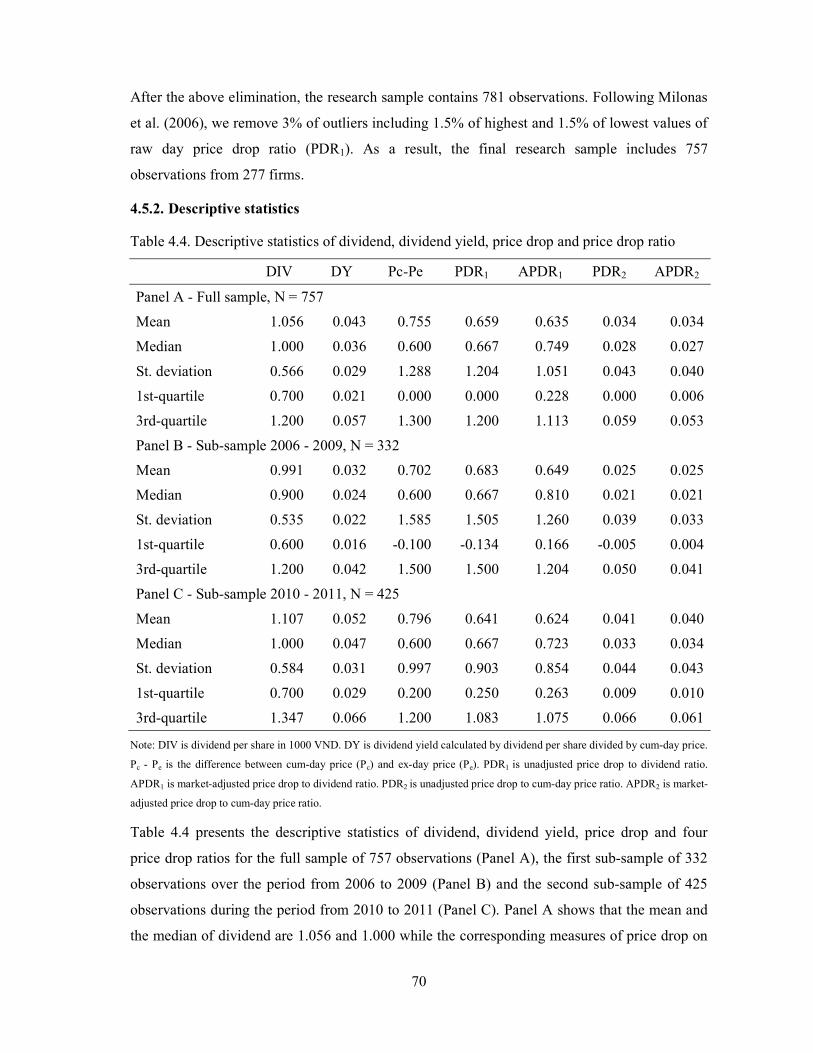
70
After the above elimination, the research sample contains 781 observations. Following Milonas
et al. (2006), we remove 3% of outliers including 1.5% of highest and 1.5% of lowest values of
raw day price drop ratio (PDR1). As a result, the final research sample includes 757
observations from 277 firms.
4.5.2. Descriptive statistics
Table 4.4. Descriptive statistics of dividend, dividend yield, price drop and price drop ratio
DIV DY Pc-Pe PDR1 APDR1 PDR2 APDR2
Panel A - Full sample, N = 757
Mean 1.056 0.043 0.755 0.659 0.635 0.034 0.034
Median 1.000 0.036 0.600 0.667 0.749 0.028 0.027
St. deviation 0.566 0.029 1.288 1.204 1.051 0.043 0.040
1st-quartile 0.700 0.021 0.000 0.000 0.228 0.000 0.006
3rd-quartile 1.200 0.057 1.300 1.200 1.113 0.059 0.053
Panel B - Sub-sample 2006 - 2009, N = 332
Mean 0.991 0.032 0.702 0.683 0.649 0.025 0.025
Median 0.900 0.024 0.600 0.667 0.810 0.021 0.021
St. deviation 0.535 0.022 1.585 1.505 1.260 0.039 0.033
1st-quartile 0.600 0.016 -0.100 -0.134 0.166 -0.005 0.004
3rd-quartile 1.200 0.042 1.500 1.500 1.204 0.050 0.041
Panel C - Sub-sample 2010 - 2011, N = 425
Mean 1.107 0.052 0.796 0.641 0.624 0.041 0.040
Median 1.000 0.047 0.600 0.667 0.723 0.033 0.034
St. deviation 0.584 0.031 0.997 0.903 0.854 0.044 0.043
1st-quartile 0.700 0.029 0.200 0.250 0.263 0.009 0.010
3rd-quartile 1.347 0.066 1.200 1.083 1.075 0.066 0.061
Note: DIV is dividend per share in 1000 VND. DY is dividend yield calculated by dividend per share divided by cum-day price.
Pc - Pe is the difference between cum-day price (Pc) and ex-day price (Pe). PDR1 is unadjusted price drop to dividend ratio.
APDR1 is market-adjusted price drop to dividend ratio. PDR2 is unadjusted price drop to cum-day price ratio. APDR2 is market-
adjusted price drop to cum-day price ratio.
Table 4.4 presents the descriptive statistics of dividend, dividend yield, price drop and four
price drop ratios for the full sample of 757 observations (Panel A), the first sub-sample of 332
observations over the period from 2006 to 2009 (Panel B) and the second sub-sample of 425
observations during the period from 2010 to 2011 (Panel C). Panel A shows that the mean and
the median of dividend are 1.056 and 1.000 while the corresponding measures of price drop on
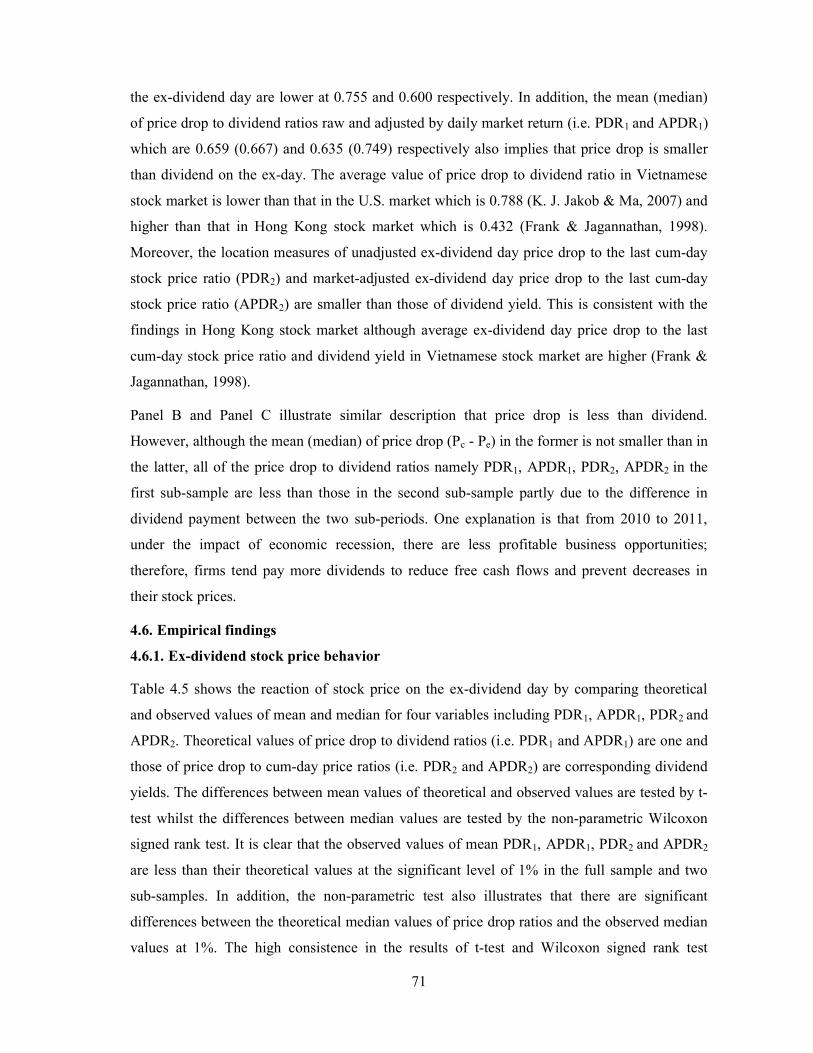
71
the ex-dividend day are lower at 0.755 and 0.600 respectively. In addition, the mean (median)
of price drop to dividend ratios raw and adjusted by daily market return (i.e. PDR1 and APDR1)
which are 0.659 (0.667) and 0.635 (0.749) respectively also implies that price drop is smaller
than dividend on the ex-day. The average value of price drop to dividend ratio in Vietnamese
stock market is lower than that in the U.S. market which is 0.788 (K. J. Jakob & Ma, 2007) and
higher than that in Hong Kong stock market which is 0.432 (Frank & Jagannathan, 1998).
Moreover, the location measures of unadjusted ex-dividend day price drop to the last cum-day
stock price ratio (PDR2) and market-adjusted ex-dividend day price drop to the last cum-day
stock price ratio (APDR2) are smaller than those of dividend yield. This is consistent with the
findings in Hong Kong stock market although average ex-dividend day price drop to the last
cum-day stock price ratio and dividend yield in Vietnamese stock market are higher (Frank &
Jagannathan, 1998).
Panel B and Panel C illustrate similar description that price drop is less than dividend.
However, although the mean (median) of price drop (Pc - Pe) in the former is not smaller than in
the latter, all of the price drop to dividend ratios namely PDR1, APDR1, PDR2, APDR2 in the
first sub-sample are less than those in the second sub-sample partly due to the difference in
dividend payment between the two sub-periods. One explanation is that from 2010 to 2011,
under the impact of economic recession, there are less profitable business opportunities;
therefore, firms tend pay more dividends to reduce free cash flows and prevent decreases in
their stock prices.
4.6. Empirical findings
4.6.1. Ex-dividend stock price behavior
Table 4.5 shows the reaction of stock price on the ex-dividend day by comparing theoretical
and observed values of mean and median for four variables including PDR1, APDR1, PDR2 and
APDR2. Theoretical values of price drop to dividend ratios (i.e. PDR1 and APDR1) are one and
those of price drop to cum-day price ratios (i.e. PDR2 and APDR2) are corresponding dividend
yields. The differences between mean values of theoretical and observed values are tested by t-
test whilst the differences between median values are tested by the non-parametric Wilcoxon
signed rank test. It is clear that the observed values of mean PDR1, APDR1, PDR2 and APDR2
are less than their theoretical values at the significant level of 1% in the full sample and two
sub-samples. In addition, the non-parametric test also illustrates that there are significant
differences between the theoretical median values of price drop ratios and the observed median
values at 1%. The high consistence in the results of t-test and Wilcoxon signed rank test
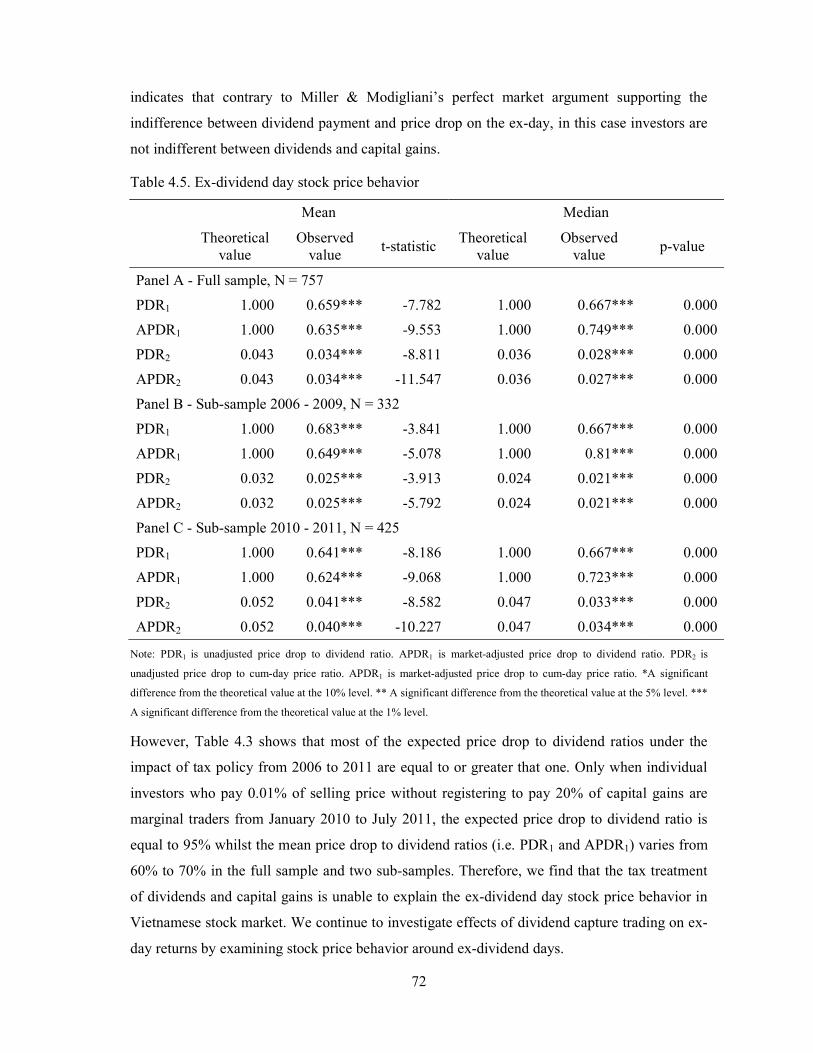
72
indicates that contrary to Miller & Modigliani’s perfect market argument supporting the
indifference between dividend payment and price drop on the ex-day, in this case investors are
not indifferent between dividends and capital gains.
Table 4.5. Ex-dividend day stock price behavior
Mean Median
Theoretical value
Observed value
t-statistic Theoretical
value Observed
value p-value
Panel A - Full sample, N = 757
PDR1 1.000 0.659*** -7.782 1.000 0.667*** 0.000
APDR1 1.000 0.635*** -9.553 1.000 0.749*** 0.000
PDR2 0.043 0.034*** -8.811 0.036 0.028*** 0.000
APDR2 0.043 0.034*** -11.547 0.036 0.027*** 0.000
Panel B - Sub-sample 2006 - 2009, N = 332
PDR1 1.000 0.683*** -3.841 1.000 0.667*** 0.000
APDR1 1.000 0.649*** -5.078 1.000 0.81*** 0.000
PDR2 0.032 0.025*** -3.913 0.024 0.021*** 0.000
APDR2 0.032 0.025*** -5.792 0.024 0.021*** 0.000
Panel C - Sub-sample 2010 - 2011, N = 425
PDR1 1.000 0.641*** -8.186 1.000 0.667*** 0.000
APDR1 1.000 0.624*** -9.068 1.000 0.723*** 0.000
PDR2 0.052 0.041*** -8.582 0.047 0.033*** 0.000
APDR2 0.052 0.040*** -10.227 0.047 0.034*** 0.000
Note: PDR1 is unadjusted price drop to dividend ratio. APDR1 is market-adjusted price drop to dividend ratio. PDR2 is
unadjusted price drop to cum-day price ratio. APDR1 is market-adjusted price drop to cum-day price ratio. *A significant
difference from the theoretical value at the 10% level. ** A significant difference from the theoretical value at the 5% level. ***
A significant difference from the theoretical value at the 1% level.
However, Table 4.3 shows that most of the expected price drop to dividend ratios under the
impact of tax policy from 2006 to 2011 are equal to or greater that one. Only when individual
investors who pay 0.01% of selling price without registering to pay 20% of capital gains are
marginal traders from January 2010 to July 2011, the expected price drop to dividend ratio is
equal to 95% whilst the mean price drop to dividend ratios (i.e. PDR1 and APDR1) varies from
60% to 70% in the full sample and two sub-samples. Therefore, we find that the tax treatment
of dividends and capital gains is unable to explain the ex-dividend day stock price behavior in
Vietnamese stock market. We continue to investigate effects of dividend capture trading on ex-
day returns by examining stock price behavior around ex-dividend days.
73
Table 4.6 presents abnormal returns and cumulative abnormal returns around ex-dividend days
calculated by both market model and mean adjusted model for the full sample and for two sub-
samples. Panel A shows that in the full sample, abnormal returns are significantly positive on
many days in the pre ex-day period and significantly negative on Day +1. In the sub-sample
from 2006 to 2009, abnormal returns are positive at 1% of significance for both models on Day
-5; however, abnormal returns in the post ex-dividend day period are not significantly different
from zero despite their negative average values from Day +1 to Day +8. The sub-sample for the
period between 2010 and 2011 gives similar results as shown in the full sample. Overall, these
findings indicate that abnormal returns are positive before the ex-day and negative after the ex-
day. Moreover, Panel A also illustrates that abnormal returns on the ex-day are highest in the
event period and statistically significant at 1% for two measurement techniques in the full
samples and both sub-samples. These results are in line with the findings presented in Table 4.5
which show that price drop is much lower than dividend payment on the ex-dividend day.
Table 4.6. Abnormal returns (%) and cumulative abnormal returns (%) around ex-dividend day
Day
Full sample (N = 757) Sub-sample 2006 -
2009 (N = 332) Sub-sample 2010 -
2011 (N = 425)
Market model
Mean adjusted
Market model
Mean adjusted
Market model
Mean adjusted
Panel A - Abnormal return (%)
-10 -0.002 -0.005 0.010 0.062 -0.012 -0.057
-9 0.170** 0.215** 0.143 0.157 0.190* 0.261**
-8 0.176* 0.115 0.117 0.057 0.222* 0.161
-7 0.255*** 0.243** 0.198 0.166 0.300*** 0.303**
-6 0.251*** 0.269*** 0.212 0.304* 0.283** 0.242**
-5 0.393*** 0.512*** 0.491*** 0.678*** 0.317*** 0.382***
-4 0.299*** 0.220** 0.287** 0.192 0.308*** 0.242**
-3 0.144 0.163 0.127 0.251 0.157 0.095
-2 0.182** 0.093 0.014 -0.027 0.313*** 0.187
-1 0.014 0.018 -0.128 -0.029 0.125 0.054
0 0.934*** 0.900*** 0.520*** 0.556*** 1.257*** 1.168***
1 -0.176** -0.203* -0.101 -0.085 -0.234** -0.295**
2 -0.058 0.032 -0.108 0.038 -0.019 0.028
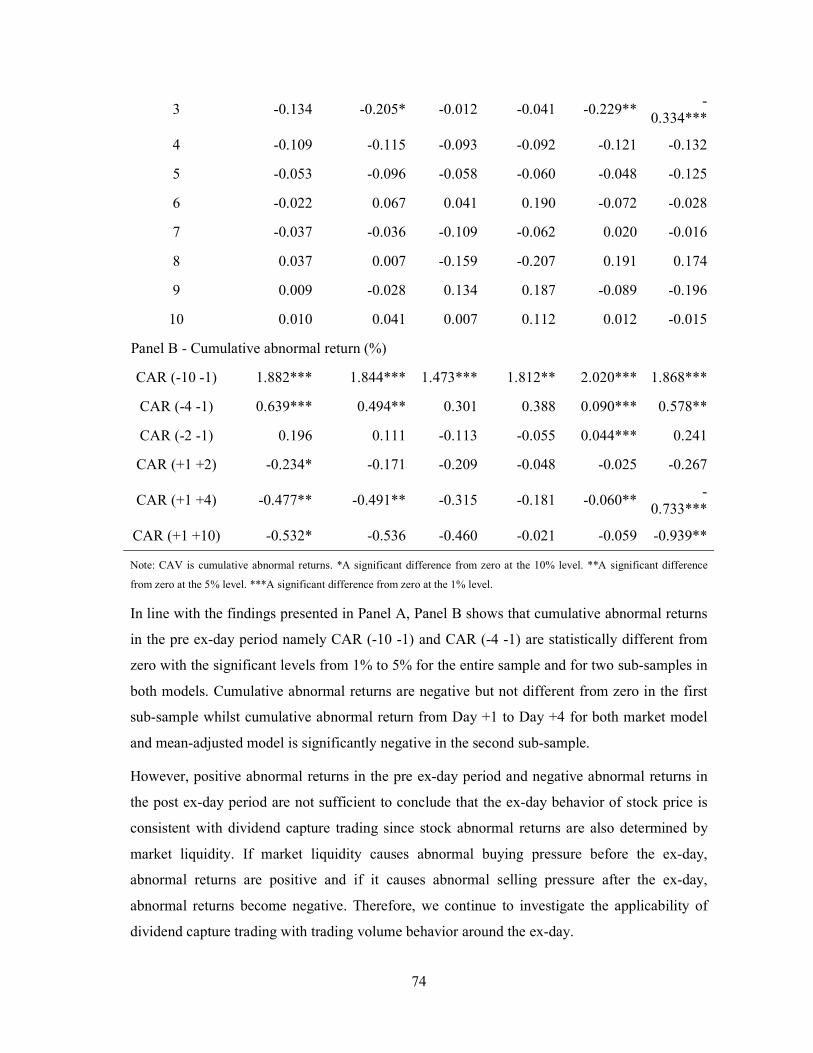
74
3 -0.134 -0.205* -0.012 -0.041 -0.229** -
0.334***
4 -0.109 -0.115 -0.093 -0.092 -0.121 -0.132
5 -0.053 -0.096 -0.058 -0.060 -0.048 -0.125
6 -0.022 0.067 0.041 0.190 -0.072 -0.028
7 -0.037 -0.036 -0.109 -0.062 0.020 -0.016
8 0.037 0.007 -0.159 -0.207 0.191 0.174
9 0.009 -0.028 0.134 0.187 -0.089 -0.196
10 0.010 0.041 0.007 0.112 0.012 -0.015
Panel B - Cumulative abnormal return (%)
CAR (-10 -1) 1.882*** 1.844*** 1.473*** 1.812** 2.020*** 1.868***
CAR (-4 -1) 0.639*** 0.494** 0.301 0.388 0.090*** 0.578**
CAR (-2 -1) 0.196 0.111 -0.113 -0.055 0.044*** 0.241
CAR (+1 +2) -0.234* -0.171 -0.209 -0.048 -0.025 -0.267
CAR (+1 +4) -0.477** -0.491** -0.315 -0.181 -0.060** -
0.733***
CAR (+1 +10) -0.532* -0.536 -0.460 -0.021 -0.059 -0.939**
Note: CAV is cumulative abnormal returns. *A significant difference from zero at the 10% level. **A significant difference
from zero at the 5% level. ***A significant difference from zero at the 1% level.
In line with the findings presented in Panel A, Panel B shows that cumulative abnormal returns
in the pre ex-day period namely CAR (-10 -1) and CAR (-4 -1) are statistically different from
zero with the significant levels from 1% to 5% for the entire sample and for two sub-samples in
both models. Cumulative abnormal returns are negative but not different from zero in the first
sub-sample whilst cumulative abnormal return from Day +1 to Day +4 for both market model
and mean-adjusted model is significantly negative in the second sub-sample.
However, positive abnormal returns in the pre ex-day period and negative abnormal returns in
the post ex-day period are not sufficient to conclude that the ex-day behavior of stock price is
consistent with dividend capture trading since stock abnormal returns are also determined by
market liquidity. If market liquidity causes abnormal buying pressure before the ex-day,
abnormal returns are positive and if it causes abnormal selling pressure after the ex-day,
abnormal returns become negative. Therefore, we continue to investigate the applicability of
dividend capture trading with trading volume behavior around the ex-day.
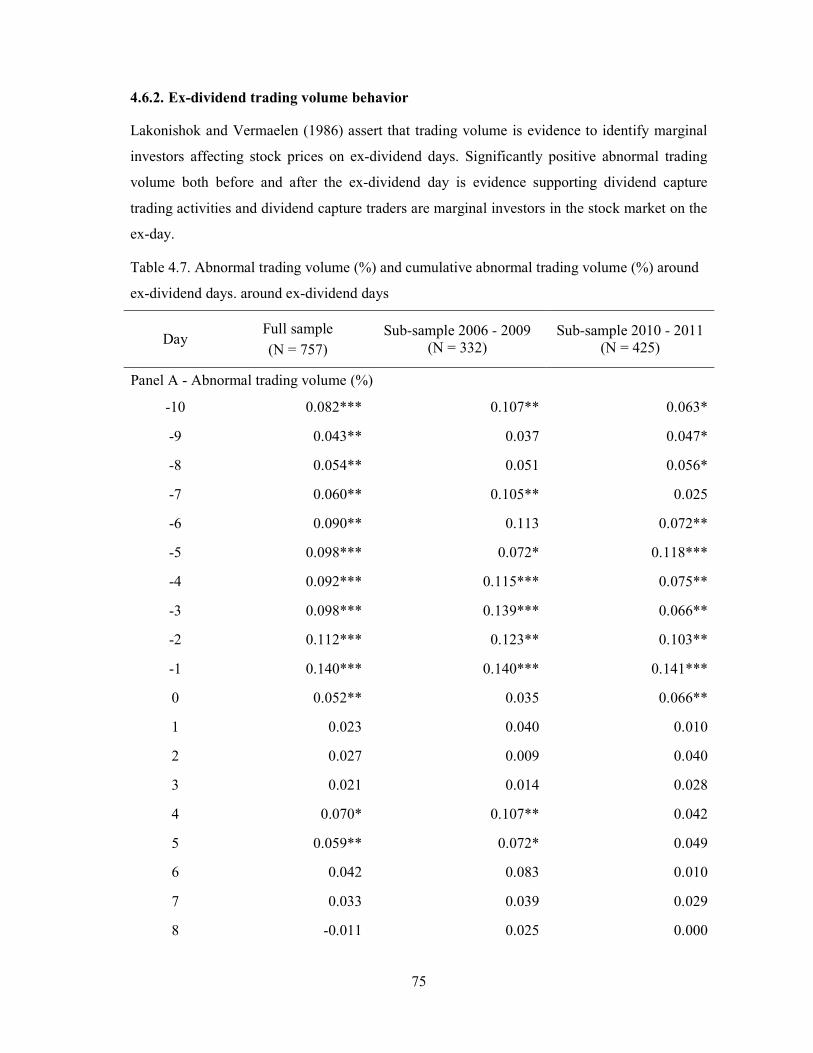
75
4.6.2. Ex-dividend trading volume behavior
Lakonishok and Vermaelen (1986) assert that trading volume is evidence to identify marginal
investors affecting stock prices on ex-dividend days. Significantly positive abnormal trading
volume both before and after the ex-dividend day is evidence supporting dividend capture
trading activities and dividend capture traders are marginal investors in the stock market on the
ex-day.
Table 4.7. Abnormal trading volume (%) and cumulative abnormal trading volume (%) around
ex-dividend days. around ex-dividend days
Day Full sample
(N = 757) Sub-sample 2006 - 2009
(N = 332) Sub-sample 2010 - 2011
(N = 425)
Panel A - Abnormal trading volume (%)
-10 0.082*** 0.107** 0.063*
-9 0.043** 0.037 0.047*
-8 0.054** 0.051 0.056*
-7 0.060** 0.105** 0.025
-6 0.090** 0.113 0.072**
-5 0.098*** 0.072* 0.118***
-4 0.092*** 0.115*** 0.075**
-3 0.098*** 0.139*** 0.066**
-2 0.112*** 0.123** 0.103**
-1 0.140*** 0.140*** 0.141***
0 0.052** 0.035 0.066**
1 0.023 0.040 0.010
2 0.027 0.009 0.040
3 0.021 0.014 0.028
4 0.070* 0.107** 0.042
5 0.059** 0.072* 0.049
6 0.042 0.083 0.010
7 0.033 0.039 0.029
8 -0.011 0.025 0.000
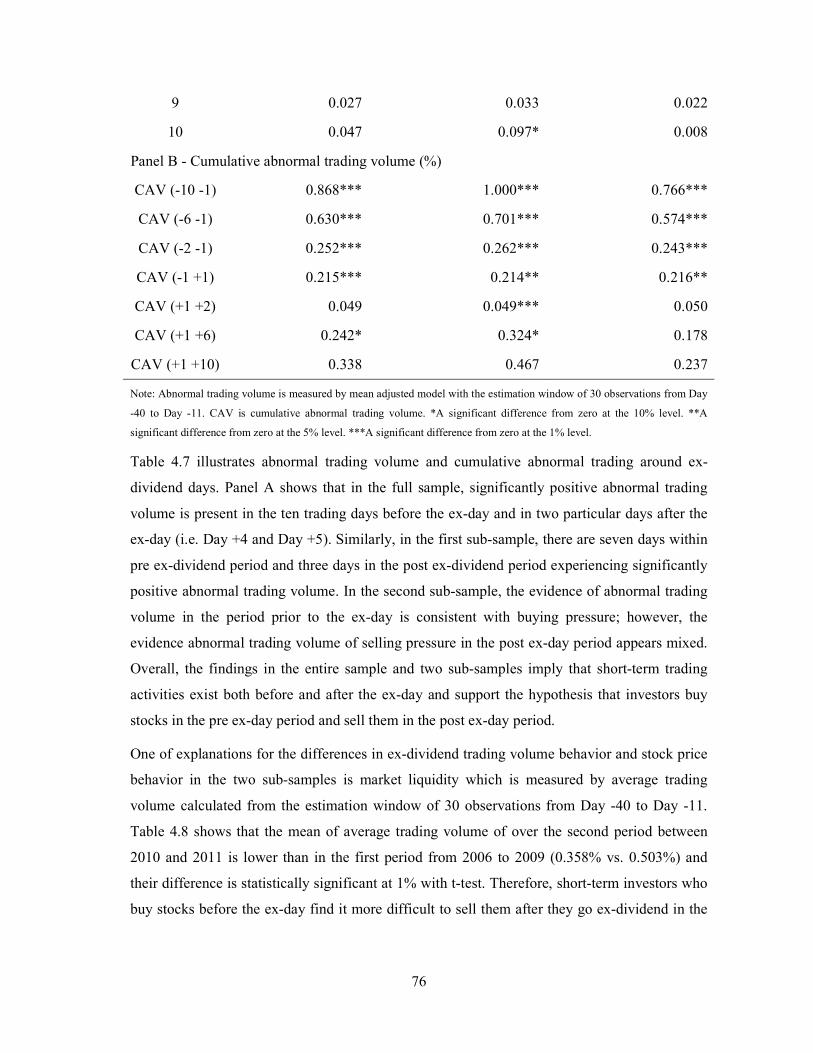
76
9 0.027 0.033 0.022
10 0.047 0.097* 0.008
Panel B - Cumulative abnormal trading volume (%)
CAV (-10 -1) 0.868*** 1.000*** 0.766***
CAV (-6 -1) 0.630*** 0.701*** 0.574***
CAV (-2 -1) 0.252*** 0.262*** 0.243***
CAV (-1 +1) 0.215*** 0.214** 0.216**
CAV (+1 +2) 0.049 0.049*** 0.050
CAV (+1 +6) 0.242* 0.324* 0.178
CAV (+1 +10) 0.338 0.467 0.237
Note: Abnormal trading volume is measured by mean adjusted model with the estimation window of 30 observations from Day
-40 to Day -11. CAV is cumulative abnormal trading volume. *A significant difference from zero at the 10% level. **A
significant difference from zero at the 5% level. ***A significant difference from zero at the 1% level.
Table 4.7 illustrates abnormal trading volume and cumulative abnormal trading around ex-
dividend days. Panel A shows that in the full sample, significantly positive abnormal trading
volume is present in the ten trading days before the ex-day and in two particular days after the
ex-day (i.e. Day +4 and Day +5). Similarly, in the first sub-sample, there are seven days within
pre ex-dividend period and three days in the post ex-dividend period experiencing significantly
positive abnormal trading volume. In the second sub-sample, the evidence of abnormal trading
volume in the period prior to the ex-day is consistent with buying pressure; however, the
evidence abnormal trading volume of selling pressure in the post ex-day period appears mixed.
Overall, the findings in the entire sample and two sub-samples imply that short-term trading
activities exist both before and after the ex-day and support the hypothesis that investors buy
stocks in the pre ex-day period and sell them in the post ex-day period.
One of explanations for the differences in ex-dividend trading volume behavior and stock price
behavior in the two sub-samples is market liquidity which is measured by average trading
volume calculated from the estimation window of 30 observations from Day -40 to Day -11.
Table 4.8 shows that the mean of average trading volume of over the second period between
2010 and 2011 is lower than in the first period from 2006 to 2009 (0.358% vs. 0.503%) and
their difference is statistically significant at 1% with t-test. Therefore, short-term investors who
buy stocks before the ex-day find it more difficult to sell them after they go ex-dividend in the
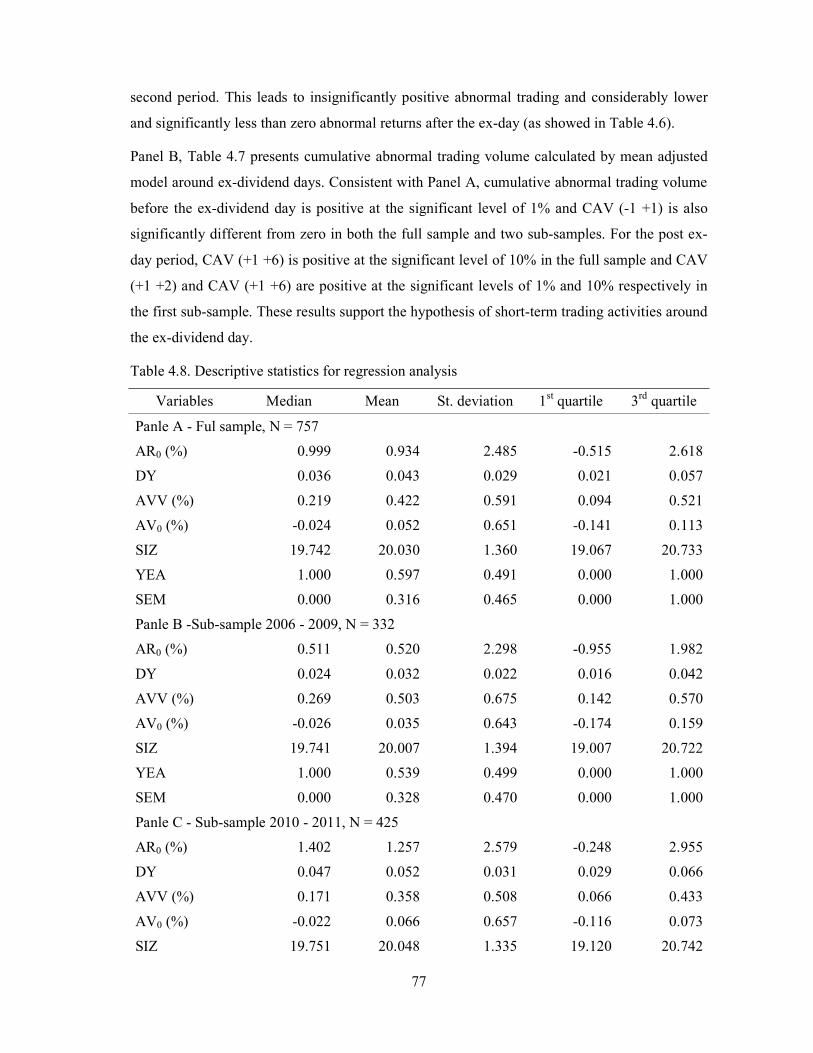
77
second period. This leads to insignificantly positive abnormal trading and considerably lower
and significantly less than zero abnormal returns after the ex-day (as showed in Table 4.6).
Panel B, Table 4.7 presents cumulative abnormal trading volume calculated by mean adjusted
model around ex-dividend days. Consistent with Panel A, cumulative abnormal trading volume
before the ex-dividend day is positive at the significant level of 1% and CAV (-1 +1) is also
significantly different from zero in both the full sample and two sub-samples. For the post ex-
day period, CAV (+1 +6) is positive at the significant level of 10% in the full sample and CAV
(+1 +2) and CAV (+1 +6) are positive at the significant levels of 1% and 10% respectively in
the first sub-sample. These results support the hypothesis of short-term trading activities around
the ex-dividend day.
Table 4.8. Descriptive statistics for regression analysis
Variables Median Mean St. deviation 1st quartile 3rd quartile
Panle A - Ful sample, N = 757
AR0 (%) 0.999 0.934 2.485 -0.515 2.618
DY 0.036 0.043 0.029 0.021 0.057
AVV (%) 0.219 0.422 0.591 0.094 0.521
AV0 (%) -0.024 0.052 0.651 -0.141 0.113
SIZ 19.742 20.030 1.360 19.067 20.733
YEA 1.000 0.597 0.491 0.000 1.000
SEM 0.000 0.316 0.465 0.000 1.000
Panle B -Sub-sample 2006 - 2009, N = 332
AR0 (%) 0.511 0.520 2.298 -0.955 1.982
DY 0.024 0.032 0.022 0.016 0.042
AVV (%) 0.269 0.503 0.675 0.142 0.570
AV0 (%) -0.026 0.035 0.643 -0.174 0.159
SIZ 19.741 20.007 1.394 19.007 20.722
YEA 1.000 0.539 0.499 0.000 1.000
SEM 0.000 0.328 0.470 0.000 1.000
Panle C - Sub-sample 2010 - 2011, N = 425
AR0 (%) 1.402 1.257 2.579 -0.248 2.955
DY 0.047 0.052 0.031 0.029 0.066
AVV (%) 0.171 0.358 0.508 0.066 0.433
AV0 (%) -0.022 0.066 0.657 -0.116 0.073
SIZ 19.751 20.048 1.335 19.120 20.742
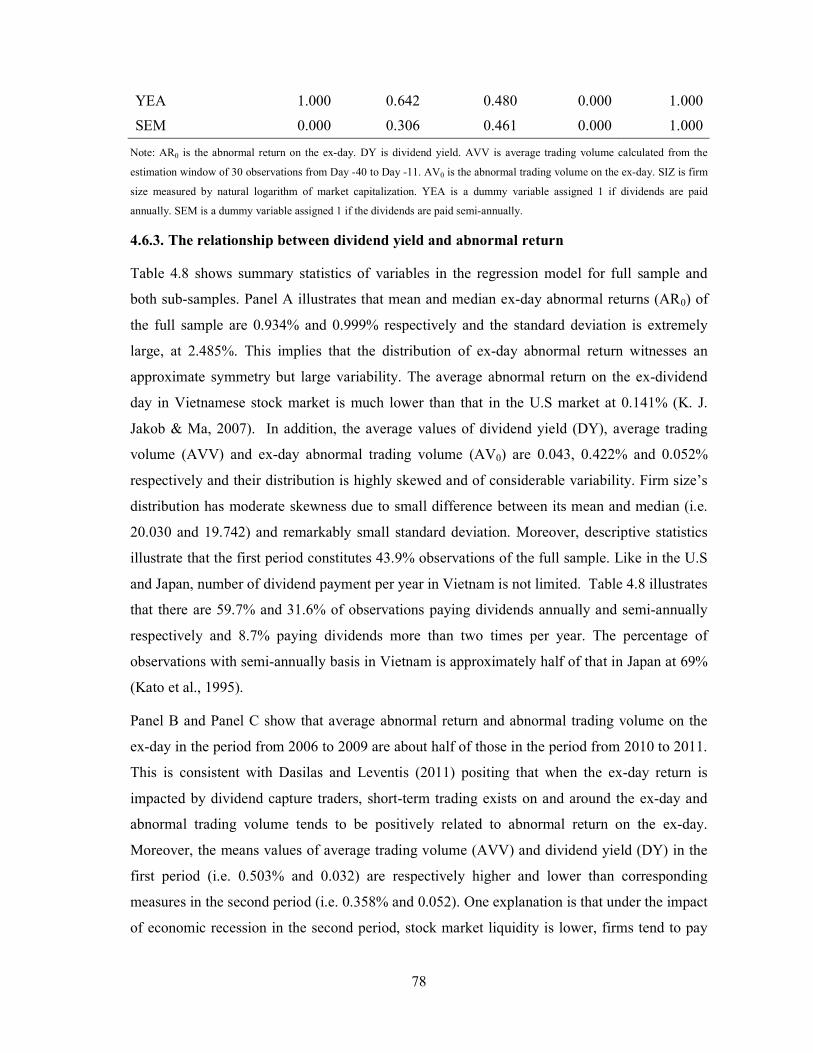
78
YEA 1.000 0.642 0.480 0.000 1.000
SEM 0.000 0.306 0.461 0.000 1.000
Note: AR0 is the abnormal return on the ex-day. DY is dividend yield. AVV is average trading volume calculated from the
estimation window of 30 observations from Day -40 to Day -11. AV0 is the abnormal trading volume on the ex-day. SIZ is firm
size measured by natural logarithm of market capitalization. YEA is a dummy variable assigned 1 if dividends are paid
annually. SEM is a dummy variable assigned 1 if the dividends are paid semi-annually.
4.6.3. The relationship between dividend yield and abnormal return
Table 4.8 shows summary statistics of variables in the regression model for full sample and
both sub-samples. Panel A illustrates that mean and median ex-day abnormal returns (AR0) of
the full sample are 0.934% and 0.999% respectively and the standard deviation is extremely
large, at 2.485%. This implies that the distribution of ex-day abnormal return witnesses an
approximate symmetry but large variability. The average abnormal return on the ex-dividend
day in Vietnamese stock market is much lower than that in the U.S market at 0.141% (K. J.
Jakob & Ma, 2007). In addition, the average values of dividend yield (DY), average trading
volume (AVV) and ex-day abnormal trading volume (AV0) are 0.043, 0.422% and 0.052%
respectively and their distribution is highly skewed and of considerable variability. Firm size’s
distribution has moderate skewness due to small difference between its mean and median (i.e.
20.030 and 19.742) and remarkably small standard deviation. Moreover, descriptive statistics
illustrate that the first period constitutes 43.9% observations of the full sample. Like in the U.S
and Japan, number of dividend payment per year in Vietnam is not limited. Table 4.8 illustrates
that there are 59.7% and 31.6% of observations paying dividends annually and semi-annually
respectively and 8.7% paying dividends more than two times per year. The percentage of
observations with semi-annually basis in Vietnam is approximately half of that in Japan at 69%
(Kato et al., 1995).
Panel B and Panel C show that average abnormal return and abnormal trading volume on the
ex-day in the period from 2006 to 2009 are about half of those in the period from 2010 to 2011.
This is consistent with Dasilas and Leventis (2011) positing that when the ex-day return is
impacted by dividend capture traders, short-term trading exists on and around the ex-day and
abnormal trading volume tends to be positively related to abnormal return on the ex-day.
Moreover, the means values of average trading volume (AVV) and dividend yield (DY) in the
first period (i.e. 0.503% and 0.032) are respectively higher and lower than corresponding
measures in the second period (i.e. 0.358% and 0.052). One explanation is that under the impact
of economic recession in the second period, stock market liquidity is lower, firms tend to pay
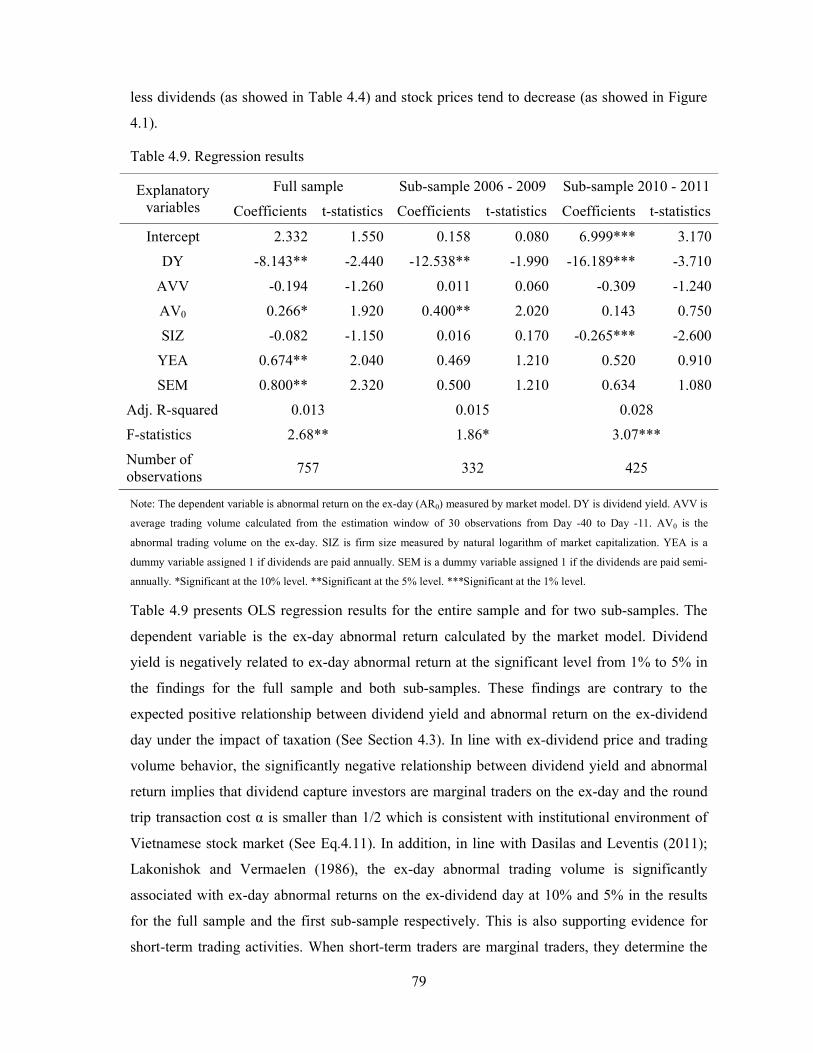
79
less dividends (as showed in Table 4.4) and stock prices tend to decrease (as showed in Figure
4.1).
Table 4.9. Regression results
Explanatory variables
Full sample Sub-sample 2006 - 2009 Sub-sample 2010 - 2011
Coefficients t-statistics Coefficients t-statistics Coefficients t-statistics
Intercept 2.332 1.550 0.158 0.080 6.999*** 3.170
DY -8.143** -2.440 -12.538** -1.990 -16.189*** -3.710
AVV -0.194 -1.260 0.011 0.060 -0.309 -1.240
AV0 0.266* 1.920 0.400** 2.020 0.143 0.750
SIZ -0.082 -1.150 0.016 0.170 -0.265*** -2.600
YEA 0.674** 2.040 0.469 1.210 0.520 0.910
SEM 0.800** 2.320 0.500 1.210 0.634 1.080
Adj. R-squared 0.013 0.015 0.028
F-statistics 2.68** 1.86* 3.07***
Number of observations
757 332 425
Note: The dependent variable is abnormal return on the ex-day (AR0) measured by market model. DY is dividend yield. AVV is
average trading volume calculated from the estimation window of 30 observations from Day -40 to Day -11. AV0 is the
abnormal trading volume on the ex-day. SIZ is firm size measured by natural logarithm of market capitalization. YEA is a
dummy variable assigned 1 if dividends are paid annually. SEM is a dummy variable assigned 1 if the dividends are paid semi-
annually. *Significant at the 10% level. **Significant at the 5% level. ***Significant at the 1% level.
Table 4.9 presents OLS regression results for the entire sample and for two sub-samples. The
dependent variable is the ex-day abnormal return calculated by the market model. Dividend
yield is negatively related to ex-day abnormal return at the significant level from 1% to 5% in
the findings for the full sample and both sub-samples. These findings are contrary to the
expected positive relationship between dividend yield and abnormal return on the ex-dividend
day under the impact of taxation (See Section 4.3). In line with ex-dividend price and trading
volume behavior, the significantly negative relationship between dividend yield and abnormal
return implies that dividend capture investors are marginal traders on the ex-day and the round
trip transaction cost α is smaller than 1/2 which is consistent with institutional environment of
Vietnamese stock market (See Eq.4.11). In addition, in line with Dasilas and Leventis (2011);
Lakonishok and Vermaelen (1986), the ex-day abnormal trading volume is significantly
associated with ex-day abnormal returns on the ex-dividend day at 10% and 5% in the results
for the full sample and the first sub-sample respectively. This is also supporting evidence for
short-term trading activities. When short-term traders are marginal traders, they determine the
80
ex-day return and short-term trading activities concentrate on and around the ex-day. In that
case, higher abnormal trading volume (AV0) results in higher abnormal return on the ex-day.
4.7. Conclusion
This study investigates both abnormal returns and abnormal trading volume around the ex-
dividend day in Vietnamese stock market that appears a promising laboratory due to its trading
regulation and taxation based on the full sample of 757 observations. With the event study
methodology, we are able to determine whether short-term traders are marginal investors in the
ex-day. The findings show that abnormal returns are significantly positive and negative in the
pre and the post ex-dividend day period. In addition, abnormal trading volume is positive before
and after stocks go ex-dividend. These results indicate that investors buy stocks cum-dividend
and sell them ex-dividend to capture dividend payment. Moreover, OLS regression analysis
investigating the relationship between dividend yield and abnormal return on the ex-day is also
used to confirm the impact of short-term traders on the ex-day stock price. The results show
that dividend yield is negatively related to ex-day abnormal return. This implies that dividend
capture traders are marginal investors on the ex-dividend day and the round trip transaction cost
α is smaller than 1/2 which is consistent with the above-mentioned institutional environment.
Furthermore, the positive relationship between abnormal trading volume and abnormal return
on the ex-day is also supporting evidence for short-term trading activities.
81
Chapter 5: SHAREHOLDER RIGHTS, CREDITOR RIGHTS AND DIVIDEND
POLICY: DOES THE GLOBAL FINANCIAL CRISIS MATTER?
5.1. Introduction
The impact of legal protection of shareholders and creditors on corporate financial decisions is
a promising area of interdisciplinary research on law and finance. Supporting evidence of this
impact on dividend policy is reported in the works of La Porta et al. (2000) and Brockman and
Unlu (2009). In this study, we employ the global financial crisis as an exogenous shock to
examine the effects of shareholder and creditor rights on dividend policy.
From the principal-agent relation proposed by M. C. Jensen and Meckling (1976), the agency
theory is developed with two types of agency problems: the problem arising from conflicts
among equity claimants and the problem arising from conflicts between debt and equity
claimants (Brockman & Unlu, 2009). Therefore, there are two types of agency costs including
agency costs of shareholders and agency costs of creditors. La Porta et al. (2000) initially study
the relationship between agency costs of shareholders and dividend policy at country level with
two competing agency models of dividends, namely the outcome model and the substitute
model. The former model predicts that agency costs are lower and more cash dividends are paid
when minority shareholder rights are stronger. In an alternate view, the latter model argues that
dividends are paid as a means to reduce agency costs to earn a reputation of fair treatment of
minority shareholders, hence weaker minority shareholder protection results in higher payout
ratios. La Porta et al. (2000) find that the outcome model is supported empirically. In addition,
Brockman and Unlu (2009) argue that dividend restrictions are a compensation for weak
creditor protection under private credit agreements and they find supporting evidence of the
substitute model based on agency costs of creditors.
This study posits that the global financial crisis is a good opportunity to test the two agency
models of dividends since it leads to increases in both types of agency costs. Under the impact
of a financial crisis, the available return on investment opportunities is lower and firms
experience more external financial constraints. The former is likely to increase agency costs of
equity with more severe expropriation of minority shareholders. The latter is likely to increase
agency costs of debt since firms are less willing and able to earn the reputation of fair treatment
of creditors. Moreover, firms are less willing to meet creditor demand to restrict dividends in
82
the post-crisis period since managers may use dividends to establish a good reputation on their
business activities. This also leads to an increase in agency costs of debt.
We begin the study by examining the differences in the effects of shareholder and creditor
rights on both dividend paying propensity and dividend magnitude across 41 countries between
the pre-crisis period from 2003 to 2007 and the post-crisis period from 2008 to 2012. After firm
characteristics including profitability, cash holdings, firm growth, debt ratio, asset tangibility,
firm size and maturity are controlled, we find that the effects of both shareholder and creditor
rights are weaker in the post-crisis period. These results suggest that both shareholders and
creditors are expropriated more when both types of agency costs are higher. Furthermore,
classifying countries by level of creditor protection and level of shareholder protection and
replicating the regression models for each group of countries, we find that the decline in the
effect of creditor rights (shareholder rights) on dividend policy is greater in the group of
stronger shareholder (creditor) protection. This implies that the extent to which creditors
(shareholders) are more expropriated is larger if shareholders (creditors) are sufficiently
protected. In addition, our additional analyses with various measures of shareholder rights and
creditor rights and additional country-level control variables including financial architecture
and tax advantage of dividends also report consistent findings.
The remaining of this paper is organized as follows: Section 2 presents relevant literature
review and develops research hypotheses, Section 3 shows research methodology, Section 4
reports empirical findings, Section 5 is additional analyses and Section 6 presents conclusions.
5.2. Literature review and research hypotheses
Agency theory is initially developed by Berle and Means (1932) to describe the impact of the
gap between ownership and control on modern companies. M. C. Jensen and Meckling (1976)
define agency relationship as an agreement under which agents perform some service on behalf
of principals and posit that the principal-agent relation leads to agency costs. Later studies
develop the agency model in broad terms with two kinds of interest conflicts: the conflicts of
interest among equity claimants, and the conflicts of interest between equity and debt holders
(Brockman & Unlu, 2009). Accordingly, there are two types of agency costs including agency
costs of equity and agency costs of debt. The agency costs of equity are commonly utilized to
explain incentive problems in corporate dividend policy at firm level. M. C. Jensen (1986) posit
that excessive funds which are available to managers are a source of agency costs. If firms’
cash flow exceeds that required to finance profitable business projects, corporate managers are
motivated to invest in negative net present value projects. Therefore, firms pay cash dividend to
83
mitigate agency costs. Rozeff (1982) argues that corporate governance is a means to reduce
agency costs and firms with strong corporate governance do not need to use dividend payment.
Using a sample of 1000 listed firms in the U.S. from 1974 to 1980 with two variables including
insider ownership and dispersion of ownership to measure agency problems between managers
and shareholders, Rozeff (1982) finds that the former and the latter are negatively and
positively associated with dividend payout ratios respectively. In addition, Holder et al. (1998)
also find that both insider ownership and concentration of ownership have significantly
negative effect on dividend payout ratios with a sample of 477 U.S. firms between 1983 and
1990.
Investigating the impact of minority shareholder rights on dividend policies around the world,
La Porta et al. (2000) develop two opposite agency models including the outcome model and
the substitute model. The former considers dividend payment as an outcome of effective legal
protection of shareholders. When legal protection of shareholders is strong, outsiders use their
legal rights to force insiders to pay dividends. In an alternative view, the substitute model
argues that if firms want to raise external funds with favorable conditions, they must earn a
reputation of fair treatment of shareholders. One way to establish a good reputation is reducing
excessive free cash flow which is available to insiders in the form of dividend payment.
Consequently, weaker minority shareholder protection results in higher payout ratios. Using a
sample of 4,000 companies from 33 countries, La Porta et al. (2000) find that the outcome
model is supported empirically. In addition, P. Jiraporn et al. (2011); Mitton (2004) find
supporting evidence for supporting evidence for the outcome model based on agency cost of
shareholders at firm level in the U.S market and 33 emerging markets. Furthermore, Brockman
and Unlu (2009) extend the line of research at country level with an argument that country-level
creditor protection also affects dividend policies. They claim that beside the reputation-building
mechanism, dividend constraints are also determined by credit contracts. Under a legal regime
of weak creditor protection, creditors tend to have stronger incentives to demand control over
the corporate decision-making process via private credit agreements. Consequently, the two
contracting parties are more likely to agreee on dividend restrictions as a compensation for poor
creditor rights. Using a research sample of 120,507 observations across 52 countries, they find
supporting evidence for the substitute model based on agency costs of debt. After firm
characteristics and shareholder rights are controlled, creditor rights are positively related to both
the likelihood of dividend payment and dividend amounts.
84
This study uses the global financial crisis as an exogenous shock to examine the changes in the
effects of shareholder rights and creditor rights on dividend payout policy. On the one hand, the
financial crisis reduces the available return on investment opportunities and insiders incur lower
marginal costs of diverting resources away from positive net present value investment projects.
Therefore, the expropriation of minority shareholders become more severe and agency costs of
equity tend to increase (Johnson et al., 2000). Lemmon and Lins (2003) examining the impact
of ownership structure on firm value during the East Asian financial crisis and also find that
firms where managers and their families separate their control rights and cash flow ownership
have lower cumulative stock returns than other firms. On the other hand, in the post-crisis
period, firms experience external financial constraints. Campello, Graham, and Harvey (2010)
survey Chief Financial Officers of 1050 firms in the U.S., Europe, and Asia about their
investment plans during the global financial crisis of 2008 and find that firms with more
financial constraints tend to plan deeper cuts in expenditures for technology employment, and
capital. When firms are not able to raise external funds easily, they are not willing to establish a
good reputation; therefore, agency conflicts between shareholders and creditors tend to
increase. Moreover, under the impact of the financial crisis, there are less profitable investment
opportunities and are more likely to use dividends as a means to establish good reputation on
their business activities. As a result, they are less willing to meet creditor demand to restrict
dividends as a substitute for weak creditor rights as suggested by Brockman and Unlu (2009).
This also leads to an increase in agency costs of debt. When both types of agency costs
increase, the outcome model based on agency costs of shareholders and the substitute model
based on agency costs of creditors are hypothesized to become less effective in the post-crisis
period than in the pre-crisis period.
Moreover, Shao et al. (2013) continue to examine the impact of power balance between equity
and debt claimants on the optimal dividend policy around the world with the argument that
optimal dividend policy is obtained when the marginal agency cost of equity is equal to the
marginal agency cost of debt. When creditor rights are stronger, firms have more discretion to
pay dividends as a substitute only if shareholder rights are sufficiently strong that firms are
forced to disgorge free cash flows. Similarly, when shareholder rights are improved, firms tend
to pay more dividends if they have flexibility to change dividend payment under strong creditor
protection. With a sample of 139,168 observations collected from 39 countries from1991 to
2010, their empirical research shows that the substitute model (outcome model) is more
effective when minority shareholders (creditors) are strongly protected. In this paper, we
85
develop an argument of this balancing strategy under the impact of the financial global crisis as
follows: When agency problems become more severe, ceteris paribus, firms are more likely to
decrease dividends paid as the substitute for weak creditor rights if minority shareholders are
strongly protected by laws. However, if creditor rights are strong, ceteris paribus, they tend to
decrease more dividends. As a result, we hypothesize that the decline in the effect of the
substitute model (outcome model) is greater when legal protection of shareholders (creditors) is
stronger.
5.3. Methodology
5.3.1. Research model
Following Brockman and Unlu (2009); Shao et al. (2013), we use logit and tobit regression
models for the likelihood of paying dividends and dividend payout ratios respectively. To
investigate the differences in the effects of shareholder and creditor rights on dividend policy
across countries between the pre-crisis period 2003 - 2007 and the post-crisis period 2008 -
2012, we add interactive terms between each independent variable and the period dummy
variable (PER) to both regression models. The period dummy variable takes the value of 1 for
the post-crisis period and 0 otherwise. If the effects of shareholder and creditor protection on
dividend policy are identical between the two periods, their interactive terms’ coefficients are
statistically insignificant.
The likelihood to pay dividends is a logit function as follows:
PAY = α + β1PRO + γ1PRO*PER + β2CAS + γ2CAS*PER + β3GRO + γ3GRO*PER + β4DEB
+ γ4DEB*PER + β5TAN + γ5TAN*PER + β6SIZ + γ6SIZ*PER + β7ASD + γ7ASD*PER +
β8CRE + γ8CRE*PER + β9LAW + γ9LAW*PER + δPER + ε (Eq.5.1)
Where: PAY is 1 if firms pay dividends and 0 otherwise. Firm-level variables employed in this
research are found to affect corporate dividend policy in many prior studies (Brockman & Unlu,
2009; DeAngelo et al., 2006; Eugene F. Fama & French, 2001; Shao et al., 2013): (1)
profitability (PRO) is net income divided by total assets, (2) cash holdings (CAS) are measured
by cash balance divided by total assets, (3) firm growth (GRO) is the ratio of current year's
change in total assets, (4) debt ratio (DEB) is the ratio of long-term debt to total assets, (5) asset
tangibility (TAN) is net property, plant and equipment scaled by total assets, (6) firm size (SIZ)
is the natural logarithm of total assets measured in U.S. dollars, and (7) firm maturity (RET) is
retained earnings to assets. Country-level variables include shareholder rights, creditor rights
and a legal origin dummy. The shareholder rights are proxied by the anti-self-dealing index
86
(ASD) from Djankov et al. (2008). The anti-self-dealing index is measured by the first principal
component of factors focusing on the strength of minority shareholder protection against the
controlling shareholder’s self-dealing (i.e. disclosure, approval, and litigation); therefore, it
represents the pressure of disgorging cash on insiders (Shao et al., 2013). The creditor rights are
proxied by the revised creditor right aggregate score (CRE) from Djankov et al. (2007). The
legal origin dummy (LAW) takes 1 for civil law countries and 0 for common law countries.
The dividend payout ratio is a tobit function as follows:
DSA = α + β1PRO + γ1PRO*PER + β2CAS + γ2CAS*PER + β3GRO + γ3GRO*PER + β4DEB
+ γ4DEB*PER + β5TAN + γ5TAN*PER + β6SIZ + γ6SIZ*PER + β7ASD + γ7ASD*PER +
β8CRE + γ8CRE*PER + β9LAW + γ9LAW*PER + δPER + ε (Eq.5.2)
Where: DSA is measured by total cash dividends scaled by sales (Brockman & Unlu, 2009;
Shao et al., 2013). Sales are used instead of earnings as a deflator due to two reasons: Firstly,
dividends to earnings ratio is not stable when earnings are low (Aivazian et al., 2003).
Secondly, earnings management is various across countries under the impact of the strength of
investor protection (Leuz, Nanda, & Wysocki, 2003). The core research findings persist with
other measures of dividend payout ratio including dividends to earnings and dividends to total
assets.
Furthermore, to examine the differences in the effects of creditor rights (shareholder rights) on
dividend policy between the pre- and post-crisis periods by level of shareholder rights (creditor
rights), in line with Shao et al. (2013) we replicate the regression models without the legal
origin dummy and its interaction for two couples of sub-samples: (1) weak shareholder
protection and strong shareholder protection; (2) weak creditor protection and strong creditor
protection) and compare the interactive terms’ coefficients in each couple. Countries with
shareholder protection indices lower than or equal to the median are of weak shareholder
protection, the others are of strong shareholder protection. Countries with creditor protection
indices lower than the median are of weak shareholder protection, the others are of strong
creditor protection.
All regression models include industry dummies, interactive terms between each industry
dummy and the crisis period dummy to control industry effects. They are also clustered by firm
to control within-firm correlated residuals. The expected signs for these firm-specific variables
87
are as follows: PRO (+), CAS (+/-)3, GRO (-), DEB (+/-), TAN (+), SIZ (+) and RET (+).
Dividends to sales (DSA) and all firm-level variables are winsorized at 5%.4
5.3.2. Data sources and sample selection
To construct the research sample, we collect annual financial and accounting information from
Compustat Global and Compustat North America for firms incorporated in countries covered in
La Porta, Lopez-De-Silanes, and Shleifer (2006). Then, we eliminate firm-year observations
meeting the criteria as follows: (1) firms incorporated in countries with mandatory dividend
payment, namely Brazil, Chile, Colombia, Greece, and Venezuela (La Porta et al., 2000), (2)
firms in utilities industry (SIC codes 4900-4999) and financial sector (SIC codes 6000-6999)
(Eugene F. Fama & French, 2001), (3) firms with multiple issues of common stocks (Ferris et
al., 2009), (4) firms with unconsolidated financial statements (Mahajan & Tartaroglu, 2008), (5)
firm-years with missing or incomplete information, (6) firm-years with abnormal data for
subsequent analysis including negative net income, negative book equity, negative total assets
and dividends greater than total assets. The final sample contains 133,279 firm-year
observations from to 23,962 firms incorporated in 41 countries during the period from 2003 to
2012.
5.4. Empirical results
5.4.1. Summary statistics
Table 5.1 presents summary of descriptive statistics of the research sample including firm level
data, annual number of observations, industry distribution and country-level data. Panel A
shows that paying firms constitute a large proportion in the full sample with 65.79%. The
paying proportion in the research sample is slightly higher than 64.4% in Brockman and Unlu
(2009) and lower than 67.3% in Shao et al. (2013). The two sub-samples for the pre- and post-
crisis periods contain similar number of firm-year observations (i.e. 66,996 and 66,283). In
addition, the post-crisis period experiences lower profitability, firm growth and debt ratio and
higher retained earnings and cash holdings than the pre-crisis period. This is consistent with the
arguement that the global financial crisis reduces investment opportunities and the availability
3 According to DeAngelo et al. (2006), the expected sign of cash holdings is ambiguous. Cash holding are high due
to two causes including accumulated cash flows and the need to invest in future business opportunities. The former
leads to high dividends but the latter results in low dividends. 4 We also replicate the research with the sample winsorized at 3% and 10% and find that the statistical and
economic significance of core variables is similar to the sample of 5% winsorization. This indicates that outliers
fail to affect the research findings significantly.
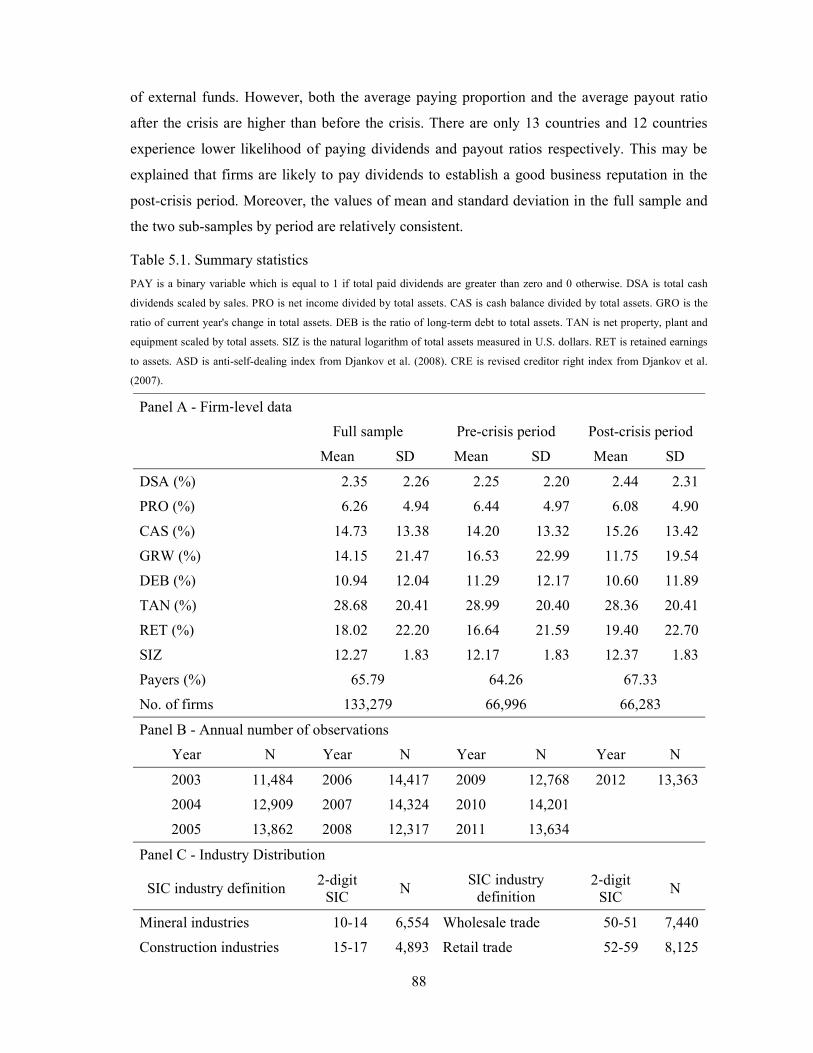
88
of external funds. However, both the average paying proportion and the average payout ratio
after the crisis are higher than before the crisis. There are only 13 countries and 12 countries
experience lower likelihood of paying dividends and payout ratios respectively. This may be
explained that firms are likely to pay dividends to establish a good business reputation in the
post-crisis period. Moreover, the values of mean and standard deviation in the full sample and
the two sub-samples by period are relatively consistent.
Table 5.1. Summary statistics
PAY is a binary variable which is equal to 1 if total paid dividends are greater than zero and 0 otherwise. DSA is total cash
dividends scaled by sales. PRO is net income divided by total assets. CAS is cash balance divided by total assets. GRO is the
ratio of current year's change in total assets. DEB is the ratio of long-term debt to total assets. TAN is net property, plant and
equipment scaled by total assets. SIZ is the natural logarithm of total assets measured in U.S. dollars. RET is retained earnings
to assets. ASD is anti-self-dealing index from Djankov et al. (2008). CRE is revised creditor right index from Djankov et al.
(2007).
Panel A - Firm‐level data
Full sample Pre-crisis period Post-crisis period
Mean SD Mean SD Mean SD
DSA (%) 2.35 2.26 2.25 2.20 2.44 2.31
PRO (%) 6.26 4.94 6.44 4.97 6.08 4.90
CAS (%) 14.73 13.38 14.20 13.32 15.26 13.42
GRW (%) 14.15 21.47 16.53 22.99 11.75 19.54
DEB (%) 10.94 12.04 11.29 12.17 10.60 11.89
TAN (%) 28.68 20.41 28.99 20.40 28.36 20.41
RET (%) 18.02 22.20 16.64 21.59 19.40 22.70
SIZ 12.27 1.83 12.17 1.83 12.37 1.83
Payers (%) 65.79 64.26 67.33
No. of firms 133,279 66,996 66,283
Panel B - Annual number of observations
Year N Year N Year N Year N
2003 11,484 2006 14,417 2009 12,768 2012 13,363
2004 12,909 2007 14,324 2010 14,201
2005 13,862 2008 12,317 2011 13,634
Panel C - Industry Distribution
SIC industry definition 2‐digit
SIC N
SIC industry definition
2‐digit SIC
N
Mineral industries 10-14 6,554 Wholesale trade 50-51 7,440
Construction industries 15-17 4,893 Retail trade 52-59 8,125
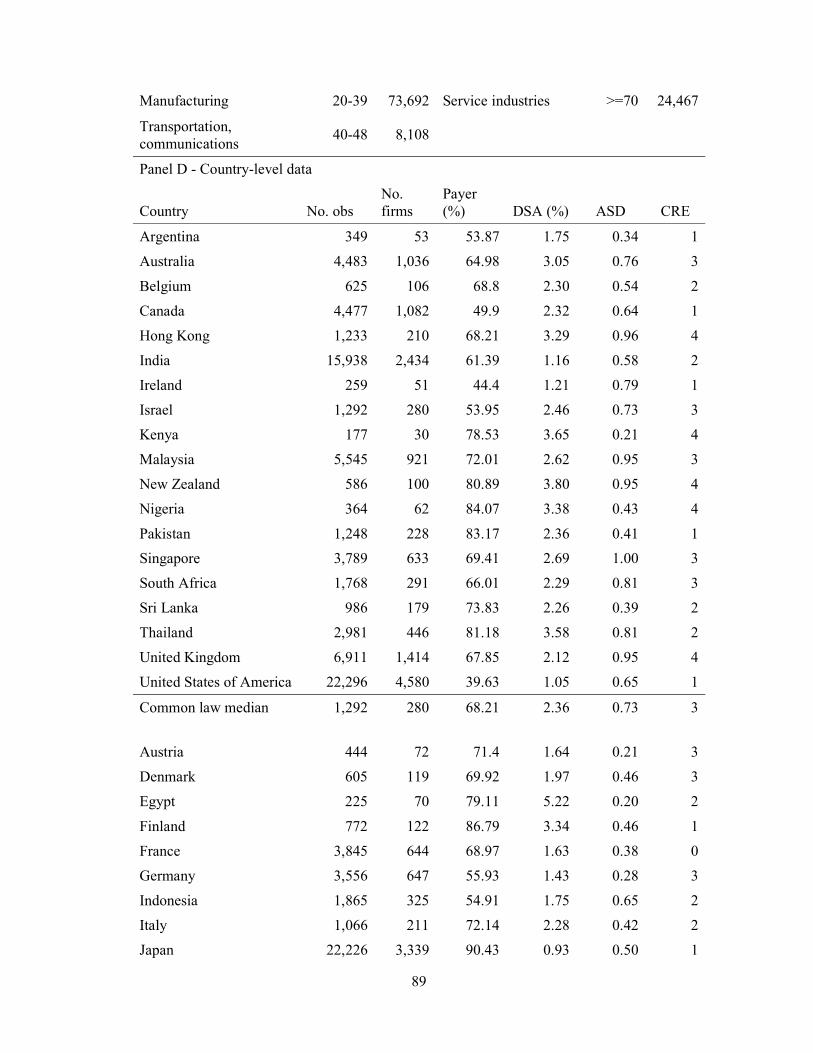
89
Manufacturing 20-39 73,692 Service industries >=70 24,467
Transportation, communications
40-48 8,108
Panel D - Country-level data
Country No. obs No. firms
Payer (%) DSA (%) ASD CRE
Argentina 349 53 53.87 1.75 0.34 1
Australia 4,483 1,036 64.98 3.05 0.76 3
Belgium 625 106 68.8 2.30 0.54 2
Canada 4,477 1,082 49.9 2.32 0.64 1
Hong Kong 1,233 210 68.21 3.29 0.96 4
India 15,938 2,434 61.39 1.16 0.58 2
Ireland 259 51 44.4 1.21 0.79 1
Israel 1,292 280 53.95 2.46 0.73 3
Kenya 177 30 78.53 3.65 0.21 4
Malaysia 5,545 921 72.01 2.62 0.95 3
New Zealand 586 100 80.89 3.80 0.95 4
Nigeria 364 62 84.07 3.38 0.43 4
Pakistan 1,248 228 83.17 2.36 0.41 1
Singapore 3,789 633 69.41 2.69 1.00 3
South Africa 1,768 291 66.01 2.29 0.81 3
Sri Lanka 986 179 73.83 2.26 0.39 2
Thailand 2,981 446 81.18 3.58 0.81 2
United Kingdom 6,911 1,414 67.85 2.12 0.95 4
United States of America 22,296 4,580 39.63 1.05 0.65 1
Common law median 1,292 280 68.21 2.36 0.73 3
Austria 444 72 71.4 1.64 0.21 3
Denmark 605 119 69.92 1.97 0.46 3
Egypt 225 70 79.11 5.22 0.20 2
Finland 772 122 86.79 3.34 0.46 1
France 3,845 644 68.97 1.63 0.38 0
Germany 3,556 647 55.93 1.43 0.28 3
Indonesia 1,865 325 54.91 1.75 0.65 2
Italy 1,066 211 72.14 2.28 0.42 2
Japan 22,226 3,339 90.43 0.93 0.50 1
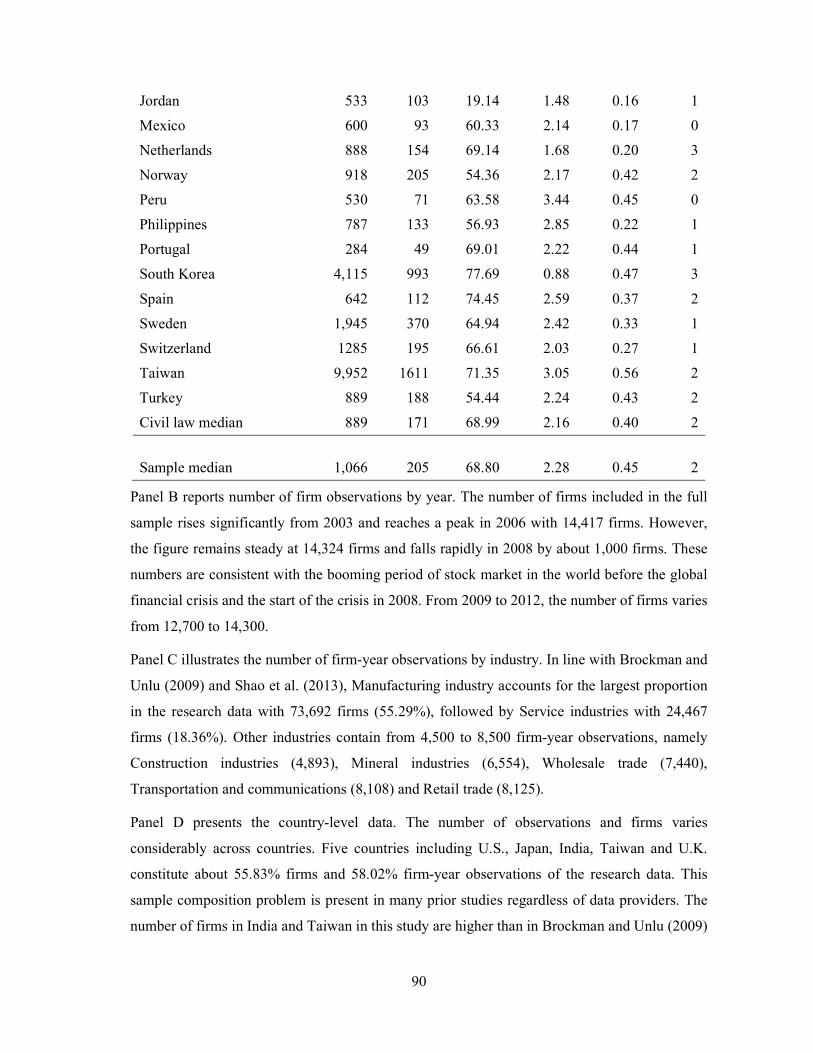
90
Jordan 533 103 19.14 1.48 0.16 1
Mexico 600 93 60.33 2.14 0.17 0
Netherlands 888 154 69.14 1.68 0.20 3
Norway 918 205 54.36 2.17 0.42 2
Peru 530 71 63.58 3.44 0.45 0
Philippines 787 133 56.93 2.85 0.22 1
Portugal 284 49 69.01 2.22 0.44 1
South Korea 4,115 993 77.69 0.88 0.47 3
Spain 642 112 74.45 2.59 0.37 2
Sweden 1,945 370 64.94 2.42 0.33 1
Switzerland 1285 195 66.61 2.03 0.27 1
Taiwan 9,952 1611 71.35 3.05 0.56 2
Turkey 889 188 54.44 2.24 0.43 2
Civil law median 889 171 68.99 2.16 0.40 2
Sample median 1,066 205 68.80 2.28 0.45 2
Panel B reports number of firm observations by year. The number of firms included in the full
sample rises significantly from 2003 and reaches a peak in 2006 with 14,417 firms. However,
the figure remains steady at 14,324 firms and falls rapidly in 2008 by about 1,000 firms. These
numbers are consistent with the booming period of stock market in the world before the global
financial crisis and the start of the crisis in 2008. From 2009 to 2012, the number of firms varies
from 12,700 to 14,300.
Panel C illustrates the number of firm-year observations by industry. In line with Brockman and
Unlu (2009) and Shao et al. (2013), Manufacturing industry accounts for the largest proportion
in the research data with 73,692 firms (55.29%), followed by Service industries with 24,467
firms (18.36%). Other industries contain from 4,500 to 8,500 firm-year observations, namely
Construction industries (4,893), Mineral industries (6,554), Wholesale trade (7,440),
Transportation and communications (8,108) and Retail trade (8,125).
Panel D presents the country-level data. The number of observations and firms varies
considerably across countries. Five countries including U.S., Japan, India, Taiwan and U.K.
constitute about 55.83% firms and 58.02% firm-year observations of the research data. This
sample composition problem is present in many prior studies regardless of data providers. The
number of firms in India and Taiwan in this study are higher than in Brockman and Unlu (2009)
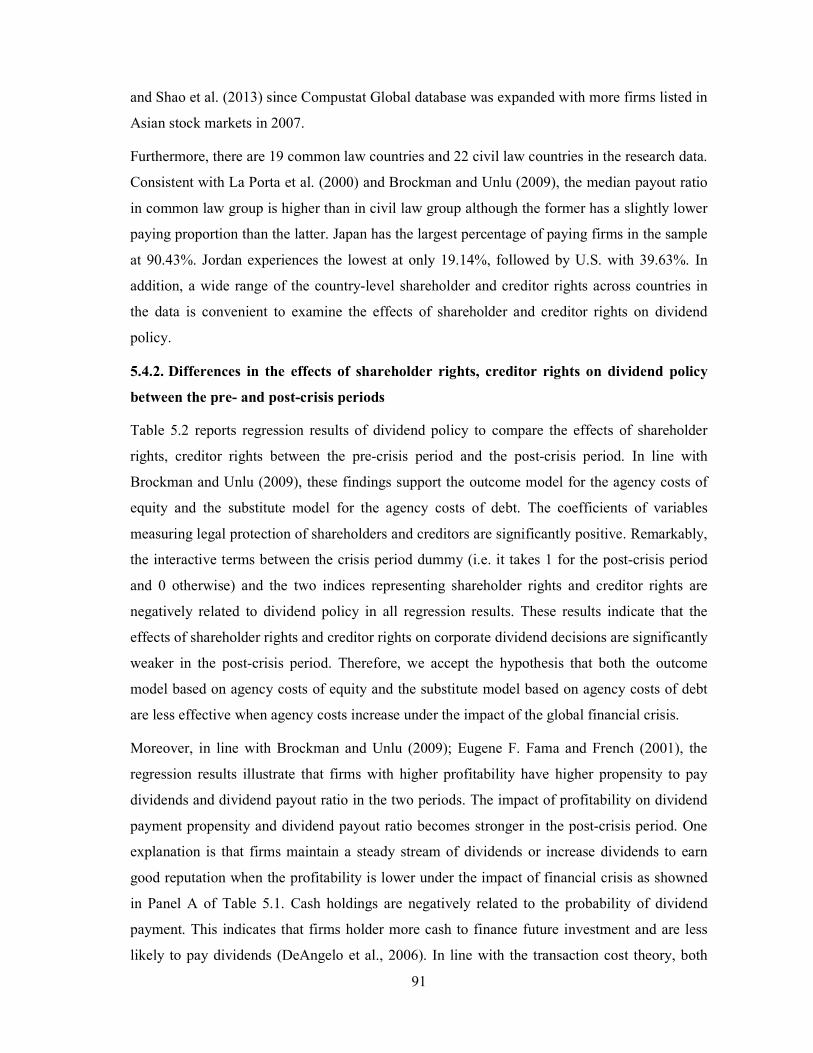
91
and Shao et al. (2013) since Compustat Global database was expanded with more firms listed in
Asian stock markets in 2007.
Furthermore, there are 19 common law countries and 22 civil law countries in the research data.
Consistent with La Porta et al. (2000) and Brockman and Unlu (2009), the median payout ratio
in common law group is higher than in civil law group although the former has a slightly lower
paying proportion than the latter. Japan has the largest percentage of paying firms in the sample
at 90.43%. Jordan experiences the lowest at only 19.14%, followed by U.S. with 39.63%. In
addition, a wide range of the country-level shareholder and creditor rights across countries in
the data is convenient to examine the effects of shareholder and creditor rights on dividend
policy.
5.4.2. Differences in the effects of shareholder rights, creditor rights on dividend policy
between the pre- and post-crisis periods
Table 5.2 reports regression results of dividend policy to compare the effects of shareholder
rights, creditor rights between the pre-crisis period and the post-crisis period. In line with
Brockman and Unlu (2009), these findings support the outcome model for the agency costs of
equity and the substitute model for the agency costs of debt. The coefficients of variables
measuring legal protection of shareholders and creditors are significantly positive. Remarkably,
the interactive terms between the crisis period dummy (i.e. it takes 1 for the post-crisis period
and 0 otherwise) and the two indices representing shareholder rights and creditor rights are
negatively related to dividend policy in all regression results. These results indicate that the
effects of shareholder rights and creditor rights on corporate dividend decisions are significantly
weaker in the post-crisis period. Therefore, we accept the hypothesis that both the outcome
model based on agency costs of equity and the substitute model based on agency costs of debt
are less effective when agency costs increase under the impact of the global financial crisis.
Moreover, in line with Brockman and Unlu (2009); Eugene F. Fama and French (2001), the
regression results illustrate that firms with higher profitability have higher propensity to pay
dividends and dividend payout ratio in the two periods. The impact of profitability on dividend
payment propensity and dividend payout ratio becomes stronger in the post-crisis period. One
explanation is that firms maintain a steady stream of dividends or increase dividends to earn
good reputation when the profitability is lower under the impact of financial crisis as showned
in Panel A of Table 5.1. Cash holdings are negatively related to the probability of dividend
payment. This indicates that firms holder more cash to finance future investment and are less
likely to pay dividends (DeAngelo et al., 2006). In line with the transaction cost theory, both
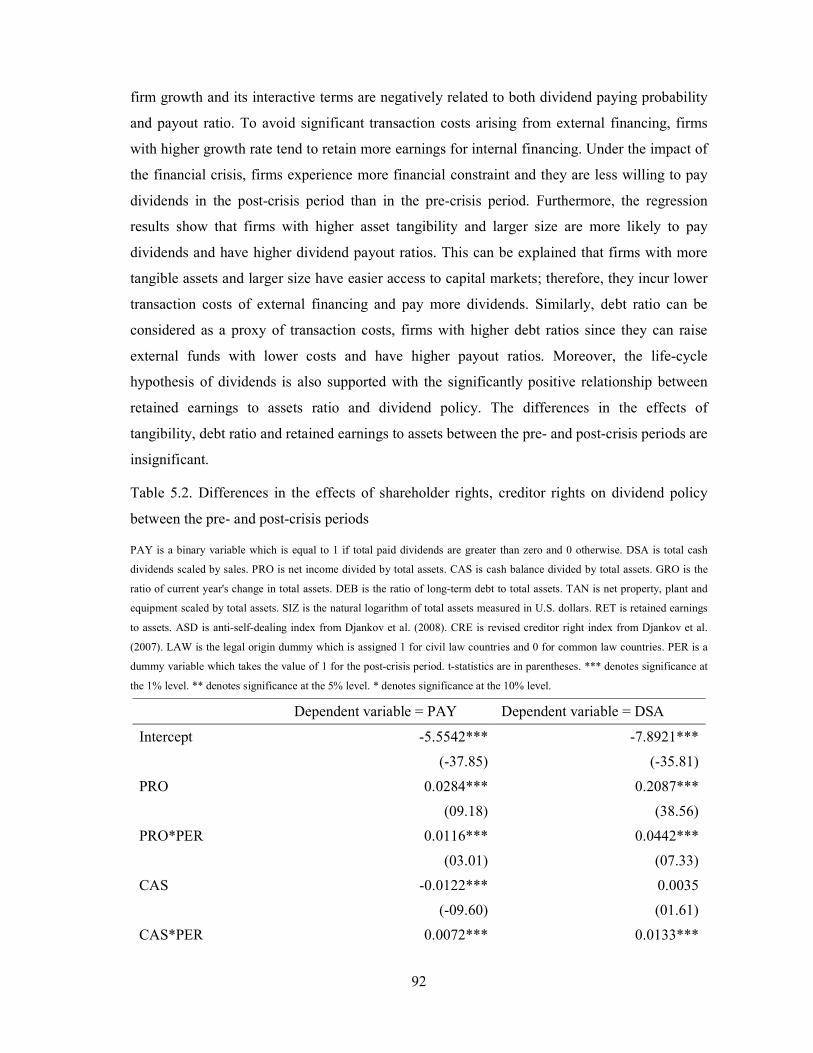
92
firm growth and its interactive terms are negatively related to both dividend paying probability
and payout ratio. To avoid significant transaction costs arising from external financing, firms
with higher growth rate tend to retain more earnings for internal financing. Under the impact of
the financial crisis, firms experience more financial constraint and they are less willing to pay
dividends in the post-crisis period than in the pre-crisis period. Furthermore, the regression
results show that firms with higher asset tangibility and larger size are more likely to pay
dividends and have higher dividend payout ratios. This can be explained that firms with more
tangible assets and larger size have easier access to capital markets; therefore, they incur lower
transaction costs of external financing and pay more dividends. Similarly, debt ratio can be
considered as a proxy of transaction costs, firms with higher debt ratios since they can raise
external funds with lower costs and have higher payout ratios. Moreover, the life-cycle
hypothesis of dividends is also supported with the significantly positive relationship between
retained earnings to assets ratio and dividend policy. The differences in the effects of
tangibility, debt ratio and retained earnings to assets between the pre- and post-crisis periods are
insignificant.
Table 5.2. Differences in the effects of shareholder rights, creditor rights on dividend policy
between the pre- and post-crisis periods
PAY is a binary variable which is equal to 1 if total paid dividends are greater than zero and 0 otherwise. DSA is total cash
dividends scaled by sales. PRO is net income divided by total assets. CAS is cash balance divided by total assets. GRO is the
ratio of current year's change in total assets. DEB is the ratio of long-term debt to total assets. TAN is net property, plant and
equipment scaled by total assets. SIZ is the natural logarithm of total assets measured in U.S. dollars. RET is retained earnings
to assets. ASD is anti-self-dealing index from Djankov et al. (2008). CRE is revised creditor right index from Djankov et al.
(2007). LAW is the legal origin dummy which is assigned 1 for civil law countries and 0 for common law countries. PER is a
dummy variable which takes the value of 1 for the post-crisis period. t-statistics are in parentheses. *** denotes significance at
the 1% level. ** denotes significance at the 5% level. * denotes significance at the 10% level.
Dependent variable = PAY Dependent variable = DSA
Intercept -5.5542*** -7.8921***
(-37.85) (-35.81)
PRO 0.0284*** 0.2087***
(09.18) (38.56)
PRO*PER 0.0116*** 0.0442***
(03.01) (07.33)
CAS -0.0122*** 0.0035
(-09.60) (01.61)
CAS*PER 0.0072*** 0.0133***
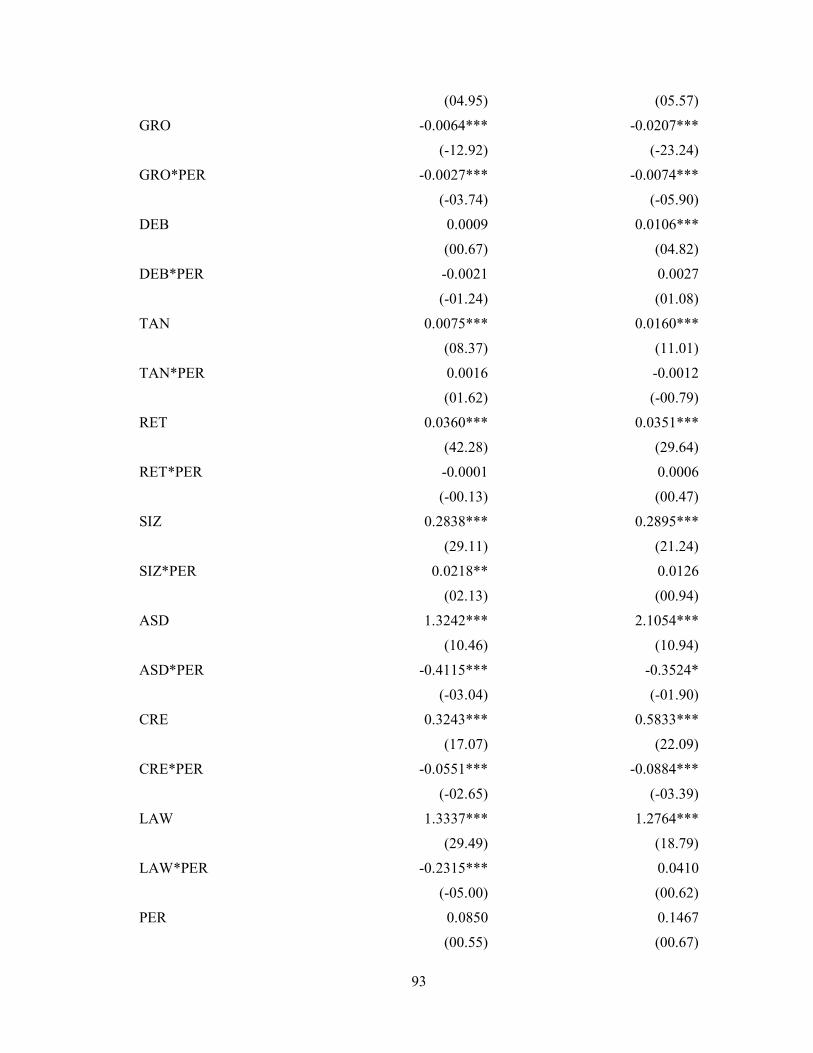
93
(04.95) (05.57)
GRO -0.0064*** -0.0207***
(-12.92) (-23.24)
GRO*PER -0.0027*** -0.0074***
(-03.74) (-05.90)
DEB 0.0009 0.0106***
(00.67) (04.82)
DEB*PER -0.0021 0.0027
(-01.24) (01.08)
TAN 0.0075*** 0.0160***
(08.37) (11.01)
TAN*PER 0.0016 -0.0012
(01.62) (-00.79)
RET 0.0360*** 0.0351***
(42.28) (29.64)
RET*PER -0.0001 0.0006
(-00.13) (00.47)
SIZ 0.2838*** 0.2895***
(29.11) (21.24)
SIZ*PER 0.0218** 0.0126
(02.13) (00.94)
ASD 1.3242*** 2.1054***
(10.46) (10.94)
ASD*PER -0.4115*** -0.3524*
(-03.04) (-01.90)
CRE 0.3243*** 0.5833***
(17.07) (22.09)
CRE*PER -0.0551*** -0.0884***
(-02.65) (-03.39)
LAW 1.3337*** 1.2764***
(29.49) (18.79)
LAW*PER -0.2315*** 0.0410
(-05.00) (00.62)
PER 0.0850 0.1467
(00.55) (00.67)
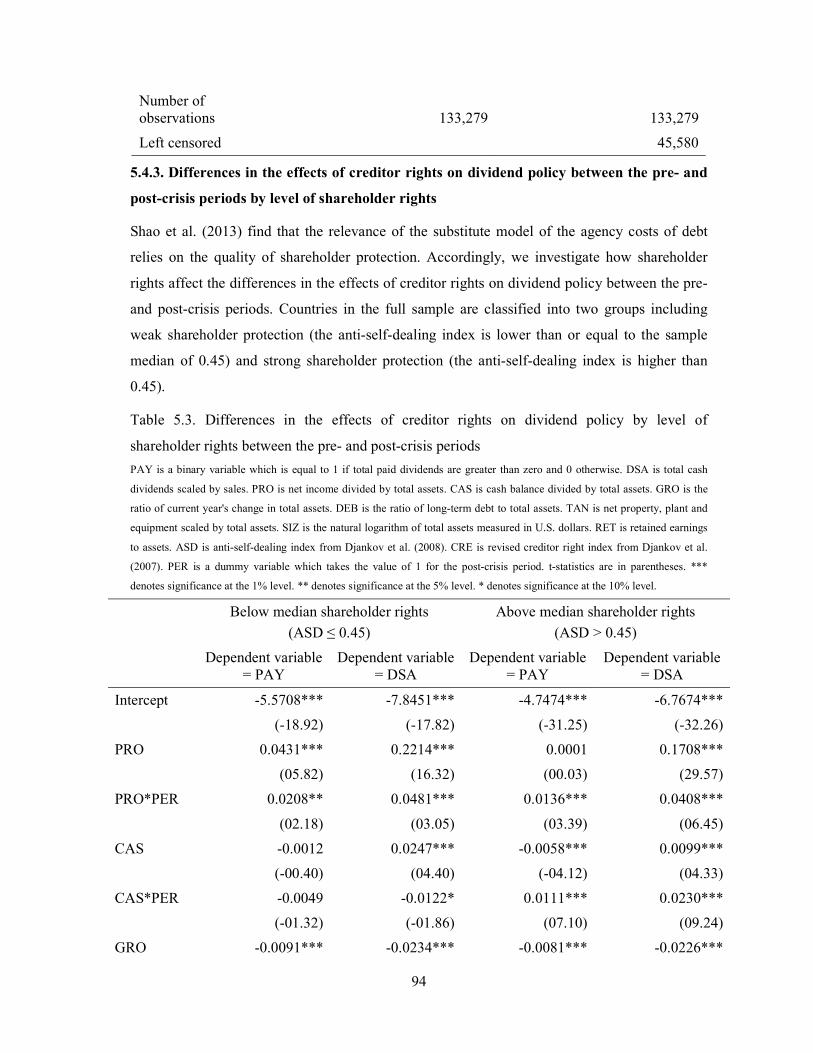
94
Number of observations 133,279 133,279
Left censored 45,580
5.4.3. Differences in the effects of creditor rights on dividend policy between the pre- and
post-crisis periods by level of shareholder rights
Shao et al. (2013) find that the relevance of the substitute model of the agency costs of debt
relies on the quality of shareholder protection. Accordingly, we investigate how shareholder
rights affect the differences in the effects of creditor rights on dividend policy between the pre-
and post-crisis periods. Countries in the full sample are classified into two groups including
weak shareholder protection (the anti-self-dealing index is lower than or equal to the sample
median of 0.45) and strong shareholder protection (the anti-self-dealing index is higher than
0.45).
Table 5.3. Differences in the effects of creditor rights on dividend policy by level of
shareholder rights between the pre- and post-crisis periods
PAY is a binary variable which is equal to 1 if total paid dividends are greater than zero and 0 otherwise. DSA is total cash
dividends scaled by sales. PRO is net income divided by total assets. CAS is cash balance divided by total assets. GRO is the
ratio of current year's change in total assets. DEB is the ratio of long-term debt to total assets. TAN is net property, plant and
equipment scaled by total assets. SIZ is the natural logarithm of total assets measured in U.S. dollars. RET is retained earnings
to assets. ASD is anti-self-dealing index from Djankov et al. (2008). CRE is revised creditor right index from Djankov et al.
(2007). PER is a dummy variable which takes the value of 1 for the post-crisis period. t-statistics are in parentheses. ***
denotes significance at the 1% level. ** denotes significance at the 5% level. * denotes significance at the 10% level.
Below median shareholder rights
(ASD ≤ 0.45)
Above median shareholder rights
(ASD > 0.45)
Dependent variable = PAY
Dependent variable = DSA
Dependent variable = PAY
Dependent variable = DSA
Intercept -5.5708*** -7.8451*** -4.7474*** -6.7674***
(-18.92) (-17.82) (-31.25) (-32.26)
PRO 0.0431*** 0.2214*** 0.0001 0.1708***
(05.82) (16.32) (00.03) (29.57)
PRO*PER 0.0208** 0.0481*** 0.0136*** 0.0408***
(02.18) (03.05) (03.39) (06.45)
CAS -0.0012 0.0247*** -0.0058*** 0.0099***
(-00.40) (04.40) (-04.12) (04.33)
CAS*PER -0.0049 -0.0122* 0.0111*** 0.0230***
(-01.32) (-01.86) (07.10) (09.24)
GRO -0.0091*** -0.0234*** -0.0081*** -0.0226***
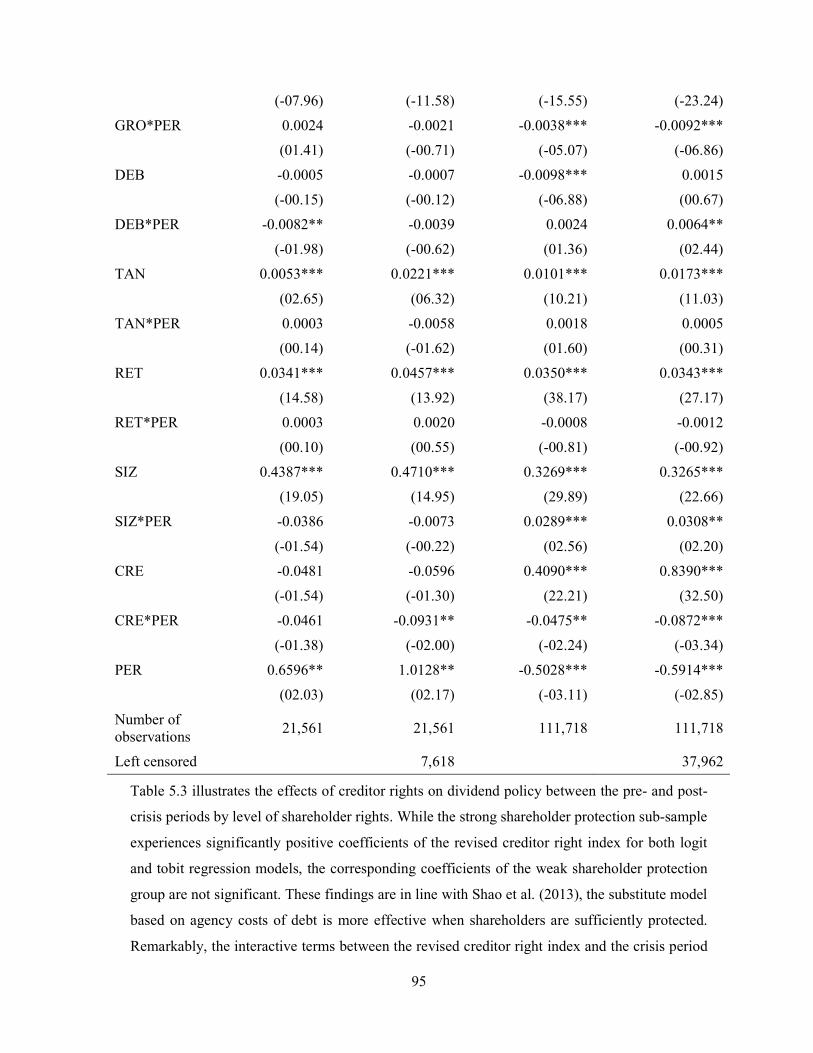
95
(-07.96) (-11.58) (-15.55) (-23.24)
GRO*PER 0.0024 -0.0021 -0.0038*** -0.0092***
(01.41) (-00.71) (-05.07) (-06.86)
DEB -0.0005 -0.0007 -0.0098*** 0.0015
(-00.15) (-00.12) (-06.88) (00.67)
DEB*PER -0.0082** -0.0039 0.0024 0.0064**
(-01.98) (-00.62) (01.36) (02.44)
TAN 0.0053*** 0.0221*** 0.0101*** 0.0173***
(02.65) (06.32) (10.21) (11.03)
TAN*PER 0.0003 -0.0058 0.0018 0.0005
(00.14) (-01.62) (01.60) (00.31)
RET 0.0341*** 0.0457*** 0.0350*** 0.0343***
(14.58) (13.92) (38.17) (27.17)
RET*PER 0.0003 0.0020 -0.0008 -0.0012
(00.10) (00.55) (-00.81) (-00.92)
SIZ 0.4387*** 0.4710*** 0.3269*** 0.3265***
(19.05) (14.95) (29.89) (22.66)
SIZ*PER -0.0386 -0.0073 0.0289*** 0.0308**
(-01.54) (-00.22) (02.56) (02.20)
CRE -0.0481 -0.0596 0.4090*** 0.8390***
(-01.54) (-01.30) (22.21) (32.50)
CRE*PER -0.0461 -0.0931** -0.0475** -0.0872***
(-01.38) (-02.00) (-02.24) (-03.34)
PER 0.6596** 1.0128** -0.5028*** -0.5914***
(02.03) (02.17) (-03.11) (-02.85)
Number of observations
21,561 21,561 111,718 111,718
Left censored 7,618 37,962
Table 5.3 illustrates the effects of creditor rights on dividend policy between the pre- and post-
crisis periods by level of shareholder rights. While the strong shareholder protection sub-sample
experiences significantly positive coefficients of the revised creditor right index for both logit
and tobit regression models, the corresponding coefficients of the weak shareholder protection
group are not significant. These findings are in line with Shao et al. (2013), the substitute model
based on agency costs of debt is more effective when shareholders are sufficiently protected.
Remarkably, the interactive terms between the revised creditor right index and the crisis period
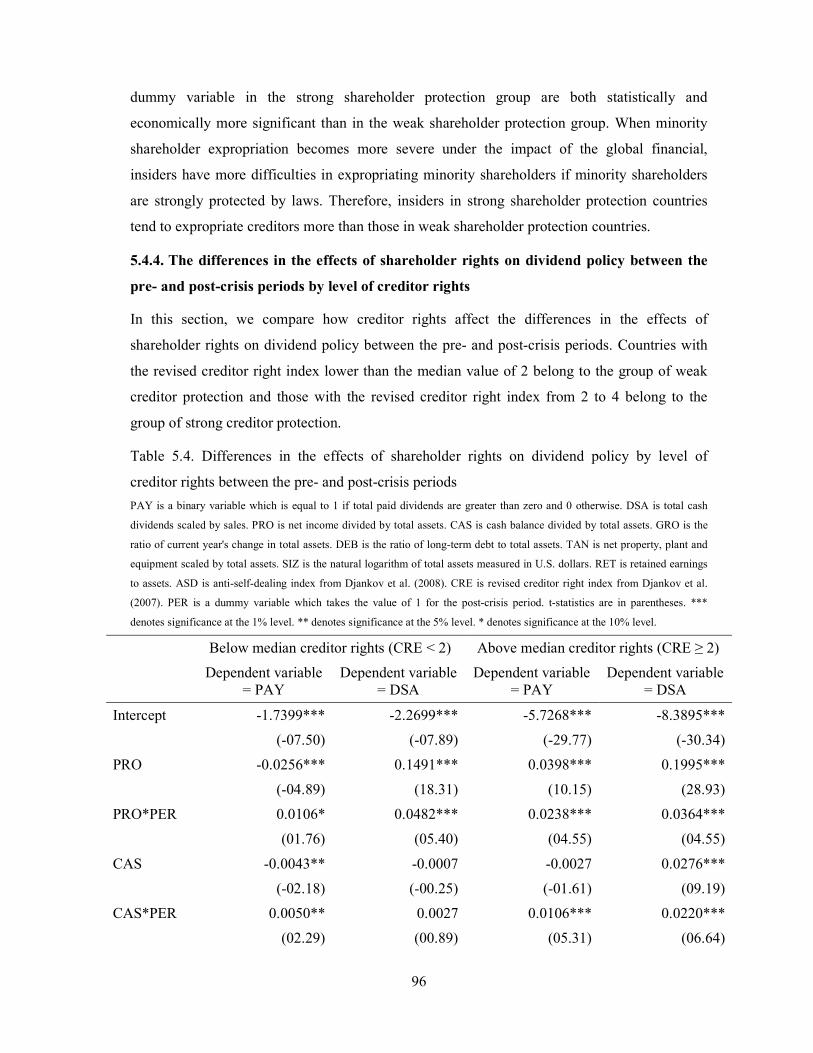
96
dummy variable in the strong shareholder protection group are both statistically and
economically more significant than in the weak shareholder protection group. When minority
shareholder expropriation becomes more severe under the impact of the global financial,
insiders have more difficulties in expropriating minority shareholders if minority shareholders
are strongly protected by laws. Therefore, insiders in strong shareholder protection countries
tend to expropriate creditors more than those in weak shareholder protection countries.
5.4.4. The differences in the effects of shareholder rights on dividend policy between the
pre- and post-crisis periods by level of creditor rights
In this section, we compare how creditor rights affect the differences in the effects of
shareholder rights on dividend policy between the pre- and post-crisis periods. Countries with
the revised creditor right index lower than the median value of 2 belong to the group of weak
creditor protection and those with the revised creditor right index from 2 to 4 belong to the
group of strong creditor protection.
Table 5.4. Differences in the effects of shareholder rights on dividend policy by level of
creditor rights between the pre- and post-crisis periods
PAY is a binary variable which is equal to 1 if total paid dividends are greater than zero and 0 otherwise. DSA is total cash
dividends scaled by sales. PRO is net income divided by total assets. CAS is cash balance divided by total assets. GRO is the
ratio of current year's change in total assets. DEB is the ratio of long-term debt to total assets. TAN is net property, plant and
equipment scaled by total assets. SIZ is the natural logarithm of total assets measured in U.S. dollars. RET is retained earnings
to assets. ASD is anti-self-dealing index from Djankov et al. (2008). CRE is revised creditor right index from Djankov et al.
(2007). PER is a dummy variable which takes the value of 1 for the post-crisis period. t-statistics are in parentheses. ***
denotes significance at the 1% level. ** denotes significance at the 5% level. * denotes significance at the 10% level.
Below median creditor rights (CRE < 2) Above median creditor rights (CRE ≥ 2)
Dependent variable = PAY
Dependent variable = DSA
Dependent variable = PAY
Dependent variable = DSA
Intercept -1.7399*** -2.2699*** -5.7268*** -8.3895***
(-07.50) (-07.89) (-29.77) (-30.34)
PRO -0.0256*** 0.1491*** 0.0398*** 0.1995***
(-04.89) (18.31) (10.15) (28.93)
PRO*PER 0.0106* 0.0482*** 0.0238*** 0.0364***
(01.76) (05.40) (04.55) (04.55)
CAS -0.0043** -0.0007 -0.0027 0.0276***
(-02.18) (-00.25) (-01.61) (09.19)
CAS*PER 0.0050** 0.0027 0.0106*** 0.0220***
(02.29) (00.89) (05.31) (06.64)
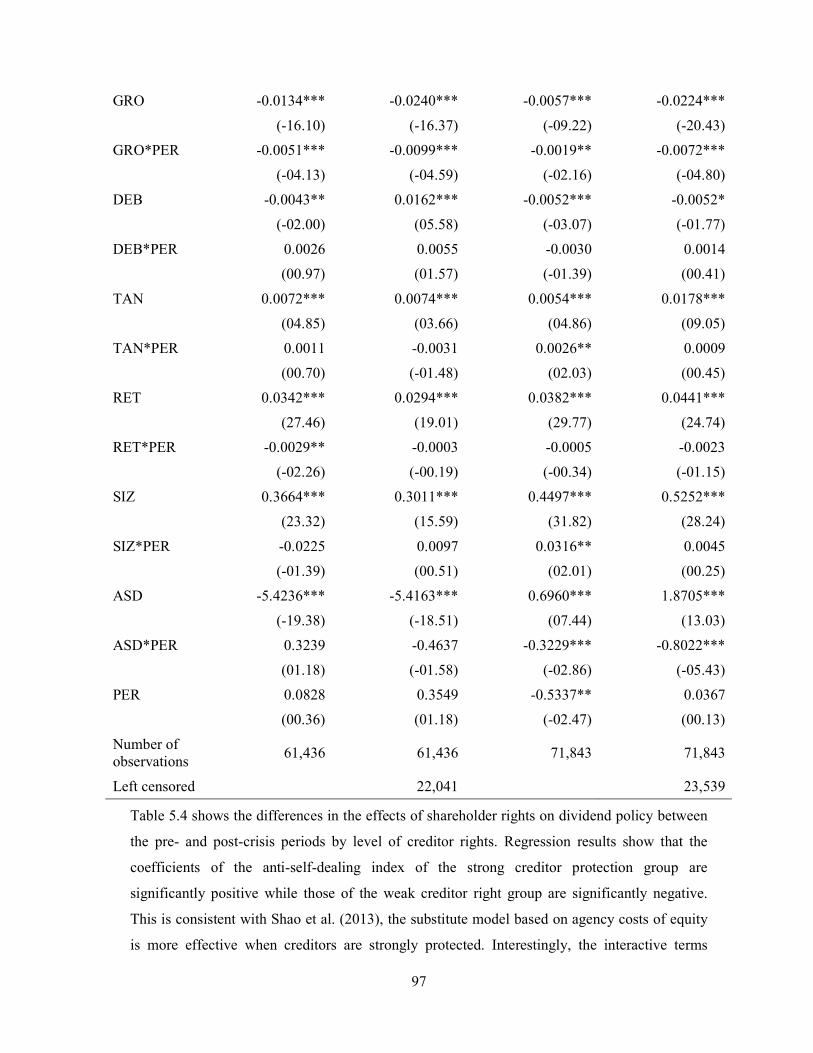
97
GRO -0.0134*** -0.0240*** -0.0057*** -0.0224***
(-16.10) (-16.37) (-09.22) (-20.43)
GRO*PER -0.0051*** -0.0099*** -0.0019** -0.0072***
(-04.13) (-04.59) (-02.16) (-04.80)
DEB -0.0043** 0.0162*** -0.0052*** -0.0052*
(-02.00) (05.58) (-03.07) (-01.77)
DEB*PER 0.0026 0.0055 -0.0030 0.0014
(00.97) (01.57) (-01.39) (00.41)
TAN 0.0072*** 0.0074*** 0.0054*** 0.0178***
(04.85) (03.66) (04.86) (09.05)
TAN*PER 0.0011 -0.0031 0.0026** 0.0009
(00.70) (-01.48) (02.03) (00.45)
RET 0.0342*** 0.0294*** 0.0382*** 0.0441***
(27.46) (19.01) (29.77) (24.74)
RET*PER -0.0029** -0.0003 -0.0005 -0.0023
(-02.26) (-00.19) (-00.34) (-01.15)
SIZ 0.3664*** 0.3011*** 0.4497*** 0.5252***
(23.32) (15.59) (31.82) (28.24)
SIZ*PER -0.0225 0.0097 0.0316** 0.0045
(-01.39) (00.51) (02.01) (00.25)
ASD -5.4236*** -5.4163*** 0.6960*** 1.8705***
(-19.38) (-18.51) (07.44) (13.03)
ASD*PER 0.3239 -0.4637 -0.3229*** -0.8022***
(01.18) (-01.58) (-02.86) (-05.43)
PER 0.0828 0.3549 -0.5337** 0.0367
(00.36) (01.18) (-02.47) (00.13)
Number of observations
61,436 61,436 71,843 71,843
Left censored 22,041 23,539
Table 5.4 shows the differences in the effects of shareholder rights on dividend policy between
the pre- and post-crisis periods by level of creditor rights. Regression results show that the
coefficients of the anti-self-dealing index of the strong creditor protection group are
significantly positive while those of the weak creditor right group are significantly negative.
This is consistent with Shao et al. (2013), the substitute model based on agency costs of equity
is more effective when creditors are strongly protected. Interestingly, the interactive terms
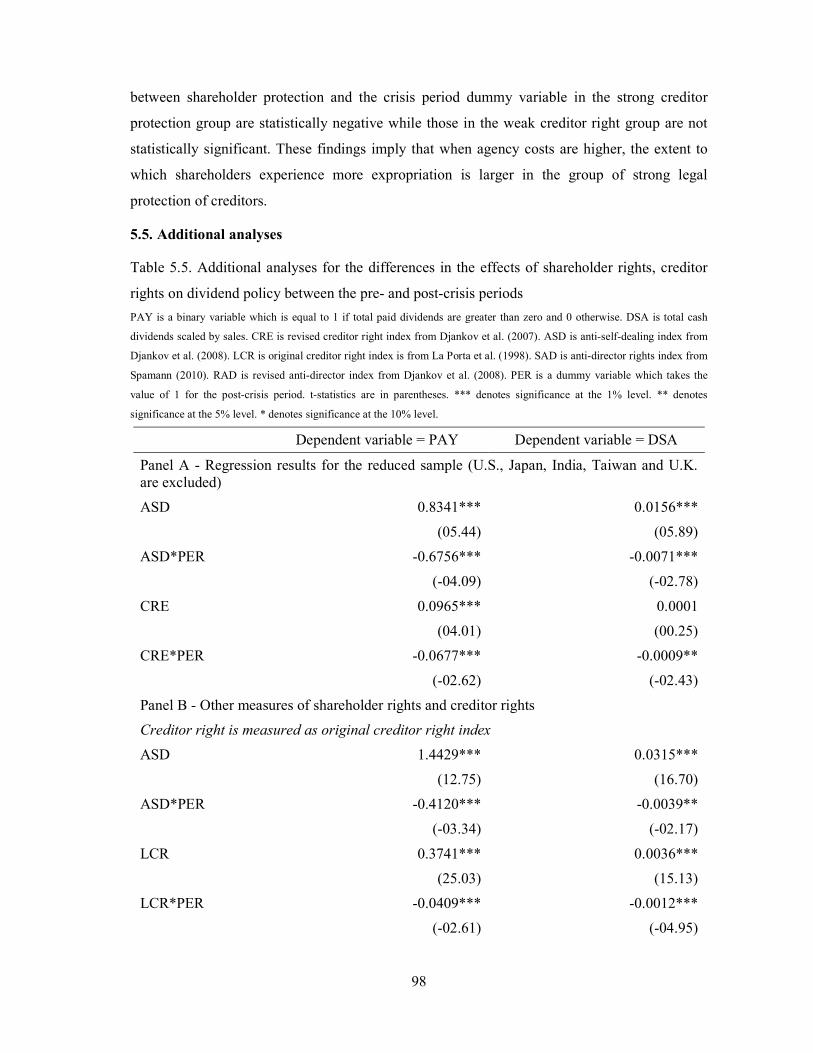
98
between shareholder protection and the crisis period dummy variable in the strong creditor
protection group are statistically negative while those in the weak creditor right group are not
statistically significant. These findings imply that when agency costs are higher, the extent to
which shareholders experience more expropriation is larger in the group of strong legal
protection of creditors.
5.5. Additional analyses
Table 5.5. Additional analyses for the differences in the effects of shareholder rights, creditor
rights on dividend policy between the pre- and post-crisis periods
PAY is a binary variable which is equal to 1 if total paid dividends are greater than zero and 0 otherwise. DSA is total cash
dividends scaled by sales. CRE is revised creditor right index from Djankov et al. (2007). ASD is anti-self-dealing index from
Djankov et al. (2008). LCR is original creditor right index is from La Porta et al. (1998). SAD is anti-director rights index from
Spamann (2010). RAD is revised anti-director index from Djankov et al. (2008). PER is a dummy variable which takes the
value of 1 for the post-crisis period. t-statistics are in parentheses. *** denotes significance at the 1% level. ** denotes
significance at the 5% level. * denotes significance at the 10% level.
Dependent variable = PAY Dependent variable = DSA
Panel A - Regression results for the reduced sample (U.S., Japan, India, Taiwan and U.K. are excluded)
ASD 0.8341*** 0.0156***
(05.44) (05.89)
ASD*PER -0.6756*** -0.0071***
(-04.09) (-02.78)
CRE 0.0965*** 0.0001
(04.01) (00.25)
CRE*PER -0.0677*** -0.0009**
(-02.62) (-02.43)
Panel B - Other measures of shareholder rights and creditor rights
Creditor right is measured as original creditor right index
ASD 1.4429*** 0.0315***
(12.75) (16.70)
ASD*PER -0.4120*** -0.0039**
(-03.34) (-02.17)
LCR 0.3741*** 0.0036***
(25.03) (15.13)
LCR*PER -0.0409*** -0.0012***
(-02.61) (-04.95)
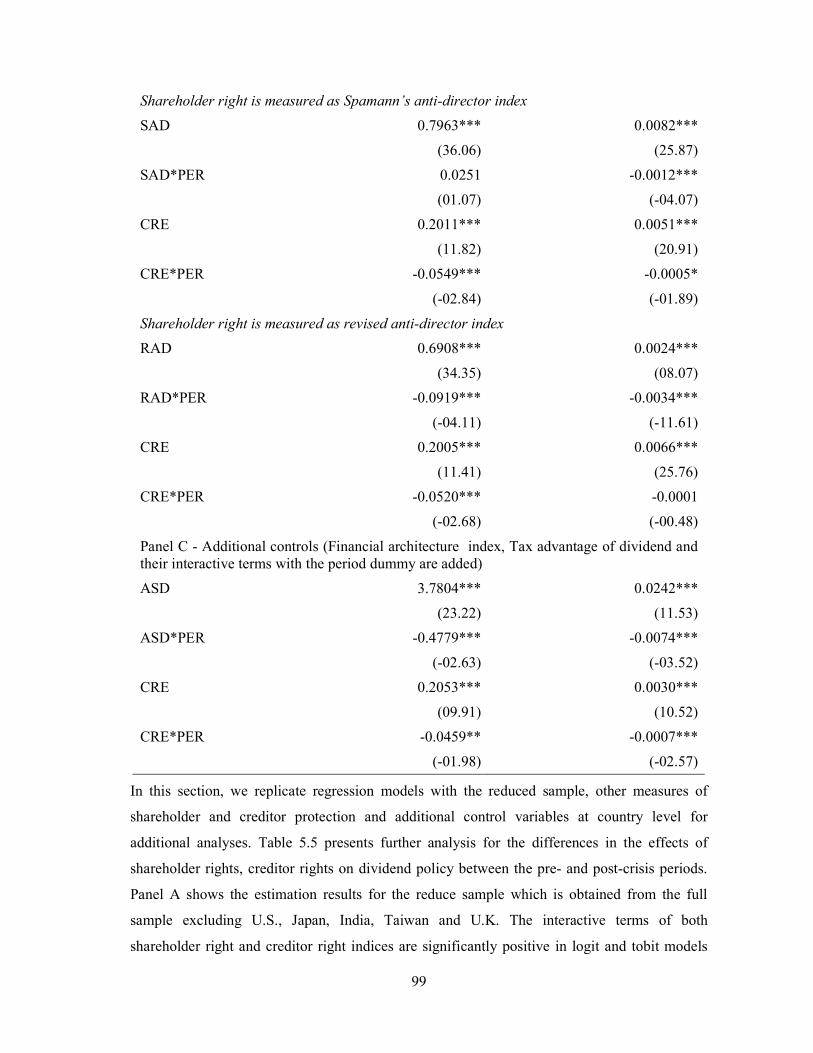
99
Shareholder right is measured as Spamann’s anti-director index
SAD 0.7963*** 0.0082***
(36.06) (25.87)
SAD*PER 0.0251 -0.0012***
(01.07) (-04.07)
CRE 0.2011*** 0.0051***
(11.82) (20.91)
CRE*PER -0.0549*** -0.0005*
(-02.84) (-01.89)
Shareholder right is measured as revised anti-director index
RAD 0.6908*** 0.0024***
(34.35) (08.07)
RAD*PER -0.0919*** -0.0034***
(-04.11) (-11.61)
CRE 0.2005*** 0.0066***
(11.41) (25.76)
CRE*PER -0.0520*** -0.0001
(-02.68) (-00.48)
Panel C - Additional controls (Financial architecture index, Tax advantage of dividend and their interactive terms with the period dummy are added)
ASD 3.7804*** 0.0242***
(23.22) (11.53)
ASD*PER -0.4779*** -0.0074***
(-02.63) (-03.52)
CRE 0.2053*** 0.0030***
(09.91) (10.52)
CRE*PER -0.0459** -0.0007***
(-01.98) (-02.57)
In this section, we replicate regression models with the reduced sample, other measures of
shareholder and creditor protection and additional control variables at country level for
additional analyses. Table 5.5 presents further analysis for the differences in the effects of
shareholder rights, creditor rights on dividend policy between the pre- and post-crisis periods.
Panel A shows the estimation results for the reduce sample which is obtained from the full
sample excluding U.S., Japan, India, Taiwan and U.K. The interactive terms of both
shareholder right and creditor right indices are significantly positive in logit and tobit models

100
despite the insignificant coefficient of the revised creditor right index in the tobit model. These
findings are consistent with those in the full sample. These results imply that the outcome
model based on agency costs of shareholders and the substitute model based on agency costs of
creditors become less effective in the post-crisis period than in the pre-crisis period regardless
of the data composition problem.
In addition, we replicate the regression models for the full sample with other measures of
creditor and shareholder protection. The measure of creditor right index is the original creditor
right index (LCR) from La Porta et al. (1998). The original creditor right index and the revised
creditor right index from Djankov et al. (2007) are measured with the same components but the
former is more outdated. The measures of shareholder rights are two anti-director indices
including the anti-director index (SAD) from Spamann (2010) and the revised anti-director
index (RAD) from Djankov et al. (2008). The anti-director indices are criticized that they only
predict financial outcome on the basis of investor protection measures across countries and fail
to explicitly focus on self-dealing defined as the problem of investor expropriation (Djankov et
al., 2008). Panel B of Table 5.5 illustrates that the overall regression results are consistent with
our main findings mentioned above despite the insignificant coefficients of the interactive terms
of Spamann’s anti-director index (SAD) and the revised anti-director index (RAD) in the logit
and tobit regression models respectively.
Table 5.6. Additional analyses for the differences in the effects of shareholder rights (creditor
rights) on dividend policy by level of creditor rights (shareholder rights)
PAY is a binary variable which is equal to 1 if total paid dividends are greater than zero and 0 otherwise. DSA is total cash
dividends scaled by sales. CRE is revised creditor right index from Djankov et al. (2007). ASD is anti-self-dealing index from
Djankov et al. (2008). PER is a dummy variable which takes the value of 1 for the post-crisis period. Additional controls
including financial architecture index, tax advantage of dividend and their interactive terms with the period dummy are added.
t-statistics are in parentheses. *** denotes significance at the 1% level. ** denotes significance at the 5% level. * denotes
significance at the 10% level.
Panel A - Differences in the effects of shareholder rights on dividend policy by level of creditor rights
Below median shareholder rights
(ASD ≤ 0.45) Above median shareholder rights
(ASD > 0.45)
Dependent variable = PAY
Dependent variable = DSA
Dependent variable = PAY
Dependent variable = DSA
Regression results for the reduced sample (U.S., Japan, India, Taiwan and U.K. are excluded)
CRE -0.0481 -0.0596 0.4024*** 0.3948***
(-01.54) (-01.30) (10.18) (05.37)
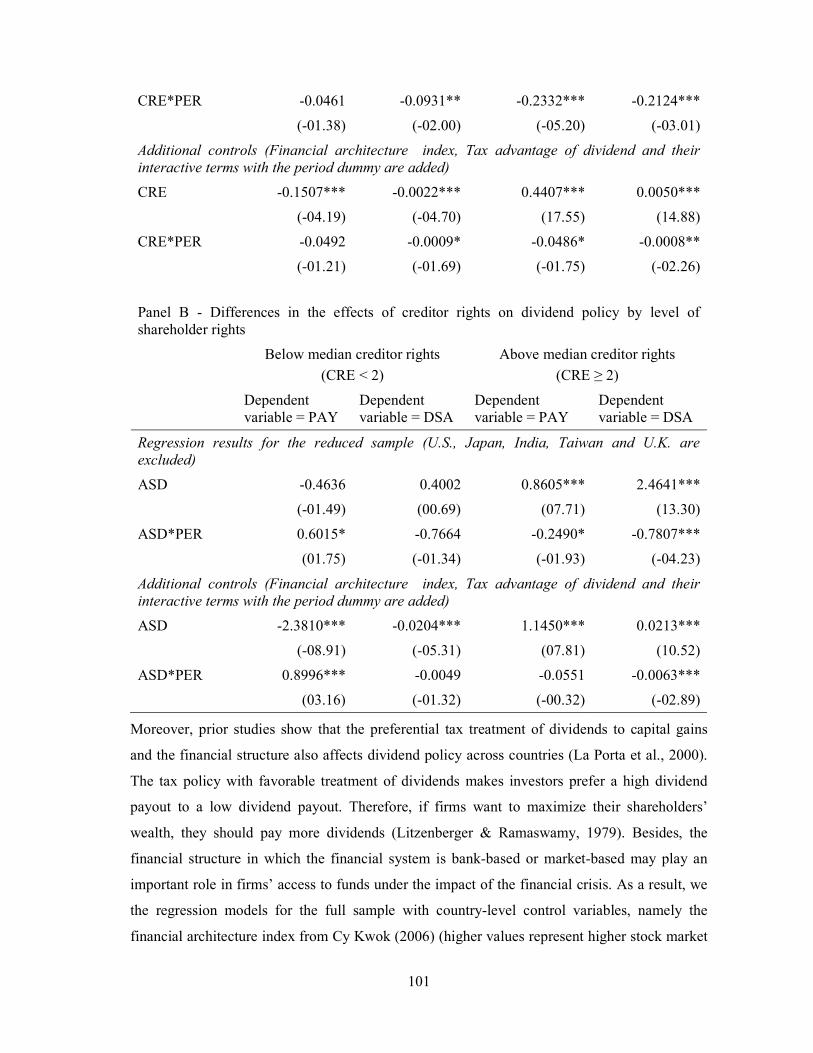
101
CRE*PER -0.0461 -0.0931** -0.2332*** -0.2124***
(-01.38) (-02.00) (-05.20) (-03.01)
Additional controls (Financial architecture index, Tax advantage of dividend and their interactive terms with the period dummy are added)
CRE -0.1507*** -0.0022*** 0.4407*** 0.0050***
(-04.19) (-04.70) (17.55) (14.88)
CRE*PER -0.0492 -0.0009* -0.0486* -0.0008**
(-01.21) (-01.69) (-01.75) (-02.26)
Panel B - Differences in the effects of creditor rights on dividend policy by level of shareholder rights
Below median creditor rights
(CRE < 2)
Above median creditor rights
(CRE ≥ 2)
Dependent variable = PAY
Dependent variable = DSA
Dependent variable = PAY
Dependent variable = DSA
Regression results for the reduced sample (U.S., Japan, India, Taiwan and U.K. are excluded)
ASD -0.4636 0.4002 0.8605*** 2.4641***
(-01.49) (00.69) (07.71) (13.30)
ASD*PER 0.6015* -0.7664 -0.2490* -0.7807***
(01.75) (-01.34) (-01.93) (-04.23)
Additional controls (Financial architecture index, Tax advantage of dividend and their interactive terms with the period dummy are added)
ASD -2.3810*** -0.0204*** 1.1450*** 0.0213***
(-08.91) (-05.31) (07.81) (10.52)
ASD*PER 0.8996*** -0.0049 -0.0551 -0.0063***
(03.16) (-01.32) (-00.32) (-02.89)
Moreover, prior studies show that the preferential tax treatment of dividends to capital gains
and the financial structure also affects dividend policy across countries (La Porta et al., 2000).
The tax policy with favorable treatment of dividends makes investors prefer a high dividend
payout to a low dividend payout. Therefore, if firms want to maximize their shareholders’
wealth, they should pay more dividends (Litzenberger & Ramaswamy, 1979). Besides, the
financial structure in which the financial system is bank-based or market-based may play an
important role in firms’ access to funds under the impact of the financial crisis. As a result, we
the regression models for the full sample with country-level control variables, namely the
financial architecture index from Cy Kwok (2006) (higher values represent higher stock market
102
orientation of financial systems) and the preferential tax treatment of dividends to capital gains
from La Porta et al. (2000). Panel C of Table 5.5 illustrates findings when the financial
architecture index, the tax advantage of dividend index and their interactive terms with the
period dummy are added. The core findings are mainly consistent with those presented in
Section 5.4.2.
Table 5.6 presents additional analyses for the differences in the effects of creditor rights
(shareholder rights) on dividend policy by level of shareholder rights (creditor rights) with the
reduced sample and additional controls. In line with Shao et al. (2013), the coefficients of
creditor rights (shareholder rights) are positive at 1% significance in the strong shareholder
(creditor) protection group; however, they are insignificant or significantly positive in the weak
shareholder (creditor) protection group. Overall, the interactive terms between creditor rights
(shareholder rights) with the crisis period dummy are statistically and economically more
significant when shareholders (creditors) experience stronger protection. These findings are
consistent results with those presented in Section 5.4.3 and Section 5.4.4.
5.6. Conclusion
The impact of creditor and shareholder protection on dividend policy is one of promising area
of interdisciplinary research on law and finance. La Porta et al. (2000) find empirical supporting
evidence for the outcome model of the agency costs of equity. Brockman and Unlu (2009) find
that the substitute model of the agency costs of debt is also effective after controlling
shareholder rights and firm-specific variables. In this study, we use the global financial crisis as
an exogenous shock which results in increases in both types of agency costs to examine the two
agency models. Using a sample of 133,279 firm-year observations from 23,962 firms
incorporated in 41 countries, we find that the effects of shareholder and creditor rights on
dividend policy become weaker in the post-crisis period. This indicates that the outcome model
based on agency costs of equity and the substitute model based on agency costs of debt become
less effective when there are increases in both types of agency costs. Moreover, we find that the
decrease in the effect of creditor rights (shareholder rights) on dividend policy between the pre-
and post-crisis periods is more pronounced when shareholders (creditors) are strongly
protected. These research resutls provide the following implications: Firstly, when both types of
agency costs increase, both shareholders and creditors experience more expropriation and
creditors (shareholders) experience more expropriation with larger extent in the group of strong
legal protection of shareholders (creditors). Secondly, it is useful to employ an exogenous
shock to test dividend theories. Finally, we can extend this line of research by investigating the

103
interaction between legal structure and firm-level corporate governance. Especially, we can
examine whether firm-level corporate governance is a substitute of poor legal protection.

104
This page is intentionally left blank
105
Chapter 6: CONCLUSION
Dividend policy has a long history of development in corporate finance with various
explanations. This PhD dissertation provides a new approach to investigate dividend policy,
new evidence of dividend capture in a promising laboratory - Vietnamese stock market and new
evidence of two agency models of dividends under the increases of agency costs of equity and
debt.
The first essay examines dividend policy of firms listed in Vietnamese stock market with a two-
step approach. Vietnamese stock market is newly established, hence the regulations and
investors’ experience to control the expropriation by insiders are likely incomplete. In addition,
the market booms and crashes shortly over 3 years in the research period, this leads to rapid
fluctuations in transaction costs of external financing and the need to signals outside investors
by dividends. Besides, a large percentage of listed firms are state-controlled firms which are
likely to experience “double principal-agent problem” (Gugler, 2003) and have higher demand
of more cash dividends to finance other financially constrained state-controlled business
projects (D. Chen et al., 2009). These characteristics are good conditions to test relevant
theories of dividend policy. Furthermore, we argue that dividend policy is not just the decision
of dividend amounts. It is a two-step decision making process including the decision to pay or
not to pay and the decision of how much firms should pay after they decide to pay. On the other
hand, from econometric perspective, dividend data is right-censored, OLS regression for the
full sample of non-payers and payers or the subsample of payers results in selection bias.
Consequently, this study examines both steps of dividend policy with Heckman two-step
regression approach to fix the selection bias. The research findings show that consistent with
Eugene F. Fama and French (2001), firms with higher profitability, larger size and lower and
investment opportunities are more likely to pay dividends. In addition, firm maturity measured
by retained earnings to equity ratio is positively related to the probability of paying dividends,
this is consistent with the life cycle hypothesis suggested by DeAngelo et al. (2006). Moreover,
in line with Banerjee et al. (2007) and Rozeff (1982), firms with higher stock liquidity (lower
information asymmetry) and higher insider ownership (higher agency costs) are less likelihood
to pay dividends respectively. State-controlled firms are more likely to pay dividends than non-
state-controlled firms, this may be explained that state-controlled firms need funds to finance
other financially constrained SOEs or public projects (D. Chen et al., 2009). Furthermore, the
second step regressions show supporting evidence of the transaction cost theory that firms with
106
higher asset growth and market-to-book ratio tend to have lower dividend yields. Moreover, in
line with the agency theory, insider ownership has a negative impact on dividend payout ratio.
Contrary to free cash flow hypothesis, free cash flows to total assets ratio is negatively related
to payout ratio, this can be explained by agency conflicts between managers and shareholder
and firms’ investment opportunities. The research results of this essay provide some
implications for investors, firm managers and policy makers as follows: (1) Investors should be
aware of the presence of insiders’ expropriation to react and seek more effective mechanism to
control this problem. If investors prefer dividend payment to capital gains, they should choose
stocks of more mature and state-controlled firms; (2) Firm managers should retain more
earnings to finance investment opportunities if firm liquidity is higher since transaction costs
are significant. Higher liquidity implies lower information asymmetry, hence managers do not
need to signal the market with dividend payment; (3) Policy makers in Vietnamese stock
market should improve regulations to manage and control insiders’ expropriation activities
more effectively. Besides, this essay also contains limitations. The research period of 5 years is
short. The data on corporate governance is not available. Moreover, this study only investigates
dividend policy in one newly established stock market. Therefore, the understanding of
dividend policy is not complete. Future research should examine dividend policy across newly
established markets to find special feature of dividend policy in terms of corporate governance,
state control or cross ownership.
The second essay investigates the behavior of stock prices on the ex-dividend in Vietnamese
stock market and provides supporting evidence of the short-term trading to capture dividends.
The extant literature shows that ex-dividend day anomaly of stock price can be explained by
three groups of factors including taxation (Elton & Gruber, 1970), transaction costs (Kalay,
1982a) and market microstructure including limit order adjustment regulation (Dubofsky, 1992,
1997), bid-ask spread (Frank & Jagannathan, 1998) and price discreteness (Bali & Hite, 1998).
This study finds that the trading regulations (i.e. periodic call auction to determine opening and
closing prices, significantly small tick size and no market maker) make the existing
microstructure theories ineffective to explain this anomaly in Vietnamese stock market.
Moreover, Vietnamese tax policy shows no favorable treatment of capital gains to dividends
and short-selling activities are prohibited under Vietnamese Security Law. With special
features, Vietnamese stock market is a good environment to examine the ex-day stock price
behavior. The research findings report that the observed mean and median values of both price
drop to dividend ratios and price drop to cum-day price ratios are significantly less than their
107
theoretical values under parametric and non-parametric tests respectively. This implies that
contrary to Miller & Modigliani’s dividend irrelevance argument, in this case dividends lead to
more-than-dividend price drops on the ex-dividend day. To find the explanation for this
anomaly, we continue to compare the observed values of price drop to dividend ratios and its
theoretical values under the impact of taxes suggested by Elton and Gruber (1970). The
research results show that while all of the observed values are much lower than one, most of
the theoretical values are equal to or greater that one. This is inconsistent with the tax clientele
theory. Then, examining the behavior of abnormal returns and abnormal trading volume around
the ex-dividend day with the event study methodology, we find supporting evidence of the
dividend capture hypothesis as follows: (1) Abnormal returns are significantly positive and
negative before and after stocks go ex-dividend. (2) Abnormal trading volume is positive
around the ex-dividend day. In addition, this is confirmed by the significantly negatively
relationship between dividend yield and the ex-day abnormal return, this relationship is
consistent with the institutional environment in which the round trip transaction cost α is
smaller than ½. These results indicate that investors prefer dividends and try to capture
dividends by buying stocks cum-dividend and selling them ex-dividend regardless of different
tax rates on dividends and capital gains. The research findings of this essay supply some
implications for investors and policy makers as follows: (1) Investors should understand the
mechanism of dividend capture activities in Vietnamese stock market to make right decisions
on selling or buying their stocks to obtain profits; (2) Policy makers cannot use tax treatment of
dividends and capital gains to create impact on dividend policy in Vietnamese stock market
since marginal investors on the ex-dividend day are indifferent to tax treatment. Moreover, one
limitation of this study lies at the methodology. We only use the ex-day stock price behavior to
eliminate the explanations of the existing theories and find supporting evidence to support the
dividend capture theory without seeking other explanations from the institutional environment
of the stock market. In addition, this study shows that short-term dividend capture trading
dominates the stock price behavior on the ex-dividend day but fails to investigate exactly which
group of investors (e.g. foreign or domestic, institutional or individual investors) are marginal
investors. In the future, this research should be extended to find the group of investors
dominating the ex-day stock price behavior when data is available.
The third essay tests the two agency models of dividends, namely the outcome model based on
agency costs of shareholders and the substitute model based on agency costs of creditors when
agency costs increase under the impact of an exogenous shock. The extant literature of
108
international corporate governance shows both theoretical and empirical supporting evidence of
the outcome model of the agency costs of equity and the substitute model based on agency costs
of creditors (Brockman & Unlu, 2009; La Porta et al., 2000; Shao et al., 2013). This study
argues that the global financial crisis is an exogenous shock leading to increases in both agency
costs of shareholders and creditors. Therefore, this exogenous shock is hypothesized to make
the two models of agency costs less effective. With a research data of 133,279 observations
from 23,962 firms incorporated in 41 countries, we find that the legal protection of shareholders
and creditors affects both the likelihood of paying dividends and dividend payout ratios in the
pre-crisis period is less effectively than in the post-crisis period. This indicates that under the
impact of the financial crisis, lower expected return on investment leads to lower marginal costs
of insiders’ expropriation; hence insiders tend to expropriate minority shareholders more
severely. On the other hand, firms with more external financial constraints are less likely to pay
dividends as the substitute of weak creditor rights. Besides, firms are also less likely to meet the
demand of restricting dividends from creditors and tend to pay more dividends as a means to
establish good reputation on their business activities. These results are consistent with the
hypothesis that both agency models of dividend become less effective or both shareholders and
creditors are expropriated more severely when both agency costs tend to increase. In addition,
we also find that the decrease in the impact of legal protection of creditors (shareholders) on
dividend policy between the pre- and post-crisis periods is larger in the group of strong
shareholder (creditor) protection. This indicates that under the increases of both agency costs,
ceteris paribus, creditors are more expropriated with greater extent if shareholders are
sufficiently protected and creditors are more expropriated with greater extent if creditors are
sufficiently protected. Moreover, additional analyses using the reduced sample which is the full
sample excluding five large countries including U.S., Japan, India, Taiwan and U.K., various
measures of shareholder rights and creditor rights and additional country-level control variables
(i.e. financial architecture, tax advantage of dividends) show consistent findings. The research
results of this essay provide some implications for shareholder, creditors and policy makers as
follows: Shareholders and creditors should recognize that they are more expropriated under the
impact of the global financial crisis or other exogenous shocks increasing the likelihood of
expropriation and should react to this problem reasonably. In addition, when the expropriation
becomes more severe, creditors (shareholders) should have more control and reaction to reduce
the agency problem when shareholders (creditors) are protected sufficiently. Besides, policy
makers should have more effective regulations to protect shareholders and creditors under the
impact of financial crisis, especially when the legal protection of shareholders or creditors is
109
weak. Furthermore, this only focuses on the differences in the effects of shareholder and
creditor rights on dividend policy between the pre- and post-crisis periods. Future research may
continue to investigate the differences in the effect of corporate governance on dividend policy
at firm level or the catering incentives on dividend policy or dividend smoothing behavior
across countries under the impact of the global financial crisis.
In conclusion, the three essays present more understanding of dividend policy with different
aspects. The first essay reports that at firm level, investors are less likely to receive dividends
and receive lower dividends when they experience more expropriation by insiders and low
information asymmetry. In addition, they are also less likely to gain dividends when firms are
state-controlled or have higher investment opportunities, larger size and higher maturity. The
second essay shows investors’ preference of dividends in Vietnamese stock market with
supporting evidence of dividend capture behavior around the ex-dividend day. The third essay
indicates that increases in both agency costs of equity and debt lead to more expropriation of
shareholders and creditors; this increase in expropriation of creditors (shareholders) is more
severe if shareholders (creditors) have stronger legal protection.

This page is intentionally left blank
TROIS ESSAIS DE LA POLITIQUE DE DISTRIBUTION DE DIVIDENDES
Mots-clefs : politique de dividende, Heckman, ex-dividende, cours boursier, droits des
créanciers, droits des actionnaires, crise financière
La politique de distribution de dividendes joue un rôle important dans la finance d’entreprise
pour deux raisons : Premièrement, la proportion de profits payée sous forme de dividende est
une des décisions financières essentielles du dirigeant d’entreprise. Deuxièmement, une
compréhension adéquate de la politique de distribution de dividende est indispensable pour
d’autres domaines de l’économie financière. En particulier, les théories d’évaluation des actifs
financiers, de fusion-acquisition, de structure de capital et de décisions d’investissement
dépendent de la façon et de la raison de la distribution de dividendes (Allen & Michaely,
1995). Dans son ouvrage classique, Black (1976) ne parvient pas à trouver un argument
raisonnable pour expliquer la cause de la distribution de dividendes en espèces aux actionnaires
et il considère dividendes comme un « puzzle ». Depuis lors, la politique de dividendes est
intensément étudiée par les économistes financiers et elle devient un des sujets le plus
discutables de la finance d’entreprise. Au début, Miller and Modigliani (1961) propose une
théorie impertinente de la politique de dividendes en supposant que les marchés capitaux sont
parfaits et complets. Pourtant, les études ultérieures trouvent que le marché n’est pas parfait et
complet alors la politique de dividendes est affectée par la friction du marché, y compris
l’asymétrie d’information, problèmes d'agence, les coûts de transaction, la maturité de
l’entreprise, et impôts. Après, plusieurs théories discutent qu’il y a l’asymétrie d’information
entre la gestion d’entreprise et les investisseurs extérieurs, le directeur utilise dividendes
comme un signal de la profitabilité prévue de l’entreprise (Bhattacharya, 1979; Heinkel, 1978;
John & Williams, 1985). La théorie d’agence concentre au conflit d’intérêt entre les
gestionnaires et les actionnaires et estime que la distribution de dividendes est un dispositif afin
d'atténuer les problèmes d'agence et de réduire les coûts d'agence (Easterbrook, 1984; M. C.
Jensen, 1986; M. C. Jensen & Meckling, 1976). La théorie de coûts de transaction, de résidu, la
théorie de la hiérarchie des préférences (pecking-order) soutiennent que les entreprises
préfèrent financer les projets entrepreneuriaux par les bénéfices non distribués que le
financement extérieur ; donc les entreprises ne veulent pas payer les dividendes quand ils ont
des opportunités d’investir (Higgins, 1972; Stewart C. Myers & Nicholas S. Majluf, 1984;
Rozeff, 1982; Weston & Brigham, 1979). Selon la théorie du cycle de vie, les entreprises
matures et établies distribuent plus dividendes grâce aux ressources abondantes et réduisent les
projets d’investissements tandis que les jeunes entreprises avec des ressources limitées ont
tendance à payer moins les dividendes pour financer les possibilités d’investissement
(DeAngelo & DeAngelo, 2006; Grullon et al., 2002). La théorie de la clientèle d'impôt utilise
la différence entre le taux d’impôt sur les gains en capital et les dividendes reçus pour expliquer
la politique de dividende. Le traitement favorable des gains en capital à des dividendes rend les
entreprises réduire dividendes afin de maximiser la richesse de leurs actionnaires (Litzenberger
& Ramaswamy, 1979). En outre, la variation du cours de bourse à la date ex-dividende est
également une anomalie. Nombreuses études concluent que la baisse du cours boursier à la date
ex-dividende est inférieure au montant de dividende alors qu'il est supposé être égal au montant
du dividende sous la théorie impertinente de dividendes. Cette anomalie est généralement
expliquée par trois groupes de facteurs, y compris la fiscalité (Elton & Gruber, 1970), les coûts
de transaction (Kalay, 1982a) et la microstructure du marché (Bali & Hite, 1998; Dubofsky,
1992; Frank & Jagannathan, 1998). De plus, il y a récemment la nouvelle tendance de
recherche, à propos de gouvernance d’entreprise, qui se concentre sur la politique de dividendes
entre les différents régimes juridiques. La politique de dividendes est examinée en utilisant une
paire de modèle basé sur les coûts d’agence de capitaux propres et ceux de dette (Brockman &
Unlu, 2009; La Porta et al., 2000). Le premier modèle prévoit que la distribution de dividendes
est le résultat de la pression des actionnaires. En revanche, le deuxième modèle prédit que le
payement de dividendes est comme un remplaçant à la faible protection des créanciers car les
entreprises veulent construire une bonne réputation relative au traitement équitable et répondre
à la demande des créanciers de restreindre de dividendes dans les contrats privés de crédit.
Cette thèse de doctorat fournit de nouvelles preuves au sujet de théories mentionnées ci-dessus
de la politique de dividendes avec trois essaies distincts comme suivant :
Le premier essai : Une approche en deux étapes pour étudier la politique de dividende:
Evidence du marché boursier vietnamien
Le premier essai explore la politique de dividende au marché boursier vietnamien avec une
approche en deux étapes. Cette étude choisit le marché boursier vietnamien pour examiner la
politique de dividende pour trois raisons suivantes: (1) Il est un marché qui est créé récemment
et ses règlements et l’expérience des investisseurs de contrôler les problèmes d’agence sont
probablement incomplètes, il est donc un bon environnement pour étudier la théorie de l'agence.
(2) Avec les courtes périodes florissantes et effondrées, les coûts de transaction de la
mobilisation de fonds extérieurs et la nécessité d'utiliser les dividendes comme des signaux à
des investisseurs extérieurs varient rapidement. Par conséquent, tester la théorie des coûts de
transaction et la théorie de signalisation de dividendes est plus approprié; (3) Les entreprises
contrôlées par l'Etat représentent un grand pourcentage dans les entreprises cotées, ce sera
l'occasion d'examiner la politique de dividende sous l'effet du contrôle de l'Etat qui est
approprié au "problème de principal-agent» (Gugler, 2003) et la demande de plus d'argent pour
financer les entreprises d'Etat ayant des contraintes financières ou les projets publics (D. Chen
et al., 2009). Par ailleurs, nous argumentons que la politique de dividendes n’est pas
simplement la décision de la proportion de bénéfices que les entreprises doivent distribuer en
espèces. La politique de dividendes est un processus compliqué avec deux étapes : la décision
de payer ou ne pas payer et celle de distribution de dividendes. En outre, au point de vue
économétrique, le biais de sélection se pose lorsque la régression OLS est utilisée pour
l’échantillon complet des non-payeurs et des payeurs ou le sous-échantillon des payeurs
puisque les dividendes sont continus a la droite de zéro. Par conséquent, cette étude examine la
politique de dividendes du marché boursier vietnamien en approchant la régression de deux
étapes de Heckman qui règle le biais de sélection. Cette étude est commencée par examiner les
facteurs qui influent sur la probabilité de distribution de dividendes, à savoir la rentabilité, la
taille de l’entreprise, les opportunités d’investissement, la composition du capital gagné/
contribué, la liquidité, la propriété d’initiés et le control de l’Etat. Ensuite, nous examinons les
impacts des opportunités d’investissement, la liquidité du titre, les flux de trésorerie disponible,
la propriété d’initiés sur la magnitude de dividende mesurée par le ratio de distribution de
dividende et le rendement de dividende. L'échantillon de l'étude se compose de 1 339
observations d’Ho Chi Minh Stock Exchange (HSX) et Ha Noi Stock Exchange (HNX) pendant
la période 2006-2011.
La première étape du modèle de régression de Heckman présente la relation entre les
caractéristiques de l'entreprise et la probabilité de distribution de dividendes. Conformément à
Denis et Osobov (2008); Eugene F. Fama et French (2001), le ratio market-to-book, une mesure
des opportunités d’investissement, est en relation négative avec la probabilité de la distribution
de dividendes alors que la rentabilité et la taille de l'entreprise ont un impact positif sur la
probabilité de distribution de dividendes. Les entreprises préfèrent le financement interne au
financement externe; c’est pourquoi, il est peu probable que les entreprises payent dividendes
quand ils possèdent plus de possibilités d’investissement. En outre, les entreprises dont la
rentabilité est plus élevée sont plus probables d'avoir des flux de trésorerie résiduel après avoir
financé leurs projets d'investissement ; ils sont donc plus probables de payer dividendes.
D’ailleurs, les grandes entreprises peuvent mobiliser des fonds externes pour financer
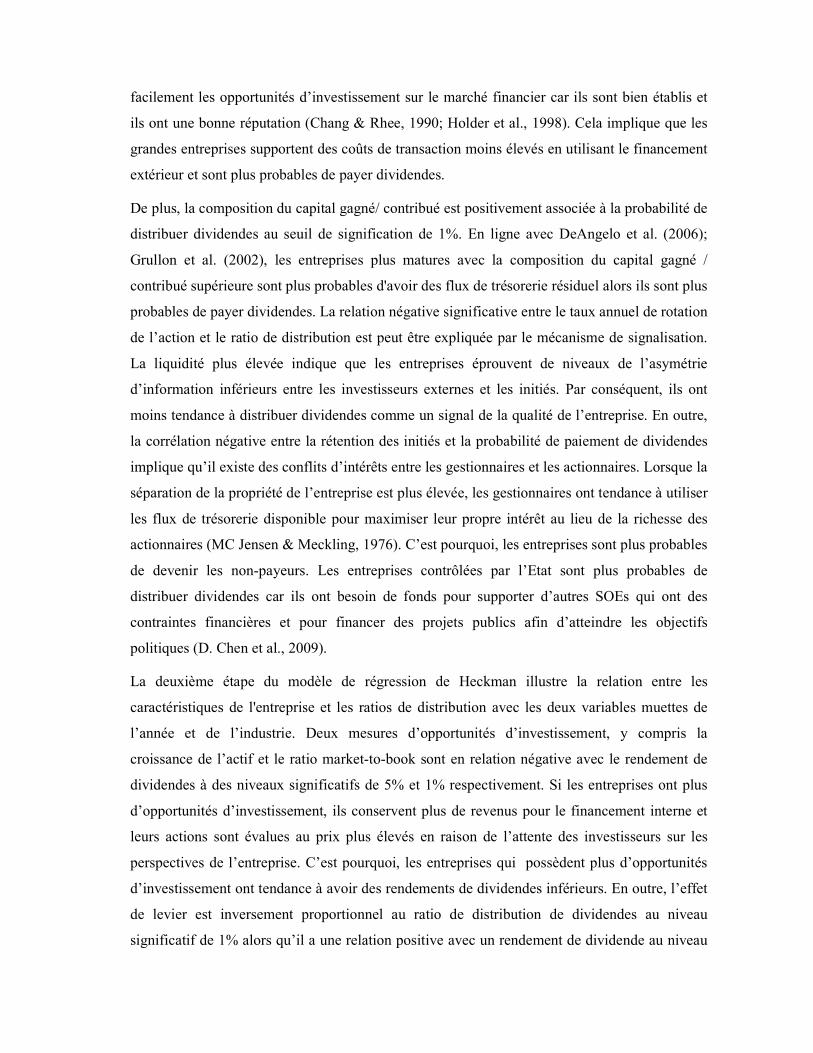
facilement les opportunités d’investissement sur le marché financier car ils sont bien établis et
ils ont une bonne réputation (Chang & Rhee, 1990; Holder et al., 1998). Cela implique que les
grandes entreprises supportent des coûts de transaction moins élevés en utilisant le financement
extérieur et sont plus probables de payer dividendes.
De plus, la composition du capital gagné/ contribué est positivement associée à la probabilité de
distribuer dividendes au seuil de signification de 1%. En ligne avec DeAngelo et al. (2006);
Grullon et al. (2002), les entreprises plus matures avec la composition du capital gagné /
contribué supérieure sont plus probables d'avoir des flux de trésorerie résiduel alors ils sont plus
probables de payer dividendes. La relation négative significative entre le taux annuel de rotation
de l’action et le ratio de distribution est peut être expliquée par le mécanisme de signalisation.
La liquidité plus élevée indique que les entreprises éprouvent de niveaux de l’asymétrie
d’information inférieurs entre les investisseurs externes et les initiés. Par conséquent, ils ont
moins tendance à distribuer dividendes comme un signal de la qualité de l’entreprise. En outre,
la corrélation négative entre la rétention des initiés et la probabilité de paiement de dividendes
implique qu’il existe des conflits d’intérêts entre les gestionnaires et les actionnaires. Lorsque la
séparation de la propriété de l’entreprise est plus élevée, les gestionnaires ont tendance à utiliser
les flux de trésorerie disponible pour maximiser leur propre intérêt au lieu de la richesse des
actionnaires (MC Jensen & Meckling, 1976). C’est pourquoi, les entreprises sont plus probables
de devenir les non-payeurs. Les entreprises contrôlées par l’Etat sont plus probables de
distribuer dividendes car ils ont besoin de fonds pour supporter d’autres SOEs qui ont des
contraintes financières et pour financer des projets publics afin d’atteindre les objectifs
politiques (D. Chen et al., 2009).
La deuxième étape du modèle de régression de Heckman illustre la relation entre les
caractéristiques de l'entreprise et les ratios de distribution avec les deux variables muettes de
l’année et de l’industrie. Deux mesures d’opportunités d’investissement, y compris la
croissance de l’actif et le ratio market-to-book sont en relation négative avec le rendement de
dividendes à des niveaux significatifs de 5% et 1% respectivement. Si les entreprises ont plus
d’opportunités d’investissement, ils conservent plus de revenus pour le financement interne et
leurs actions sont évalues au prix plus élevés en raison de l’attente des investisseurs sur les
perspectives de l’entreprise. C’est pourquoi, les entreprises qui possèdent plus d’opportunités
d’investissement ont tendance à avoir des rendements de dividendes inférieurs. En outre, l’effet
de levier est inversement proportionnel au ratio de distribution de dividendes au niveau
significatif de 1% alors qu’il a une relation positive avec un rendement de dividende au niveau
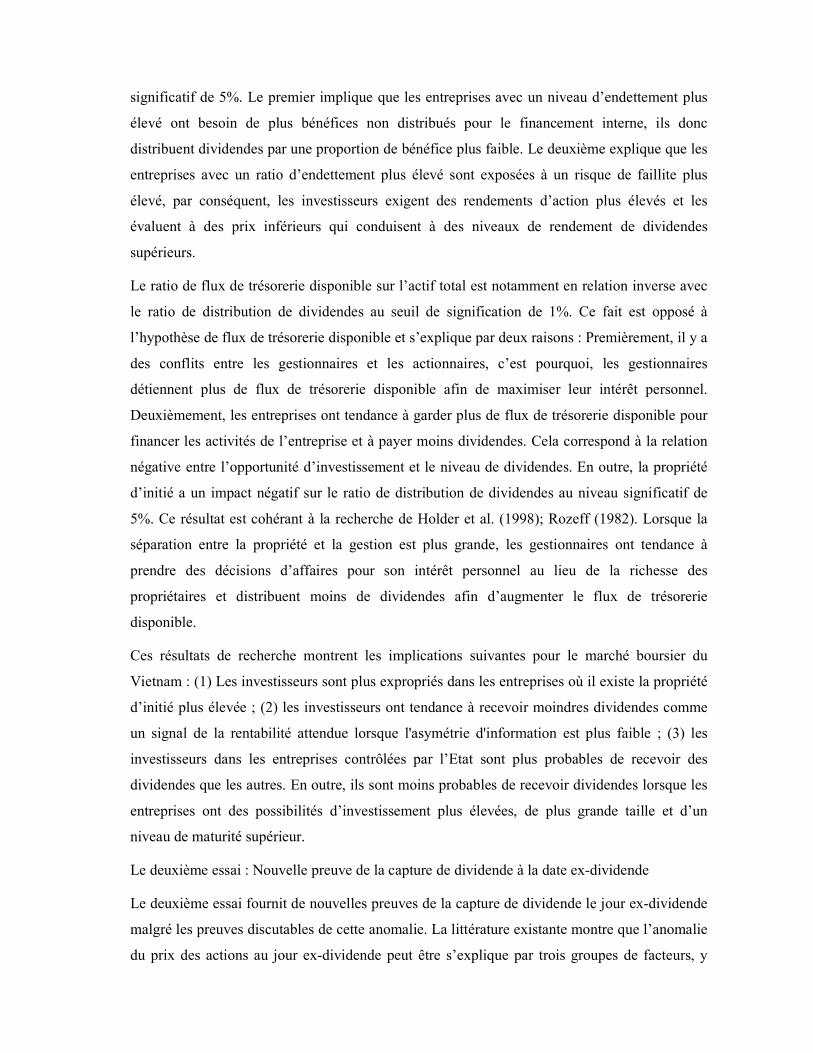
significatif de 5%. Le premier implique que les entreprises avec un niveau d’endettement plus
élevé ont besoin de plus bénéfices non distribués pour le financement interne, ils donc
distribuent dividendes par une proportion de bénéfice plus faible. Le deuxième explique que les
entreprises avec un ratio d’endettement plus élevé sont exposées à un risque de faillite plus
élevé, par conséquent, les investisseurs exigent des rendements d’action plus élevés et les
évaluent à des prix inférieurs qui conduisent à des niveaux de rendement de dividendes
supérieurs.
Le ratio de flux de trésorerie disponible sur l’actif total est notamment en relation inverse avec
le ratio de distribution de dividendes au seuil de signification de 1%. Ce fait est opposé à
l’hypothèse de flux de trésorerie disponible et s’explique par deux raisons : Premièrement, il y a
des conflits entre les gestionnaires et les actionnaires, c’est pourquoi, les gestionnaires
détiennent plus de flux de trésorerie disponible afin de maximiser leur intérêt personnel.
Deuxièmement, les entreprises ont tendance à garder plus de flux de trésorerie disponible pour
financer les activités de l’entreprise et à payer moins dividendes. Cela correspond à la relation
négative entre l’opportunité d’investissement et le niveau de dividendes. En outre, la propriété
d’initié a un impact négatif sur le ratio de distribution de dividendes au niveau significatif de
5%. Ce résultat est cohérant à la recherche de Holder et al. (1998); Rozeff (1982). Lorsque la
séparation entre la propriété et la gestion est plus grande, les gestionnaires ont tendance à
prendre des décisions d’affaires pour son intérêt personnel au lieu de la richesse des
propriétaires et distribuent moins de dividendes afin d’augmenter le flux de trésorerie
disponible.
Ces résultats de recherche montrent les implications suivantes pour le marché boursier du
Vietnam : (1) Les investisseurs sont plus expropriés dans les entreprises où il existe la propriété
d’initié plus élevée ; (2) les investisseurs ont tendance à recevoir moindres dividendes comme
un signal de la rentabilité attendue lorsque l'asymétrie d'information est plus faible ; (3) les
investisseurs dans les entreprises contrôlées par l’Etat sont plus probables de recevoir des
dividendes que les autres. En outre, ils sont moins probables de recevoir dividendes lorsque les
entreprises ont des possibilités d’investissement plus élevées, de plus grande taille et d’un
niveau de maturité supérieur.
Le deuxième essai : Nouvelle preuve de la capture de dividende à la date ex-dividende
Le deuxième essai fournit de nouvelles preuves de la capture de dividende le jour ex-dividende
malgré les preuves discutables de cette anomalie. La littérature existante montre que l’anomalie
du prix des actions au jour ex-dividende peut être s’explique par trois groupes de facteurs, y
compris la fiscalité, les coûts de transaction et la microstructure du marché. Elton et Gruber
(1970) ont initialement proposé la théorie de la clientèle d'impôt qui indique que le
comportement d'actions ordinaires d'une entreprise à ce jour doit être associé à des taux
marginaux d'imposition de ses actionnaires. Un investisseur qui vend ses bourses avant ce jour
perd le droit de recevoir dividendes. Cependant, s’il les détient jusqu’au jour ex-dividende, il
s’attend à les vendre à un prix inférieur à cause de la rétention de dividendes. Au sujet de cette
analyse, le ratio de la baisse de prix sur dividende reflète toujours les taux marginaux
d'imposition relatif de dividendes et de gain en capital. Pourtant, Kalay (1982b) argumente que,
en l’absence de l’effet de la clientèle de l’impôt, il y a des investisseurs dont le moment de la
vente et de la transaction sont différents à cause de dividendes. Si la dépasse de la baisse
prévue de prix le jour ex-dividende par rapport au dividende est supérieur aux coûts d'achat et
de vente d'actions, les investisseurs pourraient vendre à découvert leurs stocks les jours où les
dividendes sont encore attachés et les racheter quand ils arrivent à ex-dividende afin de réaliser
des bénéfices. D’autre part, si la dépasse de la baisse prévue de prix le jour ex-dividende par
rapport au dividende par action est supérieur aux coûts de transaction, les investisseurs ont
tendance à acheter des actions les jours cum-dividende et les vendre les jours ex-dividende pour
obtenir les bénéfices. Par conséquent, le bénéfice ne se réalise que s’il n’a pas exploité par des
activités d’arbitrage et l’écart entre la baisse de prix et le montant du dividende est des coûts de
transaction. Les théories de la microstructure du marché argumente que les caractéristiques de
l’environnement institutionnel, le ratio de la baisse de prix sur dividende qui est inférieur à un
le jour ex-dividende est expliqué par : l’arrondissage vers le bas du prix des ordres limites
d’achat existants à un multiple de tique (Dubofsky, 1992, 1997) ; (2) l’écart du cours d’achat le
jour cum-dividende et du cours de vente le jour ex-dividende (Frank & Jagannathan, 1998) et
(3) la discrétion de prix (Bali et Hite, 1998). Cette étude trouve que le marché boursier
vietnamien est un laboratoire plein de promesse pour étudier le comportement du cours boursier
le jour ex-dividende en raison de ses caractéristiques particulières. Tout d’abord, le marché
utilise le mécanisme de vente périodique aux enchères pour déterminer le prix d’ouverture et de
clôture et il n’y a pas de teneur de marché. Deuxièmement, la taille de la tique est beaucoup
plus petite que le montant de dividende. Ceux-ci impliquent les théories de microstructure et de
marché basés sur l’écart acheteur-vendeur et la taille de la tique ne sont pas les explications
applicables. Troisièmement, il n’y a pas beaucoup de traitement préférentiel des gains en capital
à des dividendes et c’est contrairement à la taxation des gains en capital et des dividendes dans
les autres marchés. Enfin, la vente à découvert est interdite.
Comme les études antérieures, nous vérifions à la fois le comportement du cours boursier et le
volume de transaction autour du jour ex-dividende en utilisant la méthodologie de l’étude de
cas afin de déterminer si les traders à court-terme sont des investisseurs marginaux à l’ex-jour.
Le comportement de cours boursier est d’abord et couramment utilisé mais il n’est pas assez
pour trouver des investisseurs marginaux à cause d’autres facteurs (par exemple : les impôts, la
liquidité du marché). En outre, le volume de transaction est donc utilisé (Lakonishok &
Vermaelen, 1986). De plus, une analyse de régression OLS qui examine la relation entre le
rendement de dividendes et le rendement anormal à l’ex-jour est également utilisée afin de
trouver des preuves des traders marginaux. Pour but de tester la robustesse des résultats de la
recherche, nous divisons l’échantillon complet en deux sous-échantillons en basant du
changement de la politique fiscale. Le premier sous-échantillon est de 2006 à 2009 et le
deuxième sous-échantillon est de 2010 à 2011.
Les résultats de la recherche montrent que les ratios de la baisse moyenne observée de prix sur
dividende et les ratios de la baisse de prix sur le prix à cum-jour sont inférieurs aux valeurs
théoriques au seuil significatif de 1% dans l’échantillon complet et dans les deux sous-
échantillons. De plus, le test non-paramétrique illustre également qu’il existe des différences
significatives entre les médianes théoriques des ratios de la baisse de prix et les médianes
observées à 1%. La forte consistance des résultats de t-test et « Wilcoxon-signed rank test »
indique qu’il est contraire à l’argument de marché parfait de Miller et Modigliani qui supportent
l’indifférence entre le paiement de dividende et la baisse de prix à l’ex-jour, dans ce cas, les
investisseurs ne sont pas indifférents entre les dividendes et les gains en capital. Cependant,
sous l’impact de la politique fiscale 2006-2011, la plupart des ratios attendus de la baisse de
prix sur dividende doit être égale ou supérieure à un. C’est pourquoi, nous constatons que le
traitement fiscal de dividendes et de gains en capital est incapable à expliquer le comportement
du cours boursier le jour ex-dividende au marché boursier du Vietnam. Nous continuons à
étudier les effets de la capture de dividende sur les rendements à l’ex-jour en examinant le
comportement du cours boursier autour des jours ex-dividende. Dans l'échantillon complet, les
résultats de la recherche indiquent que les rendements anormaux sont significativement positifs
aux plusieurs jours pendant la période avant ex-jour et significativement négatif au jour + 1.
Dans le sous-échantillon de 2006 à 2009, les rendements anormaux sont positifs au seuil
significatif de 1% pour les deux modèles au Jour – 5 ; toutefois, les rendements anormaux
pendant la période après le jour ex-dividende ne sont pas significativement différents de zéro
malgré leurs valeurs moyennes négatives de Jour + 1 à Jour + 8. Le sous-échantillon de la
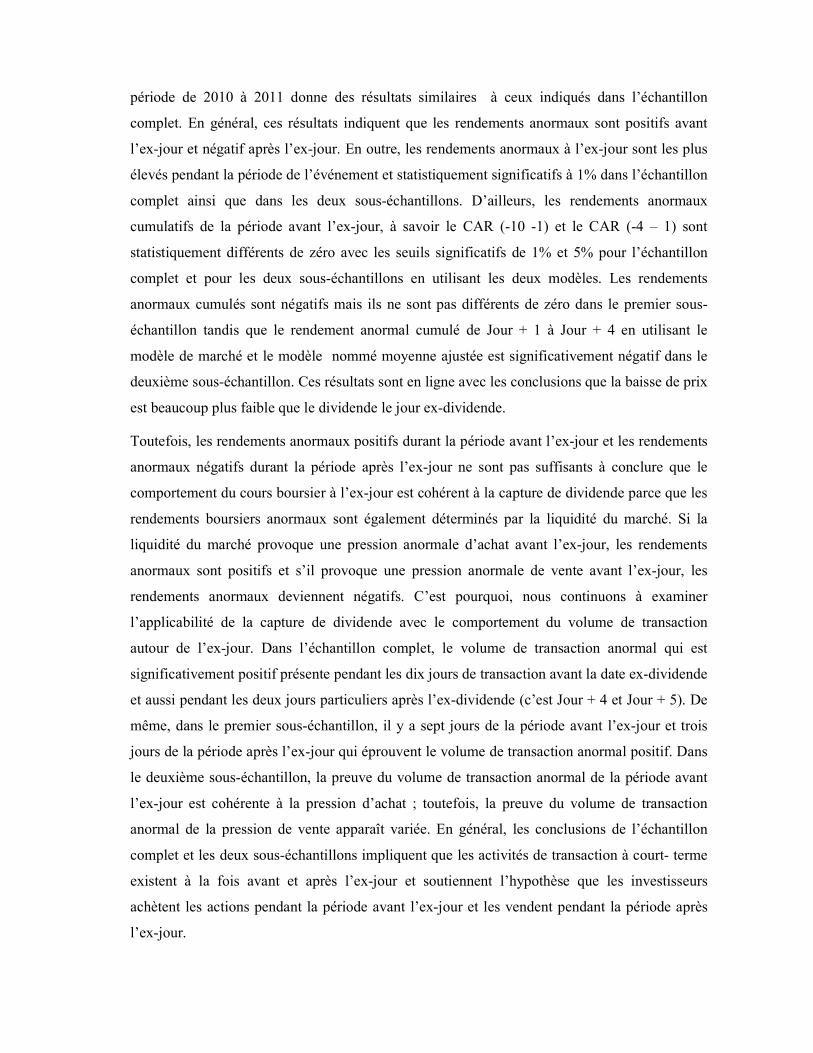
période de 2010 à 2011 donne des résultats similaires à ceux indiqués dans l’échantillon
complet. En général, ces résultats indiquent que les rendements anormaux sont positifs avant
l’ex-jour et négatif après l’ex-jour. En outre, les rendements anormaux à l’ex-jour sont les plus
élevés pendant la période de l’événement et statistiquement significatifs à 1% dans l’échantillon
complet ainsi que dans les deux sous-échantillons. D’ailleurs, les rendements anormaux
cumulatifs de la période avant l’ex-jour, à savoir le CAR (-10 -1) et le CAR (-4 – 1) sont
statistiquement différents de zéro avec les seuils significatifs de 1% et 5% pour l’échantillon
complet et pour les deux sous-échantillons en utilisant les deux modèles. Les rendements
anormaux cumulés sont négatifs mais ils ne sont pas différents de zéro dans le premier sous-
échantillon tandis que le rendement anormal cumulé de Jour + 1 à Jour + 4 en utilisant le
modèle de marché et le modèle nommé moyenne ajustée est significativement négatif dans le
deuxième sous-échantillon. Ces résultats sont en ligne avec les conclusions que la baisse de prix
est beaucoup plus faible que le dividende le jour ex-dividende.
Toutefois, les rendements anormaux positifs durant la période avant l’ex-jour et les rendements
anormaux négatifs durant la période après l’ex-jour ne sont pas suffisants à conclure que le
comportement du cours boursier à l’ex-jour est cohérent à la capture de dividende parce que les
rendements boursiers anormaux sont également déterminés par la liquidité du marché. Si la
liquidité du marché provoque une pression anormale d’achat avant l’ex-jour, les rendements
anormaux sont positifs et s’il provoque une pression anormale de vente avant l’ex-jour, les
rendements anormaux deviennent négatifs. C’est pourquoi, nous continuons à examiner
l’applicabilité de la capture de dividende avec le comportement du volume de transaction
autour de l’ex-jour. Dans l’échantillon complet, le volume de transaction anormal qui est
significativement positif présente pendant les dix jours de transaction avant la date ex-dividende
et aussi pendant les deux jours particuliers après l’ex-dividende (c’est Jour + 4 et Jour + 5). De
même, dans le premier sous-échantillon, il y a sept jours de la période avant l’ex-jour et trois
jours de la période après l’ex-jour qui éprouvent le volume de transaction anormal positif. Dans
le deuxième sous-échantillon, la preuve du volume de transaction anormal de la période avant
l’ex-jour est cohérente à la pression d’achat ; toutefois, la preuve du volume de transaction
anormal de la pression de vente apparaît variée. En général, les conclusions de l’échantillon
complet et les deux sous-échantillons impliquent que les activités de transaction à court- terme
existent à la fois avant et après l’ex-jour et soutiennent l’hypothèse que les investisseurs
achètent les actions pendant la période avant l’ex-jour et les vendent pendant la période après
l’ex-jour.
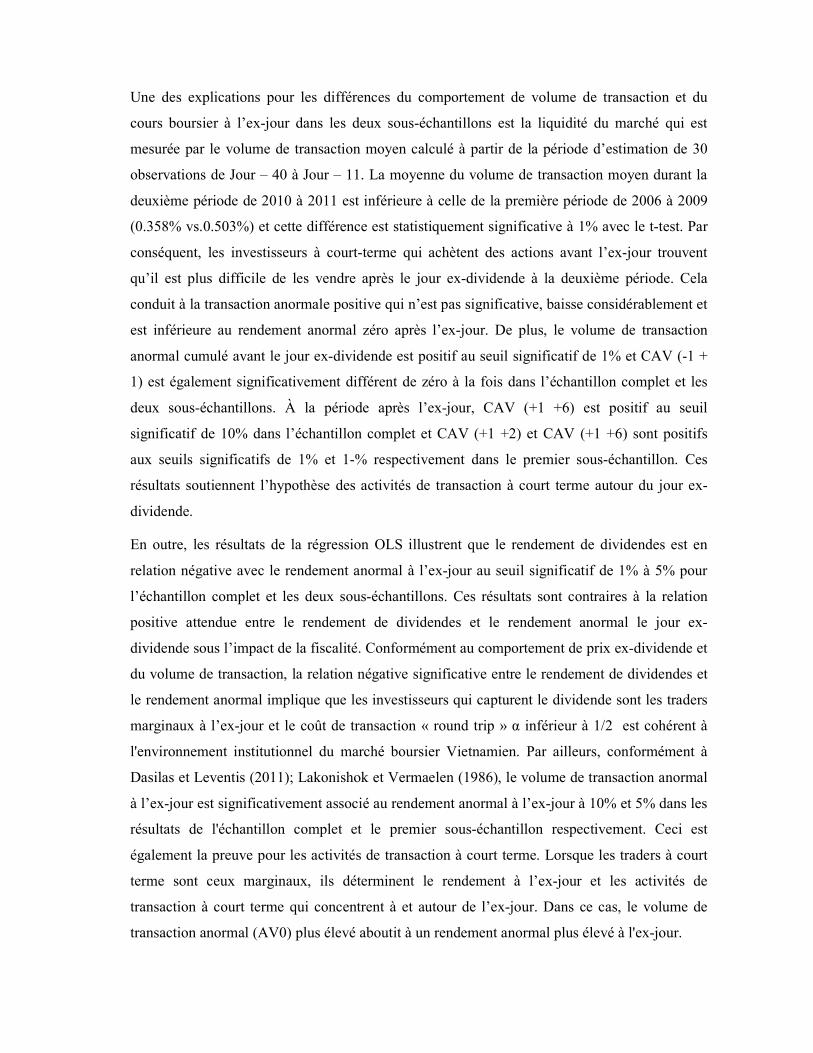
Une des explications pour les différences du comportement de volume de transaction et du
cours boursier à l’ex-jour dans les deux sous-échantillons est la liquidité du marché qui est
mesurée par le volume de transaction moyen calculé à partir de la période d’estimation de 30
observations de Jour – 40 à Jour – 11. La moyenne du volume de transaction moyen durant la
deuxième période de 2010 à 2011 est inférieure à celle de la première période de 2006 à 2009
(0.358% vs.0.503%) et cette différence est statistiquement significative à 1% avec le t-test. Par
conséquent, les investisseurs à court-terme qui achètent des actions avant l’ex-jour trouvent
qu’il est plus difficile de les vendre après le jour ex-dividende à la deuxième période. Cela
conduit à la transaction anormale positive qui n’est pas significative, baisse considérablement et
est inférieure au rendement anormal zéro après l’ex-jour. De plus, le volume de transaction
anormal cumulé avant le jour ex-dividende est positif au seuil significatif de 1% et CAV (-1 +
1) est également significativement différent de zéro à la fois dans l’échantillon complet et les
deux sous-échantillons. À la période après l’ex-jour, CAV (+1 +6) est positif au seuil
significatif de 10% dans l’échantillon complet et CAV (+1 +2) et CAV (+1 +6) sont positifs
aux seuils significatifs de 1% et 1-% respectivement dans le premier sous-échantillon. Ces
résultats soutiennent l’hypothèse des activités de transaction à court terme autour du jour ex-
dividende.
En outre, les résultats de la régression OLS illustrent que le rendement de dividendes est en
relation négative avec le rendement anormal à l’ex-jour au seuil significatif de 1% à 5% pour
l’échantillon complet et les deux sous-échantillons. Ces résultats sont contraires à la relation
positive attendue entre le rendement de dividendes et le rendement anormal le jour ex-
dividende sous l’impact de la fiscalité. Conformément au comportement de prix ex-dividende et
du volume de transaction, la relation négative significative entre le rendement de dividendes et
le rendement anormal implique que les investisseurs qui capturent le dividende sont les traders
marginaux à l’ex-jour et le coût de transaction « round trip » α inférieur à 1/2 est cohérent à
l'environnement institutionnel du marché boursier Vietnamien. Par ailleurs, conformément à
Dasilas et Leventis (2011); Lakonishok et Vermaelen (1986), le volume de transaction anormal
à l’ex-jour est significativement associé au rendement anormal à l’ex-jour à 10% et 5% dans les
résultats de l'échantillon complet et le premier sous-échantillon respectivement. Ceci est
également la preuve pour les activités de transaction à court terme. Lorsque les traders à court
terme sont ceux marginaux, ils déterminent le rendement à l’ex-jour et les activités de
transaction à court terme qui concentrent à et autour de l’ex-jour. Dans ce cas, le volume de
transaction anormal (AV0) plus élevé aboutit à un rendement anormal plus élevé à l'ex-jour.
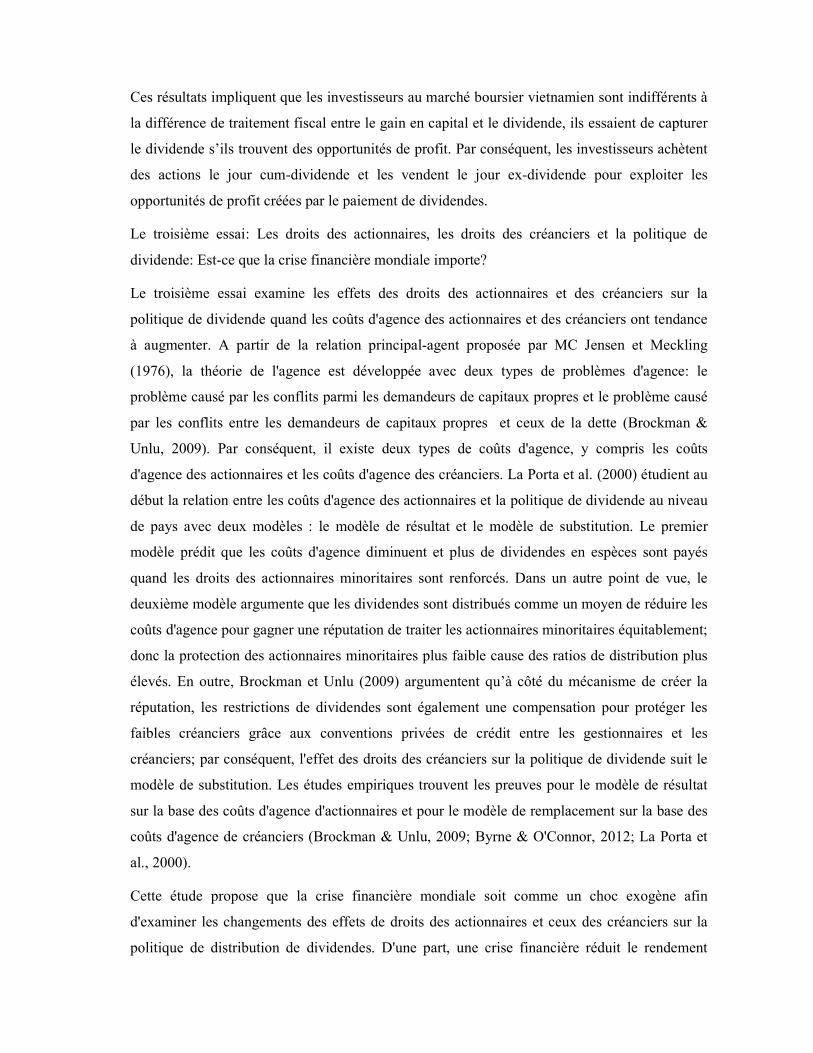
Ces résultats impliquent que les investisseurs au marché boursier vietnamien sont indifférents à
la différence de traitement fiscal entre le gain en capital et le dividende, ils essaient de capturer
le dividende s’ils trouvent des opportunités de profit. Par conséquent, les investisseurs achètent
des actions le jour cum-dividende et les vendent le jour ex-dividende pour exploiter les
opportunités de profit créées par le paiement de dividendes.
Le troisième essai: Les droits des actionnaires, les droits des créanciers et la politique de
dividende: Est-ce que la crise financière mondiale importe?
Le troisième essai examine les effets des droits des actionnaires et des créanciers sur la
politique de dividende quand les coûts d'agence des actionnaires et des créanciers ont tendance
à augmenter. A partir de la relation principal-agent proposée par MC Jensen et Meckling
(1976), la théorie de l'agence est développée avec deux types de problèmes d'agence: le
problème causé par les conflits parmi les demandeurs de capitaux propres et le problème causé
par les conflits entre les demandeurs de capitaux propres et ceux de la dette (Brockman &
Unlu, 2009). Par conséquent, il existe deux types de coûts d'agence, y compris les coûts
d'agence des actionnaires et les coûts d'agence des créanciers. La Porta et al. (2000) étudient au
début la relation entre les coûts d'agence des actionnaires et la politique de dividende au niveau
de pays avec deux modèles : le modèle de résultat et le modèle de substitution. Le premier
modèle prédit que les coûts d'agence diminuent et plus de dividendes en espèces sont payés
quand les droits des actionnaires minoritaires sont renforcés. Dans un autre point de vue, le
deuxième modèle argumente que les dividendes sont distribués comme un moyen de réduire les
coûts d'agence pour gagner une réputation de traiter les actionnaires minoritaires équitablement;
donc la protection des actionnaires minoritaires plus faible cause des ratios de distribution plus
élevés. En outre, Brockman et Unlu (2009) argumentent qu’à côté du mécanisme de créer la
réputation, les restrictions de dividendes sont également une compensation pour protéger les
faibles créanciers grâce aux conventions privées de crédit entre les gestionnaires et les
créanciers; par conséquent, l'effet des droits des créanciers sur la politique de dividende suit le
modèle de substitution. Les études empiriques trouvent les preuves pour le modèle de résultat
sur la base des coûts d'agence d'actionnaires et pour le modèle de remplacement sur la base des
coûts d'agence de créanciers (Brockman & Unlu, 2009; Byrne & O'Connor, 2012; La Porta et
al., 2000).
Cette étude propose que la crise financière mondiale soit comme un choc exogène afin
d'examiner les changements des effets de droits des actionnaires et ceux des créanciers sur la
politique de distribution de dividendes. D'une part, une crise financière réduit le rendement
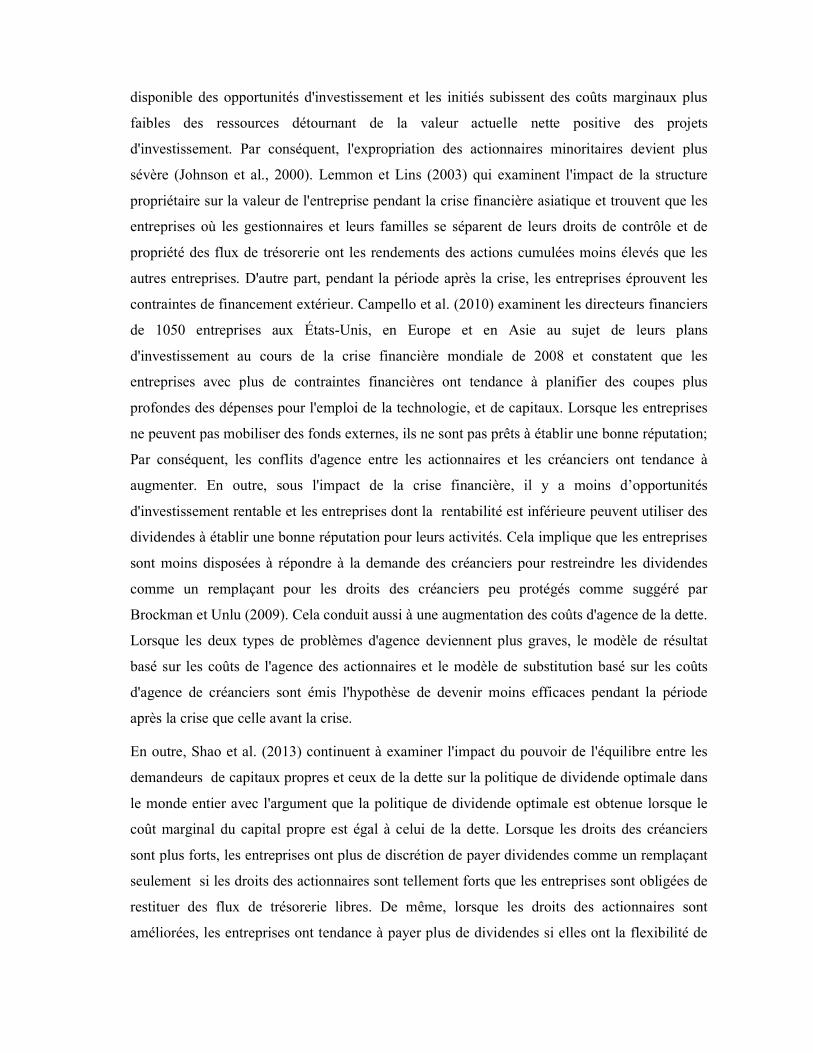
disponible des opportunités d'investissement et les initiés subissent des coûts marginaux plus
faibles des ressources détournant de la valeur actuelle nette positive des projets
d'investissement. Par conséquent, l'expropriation des actionnaires minoritaires devient plus
sévère (Johnson et al., 2000). Lemmon et Lins (2003) qui examinent l'impact de la structure
propriétaire sur la valeur de l'entreprise pendant la crise financière asiatique et trouvent que les
entreprises où les gestionnaires et leurs familles se séparent de leurs droits de contrôle et de
propriété des flux de trésorerie ont les rendements des actions cumulées moins élevés que les
autres entreprises. D'autre part, pendant la période après la crise, les entreprises éprouvent les
contraintes de financement extérieur. Campello et al. (2010) examinent les directeurs financiers
de 1050 entreprises aux États-Unis, en Europe et en Asie au sujet de leurs plans
d'investissement au cours de la crise financière mondiale de 2008 et constatent que les
entreprises avec plus de contraintes financières ont tendance à planifier des coupes plus
profondes des dépenses pour l'emploi de la technologie, et de capitaux. Lorsque les entreprises
ne peuvent pas mobiliser des fonds externes, ils ne sont pas prêts à établir une bonne réputation;
Par conséquent, les conflits d'agence entre les actionnaires et les créanciers ont tendance à
augmenter. En outre, sous l'impact de la crise financière, il y a moins d’opportunités
d'investissement rentable et les entreprises dont la rentabilité est inférieure peuvent utiliser des
dividendes à établir une bonne réputation pour leurs activités. Cela implique que les entreprises
sont moins disposées à répondre à la demande des créanciers pour restreindre les dividendes
comme un remplaçant pour les droits des créanciers peu protégés comme suggéré par
Brockman et Unlu (2009). Cela conduit aussi à une augmentation des coûts d'agence de la dette.
Lorsque les deux types de problèmes d'agence deviennent plus graves, le modèle de résultat
basé sur les coûts de l'agence des actionnaires et le modèle de substitution basé sur les coûts
d'agence de créanciers sont émis l'hypothèse de devenir moins efficaces pendant la période
après la crise que celle avant la crise.
En outre, Shao et al. (2013) continuent à examiner l'impact du pouvoir de l'équilibre entre les
demandeurs de capitaux propres et ceux de la dette sur la politique de dividende optimale dans
le monde entier avec l'argument que la politique de dividende optimale est obtenue lorsque le
coût marginal du capital propre est égal à celui de la dette. Lorsque les droits des créanciers
sont plus forts, les entreprises ont plus de discrétion de payer dividendes comme un remplaçant
seulement si les droits des actionnaires sont tellement forts que les entreprises sont obligées de
restituer des flux de trésorerie libres. De même, lorsque les droits des actionnaires sont
améliorées, les entreprises ont tendance à payer plus de dividendes si elles ont la flexibilité de
changer la distribution de dividende grâce à la forte protection de créancier. Avec un
échantillon de 139 168 observations de 39 pays de 1991 à 2010, leur recherche empirique
montre que le modèle de substitution (modèle de résultat) est plus efficace lorsque les
actionnaires minoritaires (créanciers) sont fortement protégés. Dans cet article, nous
développons un argument de cette stratégie d'équilibrage sous l'impact de la crise financière
mondiale comme suivant: Lorsque les problèmes d'agence deviennent plus sévères, ceteris
paribus, les entreprises sont plus probables de diminuer les dividendes payés comme un
remplaçant pour les droits des créanciers peu protégés, si les actionnaires minoritaires sont
fortement protégés par les règles. Toutefois, si les droits des créanciers sont forts, ceteris
paribus, ils ont tendance à diminuer plus de dividendes. En conséquence, nous émettons
l'hypothèse que la différence de l'effet des droits des créanciers (des droits des actionnaires) sur
la politique de dividende entre les périodes avant et après la crise est plus grande lorsque la
protection juridique des actionnaires (des créanciers) est plus forte. Cette étude est menée avec
un échantillon de recherche de 104 072 observations de l’entreprise-année à partir de 17 968
entreprises constituées dans 39 pays pendant la période 2003-2012.
Suivons Brockman et Unlu (2009); Shao et al. (2013), nous utilisons deux modèles de
régression logit et tobit pour examiner la probabilité de distribution de dividendes et les ratios
de distribution avec des variables indépendantes à la fois au niveau de pays et au niveau
d’entreprises. Cependant, pour examiner les différences des effets des droits des actionnaires et
des créanciers sur la politique de dividende entre les pays pendant la période avant la crise de
2003 à 2007 et la période après crise de 2008 à 2012, nous ajoutons les termes interactifs entre
chaque variable indépendante avec la variable muette de période (PER) pour les deux modèles
de régression. La variable muette de période prend la valeur de 1 pour la période après la crise
et 0 autrement. Si les effets de la protection de l'actionnaire et créancier sur la politique de
dividende sont identiques entre les deux périodes, les coefficients de leurs termes interactifs
sont statistiquement insignifiants. Les variables au niveau d'entreprise dans cette recherche se
trouvent à influer sur la politique de dividende de l'entreprise dans nombreuses études
antérieures (Brockman & Unlu, 2009; DeAngelo et al, 2006; Eugene F. Fama et français, 2001;
Shao et al, 2013..): (1) la rentabilité (PRO) est le résultat net divisé par l’actif total, (2) des
encaisses (CAS) sont mesurées par le solde de trésorerie divisé par l’actif total, (3) la croissance
de l’entreprise (GRO) est le ratio du changement de l’actif total de l’année en cours, (4) Le ratio
de la dette (DEB) est le ratio de la dette à long terme sur l'actif total, (5) l’actif tangible (TAN)
est l’immobilisation corporelle nette échelonnée par l'actif total, (6) la taille de l’entreprise
(SIZ) est le logarithme naturel de l'actif total mesuré en dollars américains, et (7) la maturité de
l’entreprise (RET) est les bénéfices non distribués divisés par l’actif. Les variables au niveau de
pays comprennent des indices de droits des actionnaires, droits des créanciers et la variable
muette de l'origine de légale. Les droits des actionnaires sont estimés par l'indice « anti les
opérations entre les inities » (Anti self-dealing, ASD) de Djankov et al. (2008). L'indice ASD
est mesurée par la première composante principale de facteurs concentrés sur la force de
protection des actionnaires minoritaires contre les opérations des actionnaires majoritaires (i.e.
la divulgation, l'approbation et le contentieux); par conséquent, il représente la pression sur les
initiés de restituer l’argent (Shao et al., 2013). Les droits des créanciers sont estimés par le
score du total du droit de créancier révisé (CRE) de Djankov et al. (2007). La variable muette
de l'origine légale (LAW) prend 1 pour les pays de droit civil et 0 pour les pays de droit
commun.
En outre, afin d'examiner les différences des effets des droits des créanciers (des actionnaires)
sur la politique de dividende entre les périodes avant et après la crise par le niveau de droits des
actionnaires (des créanciers), comme Shao et al. (2013), Nous reproduisons les modèles de
régression sans variable muette de l'origine légale et son interactif pour deux couples de sous-
échantillons: (1) la faible protection des actionnaires et la forte protection des actionnaires; (2)
la faible protection des créanciers et la forte protection des créanciers et comparons les
coefficients des termes interactifs dans chaque couple. Les pays ayant des indices de protection
des actionnaires inférieures ou égales à la médiane ont la faible protection des actionnaires, les
autres ont la forte protection des actionnaires. Les pays ayant des indices de protection les
créanciers inférieurs à la médiane ont la faible protection des actionnaires, les autres ont la forte
protection des créanciers.
Tous les modèles de régression comprennent les variables muettes de l’industrie, les termes
interactifs entre chaque variable muette de l'industrie et la variable muette de la période de crise
afin de contrôler les effets de l'industrie. Ils sont également regroupés par la firme pour
contrôler la corrélation des résiduels à l’intérieur de l’entreprise. Les signes attendus des
variables spécifiques de l’entreprise sont comme suivants: PRO (+), CAS (+/-), GRO (-), DEB
(+/-), TAN (+), SIZ (+) et RET (+). Dividendes aux ventes (DSA) et toutes les variables au
niveau de l'entreprise sont winsorisées à 5%.
Les résultats de la régression de l'échantillon indiquent qu’après l'effet de la crise financière
mondiale qui est contrôlée par la variable muette de la période de crise et les termes interactifs,
l'indice ASD et CRE sont en relation positive avec à la fois la probabilité de distribution de

dividendes et le montant de dividendes dans tous les pays. Cela implique que s’il n'y a pas de
choc exogène, les initiés sont plus probables de payer dividendes et de payer plus dividendes
lorsque les droits des actionnaires et des créanciers sont plus forts. Conformément à Brockman
et Unlu (2009), ces résultats confirment le modèle de résultat pour les coûts d'agence de
capitaux propres (les droits des actionnaires plus forts pressent les initiés à payer plus
dividendes) et le modèle de substitution pour les coûts d'agence de la dette (les entreprises
paient moins dividendes car les droits des créanciers sont plus faibles pour gagner une
réputation de traitement équitable et de répondre à la demande des créanciers pour restreindre
les dividendes). Les termes interactifs entre la variable muette de la période de crise (i.e. elle est
1 pour la période après la crise et 0 sinon) et les deux indices représentant les droits des
actionnaires et les droits des créanciers sont négativement liés à la politique de dividendes dans
tous les résultats de la régression. Ces résultats indiquent que les effets des droits des
actionnaires et des créanciers sur les décisions de dividendes des sociétés dans la période avant
la crise sont significativement plus forts que dans la période après la crise. Par conséquent, nous
acceptons l'hypothèse que, sous l'impact de la crise financière, le modèle de résultats basé sur
les coûts de l'agence de capitaux propres et le modèle de substitution basé sur les coûts d'agence
de la dette deviennent également moins efficaces.
Shao et al. (2013) constatent que la pertinence du modèle de substitution de coûts d'agence de la
dette compte sur la qualité de la protection des actionnaires. Par conséquent, nous examinons
comment les droits des actionnaires affectent les différences des effets des droits des créanciers
sur la politique de dividende entre les périodes avant et après la crise. Les pays dans
l'échantillon complet sont classés en deux groupes, y compris la faible protection des
actionnaires (l'indice ASD est inférieur ou égal à la médiane de l'échantillon de 0,45) et la forte
protection des actionnaires (l'indice ASD est supérieur à 0,45). Les effets des droits des
créanciers sur la politique de dividende entre les périodes avant et après la crise selon le niveau
des droits des actionnaires. Les deux modèles de régression logit et tobit résultent les
coefficients de l’indice CRE dans le sous-échantillon de la forte protection des actionnaires
tandis que les coefficients correspondants du groupe de la faible protection des actionnaires ne
sont pas significatifs. Ces résultats sont en ligne avec Shao et al. (2013), le modèle de
substitution sur la base des coûts d'agence de la dette est plus efficace lorsque les actionnaires
sont suffisamment protégés. Remarquablement, les termes interactifs entre l’indice CRE et la
variable muette de la période de crise dans le groupe de la forte protection des actionnaires sont
à la fois statistiquement et économiquement plus importants que dans le groupe de la faible
protection des actionnaires. Bien que l’expropriation de l’actionnaire minoritaire devienne plus
sévère sous l'impact de la crise financière mondiale, les initiés ne peuvent pas exproprier des
actionnaires minoritaires facilement lorsque les actionnaires minoritaires sont fortement
protégés par les lois. Par conséquent, les initiés dans les pays où la protection des actionnaires
est plus forte tendent à réduire plus dividendes comme un remplaçant à la faiblesse des droits
des créanciers que ceux dans les pays où la protection des actionnaires est faible.
En outre, nous comparons comment les droits des créanciers affectent les différences des effets
de droits des actionnaires sur la politique de dividende entre les périodes avant et après crise.
Les pays avec l’indice CRE inférieur à la valeur médiane de 2 appartiennent au groupe de la
faible protection des créanciers et ceux avec l’indice CRE de 2 à 4 appartiennent au groupe de
la forte protection des créanciers. Les différences des effets de droits des actionnaires sur la
politique de dividende entre les périodes avant et après la crise par niveau de droits des
créanciers. En accord avec Shao et al. (2013), les résultats de la régression montrent que le
modèle de substitution sur la base des coûts d'agence de capitaux propres est plus efficace
lorsque les créanciers sont fortement protégés. Les coefficients de l'indice ASD dans les
résultats de la régression du groupe de la forte protection des créanciers sont significativement
positifs tandis que ceux du groupe de la faible protection des créanciers sont significativement
négatifs. En outre, les termes interactifs entre la protection des actionnaires et la variable muette
de la période de crise dans le groupe de la forte protection contre les créanciers sont
statistiquement négatifs tandis que du groupe de la faible protection des créanciers ne sont pas
statistiquement significatifs. Ces résultats ne sont pas qualitativement contre notre hypothèse.
Lorsque les entreprises sont contraintes financières sous l'impact de la crise financière
mondiale, les initiés sont moins probables de réduire le paiement de dividendes si les créanciers
sont fortement protégés, donc ils ont tendance à exproprier plus des actionnaires minoritaires.
Ces résultats impliquent que lorsque les deux types de coûts d'agence: (1) les actionnaires et les
créanciers sont plus expropriés; (2) l'augmentation de l'expropriation des créanciers
(actionnaires) est plus élevée si les actionnaires (les créanciers) sont protégés par la loi
fortement.

This page is intentionally left blank
BILIOGRAPHY
Adjaoud, Fodil. (1984). The Information Content of Dividends. A Canadian Test*. Canadian
Journal of Administrative Sciences / Revue Canadienne des Sciences de
l'Administration, 1(2), 338-351. doi: 10.1111/j.1936-4490.1984.tb00295.x
Adjaoud, Fodil, & Ben-Amar, Walid. (2010). Corporate Governance and Dividend Policy:
Shareholders’ Protection or Expropriation? Journal of Business Finance & Accounting,
37(5-6), 648-667. doi: 10.1111/j.1468-5957.2010.02192.x
Ahmed, H., & Javid, A. (2009). Dynamics and determinants of dividend policy in
Pakistan(Evidence from Karachi stock exchange non-financial listed firms).
International Research Journal of Finance and Economics, 1(25), 148-171.
Aivazian, V., Booth, L., & Cleary, S. (2003). Do emerging market firms follow different
dividend policies from U.S. firms? Journal of Financial Research, 26(3), 371-387. doi:
10.1111/1475-6803.00064
Al-Malkawi, Husam-Aldin Nizar. (2007). Determinants of Corporate Dividend Policy in
Jordan: An Application of the Tobit Model. Journal of Economic and Administrative
Sciences, 23(2), 26. doi: 10.1108/10264116200700007
Al-Najjar, Basil , & Hussainey, Khaled (2009). The association between dividend payout and
outside directorships. Journal of Applied Accounting Research, 10(1), 15. doi:
10.1108/09675420910963360
Al-Yahyaee, Khamis Hamed. (2007). Stock dividend Ex-Day Effect and Market Microstructure
in a Unique Environment. International Economics(0). doi:
http://dx.doi.org/10.1016/j.inteco.2014.04.002
Al Shabibi, Badar Khalid, & Ramesh, G. (2011). An Empirical Study on the Determinants of
Dividend Policy in the UK. International Research Journal of Finance &
Economics(80), 105-120.
Al Yahyaee, Khamis, Pham, Toan, & Walter, Terry. (2008). Ex-Dividend Day Behavior in the
Absence of Taxes and Price Discreteness*. International Review of Finance, 8(3-4),
103-123. doi: 10.1111/j.1468-2443.2008.00078.x
Albouy, Michel, Bah, Rahim, Bonnet, Christophe, & Thévenin, Dominique. (2012). The
Perception of Dividends by Managers: Do French CFOs differ from their North-
American peers? Bankers, Markets & Investors(116), 52-64.
Allen, Franklin, & Michaely, Roni. (1995). Chapter 25 Dividend policy. In V. M. R.A. Jarrow
& W. T. Ziemba (Eds.), Handbooks in Operations Research and Management Science
(Vol. Volume 9, pp. 793-837): Elsevier.
Alli, Kasim L., Khan, A. Qayyum, & Ramirez, Gabriel G. (1993). Determinants of Corporate
Dividend Policy: A Factorial Analysis. Financial Review, 28(4), 523-547. doi:
10.1111/j.1540-6288.1993.tb01361.x
Ambarish, Ramasastry, John, Kose, & Williams, Joseph. (1987). Efficient Signalling with
Dividends and Investments. Journal of Finance, 42(2), 321-343.
Amidu, Mohammed, & Abor, Joshua. (2006). Determinants of dividend payout ratios in Ghana.
Journal of Risk Finance (Emerald Group Publishing Limited), 7(2), 136-145. doi:
10.1108/15255940610648580
Anderson, Ronald C., Mansi, Sattar A., & Reeb, David M. (2003). Founding family ownership
and the agency cost of debt. Journal of Financial Economics, 68(2), 263-285. doi:
http://dx.doi.org/10.1016/S0304-405X(03)00067-9
Ang, James S., Cole, Rebel A., & Lin, James Wuh. (2000). Agency Costs and Ownership
Structure. The Journal of Finance, 55(1), 81-106. doi: 10.1111/0022-1082.00201
Asquith, Paul, & Mullins Jr, David W. (1983). The Impact of Initiating Dividend Payments on
Shareholders' Wealth. Journal of Business, 56(1), 77-96.
Baker, H. K., Saadi, S., Dutta, S., & Gandhi, D. (2007). The perception of dividends by
Canadian managers: New survey evidence. International Journal of Managerial
Finance, 3(1), 70-91. doi: 10.1108/17439130710721662
Baker, H. Kent, Farrelly, Gail E., & Edelman, Richard B. (1985). A Survey of Management
Views on Dividend Policy. Financial Management (1972), 14(3), 78-84.
Baker, H. Kent, Mukherjee, Tarun K., & Paskelian, Ohannes George. (2006). How Norwegian
managers view dividend policy. Global Finance Journal, 17(1), 155-176. doi:
http://dx.doi.org/10.1016/j.gfj.2006.06.005

Baker, H. Kent, & Powell, Gary E. (1999). How Corporate Managers View Dividend Policy.
Quarterly Journal of Business & Economics, 38(2), 17.
Baker, H. Kent, & Powell, Gary E. (2000). Determinants of Corporate Dividend Policy: A
Survey of NYSE Firms. Financial Practice & Education, 10(1), 29-40.
Baker, H. Kent, Powell, Gary E., & Veit, E. Theodore. (2001). Factors Influencing Dividend
Policy Decisions of Nasdaq Firms. Financial Review, 36(3), 19.
Baker, Malcolm, & Wurgler, Jeffrey. (2004a). Appearing and disappearing dividends: The link
to catering incentives. Journal of Financial Economics, 73(2), 271-288. doi:
http://dx.doi.org/10.1016/j.jfineco.2003.08.001
Baker, Malcolm, & Wurgler, Jeffrey. (2004b). A Catering Theory of Dividends. Journal of
Finance, 59(3), 1125-1165. doi: 10.1111/j.1540-6261.2004.00658.x
Bali, Rakesh, & Hite, Gailen L. (1998). Ex dividend day stock price behavior: discreteness or
tax-induced clienteles? Journal of Financial Economics, 47(2), 127-159. doi:
http://dx.doi.org/10.1016/S0304-405X(97)00041-X
Bancel, Franck, Bhattacharyya, Nalinaksha, Mittoo, Usha R., & Baker, H. Kent. (2009). Cross-
Country Determinants of Payout Policy: European Firms Dividends and Dividend
Policy (pp. 71-93): John Wiley & Sons, Inc.
Banerjee, S., Gatchev, V. A., & Spindt, P. A. (2007). Stock market liquidity and firm dividend
policy. Journal of Financial and Quantitative Analysis, 42(2), 369-398.
Bar-Yosef, Sasson, & Huffman, Lucy. (1986). The Information Content of Dividends: A
Signalling Approach. Journal of Financial & Quantitative Analysis, 21(1), 47-58.
Barclay, Michael J. (1987). Dividends, taxes, and common stock prices: The ex-dividend day
behavior of common stock prices before the income tax. Journal of Financial
Economics, 19(1), 31-44. doi: http://dx.doi.org/10.1016/0304-405X(87)90027-4
Bartov, Eli, & Bodnar, Gordon M. (1996). Alternative Accounting Methods, Information
Asymmetry and Liquidity: Theory and Evidence. Accounting Review, 71(3), 397-418.
Beaver, William H. (1968). The Information Content of Annual Earnings Announcements.
Journal of Accounting Research, 6(3), 67-92.
Bebczuk, Ricardo N. (2005). Corporate governance and ownership : measurement and impact
on corporate performance and dividend policies in Argentina. from
http://www.depeco.econo.unlp.edu.ar/doctrab/doc59.pdf
Benartzi, Shlomo, Michaely, Roni, & Thaler, Richard. (1997). Do Changes in Dividends Signal
the Future or the Past? Journal of Finance, 52(3), 1007-1034.
Berle, A.A., & Means, G.C. (1932). The Modern Corporation and Private Property. New York:
The Macmillan Company.
Bhattacharya, Sudipto. (1979). Imperfect information, dividend policy, and "the bird in the
hand" fallacy. Bell Journal of Economics, 10(1), 259-270.
Black, Fischer. (1976). The dividend puzzle. The Journal of Portfolio Management, 2(2), 5-8.
Black, Fischer, & Scholes, Myron. (1974). The effects of dividend yield and dividend policy on
common stock prices and returns. Journal of Financial Economics, 1(1), 1-22. doi:
http://dx.doi.org/10.1016/0304-405X(74)90006-3
Bolster, Paul J., & Janjigian, Vahan. (1991). Dividend Policy and Valuation Effects of the
Tax Reform Act of 1986. National Tax Journal, 44(4), 511-518. doi: 10.2307/41788937
Booth, L. D., & Johnston, D. J. (1984). The Ex-Dividend Day Behavior of Canadian Stock
Prices: Tax Changes and Clientele Effects. Journal of Finance, 39(2), 457-476.
Boyd, J. H., & Jagannathan, R. (1994). Ex-dividend price behavior of common stocks. Review
of Financial Studies, 7(4).
Brav, Alon, Graham, John R., Harvey, Campbell R., & Michaely, Roni. (2005). Payout policy
in the 21st century. Journal of Financial Economics, 77(3), 483-527. doi:
http://dx.doi.org/10.1016/j.jfineco.2004.07.004
Brennan, M. (1970). Tax reform and the stock market: an asset price approach. American
Economic Review, 23(4), 417-427.
Brockman, Paul, & Unlu, Emre. (2009). Dividend policy, creditor rights, and the agency costs
of debt. Journal of Financial Economics, 92(2), 276-299. doi:
http://dx.doi.org/10.1016/j.jfineco.2008.03.007
Brown, Stephen J., & Warner, Jerold B. (1985). Using daily stock returns: The case of event
studies. Journal of Financial Economics, 14(1), 3-31. doi:
http://dx.doi.org/10.1016/0304-405X(85)90042-X
Byrne, Julie, & O’Connor, Thomas. (2012). Creditor rights and the outcome model of
dividends. The Quarterly Review of Economics and Finance, 52(2), 227-242. doi:
http://dx.doi.org/10.1016/j.qref.2012.04.002
Campello, Murillo, Graham, John R., & Harvey, Campbell R. (2010). The real effects of
financial constraints: Evidence from a financial crisis. Journal of Financial Economics,
97(3), 470-487. doi: http://dx.doi.org/10.1016/j.jfineco.2010.02.009
Casey, K. Michael, & Dickens, Ross N. (2000). The effects of tax and regulatory changes on
commercial bank dividend policy. The Quarterly Review of Economics and Finance,
40(2), 279-293. doi: http://dx.doi.org/10.1016/S1062-9769(99)00051-4
Castillo, Augusto, & Jakob, Keith. (2006). The Chilean ex-dividend day. Global Finance
Journal, 17(1), 105-118. doi: http://dx.doi.org/10.1016/j.gfj.2006.06.002
Chang, Rosita P., & Rhee, S. Ghon. (1990). The Impact of Personal Taxes on Corporate
Dividend Policy and Capital Structure Decisions. FM: The Journal of the Financial
Management Association, 19(2), 21-31.
Chen, Donghua, Jian, Ming, & Xu, Ming. (2009). Dividends for tunneling in a regulated
economy: The case of China. Pacific-Basin Finance Journal, 17(2), 209-223. doi:
http://dx.doi.org/10.1016/j.pacfin.2008.05.002
Chen, Hung-Ling, Chow, Edward H., & Shiu, Cheng-Yi. (2013). Ex-dividend prices and
investor trades: Evidence from Taiwan. Pacific-Basin Finance Journal, 24(0), 39-65.
doi: http://dx.doi.org/10.1016/j.pacfin.2013.02.004
Chen, J., & Dhiensiri, N. (2009). Determinants of dividend policy: The evidence from New
Zealand. International Research Journal of Finance and Economics, 34, 18-28.
Cotter, Julie, & Silvester, Mark. (2003). Board and Monitoring Committee Independence.
Abacus, 39(2), 211-232. doi: 10.1111/1467-6281.00127
Cy Kwok, Chuck. (2006). National culture and financial systems. Journal of International
Business Studies, 37(2), 227-247.
Dasilas, Apostolos. (2009). The ex-dividend day stock price anomaly: evidence from the Greek
stock market. Financial Markets and Portfolio Management, 23(1), 59-91. doi:
10.1007/s11408-008-0094-6
Dasilas, Apostolos, & Leventis, Stergios. (2011). Stock market reaction to dividend
announcements: Evidence from the Greek stock market. International Review of
Economics & Finance, 20(2), 302-311. doi: http://dx.doi.org/10.1016/j.iref.2010.06.003
Daunfeldt, Sven-Olov, Selander, Carina, & Wikström, Magnus. (2009). Taxation, Dividend
Payments and Ex-Day Price-Changes. Multinational Finance Journal, 13(1/2), 141-160.
DeAngelo, Harry, & DeAngelo, Linda. (2006). The irrelevance of the MM dividend irrelevance
theorem. Journal of Financial Economics, 79(2), 293-315. doi:
http://dx.doi.org/10.1016/j.jfineco.2005.03.003
DeAngelo, Harry, DeAngelo, Linda, & Skinner, Douglas J. (1996). Reversal of fortune
dividend signaling and the disappearance of sustained earnings growth. Journal of
Financial Economics, 40(3), 341-371. doi: http://dx.doi.org/10.1016/0304-
405X(95)00850-E
DeAngelo, Harry, DeAngelo, Linda, & Stulz, René M. (2006). Dividend policy and the
earned/contributed capital mix: a test of the life-cycle theory. Journal of Financial
Economics, 81(2), 227-254. doi: http://dx.doi.org/10.1016/j.jfineco.2005.07.005
Denis, David J., & Osobov, Igor. (2008). Why do firms pay dividends? International evidence
on the determinants of dividend policy. Journal of Financial Economics, 89(1), 62-82.
doi: http://dx.doi.org/10.1016/j.jfineco.2007.06.006
Dhrymes, Phoebus J., & Kurz, Mordecai. (1967). Investment, Dividend, and External Finance
Behavior of Firms. In R. Ferber (Ed.), Determinants of Investment Behavior: National
Bureau of Economic Research, Inc.
Djankov, Simeon, La Porta, Rafael, Lopez-de-Silanes, Florencio, & Shleifer, Andrei. (2008).
The law and economics of self-dealing. Journal of Financial Economics, 88(3), 430-
465. doi: http://dx.doi.org/10.1016/j.jfineco.2007.02.007
Djankov, Simeon, McLiesh, Caralee, & Shleifer, Andrei. (2007). Private credit in 129
countries. Journal of Financial Economics, 84(2), 299-329. doi:
http://dx.doi.org/10.1016/j.jfineco.2006.03.004
Donaldson, G. (1961). CorporateDebt Capacity: A Study of Corporate Debt Policy and
theDetermination of Corporate Debt Capacity. Boston: Harvard Graduate School of
Business Administration.
Dubofsky, David A. (1992). A market microstructure explanation of ex-day abnormal returns.
FM: The Journal of the Financial Management Association, 21(4), 32.
Dubofsky, David A. (1997). Limit orders and ex-dividend day return distributions. Journal of
Empirical Finance, 4(1), 47-65. doi: http://dx.doi.org/10.1016/S0927-5398(96)00012-6
Eades, Kenneth M. (1982, 1982/11//). Empirical Evidence on Dividends as a Signal of Firm
Value.
Eades, Kenneth M., Hess, Patrick J., & Kim, E. Han. (1984). On interpreting security returns
during the ex-dividend period. Journal of Financial Economics, 13(1), 3-34. doi:
http://dx.doi.org/10.1016/0304-405X(84)90030-8
Easterbrook, Frank H. (1984). Two Agency-Cost Explanations of Dividends. American
Economic Review, 74(4), 650.
Elton, Edwin J., & Gruber, Martin J. (1970). Marginal stockholder tax rates and the clientele
effect. Review of Economics & Statistics, 52(1), 68-74.
Fama, Eugene F, & French, Kenneth R. (2015). A five-factor asset pricing model. Journal of
Financial Economics, 116(1), 1-22.
Fama, Eugene F., & French, Kenneth R. (2001). Disappearing dividends: changing firm
characteristics or lower propensity to pay? Journal of Financial Economics, 60(1), 3-43.
doi: http://dx.doi.org/10.1016/S0304-405X(01)00038-1
Ferris, Stephen P., Jayaraman, Narayanan, & Sabherwal, Sanjiv. (2009). Catering effects in
corporate dividend policy: The international evidence. Journal of Banking & Finance,
33(9), 1730-1738. doi: http://dx.doi.org/10.1016/j.jbankfin.2009.04.005
Florentsen, Bjarne, & Rydqvist, Kristian. (2002). Ex-Day Behavior When Investors and
Professional Traders Assume Reverse Roles: The Case of Danish Lottery Bonds.
Journal of Financial Intermediation, 11(2), 152-175. doi:
http://dx.doi.org/10.1006/jfin.2001.0332
Frank, Murray, & Jagannathan, Ravi. (1998). Why do stock prices drop by less than the value
of the dividend? Evidence from a country without taxes. Journal of Financial
Economics, 47(2), 161-188. doi: http://dx.doi.org/10.1016/S0304-405X(97)80053-0
Ghosh, C., & Woolridge, J. R. (1989). Stock-market Reaction to Growth-induced Dividend
Cuts: Are Investors Myopic? Managerial & Decision Economics, 10(1), 25-35.
Gonedes, Nicholas J. (1978). Corporate Signaling, External Accounting, and Capital Market
Equilibrium: Evidence on Dividends, Income, and Extraordinary Items. Journal of
Accounting Research, 16(1), 26-79.
Gordon, Myron J. (1962). The savings investment and valuation of a corporation. The Review of
Economics and Statistics, 37-51.
Graham, John R., Michaely, Roni, & Roberts, Michael R. (2003). Do Price Discreteness and
Transactions Costs Affect Stock Returns? Comparing Ex-Dividend Pricing before and
after Decimalization. Journal of Finance, 58(6), 2611-2636. doi: 10.1046/j.1540-
6261.2003.00617.x
Grullon, Gustavo, & Michaely, Roni. (2002). Dividends, Share Repurchases, and the
Substitution Hypothesis. The Journal of Finance, 57(4), 1649-1684. doi: 10.1111/1540-
6261.00474
Grullon, Gustavo, Michaely, Roni, & Swaminathan, Bhaskaran. (2002). Are Dividend Changes
a Sign of Firm Maturity? Journal of Business, 75(3), 387-424.
Gugler, K. (2003). Corporate governance, dividend payout policy, and the interrelation between
dividends, R&D, and capital investment. Journal of Banking and Finance, 27(7), 1297-
1321. doi: 10.1016/S0378-4266(02)00258-3
Handjinicolaou, George, & Kalay, Avner. (1984). Wealth redistributions or changes in firm
value: An analysis of returns to bondholders and stockholders around dividend
announcements. Journal of Financial Economics, 13(1), 35-63. doi:
http://dx.doi.org/10.1016/0304-405X(84)90031-X
Healy, Paul M., & Palepu, Krishna G. (1988). Earnings information conveyed by dividend
initiations and omissions. Journal of Financial Economics, 21(2), 149-175. doi:
http://dx.doi.org/10.1016/0304-405X(88)90059-1
Heinkel, Robert. (1978). Dividend policy as a signal of firm value in Essays on financial
markets with imperfect information. (Ph.D), University of California, Berkeley.
Hietala, Pekka T. (1990). Equity markets and personal taxation: The ex-dividend day behaviour
of Finnish stock prices. Journal of Banking & Finance, 14(2–3), 327-350. doi:
http://dx.doi.org/10.1016/0378-4266(90)90053-5
Higgins, Robert C. (1972). The corporate dividend-saving decision. Journal of Financial &
Quantitative Analysis, 7(2), 1527-1541.
Holder, Mark E., Langrehr, Frederick W., & Hexter, J. Lawrence. (1998). Dividend policy
determinants: an investigation of the influences of stakeholder theory. FM: The Journal
of the Financial Management Association, 27(3), 73.
Jakob, Keith J., & Ma, Tongshu. (2007). Are ex‐day dividend clientele effects dead? Dividend
yield versus dividend size. Journal of Empirical Finance, 14(5), 718-735. doi:
http://dx.doi.org/10.1016/j.jempfin.2006.09.001
Jakob, Keith, & Ma, Tongshu. (2004). Tick size, NYSE rule 118, and ex-dividend day stock
price behavior. Journal of Financial Economics, 72(3), 605-625. doi:
http://dx.doi.org/10.1016/S0304-405X(03)00189-2
Jensen, Gerald R., Solberg, Donald P., & Zorn, Thomas S. (1992). Simultaneous Determination
of Insider Ownership, Debt, and Dividend Policies. Journal of Financial & Quantitative
Analysis, 27(2), 247-263.
Jensen, Michael C. (1986). Agency Costs of Free Cash Flow, Corporate Finance, and
Takeovers. American Economic Review, 76(2), 323.
Jensen, Michael C., & Meckling, William H. (1976). Theory of the firm: Managerial behavior,
agency costs and ownership structure. Journal of Financial Economics, 3(4), 305-360.
doi: http://dx.doi.org/10.1016/0304-405X(76)90026-X
Jerry, R. Green. (1980). Taxation and the Ex-dividend Day Behavior of Common Stock Prices.
Jiraporn, P., Kim, J. C., & Kim, Y. S. (2011). Dividend payouts and corporate governance
quality: An empirical investigation. Financial Review, 46(2), 251-279. doi:
10.1111/j.1540-6288.2011.00299.x
Jiraporn, Pornsit. (2006). Share repurchases, shareholder rights, and corporate governance
provisions. The North American Journal of Economics and Finance, 17(1), 35-47. doi:
http://dx.doi.org/10.1016/j.najef.2005.03.003
John, Kose, & Williams, Joseph. (1985). Dividends, Dilution, and Taxes: A Signalling
Equilibrium. Journal of Finance, 40(4), 1053-1070.
Johnson, Simon, Boone, Peter, Breach, Alasdair, & Friedman, Eric. (2000). Corporate
governance in the Asian financial crisis. Journal of Financial Economics, 58(1–2), 141-
186. doi: http://dx.doi.org/10.1016/S0304-405X(00)00069-6
Kalay, Avner. (1982a). The Ex-Dividend Day Behavior of Stock Prices: A Re-Examination of
the Clientele Effect. The Journal of Finance, 37(4), 1059-1070. doi: 10.1111/j.1540-
6261.1982.tb03598.x
Kalay, Avner. (1982b). Stockholder-bondholder conflict and dividend constraints. Journal of
Financial Economics, 10(2), 211-233. doi: http://dx.doi.org/10.1016/0304-
405X(82)90014-9
Kale, Jayant R., & Noe, Thomas H. (1990). Dividends, uncertainty and underwriting costs
under asymetric information. Journal of Financial Research, 13(4), 265.
Kaplan, Steven N., & Reishus, David. (1990). Outside directorships and corporate performance.
Journal of Financial Economics, 27(2), 389-410. doi: http://dx.doi.org/10.1016/0304-
405X(90)90061-4
Karpoff, Jonathan M., & Walkling, Ralph A. (1988). Short-term trading around ex-dividend
days: Additional evidence. Journal of Financial Economics, 21(2), 291-298. doi:
http://dx.doi.org/10.1016/0304-405X(88)90063-3
Karpoff, Jonathan M., & Walkling, Ralph A. (1990). Dividend capture in NASDAQ stocks.
Journal of Financial Economics, 28(1–2), 39-65. doi: http://dx.doi.org/10.1016/0304-
405X(90)90047-4
Kato, K., Kato, Kiyoshi, Loewenstein, U., & Loewenstein, Uri. (1995). The ex-dividend-day
behavior of stock prices: the case of Japan. Review of Financial Studies, 8(3).
Koch, Paul D., & Shenoy, Catherine. (1999). The Information Content of Dividend and Capital
Structure Policies. FM: The Journal of the Financial Management Association, 28(4),
16-35.
Kowalewski, Oskar, Stetsyuk, Ivan, & Talavera, Oleksandr. (2007). Corporate Governance and
Dividend Policy in Poland. Working Papers -- Financial Institutions Center at The
Wharton School, 1-35.
La Porta, Rafael, Lopez-De-Silanes, Florencio, & Shleifer, Andrei. (2006). What Works in
Securities Laws? The Journal of Finance, 61(1), 1-32. doi: 10.1111/j.1540-
6261.2006.00828.x
La Porta, Rafael, Lopez-de-Silanes, Florencio, Shleifer, Andrei, & Vishny, Robert. (1998). Law
and finance. Journal of Political Economy, 106, 42.
La Porta, Rafael, Lopez-De-Silanes, Florencio, Shleifer, Andrei, & Vishny, Robert W. (2000).
Agency Problems and Dividend Policies around the World. Journal of Finance, 55(1),
1-33.
Lakonishok, Josef, & Vermaelen, Theo. (1986). Tax-induced trading around ex-dividend days.
Journal of Financial Economics, 16(3), 287-319. doi: http://dx.doi.org/10.1016/0304-
405X(86)90032-2
Lamdin, D. J. (1993). Shareholder taxation and aggregate dividend payout: Evidence from the
tax reform act of 1986. Review of Quantitative Finance and Accounting, 3(4), 459-468.
doi: 10.1007/BF02409623
Lang, Larry H. P., Stulz, RenéM, & Walkling, Ralph A. (1991). A test of the free cash flow
hypothesis: The case of bidder returns. Journal of Financial Economics, 29(2), 315-335.
doi: http://dx.doi.org/10.1016/0304-405X(91)90005-5
Lemmon, Michael L., & Lins, Karl V. (2003). Ownership Structure, Corporate Governance,
and Firm Value: Evidence from the East Asian Financial Crisis. The Journal of Finance,
58(4), 1445-1468. doi: 10.1111/1540-6261.00573
Leuz, Christian, Nanda, Dhananjay, & Wysocki, Peter D. (2003). Earnings management and
investor protection: an international comparison. Journal of Financial Economics,
69(3), 505-527. doi: http://dx.doi.org/10.1016/S0304-405X(03)00121-1
Lewellen, Wilbur G., Stanley, Kenneth L., Lease, Ronald C., & Schlarbaum, Gary G. (1978).
Some Direct Evidence on the Dividend Clientele Phenomenon. The Journal of Finance,
33(5), 1385-1399. doi: 10.1111/j.1540-6261.1978.tb03427.x
Li, Wei, & Lie, Erik. (2006). Dividend changes and catering incentives. Journal of Financial
Economics, 80(2), 293-308. doi: http://dx.doi.org/10.1016/j.jfineco.2005.03.005
Lintner, J. (1956). Distribution of incomes of corporations among dividends, retained earnings,
and taxes. American Economic Review, 46(2), 97-113.
Litzenberger, Robert H., & Ramaswamy, Krishna. (1979). The effect of personal taxes and
dividends on capital asset prices: Theory and empirical evidence. Journal of Financial
Economics, 7(2), 163-195. doi: http://dx.doi.org/10.1016/0304-405X(79)90012-6
Mahajan, Arvind, & Tartaroglu, Semih. (2008). Equity market timing and capital structure:
International evidence. Journal of Banking & Finance, 32(5), 754-766. doi:
http://dx.doi.org/10.1016/j.jbankfin.2007.05.007
Manos, Ronny. (2001). Capital structure and dividend policy : evidence from emerging
markets. (Ph D), University of Birmingham.
McDonald, Robert L. (2001). Cross-Border Investing with Tax Arbitrage: The Case of German
Dividend Tax Credits. Review of Financial Studies, 14(3), 617-657. doi:
10.1093/rfs/14.3.617
McManus, Ian, Ap Gwilym, Owain, & Thomas, Stephen. (2004). The Role of Payout Ratio in
the Relationship Between Stock Returns and Dividend Yield. Journal of Business
Finance & Accounting, 31(9/10), 1355-1387. doi: 10.1111/j.0306-686X.2004.00577.x
Means, D. B., Charoenwong, C., & Kang, Y. K. (1992). Changing dividend policies caused by
the Tax Reform Act of 1986: An empirical analysis. Journal of Economics and Finance,
16(3), 153-160. doi: 10.1007/BF02920317
Meyer, John Robert, & Kuh, Edwin. (1957). The Investment Decision: An Empirical Study.
Cambridge: Harvard University Press.
Michaely, R., Michaely, Roni, Murgia, M., & Murgia, Maurizio. (1995). The effect of tax
heterogeneity on prices and volume around the ex-dividend day: evidence from the
Milan stock exchange. Review of Financial Studies, 8(2).
Michaely, Roni. (1991). Ex-Dividend Day Stock Price Behavior: The Case of the 1986 Tax
Reform Act. Journal of Finance, 46(3), 845-859.
Michaely, Roni. (1996). Trading Volume with Private Valuation: Evidence from the Ex-
Dividend Day.
Michaely, Roni, & Vila, Jean-Luc. (1995). Investors' Heterogeneity, Prices, and Volume around
the Ex-Dividend Day. Journal of Financial & Quantitative Analysis, 30(2), 171-198.
Miller, Merton H., & Modigliani, Franco. (1961). Dividend Policy, Growth, and the Valuation
of Shares. In H. R. Vane & C. Mulhearn (Eds.), Harry M. Markowitz, Merton H. Miller,
William F. Sharpe, Robert C. Merton and Myrin S. Scholes (pp. 113-135): Elgar
Reference Collection. Pioneering Papers of the Nobel Memorial Laureates in
Economics, vol. 2. Cheltenham, U.K. and Northampton, Mass.: Elgar.
Miller, Merton H., & Rock, Kevin. (1985). Dividend Policy under Asymmetric Information.
Journal of Finance, 40(4), 1031-1051.
Miller, Merton H., & Scholes, Myron S. (1978). Dividends and taxes. Journal of Financial
Economics, 6(4), 333-364. doi: http://dx.doi.org/10.1016/0304-405X(78)90009-0
Miller, Merton H., & Scholes, Myron S. (1982). Dividend and taxes: Some empirical evidence.
Journal of Political Economy, 90(6), 23.
Milonas, Nikolaos T., Travlos, Nickolaos G., Xiao, Jason Zezhong, & Tan, Cunkai. (2006). The
ex-dividend day stock price behavior in the Chinese stock market. Pacific-Basin
Finance Journal, 14(2), 155-174. doi: http://dx.doi.org/10.1016/j.pacfin.2005.06.004
Mitton, Todd. (2004). Corporate governance and dividend policy in emerging markets.
Emerging Markets Review, 5(4), 409-426. doi:
http://dx.doi.org/10.1016/j.ememar.2004.05.003
Mollah, A. Sabur. (2001). Dividend policy and behaviour, and security price reaction to the
announcement of dividends in an emergency market : a study of companies listed on the
Dhaka stock exchange. (Thesis (Ph D )), University of Leeds (Business School), Leeds,.
Retrieved from http://etheses.whiterose.ac.uk/700/
Myers, Stewart C. (1977). Determinants of corporate borrowing. Journal of Financial
Economics, 5(2), 147-175. doi: http://dx.doi.org/10.1016/0304-405X(77)90015-0
Myers, Stewart C., & Majluf, Nicholas S. (1984). Corporate financing and investment decisions
when firms have information that investors do not have. Journal of Financial
Economics, 13(2), 187-221. doi: http://dx.doi.org/10.1016/0304-405X(84)90023-0
Myers, Stewart C., & Majluf, Nicolas S. (1984). Stock issues and investment policy when firms
have information that investors do not have. Journal of Financial Economics(13), 24.
doi: http://hdl.handle.net/1721.1/2002
Naranjo, Andy, Nimalendran, M., & Ryngaert, Mike. (2000). Time Variation of Ex-Dividend
Day Stock Returns and Corporate Dividend Capture: A Reexamination. Journal of
Finance, 55(5), 2357-2372.
Nash, Robert C., Netter, Jeffry M., & Poulsen, Annette B. (2003). Determinants of contractual
relations between shareholders and bondholders: investment opportunities and
restrictive covenants. Journal of Corporate Finance, 9(2), 201-232. doi:
http://dx.doi.org/10.1016/S0929-1199(02)00007-X
Paczkowski, John. (2012, 19th March 2012). Apple’s Dividend: Why Now? , 2015, from
http://allthingsd.com/20120319/apples-dividend-why-now/
Papaioannou, George J., & Savarese, Craig M. (1994). Corporate Dividend Policy Response to
the Tax Reform Act of 1986. Financial Management, 23(1), 56-63. doi:
10.2307/3666056
Partington, Graham H. (1989). VARIABLES INFLUENCING DIVIDEND POLICY IN
AUSTRALIA: SURVEY RESULTS. Journal of Business Finance & Accounting, 16(2),
165-182.
Pettit, R. Richardson. (1977). Taxes, transactions costs and the clientele effect of dividends.
Journal of Financial Economics, 5(3), 419-436. doi: http://dx.doi.org/10.1016/0304-
405X(77)90046-0
Poterba, James M., & Summers, Lawrence H. (1984). New Evidence That Taxes Affect the
Valuation of Dividends. Journal of Finance, 39(5), 1397-1415.
Raaballe, Johannes , & Hedensted, Jakob Stig. (2008). Dividend Determinants in Denmark.
SSRN.
Rozeff, Michael S. (1982). Growth, beta and agency costs as determinants of dividend payout
ratios. Journal of Financial Research, 5(3), 249.
Saadi, Samir, & Chkir, Imed. (2008). Taxation and Dividend Policy: New Empirical Evidence.
Journal of Corporate Ownership and Control, 5(4), 266-273.
Schellenger, Michael H., Wood, David D., & Tashakori, Ahmad. (1989). Board of Director
Composition, Shareholder Wealth, and Dividend Policy. Journal of Management, 15(3),
457.
Shao, Liang, Kwok, Chuck C. Y., & Guedhami, Omrane. (2013). Dividend Policy: Balancing
Shareholders' And Creditors' Interests. Journal of Financial Research, 36(1), 43-66. doi:
10.1111/j.1475-6803.2013.12002.x
Shelley, R. Bream; T. (2007). SSE to raise dividend 18 per cent in new payout policy.
Retrieved 6 March, 2007, from www.ft.com
Spamann, Holger. (2010). The “antidirector rights index” revisited. Review of Financial
Studies, 23(2), 467-486.
Stephen P. Ferris, Nilanjan Sen, & Ho Pei Yui. (2006). God Save the Queen and Her
Dividends: Corporate Payouts in the United Kingdom. The Journal of Business, 79(3),
1149-1173. doi: 10.1086/500672
Stevens, Jerry L., & Jose, Manuel L. (1992). The Effects of Dividend Payout, Stability, and
Smoothing on Firm Value. Journal of Accounting, Auditing & Finance, 7(2), 213-216.
Stulz, RenéM. (1990). Managerial discretion and optimal financing policies. Journal of
Financial Economics, 26(1), 3-27. doi: http://dx.doi.org/10.1016/0304-405X(90)90011-
N
Thanatawee, Yordying. (2011). Life-Cycle Theory and Free Cash Flow Hypothesis: Evidence
from Dividend Policy in Thailand. International Journal of Financial Research, 2(2).
doi: 10.5430/ijfr.v2n2p52
Utami, S. R., & Inanga, E. L. (2011). Agency costs of free cash flow, dividend policy, and
leverage of firms in Indonesia. European Journal of Economics, Finance and
Administrative Sciences(33), 7-24.
von Eije, Henk, & Megginson, William L. (2008). Dividends and share repurchases in the
European Union. Journal of Financial Economics, 89(2), 347-374. doi:
http://dx.doi.org/10.1016/j.jfineco.2007.11.002
Wang, George Yungchih. (2010). The Impacts of Free Cash Flows and Agency Costs on Firm
Performance. Journal of Service Science & Management, 3, 10. doi:
10.4236/jssm.2010.34047
Watts, Ross. (1973). The Information Content of Dividends. Journal of Business, 46(2), 191-
211.
Wei, Jim Gang, Zhang, Weiguo, & Xiao, Jason ZeZhong. (2004). Dividend payment and
ownership structure in China. Advances in Financial Economics, 9, 22. doi:
10.1016/S1569-3732(04)09008-5
Weston, J. F. , & Brigham, E. F. (1979). Managerial Finance (7th ed.): Dryden Press.
Wooldridge, J.M. (2010). Econometric Analysis of Cross Section and Panel Data (10th ed.).
Cambridge: MIT Press.
TROIS ESSAIS DE LA POLITIQUE DE DISTRIBUTION DE DIVIDENDES
Résumé (1500 caractères max.) La première rédaction enquête sur la politique de dividende récemment établie sur le marché boursier vietnamien et expérimente les périodes condensées de forte croissance et chute brutale avec une approche en deux étapes. Les résultats de la recherche montrent : (1) Les investisseurs sont d’avantage expropriés dans les entreprises dont la part de détention d’actions des initiés est plus élevée ; (2) Les investisseurs tendent à percevoir le versement de plus faibles dividendes comme un signal relatif à la rentabilité espérée dès lors que l’asymétrie d’information est réduite ; (3) Les investisseurs dans les entreprises contrôlées par l’Etat sont plus enclins à recevoir des dividendes que celles qui ne le sont pas. La seconde rédaction pose que le marché vietnamien des actions est un laboratoire prometteur pour enquêter sur le comportement des cours de marché le jour du Ex-dividende. Les résultats des recherches suggèrent que les investisseurs du marché boursier vietnamien sont indifférents à l’écart dans l’application de taxe sur les revenus des dividendes. Ils cherchent à capter des dividendes s’ils trouvent des opportunités de profit. Par conséquent, les investisseurs achètent des actions le jour du Cum-dividende et les vendent le Ex-dividende pour exploiter les opportunités de profit générées par le paiement de dividendes. La dernière rédaction examine les effets des droits des actionnaires et des créanciers sur la politique de dividende lorsque les frais de représentation des actionnaires et des créances tendent à augmenter. Ses découvertes indiquent que les actionnaires et les créanciers sont plus souvent expropriés et l’augmentation des expropriations des créanciers (actionnaires) est plus élevée si les actionnaires (créanciers) sont fortement protégées par la réglementation. Mots clefs français: politique de dividende, Heckman, ex-dividende, cours boursier, droits des créanciers, droits des actionnaires, crise financière
Three essays on dividend policy Abstract The first essay investigates dividend policy in Vietnamese stock market which is newly established and experiences short booming and crashing periods with a two-step approach. The research findings show: (1) investors are expropriated more in firms with higher insider ownership; (2) Investors tend to receive smaller dividends paid as a signal of expected profitability when information asymmetry is lower; (3) investors in state-controlled firms are more likely to receive dividends than those in non-state-controlled firms. The second essay posits that Vietnamese stock market is a promising laboratory to investigate stock price behavior on ex-dividend day. The research results imply that investors in Vietnamese stock market is indifferent to the difference in tax treatment of capital gains to dividends, they try to capture dividends if they find profit opportunities. Therefore, investors buy stocks on the cum-dividend day and sell them on the ex-dividend to exploit profit opportunities created by dividend payment. The third essay examines the effects of shareholder rights and creditor rights on dividend policy when agency costs of shareholders and creditors tend to increase. Its findings indicate that are more expropriated and the increase in the expropriation of creditors (shareholders) is higher if shareholders (creditors) are protected strongly by law. Keywords: dividend policy, Heckman, ex-dividend, stock price, creditor rights, shareholder rights, financial crisis. Unité de recherche/Research unit : […intitulé, adresse, email et Url…] Ecole doctorale/Doctoral school : Ecole doctorale des sciences juridiques, politiques et de gestion, n° 74, 1 place Déliot, 59000 Lille, ecodoc.univ-lille2.fr, http://edoctorale74.univ-lille2.fr Université/University : Université Lille 2, Droit et Santé, 42 rue Paul Duez, 59000 Lille, http://www.univ-lille2.fr
