trialling the pas 2050 on johnson & johnson baby...
TRANSCRIPT
i
Trialling the PAS 2050 on Johnson & Johnson Baby Wipes Environmental Resources Management A research report completed for the Department for Environment, Food and Rural Affairs
March 2010
ii
Published by the Department for Environment, Food and Rural Affairs
Department for Environment, Food and Rural Affairs Nobel House 17 Smith Square London SW1P 3JR Tel: 020 7238 6000 Website: www.defra.gov.uk © Queen's Printer and Controller of HMSO 2010 This publication is value added. If you wish to re-use this material, please apply for a Click-Use Licence for value added material at: http://www.opsi.gov.uk/click-use/value-added-licence-information/index.htm Alternatively applications can be sent to Office of Public Sector Information, Information Policy Team, St Clements House, 2-16 Colegate, Norwich NR3 1BQ; Fax: +44 (0)1603 723000; email: [email protected] Information about this publication is available from: SCP&W Evidence Base Defra Zone 5D, 5th Floor, Ergon House c/o Nobel House, 17 Smith Square London SW1P 3JR Email: [email protected]
iii
EV0426 Trialling the PAS 2050 on priority products
Final Report to the Department for Environment, Food and Rural Affairs
March 2010
This research was commissioned and funded by Defra. The views expressed reflect the research findings and the authors‟ interpretation; they do not necessarily reflect Defra policy or opinions.
ERM Ltd 2nd Floor Exchequer Court
33 St Mary Axe London EC3A 8AA
1
TABLE OF CONTENTS
Executive Summary ................................................................................................. 2
Calculation Difficulties Encountered ................................................................................................... 4 Difference between J&J and ERM footprints calculated in parallel .................................................... 5 Areas for Potential Improvement in Guidance .................................................................................... 5
1 Background and objectives ............................................................................ 7
2 Methods and approach .................................................................................... 8
3 Findings .......................................................................................................... 11
J&J‟s experience – Step 1................................................................................................................. 13 ERM commentary – Step 1 ............................................................................................................... 14 J&J‟s experience – Step 2................................................................................................................. 15 ERM commentary – Step 2 ............................................................................................................... 15 J&J‟s experience – Step 3................................................................................................................. 19 ERM commentary – Step 3 ............................................................................................................... 24 J&J‟s experience – Step 4................................................................................................................. 31 ERM‟s experience – Step 4............................................................................................................... 31 Difference between J&J and ERM footprints calculated in parallel .................................................. 34
4 Summary ......................................................................................................... 38
Footprint Limitations .......................................................................................................................... 39 General Difficulties Encountered ...................................................................................................... 40 Difference between J&J and ERM footprints calculated in parallel .................................................. 41 Areas for Potential Improvement in Guidance .................................................................................. 42
5 References ...................................................................................................... 43
Annex A: Data Collection Questionnaire ............................................................. 44
2
Executive Summary
Background The PAS (Publically Available Specification) 2050 provides a standard method for calculating the greenhouse gas emissions embedded within the life cycle of a product or service. The method was developed by British Standards Institute (BSI), at the request of Defra and the Carbon Trust. It was launched in October 2008, following a period of consultation and testing. To assist the use and uptake of PAS 2050, Defra are running trials with products and services not tested to date, in order to identify the lessons learnt from the initial experiences of using the PAS 2050. This trial was to undertake a carbon footprint of a Johnson & Johnson (J&J) baby wipe product using the PAS 2050 method. The process was undertaken with a view to achieving the following objectives:
calculation of a carbon footprint for the baby wipe product;
recording J&J‟s experiences in implementing the PAS 2050, and decisions made at each stage in the process; and
documenting the lessons learnt from J&J‟s experiences, in order to inform future revisions of the PAS 2050 and guidance documentation.
The trial was undertaken by a predominantly procurement-based team from J&J, with the wider team including Directors of Government Affairs & Policy; Customer Development; and EHS. ERM acted in an advisory capacity, assuming the role of Life Cycle Assessment [LCA] specialist.
Summary Findings Overall the trial was a very successful one, a high proportion of good quality primary data were sourced and the resulting footprint is considered to be a good representation of the life cycle greenhouse gas impacts of a 64 pack of J&J Baby Wipes. The amount of primary data collected was, in fact, beyond the requirements of the PAS 2050. However, this is good practice wherever practicable, and allows a greater confidence in the resulting footprint. The more primary data collected, the more the footprint will reflect the actual product supply chain/s and potential impacts. The J&J team has very good relationships with suppliers up the value chain (ie not just direct suppliers) and this aided the collection of data not only for the production of the final product, but also for the production of key materials comprising the wipe substrate – viscose and non-woven. Secondary data was relied on predominantly for chemical inputs and packaging.
The J&J team found the Guide to PAS 2050 user friendly and easy to understand. The PAS 2050 specification itself was found to be too technical for a non-technical audience and so was not consulted to any great degree. Although the Guide to PAS 2050 was useful and user-friendly, it was found that the J&J team did require additional support in some areas. The relative ease/difficulty of respective
3
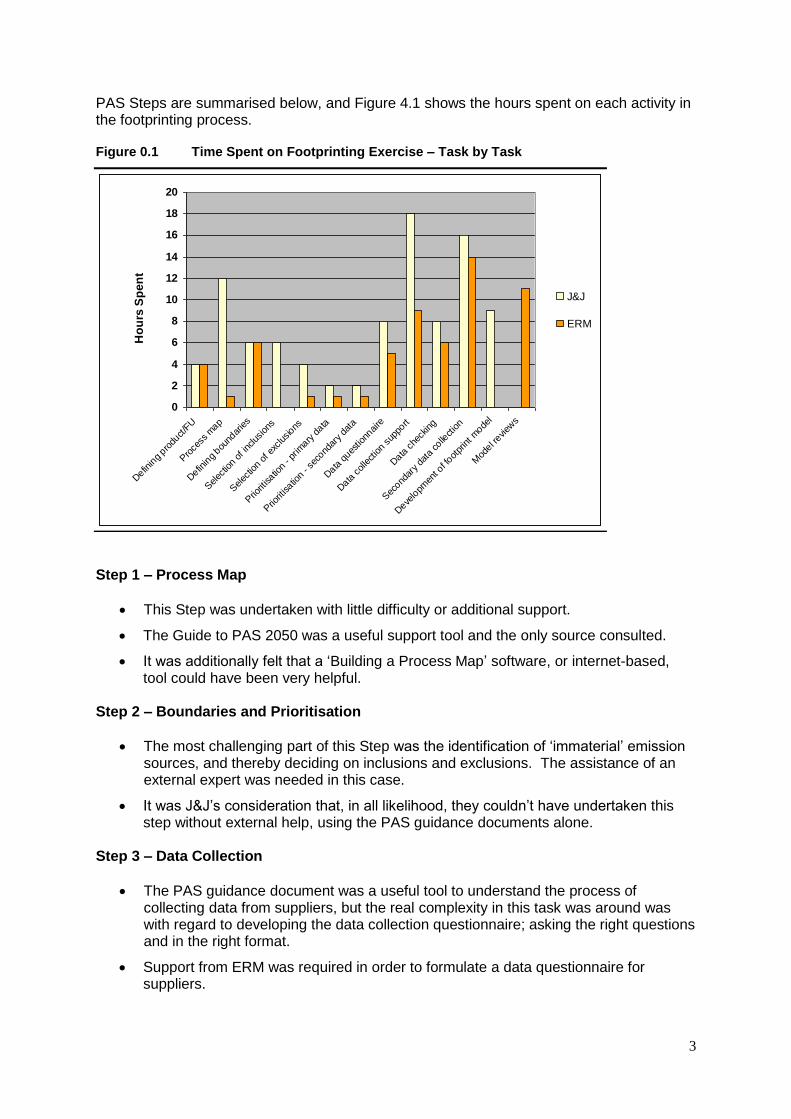
PAS Steps are summarised below, and Figure 4.1 shows the hours spent on each activity in the footprinting process.
Figure 0.1 Time Spent on Footprinting Exercise – Task by Task
Step 1 – Process Map
This Step was undertaken with little difficulty or additional support.
The Guide to PAS 2050 was a useful support tool and the only source consulted.
It was additionally felt that a „Building a Process Map‟ software, or internet-based, tool could have been very helpful.
Step 2 – Boundaries and Prioritisation
The most challenging part of this Step was the identification of „immaterial‟ emission sources, and thereby deciding on inclusions and exclusions. The assistance of an external expert was needed in this case.
It was J&J‟s consideration that, in all likelihood, they couldn‟t have undertaken this step without external help, using the PAS guidance documents alone.
Step 3 – Data Collection
The PAS guidance document was a useful tool to understand the process of collecting data from suppliers, but the real complexity in this task was around was with regard to developing the data collection questionnaire; asking the right questions and in the right format.
Support from ERM was required in order to formulate a data questionnaire for suppliers.
0
2
4
6
8
10
12
14
16
18
20
Defin
ing pro
duct/F
U
Pro
cess
map
Defin
ing bou
ndar
ies
Selec
tion o
f inc
lusion
s
Selec
tion o
f exc
lusions
Prio
ritisatio
n - pr
imary
data
Prio
ritisatio
n - se
cond
ary da
ta
Data
ques
tionn
aire
Data
collection
supp
ort
Data
che
cking
Sec
ondar
y da
ta colle
ction
Deve
lopm
ent o
f foot
print m
odel
Mod
el revi
ews
Ho
urs
Sp
en
t
J&J
ERM
4
The J&J team felt that the publically available sources of the secondary data available to them were too technical for a first time user. It may have been possible to undertake the secondary data-sourcing task without external support, but this would have required much more time and resources, and data quality might have been compromised.
Levels of response to data collection questionnaires were found to be quite dependent on supplier relationship, showing the importance of supplier relationship and supplier engagement.
Step 4 - Calculation
Once data had been collected, and translated into the required unit of measure, the calculation itself was found to be relatively easy. The unit of measure is the key difficulty here.
The croissant example in the Guide to PAS was followed, and the guidance was found to provide clear instructions on how to structure the data and calculate the carbon footprint.
Support from ERM was used to verify the calculations undertaken, for peace of mind, but it was not felt that external assistance, or any other guidance, was required for this Step.
The main difficulty throughout the Step, and following on from Step 3, was around data verification, recognising where data points were anomalous and making assumptions to fill data gaps. This is something that comes from experience, and so could be difficult to prescribe in any guidance materials.
Calculation Difficulties Encountered
Specific limitations of the footprint calculated for the baby wipe product, linked to technical or data collection difficulties, are outlined in detail in the report. Some more general difficulties encountered, and those likely to be common for many companies or product sectors, are as follows.
Interpreting secondary data sources and extracting the right information was very difficult. Data in sources such as the ELCD were quite tricky to interpret for a non-LCA practitioner; due to the terminologies and data presentation conventions used (eg inventory information rather than an aggregated CO2-equivalent figure).
Double-counting presented an issue, predominantly in relation to fuel combustion.
Transportation. Calculations around volume limitation for transport vehicles can be quite complex and require the collection of lots of information. For example, the volume capacity of each vehicle used is required (as opposed to weight, which is more commonly reported); and density of the materials transported is needed.
Post-production impacts proved to be quite a tricky area and data collection and calculations were predominantly undertaken by ERM, or under ERM‟s guidance (with the exception of J&J's own warehouse). It is likely that this would be the case for the majority of products/companies, as there are generally no primary data to be collected, little secondary data exist and activities are usually removed from a company‟s specific operations. This makes it difficult to firstly understand/visualise
5
the data that are required; and secondly to collect information where supply chain relationships might not be in place.
Obtaining emission factors for waste management from publically available sources was a big challenge, as no publically available data sources are PAS-compliant. As such, calculations must be made from first principles, based on degradation rates over time and landfill gas capture rates etc.
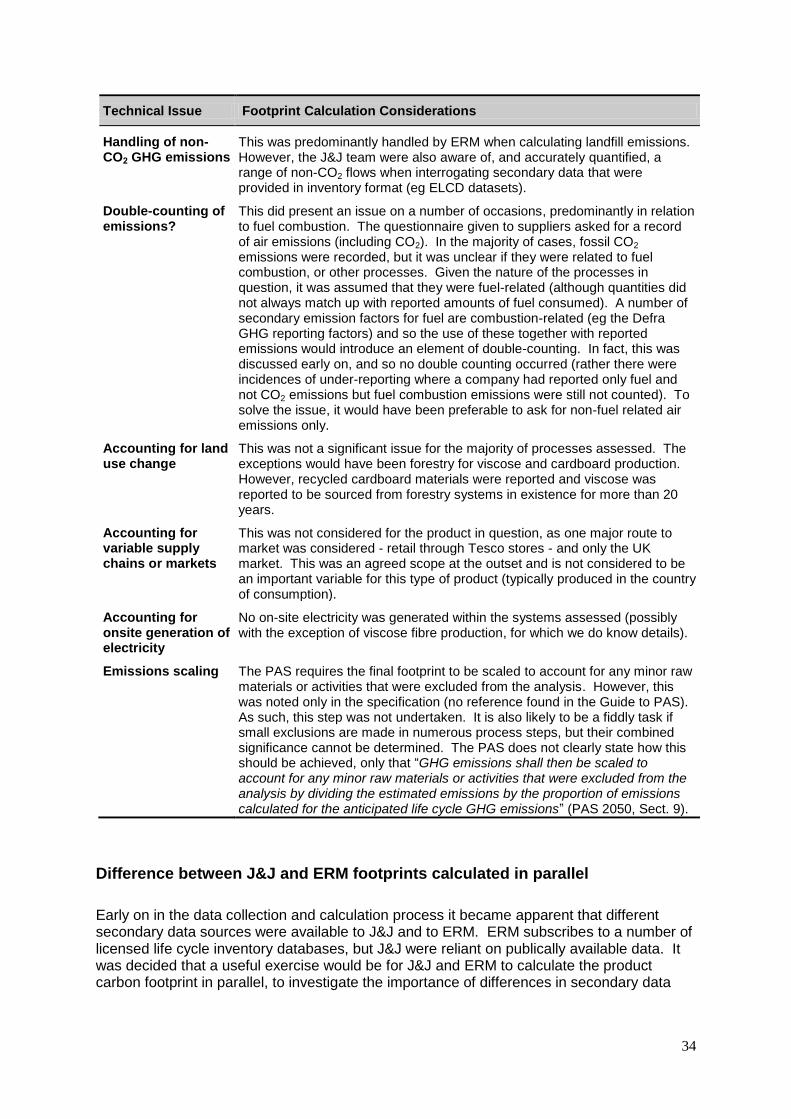
Difference between J&J and ERM footprints calculated in parallel
When comparing baby wipe carbon footprints calculated by J&J and ERM in parallel it was found that in some areas the J&J team‟s secondary data and calculations resulted in increased emissions, and in others lower emissions. The net result was that the baby wipe carbon footprint calculated by ERM and J&J were the same (<1% difference). The ERM footprint was, however, subsequently scaled up to account for material exclusions (small chemical inputs), resulting in an increase of approximately 3% (only 96% of material inputs to production were captured). The reason for this close alignment is likely to be due to the high degree of primary data sourced by J&J (and also used by ERM). Importantly, these primary data were sourced for key contributors to the footprint, such as viscose and non-woven production. This finding is not necessarily transferable to other product system, but shows that for the baby wipe supply chain secondary data choices were not a significant influence on the outcome, giving further confidence in the calculated footprint.
Areas for Potential Improvement in Guidance
Based on the observations from this trial, suggested improvements/ extensions to the PAS 2050 Guide would be in the following areas.
A simplified approach to determining what does and does not need to be included in the footprint (materiality considerations) is required. There was some confusion around the implementation of the materiality threshold rules for the baby wipe footprint. This is a common difficulty due to the „chicken and egg‟ scenario of needing data in order to assess materiality, but wanting to assess materiality before having to collect data. In this instance, it was advised that a materiality threshold could be devised based on the relative mass of component parts and other ingredients – ie to include all items that are 1% of the (dry) mass of the product.
Further guidance on data collection questionnaires, and a more detailed example questionnaire, or questionnaires, would be a welcome addition to the PAS documentation package. There is currently one example in the Guide to PAS, but this does not quite go far enough to generate a dataset that is complete and useful in a footprint.
Secondary data collection. If the audience of the Guide to PAS 2050 is a company new to carbon footprinting, there is a need for more specific guidance/examples in the interpretation and handling of secondary data sources, as the guidance itself was insufficient itself to provide support.
6
Likewise, some specific examples of where data gaps can exist, and how to fill them, and data-checking „rules of thumb‟ would be useful if the Guide is intended as use as a standalone support document (for a non-technical user).
The Guide would benefit from being extended with regard to the following specific areas, perhaps to include specific data sources, example calculations and common problems encountered:
o transport;
o storage and retail; and
o waste management.
The PAS 2050 specification itself was found to be too technical for a non-technical audience and so was not consulted to any great degree in this trial. This suggests that it is important that all key information is contained within the Guide to PAS 2050, rather than providing a referral to the specification.
7
1 Background and objectives
Background
The PAS (Publically Available Specification) 2050 provides a standard method for calculating the greenhouse gas emissions embedded within the life cycle of a product or service. The method was developed by British Standards Institute (BSI), at the request of Defra and the Carbon Trust. It was launched in October 2008, following a period of consultation and testing. During this development phase, a range of products and services were tested against the draft method and the resulting experiences were used to revise requirements and to inform supporting documentation. To assist the use and uptake of PAS 2050, Defra are running further trials with products and services not tested to date, in order to identify the lessons learnt from the initial experiences of using the PAS 2050. The healthcare product, baby wipes, being assessed in this project is one of these trials.
Project Aim & Objectives
The aim of this project was to undertake a carbon footprint of a Johnson & Johnson (J&J) baby wipe product using the PAS 2050 method. The process was undertaken with a view to achieving the following objectives:
calculation of a carbon footprint for the baby wipe product;
recording J&J‟s experiences in implementing the PAS 2050, and decisions made at each stage in the process; and
documenting the lessons learnt from J&J‟s experiences, in order to inform future revisions of the PAS 2050 and guidance documentation.
This Report
The scope of this report is not to specifically document the results of the footprint calculations, but to record J&J‟s experience of using the PAS 2050 and accompanying guidance materials. The report sets out:
a summary of steps and tools used to undertake the trial;
the J&J team and ERM‟s experiences in undertaking each step in the process;
resources expended in calculating the footprint;
specific technical issues encountered, and how they were resolved;
the usefulness of supporting guidance documentation to the PAS 2050;
recommendations as to how guidance could be improved.
8
2 Methods and approach
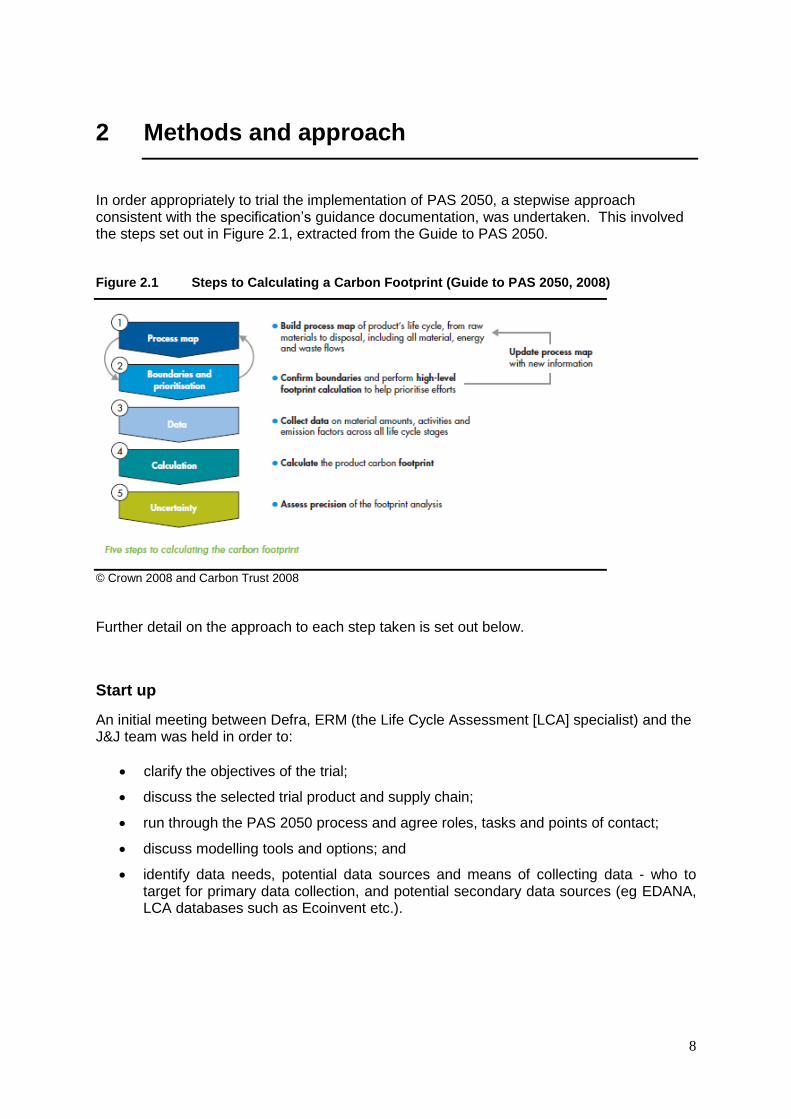
In order appropriately to trial the implementation of PAS 2050, a stepwise approach consistent with the specification‟s guidance documentation, was undertaken. This involved the steps set out in Figure 2.1, extracted from the Guide to PAS 2050.
Figure 2.1 Steps to Calculating a Carbon Footprint (Guide to PAS 2050, 2008)
© Crown 2008 and Carbon Trust 2008
Further detail on the approach to each step taken is set out below.
Start up
An initial meeting between Defra, ERM (the Life Cycle Assessment [LCA] specialist) and the J&J team was held in order to:
clarify the objectives of the trial;
discuss the selected trial product and supply chain;
run through the PAS 2050 process and agree roles, tasks and points of contact;
discuss modelling tools and options; and
identify data needs, potential data sources and means of collecting data - who to target for primary data collection, and potential secondary data sources (eg EDANA, LCA databases such as Ecoinvent etc.).
9
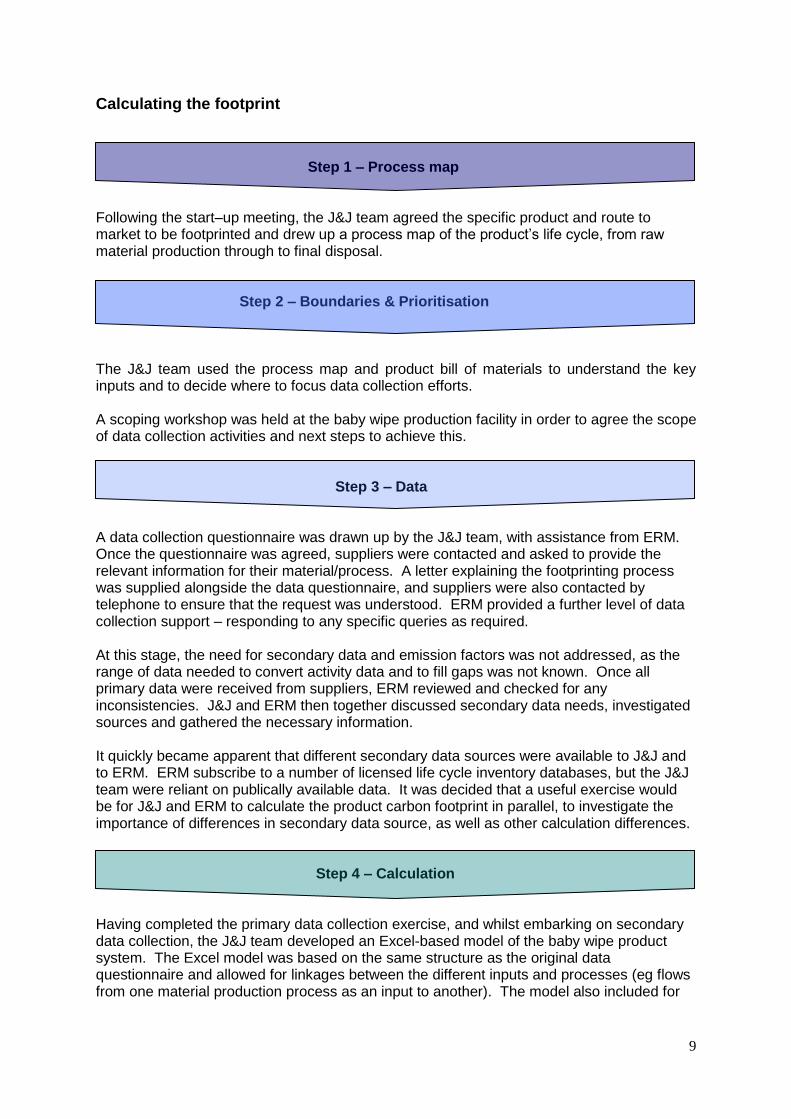
Calculating the footprint
Step 1 – Process map Following the start–up meeting, the J&J team agreed the specific product and route to market to be footprinted and drew up a process map of the product‟s life cycle, from raw material production through to final disposal. Step 2 – Boundaries & Prioritisation The J&J team used the process map and product bill of materials to understand the key inputs and to decide where to focus data collection efforts. A scoping workshop was held at the baby wipe production facility in order to agree the scope of data collection activities and next steps to achieve this. Step 3 – Data A data collection questionnaire was drawn up by the J&J team, with assistance from ERM. Once the questionnaire was agreed, suppliers were contacted and asked to provide the relevant information for their material/process. A letter explaining the footprinting process was supplied alongside the data questionnaire, and suppliers were also contacted by telephone to ensure that the request was understood. ERM provided a further level of data collection support – responding to any specific queries as required. At this stage, the need for secondary data and emission factors was not addressed, as the range of data needed to convert activity data and to fill gaps was not known. Once all primary data were received from suppliers, ERM reviewed and checked for any inconsistencies. J&J and ERM then together discussed secondary data needs, investigated sources and gathered the necessary information. It quickly became apparent that different secondary data sources were available to J&J and to ERM. ERM subscribe to a number of licensed life cycle inventory databases, but the J&J team were reliant on publically available data. It was decided that a useful exercise would be for J&J and ERM to calculate the product carbon footprint in parallel, to investigate the importance of differences in secondary data source, as well as other calculation differences. Step 4 – Calculation Having completed the primary data collection exercise, and whilst embarking on secondary data collection, the J&J team developed an Excel-based model of the baby wipe product system. The Excel model was based on the same structure as the original data questionnaire and allowed for linkages between the different inputs and processes (eg flows from one material production process as an input to another). The model also included for
10
activities occurring downstream of the baby wipe production process – ie distribution, storage, retail, use and end of life stages. ERM reviewed the model for completeness at various stages in its development and provided advice on gap filling and addressing any inconsistencies. ERM also used the same model structure to calculate the baby wipe footprint in parallel (using secondary data from licensed life cycle inventory databases). When the models were completed, with all gaps filled, ERM carried out a final review and highlighted any limitations in the data or calculations that would benefit from improvement in future exercises. Step 5 – Uncertainty The uncertainty analysis step is an optional one and was not carried out in this trial. A significant proportion of primary data were collected and so it was considered that there would be a relatively high degree of confidence in the resulting footprint.
Recording of experiences
In order to support this report and to document the experiences of using the PAS 2050 in the J&J, and other, trials, a PAS 2050 „Understanding and Learnings‟ template was developed. This template comprised a standard set of questions and metrics to appraise the company‟s implementation of the specification, in terms of:
experiences;
feedback;
learning‟s with regard to the pros and cons of the PAS 2050;
additional support and material needs; and
resources expended throughout the trial.
11
3 Findings
This section records the experiences of using the PAS 2050 in the J&J baby wipe trial, specific lessons learnt throughout each footprint calculation step and any specific technical issues encountered. The section is split into findings for each PAS Step, documenting the tasks undertaken, reasoning, outcomes and resource needs (time) in a Table. This is followed by a summary of J&J‟s experience in carrying out the Step and ERM‟s commentary on any issues encountered.
Start up
A number of J&J personnel attended the initial project meeting, including Directors of Government Affairs & Policy; Customer Development; EHS; and Procurement. Some problems were initially identified around defining a project manager with all the required skills for the study (understanding of the supply chain and numeracy in particular), but this was later addressed. The meeting was a useful scene-setting exercise and served to provide background to the PAS 2050 process for the J&J team; and an outline of the baby wipe supply chain for Defra and ERM. The baby wipe product is predominantly comprised of a viscose and polyester fibre nonwoven material. Viscose sourced from an Austrian supplier and then is spun and blended with polyester fibre by a subsequent supplier based in Germany. The production of the final product occurs in the UK (for UK-retailed products) and this process is undertaken also by a third party wipes converter. At the third party‟s site, an oil and water lotion emulsion is added to the non-woven, the wipes are folded and packaged. Packaging comprises a laminate film plus label and a cardboard outer case (100% recycled content).
Calculating the footprint
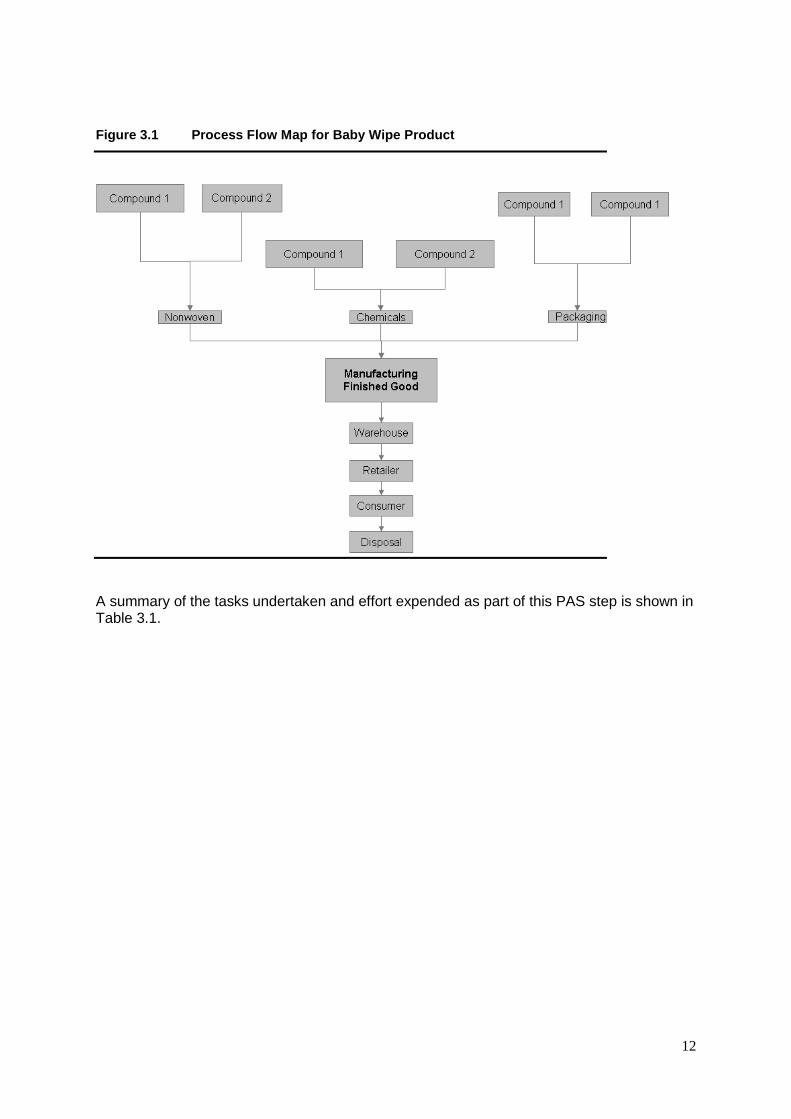
Step 1 – Process map Following the start–up meeting, the J&J team confirmed the specific product to be assessed as a 64 pack of baby wipes, single flow, Crown lotion. The functional unit for the resulting carbon footprint was chosen to be one single wipe. A process map of the baby wipe product life cycle was drawn up, and is shown in Figure 3.1. Note – this does not detail all of the inputs to the baby wipe product. There are nine additional chemical inputs and pallet and shrink-wrap materials that also form part of the packaged, distributed product, but these were later discounted from the exercise (see Step 2) and so were not included in the process map.
12
Figure 3.1 Process Flow Map for Baby Wipe Product
A summary of the tasks undertaken and effort expended as part of this PAS step is shown in Table 3.1.

13
Table 3.1 Footprinting Activities – Step 1
PAS Step
Task/ Activity
Process Undertaken to Complete this Task
Time Taken - J&J (hours)
Support from ERM (hours)
Key Assumptions/ Reasoning Made
Outcome from Task
Step 1
Defining functional unit for study
The product was identified during the kick off meeting between Defra and J&J
4 (meeting)
4 (meeting)
The functional unit reflected the unit in which the product is consumed by the end user. The functional unit has been defined as a single sheet of wipes of the highest selling baby wipe SKU in J&J's baby wipes product portfolio.
Single wipe from the pack of Johnson's Skincare Baby Wipes 64 count
Building process map
The process map was developed by a cross-functional J&J team, discussed during the meeting between J&J, wipes converter, ERM and finalised after several conference call consultations between the J&J project team and ERM. The Bill of Materials and finished product spec was used to identify significant raw material inputs, manufacturing processes and transportation requirements.
12 1 The process map included all possible drivers of emission, but excluded potentially insignificant contributors (cross-over with Step 2).
Process map
J&J’s experience – Step 1
J&J found Step 1 of the footprinting process to be moderately difficult. Both the Guide to PAS 2050 and external support were found to be useful: “once we've gone through PAS 2050 guide (croissants example), and had a conference call with ERM, the process became clear”. “the guide to PAS 2050 was very useful, it's easy to understand and has a good practical example. The PAS 2050 Specification brochure is too technical for „non-technical‟ people”.
14
Overall the process of undertaking Step 1 was a useful one to the company in informing understanding of inputs/emissions across the product's supply chain and was seen as a foundation for the entire trial. It was felt that this Step in the process could have been undertaken without external support, using only the existing guidance documentation. External support was helpful in reducing time spent in familiarisation and understanding of requirements, but was not essential. The Guide to PAS 2050 was a useful support tool in itself. It was additionally felt that a „Building a Process Map‟ software, or internet-based, tool could also have been very helpful.
ERM commentary – Step 1
No real difficulties were observed in the J&J team undertaking this task. The team primarily completed the process map themselves, with only minimal steer given at the start-up and review stage. The guidance given in the PAS was found to be helpful, and this Step in general is a useful scene-setting one even for those not wishing to embark any further on a footprinting exercise.
15
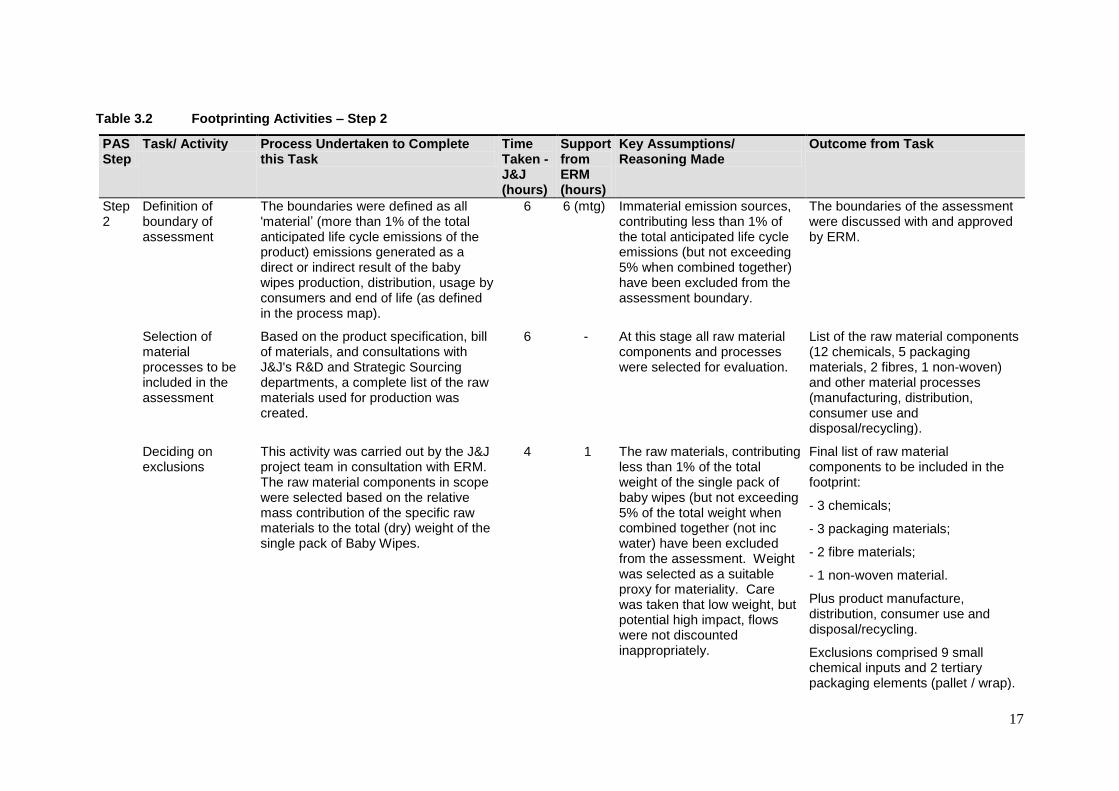
Step 2 – Boundaries & Prioritisation The J&J team used the process map and product bill of materials to understand what are the key inputs and to decide where to focus data collection efforts. A summary of the tasks undertaken and effort expended as part of this PAS step is shown in Table 3.2.
J&J’s experience – Step 2
The J&J team found this PAS step more difficult than Step 1. The most challenging part was the identification of „immaterial‟ emission sources, and thereby deciding on inclusions and exclusions. The assistance of an external expert was needed in this case. External support provided was predominantly in the form of discussions around how to determine if something is material or immaterial. The approach taken was to use mass as a proxy for environmental impact and to exclude inputs that are less than 1% of the product‟s weight (discussed further below). It was J&J‟s consideration that, in all likelihood, they couldn‟t have undertaken this step without external help, using the PAS guidance documents alone. However, the process of undertaking this exercise was found to be very helpful in better understanding the contribution of specific raw materials and processes to the total greenhouse gas emissions of the finished product.
ERM commentary – Step 2
There was some confusion around the implementation of the materiality threshold rules for the baby wipe footprint. This is a common difficulty due to the „chicken and egg‟ scenario of needing data in order to assess materiality, but wanting to assess materiality before having to collect data. In this instance, a particular difficulty arose because, not having access to extensive secondary databases, J&J did not have the required information to carry out the type of materiality analysis described in the Guide to PAS 2050. Instead, it was advised that a materiality threshold could be devised based on the relative mass of component parts and other ingredients. Assessing materiality by mass is an approach often taken in life cycle studies – provided that due care is given that inputs with low mass, but high potential impact are not discounted. For the baby wipe product, care was taken that the materiality assessment took due account of the high water content in the product. Water in the baby wipe lotion comprises over 70% of the total packaged product weight, but is likely to contribute only a very small amount to the product footprint. Thus to assess materiality based on „proportion of total product weight (including water)‟ would not be a suitable proxy for „proportion of emissions‟. The risk would be to discount some components with low mass, but considerably greater embodied emissions than water.
16
In order to make a more representative assessment of materiality in this case, water was removed from the equation and material flows were calculated to be those inputs greater than 1% of the dry mass of the product (defined as total weight minus water in the lotion). This choice of cut-off threshold has been retrospectively assessed, and found to be sound. The dry mass of the product (as defined) is comprised of non-woven, laminate packaging and lotion chemicals. The footprint calculations included the non-woven, laminate packaging and 3 of 12 lotion chemicals - together comprising 96% of the dry mass. Embodied emissions associated with all of these inputs were found to be very similar, and it is likely that the remaining 9 chemicals would also have embodied impacts that are not dissimilar. Thus, a simple scaling exercise would give a very good representation of the total product footprint. It is a point of note that in the final calculation of the footprint, while there is a requirement in the PAS to carry out a scaling exercise where exclusions have been made, this is only documented in the specification, not in the Guide to PAS 2050. PAS 2050, Section 9: “The GHG emissions shall then be scaled to account for any minor raw materials or activities that were excluded from the analysis by dividing the estimated emissions by the proportion of emissions calculated for the anticipated life cycle GHG emissions” The J&J team found the PAS specification too technical for a first-time user and so consulted only the guidance document. As a result, this step was missed in the final calculation.
17
Table 3.2 Footprinting Activities – Step 2
PAS Step
Task/ Activity Process Undertaken to Complete this Task
Time Taken - J&J (hours)
Support from ERM (hours)
Key Assumptions/ Reasoning Made
Outcome from Task
Step 2
Definition of boundary of assessment
The boundaries were defined as all 'material‟ (more than 1% of the total anticipated life cycle emissions of the product) emissions generated as a direct or indirect result of the baby wipes production, distribution, usage by consumers and end of life (as defined in the process map).
6 6 (mtg) Immaterial emission sources, contributing less than 1% of the total anticipated life cycle emissions (but not exceeding 5% when combined together) have been excluded from the assessment boundary.
The boundaries of the assessment were discussed with and approved by ERM.
Selection of material processes to be included in the assessment
Based on the product specification, bill of materials, and consultations with J&J's R&D and Strategic Sourcing departments, a complete list of the raw materials used for production was created.
6 - At this stage all raw material components and processes were selected for evaluation.
List of the raw material components (12 chemicals, 5 packaging materials, 2 fibres, 1 non-woven) and other material processes (manufacturing, distribution, consumer use and disposal/recycling).
Deciding on exclusions
This activity was carried out by the J&J project team in consultation with ERM. The raw material components in scope were selected based on the relative mass contribution of the specific raw materials to the total (dry) weight of the single pack of Baby Wipes.
4 1 The raw materials, contributing less than 1% of the total weight of the single pack of baby wipes (but not exceeding 5% of the total weight when combined together (not inc water) have been excluded from the assessment. Weight was selected as a suitable proxy for materiality. Care was taken that low weight, but potential high impact, flows were not discounted inappropriately.
Final list of raw material components to be included in the footprint:
- 3 chemicals;
- 3 packaging materials;
- 2 fibre materials;
- 1 non-woven material.
Plus product manufacture, distribution, consumer use and disposal/recycling.
Exclusions comprised 9 small chemical inputs and 2 tertiary packaging elements (pallet / wrap).
18
PAS Step
Task/ Activity Process Undertaken to Complete this Task
Time Taken - J&J (hours)
Support from ERM (hours)
Key Assumptions/ Reasoning Made
Outcome from Task
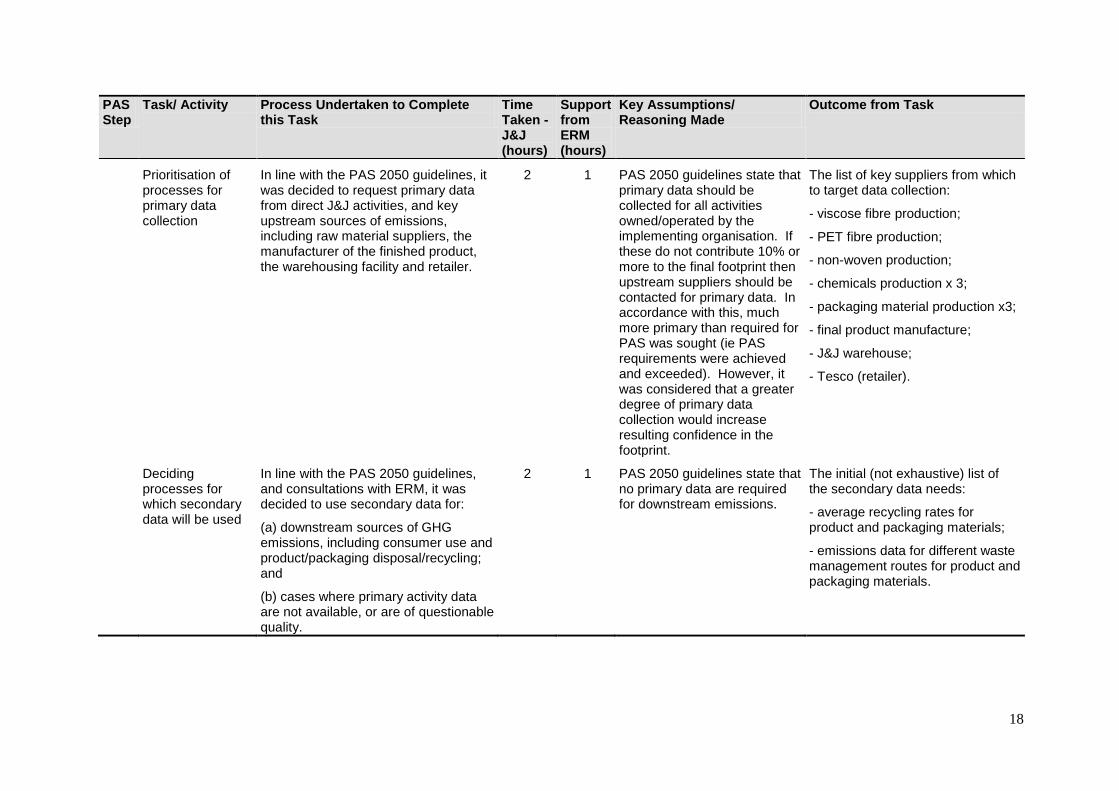
Prioritisation of processes for primary data collection
In line with the PAS 2050 guidelines, it was decided to request primary data from direct J&J activities, and key upstream sources of emissions, including raw material suppliers, the manufacturer of the finished product, the warehousing facility and retailer.
2 1 PAS 2050 guidelines state that primary data should be collected for all activities owned/operated by the implementing organisation. If these do not contribute 10% or more to the final footprint then upstream suppliers should be contacted for primary data. In accordance with this, much more primary than required for PAS was sought (ie PAS requirements were achieved and exceeded). However, it was considered that a greater degree of primary data collection would increase resulting confidence in the footprint.
The list of key suppliers from which to target data collection:
- viscose fibre production;
- PET fibre production;
- non-woven production;
- chemicals production x 3;
- packaging material production x3;
- final product manufacture;
- J&J warehouse;
- Tesco (retailer).
Deciding processes for which secondary data will be used
In line with the PAS 2050 guidelines, and consultations with ERM, it was decided to use secondary data for:
(a) downstream sources of GHG emissions, including consumer use and product/packaging disposal/recycling; and
(b) cases where primary activity data are not available, or are of questionable quality.
2 1 PAS 2050 guidelines state that no primary data are required for downstream emissions.
The initial (not exhaustive) list of the secondary data needs:
- average recycling rates for product and packaging materials;
- emissions data for different waste management routes for product and packaging materials.
19
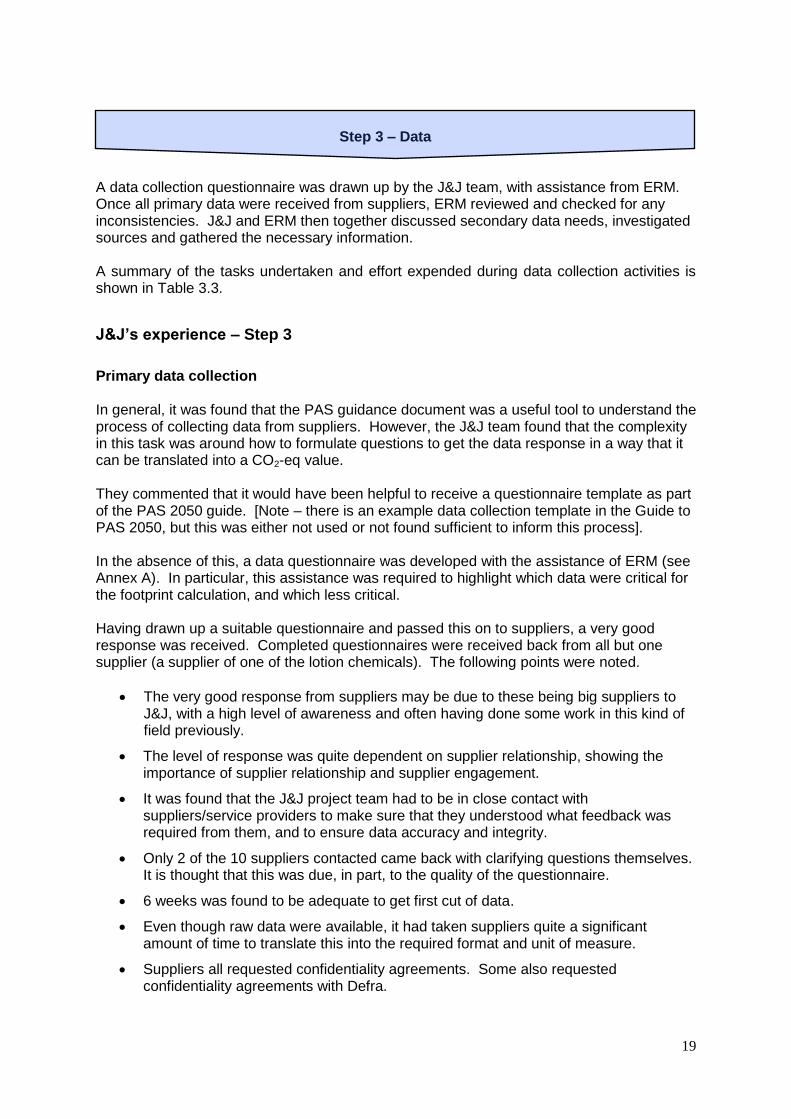
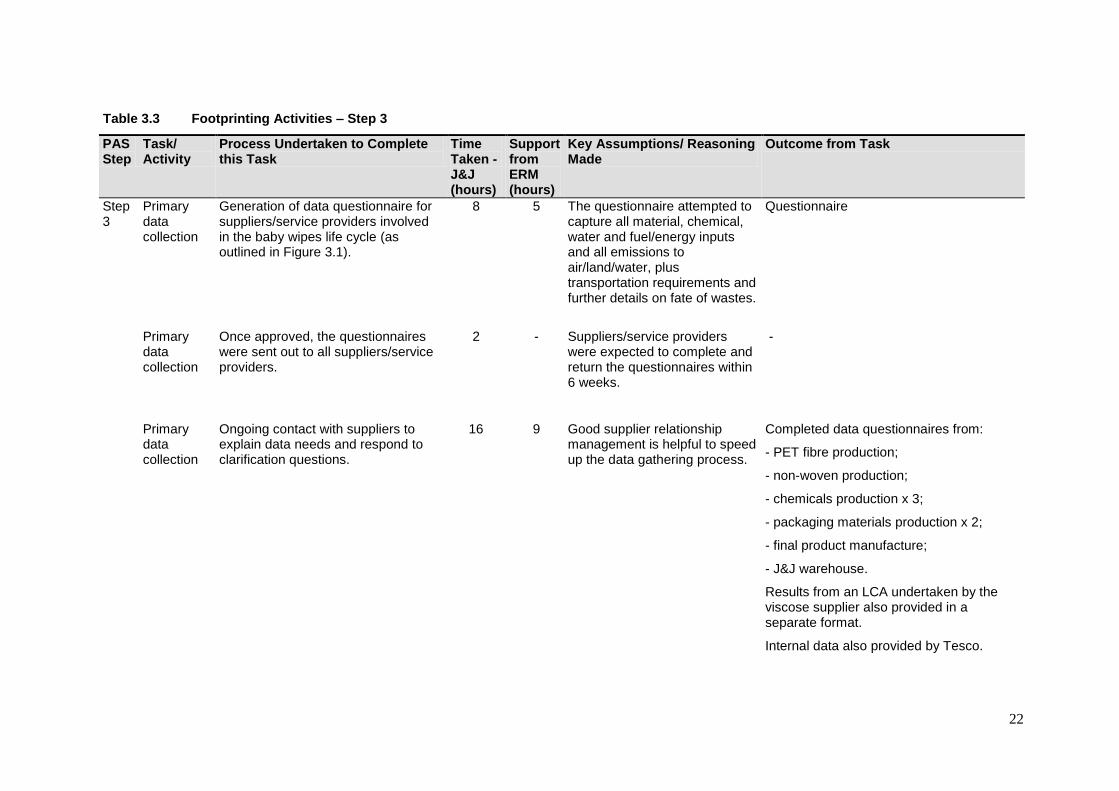
Step 3 – Data A data collection questionnaire was drawn up by the J&J team, with assistance from ERM. Once all primary data were received from suppliers, ERM reviewed and checked for any inconsistencies. J&J and ERM then together discussed secondary data needs, investigated sources and gathered the necessary information. A summary of the tasks undertaken and effort expended during data collection activities is shown in Table 3.3.
J&J’s experience – Step 3
Primary data collection In general, it was found that the PAS guidance document was a useful tool to understand the process of collecting data from suppliers. However, the J&J team found that the complexity in this task was around how to formulate questions to get the data response in a way that it can be translated into a CO2-eq value. They commented that it would have been helpful to receive a questionnaire template as part of the PAS 2050 guide. [Note – there is an example data collection template in the Guide to PAS 2050, but this was either not used or not found sufficient to inform this process]. In the absence of this, a data questionnaire was developed with the assistance of ERM (see Annex A). In particular, this assistance was required to highlight which data were critical for the footprint calculation, and which less critical. Having drawn up a suitable questionnaire and passed this on to suppliers, a very good response was received. Completed questionnaires were received back from all but one supplier (a supplier of one of the lotion chemicals). The following points were noted.
The very good response from suppliers may be due to these being big suppliers to J&J, with a high level of awareness and often having done some work in this kind of field previously.
The level of response was quite dependent on supplier relationship, showing the importance of supplier relationship and supplier engagement.
It was found that the J&J project team had to be in close contact with suppliers/service providers to make sure that they understood what feedback was required from them, and to ensure data accuracy and integrity.
Only 2 of the 10 suppliers contacted came back with clarifying questions themselves. It is thought that this was due, in part, to the quality of the questionnaire.
6 weeks was found to be adequate to get first cut of data.
Even though raw data were available, it had taken suppliers quite a significant amount of time to translate this into the required format and unit of measure.
Suppliers all requested confidentiality agreements. Some also requested confidentiality agreements with Defra.
20
There was some general concern among suppliers as to how their numbers would be used, and how the footprint would be broken down.
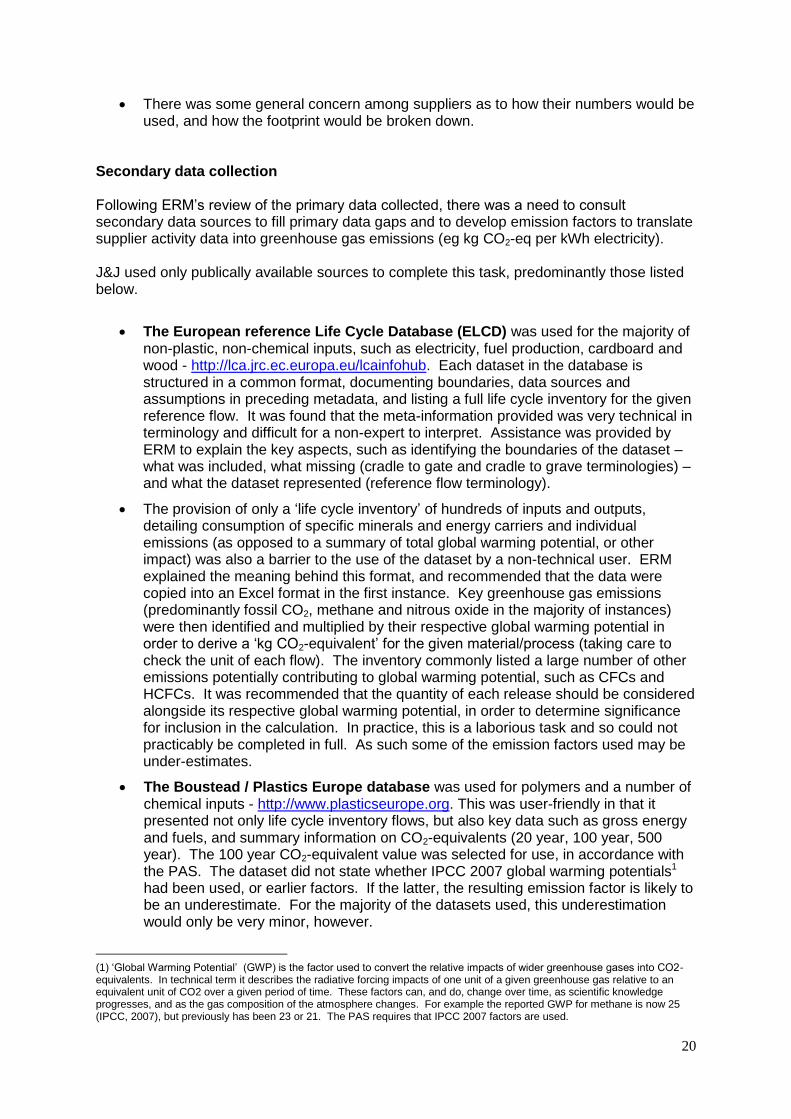
Secondary data collection Following ERM‟s review of the primary data collected, there was a need to consult secondary data sources to fill primary data gaps and to develop emission factors to translate supplier activity data into greenhouse gas emissions (eg kg CO2-eq per kWh electricity). J&J used only publically available sources to complete this task, predominantly those listed below.
The European reference Life Cycle Database (ELCD) was used for the majority of non-plastic, non-chemical inputs, such as electricity, fuel production, cardboard and wood - http://lca.jrc.ec.europa.eu/lcainfohub. Each dataset in the database is structured in a common format, documenting boundaries, data sources and assumptions in preceding metadata, and listing a full life cycle inventory for the given reference flow. It was found that the meta-information provided was very technical in terminology and difficult for a non-expert to interpret. Assistance was provided by ERM to explain the key aspects, such as identifying the boundaries of the dataset – what was included, what missing (cradle to gate and cradle to grave terminologies) – and what the dataset represented (reference flow terminology).
The provision of only a „life cycle inventory‟ of hundreds of inputs and outputs, detailing consumption of specific minerals and energy carriers and individual emissions (as opposed to a summary of total global warming potential, or other impact) was also a barrier to the use of the dataset by a non-technical user. ERM explained the meaning behind this format, and recommended that the data were copied into an Excel format in the first instance. Key greenhouse gas emissions (predominantly fossil CO2, methane and nitrous oxide in the majority of instances) were then identified and multiplied by their respective global warming potential in order to derive a „kg CO2-equivalent‟ for the given material/process (taking care to check the unit of each flow). The inventory commonly listed a large number of other emissions potentially contributing to global warming potential, such as CFCs and HCFCs. It was recommended that the quantity of each release should be considered alongside its respective global warming potential, in order to determine significance for inclusion in the calculation. In practice, this is a laborious task and so could not practicably be completed in full. As such some of the emission factors used may be under-estimates.
The Boustead / Plastics Europe database was used for polymers and a number of chemical inputs - http://www.plasticseurope.org. This was user-friendly in that it presented not only life cycle inventory flows, but also key data such as gross energy and fuels, and summary information on CO2-equivalents (20 year, 100 year, 500 year). The 100 year CO2-equivalent value was selected for use, in accordance with the PAS. The dataset did not state whether IPCC 2007 global warming potentials1 had been used, or earlier factors. If the latter, the resulting emission factor is likely to be an underestimate. For the majority of the datasets used, this underestimation would only be very minor, however.
(1) „Global Warming Potential‟ (GWP) is the factor used to convert the relative impacts of wider greenhouse gases into CO2-equivalents. In technical term it describes the radiative forcing impacts of one unit of a given greenhouse gas relative to an equivalent unit of CO2 over a given period of time. These factors can, and do, change over time, as scientific knowledge progresses, and as the gas composition of the atmosphere changes. For example the reported GWP for methane is now 25 (IPCC, 2007), but previously has been 23 or 21. The PAS requires that IPCC 2007 factors are used.
21
Defra 2008 GHG reporting factors were used for transportation and UK grid electricity - http://www.defra.gov.uk/environment/business/reporting/pdf/ghg-cf-guidelines-annexes2008.pdf. These were very clearly presented in the documentation and easy to use. However, it is a point of note that these factors only account for the CO2 associated with burning fuel (in an engine or power plant). They do not include the burdens of producing the fuel, or transporting it to point of use. As such, these emission factors are underestimates (typically by up to 10%) and not compliant with PAS 2050 boundaries. The PAS states that upstream emissions from producing fuels/energy – and transporting fuels should be included in the assessment.
In general, it was the J&J team‟s feeling that the publically available sources of the secondary data available to them were too technical for a first time user. It would have been possible to undertake the secondary data-sourcing task without external support, but this would have required much more time and resources, and data quality might have been compromised. This step in general The J&J team found this step useful in providing a lot of information regarding sources of greenhouse emissions. “The knowledge of the greenhouse gas emissions related to the life cycle of the baby wipe product is useful and allows us to identify CO2 drivers.”
22
Table 3.3 Footprinting Activities – Step 3
PAS Step
Task/ Activity
Process Undertaken to Complete this Task
Time Taken - J&J (hours)
Support from ERM (hours)
Key Assumptions/ Reasoning Made
Outcome from Task
Step 3
Primary data collection
Generation of data questionnaire for suppliers/service providers involved in the baby wipes life cycle (as outlined in Figure 3.1).
8 5 The questionnaire attempted to capture all material, chemical, water and fuel/energy inputs and all emissions to air/land/water, plus transportation requirements and further details on fate of wastes.
Questionnaire
Primary data collection
Once approved, the questionnaires were sent out to all suppliers/service providers.
2 - Suppliers/service providers were expected to complete and return the questionnaires within 6 weeks.
-
Primary data collection
Ongoing contact with suppliers to explain data needs and respond to clarification questions.
16 9 Good supplier relationship management is helpful to speed up the data gathering process.
Completed data questionnaires from:
- PET fibre production;
- non-woven production;
- chemicals production x 3;
- packaging materials production x 2;
- final product manufacture;
- J&J warehouse.
Results from an LCA undertaken by the viscose supplier also provided in a separate format.
Internal data also provided by Tesco.
23
PAS Step
Task/ Activity
Process Undertaken to Complete this Task
Time Taken - J&J (hours)
Support from ERM (hours)
Key Assumptions/ Reasoning Made
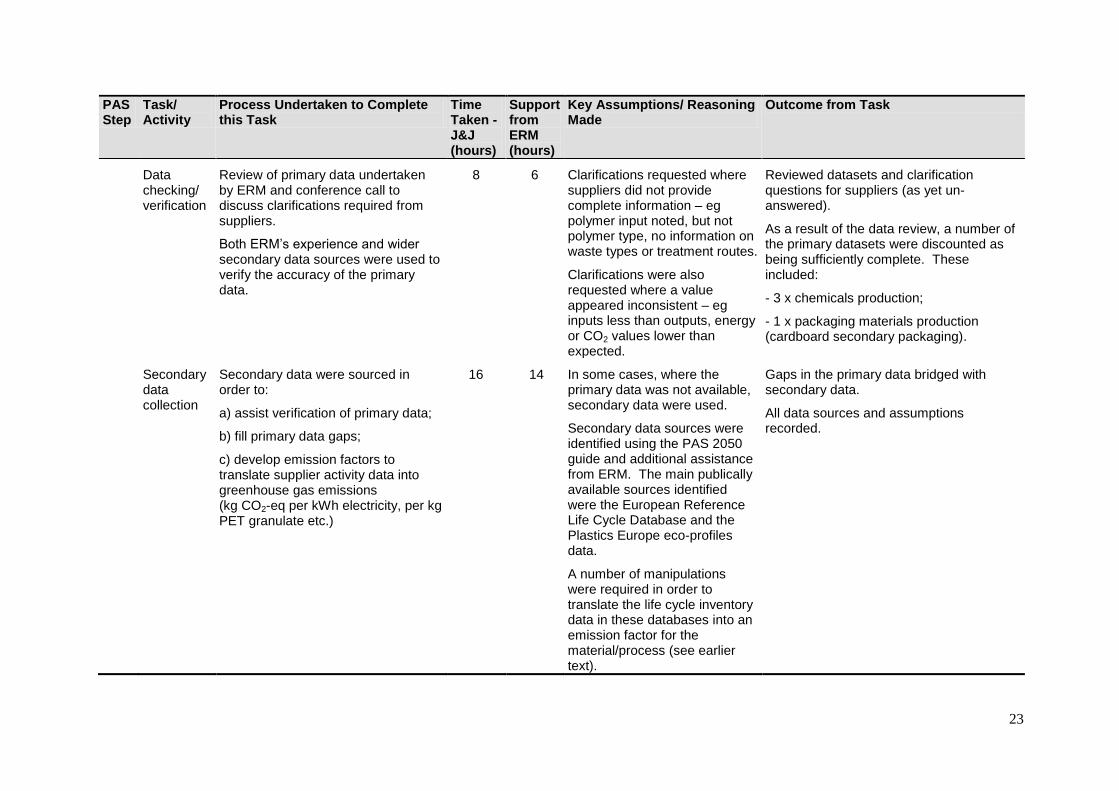
Outcome from Task
Data checking/ verification
Review of primary data undertaken by ERM and conference call to discuss clarifications required from suppliers.
Both ERM‟s experience and wider secondary data sources were used to verify the accuracy of the primary data.
8 6 Clarifications requested where suppliers did not provide complete information – eg polymer input noted, but not polymer type, no information on waste types or treatment routes.
Clarifications were also requested where a value appeared inconsistent – eg inputs less than outputs, energy or CO2 values lower than expected.
Reviewed datasets and clarification questions for suppliers (as yet un-answered).
As a result of the data review, a number of the primary datasets were discounted as being sufficiently complete. These included:
- 3 x chemicals production;
- 1 x packaging materials production (cardboard secondary packaging).
Secondary data collection
Secondary data were sourced in order to:
a) assist verification of primary data;
b) fill primary data gaps;
c) develop emission factors to translate supplier activity data into greenhouse gas emissions (kg CO2-eq per kWh electricity, per kg PET granulate etc.)
16 14 In some cases, where the primary data was not available, secondary data were used.
Secondary data sources were identified using the PAS 2050 guide and additional assistance from ERM. The main publically available sources identified were the European Reference Life Cycle Database and the Plastics Europe eco-profiles data.
A number of manipulations were required in order to translate the life cycle inventory data in these databases into an emission factor for the material/process (see earlier text).
Gaps in the primary data bridged with secondary data.
All data sources and assumptions recorded.
24
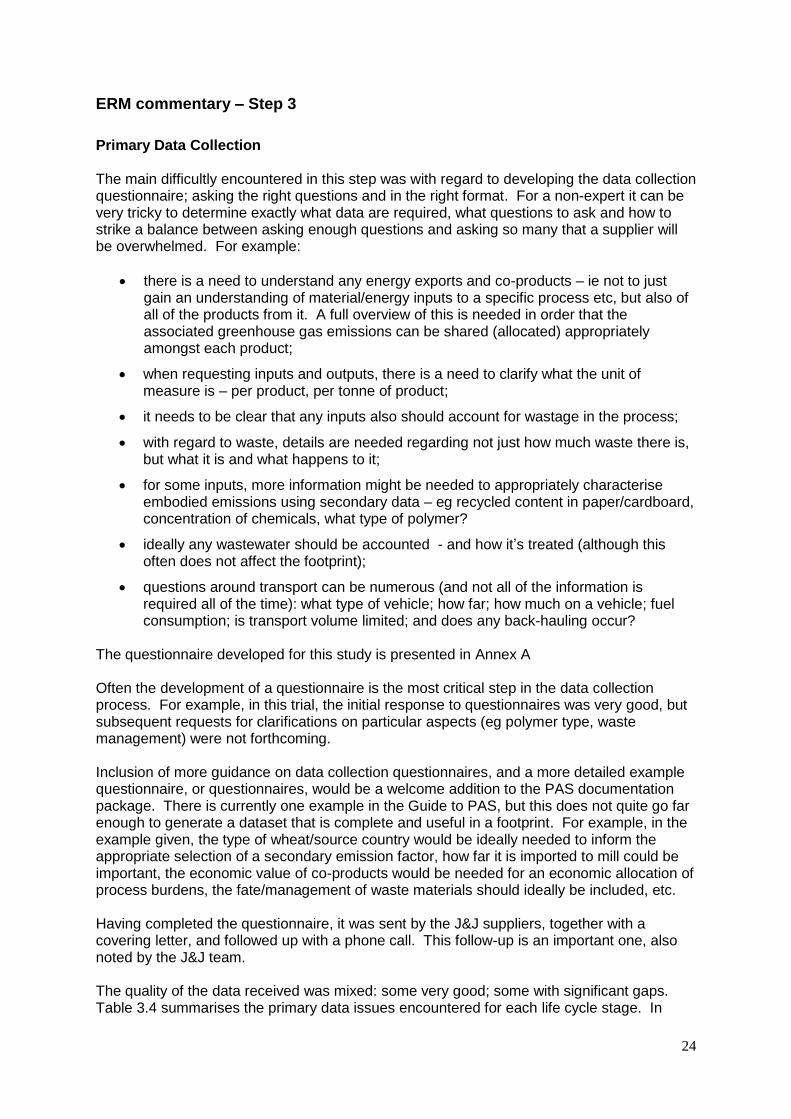
ERM commentary – Step 3
Primary Data Collection
The main difficultly encountered in this step was with regard to developing the data collection questionnaire; asking the right questions and in the right format. For a non-expert it can be very tricky to determine exactly what data are required, what questions to ask and how to strike a balance between asking enough questions and asking so many that a supplier will be overwhelmed. For example:
there is a need to understand any energy exports and co-products – ie not to just gain an understanding of material/energy inputs to a specific process etc, but also of all of the products from it. A full overview of this is needed in order that the associated greenhouse gas emissions can be shared (allocated) appropriately amongst each product;
when requesting inputs and outputs, there is a need to clarify what the unit of measure is – per product, per tonne of product;
it needs to be clear that any inputs also should account for wastage in the process;
with regard to waste, details are needed regarding not just how much waste there is, but what it is and what happens to it;
for some inputs, more information might be needed to appropriately characterise embodied emissions using secondary data – eg recycled content in paper/cardboard, concentration of chemicals, what type of polymer?
ideally any wastewater should be accounted - and how it‟s treated (although this often does not affect the footprint);
questions around transport can be numerous (and not all of the information is required all of the time): what type of vehicle; how far; how much on a vehicle; fuel consumption; is transport volume limited; and does any back-hauling occur?
The questionnaire developed for this study is presented in Annex A Often the development of a questionnaire is the most critical step in the data collection process. For example, in this trial, the initial response to questionnaires was very good, but subsequent requests for clarifications on particular aspects (eg polymer type, waste management) were not forthcoming. Inclusion of more guidance on data collection questionnaires, and a more detailed example questionnaire, or questionnaires, would be a welcome addition to the PAS documentation package. There is currently one example in the Guide to PAS, but this does not quite go far enough to generate a dataset that is complete and useful in a footprint. For example, in the example given, the type of wheat/source country would be ideally needed to inform the appropriate selection of a secondary emission factor, how far it is imported to mill could be important, the economic value of co-products would be needed for an economic allocation of process burdens, the fate/management of waste materials should ideally be included, etc. Having completed the questionnaire, it was sent by the J&J suppliers, together with a covering letter, and followed up with a phone call. This follow-up is an important one, also noted by the J&J team. The quality of the data received was mixed: some very good; some with significant gaps. Table 3.4 summarises the primary data issues encountered for each life cycle stage. In
25
general for this project, a high degree of good quality primary data was sourced. Levels of primary data collection were beyond the requirements of the PAS 2050. This is good practice and allows a greater confidence in the resulting footprint.
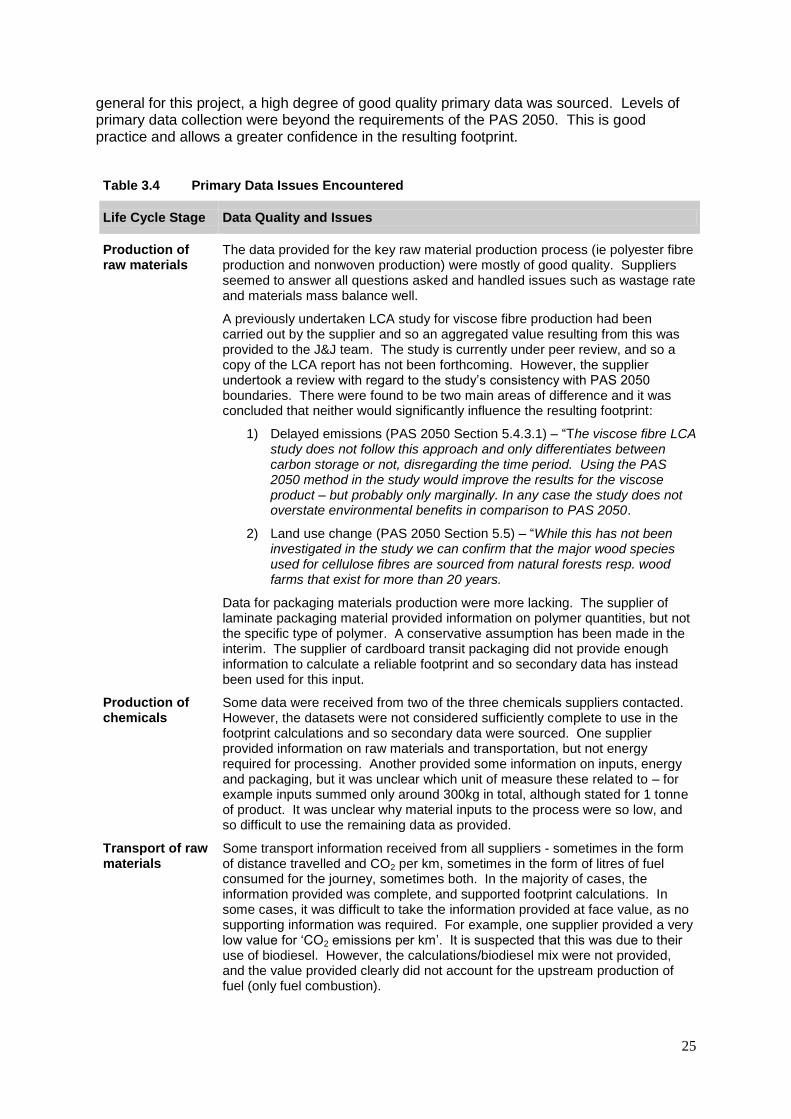
Table 3.4 Primary Data Issues Encountered
Life Cycle Stage Data Quality and Issues
Production of raw materials
The data provided for the key raw material production process (ie polyester fibre production and nonwoven production) were mostly of good quality. Suppliers seemed to answer all questions asked and handled issues such as wastage rate and materials mass balance well.
A previously undertaken LCA study for viscose fibre production had been carried out by the supplier and so an aggregated value resulting from this was provided to the J&J team. The study is currently under peer review, and so a copy of the LCA report has not been forthcoming. However, the supplier undertook a review with regard to the study‟s consistency with PAS 2050 boundaries. There were found to be two main areas of difference and it was concluded that neither would significantly influence the resulting footprint:
1) Delayed emissions (PAS 2050 Section 5.4.3.1) – “The viscose fibre LCA study does not follow this approach and only differentiates between carbon storage or not, disregarding the time period. Using the PAS 2050 method in the study would improve the results for the viscose product – but probably only marginally. In any case the study does not overstate environmental benefits in comparison to PAS 2050.
2) Land use change (PAS 2050 Section 5.5) – “While this has not been investigated in the study we can confirm that the major wood species used for cellulose fibres are sourced from natural forests resp. wood farms that exist for more than 20 years.
Data for packaging materials production were more lacking. The supplier of laminate packaging material provided information on polymer quantities, but not the specific type of polymer. A conservative assumption has been made in the interim. The supplier of cardboard transit packaging did not provide enough information to calculate a reliable footprint and so secondary data has instead been used for this input.
Production of chemicals
Some data were received from two of the three chemicals suppliers contacted. However, the datasets were not considered sufficiently complete to use in the footprint calculations and so secondary data were sourced. One supplier provided information on raw materials and transportation, but not energy required for processing. Another provided some information on inputs, energy and packaging, but it was unclear which unit of measure these related to – for example inputs summed only around 300kg in total, although stated for 1 tonne of product. It was unclear why material inputs to the process were so low, and so difficult to use the remaining data as provided.
Transport of raw materials
Some transport information received from all suppliers - sometimes in the form of distance travelled and CO2 per km, sometimes in the form of litres of fuel consumed for the journey, sometimes both. In the majority of cases, the information provided was complete, and supported footprint calculations. In some cases, it was difficult to take the information provided at face value, as no supporting information was required. For example, one supplier provided a very low value for „CO2 emissions per km‟. It is suspected that this was due to their use of biodiesel. However, the calculations/biodiesel mix were not provided, and the value provided clearly did not account for the upstream production of fuel (only fuel combustion).
26
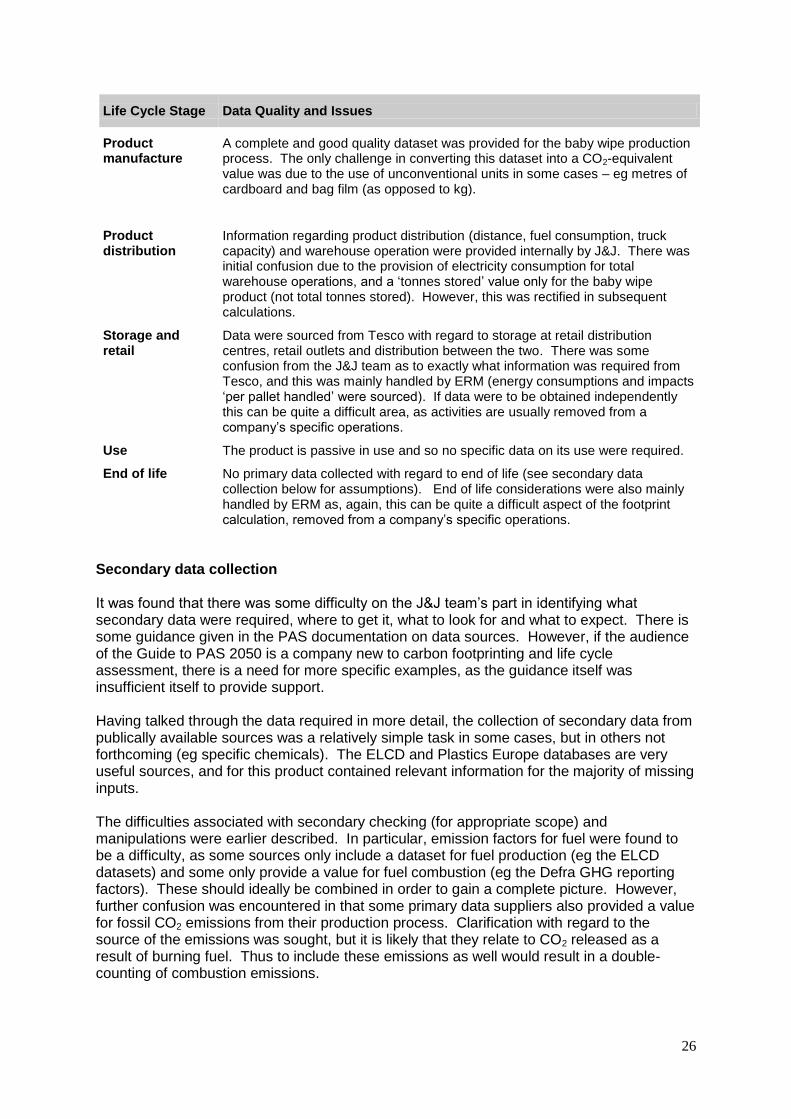
Life Cycle Stage Data Quality and Issues
Product manufacture
A complete and good quality dataset was provided for the baby wipe production process. The only challenge in converting this dataset into a CO2-equivalent value was due to the use of unconventional units in some cases – eg metres of cardboard and bag film (as opposed to kg).
Product distribution
Information regarding product distribution (distance, fuel consumption, truck capacity) and warehouse operation were provided internally by J&J. There was initial confusion due to the provision of electricity consumption for total warehouse operations, and a „tonnes stored‟ value only for the baby wipe product (not total tonnes stored). However, this was rectified in subsequent calculations.
Storage and retail
Data were sourced from Tesco with regard to storage at retail distribution centres, retail outlets and distribution between the two. There was some confusion from the J&J team as to exactly what information was required from Tesco, and this was mainly handled by ERM (energy consumptions and impacts „per pallet handled‟ were sourced). If data were to be obtained independently this can be quite a difficult area, as activities are usually removed from a company‟s specific operations.
Use The product is passive in use and so no specific data on its use were required.
End of life No primary data collected with regard to end of life (see secondary data collection below for assumptions). End of life considerations were also mainly handled by ERM as, again, this can be quite a difficult aspect of the footprint calculation, removed from a company‟s specific operations.
Secondary data collection
It was found that there was some difficulty on the J&J team‟s part in identifying what secondary data were required, where to get it, what to look for and what to expect. There is some guidance given in the PAS documentation on data sources. However, if the audience of the Guide to PAS 2050 is a company new to carbon footprinting and life cycle assessment, there is a need for more specific examples, as the guidance itself was insufficient itself to provide support. Having talked through the data required in more detail, the collection of secondary data from publically available sources was a relatively simple task in some cases, but in others not forthcoming (eg specific chemicals). The ELCD and Plastics Europe databases are very useful sources, and for this product contained relevant information for the majority of missing inputs. The difficulties associated with secondary checking (for appropriate scope) and manipulations were earlier described. In particular, emission factors for fuel were found to be a difficulty, as some sources only include a dataset for fuel production (eg the ELCD datasets) and some only provide a value for fuel combustion (eg the Defra GHG reporting factors). These should ideally be combined in order to gain a complete picture. However, further confusion was encountered in that some primary data suppliers also provided a value for fossil CO2 emissions from their production process. Clarification with regard to the source of the emissions was sought, but it is likely that they relate to CO2 released as a result of burning fuel. Thus to include these emissions as well would result in a double-counting of combustion emissions.
27
Obtaining emission factors for waste management from publically available sources is a big challenge, as no publically available data sources are PAS-compliant with regard to their handling of greenhouse emissions, predominantly from landfill. Most proprietary databases are also not PAS-compliant with regard to emissions from landfill, as weighted accounting for delayed emissions following disposal (ref Annex B) is not common practice. As such, calculations must be made from first principles, based on degradation rates over time and landfill gas capture rates etc. In this trial, it was not possible for the J&J team to obtain emission factors for biodegradable wastes sent to landfill. Instead, they were calculated by ERM, based on information from previous research projects undertaken for Defra (ERM 2006, 2007) and from the Ecoinvent project (www.ecoinvent.ch). Other waste and end-of-life related assumptions are noted as follows.
Emissions associated with non-biodegradable wastes to landfill were assumed to be zero, as no carbon will be released from this material, and processing burdens at a landfill site will be minor.
Emissions associated with incinerating wastes were assumed to be zero as the majority of incinerators in the UK and other relevant locations across Europe are likely to operate energy recovery procedures. According to the PAS (Section 8.2.3), when energy is produced from waste, any emissions are allocated to the energy produced, as opposed to the waste treated.
Emissions associated with recycling materials at the end of their life were assumed to be zero, as “the recycled portion of a product is excluded from its life cycle emissions, and included in the product that uses it as a raw material” (ref Guide to PAS page 31).
It was assumed that core input materials – polymers and viscose – were virgin materials. On this subject, the Guide to the PAS states that “for inputs with recycled material that is not part of a closed-loop recycled system, PAS 2050 requires that the emissions arising from that material is assessed using an approach consistent with BD EN ISO 14044, which factors in the recycling rate across the entire material system” (Annex D in the specification itself is not specific on approach for open-loop recycling, as is quite technical for a non-expert). The materials used in the product and primary packaging are of virgin source and there is currently no recycling of the wipe itself, and likely little recycling of the packaging film. Thus a 100% virgin scenario is a conservative, but representative one.
As noted, it was assumed that, once used, the wipe would be discarded and treated according to average UK waste management practices (http://www.defra.gov.uk/environment/statistics/wastats/). It was assumed that the plastic film packaging would be recycled at national recycling rate for plastic film, with the remainder discarded.
Given the difficulties encountered with regard to waste management, we suggest further guidance on waste treatment in the Guide to PAS, perhaps with some specific examples. The J&J team found it difficult to interpret what an emission factor for waste actually represents (eg what processes), suggesting the guidance provided is not sufficiently clear. There is also the likelihood of this life cycle stage being conceptually difficult, as waste management processes are commonly removed from a company‟s operations, and handled by a contractor.
28
Emission factors used in ERM calculations Further to inform the PAS trial, it was decided that a useful exercise would be for both J&J and ERM to calculate the product carbon footprint in parallel. The results of this exercise are discussed in Step 4. Emission factors used by ERM in undertaking the baby wipe product footprint were sourced predominantly from the Ecoinvent v2.1 database (www.ecoinvent.ch). Ecoinvent data was sourced for the following materials and processes:
electricity generation (updated to reflect the latest IEA supply mix statistics for each country in which production occurs);
fuel production – diesel, biodiesel (RME), natural gas and fuel oil, with Defra GHG conversion factors used in addition for fuel combustion;
production of polymers;
production of chemicals;
wastewater treatment; and
waste transportation (vehicle emissions).
29
Step 4 – Calculation Having completed the primary data collection exercise, the J&J team developed an Excel model of the different process steps within the baby wipe product system. The model was based on the same structure as the original data questionnaire and allowed for linkages between the different processes (eg flows from one material production process as an input to another). The model also included for activities occurring downstream of the baby wipe production process:
storage at J&J warehouse;
transport to a retailer‟s regional distribution centre (RDC);
storage at RDC;
transport to retail;
storage at retail outlet;
consumer use; and
end of life. ERM also used the same model structure, and the same primary data, to calculate the baby wipe footprint in parallel. The key difference between the J&J footprint calculations and ERM calculations were the secondary emissions factors used to translate primary activity data into greenhouse gas emissions (CO2-equivalents). ERM used predominantly secondary data from licensed life cycle inventory databases; whereas J&J used only publically available sources. A summary of the resulting differences in footprint between J&J and ERM calculations is shown in Table 3.8. A summary of the tasks undertaken and effort expended as part of this PAS step is shown in Table 3.5.
30
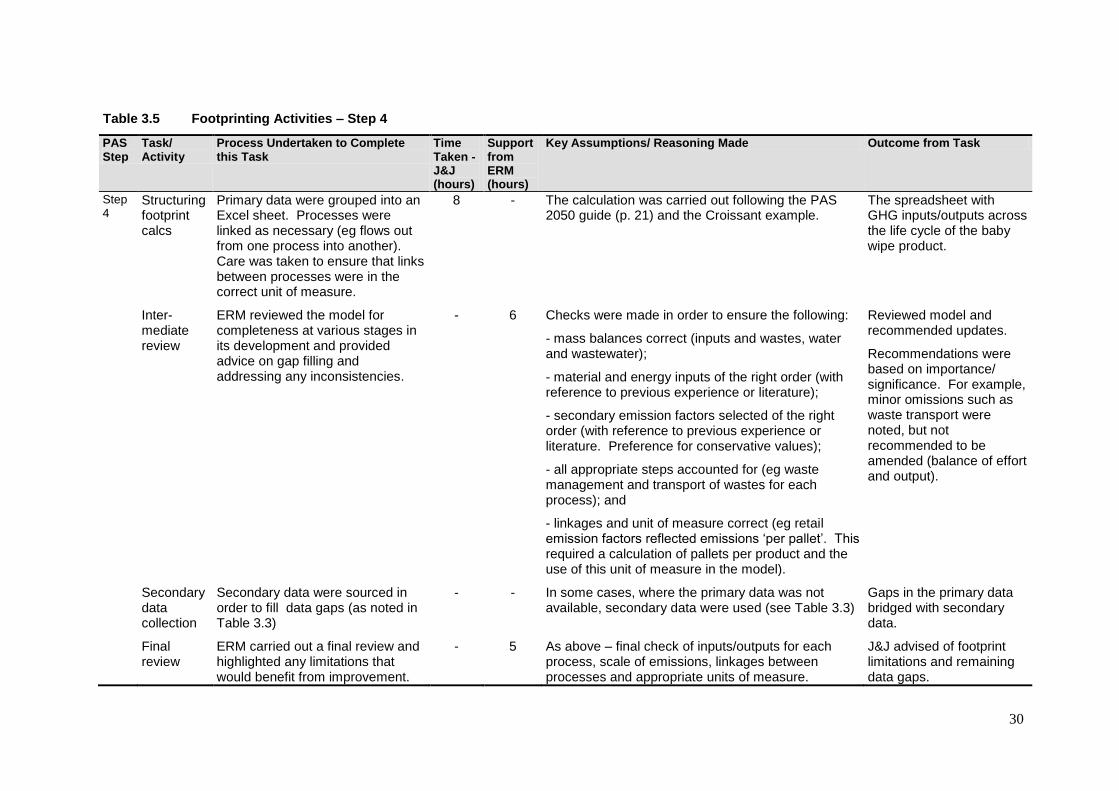
Table 3.5 Footprinting Activities – Step 4
PAS Step
Task/ Activity
Process Undertaken to Complete this Task
Time Taken - J&J (hours)
Support from ERM (hours)
Key Assumptions/ Reasoning Made Outcome from Task
Step 4
Structuring footprint calcs
Primary data were grouped into an Excel sheet. Processes were linked as necessary (eg flows out from one process into another). Care was taken to ensure that links between processes were in the correct unit of measure.
8 - The calculation was carried out following the PAS 2050 guide (p. 21) and the Croissant example.
The spreadsheet with GHG inputs/outputs across the life cycle of the baby wipe product.
Inter-mediate review
ERM reviewed the model for completeness at various stages in its development and provided advice on gap filling and addressing any inconsistencies.
- 6 Checks were made in order to ensure the following:
- mass balances correct (inputs and wastes, water and wastewater);
- material and energy inputs of the right order (with reference to previous experience or literature);
- secondary emission factors selected of the right order (with reference to previous experience or literature. Preference for conservative values);
- all appropriate steps accounted for (eg waste management and transport of wastes for each process); and
- linkages and unit of measure correct (eg retail emission factors reflected emissions „per pallet‟. This required a calculation of pallets per product and the use of this unit of measure in the model).
Reviewed model and recommended updates.
Recommendations were based on importance/ significance. For example, minor omissions such as waste transport were noted, but not recommended to be amended (balance of effort and output).
Secondary data collection
Secondary data were sourced in order to fill data gaps (as noted in Table 3.3)
-
-
In some cases, where the primary data was not available, secondary data were used (see Table 3.3)
Gaps in the primary data bridged with secondary data.
Final review
ERM carried out a final review and highlighted any limitations that would benefit from improvement.
- 5 As above – final check of inputs/outputs for each process, scale of emissions, linkages between processes and appropriate units of measure.
J&J advised of footprint limitations and remaining data gaps.
31
J&J’s experience – Step 4
Once data had been collected, and translated into the required unit of measure, the calculation itself was found to be relatively easy. The croissant example in the Guide to PAS was followed, and the guidance was found to provide clear instructions on how to structure the data and calculate the carbon footprint. J&J‟s comments were as follows: “The PAS 2050 guidance is very useful and easy to work with. Clear and very easy to adopt for other situations or products. The main area for improvement would be to be clearer in term of the unit of measurement”. The most difficult part of the calculation was to adjust the data collected to be in the right format for calculations. The calculation sheet was structured in the same way as the data questionnaire in order to aid this process. Processes were linked such that the footprint result for a tonne of raw material production (eg non-woven production) was linked directly as an input to the next process in the chain (eg baby wipe production). Care was taken to ensure that links between processes were in the correct unit of measure (eg input of nonwoven to baby wipe production in kg rather than tonnes, to match information provided by the supplier). Support from ERM was used to verify the calculations undertaken, for peace of mind. However, it was not felt that external assistance, or any other guidance, was required for this step. This step was also found to be a helpful one in showing the relative contribution of each life cycle stage to the baby wipe footprint, and to see how they fit together.
ERM’s experience – Step 4
The J&J team undertook the baby wipe footprint calculations very well and understood the principles behind the multiplication of activity data and emission factors, and the flows between process stages. The Excel model developed was simple, but effective and very transparent. The main difficulty throughout the Step, and following on from Step 3, was around data verification, recognising where data points were anomalous and making assumptions to fill data gaps. Specific difficulties encountered, by life cycle stage and by technical issue are outlined in Table 3.6 and Table 3.7.
Also, as earlier noted, the final footprint was not scaled up to account for exclusions that had been made (Section 9), as this is only documented in the specification, not in the Guide to PAS 2050.
32
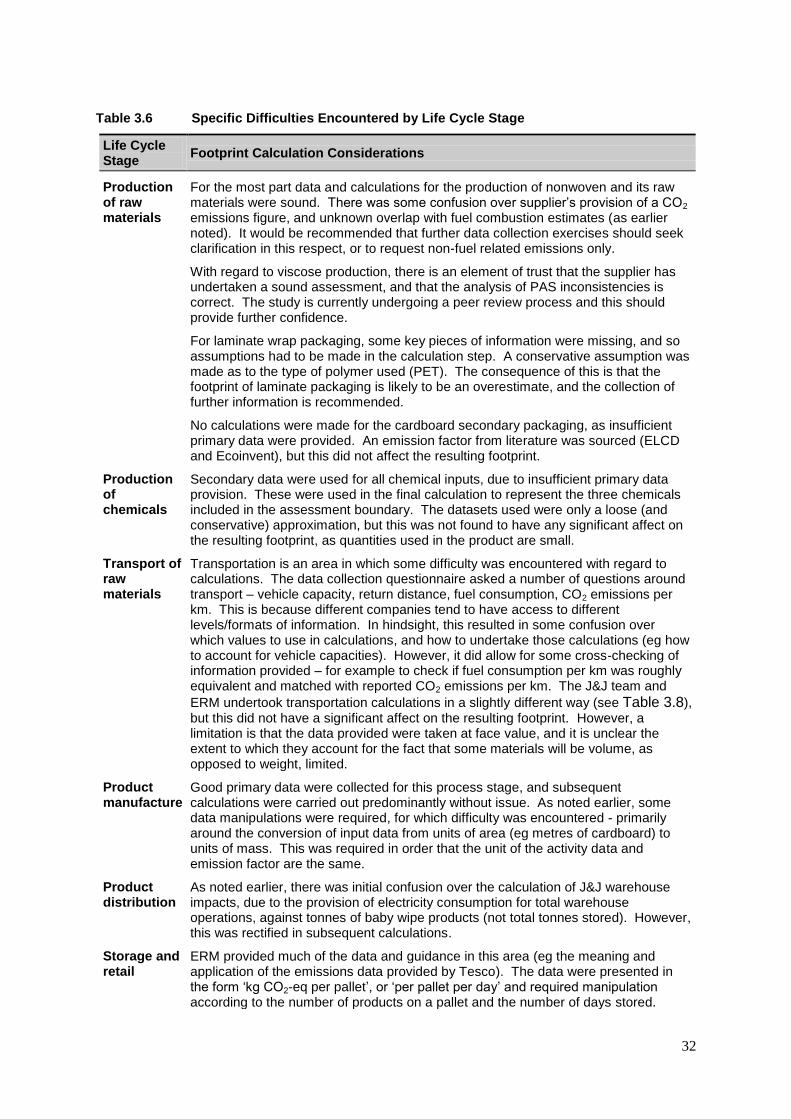
Table 3.6 Specific Difficulties Encountered by Life Cycle Stage
Life Cycle Stage
Footprint Calculation Considerations
Production of raw materials
For the most part data and calculations for the production of nonwoven and its raw materials were sound. There was some confusion over supplier‟s provision of a CO2 emissions figure, and unknown overlap with fuel combustion estimates (as earlier noted). It would be recommended that further data collection exercises should seek clarification in this respect, or to request non-fuel related emissions only.
With regard to viscose production, there is an element of trust that the supplier has undertaken a sound assessment, and that the analysis of PAS inconsistencies is correct. The study is currently undergoing a peer review process and this should provide further confidence.
For laminate wrap packaging, some key pieces of information were missing, and so assumptions had to be made in the calculation step. A conservative assumption was made as to the type of polymer used (PET). The consequence of this is that the footprint of laminate packaging is likely to be an overestimate, and the collection of further information is recommended.
No calculations were made for the cardboard secondary packaging, as insufficient primary data were provided. An emission factor from literature was sourced (ELCD and Ecoinvent), but this did not affect the resulting footprint.
Production of chemicals
Secondary data were used for all chemical inputs, due to insufficient primary data provision. These were used in the final calculation to represent the three chemicals included in the assessment boundary. The datasets used were only a loose (and conservative) approximation, but this was not found to have any significant affect on the resulting footprint, as quantities used in the product are small.
Transport of raw materials
Transportation is an area in which some difficulty was encountered with regard to calculations. The data collection questionnaire asked a number of questions around transport – vehicle capacity, return distance, fuel consumption, CO2 emissions per km. This is because different companies tend to have access to different levels/formats of information. In hindsight, this resulted in some confusion over which values to use in calculations, and how to undertake those calculations (eg how to account for vehicle capacities). However, it did allow for some cross-checking of information provided – for example to check if fuel consumption per km was roughly equivalent and matched with reported CO2 emissions per km. The J&J team and
ERM undertook transportation calculations in a slightly different way (see Table 3.8), but this did not have a significant affect on the resulting footprint. However, a limitation is that the data provided were taken at face value, and it is unclear the extent to which they account for the fact that some materials will be volume, as opposed to weight, limited.
Product manufacture
Good primary data were collected for this process stage, and subsequent calculations were carried out predominantly without issue. As noted earlier, some data manipulations were required, for which difficulty was encountered - primarily around the conversion of input data from units of area (eg metres of cardboard) to units of mass. This was required in order that the unit of the activity data and emission factor are the same.
Product distribution
As noted earlier, there was initial confusion over the calculation of J&J warehouse impacts, due to the provision of electricity consumption for total warehouse operations, against tonnes of baby wipe products (not total tonnes stored). However, this was rectified in subsequent calculations.
Storage and retail
ERM provided much of the data and guidance in this area (eg the meaning and application of the emissions data provided by Tesco). The data were presented in the form „kg CO2-eq per pallet‟, or „per pallet per day‟ and required manipulation according to the number of products on a pallet and the number of days stored.
33
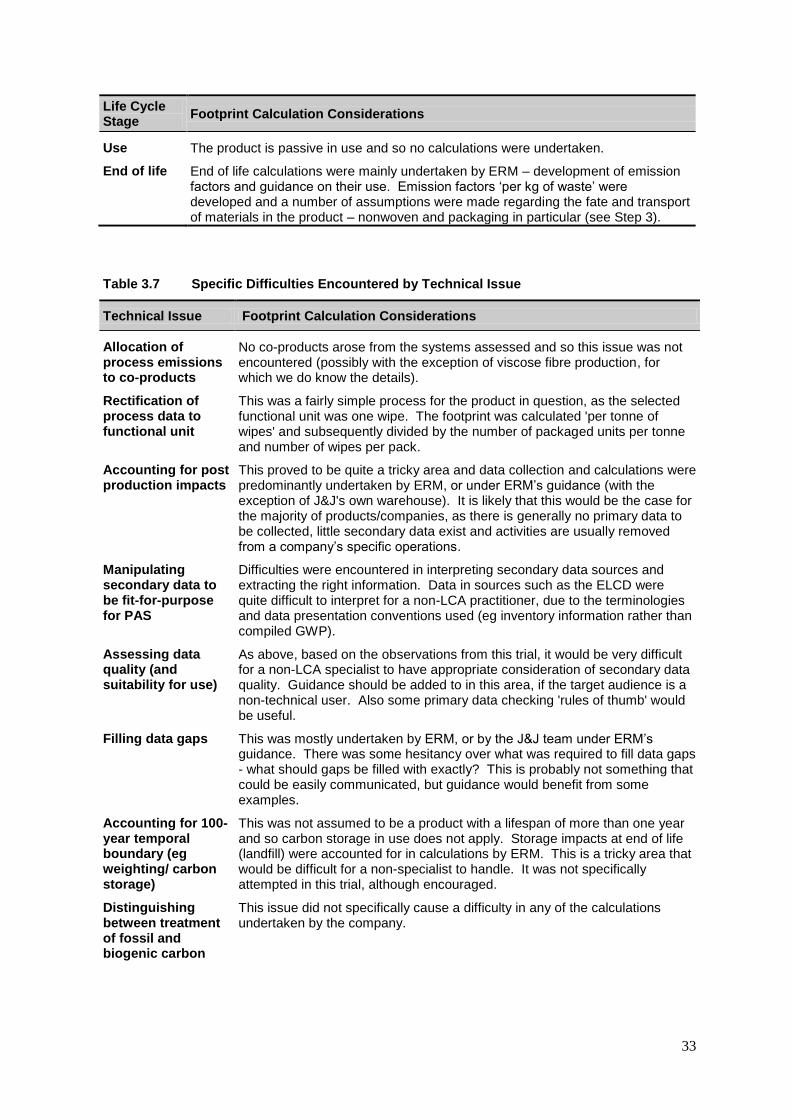
Life Cycle Stage
Footprint Calculation Considerations
Use The product is passive in use and so no calculations were undertaken.
End of life End of life calculations were mainly undertaken by ERM – development of emission factors and guidance on their use. Emission factors „per kg of waste‟ were developed and a number of assumptions were made regarding the fate and transport of materials in the product – nonwoven and packaging in particular (see Step 3).
Table 3.7 Specific Difficulties Encountered by Technical Issue
Technical Issue Footprint Calculation Considerations
Allocation of process emissions to co-products
No co-products arose from the systems assessed and so this issue was not encountered (possibly with the exception of viscose fibre production, for which we do know the details).
Rectification of process data to functional unit
This was a fairly simple process for the product in question, as the selected functional unit was one wipe. The footprint was calculated 'per tonne of wipes' and subsequently divided by the number of packaged units per tonne and number of wipes per pack.
Accounting for post production impacts
This proved to be quite a tricky area and data collection and calculations were predominantly undertaken by ERM, or under ERM‟s guidance (with the exception of J&J's own warehouse). It is likely that this would be the case for the majority of products/companies, as there is generally no primary data to be collected, little secondary data exist and activities are usually removed from a company‟s specific operations.
Manipulating secondary data to be fit-for-purpose for PAS
Difficulties were encountered in interpreting secondary data sources and extracting the right information. Data in sources such as the ELCD were quite difficult to interpret for a non-LCA practitioner, due to the terminologies and data presentation conventions used (eg inventory information rather than compiled GWP).
Assessing data quality (and suitability for use)
As above, based on the observations from this trial, it would be very difficult for a non-LCA specialist to have appropriate consideration of secondary data quality. Guidance should be added to in this area, if the target audience is a non-technical user. Also some primary data checking 'rules of thumb' would be useful.
Filling data gaps This was mostly undertaken by ERM, or by the J&J team under ERM‟s guidance. There was some hesitancy over what was required to fill data gaps - what should gaps be filled with exactly? This is probably not something that could be easily communicated, but guidance would benefit from some examples.
Accounting for 100-year temporal boundary (eg weighting/ carbon storage)
This was not assumed to be a product with a lifespan of more than one year and so carbon storage in use does not apply. Storage impacts at end of life (landfill) were accounted for in calculations by ERM. This is a tricky area that would be difficult for a non-specialist to handle. It was not specifically attempted in this trial, although encouraged.
Distinguishing between treatment of fossil and biogenic carbon
This issue did not specifically cause a difficulty in any of the calculations undertaken by the company.
34
Technical Issue Footprint Calculation Considerations
Handling of non-CO2 GHG emissions
This was predominantly handled by ERM when calculating landfill emissions. However, the J&J team were also aware of, and accurately quantified, a range of non-CO2 flows when interrogating secondary data that were provided in inventory format (eg ELCD datasets).
Double-counting of emissions?
This did present an issue on a number of occasions, predominantly in relation to fuel combustion. The questionnaire given to suppliers asked for a record of air emissions (including CO2). In the majority of cases, fossil CO2 emissions were recorded, but it was unclear if they were related to fuel combustion, or other processes. Given the nature of the processes in question, it was assumed that they were fuel-related (although quantities did not always match up with reported amounts of fuel consumed). A number of secondary emission factors for fuel are combustion-related (eg the Defra GHG reporting factors) and so the use of these together with reported emissions would introduce an element of double-counting. In fact, this was discussed early on, and so no double counting occurred (rather there were incidences of under-reporting where a company had reported only fuel and not CO2 emissions but fuel combustion emissions were still not counted). To solve the issue, it would have been preferable to ask for non-fuel related air emissions only.
Accounting for land use change
This was not a significant issue for the majority of processes assessed. The exceptions would have been forestry for viscose and cardboard production. However, recycled cardboard materials were reported and viscose was reported to be sourced from forestry systems in existence for more than 20 years.
Accounting for variable supply chains or markets
This was not considered for the product in question, as one major route to market was considered - retail through Tesco stores - and only the UK market. This was an agreed scope at the outset and is not considered to be an important variable for this type of product (typically produced in the country of consumption).
Accounting for onsite generation of electricity
No on-site electricity was generated within the systems assessed (possibly with the exception of viscose fibre production, for which we do know details).
Emissions scaling The PAS requires the final footprint to be scaled to account for any minor raw materials or activities that were excluded from the analysis. However, this was noted only in the specification (no reference found in the Guide to PAS). As such, this step was not undertaken. It is also likely to be a fiddly task if small exclusions are made in numerous process steps, but their combined significance cannot be determined. The PAS does not clearly state how this should be achieved, only that “GHG emissions shall then be scaled to account for any minor raw materials or activities that were excluded from the analysis by dividing the estimated emissions by the proportion of emissions calculated for the anticipated life cycle GHG emissions” (PAS 2050, Sect. 9).
Difference between J&J and ERM footprints calculated in parallel
Early on in the data collection and calculation process it became apparent that different secondary data sources were available to J&J and to ERM. ERM subscribes to a number of licensed life cycle inventory databases, but J&J were reliant on publically available data. It was decided that a useful exercise would be for J&J and ERM to calculate the product carbon footprint in parallel, to investigate the importance of differences in secondary data
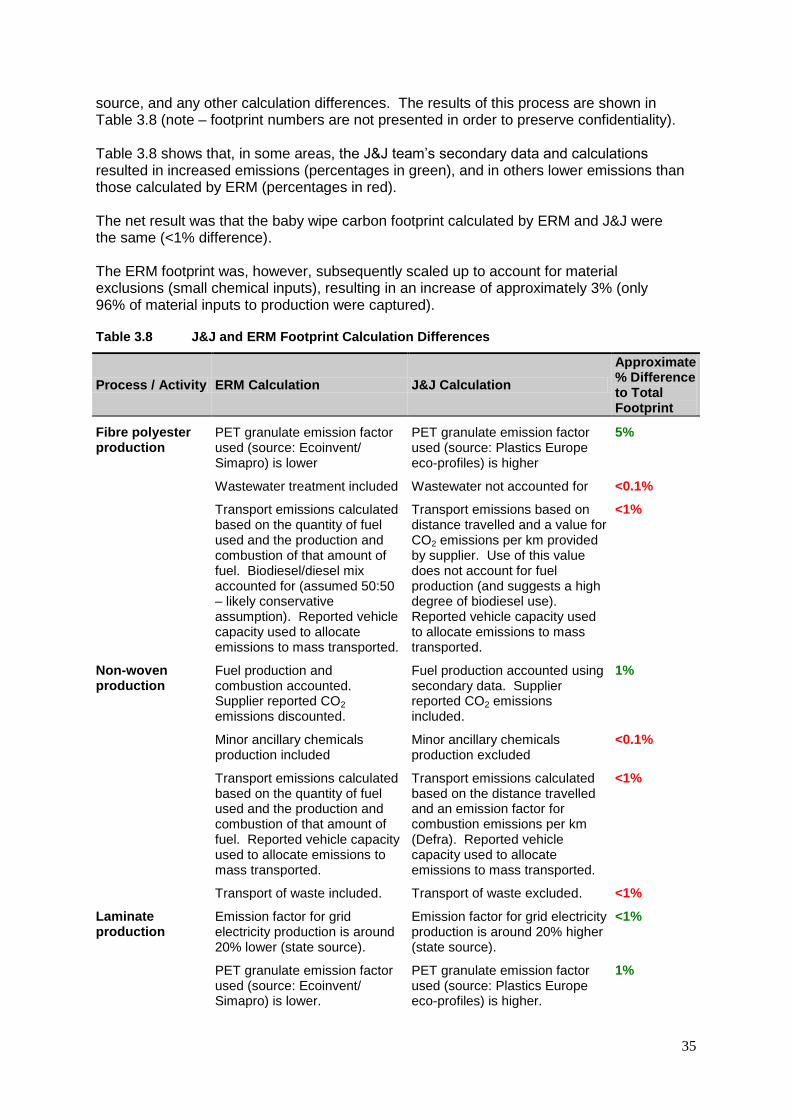
35
source, and any other calculation differences. The results of this process are shown in Table 3.8 (note – footprint numbers are not presented in order to preserve confidentiality).
Table 3.8 shows that, in some areas, the J&J team‟s secondary data and calculations resulted in increased emissions (percentages in green), and in others lower emissions than those calculated by ERM (percentages in red). The net result was that the baby wipe carbon footprint calculated by ERM and J&J were the same (<1% difference). The ERM footprint was, however, subsequently scaled up to account for material exclusions (small chemical inputs), resulting in an increase of approximately 3% (only 96% of material inputs to production were captured).
Table 3.8 J&J and ERM Footprint Calculation Differences
Process / Activity ERM Calculation J&J Calculation
Approximate % Difference to Total Footprint
Fibre polyester production
PET granulate emission factor used (source: Ecoinvent/ Simapro) is lower
PET granulate emission factor used (source: Plastics Europe eco-profiles) is higher
5%
Wastewater treatment included Wastewater not accounted for <0.1%
Transport emissions calculated based on the quantity of fuel used and the production and combustion of that amount of fuel. Biodiesel/diesel mix accounted for (assumed 50:50 – likely conservative assumption). Reported vehicle capacity used to allocate emissions to mass transported.
Transport emissions based on distance travelled and a value for CO2 emissions per km provided by supplier. Use of this value does not account for fuel production (and suggests a high degree of biodiesel use). Reported vehicle capacity used to allocate emissions to mass transported.
<1%
Non-woven production
Fuel production and combustion accounted. Supplier reported CO2 emissions discounted.
Fuel production accounted using secondary data. Supplier reported CO2 emissions included.
1%
Minor ancillary chemicals production included
Minor ancillary chemicals production excluded
<0.1%
Transport emissions calculated based on the quantity of fuel used and the production and combustion of that amount of fuel. Reported vehicle capacity used to allocate emissions to mass transported.
Transport emissions calculated based on the distance travelled and an emission factor for combustion emissions per km (Defra). Reported vehicle capacity used to allocate emissions to mass transported.
<1%
Transport of waste included. Transport of waste excluded. <1%
Laminate production
Emission factor for grid electricity production is around 20% lower (state source).
Emission factor for grid electricity production is around 20% higher (state source).
<1%
PET granulate emission factor used (source: Ecoinvent/ Simapro) is lower.
PET granulate emission factor used (source: Plastics Europe eco-profiles) is higher.
1%
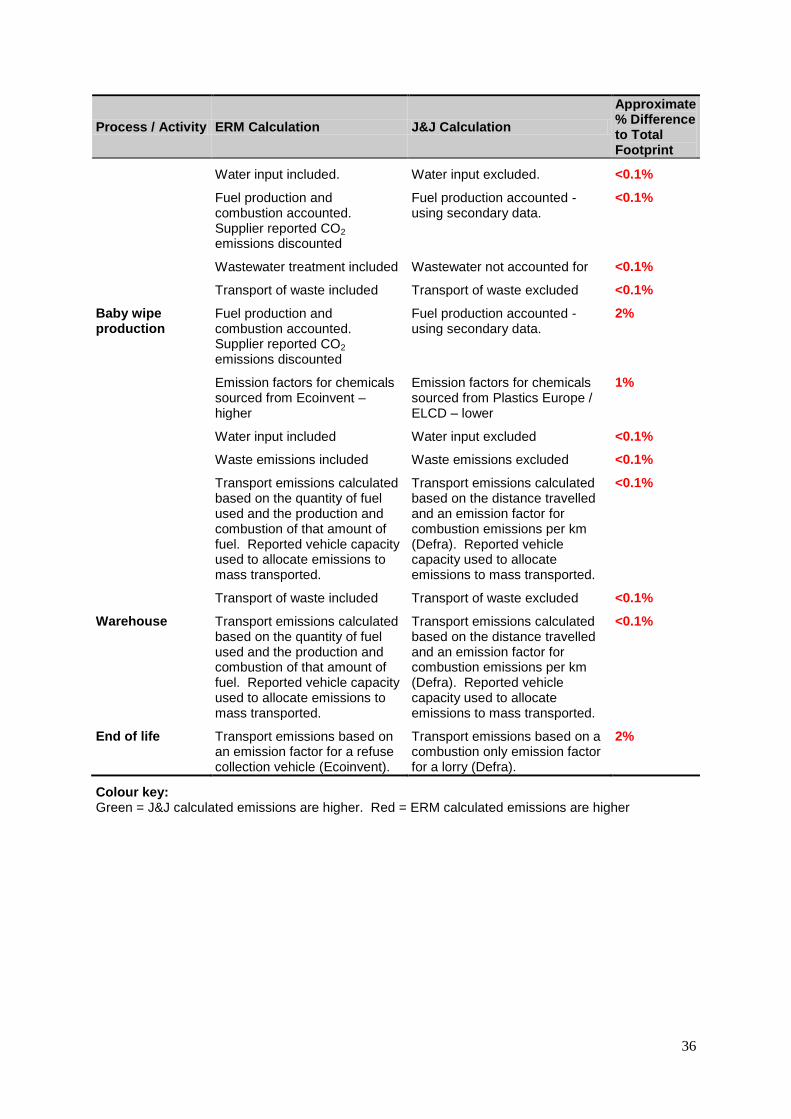
36
Process / Activity ERM Calculation J&J Calculation
Approximate % Difference to Total Footprint
Water input included. Water input excluded. <0.1%
Fuel production and combustion accounted. Supplier reported CO2 emissions discounted
Fuel production accounted - using secondary data.
<0.1%
Wastewater treatment included Wastewater not accounted for <0.1%
Transport of waste included Transport of waste excluded <0.1%
Baby wipe production
Fuel production and combustion accounted. Supplier reported CO2 emissions discounted
Fuel production accounted - using secondary data.
2%
Emission factors for chemicals sourced from Ecoinvent – higher
Emission factors for chemicals sourced from Plastics Europe / ELCD – lower
1%
Water input included Water input excluded <0.1%
Waste emissions included Waste emissions excluded <0.1%
Transport emissions calculated based on the quantity of fuel used and the production and combustion of that amount of fuel. Reported vehicle capacity used to allocate emissions to mass transported.
Transport emissions calculated based on the distance travelled and an emission factor for combustion emissions per km (Defra). Reported vehicle capacity used to allocate emissions to mass transported.
<0.1%
Transport of waste included Transport of waste excluded <0.1%
Warehouse Transport emissions calculated based on the quantity of fuel used and the production and combustion of that amount of fuel. Reported vehicle capacity used to allocate emissions to mass transported.
Transport emissions calculated based on the distance travelled and an emission factor for combustion emissions per km (Defra). Reported vehicle capacity used to allocate emissions to mass transported.
<0.1%
End of life Transport emissions based on an emission factor for a refuse collection vehicle (Ecoinvent).
Transport emissions based on a combustion only emission factor for a lorry (Defra).
2%
Colour key: Green = J&J calculated emissions are higher. Red = ERM calculated emissions are higher
37
Step 5 – Uncertainty The uncertainty analysis step is an optional one and was not carried out in this trial. A significant proportion of primary data were collected and so it was considered that there would be a relatively high degree of confidence in the resulting footprint. The parallel calculations undertaken by ERM also served as a form of sensitivity analysis. The baby wipe footprint calculated by J&J was marginally higher, and so was considered a conservative, but representative, estimate of life cycle impacts. There is always uncertainty around a footprint calculation, and so the resulting number is never precise. The values calculated by ERM and J&J were closely aligned. However, the fact that J&J and ERM's analyses yielded similar results is likely to be through commonalities in the primary and secondary data used. These data are themselves uncertain, and only a representation of actual activities in the product life cycle. The J&J team considered, on reflection, that an uncertainty analysis step would be necessary to determine the accuracy of the footprint number in order to make comparisons between products. "In order to compare products it is necessary to know the confidence interval of the data being compared. For example, 100g CO2e is not different from 85g CO2e if the individual carbon footprint is only accurate within +/-20%". It is J&J's feeling, therefore, that consideration should be given to making uncertainty analysis a mandatory component of any calculation".
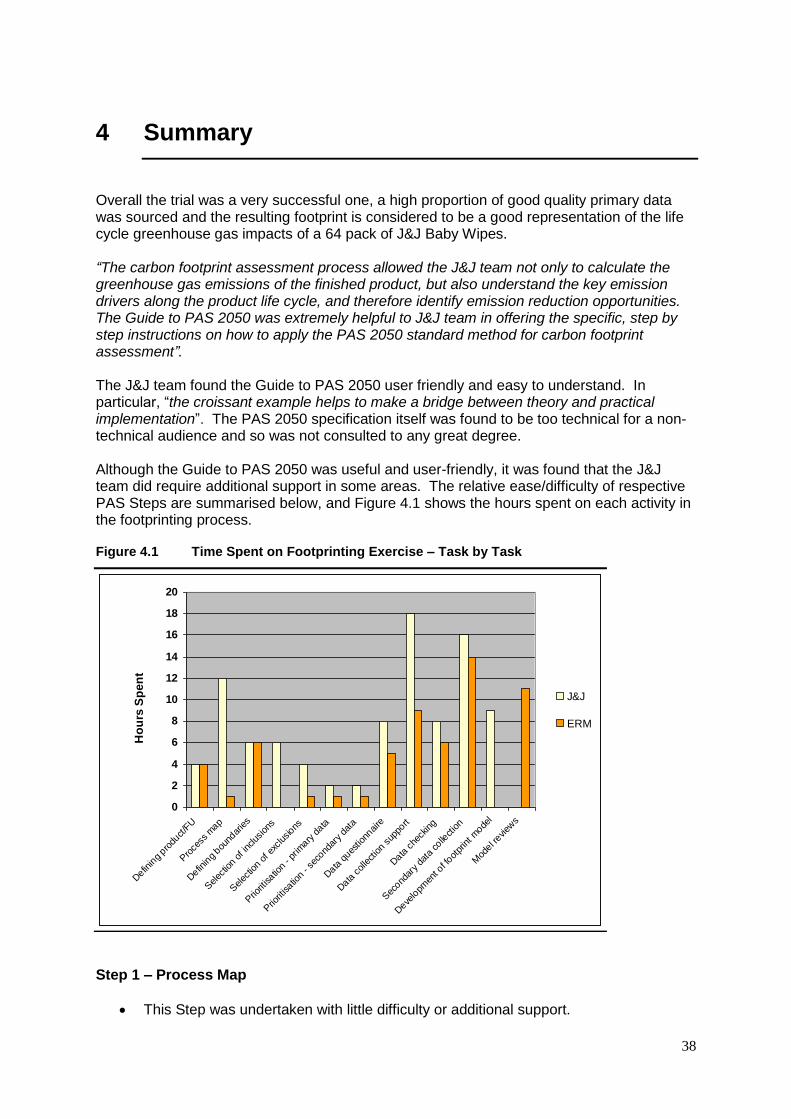
38
4 Summary
Overall the trial was a very successful one, a high proportion of good quality primary data was sourced and the resulting footprint is considered to be a good representation of the life cycle greenhouse gas impacts of a 64 pack of J&J Baby Wipes.
“The carbon footprint assessment process allowed the J&J team not only to calculate the greenhouse gas emissions of the finished product, but also understand the key emission drivers along the product life cycle, and therefore identify emission reduction opportunities. The Guide to PAS 2050 was extremely helpful to J&J team in offering the specific, step by step instructions on how to apply the PAS 2050 standard method for carbon footprint assessment”.
The J&J team found the Guide to PAS 2050 user friendly and easy to understand. In particular, “the croissant example helps to make a bridge between theory and practical implementation”. The PAS 2050 specification itself was found to be too technical for a non-technical audience and so was not consulted to any great degree. Although the Guide to PAS 2050 was useful and user-friendly, it was found that the J&J team did require additional support in some areas. The relative ease/difficulty of respective PAS Steps are summarised below, and Figure 4.1 shows the hours spent on each activity in the footprinting process.
Figure 4.1 Time Spent on Footprinting Exercise – Task by Task
Step 1 – Process Map
This Step was undertaken with little difficulty or additional support.
0
2
4
6
8
10
12
14
16
18
20
Defin
ing pro
duct/F
U
Pro
cess
map
Defin
ing bou
ndar
ies
Selec
tion o
f inc
lusion
s
Selec
tion o
f exc
lusions
Prio
ritisatio
n - pr
imary
data
Prio
ritisatio
n - se
cond
ary da
ta
Data
ques
tionn
aire
Data
collection
supp
ort
Data
che
cking
Sec
ondar
y da
ta colle
ction
Deve
lopm
ent o
f foot
print m
odel
Mod
el revi
ews
Ho
urs
Sp
en
t
J&J
ERM
39
The Guide to PAS 2050 was a useful support tool and the only source consulted.
It was additionally felt that a „Building a Process Map‟ software, or internet-based, tool could have been very helpful.
Step 2 – Boundaries and Prioritisation
The most challenging part of this Step was the identification of „immaterial‟ emission sources, and thereby deciding on inclusions and exclusions. The assistance of an external expert was needed in this case.
It was J&J‟s consideration that, in all likelihood, they couldn‟t have undertaken this step without external help, using the PAS guidance documents alone.
Step 3 – Data Collection
The PAS guidance document was a useful tool to understand the process of collecting data from suppliers, but the real complexity in this task was around was with regard to developing the data collection questionnaire; asking the right questions and in the right format.
Support from ERM was required in order to formulate a data questionnaire for suppliers.
The J&J team felt that the publically available sources of the secondary data available to them were too technical for a first time user. It may have been possible to undertake the secondary data-sourcing task without external support, but this would have required much more time and resources, and data quality might have been compromised.
Step 4 - Calculation
Once data had been collected, and translated into the required unit of measure, the calculation itself was found to be relatively easy. The unit of measure is the key difficulty here.
The croissant example in the Guide to PAS was followed, and the guidance was found to provide clear instructions on how to structure the data and calculate the carbon footprint.
Support from ERM was used to verify the calculations undertaken, for peace of mind, but it was not felt that external assistance, or any other guidance, was required for this Step.
The main difficulty throughout the Step, and following on from Step 3, was around data verification, recognising where data points were anomalous and making assumptions to fill data gaps. This is something that comes from experience, and so could be difficult to prescribe in any guidance materials.
Footprint Limitations
Specific limitations of the footprint calculated for the baby wipe product, linked to technical or data collection difficulties, were as follows.
There was some confusion over supplier‟s provision of a CO2 emissions figure, and unknown overlap with fuel combustion estimates. It would be recommended that
40
further data collection exercises should seek clarification in this respect, or to request non-fuel related emissions only.
For laminate wrap packaging, some key pieces of information were missing, and so assumptions had to be made in the calculation step. A conservative assumption was made as to the type of polymer. The collection of further information is recommended.
No calculations were made for the cardboard secondary packaging, as insufficient primary data were provided. An emission factor from literature was sourced.
Secondary data were used for all chemical inputs, due to insufficient primary data provision.
Conversion of input data from units of area (eg metres of cardboard) to units of mass was found to be tricky and is unresolved in parts (although not affecting the footprint result). This was required in order that the unit of the activity data and emission factor are the same.
The PAS specification requires the final footprint to be scaled to account for any minor raw materials or activities that were excluded from the analysis. However, this was not noted in the Guide to PAS and so this step was not undertaken.
General Difficulties Encountered
Some more general difficulties encountered, and those likely to be common for many companies or product sectors, are as follows.
Interpreting secondary data sources and extracting the right information was very difficult. Data in sources such as the ELCD were quite tricky to interpret for a non-LCA practitioner; due to the terminologies and data presentation conventions used (eg inventory information rather than an aggregated CO2-equivalent figure).
As above, based on the observations from this trial, it would be very difficult for a non-LCA specialist to have appropriate consideration of secondary, or primary, data quality.
The filling of data gaps was mostly undertaken by ERM, or by the J&J team under ERM‟s guidance. There was some hesitancy over what was required to fill data gaps - what should gaps be filled with exactly?
Double-counting presented an issue on a number of occasions, predominantly in relation to fuel combustion. The questionnaire given to suppliers asked for a record of air emissions (including CO2). In the majority of cases, fossil CO2 emissions were recorded, but it was unclear if they were related to fuel combustion, or other processes. Given the nature of the processes in question, it was assumed that they were fuel-related (although quantities did not always match up with reported amounts of fuel consumed).
A number of secondary emission factors for fuel are combustion-related (eg the Defra GHG reporting factors) and so the use of these together with reported emissions would introduce an element of double-counting. In fact, this was discussed early on, and so no double-counting occurred (rather there were incidences of under-reporting where a company had reported only fuel and not CO2 emissions but fuel combustion emissions were still not counted). To solve the issue, it would have been preferable to ask for non-fuel related air emissions only.
41
Transportation is an area in which some difficulty was encountered with regard to calculations. The J&J team and ERM undertook transportation calculations in a slightly different way, but this did not have a significant affect on the resulting footprint. However, a limitation is that the data provided were taken at face value, and it is unclear the extent to which they account for the fact that some materials will be volume, as opposed to weight, limited 1. This is likely to be a common difficulty, as calculations around volume limitation for transport vehicles can be quite complex and require the collection of lots of information. For example, the volume capacity of each vehicle used is required (as opposed to weight, which tends to be a more commonly reported); and density of the materials transported is needed.
Post-production impacts proved to be quite a tricky area and data collection and calculations were predominantly undertaken by ERM, or under ERM‟s guidance (with the exception of J&J's own warehouse). It is likely that this would be the case for the majority of products/companies, as there are generally no primary data to be collected, little secondary data exist and activities are usually removed from a company‟s specific operations. This makes it difficult to firstly understand/visualise the data that are required; and secondly to collect specific data where supply chain relationships might not be in place.
Obtaining emission factors for waste management from publically available sources was a big challenge, as no publically available data sources are PAS-compliant (they typically don‟t account for delayed emissions, or include carbon storage benefits post 100 years). Most proprietary databases are also not PAS-compliant with regard to emissions from landfill, as weighted accounting for delayed emissions following disposal (ref Annex B) is not common practice. As such, calculations must be made from first principles, based on degradation rates over time and landfill gas capture rates etc. In this trial, it was not possible for the J&J team to obtain emission factors for biodegradable wastes sent to landfill. Instead they were calculated by ERM based on information from previous research projects undertaken for Defra (ERM 2007, 2008) and from the Ecoinvent database. Furthermore, The J&J team found it difficult to interpret what an emission factor for waste actually represents (eg what processes), suggesting the guidance provided is not sufficiently clear.
Difference between J&J and ERM footprints calculated in parallel
When comparing baby wipe carbon footprints calculated by J&J and ERM in parallel it was found that in some areas the J&J team‟s secondary data and calculations resulted in increased emissions, and in others lower emissions. The net result was that the baby wipe carbon footprint calculated by ERM and J&J were the same (<1% difference). The ERM footprint was, however, subsequently scaled up to account for material exclusions (small chemical inputs), resulting in an increase of approximately 3% (only 96% of material inputs to production were captured). The reason for this close alignment is likely to be due to the high degree of primary data sourced by J&J (and also used by ERM). Importantly, these primary data were sourced for key contributors to the footprint, such as viscose and non-woven production.
(1) Vehicle emissions are typically shared equally across the mass of goods transported. For example, if a truck carries a 10 tonne load, each
tonne of material transported will be allocated one tenth of the emissions from the journey. The PAS requires that account is taken where
materials are less dense/have greater volume, and so take up a greater proportion of the vehicle‟s capacity than allocated (if using only its mass).
42
This finding is not necessarily transferable to other product system, but shows that for the baby wipe supply chain secondary data choices were not a significant influence on the outcome, giving further confidence in the calculated footprint.
Areas for Potential Improvement in Guidance
Based on the observations from this trial, suggested improvements/ extensions to the PAS 2050 Guide would be in the following areas.
Further guidance on data collection questionnaires, and a more detailed example questionnaire, or questionnaires, would be a welcome addition to the PAS documentation package. There is currently one example in the Guide to PAS, but this does not quite go far enough to generate a dataset that is complete and useful in a footprint. For example, in the example given, the type of wheat/source country would be ideally needed to inform the appropriate selection of a secondary emission factor, how far it is imported to mill could be important, the economic value of co-products would be needed for an economic allocation of process burdens, the fate/management of waste materials should ideally be included, etc.
Secondary data collection. If the audience of the Guide to PAS 2050 is a company new to carbon footprinting, there is a need for more specific guidance/examples in the interpretation and handling of secondary data sources, as the guidance itself was insufficient itself to provide support.
Likewise, some specific examples of where data gaps can exist, and how to fill them, and data-checking „rules of thumb‟ would be useful if the Guide is intended as use as a standalone support document (for a non-technical user).
The Guide would benefit from being extended with regard to the following specific areas, perhaps to include specific data sources, example calculations and common problems encountered:
o transport;
o storage and retail; and
o waste management.
The PAS 2050 specification itself was found to be too technical for a non-technical audience and so was not consulted to any great degree in this trial. This suggests that it is important that all key information is contained within the Guide to PAS 2050, rather than providing a referral to the specification. An example is the requirement to scale up the final footprint to account for exclusions - and how this can be achieved.
43
5 References
BSI (2008). PAS 2050:2008. Specification for the Assessment of the Life Cycle Greenhouse Gas Emissions of Goods and Services. BSI, London. BSI (2008). Guide to PAS 2050. How to Assess the Carbon Footprint of Goods and Services. BSI, London. Defra (2008) GHG reporting factors - http://www.defra.gov.uk/environment/business/reporting/pdf/ghg-cf-guidelines-annexes2008.pdf Defra (2009) municipal waste statistics - http://www.defra.gov.uk/environment/statistics/wastats/ Eco-profiles of the European Plastics Industry - http://lca.plasticseurope.org/index.htm Ecoinvent database v2.1 - www.ecoinvent.ch ERM (2006). Impact of Energy from Waste and Recycling Policy on UK Greenhouse Gas Emissions. Report for Defra, London. ERM (2007). Carbon Balances and Energy Impacts and Benefits of the Management of UK Wastes. Report for Defra, London. European reference Life Cycle Database (ELCD) - http://lca.jrc.ec.europa.eu/lcainfohub
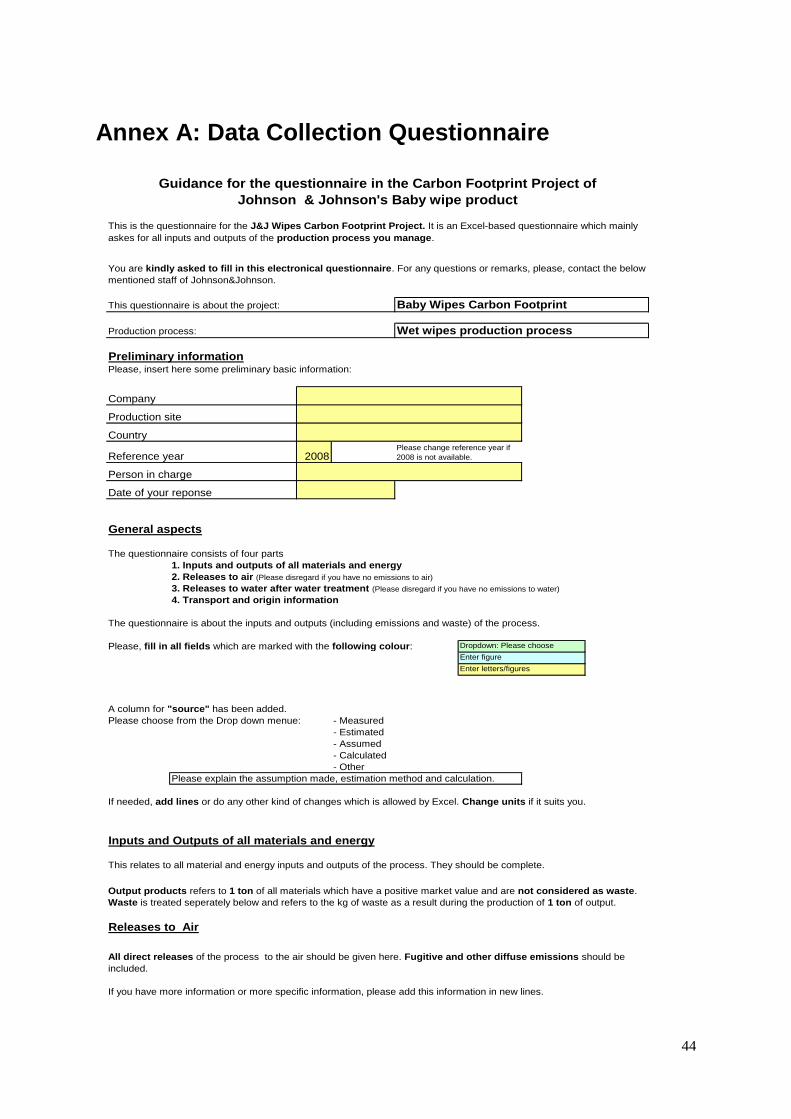
44
Annex A: Data Collection Questionnaire
Production process:
Please, insert here some preliminary basic information:
2008
Please, fill in all fields which are marked with the following colour:
- Measured
- Estimated
- Assumed
- Calculated
- Other
Company
Production site
Country
This is the questionnaire for the J&J Wipes Carbon Footprint Project. It is an Excel-based questionnaire which mainly
askes for all inputs and outputs of the production process you manage.
You are kindly asked to fill in this electronical questionnaire. For any questions or remarks, please, contact the below
mentioned staff of Johnson&Johnson.
This questionnaire is about the project: Baby Wipes Carbon Footprint
Inputs and Outputs of all materials and energy
All direct releases of the process to the air should be given here. Fugitive and other diffuse emissions should be
included.
Releases to Air
General aspects
The questionnaire consists of four parts
The questionnaire is about the inputs and outputs (including emissions and waste) of the process.
Please explain the assumption made, estimation method and calculation.
If needed, add lines or do any other kind of changes which is allowed by Excel. Change units if it suits you.
Guidance for the questionnaire in the Carbon Footprint Project of
Johnson & Johnson's Baby wipe product
Dropdown: Please choose
Enter figure
Enter letters/figures
Please change reference year if
2008 is not available.
Wet wipes production process
Preliminary information
This relates to all material and energy inputs and outputs of the process. They should be complete.
Output products refers to 1 ton of all materials which have a positive market value and are not considered as waste.
Waste is treated seperately below and refers to the kg of waste as a result during the production of 1 ton of output.
If you have more information or more specific information, please add this information in new lines.
Reference year
Person in charge
Date of your reponse
A column for "source" has been added.
Please choose from the Drop down menue:
1. Inputs and outputs of all materials and energy
2. Releases to air (Please disregard if you have no emissions to air)
3. Releases to water after water treatment (Please disregard if you have no emissions to water)
4. Transport and origin information
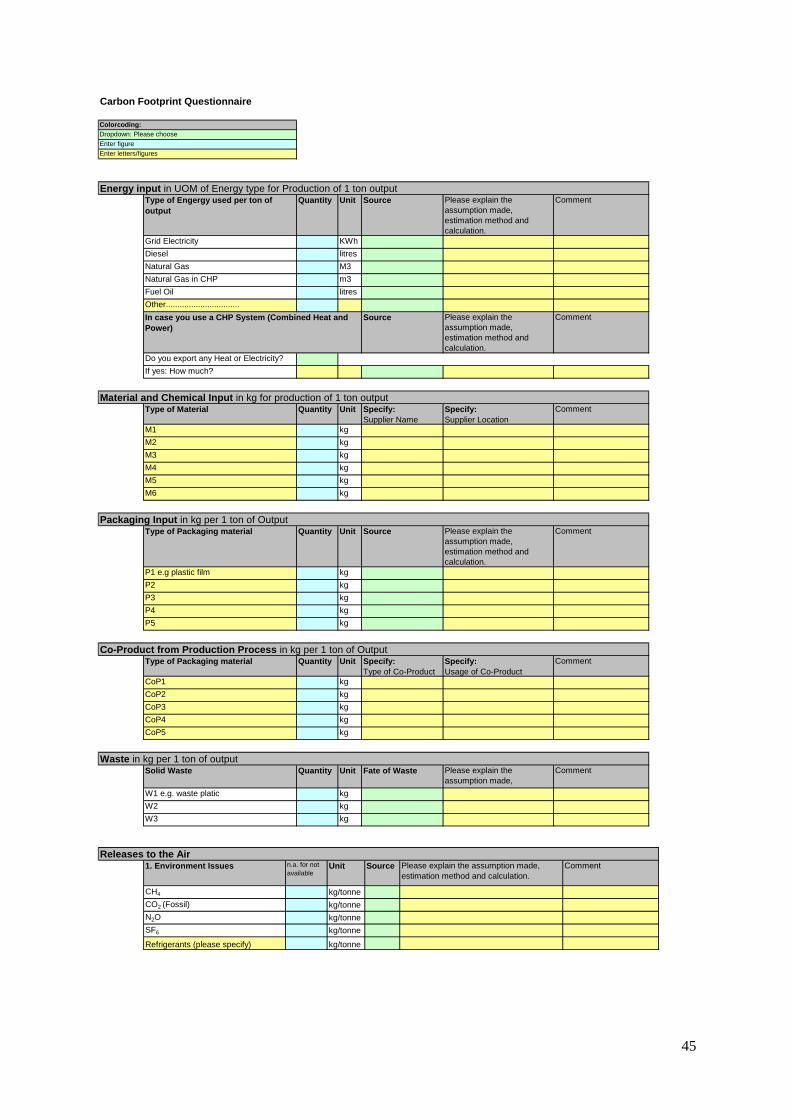
45
Type of Engergy used per ton of
output
Quantity Unit Source Please explain the
assumption made,
estimation method and
calculation.
Comment
Grid Electricity KWh
Diesel litres
Natural Gas M3
Natural Gas in CHP m3
Fuel Oil litres
Other................................
Source Please explain the
assumption made,
estimation method and
calculation.
Comment
Do you export any Heat or Electricity?
If yes: How much?
Type of Material Quantity Unit Specify:
Supplier Name
Specify:
Supplier Location
Comment
M1 kg
M2 kg
M3 kg
M4 kg
M5 kg
M6 kg
Type of Packaging material Quantity Unit Source Please explain the
assumption made,
estimation method and
calculation.
Comment
P1 e.g plastic film kg
P2 kg
P3 kg
P4 kg
P5 kg
Type of Packaging material Quantity Unit Specify:
Type of Co-Product
Specify:
Usage of Co-Product
Comment
CoP1 kg
CoP2 kg
CoP3 kg
CoP4 kg
CoP5 kg
Solid Waste Quantity Unit Fate of Waste Please explain the
assumption made,
estimation method and
Comment
W1 e.g. waste platic kg
W2 kg
W3 kg
Waste in kg per 1 ton of output
Material and Chemical Input in kg for production of 1 ton output
Packaging Input in kg per 1 ton of Output
Co-Product from Production Process in kg per 1 ton of Output
In case you use a CHP System (Combined Heat and
Power)
Carbon Footprint Questionnaire
Energy input in UOM of Energy type for Production of 1 ton output
Enter figure
Enter letters/figures
Dropdown: Please choose
Colorcoding:
1. Environment Issues n.a. for not
availableUnit Source Please explain the assumption made,
estimation method and calculation.
Comment
CH4 kg/tonne
CO2 (Fossil) kg/tonne
N2O kg/tonne
SF6 kg/tonne
Refrigerants (please specify) kg/tonne
Releases to the Air
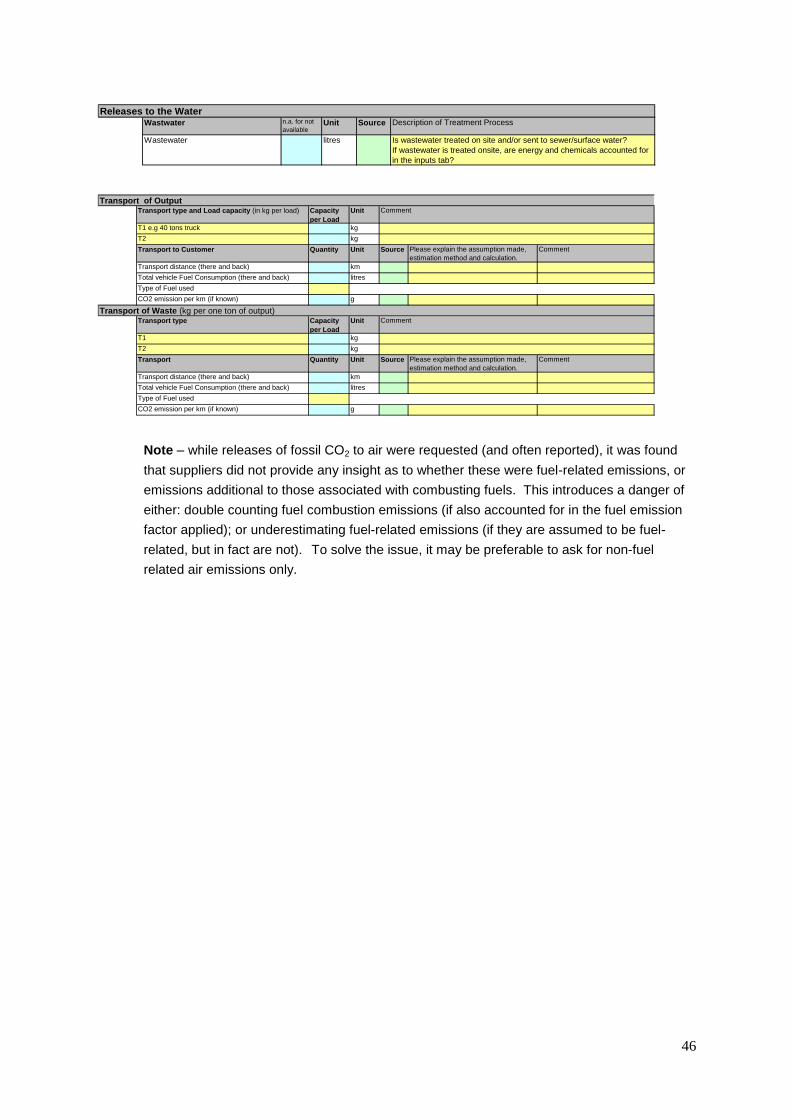
46
Note – while releases of fossil CO2 to air were requested (and often reported), it was found
that suppliers did not provide any insight as to whether these were fuel-related emissions, or
emissions additional to those associated with combusting fuels. This introduces a danger of
either: double counting fuel combustion emissions (if also accounted for in the fuel emission
factor applied); or underestimating fuel-related emissions (if they are assumed to be fuel-
related, but in fact are not). To solve the issue, it may be preferable to ask for non-fuel
related air emissions only.
Wastwater n.a. for not
availableUnit Source
Wastewater litres
Description of Treatment Process
Is wastewater treated on site and/or sent to sewer/surface water?
If wastewater is treated onsite, are energy and chemicals accounted for
in the inputs tab?
Releases to the Water
Transport type and Load capacity (in kg per load) Capacity
per Load
Unit
T1 e.g 40 tons truck kg
T2 kg
Transport to Customer Quantity Unit Source Please explain the assumption made,
estimation method and calculation.
Comment
Transport distance (there and back) km
Total vehicle Fuel Consumption (there and back) litres
Type of Fuel used
CO2 emission per km (if known) g
Transport type Capacity
per Load
Unit
T1 kg
T2 kg
Transport Quantity Unit Source Please explain the assumption made,
estimation method and calculation.
Comment
Transport distance (there and back) km
Total vehicle Fuel Consumption (there and back) litres
Type of Fuel used
CO2 emission per km (if known) g
Comment
Transport of Waste (kg per one ton of output)Comment
Transport of Output

47