trends in sulphur and nitrogen deposition fluxes in the geomon network, czech republic, between 1994...
TRANSCRIPT
TRENDS IN SULPHUR AND NITROGEN DEPOSITION FLUXES IN THEGEOMON NETWORK, CZECH REPUBLIC, BETWEEN 1994 AND 2000
DANIELA FOTTOVÁCzech Geological Survey, Klárov 3, 118 21 Prague 1, Czech Republic
(∗ author for correspondance, e-mail: [email protected]; fax: +420251818748)
(Received 7 May 2003; accepted 21 May 2003)
Abstract. Deposition fluxes of sulphur and nitrogen in bulk and throughfall precipitation were mon-itored for the 1994–2000 period for seven small forest catchments in the GEOMON network, CzechRepublic (CR). Four catchments are situated at similar elevations (roughly between 800 and 1000 m)and represent three areas: the Black Triangle near the Krušné hory Mts. coalfield (catchments JEZ andLYS), the Orlické hory Mts., close to the Polish industrial regions (UDL), and the Šumava Mts., a rel-atively unpolluted area (LIZ). Three catchments (GEM, POM, LES) lie at lower elevations (400–600m) in Central Bohemia. A substantial decrease in the bulk and throughfall deposition of pollutantsoccurred as a result of the desulphurisation programme implemented in the Czech Republic between1996 and 1998. A reduction has been described mainly in the Krušné hory Mts. (JEZ), in Slavkovskýles (LYS) and also in Central Bohemia (GEM). The decrease in the throughfall to less than one halfwithin a single year in POM (Central Bohemia) was an example of a direct response to the localemission reduction in the nearby Chvaletice power plant. However, in some areas, the throughfalldeposition of sulphur, which includes wet and dry deposition, is still significant, especially at higherelevations. Recent forest degradation was observed in the Orlické hory Mts., where, particularly in1998, as much as 91.1 kg S was found in coniferous throughfall. The fraction of dry deposition inthe coniferous forests of CR represents 30–70% of the total deposition. The difference between con-iferous (higher) and deciduous (lower) throughfall fluxes is significant because of the larger surfacearea of conifers and year-round exposure to air-borne sulphur. At several of the GEOMON sites, theflux of nitrogen via throughfall increased during the observation period and, at the end of the studiedperiod (2000), nitrogen became the main source of acidification, replacing sulphur compounds. Thehighest fluxes (81.7 kg N ha−1 yr−1) were measured in 2000 in the Orlické hory Mts., which providean example of multiple causes of forest decline – the direct impact of air pollution, abundance ofnitrogen, acidification and secondary stressors (weather changes, insect pests, fungal infections). Acomparison is given with data from other countries.
Keywords: bulk, catchment, deposition, nitrogen, sulphur, throughfall
1. Introduction
Monitoring of elemental fluxes in GEOMON, a network of small forested catch-ments in the territory of the Czech Republic (CR), has been coordinated by theCzech Geological Survey since 1994 (Fottová, 1995; Fottová and Skorepová, 1998).The deposition fluxes of fifteen major ionic species based on bulk precipitation andthroughfall analysis were calculated for the 1994–2000 period. The data were ob-tained for the whole network encompassing fourteen small forest catchments. The
Water, Air, and Soil Pollution 150: 73–87, 2003.© 2003 Kluwer Academic Publishers. Printed in the Netherlands.
74 D. FOTTOVA
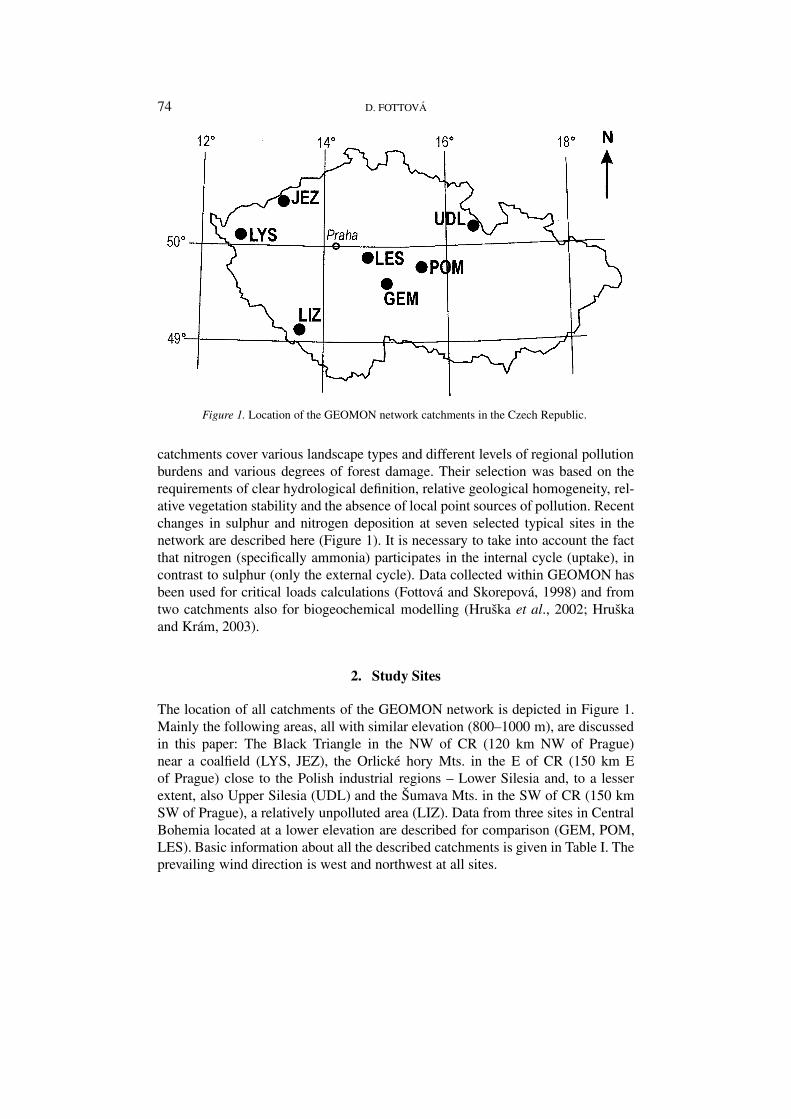
Figure 1. Location of the GEOMON network catchments in the Czech Republic.
catchments cover various landscape types and different levels of regional pollutionburdens and various degrees of forest damage. Their selection was based on therequirements of clear hydrological definition, relative geological homogeneity, rel-ative vegetation stability and the absence of local point sources of pollution. Recentchanges in sulphur and nitrogen deposition at seven selected typical sites in thenetwork are described here (Figure 1). It is necessary to take into account the factthat nitrogen (specifically ammonia) participates in the internal cycle (uptake), incontrast to sulphur (only the external cycle). Data collected within GEOMON hasbeen used for critical loads calculations (Fottová and Skorepová, 1998) and fromtwo catchments also for biogeochemical modelling (Hruška et al., 2002; Hruškaand Krám, 2003).
2. Study Sites
The location of all catchments of the GEOMON network is depicted in Figure 1.Mainly the following areas, all with similar elevation (800–1000 m), are discussedin this paper: The Black Triangle in the NW of CR (120 km NW of Prague)near a coalfield (LYS, JEZ), the Orlické hory Mts. in the E of CR (150 km Eof Prague) close to the Polish industrial regions – Lower Silesia and, to a lesserextent, also Upper Silesia (UDL) and the Šumava Mts. in the SW of CR (150 kmSW of Prague), a relatively unpolluted area (LIZ). Data from three sites in CentralBohemia located at a lower elevation are described for comparison (GEM, POM,LES). Basic information about all the described catchments is given in Table I. Theprevailing wind direction is west and northwest at all sites.
TRENDS IN SULPHUR AND NITROGEN DEPOSITION 75
TAB
LE
I
Cat
chm
entl
ocat
ions
and
char
acte
rist
ics
Cat
chm
ent
Are
aE
leva
tion
Pre
cipi
tati
onB
edro
ckS
oil
pHof
runo
ffA
lkal
init
yof
runo
ff
(km
2)
a.s.
l.(m
)av
g94
–200
0pr
evai
ling
type
prev
ailin
gty
peav
g97
–200
0av
g97
–200
0(µ
eq/L
)
(mm
)
Jeze
rriJ
EZ
2.61
475–
924
847
two-
mic
agn
eiss
dist
ric
cam
biso
l5.
5889
.1
Kru
šne
hory
Mts
.
Lys
ina
LYS
0.27
829–
949
943
leuc
ocra
tic
gran
ite
spod
o-di
stri
cca
mbi
sol
4.03
–105
.1
Sla
vkov
sky
les
Mts
.
Udv
oulo
ucek
UD
L0.
3388
0–95
019
96tw
o-m
ica
gnei
sssp
odo-
dist
ric
cam
biso
l4.
9115
.9
Orl
icke
hory
Mts
.ca
mbi
cpo
dzol
4.91
15.9
Na
lizu
LIZ
0.99
828–
1024
871
silli
man
ite-b
iotit
edi
stri
cca
mbi
sol
6.54
147.
5
Šum
ava
Mts
.pa
ragn
eiss
Ane
nsky
poto
kG
EM
0.27
480–
540
654
silli
man
ite-b
iotit
edi
stri
cca
mbi
sol
0.07
335.
7
Cen
tral
Boh
emia
para
gnei
ss
Pol
omka
PO
M0.
6951
2–64
070
0m
igm
atite
-ort
hogn
eiss
dist
ric
cam
biso
l6.
4313
1.2
Cen
tral
Boh
emia
para
gnei
ssst
agno
-gle
yic
cam
biso
l
Les
nıpo
tok
LE
S0.
7040
0–49
561
3bi
otite
gran
itedi
stri
cca
mbi
sol
5.07
10.7
Cen
tral
Boh
emia
76 D. FOTTOVA
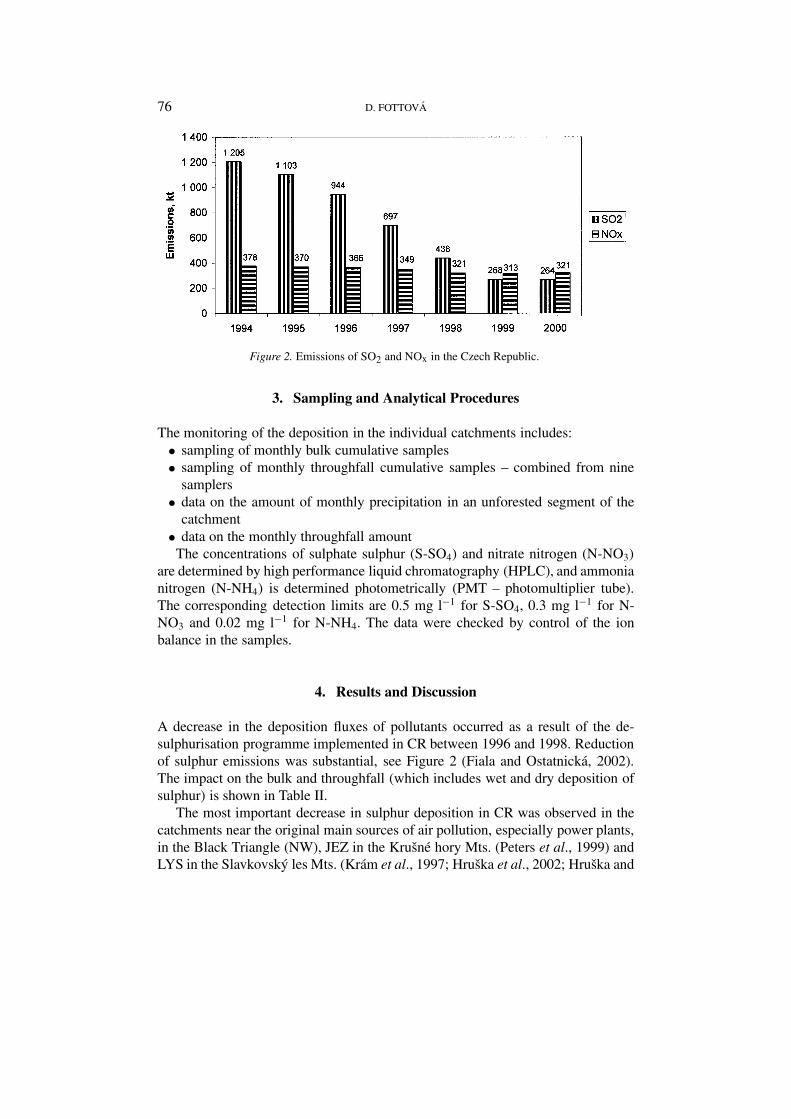
Figure 2. Emissions of SO2 and NOx in the Czech Republic.
3. Sampling and Analytical Procedures
The monitoring of the deposition in the individual catchments includes:• sampling of monthly bulk cumulative samples• sampling of monthly throughfall cumulative samples – combined from nine
samplers• data on the amount of monthly precipitation in an unforested segment of the
catchment• data on the monthly throughfall amount
The concentrations of sulphate sulphur (S-SO4) and nitrate nitrogen (N-NO3)
are determined by high performance liquid chromatography (HPLC), and ammonianitrogen (N-NH4) is determined photometrically (PMT – photomultiplier tube).The corresponding detection limits are 0.5 mg l−1 for S-SO4, 0.3 mg l−1 for N-NO3 and 0.02 mg l−1 for N-NH4. The data were checked by control of the ionbalance in the samples.
4. Results and Discussion
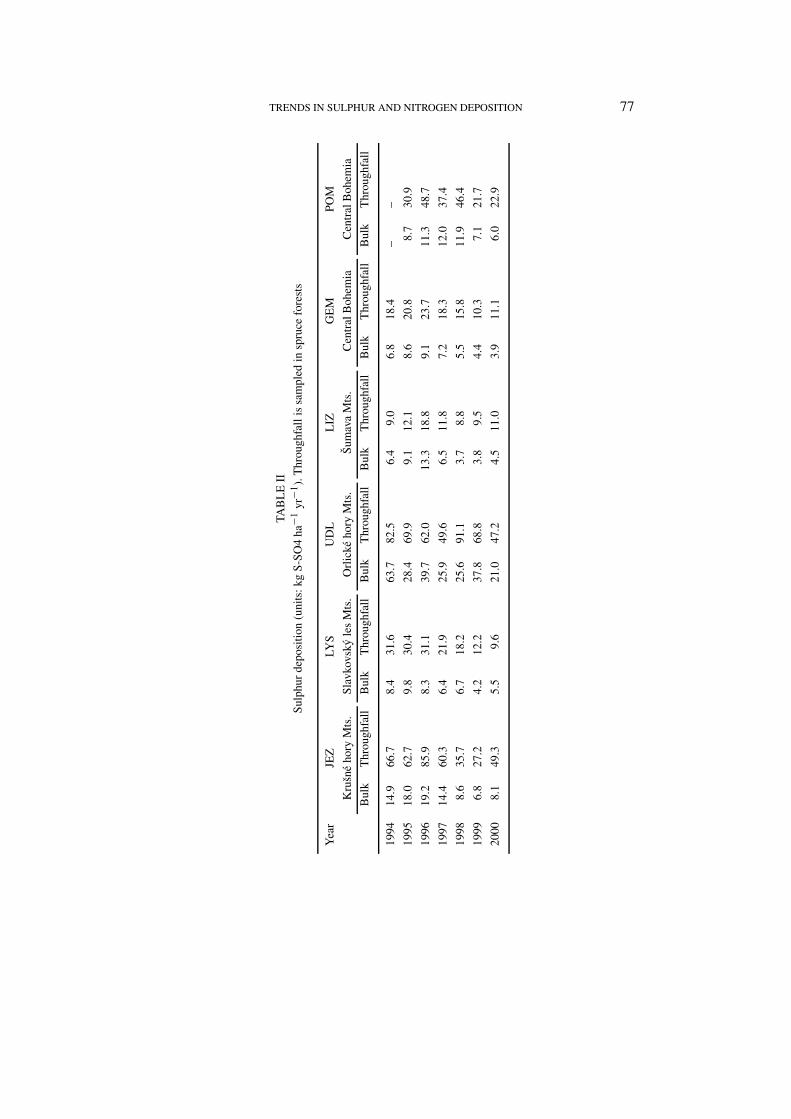
A decrease in the deposition fluxes of pollutants occurred as a result of the de-sulphurisation programme implemented in CR between 1996 and 1998. Reductionof sulphur emissions was substantial, see Figure 2 (Fiala and Ostatnická, 2002).The impact on the bulk and throughfall (which includes wet and dry deposition ofsulphur) is shown in Table II.
The most important decrease in sulphur deposition in CR was observed in thecatchments near the original main sources of air pollution, especially power plants,in the Black Triangle (NW), JEZ in the Krušné hory Mts. (Peters et al., 1999) andLYS in the Slavkovský les Mts. (Krám et al., 1997; Hruška et al., 2002; Hruška and
TRENDS IN SULPHUR AND NITROGEN DEPOSITION 77
TAB
LE
II
Sul
phur
depo
sitio
n(u
nits
:kg
S-S
O4
ha−1
yr−1
).T
hrou
ghfa
llis
sam
pled
insp
ruce
fore
sts
Yea
rJE
ZLY
SU
DL
LIZ
GE
MP
OM
Kru
šne
hory
Mts
.S
lavk
ovsk
yle
sM
ts.
Orl
icke
hory
Mts
.Š
umav
aM
ts.
Cen
tral
Boh
emia
Cen
tral
Boh
emia
Bul
kT
hrou
ghfa
llB
ulk
Thr
ough
fall
Bul
kT
hrou
ghfa
llB
ulk
Thr
ough
fall
Bul
kT
hrou
ghfa
llB
ulk
Thr
ough
fall
1994
14.9
66.7
8.4
31.6
63.7
82.5
6.4
9.0
6.8
18.4
––
1995
18.0
62.7
9.8
30.4
28.4
69.9
9.1
12.1
8.6
20.8
8.7
30.9
1996
19.2
85.9
8.3
31.1
39.7
62.0
13.3
18.8
9.1
23.7
11.3
48.7
1997
14.4
60.3
6.4
21.9
25.9
49.6
6.5
11.8
7.2
18.3
12.0
37.4
1998
8.6
35.7
6.7
18.2
25.6
91.1
3.7
8.8
5.5
15.8
11.9
46.4
1999
6.8
27.2
4.2
12.2
37.8
68.8
3.8
9.5
4.4
10.3
7.1
21.7
2000
8.1
49.3
5.5
9.6
21.0
47.2
4.5
11.0
3.9
11.1
6.0
22.9
78 D. FOTTOVA
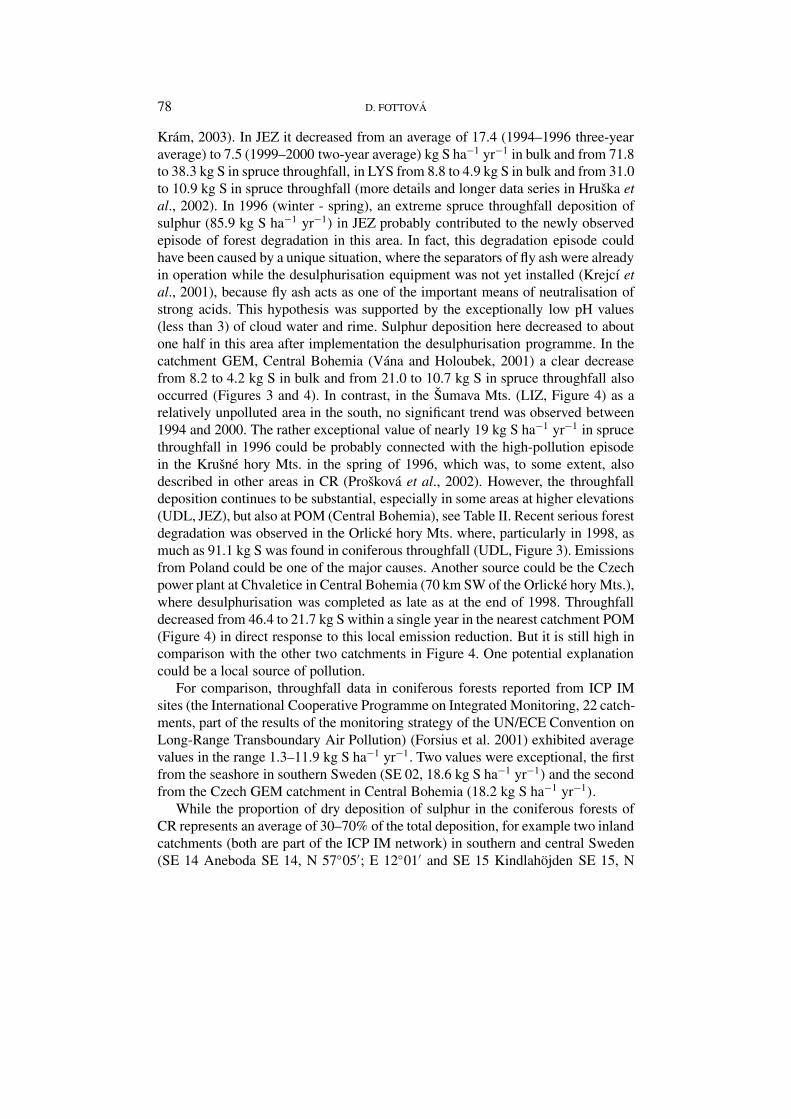
Krám, 2003). In JEZ it decreased from an average of 17.4 (1994–1996 three-yearaverage) to 7.5 (1999–2000 two-year average) kg S ha−1 yr−1 in bulk and from 71.8to 38.3 kg S in spruce throughfall, in LYS from 8.8 to 4.9 kg S in bulk and from 31.0to 10.9 kg S in spruce throughfall (more details and longer data series in Hruška etal., 2002). In 1996 (winter - spring), an extreme spruce throughfall deposition ofsulphur (85.9 kg S ha−1 yr−1) in JEZ probably contributed to the newly observedepisode of forest degradation in this area. In fact, this degradation episode couldhave been caused by a unique situation, where the separators of fly ash were alreadyin operation while the desulphurisation equipment was not yet installed (Krejcí etal., 2001), because fly ash acts as one of the important means of neutralisation ofstrong acids. This hypothesis was supported by the exceptionally low pH values(less than 3) of cloud water and rime. Sulphur deposition here decreased to aboutone half in this area after implementation the desulphurisation programme. In thecatchment GEM, Central Bohemia (Vána and Holoubek, 2001) a clear decreasefrom 8.2 to 4.2 kg S in bulk and from 21.0 to 10.7 kg S in spruce throughfall alsooccurred (Figures 3 and 4). In contrast, in the Šumava Mts. (LIZ, Figure 4) as arelatively unpolluted area in the south, no significant trend was observed between1994 and 2000. The rather exceptional value of nearly 19 kg S ha−1 yr−1 in sprucethroughfall in 1996 could be probably connected with the high-pollution episodein the Krušné hory Mts. in the spring of 1996, which was, to some extent, alsodescribed in other areas in CR (Prošková et al., 2002). However, the throughfalldeposition continues to be substantial, especially in some areas at higher elevations(UDL, JEZ), but also at POM (Central Bohemia), see Table II. Recent serious forestdegradation was observed in the Orlické hory Mts. where, particularly in 1998, asmuch as 91.1 kg S was found in coniferous throughfall (UDL, Figure 3). Emissionsfrom Poland could be one of the major causes. Another source could be the Czechpower plant at Chvaletice in Central Bohemia (70 km SW of the Orlické hory Mts.),where desulphurisation was completed as late as at the end of 1998. Throughfalldecreased from 46.4 to 21.7 kg S within a single year in the nearest catchment POM(Figure 4) in direct response to this local emission reduction. But it is still high incomparison with the other two catchments in Figure 4. One potential explanationcould be a local source of pollution.
For comparison, throughfall data in coniferous forests reported from ICP IMsites (the International Cooperative Programme on Integrated Monitoring, 22 catch-ments, part of the results of the monitoring strategy of the UN/ECE Convention onLong-Range Transboundary Air Pollution) (Forsius et al. 2001) exhibited averagevalues in the range 1.3–11.9 kg S ha−1 yr−1. Two values were exceptional, the firstfrom the seashore in southern Sweden (SE 02, 18.6 kg S ha−1 yr−1) and the secondfrom the Czech GEM catchment in Central Bohemia (18.2 kg S ha−1 yr−1).
While the proportion of dry deposition of sulphur in the coniferous forests ofCR represents an average of 30–70% of the total deposition, for example two inlandcatchments (both are part of the ICP IM network) in southern and central Sweden(SE 14 Aneboda SE 14, N 57◦05′; E 12◦01′ and SE 15 Kindlahöjden SE 15, N
TRENDS IN SULPHUR AND NITROGEN DEPOSITION 79
Figure 3. Trends in sulphur throughfall (UDL, JEZ, LYS). Throughfall is sampled in spruce forests.
Figure 4. Trends in sulphur throughfall (GEM, LIZ, POM). Throughfall is sampled in spruce forests.
80 D. FOTTOVA
TABLE III
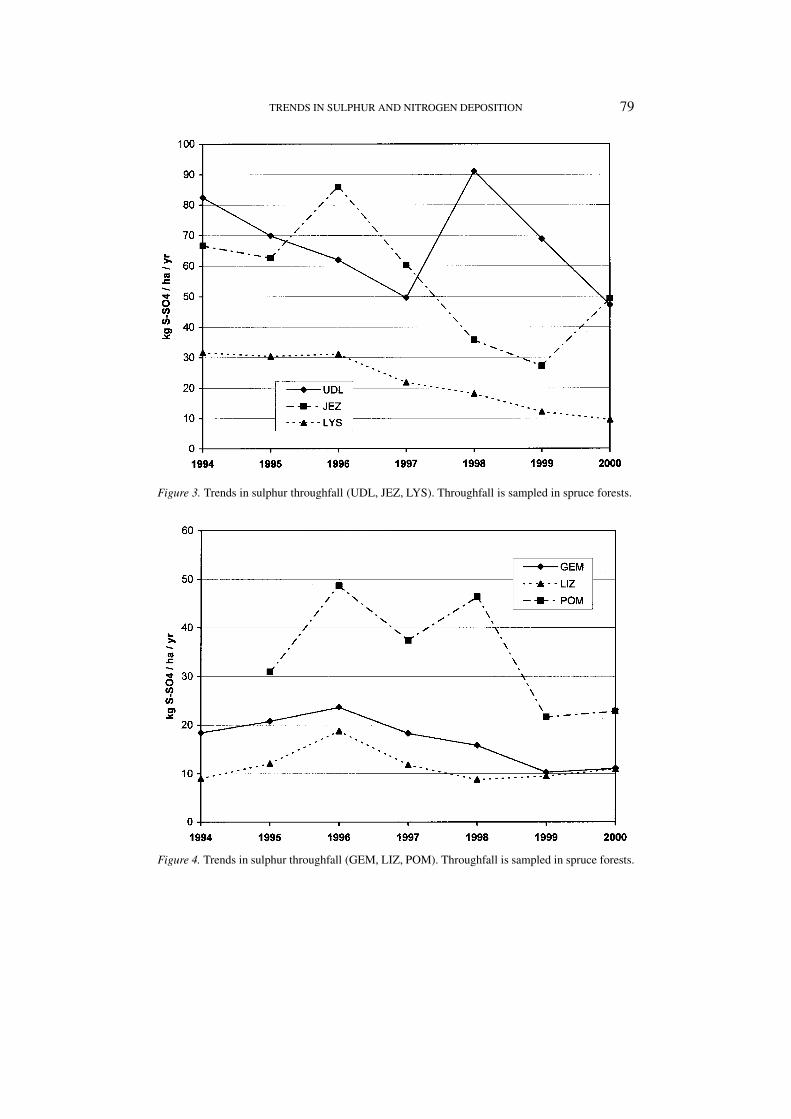
Comparison of sulphur deposition (units: kg S-SO4 ha−1 yr−1) in bulk precipitation and throughfallfrom Norway spruce and European beech at a high elevation and polluted site (JEZ) and a low elevationsite (LES)
Year JEZ LES
Krušne hory Mts. Central Bohemia
Bulk precipitation Bulk Spruce Beech Bulk precipitation Bulk Spruce Beech
(mm) (mm)
1997 705 14.4 60.3 19.9 621 7.6 20.5 6.7
1998 618 8.6 35.7 15.1 598 5.3 17.9 6.6
1999 568 6.8 27.2 10.8 454 1.8 10.4 4.4
2000 945 8.1 49.3 11.6 598 3.5 11.7 5.5
59◦45′; E 14◦54′) with lower pollution levels had much lower dry deposition, onlyabout 10–15%. In 1998–2000, bulk deposition in Aneboda amounted to 3.8–5.4 kgS ha−1 yr−1 while throughfall deposition (coniferous) was 4.8–5.1 kg S ha−1 yr−1,in Kindlahöjden bulk deposition was 3.9–5.1 kg S ha−1 yr−1 and throughfall de-position was 4.5–5.9 kg S ha−1 yr−1 (Löfgren, 2001). The Czech GEM catchment,as a part of the ICP IM network, exhibited the highest fraction of dry depositionof sulphur among non-marine areas, 63%. Only catchments in Lithuania close tothe Russian border, with 43 and 48% dry deposition, were similar to conditions atthe Czech sites. Other sites had a substantially lower fraction of dry deposition:Austria 24%, Germany 39%, Switzerland 21%, Italy 16%, Latvia 22%, Finland19%, Norway 10% (Forsius et al., 2001).
The difference between coniferous and deciduous throughfall is significant be-cause of the larger surface area of conifers and year-round exposure to air-borneSO2. For example, the JEZ catchment in the Krušné hory Mts. exhibited 49.3 kg Sha−1 yr−1 under conifers and only 11.6 kg S under deciduous trees in 2000 (TableIII), while bulk deposition in an open area was only 8.1 kg S. In Central Bohemia(LES), 11.7 kg S was measured in a coniferous stand, 5.5 kg S in a deciduous standand 3.5 kg S in bulk precipitation. These data support the argument against plantingconiferous monocultures in areas with elevated air pollution.
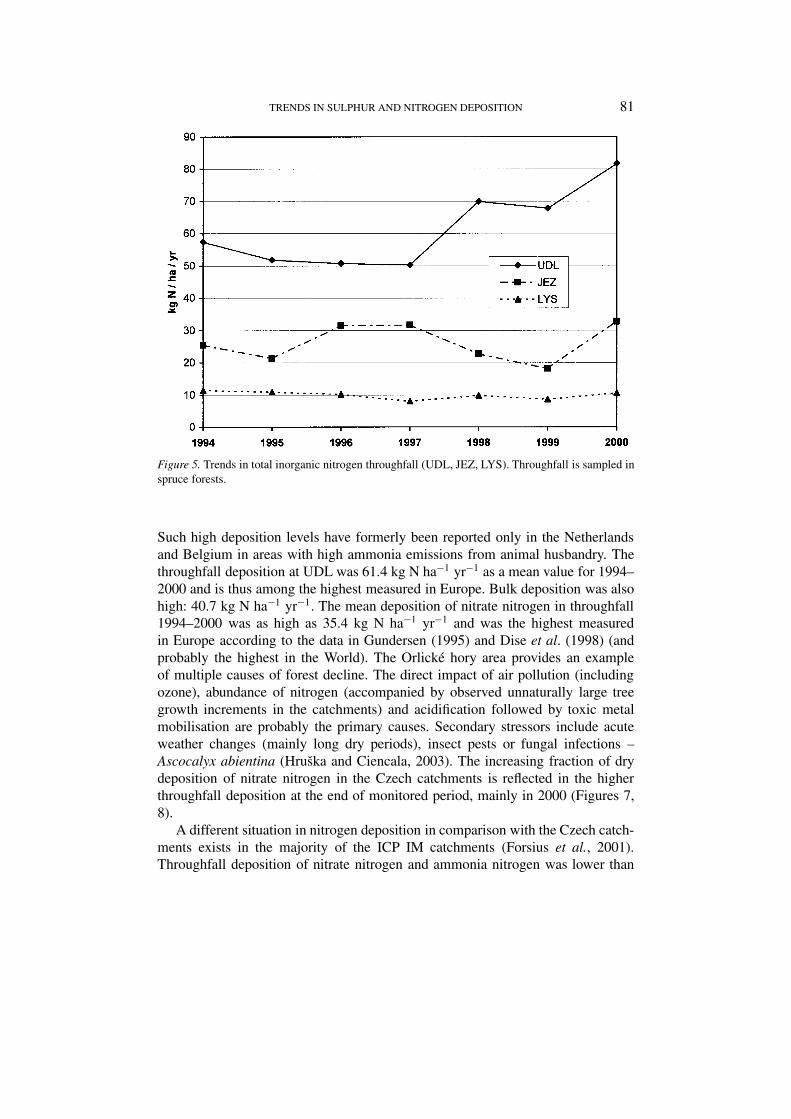
Many of the sites of the GEOMON network exhibited an increase in nitrogenflux via throughfall in the late 1990s (Tables IV, V, Figures 5, 6). The highest totalinorganic nitrogen throughfall (coniferous), 81.7 kg N ha−1 yr−1 was measuredin 2000 in the Orlické hory Mts. (UDL), where nitrate nitrogen (49.9 kg N-NO3
ha−1 yr−1) was the prevailing nitrogen species. These were the highest values inthe entire observation period of seven years in the network. Maximum nitrogendeposition in throughfall in Europe has values of up to 70 kg N ha−1 yr−1 withammonia as the dominant nitrogen species (Gundersen, 1995; Dise et al., 1998).
TRENDS IN SULPHUR AND NITROGEN DEPOSITION 81
Figure 5. Trends in total inorganic nitrogen throughfall (UDL, JEZ, LYS). Throughfall is sampled inspruce forests.
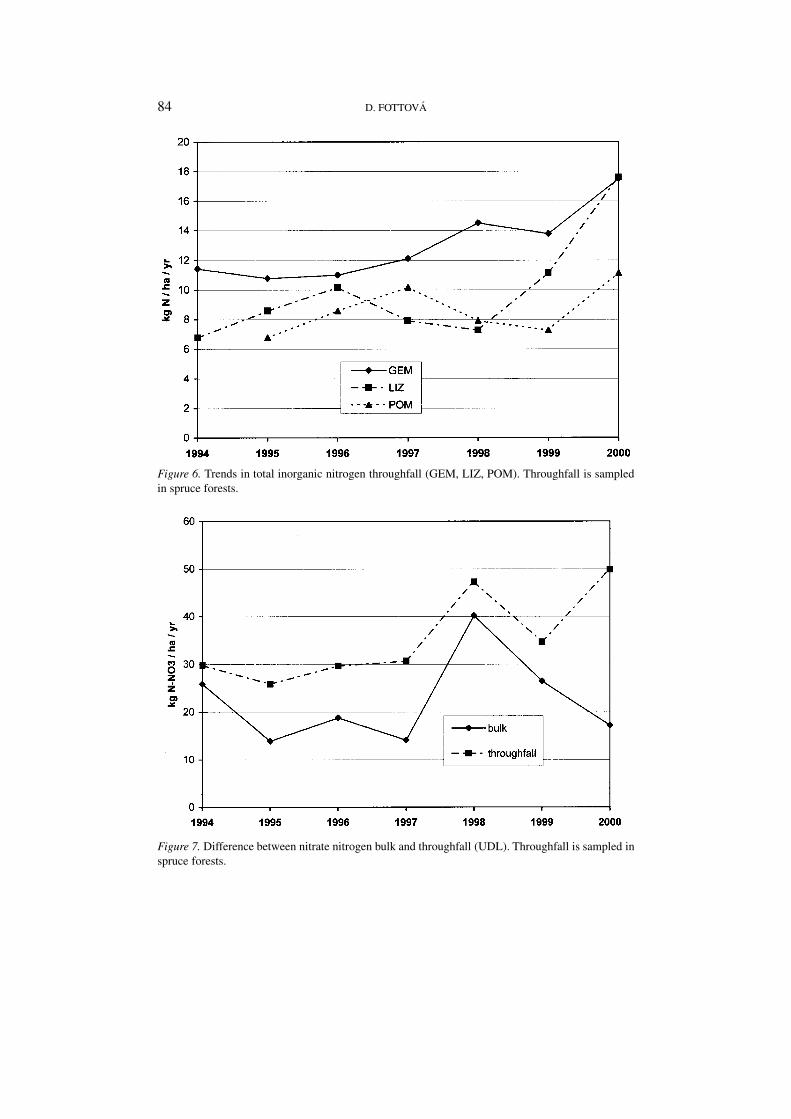
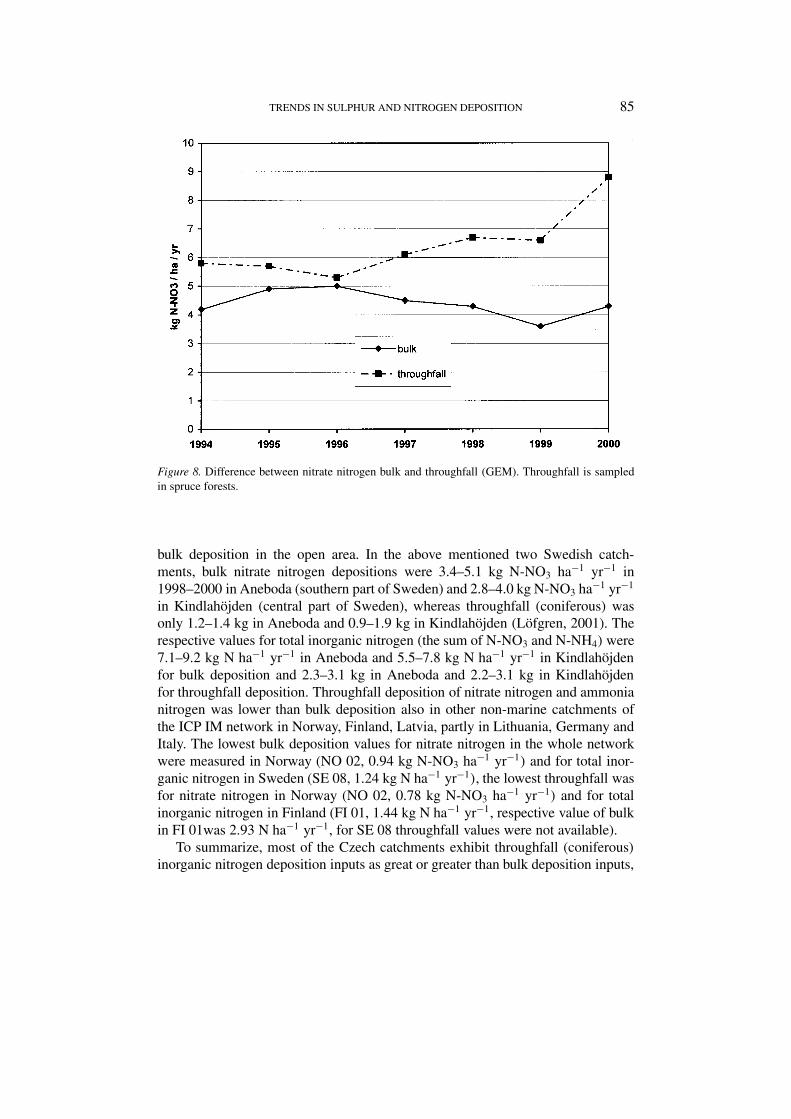
Such high deposition levels have formerly been reported only in the Netherlandsand Belgium in areas with high ammonia emissions from animal husbandry. Thethroughfall deposition at UDL was 61.4 kg N ha−1 yr−1 as a mean value for 1994–2000 and is thus among the highest measured in Europe. Bulk deposition was alsohigh: 40.7 kg N ha−1 yr−1. The mean deposition of nitrate nitrogen in throughfall1994–2000 was as high as 35.4 kg N ha−1 yr−1 and was the highest measuredin Europe according to the data in Gundersen (1995) and Dise et al. (1998) (andprobably the highest in the World). The Orlické hory area provides an exampleof multiple causes of forest decline. The direct impact of air pollution (includingozone), abundance of nitrogen (accompanied by observed unnaturally large treegrowth increments in the catchments) and acidification followed by toxic metalmobilisation are probably the primary causes. Secondary stressors include acuteweather changes (mainly long dry periods), insect pests or fungal infections –Ascocalyx abientina (Hruška and Ciencala, 2003). The increasing fraction of drydeposition of nitrate nitrogen in the Czech catchments is reflected in the higherthroughfall deposition at the end of monitored period, mainly in 2000 (Figures 7,8).
A different situation in nitrogen deposition in comparison with the Czech catch-ments exists in the majority of the ICP IM catchments (Forsius et al., 2001).Throughfall deposition of nitrate nitrogen and ammonia nitrogen was lower than
82 D. FOTTOVA
TAB
LE
IV
Nit
rate
nitr
ogen
depo
siti
on(u
nits
:kg
N-N
O3
ha−1
yr−1
).T
hrou
ghfa
llis
sam
pled
insp
ruce
fore
sts
Yea
rJE
ZLY
SU
DL
LIZ
GE
MP
OM
Kru
šne
hory
Mts
.S
lavk
ovsk
yle
sM
ts.
Orl
icke
hory
Mts
.Š
umav
aM
ts.
Cen
tral
Boh
emia
Cen
tral
Boh
emia
Bul
kT
hrou
ghfa
llB
ulk
Thr
ough
fall
Bul
kT
hrou
ghfa
llB
ulk
Thr
ough
fall
Bul
kT
hrou
ghfa
llB
ulk
Thr
ough
fall
1994
6.4
12.4
4.7
6.8
25.9
29.8
2.8
3.6
4.2
5.8
––
1995
6.9
12.4
5.6
6.3
13.9
25.9
5.1
4.5
4.9
5.7
3.7
9.1
1996
7.3
14.2
5.2
5.0
18.8
29.7
8.8
5.4
5.0
5.3
3.7
12.8
1997
5.6
14.4
4.1
4.1
14.1
30.7
4.1
4.8
4.5
6.1
6.2
12.7
1998
5.6
9.8
5.1
5.4
40.2
47.3
4.7
5.1
4.3
6.7
4.9
12.3
1999
4.0
8.9
4.6
5.3
26.5
34.7
3.7
5.9
3.6
6.6
3.6
10.0
2000
4.5
17.1
4.8
6.3
17.2
49.9
4.1
10.0
4.3
8.8
8.5
10.7

TRENDS IN SULPHUR AND NITROGEN DEPOSITION 83
TAB
LE
V
Tota
lino
rgan
icni
trog
ende
posi
tion
(uni
ts:k
gN
ha−1
yr−1
).T
hrou
ghfa
llis
sam
pled
insp
ruce
fore
sts
Yea
rJE
ZLY
SU
DL
LIZ
GE
MP
OM
Kru
šne
hory
Mts
.S
lavk
ovsk
yle
sM
ts.
Orl
icke
hory
Mts
.Š
umav
aM
ts.
Cen
tral
Boh
emia
Cen
tral
Boh
emia
Bul
kT
hrou
ghfa
llB
ulk
Thr
ough
fall
Bul
kT
hrou
ghfa
llB
ulk
Thr
ough
fall
Bul
kT
hrou
ghfa
llB
ulk
Thr
ough
fall
1994
12.4
25.5
9.8
11.5
51.1
57.4
4.8
6.8
9.6
11.4
––
1995
14.2
21.4
13.0
10.9
30.7
51.8
12.6
8.6
11.3
10.8
11.2
15.4
1996
16.7
31.6
11.4
10.3
39.6
50.8
16.7
10.2
11.1
11.0
11.0
30.9
1997
13.2
31.7
11.0
8.1
26.1
50.3
7.5
7.9
10.1
12.1
13.6
24.8
1998
13.2
22.7
12.2
9.9
53.6
70.0
6.8
7.3
9.3
14.5
10.3
19.9
1999
8.9
18.7
8.8
8.7
54.6
67.9
7.0
11.1
7.9
13.8
7.3
19.3
2000
14.0
32.8
9.7
10.7
29.1
81.7
10.2
17.6
9.0
17.5
11.6
20.5
84 D. FOTTOVA
Figure 6. Trends in total inorganic nitrogen throughfall (GEM, LIZ, POM). Throughfall is sampledin spruce forests.
Figure 7. Difference between nitrate nitrogen bulk and throughfall (UDL). Throughfall is sampled inspruce forests.
TRENDS IN SULPHUR AND NITROGEN DEPOSITION 85
Figure 8. Difference between nitrate nitrogen bulk and throughfall (GEM). Throughfall is sampledin spruce forests.
bulk deposition in the open area. In the above mentioned two Swedish catch-ments, bulk nitrate nitrogen depositions were 3.4–5.1 kg N-NO3 ha−1 yr−1 in1998–2000 in Aneboda (southern part of Sweden) and 2.8–4.0 kg N-NO3 ha−1 yr−1
in Kindlahöjden (central part of Sweden), whereas throughfall (coniferous) wasonly 1.2–1.4 kg in Aneboda and 0.9–1.9 kg in Kindlahöjden (Löfgren, 2001). Therespective values for total inorganic nitrogen (the sum of N-NO3 and N-NH4) were7.1–9.2 kg N ha−1 yr−1 in Aneboda and 5.5–7.8 kg N ha−1 yr−1 in Kindlahöjdenfor bulk deposition and 2.3–3.1 kg in Aneboda and 2.2–3.1 kg in Kindlahöjdenfor throughfall deposition. Throughfall deposition of nitrate nitrogen and ammonianitrogen was lower than bulk deposition also in other non-marine catchments ofthe ICP IM network in Norway, Finland, Latvia, partly in Lithuania, Germany andItaly. The lowest bulk deposition values for nitrate nitrogen in the whole networkwere measured in Norway (NO 02, 0.94 kg N-NO3 ha−1 yr−1) and for total inor-ganic nitrogen in Sweden (SE 08, 1.24 kg N ha−1 yr−1), the lowest throughfall wasfor nitrate nitrogen in Norway (NO 02, 0.78 kg N-NO3 ha−1 yr−1) and for totalinorganic nitrogen in Finland (FI 01, 1.44 kg N ha−1 yr−1, respective value of bulkin FI 01was 2.93 N ha−1 yr−1, for SE 08 throughfall values were not available).
To summarize, most of the Czech catchments exhibit throughfall (coniferous)inorganic nitrogen deposition inputs as great or greater than bulk deposition inputs,

86 D. FOTTOVA
TABLE VI
Increase of road traffic in the Czech Republic
Year Czech Republic (10.3 mil. inhabitants) Prague (1.2 mil. inhabitants)
Motor vehicles – total Ppassenger cars Motor vehicles – total Passenger cars
1990 4039606,0 2411297,0 428769,0 336037,0
2000 5230846,0 3720310,0 746832,0 620663,0
Source: Institute of transportation engineering of the city of Prague.
whereas most canopies mainly in Scandinavia, as examples of unpolluted areas,absorb nitrogen , resulting in lower throughfall inputs than bulk inputs.
The following explanation has been suggested for the high Czech nitrogen de-positions: an increase in road traffic in CR (Table VI), enhanced use of natural gasfor household heating and continuing emissions from power plants, which weredesulphurised but not denitrified (Table II).
5. Conclusions
Data on elemental fluxes from the GEOMON network demonstrate that the effectof desulphurisation was not uniform over the whole territory of the Czech Republic.Areas close to the Black Triangle were preferentially influenced by desulphurisa-tion of power plants but, for example, the Orlické hory Mts. in the east of the CzechRepublic are still under relatively high atmospheric loads of sulphur and nitrogen.After desulphurisation, nitrogen compounds became the main source of acidifica-tion, replacing sulphur. Throughfall deposition of nitrogen (mainly nitrate nitrogen)increased at most sites in the monitored period, especially after 1997–1998. At onesite (UDL, Orlické hory Mts.) nitrogen deposition was 81.7 kg N ha−1 yr−1 in2000, one of the highest deposition levels observed in Europe. The explanationssuggested for the high Czech nitrogen depositions lie in an increase in road trafficin CR (Table VI), enhanced use of natural gas for household heating and continuingemissions from power plants, which were desulphurised, but not denitrified. Thestructure of emissions has changed over the last few years. The small decrease inemissions from large sources was compensated by an increase in emissions frommobile sources. Nitrogen from these mobile sources is more accessible than thatfrom large sources, which contribute more to long-range transport.
References
Dise, N. B., Matzner, E. and Gundersen, P.: 1998, ‘Synthesis of nitrogen pools and fluxes fromEuropean forest ecosystems’, Water, Air, Soil Pollut. 105, 143–154.
TRENDS IN SULPHUR AND NITROGEN DEPOSITION 87
Fiala, J. and Ostatnická, J. (eds): 2002, Air Pollution in the Czech Republic in 2001, CzechHydrometeorological Institute Prague.
Forsius, M., Kleemola, S., Vuorenmaa, J. and Syri, S.: 2001, ‘Fluxes and trends of nitrogen andsulphur compounds at integrated monitoring sites in Europe’, Water, Air, Soil Pollut. 130, 1641–1648.
Fottová, D.: 1995, ‘Regional evaluation of mass element fluxes: GEOMON network of smallcatchments’, Envir. Monit. Assess. 34, 215–221.
Fottová, D. and Skorepová, I.: 1998, ‘Changes in mass element fluxes and their importance for criticalloads: GEOMON network, Czech Republic’, Water, Air, Soil Pollut. 105, 365–376.
Gundersen, P.: 1995, ‘Nitrogen deposition and leaching in European forests – preliminary resultsfrom a data compilation’, Water, Air, Soil Pollut. 85, 1179–1184.
Hruška, J., Moldan, F. and Krám, P.: 2002, ‘Recovery from acidification in Central Europe – Ob-served and predicted changes of soil and streamwater chemistry in the Lysina catchment, CzechRepublic’, Envir. Pollut. 120, 261–274.
Hruška, J. and Krám, P.: 2003, ‘Modeling long-term changes in streamwater and soil chemistryin catchments with contrasting vulnerability to acidification (Lysina and Pluhuv Bor, CzechRepublic)’, Hydrology and Earth System Sciences (submitted).
Hruška, J. and Cienciala, E. (eds): 2003, Long-term Acidification and Soil Nutrient Degradation– Limiting Factor of the Recent Forestry, Report for Ministry of Environment of the CzechRepublic (in press).
Krám, P., Hruška, J., Wenner, B. S., Driscoll, C. T. and Johnson, C. E.: 1997, ‘The biogeo-chemistry of basic cations in two acid-impacted forest catchments with contrasting lithology’,Biogeochemistry 37, 173–202.
Krejcí, R., Cerný, J., Havel, M., Hruška, J., Davies, T. D., Bridges, K. S. and Hunová, I.: 2001,‘Damage to spruce forests in the Krušné hory Mts.’, Vesmír 80(576), 2001/10.
Löfgren, S.: 2001, ‘Integrated Monitoring of the Environmental Status in Swedish Forest Ecosys-tems’, IM Annual Report 2000, Uppsala.
Peters, N. E., Cerný, J., Havel, M. and Krejcí, R.: 1999, ‘Temporal trends of bulk precipitation andstream water chemistry (1977–1997) in a small forested area, Krušné hory, Northern Bohemia,the Czech Republic’, Hydrol. Process. 13, 2721–2741.
Prošková, J., Hunová, I. and Macoun, J.: 2002, ‘Anomaly in the chemical composition of atmosphericprecipitation observed at some monitoring sites in the Czech Republic in February, March andApril 1996’. Meteorol. Bull. 55(4), 97–102.
Vána, M. and Holoubek, I.: 2001, ‘Quality of the Natural Environment in the Czech Republic atthe Regional Level (results of the Košetice Observatory)’, Czech Hydrometeorological Institute,Prague.