trends in data centre energy consumption under the...
TRANSCRIPT
Trends in data centre energy consumption under the European Code of Conduct for Data Centre Energy Efficiency
Paolo Bertoldi, Maria Avgerinou, Luca Castellazzi
2017
EUR 28874 EN

This publication is a Technical report by the Joint Research Centre (JRC), the European Commission’s science and knowledge service. It aims to provide evidence-based scientific support to the European policymaking process. The scientific output expressed does not imply a policy position of the European Commission. Neither the European Commission nor any person acting on behalf of the Commission is responsible for the use that might be made of this publication. Contact information
Name: Paolo Bertoldi Address: European Commission, Joint Research Centre, Via E. Fermi, 2749, I-21027 Ispra (VA), ITALY Email: [email protected] Tel.: +39 0332 789299 JRC Science Hub
https://ec.europa.eu/jrc JRC108354 EUR 28874 EN
PDF ISBN 978-92-79-76445-5 ISSN 1831-9424 doi:10.2760/358256
Luxembourg: Publications Office of the European Union, 2017 © European Union, 2017
Reuse is authorised provided the source is acknowledged. The reuse policy of European Commission documents is regulated by Decision 2011/833/EU (OJ L 330, 14.12.2011, p. 39).
For any use or reproduction of photos or other material that is not under the EU copyright, permission must be sought directly from the copyright holders. How to cite this report: P. Bertoldi, M. Avgerinou, L. Castellazzi, Trends in data centre energy consumption
under the European Code of Conduct for Data Centre Energy Efficiency, EUR 28874 EN, Publications Office of the European Union, Luxembourg, 2017, ISBN 978-92-79-76445-5, doi:10.2760/358256, JRC108354 All images © European Union 2017, except: cover page, cybrain, image # 479232763, Source: www.shutterstock.com
i
Contents
Acknowledgements ................................................................................................ 1
Abstract ............................................................................................................... 2
1 Introduction ...................................................................................................... 3
2 European Trends ............................................................................................... 5
2.1 Data centre markets .................................................................................... 5
2.1.1 London Market .................................................................................... 6
2.1.2 Frankfurt Market .................................................................................. 6
2.1.3 Paris Market ........................................................................................ 7
2.1.4 Amsterdam Market .............................................................................. 7
2.1.5 Other Markets ..................................................................................... 8
3 European Code of Conduct for Data Centre Energy Efficiency ................................ 10
4 Methodology and Metrics .................................................................................. 13
5 Results and Analysis ........................................................................................ 14
5.1 PUE analysis ............................................................................................. 14
5.2 Sector Distribution Analysis......................................................................... 20
5.3 Geographical Distribution Analysis ............................................................... 21
5.4 Free Cooling Technologies ........................................................................... 24
5.5 Best practices............................................................................................ 26
6 Conclusions ...................................................................................................... 31
References ......................................................................................................... 32
List of abbreviations and definitions ....................................................................... 36
List of figures ...................................................................................................... 37
List of tables ....................................................................................................... 38

1
Acknowledgements
We thank Katalin Bodis, Officer at European Commission, Joint Research Centre, for the assistance with the geographical distribution map.
Authors
Paolo Bertoldi, Maria Avgerinou, Luca Castellazzi
2
Abstract
Climate change is recognised as one of the key challenges humankind is facing. The Information and Communication Technology (ICT) sector including data centres generates up to 2% of the global CO2 emissions, a number on par to the aviation sector contribution, and data centres are estimated to have the fastest growing carbon footprint from across the whole ICT sector, mainly due to technological advances such as the cloud computing and the rapid growth of the use of Internet services. There are no recent estimations of the total energy consumption of the European data centre and of their energy efficiency. The aim of this paper is to evaluate, analyse and present the current trends in energy consumption and efficiency in data centres in the European Union using the data submitted by companies participating in the European Code of Conduct for Data Centre Energy Efficiency programme, a voluntary initiative created in 2008 in response to the increasing energy consumption in data centres and the need to reduce the related environmental, economic and energy supply security impacts. The analysis shows that the average Power Usage Effectiveness (PUE) of the facilities participating in the programme is declining year after year. This confirms that voluntary approaches could be effective in addressing climate and energy issue.
3
1 Introduction
According to Rong H et al. [5] data centres are computer warehouses that store a large amount of data for different organisations in order to meet their daily transaction processing needs. They contain servers for the collection of data and network infrastructure for the utilisation and storage of the data [5]. Data centres usually run 24/7 all year round [1] and are very energy intensive with typical power densities of 538-2153 W/m2 and sometimes they can reach up to 10 KW/m2 [11]. High energy consumption can be attributed primarily to the IT demands and cooling equipment, as well as lighting, power distribution and other requirements. The cooling system may account for up to 40% of the energy demands of a data centre [13] [6] with the most efficient systems using 24% of the total energy and the least efficient 61% [6]. This power is distributed to chillers, cooling towers and water pumps. Water chillers consume the most energy to supply chilled water to the cooling coil in order to keep the indoor temperature low enough by removing the heat emitted by the servers [13]. Hence, the improvement of the cooling system efficiency can lead to great energy and financial savings. However there is no appropriate legislative framework.
There are European policy actions for buildings such as the 2010 European Energy Performance of Building Directive (EPBD) [48] which imposes on the EU Member States to adopt minimum efficiency requirements for buildings based on cost-optimality in their building codes. In addition to that Directive, there is an agreement between the EU and the US on the shared use of the Energy Star labelling programme, whose equipment is available in Europe and promoted by public authorities and their procurement practices. Furthermore, the Eco-design Directive introduces minimum efficiency requirements for end-use equipment such as domestic appliances, lighting products, electronics, UPS, air-conditioners, computers etc. Even though the Directive covers individual equipment that is used in data centres, the overall efficiency of the facility is not guaranteed [Bertoldi]. Generally, there are no European policies that introduce specific mandatory efficiency requirements for data centres.
Data centres have been designed to allow operational and capacity changes as well as expansions. In addition, most of them nowadays run significant quantities of redundant power and cooling systems to provide higher levels of reliability. Additionally, IT systems frequently run at a low average utilisation. Over-provisioning, ensuring availability and associated costs were previously considered as a negligible risk to business performance because energy costs were relatively small in comparison to the IT budget and environmental and energy responsibility was not considered to be under the control of the IT department. However, with rising energy prices this is no longer the case, and the issue of energy consumption at the individual data centre level is becoming increasingly important as operational energy expenditures and environmental impact of the energy consumed begins to play an ever important role in overall cost of ownership of data centres [Bertoldi] [Participant Guidelines].
The energy consumption in the ICT (Information and Communication Technology) sector has increased exponentially over the last years, mainly due to technological advances such as the cloud computing and the rapid growth of the use of Internet services [1]. The data centre sector in particular is estimated to account for the 1.4% of the global electricity consumption [2] [5], and the compound annual growth rate (CAGR) of this consumption in the period between 2007 and 2012 has been estimated as 4.4%. This number is much higher that the projected 2.1% increase in global demand from 2012 to 2040 [2]. The ICT sector including data centres generates up to 2% of the global CO2 emissions, a number on par to the aviation sector contribution [3][4], and data centres are estimated to have the fastest growing carbon footprint from across the whole ICT sector [4]. In addition, real-time video streaming, online gaming as well as mobile devices already account for 60% of all data traffic, and it is predicted that this will rise to 80% by 2020. In general, the ICT sector nowadays consumes approximately 7 % of the global electricity, and it is forecasted that the share will rise up to 13% by 2030 [14].

4
Climate change might not only affect the ICT sector as a whole but data centres are particularly vulnerable to climate hazards due to the impacts on business continuity. Acclimatise, a climate risk management consulting company, published a report describing a number of potential risks that can be attributed to climate change [16]:
● More frequent heat waves and high temperature spikes add extra burden on cooling equipment;
● Reduced efficiency and increased mechanical failures as a result of the increased temperatures affecting the manufacturing parameters of the equipment;
● Power failures affecting the local grid due to increased supply demands for cooling purposes during heatwaves;
● Restricted water supply during more frequently occurring droughts;
● Sea level rise, increased river flood or 'flash' flooding may damage the equipment and lead to data loss due to the drainage systems blocked by heavy precipitation;
● Direct impacts on supply chains and infrastructure and loss pf business continuity;
● Employees' mobility affected by adverse weather-related events.
There are not any recent estimations of the energy consumption of European Data Centres or of the average PUE. The aim of this report is to evaluate, analyse and present the current trends in energy efficiency in data centres using the data submitted by companies participating in the European Code of Conduct for Data Centre Energy Efficiency.
5
2 European Trends
According to the Energy Efficiency Status Report published by European Commission's Joint Research Centre in 2012, the total data centre energy consumption in 2007 was estimated as 56 TWh (2% of the overall energy consumption in the EU annually), and it is projected to grow to 104 TWh/ year (4%) by 2020 [8].
These figures are not too far off from Koomey's [9] estimations regarding the annual electricity consumption in Western Europe for 2000 and 2005. He estimated the consumption to be 18.3 TWh in 2000 and 41.3 TWh in 2005. Also, assuming an annual 12% growth rate the 2010 energy consumption was estimated as 72.5 TWh.
According to DataCentreDynamics, the total data centre energy consumption in the EU is estimated as 48 - 55 TWh per year. Also, the same source estimates the power usage to be 5,5-6 GW and the net data centre space as 6,0-6,5 million m2 (N. Parfitt, personal communication, December 4, 2016).
Another study conducted by Broadgroup in 2014 provides estimations and future projections regarding the net space of data centres, power density and usage of European data centres:
Table 1. Data centres in Western Europe
Western Europe 2013 2014 2015 2016 2017 2018 2019 2020
Net data centre space (thousands of m2)
102,056 10221 10,105 10,055 9,875 9,555 9,365 9,155
Average power density (kW/m2)
1.1 1.1 1.2 1.2 1.3 1.3 1.2 1.3
Total power usage (GW)
11.3 11.2 12.1 12 12.8 12.4 11.3 10.9
Source: Broadgroup 2014
Table 1 shows that the net data centre space has been steadily declining throughout the years and is projected to decline more in the near future. The average density and total power usage trends show fluctuations, however, the power usage is predicted to fall. Assuming 8,000 operating hours per year, it is estimated that energy consumption reaches a peak in 2017 (102 TWh) and is projected to drop to 87 TWh until 2020.
It must be noted that some of the data presented in the table above contradict the aforementioned data provided by DataCentreDynamics and the Energy Efficiency Status Report. This is to be expected since all studies provide estimations and future projections based on different models and data collection methodologies.
Also, the average PUE in European data centres in 2012 was reported to be 2.62 and in 2013 it declined to 2.53 [17]. However, it is rather difficult to determine a certain figure that is widely accepted to quantify the efficiency of European data centres.
2.1 Data centre markets
There are four dominant data centre markets in Europe: UK, Germany, France and Netherlands.
Frankfurt is well connected to Central and South East Europe, whereas the Amsterdam market connections extend to Scandinavia and Russia. London and Frankfurt being the largest financial business centres naturally have the strongest industries [18].
6
The latest available data cover the third quarter of 2016 and calculate the total power supply in the four big markets as 879 MW since the start of the current year. As for the individual supplies, they were reported in the CBRE Q3 2016 Report [19] as follows:
● London: 384MW
● Frankfurt: 199MW
● Amsterdam: 166 MW
● Paris: 129MW
2.1.1 London Market
The British data centre market, being the largest one, is well reported and analysed. According to TechUK's Emma Fryer, it is estimated that the data centres industry's share cover 0.6% of the total energy consumption in the UK. In general, the electricity consumption in 2014 was the lowest since 1995, 4.3% down comparing to the previous and it is part of a general declining trend [20].
CCA (Climate Change Agreement) for Data Centres came into force in July 2014 and is a voluntary scheme that promotes energy efficiency strategies. The target is to reduce the PUE by at least 15% for the base year over the life of the scheme (it runs until 2023 and is spread over four target periods) [21].
The latest available data cover the period up to the end of 2014 and refer to colocation data centres only. However, the sites that are not in the scheme ate relatively small and the additional power consumption will not affect the overall number substantially. The total energy usage of the 98 facilities participating in the scheme in 2014 was 2 TWh. It is estimated that the whole sector accounts for 2.2-2.5 TWh a year. (E. Fryer, personal communication, November 28, 2016).
More specifically, the total annual electricity that went through the scheme until 2014 was 1,995,810 MWh and the total IT electricity based on base year data was 1,015,360 MWh.
In addition, the average PUE of the reporting facilities between base years 2011-2014 is 1.93 [21].
2.1.2 Frankfurt Market
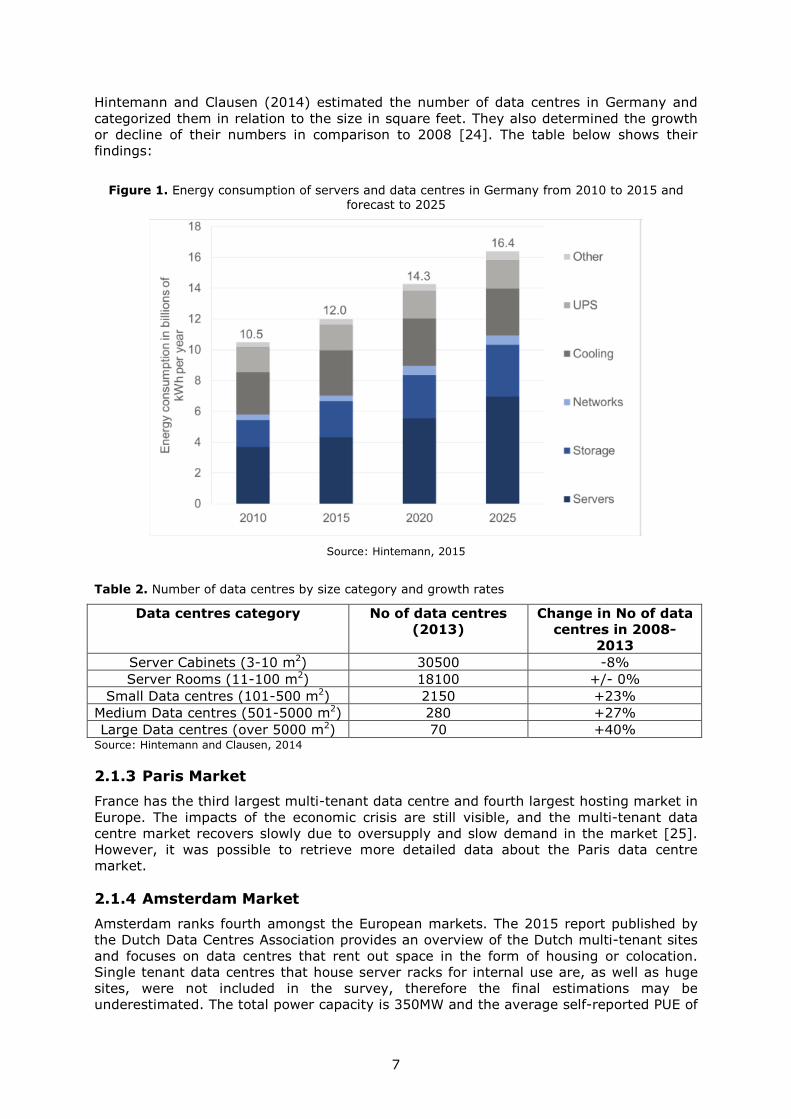
As for the Frankfurt market, the second largest in Europe, the increased digitization in all sectors leads to growing energy demands. The 2015 report published by the Borderstep Institute reported that the 2015 total energy consumption is estimated up to 12 TWh, and the future projections for 2020 and 2025 are 14 TWh and 16.4 TWh respectively, as demonstrated in Figure 1 [22]. Frankfurt became the first data centre market to reach 30MW of colocation take-up in less than one year, a record that no other market has reached before [23].
7
Hintemann and Clausen (2014) estimated the number of data centres in Germany and categorized them in relation to the size in square feet. They also determined the growth or decline of their numbers in comparison to 2008 [24]. The table below shows their findings:
Figure 1. Energy consumption of servers and data centres in Germany from 2010 to 2015 and forecast to 2025
Source: Hintemann, 2015
Table 2. Number of data centres by size category and growth rates
Data centres category No of data centres
(2013)
Change in No of data
centres in 2008-
2013
Server Cabinets (3-10 m2) 30500 -8% Server Rooms (11-100 m2) 18100 +/- 0%
Small Data centres (101-500 m2) 2150 +23% Medium Data centres (501-5000 m2) 280 +27% Large Data centres (over 5000 m2) 70 +40%
Source: Hintemann and Clausen, 2014
2.1.3 Paris Market
France has the third largest multi-tenant data centre and fourth largest hosting market in Europe. The impacts of the economic crisis are still visible, and the multi-tenant data centre market recovers slowly due to oversupply and slow demand in the market [25]. However, it was possible to retrieve more detailed data about the Paris data centre market.
2.1.4 Amsterdam Market
Amsterdam ranks fourth amongst the European markets. The 2015 report published by the Dutch Data Centres Association provides an overview of the Dutch multi-tenant sites and focuses on data centres that rent out space in the form of housing or colocation. Single tenant data centres that house server racks for internal use are, as well as huge sites, were not included in the survey, therefore the final estimations may be underestimated. The total power capacity is 350MW and the average self-reported PUE of
8
the facilities that were surveyed was 1.31 [26]. Nowadays, Amsterdam holds the 20% of the European key data centre market. It is also projected that until 2020 there will be a 10-20% reduction of the ICT-related electricity consumption relative to 2013 [27]. Specifically, the 2013 energy consumption in the Amsterdam area only was reported as 0.46 TWh [18] whereas the national consumption for the same year is estimated as 1.4 TWh [27].
According to the 2016 report of the Dutch Data Centre Association, there are over 200 sites across the country and they cover approximately 271000 m2 of total net data centre surface. Another estimation, provided by Le Fevre and Leclercq in 2013 predicted the net space growth in 2016 up to 385000 m2 and the capacity to 500 MW taking into account the consumption of main-process supporting data centre within companies, hence the higher numbers [18].
2.1.5 Other Markets
Other general trends in the European sector include the Nordic market (Norway, Sweden, Finland, Denmark and Iceland) which covers the 9.52% of all Europe. Scandinavian cold climates turn out to be the ideal locations for data centres, offering low temperatures that cut down the cooling energy consumption and costs, as well as low-cost, reliable green power such as hydropower and thermal power [28]. Indicatively, Europe's largest data centre is located in Måløy, Norway and it covers 120,000 m2. Seawater is used as cooling resource as well as a renewable energy source [29].
Ireland is attracting US firms such as Apple and accounts for the 3.31% of all Europe. Finally, there is a projected increase in outsourcing by 42.3% by 2018, comparing to 21.2% in 2013. The British companies are generally more prone to using third-party outsourcing for their needs [30]. Ireland offers a combination of benefits that has attracted foreign investments and particularly some of the industry giants such as Amazon, Microsoft and Google. The cold and damp weather, suitable for reduced cooling costs, in conjunction with the improved connectivity with the UK, rest of Europe and the US, and last but not least, the accommodating low tax rates in comparison to the main antagonists, UK and France, indicate a business-ready country [Jones, 2014].
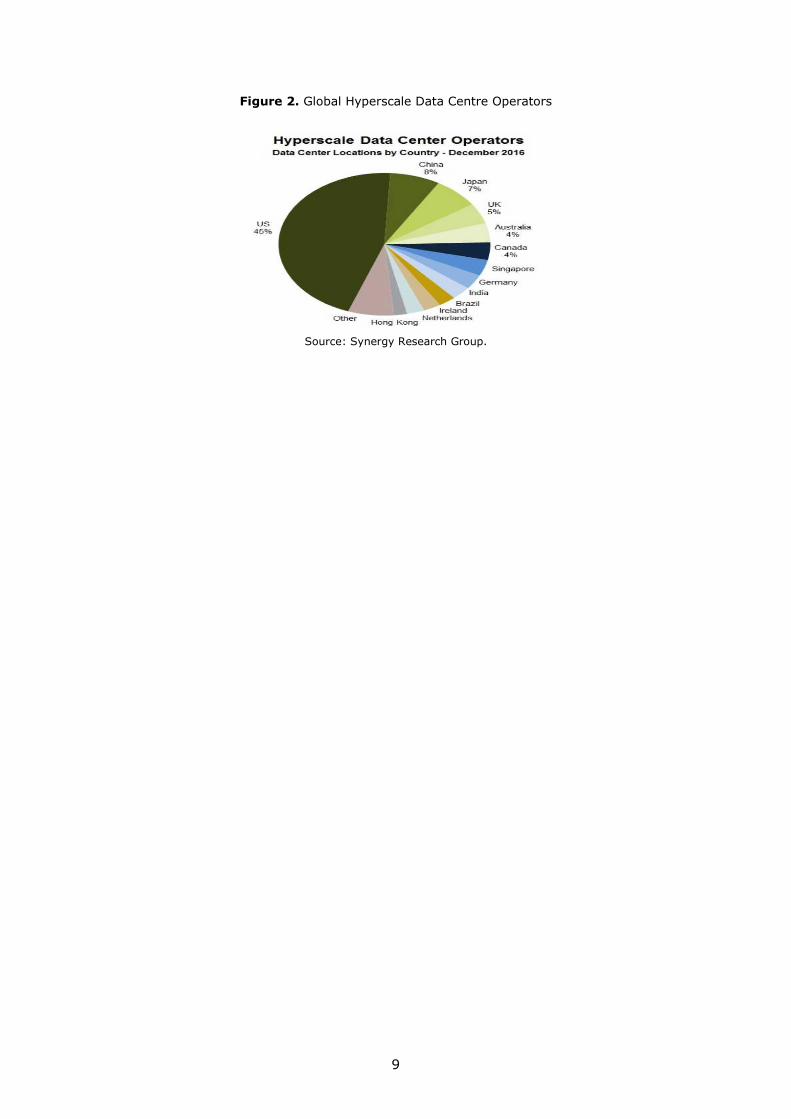
Outside of the EU, US still accounts for 45% of the major cloud and internet data centre sites globally, followed by China (8%), Japan (7%), Australia and Canada (4%). Other non EU countries than have smaller shares include Singapore, Brazil, India and Hong Kong [31]. In 2014, American data centres consumed an estimated 70 TWh, covering approximately 1.8% of the total annual US electricity consumption. There was a 4% increase in the consumption between 2010-2014, even though is significantly lower than the 24% increase in 2005-2010, and the exponential 90% growth that was noted during 2000-2005. It is expected that by 2020 the US facilities are projected to consume 73 TWh, considering a steady 4% consumption growth rate [32].
According to Cloudscene, an online connectivity directory for colocation centres and cloud service providers, there are over 6,122 colocation data centres around the world at the moment [49]. 2015 global energy data centre consumption was estimated 416 TWh and accounts roughly for 3% of the globally generated power and 2% of the global production of greenhouse gas emissions [33].
9
Figure 2. Global Hyperscale Data Centre Operators
Source: Synergy Research Group.
10
3 European Code of Conduct for Data Centre Energy
Efficiency
In order to address complex energy efficiency issues, policy makers can either establish mandatory regulations or voluntary agreements. However, there are sectors that are especially difficult to regulate with many decision makers involved, therefore the voluntary approach is generally preferred, especially between public authorities and private enterprises [34].
The Codes of Conduct (CoC) are European voluntary programmes for the ICT sector that were introduced since 2000. At the moment there are five CoC for ICT products in place: External Power Supplies, Digital TV Systems, Broadband Equipment and UPS. All the aforementioned Codes set specific efficiency requirements for specific products on a voluntary basis, but once a company participates, they have to meet the performance levels and report the energy consumption of their products annually. The fifth and most recent CoC for Data Centres employs the same strategy [8]; however, it is not possible to set a minimum efficiency requirement for data centres, given the diversity of data centres, the different level of responsibilities (some company being only responsible for the infrastructure, while other being responsible for the IT equipment selection and operation). Therefore it was decided that the key criteria for the Data Centre CoC was to ask participating companies to monitor their energy consumption and to adopt a set of established best practices [35].
The European Code of Conduct for Data Centres programme is a voluntary initiative managed by the Joint Research Centre (JRC), the European Commission's in-house science service. It has been created in response to the increasing energy consumption in data centres and the need to reduce the related environmental, economic and energy supply impacts. The aim is to inform and stimulate operators and owners to reduce energy consumption in a cost-effective manner and without hampering the critical function of data centres. In addition, it provides the platform to bring together European stakeholders to discuss and agree voluntary actions which will improve energy efficiency following European conditions such as the climate and energy markets regulations.
The Code addresses primarily data centre owners and operators, and secondly the supply chain and service providers. It is a "multipurpose" programme, allowing different stakeholders to commit to improve efficiency in their own areas of competence. The primary target of the CoC is the data centre owner/operator, who is encouraged to commit to undertake and implement energy efficient solutions in existing or new data centres, whilst respecting the life cycle cost effectiveness and the performance availability of the system.
The energy saving focus of the Code of Conduct covers two main areas:
1. IT Load – this relates to the consumption of the IT equipment in the data centre.
2. Facilities Load – this relates to the mechanical and electrical systems that support the IT electrical load [35].
For the purposes of the CoC, the term "data centres" includes all buildings, facilities and rooms which contain enterprise servers, server communication equipment, cooling equipment and power equipment, and provide some form of data service (e.g. large scale mission critical facilities all the way down to small server rooms located in office buildings) [8].
In [35] it is stated that the CoC aims to:
● Develop and promote a set of easily understood metrics to measure the current efficiencies and improvement.
● Provide and open process and forum for discussion representing European stakeholder requirements.
11
● Produce a common set of principles to refer to and work in coordination with other international initiatives.
● Raise awareness among managers, owners, investors, with targeted information and material on the opportunity to improve efficiency.
● Create and provide an enabling tool for industry to implement cost-effective energy saving opportunities.
● Develop practical voluntary commitments which when implemented improve the energy efficiency of data centres and in so doing minimise the total cost of ownership.
● Determine and accelerate the application of energy efficient technologies.
● Foster the development of tools that promote energy efficient procurement practices, including criteria for equipment based on the Energy Star programme specifications, and other Codes of Conduct.
● Monitor and assess actions to properly determine both the progress and areas for improvement.
● Provides reference for other participants.
The methodological core of the programme is a Registration form, signed by the Participant, in which they commit to:
● Conduct an initial energy measurement and energy audit to identify the major energy saving opportunities.
● Prepare and submit an action plan. Once the action plan is accepted the Participant status will be granted
● Implement the action plan according to the agreed time table. Energy consumption must be monitored regularly, to see overtime progresses in the energy efficiency indicator related to the data centre.
To apply as a Participant the company must determine which of your data centres will be included, whether it meets the criteria for a corporate level Participant and whether it has full of partial control of the data centres.
In addition to the main CoC signing form the applicant shall complete a Reporting Form for each data centre;
● Complete the data centre information tab
● Assess their energy metering capability to ensure that they can meet the reporting requirements
● Enter one month of metering data on the electricity data tab
● Audit their compliance with the Best Practices
● Implement any of the minimum expected Practices that are not already in place in each data centre
● Complete the Best Practices tab.
Energy is measured in line with the reporting requirements. At a minimum, the facility energy is measured at the utility for a stand-alone data centre, or the data centre sub meter. In addition to the energy consumption, optional reporting criteria are also included in the reporting form such as meters on individual parts of the data centre such as the chiller systems and the CRAC units. Also, meters allowing the efficiency devices to be measured such as Power to and from the UPS system.
All Participants have the obligation to continuously monitor energy consumption and adopt energy management in order to look for continuous improvement in energy efficiency. One of the key objectives of the CoC is that each participant benchmark their

12
efficiency overtime, using the CoC metric in order to produce evidence of continuous improvement in efficiency.
It is understood that not all operators are responsible for all aspects of the IT environment defined within the best practices. This is not a barrier to Participant status but the participant can act as an Endorser for those practices outside of their direct control. An example of this would be a collocation provider who does not control the IT equipment shall actively endorse the practices relating to the IT equipment to their customers in adopting those practices. Equally, an IT operator using collocation shall request their collocation provider to implement the practices relating to the facility [36].
13
4 Methodology and Metrics
The European CoC uses the power utilisation effectiveness metric (PUE) which is used to help operators understand a data centre's overall efficiency and reduce energy consumption.
PUE is defined as the ratio of total data centre input power to IT load power. Higher the PUE value lower is the efficiency of the facility as more "overhead" energy is consumed for powering the electrical load. The ideal case id if the value of the PUE is 1 which indicates the maximum attainable efficiency with no overhead energy. The ideal case is not attainable at present due to the consumption of electricity by UPS, fans, pumps, transformers, lighting and other auxiliary equipment in addition to the consuming IT Load [37]. Characteristically, Koomey estimated a range of global PUE values from 1.25 to 3.75 with an average on 1.92, based on the EPA's (Environmental Protection Agency) Energy Star programme survey on 61 data centres in 2010 [38]. In addition to that, Uptime Institute published a survey in 2013 estimating the average PUE based on self-reporting participants to be 1.65, a much improved performance comparing to 1.89 in 2011 and 2.1 in 2007 [39].
The total data centre energy is measured from the point where it is purchased; this includes the electricity, chilled water, gas, fuel oil and other purchases made from a utility. Electricity generated from renewable energy sources is also included in the total. As for the IT Load, it should be measured in the output of the Power Distribution Unit (PDU), or at a minimum at the output of the Uninterruptible Power Supply (UPS) [40].
The data used for the analysis were taken from the registration forms submitted by the companies applying for the Participant status. In total, there are over 120 different businesses participating with one or multiple facilities each from all over Europe and some from the US. All data are confidential and are only used for research purposes.
Up to December 2016, 325 data centres have applied for the Participant status, the great majority of them located in Europe. In the present report, the analysis was applied to a reduced sample of 289 data centres that have been approved and have submitted complete energy data so far.
14
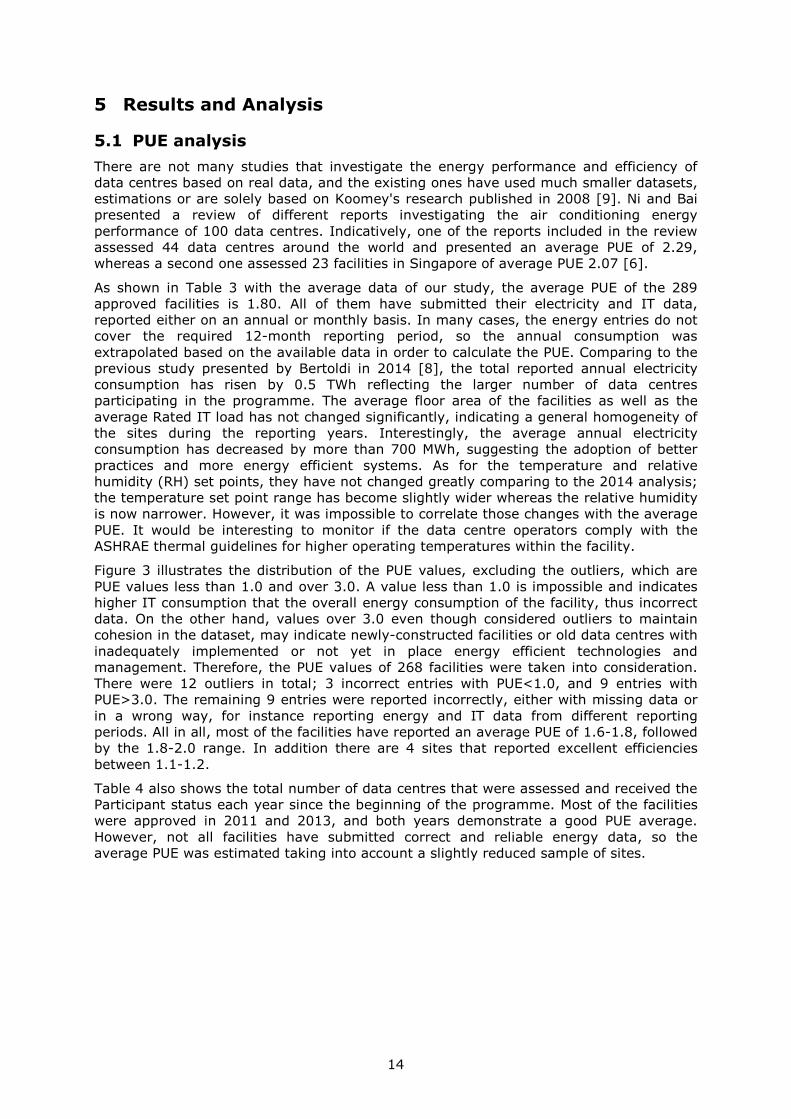
5 Results and Analysis
5.1 PUE analysis
There are not many studies that investigate the energy performance and efficiency of data centres based on real data, and the existing ones have used much smaller datasets, estimations or are solely based on Koomey's research published in 2008 [9]. Ni and Bai presented a review of different reports investigating the air conditioning energy performance of 100 data centres. Indicatively, one of the reports included in the review assessed 44 data centres around the world and presented an average PUE of 2.29, whereas a second one assessed 23 facilities in Singapore of average PUE 2.07 [6].
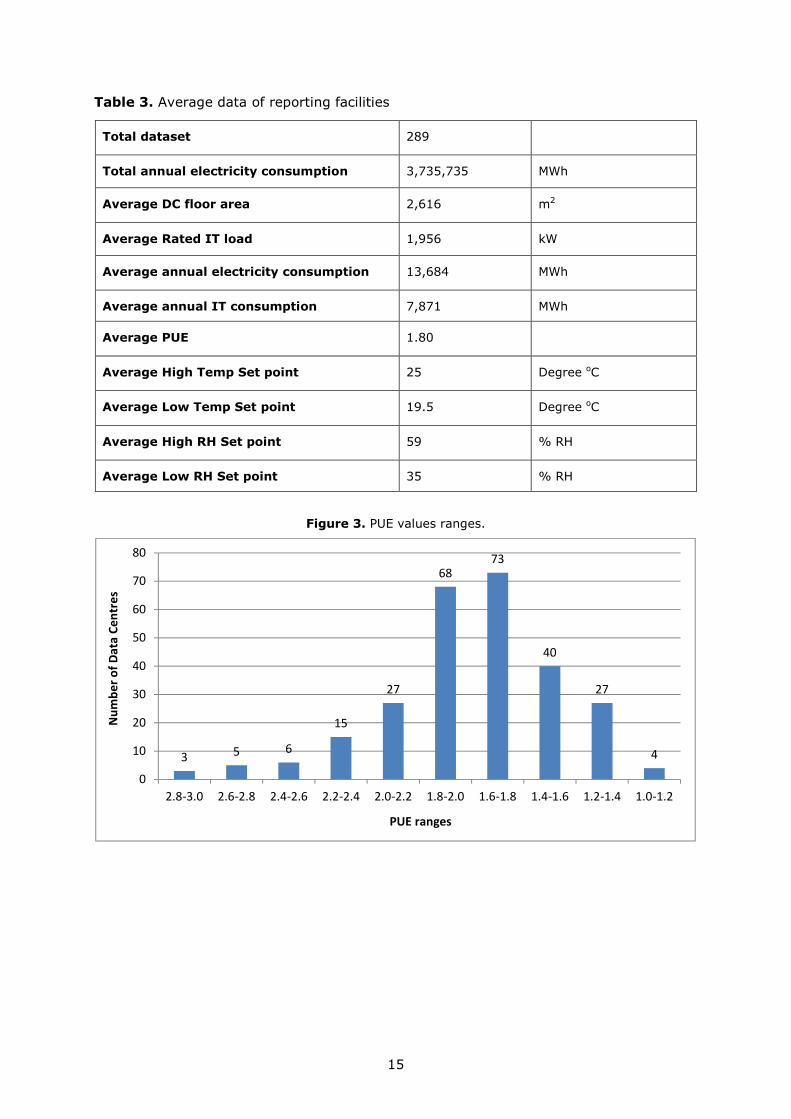
As shown in Table 3 with the average data of our study, the average PUE of the 289 approved facilities is 1.80. All of them have submitted their electricity and IT data, reported either on an annual or monthly basis. In many cases, the energy entries do not cover the required 12-month reporting period, so the annual consumption was extrapolated based on the available data in order to calculate the PUE. Comparing to the previous study presented by Bertoldi in 2014 [8], the total reported annual electricity consumption has risen by 0.5 TWh reflecting the larger number of data centres participating in the programme. The average floor area of the facilities as well as the average Rated IT load has not changed significantly, indicating a general homogeneity of the sites during the reporting years. Interestingly, the average annual electricity consumption has decreased by more than 700 MWh, suggesting the adoption of better practices and more energy efficient systems. As for the temperature and relative humidity (RH) set points, they have not changed greatly comparing to the 2014 analysis; the temperature set point range has become slightly wider whereas the relative humidity is now narrower. However, it was impossible to correlate those changes with the average PUE. It would be interesting to monitor if the data centre operators comply with the ASHRAE thermal guidelines for higher operating temperatures within the facility.
Figure 3 illustrates the distribution of the PUE values, excluding the outliers, which are PUE values less than 1.0 and over 3.0. A value less than 1.0 is impossible and indicates higher IT consumption that the overall energy consumption of the facility, thus incorrect data. On the other hand, values over 3.0 even though considered outliers to maintain cohesion in the dataset, may indicate newly-constructed facilities or old data centres with inadequately implemented or not yet in place energy efficient technologies and management. Therefore, the PUE values of 268 facilities were taken into consideration. There were 12 outliers in total; 3 incorrect entries with PUE<1.0, and 9 entries with PUE>3.0. The remaining 9 entries were reported incorrectly, either with missing data or in a wrong way, for instance reporting energy and IT data from different reporting periods. All in all, most of the facilities have reported an average PUE of 1.6-1.8, followed by the 1.8-2.0 range. In addition there are 4 sites that reported excellent efficiencies between 1.1-1.2.
Table 4 also shows the total number of data centres that were assessed and received the Participant status each year since the beginning of the programme. Most of the facilities were approved in 2011 and 2013, and both years demonstrate a good PUE average. However, not all facilities have submitted correct and reliable energy data, so the average PUE was estimated taking into account a slightly reduced sample of sites.
15
Table 3. Average data of reporting facilities
Figure 3. PUE values ranges.
3 5 6
15
27
6873
40
27
4
0
10
20
30
40
50
60
70
80
2.8-3.0 2.6-2.8 2.4-2.6 2.2-2.4 2.0-2.2 1.8-2.0 1.6-1.8 1.4-1.6 1.2-1.4 1.0-1.2
Nu
mb
er
of
Da
ta C
en
tre
s
PUE ranges
Total dataset 289
Total annual electricity consumption 3,735,735 MWh
Average DC floor area 2,616 m2
Average Rated IT load 1,956 kW
Average annual electricity consumption 13,684 MWh
Average annual IT consumption 7,871 MWh
Average PUE 1.80
Average High Temp Set point 25 Degree oC
Average Low Temp Set point 19.5 Degree oC
Average High RH Set point 59 % RH
Average Low RH Set point 35 % RH
16
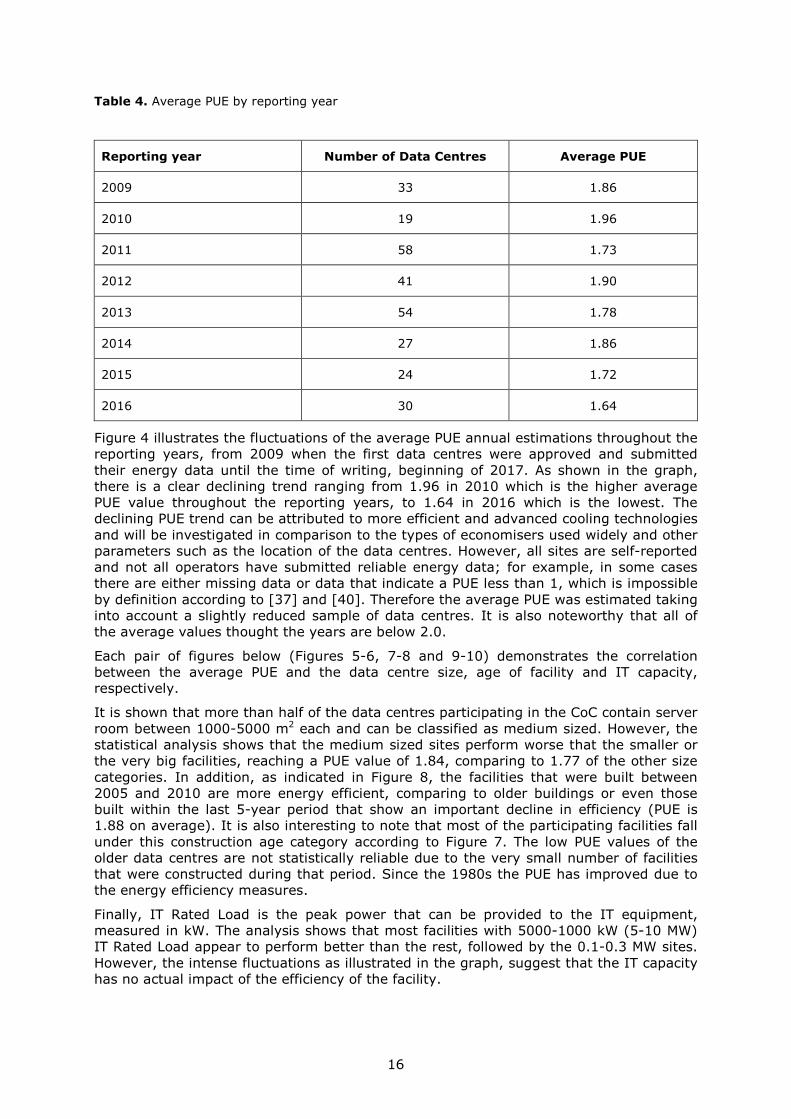
Table 4. Average PUE by reporting year
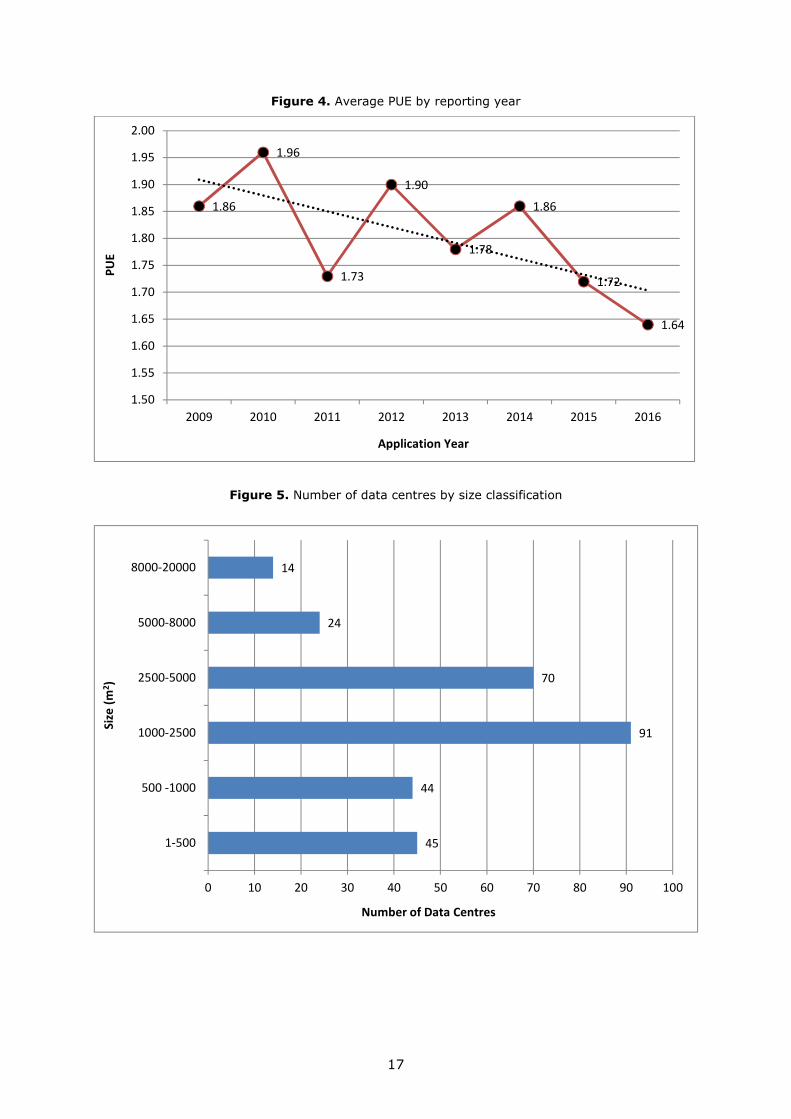
Figure 4 illustrates the fluctuations of the average PUE annual estimations throughout the reporting years, from 2009 when the first data centres were approved and submitted their energy data until the time of writing, beginning of 2017. As shown in the graph, there is a clear declining trend ranging from 1.96 in 2010 which is the higher average PUE value throughout the reporting years, to 1.64 in 2016 which is the lowest. The declining PUE trend can be attributed to more efficient and advanced cooling technologies and will be investigated in comparison to the types of economisers used widely and other parameters such as the location of the data centres. However, all sites are self-reported and not all operators have submitted reliable energy data; for example, in some cases there are either missing data or data that indicate a PUE less than 1, which is impossible by definition according to [37] and [40]. Therefore the average PUE was estimated taking into account a slightly reduced sample of data centres. It is also noteworthy that all of the average values thought the years are below 2.0.
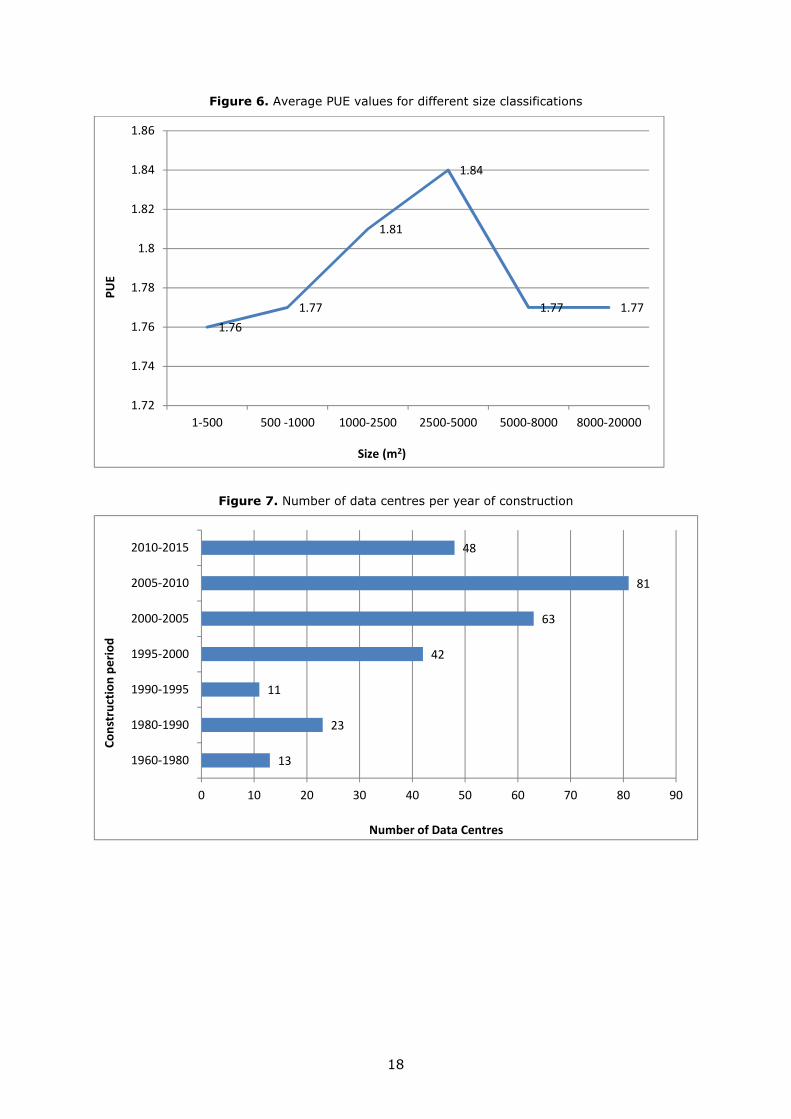
Each pair of figures below (Figures 5-6, 7-8 and 9-10) demonstrates the correlation between the average PUE and the data centre size, age of facility and IT capacity, respectively.
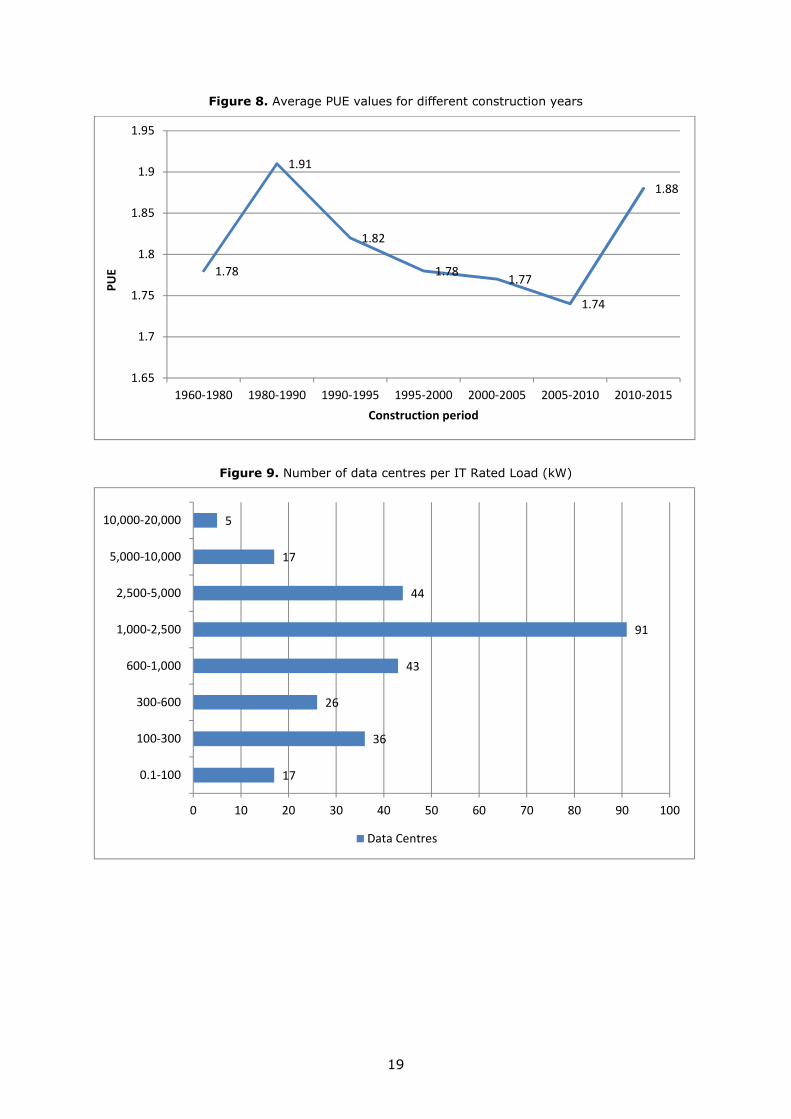
It is shown that more than half of the data centres participating in the CoC contain server room between 1000-5000 m2 each and can be classified as medium sized. However, the statistical analysis shows that the medium sized sites perform worse that the smaller or the very big facilities, reaching a PUE value of 1.84, comparing to 1.77 of the other size categories. In addition, as indicated in Figure 8, the facilities that were built between 2005 and 2010 are more energy efficient, comparing to older buildings or even those built within the last 5-year period that show an important decline in efficiency (PUE is 1.88 on average). It is also interesting to note that most of the participating facilities fall under this construction age category according to Figure 7. The low PUE values of the older data centres are not statistically reliable due to the very small number of facilities that were constructed during that period. Since the 1980s the PUE has improved due to the energy efficiency measures.
Finally, IT Rated Load is the peak power that can be provided to the IT equipment, measured in kW. The analysis shows that most facilities with 5000-1000 kW (5-10 MW) IT Rated Load appear to perform better than the rest, followed by the 0.1-0.3 MW sites. However, the intense fluctuations as illustrated in the graph, suggest that the IT capacity has no actual impact of the efficiency of the facility.
Reporting year Number of Data Centres Average PUE
2009 33 1.86
2010 19 1.96
2011 58 1.73
2012 41 1.90
2013 54 1.78
2014 27 1.86
2015 24 1.72
2016 30 1.64
17
Figure 4. Average PUE by reporting year
Figure 5. Number of data centres by size classification
1.86
1.96
1.73
1.90
1.78
1.86
1.72
1.64
1.50
1.55
1.60
1.65
1.70
1.75
1.80
1.85
1.90
1.95
2.00
2009 2010 2011 2012 2013 2014 2015 2016
PU
E
Application Year
45
44
91
70
24
14
0 10 20 30 40 50 60 70 80 90 100
1-500
500 -1000
1000-2500
2500-5000
5000-8000
8000-20000
Number of Data Centres
Siz
e (
m2)
18
Figure 6. Average PUE values for different size classifications
Figure 7. Number of data centres per year of construction
1.76
1.77
1.81
1.84
1.77 1.77
1.72
1.74
1.76
1.78
1.8
1.82
1.84
1.86
1-500 500 -1000 1000-2500 2500-5000 5000-8000 8000-20000
PU
E
Size (m2)
13
23
11
42
63
81
48
0 10 20 30 40 50 60 70 80 90
1960-1980
1980-1990
1990-1995
1995-2000
2000-2005
2005-2010
2010-2015
Number of Data Centres
Co
nst
ruct
ion
pe
rio
d
19
Figure 8. Average PUE values for different construction years
Figure 9. Number of data centres per IT Rated Load (kW)
1.78
1.91
1.82
1.781.77
1.74
1.88
1.65
1.7
1.75
1.8
1.85
1.9
1.95
1960-1980 1980-1990 1990-1995 1995-2000 2000-2005 2005-2010 2010-2015
PU
E
Construction period
17
36
26
43
91
44
17
5
0 10 20 30 40 50 60 70 80 90 100
0.1-100
100-300
300-600
600-1,000
1,000-2,500
2,500-5,000
5,000-10,000
10,000-20,000
Data Centres

20
Figure 10. Average PUE values for different IT Rated Load classifications (kW)
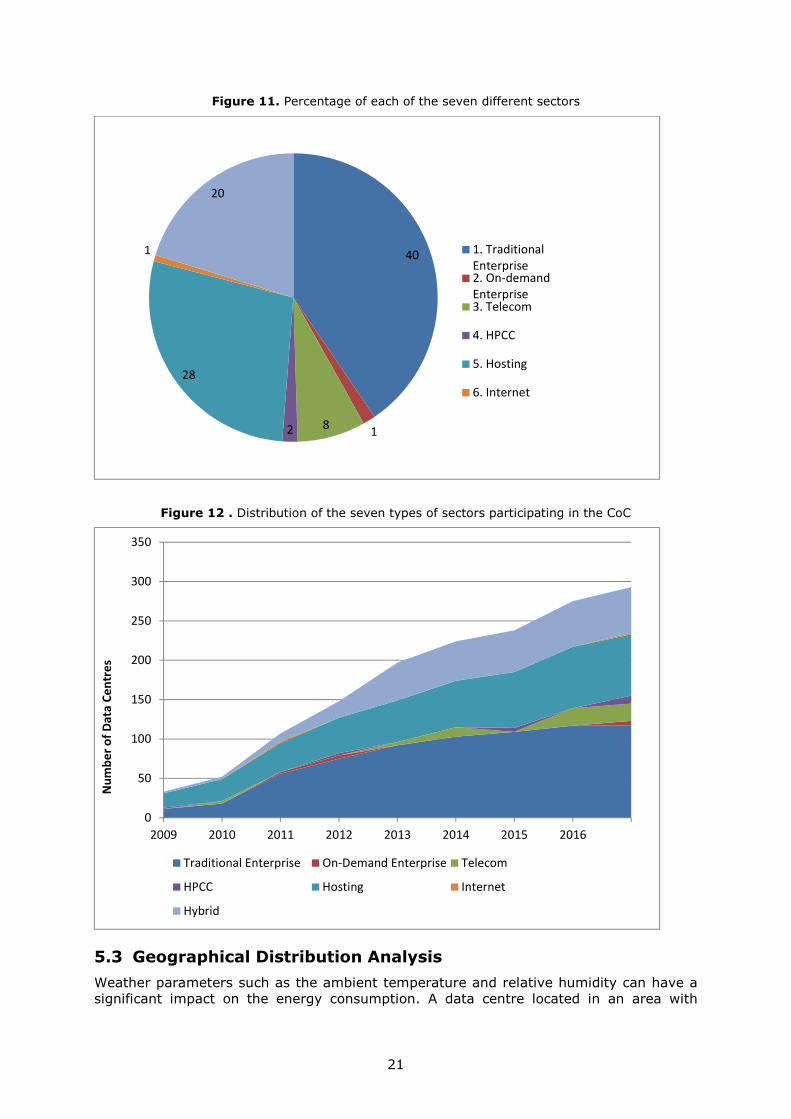
5.2 Sector Distribution Analysis
The Code of Conduct distinguishes between seven different types of data centres, as described in the Reporting form for Participants [35]:
1. Traditional Enterprise: Processes data requirements for data centre owner
2. On Demand Enterprise: Processes and expands data processing capacity, when needed, for numerous customers (this would include batch processing and manufacturing type data processing facilities)
3. Telecom: Telecom Switching Centre
4. High Performance Computing Cluster (HPCC): Scientific and high density data processing
5. Hosting: Sells data processing services to numerous Customers
6. Internet: Provides high capacity processing for large numbers of web clients
7. Hybrid: Combination of two or more of the above
Figures 11 and 12 present the distribution of the data centres by the types of sectors. It is observed that more than one third of the reporting facilities belong to the Traditional Enterprise sector, the type of facility that processes data requirements for data centre owners. In this type of business model the ownership of the facility, IT equipment and software systems are common [1]. The Hosting sector comes second followed by the Hybrid. In a Hosting type of facility, the ownership and the IT equipment is common but the software systems are run by others [1]. In addition, the majority of the data centres (approximately 61%) are stand-alone facilities.
1.73
1.71
1.82
1.88
1.79
1.81
1.67
1.8
1.55
1.6
1.65
1.7
1.75
1.8
1.85
1.9
PU
E
IT Rated Load (kW)
21
Figure 11. Percentage of each of the seven different sectors
Figure 12 . Distribution of the seven types of sectors participating in the CoC
5.3 Geographical Distribution Analysis
Weather parameters such as the ambient temperature and relative humidity can have a significant impact on the energy consumption. A data centre located in an area with
40
182
28
1
20
1. Traditional
Enterprise2. On-demand
Enterprise3. Telecom
4. HPCC
5. Hosting
6. Internet
0
50
100
150
200
250
300
350
2009 2010 2011 2012 2013 2014 2015 2016
Nu
mb
er
of
Da
ta C
en
tre
s
Traditional Enterprise On-Demand Enterprise Telecom
HPCC Hosting Internet
Hybrid
22
extreme temperatures and humidity is expected to consume more energy as the cooling system will be working harder to maintain stable operating conditions within the facility.
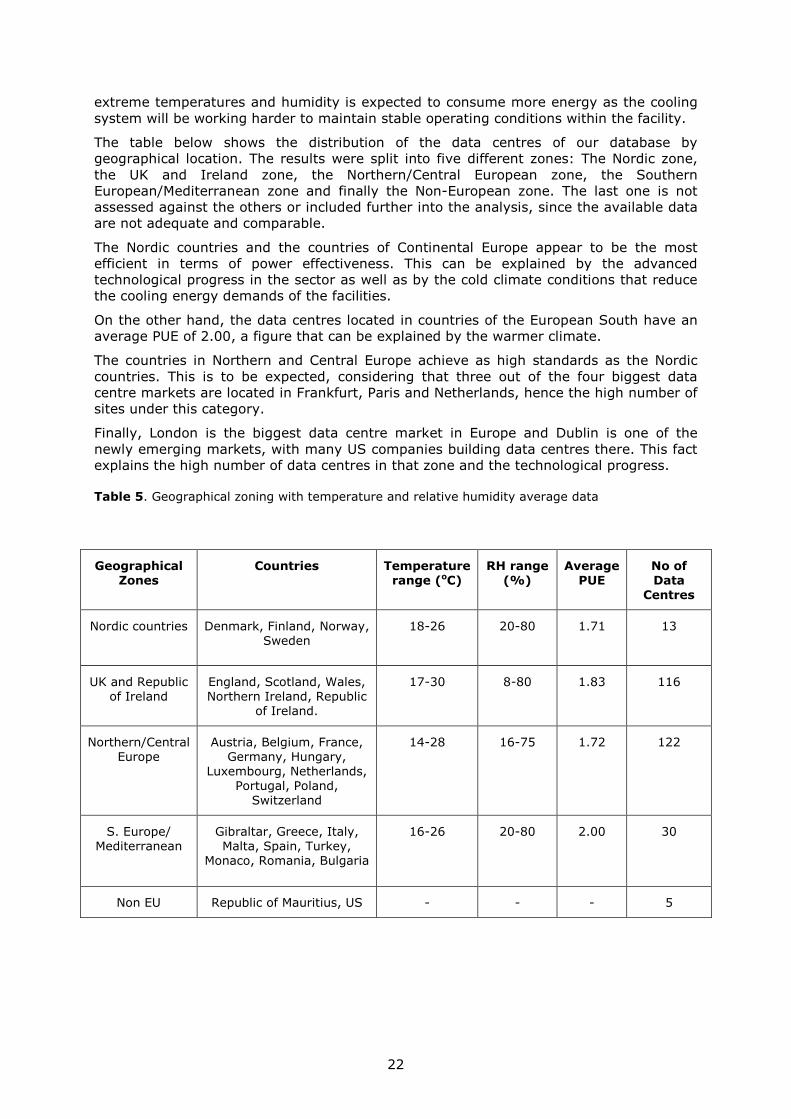
The table below shows the distribution of the data centres of our database by geographical location. The results were split into five different zones: The Nordic zone, the UK and Ireland zone, the Northern/Central European zone, the Southern European/Mediterranean zone and finally the Non-European zone. The last one is not assessed against the others or included further into the analysis, since the available data are not adequate and comparable.
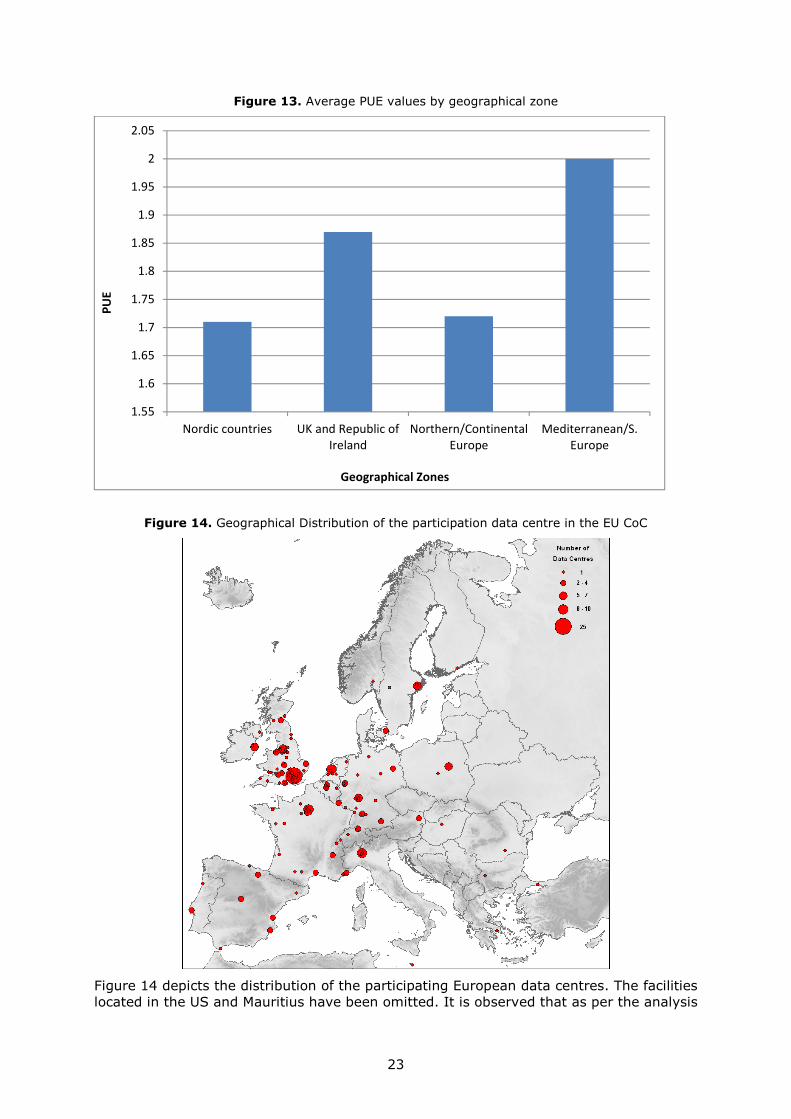
The Nordic countries and the countries of Continental Europe appear to be the most efficient in terms of power effectiveness. This can be explained by the advanced technological progress in the sector as well as by the cold climate conditions that reduce the cooling energy demands of the facilities.
On the other hand, the data centres located in countries of the European South have an average PUE of 2.00, a figure that can be explained by the warmer climate.
The countries in Northern and Central Europe achieve as high standards as the Nordic countries. This is to be expected, considering that three out of the four biggest data centre markets are located in Frankfurt, Paris and Netherlands, hence the high number of sites under this category.
Finally, London is the biggest data centre market in Europe and Dublin is one of the newly emerging markets, with many US companies building data centres there. This fact explains the high number of data centres in that zone and the technological progress.
Table 5. Geographical zoning with temperature and relative humidity average data
Geographical
Zones
Countries Temperature
range (oC)
RH range
(%)
Average
PUE
No of
Data
Centres
Nordic countries Denmark, Finland, Norway, Sweden
18-26 20-80 1.71 13
UK and Republic of Ireland
England, Scotland, Wales, Northern Ireland, Republic
of Ireland.
17-30 8-80 1.83 116
Northern/Central Europe
Austria, Belgium, France, Germany, Hungary,
Luxembourg, Netherlands, Portugal, Poland,
Switzerland
14-28 16-75 1.72 122
S. Europe/ Mediterranean
Gibraltar, Greece, Italy, Malta, Spain, Turkey,
Monaco, Romania, Bulgaria
16-26 20-80 2.00 30
Non EU Republic of Mauritius, US - - - 5
23
Figure 13. Average PUE values by geographical zone
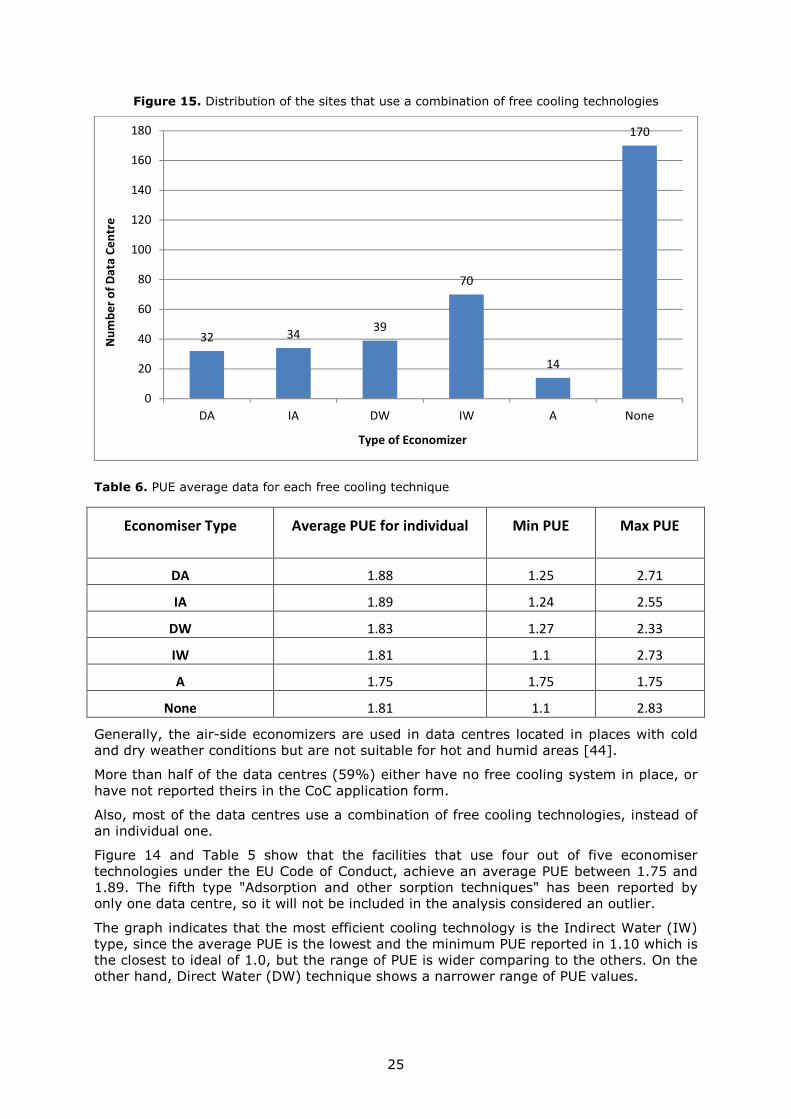
Figure 14. Geographical Distribution of the participation data centre in the EU CoC
Figure 14 depicts the distribution of the participating European data centres. The facilities located in the US and Mauritius have been omitted. It is observed that as per the analysis
1.55
1.6
1.65
1.7
1.75
1.8
1.85
1.9
1.95
2
2.05
Nordic countries UK and Republic of
Ireland
Northern/Continental
Europe
Mediterranean/S.
Europe
PU
E
Geographical Zones

24
outlined in Table 2, the places with the greater data centre densities are the London, Amsterdam, Frankfurt, Paris and Milan areas and the surroundings, where in fact, the largest data centre marktes in Europe are based.
5.4 Free Cooling Technologies
Free cooling, also known as economizer cycle, takes advantage of the outside dry and cool climate conditions to cooling cost savings through the refrigeration compressor workload reduction required to operate the chillers [13]. When the ambient temperature is sufficiently lower than the facility temperature, the heat naturally flows to the outside without the use of vapour-compression refrigeration system, offering significant energy savings [41]. Free or economised cooling designs use cool ambient conditions to meet part or all of the facilities cooling requirements hence compressor work for cooling is reduced or removed, which can result in significant energy reduction. Economised cooling can be retrofitted to some facilities. The opportunities for the utilisation of free cooling are increased in cooler and dryer climates and where increased temperature set points are used. Where refrigeration plant can be reduced in size (or eliminated), operating and capital costs are reduced, including that of supporting electrical infrastructure [42].
According to [43], there are four fundamental types of free cooling technologies that operate in the facilities either individually or more often, combined:
● Direct Air (DA) free cooling: External air is used to cool the facility. Refrigeration systems are present to deal with humidity and high external temperatures if necessary. Exhaust air is re-circulated and mixed with intake air to control supply air temperature and humidity.
This design tends to have the lowest temperature difference between external temperature and IT supply air.
● Indirect Air (IA) free cooling: Re-circulated air within the facility is primarily passed through an air to air heat exchanger against external air (may have adiabatic cooling) to remove heat to the atmosphere.
This design tends to have a low temperature difference between external temperature and IT supply.
● Direct Water (DW) free cooling: Chilled water cooled by the external ambient air via a free cooling coil. This may be achieved by dry coolers or by evaporative assistance through spray onto the dry coolers.
This design tends to have a medium temperature difference between external temperature and IT supply air.
● Indirect Water (IW) free cooling: Chilled water is cooled by the external ambient conditions via a heat exchanger which is used between the condenser and chilled water circuits. This may be achieved by cooling towers or dry coolers, the dry coolers might have evaporative assistance through spray onto the coolers.
This design tends to have a higher temperature difference between external temperature and IT supply air restricting the economiser hours available and increasing energy overhead.
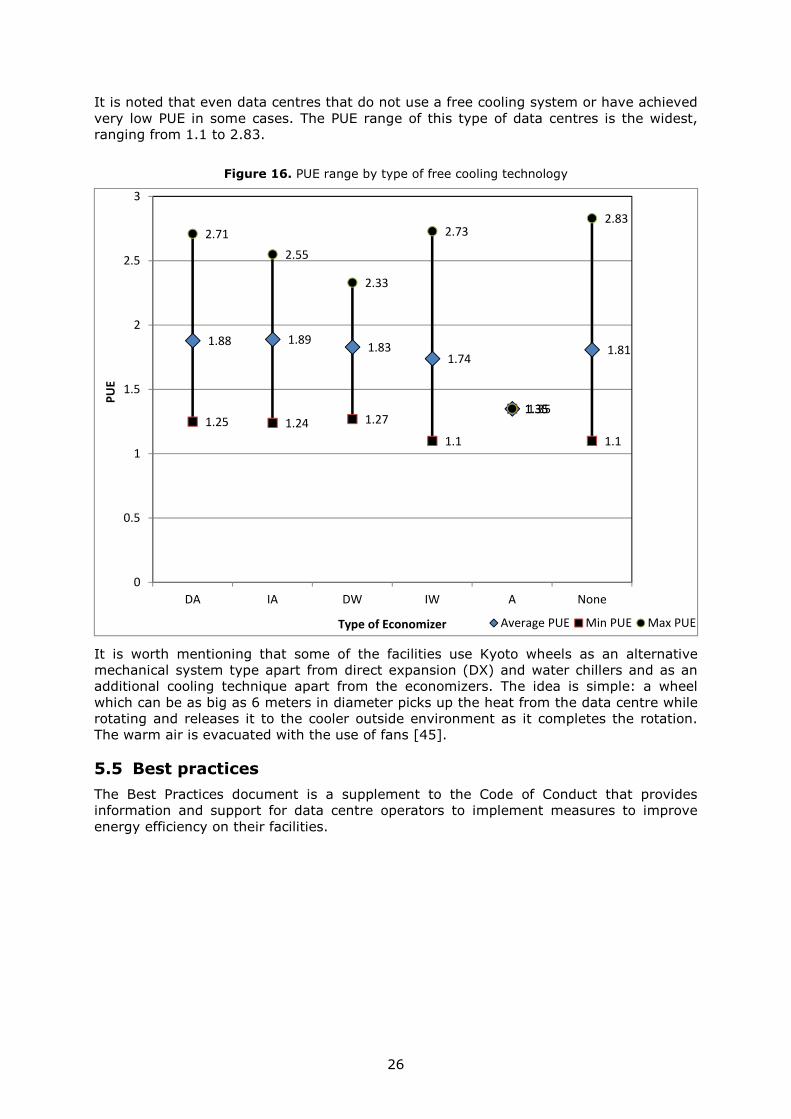
Figure 13 provides a graphic representation of the number of sites that operate each of the aforementioned technologies. The analysis was performed in 288 facilities that have been granted the Participant status and submitted their best practices description.
25
Figure 15. Distribution of the sites that use a combination of free cooling technologies
Table 6. PUE average data for each free cooling technique
Generally, the air-side economizers are used in data centres located in places with cold and dry weather conditions but are not suitable for hot and humid areas [44].
More than half of the data centres (59%) either have no free cooling system in place, or have not reported theirs in the CoC application form.
Also, most of the data centres use a combination of free cooling technologies, instead of an individual one.
Figure 14 and Table 5 show that the facilities that use four out of five economiser technologies under the EU Code of Conduct, achieve an average PUE between 1.75 and 1.89. The fifth type "Adsorption and other sorption techniques" has been reported by only one data centre, so it will not be included in the analysis considered an outlier.
The graph indicates that the most efficient cooling technology is the Indirect Water (IW) type, since the average PUE is the lowest and the minimum PUE reported in 1.10 which is the closest to ideal of 1.0, but the range of PUE is wider comparing to the others. On the other hand, Direct Water (DW) technique shows a narrower range of PUE values.
32 3439
70
14
170
0
20
40
60
80
100
120
140
160
180
DA IA DW IW A None
Nu
mb
er
of
Da
ta C
en
tre
Type of Economizer
Economiser Type Average PUE for individual Min PUE Max PUE
DA 1.88 1.25 2.71
IA 1.89 1.24 2.55
DW 1.83 1.27 2.33
IW 1.81 1.1 2.73
A 1.75 1.75 1.75
None 1.81 1.1 2.83
26
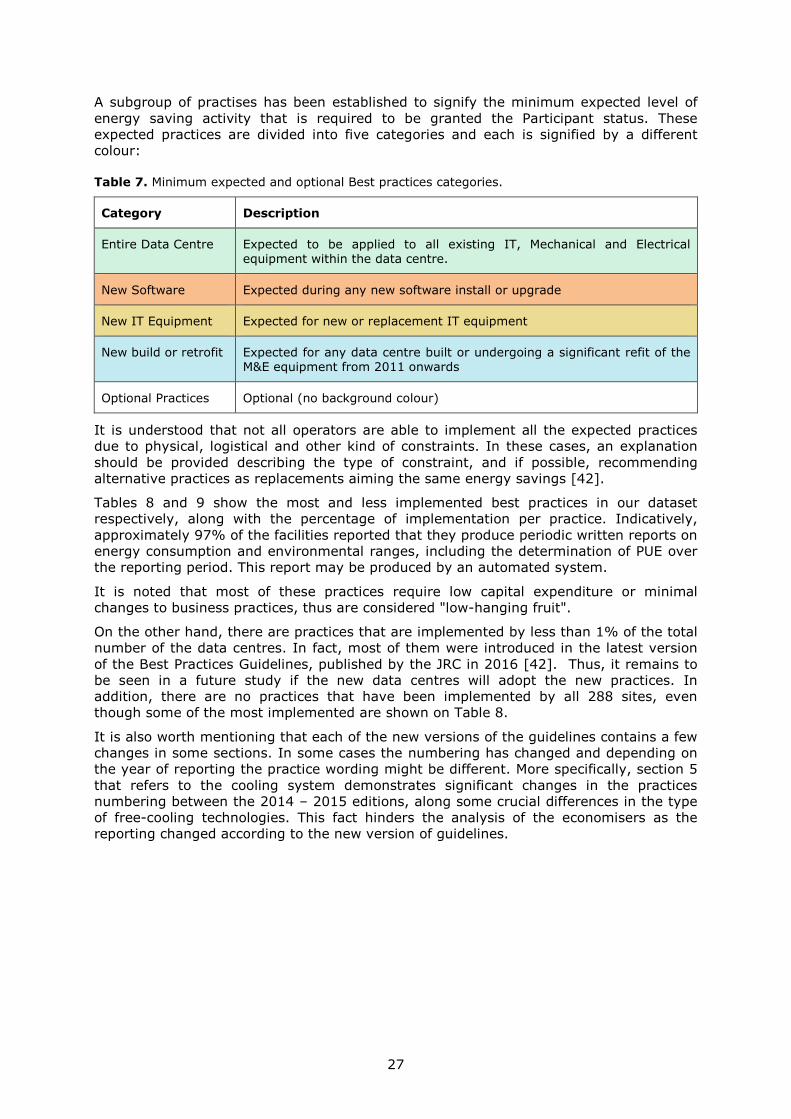
It is noted that even data centres that do not use a free cooling system or have achieved very low PUE in some cases. The PUE range of this type of data centres is the widest, ranging from 1.1 to 2.83.
Figure 16. PUE range by type of free cooling technology
It is worth mentioning that some of the facilities use Kyoto wheels as an alternative mechanical system type apart from direct expansion (DX) and water chillers and as an additional cooling technique apart from the economizers. The idea is simple: a wheel which can be as big as 6 meters in diameter picks up the heat from the data centre while rotating and releases it to the cooler outside environment as it completes the rotation. The warm air is evacuated with the use of fans [45].
5.5 Best practices
The Best Practices document is a supplement to the Code of Conduct that provides information and support for data centre operators to implement measures to improve energy efficiency on their facilities.
1.88 1.891.83
1.74
1.35
1.81
1.25 1.24 1.27
1.1
1.35
1.1
2.71
2.55
2.33
2.73
1.35
2.83
0
0.5
1
1.5
2
2.5
3
DA IA DW IW A None
PU
E
Type of Economizer Average PUE Min PUE Max PUE
27
A subgroup of practises has been established to signify the minimum expected level of energy saving activity that is required to be granted the Participant status. These expected practices are divided into five categories and each is signified by a different colour:
Table 7. Minimum expected and optional Best practices categories.
Category Description
Entire Data Centre Expected to be applied to all existing IT, Mechanical and Electrical equipment within the data centre.
New Software Expected during any new software install or upgrade
New IT Equipment Expected for new or replacement IT equipment
New build or retrofit Expected for any data centre built or undergoing a significant refit of the M&E equipment from 2011 onwards
Optional Practices Optional (no background colour)
It is understood that not all operators are able to implement all the expected practices due to physical, logistical and other kind of constraints. In these cases, an explanation should be provided describing the type of constraint, and if possible, recommending alternative practices as replacements aiming the same energy savings [42].
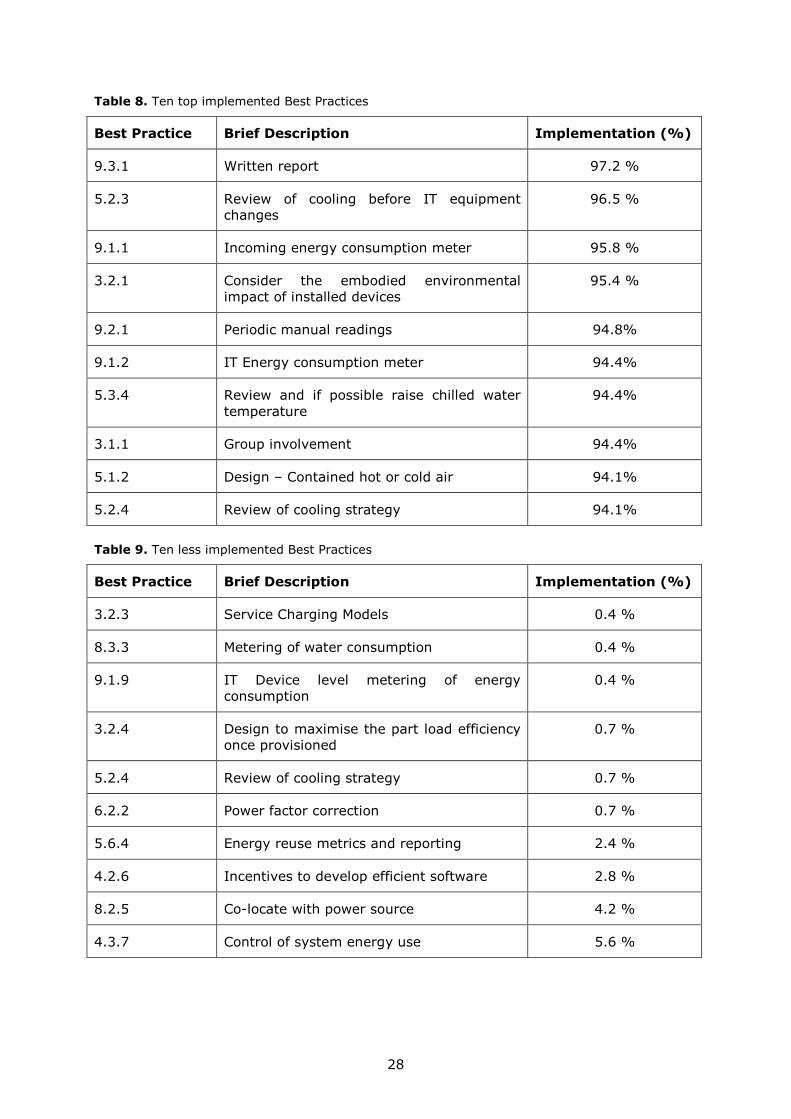
Tables 8 and 9 show the most and less implemented best practices in our dataset respectively, along with the percentage of implementation per practice. Indicatively, approximately 97% of the facilities reported that they produce periodic written reports on energy consumption and environmental ranges, including the determination of PUE over the reporting period. This report may be produced by an automated system.
It is noted that most of these practices require low capital expenditure or minimal changes to business practices, thus are considered "low-hanging fruit".
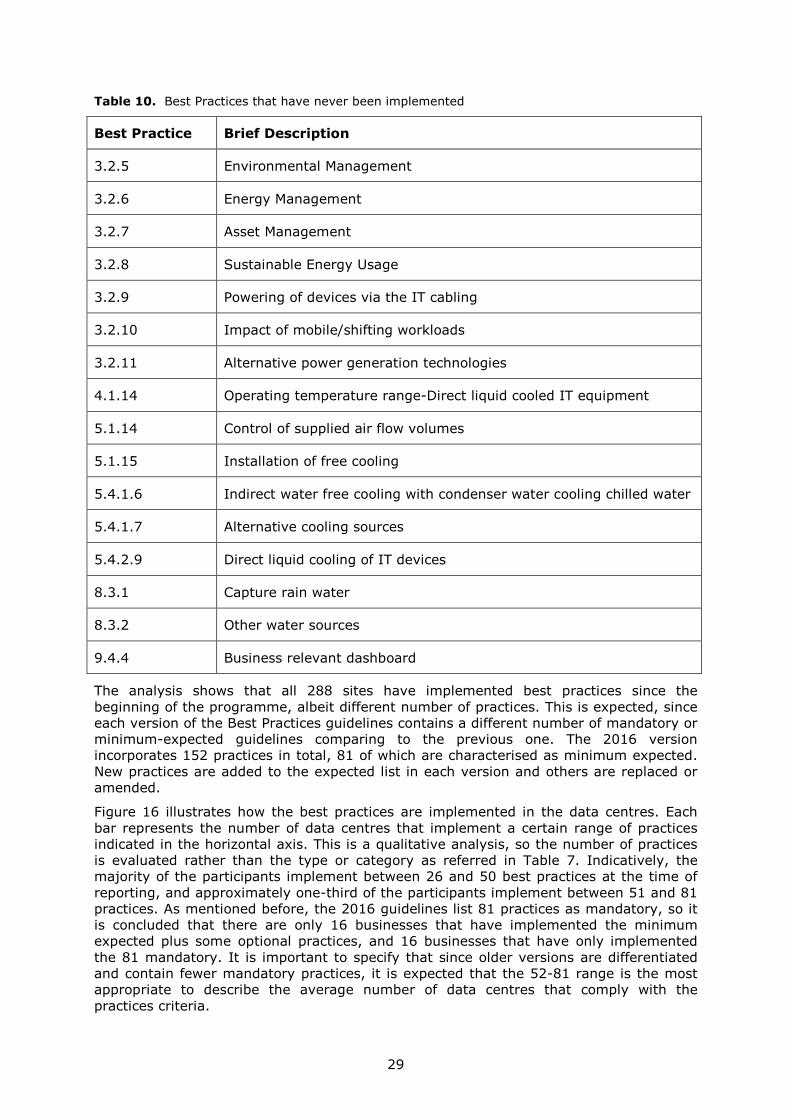
On the other hand, there are practices that are implemented by less than 1% of the total number of the data centres. In fact, most of them were introduced in the latest version of the Best Practices Guidelines, published by the JRC in 2016 [42]. Thus, it remains to be seen in a future study if the new data centres will adopt the new practices. In addition, there are no practices that have been implemented by all 288 sites, even though some of the most implemented are shown on Table 8.
It is also worth mentioning that each of the new versions of the guidelines contains a few changes in some sections. In some cases the numbering has changed and depending on the year of reporting the practice wording might be different. More specifically, section 5 that refers to the cooling system demonstrates significant changes in the practices numbering between the 2014 – 2015 editions, along some crucial differences in the type of free-cooling technologies. This fact hinders the analysis of the economisers as the reporting changed according to the new version of guidelines.
28
Table 8. Ten top implemented Best Practices
Best Practice Brief Description Implementation (%)
9.3.1 Written report 97.2 %
5.2.3 Review of cooling before IT equipment changes
96.5 %
9.1.1 Incoming energy consumption meter 95.8 %
3.2.1 Consider the embodied environmental impact of installed devices
95.4 %
9.2.1 Periodic manual readings 94.8%
9.1.2 IT Energy consumption meter 94.4%
5.3.4 Review and if possible raise chilled water temperature
94.4%
3.1.1 Group involvement 94.4%
5.1.2 Design – Contained hot or cold air 94.1%
5.2.4 Review of cooling strategy 94.1%
Table 9. Ten less implemented Best Practices
Best Practice Brief Description Implementation (%)
3.2.3 Service Charging Models 0.4 %
8.3.3 Metering of water consumption 0.4 %
9.1.9 IT Device level metering of energy consumption
0.4 %
3.2.4 Design to maximise the part load efficiency once provisioned
0.7 %
5.2.4 Review of cooling strategy 0.7 %
6.2.2 Power factor correction 0.7 %
5.6.4 Energy reuse metrics and reporting 2.4 %
4.2.6 Incentives to develop efficient software 2.8 %
8.2.5 Co-locate with power source 4.2 %
4.3.7 Control of system energy use 5.6 %
29
Table 10. Best Practices that have never been implemented
Best Practice Brief Description
3.2.5 Environmental Management
3.2.6 Energy Management
3.2.7 Asset Management
3.2.8 Sustainable Energy Usage
3.2.9 Powering of devices via the IT cabling
3.2.10 Impact of mobile/shifting workloads
3.2.11 Alternative power generation technologies
4.1.14 Operating temperature range-Direct liquid cooled IT equipment
5.1.14 Control of supplied air flow volumes
5.1.15 Installation of free cooling
5.4.1.6 Indirect water free cooling with condenser water cooling chilled water
5.4.1.7 Alternative cooling sources
5.4.2.9 Direct liquid cooling of IT devices
8.3.1 Capture rain water
8.3.2 Other water sources
9.4.4 Business relevant dashboard
The analysis shows that all 288 sites have implemented best practices since the beginning of the programme, albeit different number of practices. This is expected, since each version of the Best Practices guidelines contains a different number of mandatory or minimum-expected guidelines comparing to the previous one. The 2016 version incorporates 152 practices in total, 81 of which are characterised as minimum expected. New practices are added to the expected list in each version and others are replaced or amended.
Figure 16 illustrates how the best practices are implemented in the data centres. Each bar represents the number of data centres that implement a certain range of practices indicated in the horizontal axis. This is a qualitative analysis, so the number of practices is evaluated rather than the type or category as referred in Table 7. Indicatively, the majority of the participants implement between 26 and 50 best practices at the time of reporting, and approximately one-third of the participants implement between 51 and 81 practices. As mentioned before, the 2016 guidelines list 81 practices as mandatory, so it is concluded that there are only 16 businesses that have implemented the minimum expected plus some optional practices, and 16 businesses that have only implemented the 81 mandatory. It is important to specify that since older versions are differentiated and contain fewer mandatory practices, it is expected that the 52-81 range is the most appropriate to describe the average number of data centres that comply with the practices criteria.

30
In general, the analysis shows that after 2015 the data centres that apply for the Code of Conduct Participant status already implement more practices than those that participated when the programme first started. This fact could be indicative of the technological trends towards a more energy efficient way of operating a facility, with more significant energy and financial savings.
Figure 17. Frequency of the best practices implementations
7
173
89
14
2
0
20
40
60
80
100
120
140
160
180
200
1-25 BP 26-50 BP 51-81 BP 82-100 BP 101-152 BP
Nu
mb
er
of
Da
ta C
en
tre
s
Number of Best practices
31
6 Conclusions
The study focuses on the emerging trends in energy efficiency in data centres, as evaluated using the data submitted voluntarily by various companies under the Code of Conduct for Data Centre Energy Efficiency. The number of participating data centres that have claimed the Participant status is astounding having reached the 345 applications so far. It must be noted that this is a unique study not only because of the size of the database but also in terms of reliability, it is based on real data, instead of estimations.
The Code of Conduct is the only European independent programme that promotes data centres energy efficiency best practices and monitors the energy consumption. It is acknowledged as a successful example of a non-regulatory policy to improve energy efficiency in data centres that has stimulated efficiency improvement is data centres. Every year, the number of companies applying for the Participant Status increases.
The analysis shows that the average PUE of the facilities participating in the programme is declining year after year, reaching the value 1.64 in 2016. The total energy consumption so far of all the 289 approved Participants is approximately 3.7 TWh and the average annual electricity consumption has declined since the last survey in 2014. There is a number of facilities that already achieve PUE equal or below 1.2.
In addition, the PUE is compared against various parameters such as the facility size, the construction year and the Rated IT Electrical Load. It is concluded that either the very small or very large size data centres of the sample achieve the best PUE. As for the other parameters, the facilities that were built in the period between 2005 and 2010 and have an average of 5-10 MW capacity perform the best.
Furthermore, as expected, the data centres located in Scandinavia and Northern Europe are more energy efficient, mainly due to the cooler ambient conditions that facilitate economizer use. It derives that the type of economizer that contributes the most to energy savings is the Indirect Water type, followed by the Direct Water.
Finally, regarding the best practices implementation, most data centre of the dataset implement between 26 and 50 practices, significantly less that the mandatory number of 81, as required by the latest guidelines. However, the participants of the recent years appear to perform better and implement more practices comparing to the past participants, and most of those practices are the most cost-effective and with the shortest payback period.
The future research task linked to the dataset is to track the efficiency improvements of each data centre over time and examine the operational or infrastructure changes.
The Code of Conduct is one of the most successful policies to improve energy efficiency in data centres in the EU, and it could be easily replicated in other countries and regions based on the EU experience.
32
References
[1] Oró E, Depoorter V, Garcia A, Salom J. Energy efficiency and renewable energy integration in data centres. Strategies and modelling review. Renewable and Sustainable Energy Review 2015; 42: 429-445.
[2] Tatchell-Evans M, Kapur N, Summers J, Thompson H, Oldham D. An experimental and theoretical investigation of the extent of bypass air within data centres employing aisle containment, and its impact on power consumption. Applied Energy 2017; 186: 457-469.
[3] UNFCCC. ICT Helping Tackle Climate Change Could Help Cut Global Emissions 20% by 2030. 2016. Available at: http://newsroom.unfccc.int/unfccc-newsroom/ict-sector-helping-to-tackle-climate-change/ [Accessed: February 2017]
[4] Whitehead B, Andrews D, Shah A, Maidment G. Assessing the environmental impact of data centres Part 1: Background, energy use and metrics. Building and Environment 2014; 82: 151-159.
[5] Rong H, Zhang H, Xiao S, Li C, Hu C. Optimizing energy consumption for data centres. Renewable and Sustainable Energy Reviews 2016; 58: 674-691.
[6] Ni J, Bai X. A review of air conditioning energy performance in data centres. Renewable and Sustainable Energy Reviews 2017; 67:625-640.
[7] Bertoldi P, Hirl B, Labanca N. Energy Efficiency Status Report 2012. Electricity Consumption and Efficiency Trends in the EU-27. European Commission, Joint Research Centre 2012. Available at: http://publications.jrc.ec.europa.eu/repository/handle/JRC69638 [Accessed: November 2016]
[8] Bertoldi P. A Market Transformation Programme for Improving Energy Efficiency in Data Centres. ACEEE Summer Study on Energy Efficiency in Buildings; 2014: 9.14-9.26
[9] Koomey, J. Worldwide Electricity used in Data Centres. Environmental Research Letters 2008; 3: 8.
[10] Van Heddeghem W, Lambert S, Lannoo B, Colle D, Pickavet M, Demeester P. Trends in worldwide ICT electricity consumption from 2007 to 2012. Computer Communications 2014; 50: 67-76.
[11] Beaty DL. Internal IT Load. Profile Variability. ASHRAE Journal 2013; 72-74.
[12] Capozzoli A, Primiceri G. Cooling Systems in data centres: state of art and emerging technologies. Energy Procedia 2015; 83: 484-493.
[13] Khalaj A H, Scherer T, Halgamuge S K. Energy, environmental and economical saving potential of data centres with various economizers across Australia. Applied Energy 2016; 183: 1528-1549.
[14] Sadler R. Video demand drives up global CO2 emissions. 2017, January 31. Retrieved from: http://climatenewsnetwork.net/video-demand-drives-global-co2-emissions/ [Accessed: February 2017]
[15] Directive 2010/31/EU of the European parliament and of the council of 19 May 2010 on the energy performance of buildings. Off. J. Eur. Union 2010, 3, 124–146.
[16] Acclimatise. Climate Change Risks to Data Centres; 2008. www.acclimatise.uk.com/login/uploaded/resources/AcclimatiseDataCentres.pdf [Accessed : February 2017].
[17] Peterson M. Is PUE Still Above 2.0 for Most Data Centres? 2015, February 19. Message posted to: http://www.vertatique.com/no-one-can-agree-typical-pue [Accessed: November 2017]

33
[18] Le Fevre S, Leclercq M. Data centres establishment policy. The Amsterdam region as Green Data Port. 2013; Gemeente Amsterdam. Dienst Ruimtelijke Ordening.
[19] CBRE. CBRE Marketview. European Data Centres, Q3 2016.
[20] Fryer E. The Donald Runsfelf Guide to Data Centre Energy Consumption: The Known Knowns, the Known Unknowns and the Unknown Unknowns. 2016, May; First published by BroadGroup for DataCloud Europe 2016.
[21] TechUK. Climate Change Agreement (CCA) for Data Centres. Target Period One: Report on findings. 2014; Retrieved from TechUK Website: www.techuk.org/images/CCA_First_Target_Report_final.pdf [Accessed: November 2017]
[22] Hintemann R. Energy Consumption of Data Centres continues to increase – 2015 update. Borderstep Institute. 2015; Retrieved from Borderstep Institute Website: https://www.borderstep.de/wp-content/uploads/2015/01/Borderstep_Energy_Consumption_2015_Data_Centers_16_12_2015.pdf [Accessed: November 2017]
[23] Frankfurt becomes the first data centre market to reach 30MW in a year. 2016, November 28; retrieved from: https://digitalisationworld.com/article/50043/1 [Accessed: November 2017]
[24] Hintemann R, Clausen J. Rechenzentren in Deutschland: Eine Studie zur Darstellung der wirtschaftlichen Bedeutung und Wettbewerbssituation. Studie im Auftrag des Bundesverbandes Informationswirtschaft, Telekommunikation und neue Medien e.V. (BITKOM). Berlin. [Data centers in Germany: A study on the economic significance and the competitive situation.] 2014; retrieved from: https://www.bitkom.org/Bitkom/Publikationen/Rechenzentren-in-Deutschland-Wirtschaftliche-Bedeutung-und-Wettbewerbssituation.html [Accessed: February 2017]
[25] Jones P, Duncan R. Executive Overview: Paris Multi-Tenant Datacentre and Hosting Market. 2016; retrieved from: https://451research.com/report-long?icid=3712&task=download&file=summary [Accessed: November 2017]
[26] Dutch Data Centre Association. Dutch Data Centre Report 2015. State of the Dutch Data Centres. 2015; retrieved from: www.dutchdatacenters.nl/dutch-data-center-report.html [Accessed: February 2017]
[27] Dutch Data Centre Association. Dutch Data Centre Report 2016. State of the Dutch Data Centres. The new foundation. 2016; retrieved from: www.dutchdatacenters.nl/dutch-data-center-report.html [Accessed: February 2017]
[28] Kontzer T. Data Centres Operators Flock to Cold Climates. 2013, September; retrieved from: http://www.networkcomputing.com/data-centers/data-center-operators-flock-cold-climates/1697156413 [Accessed: February 2017]
[29] Smolaks M. Nordic data centre market expected to triple power by 2017. 2015, September 10; retrieved from: http://www.datacenterdynamics.com/content-tracks/design-build/nordic-data-center-market-expected-to-triple-power-by-2017/94767.fullarticle [Accessed: February 2017]
[30] Howard-Healy M. Data Centre Market Europe. 2016; retrieved from: https://datacenter.eco.de/wp-content/blogs.dir/13/files/160119_broadgroup.pdf [Accessed: February 2017]
[31] Synergy Research Group Hyperscale Data Centre Count Passes the 300 Milestone in December. 2016, December 19; retrieved from: https://www.srgresearch.com/articles/hyperscale-data-center-count-passes-300-milestone-december [Accessed: February 2017]
[32] Shehabi A, Smith S, Sartor D, Brown R, Herrlin M, Koomey J, Masanet E, Horner N, Azevedo I, Lintner W. United States Data Centre Energy Usage Report. 2016; retrieved
34
from: https://eta.lbl.gov/sites/all/files/publications/lbnl-1005775_v2.pdf [Accessed: February 2017]
[33] Data Centres 'Going Green' to reduce a carbon footprint larger than the airline industry. 2017, 27 January; retrieved from: https://data-economy.com/data-centers-going-green-to-reduce-a-carbon-footprint-larger-than-the-airline-industry/ [Accessed: February 2017]
[34] Rezessy S, Bertoldi P. Voluntary agreements in the field of energy efficiency and emission reduction: Review and analysis of experiences in the European Union. Energy Policy 2011; 39: 7121-7129.
[35] European Commission. Code of Conduct on Data Centres Energy Efficiency. Version 2.0. Participant Guidelines and Registration Form. 2009; Retrieved from: http://iet.jrc.ec.europa.eu/energyefficiency/ict-codes-conduct/data-centres-energy-efficiency [Accessed: February 2017]
[36] European Commission. EU Code of Conduct on Data Centre Energy Efficiency. Introductory Guide for all applicants. Version 3.1.2. 2016; Retrieved from: http://iet.jrc.ec.europa.eu/energyefficiency/ict-codes-conduct/data-centres-energy-efficiency [Accessed: February 2017]
[37] Sharma M, Arunachalam K, Sharma D. Analysing the data center efficiency by using PUE to make data centers more energy efficient by reducing the electrical consumption and exploring new strategies. Procedia Computer Science 2015; 48: 142-148.
[38] Koomey J. Growth in Data Centre electricity use 2005-2010. A report by Analytical Press, completed at the request of the New York Times; 2011. Available from: http://www.analyticspress.com/datacenters.html [Accessed: February 2017]
[39] Uptime Institute. 2013 Data Centre Industry Survey. Uptime Institute, 2013.
[40] The Green Grid. Harmonizing Global Metrics for Data Centre Energy Efficiency. 2014; Available at: http://iet.jrc.ec.europa.eu/energyefficiency/ict-codes-conduct/data-centres-energy-efficiency [Accessed: February 2017]
[41] Zhang H, Shao S, Xu H, Zou H, Tian C. Free cooling of data centres: A review. Renewable and Sustainable Energy Reviews 2014, 35; 171-182.
[42] Newcombe, L., Acton, M., Bertoldi, P., Booth, J., Flucker, S., Rouyer, A. (2016) 2016 Best Practices Guidelines for the EU Code of Conduct on Data Centre Energy Efficiency. Version 7.1.2. Retrieved from: http://iet.jrc.ec.europa.eu/energyefficiency/ict-codes-conduct/data-centres-energy-efficiency [Accessed: February 2017]
[43] Newcombe L, Acton M, Booth J, Flucker S, Rabbetts A, Strutt S, Rouyer A, Tozer R. 2013 Best Practices for the EU Code of Conduct on Data Centres. Version 4.0.5. 2013. Retrieved from: http://iet.jrc.ec.europa.eu/energyefficiency/ict-codes-conduct/data-centres-energy-efficiency [Accessed: February 2017]
[44] Depoorter, V., Oró, E., Salom, J. (2015) The location as an energy efficiency and renewable energy supply measure for data centres in Europe. Applied Energy, 140, pp. 338-349.
[45] McFarlane R. Look to the Kyoto wheel to maximize free data center cooling. 2010, July. Retrieved from: http://searchdatacenter.techtarget.com/tip/Look-to-the-Kyoto-wheel-to-maximize-free-data-center-cooling [Accessed: February 2017]
[46] Depoorter V, Oró E, Salom J. The location as an energy efficiency and renewable energy supply measure for data centres in Europe. Applied Energy 2015; 140: 338-349.
[47] European Commission (2016). EU Code of Conduct on Data Centre Energy Efficiency. Introductory Guide for all applicants. Version 3.1.2. Retrieved from: http://iet.jrc.ec.europa.eu/energyefficiency/ict-codes-conduct/data-centres-energy-efficiency

35
[48] Directive 2010/31/EU of the European parliament and of the council of 19 May 2010 on the energy performance of buildings. Off. J. Eur. Union 2010, 3, 124–146.
[49] CLOUDSCENE website: https://cloudscene.com/search/data-centers?searchTerm=&pDc=1&pSp=1&pFb=1&pMar=1&sDc=providers&sSp=pops&sFb=markets&sMar=facilities ]Accessed on 9 November 2017]
36
List of abbreviations and definitions
BP Best Practice
CAGR Compound Annual Growth Rate
CCA Climate Change Agreement
CoC Code of Conduct
CRAC Control Room Air Conditioning (unit)
CRAH Control Room Air Handler (unit)
DA Direct Air
DC Data Centre
DW Direct Water
IA Indirect Air
IW Indirect Water
RH Relative Humidity
HPCC High-Performance Computing Cluster
HVAC Heating, Ventilation and Air-Conditioning
ICT Information and Communication Technology
IT Information Technology
PUE Power Utilisation Effectiveness
37
List of figures
Figure 1. Energy consumption of servers and data centres in Germany from 2010 to 2015 and forecast to 2025 ...................................................................................... 7
Figure 2. Global Hyperscale Data Centre Operators .................................................. 9
Figure 3. PUE values ranges. ................................................................................15
Figure 4. Average PUE by reporting year ................................................................17
Figure 5. Number of data centres by size classification. ............................................17
Figure 6. Average PUE values for different size classifications. ..................................18
Figure 7. Number of data centres per year of construction........................................18
Figure 8. Average PUE values for different construction years. ..................................19
Figure 9. Number of data centres per IT Rated Load (kW). .......................................19
Figure 10. Average PUE values for different IT Rated Load classifications (kW). ..........20
Figure 11. Percentage of each of the seven different sectors. ...................................21
Figure 12 . Distribution of the seven types of sectors participating in the CoC. ............21
Figure 13. Average PUE values by geographical zone ...............................................23
Figure 14. Geographical Distribution of the participation data centre in the EU CoC. ....23
Figure 15. Distribution of the sites using a combination of free cooling technologies. ...25
Figure 16. PUE range by type of free cooling technology ..........................................26
Figure 17. Frequency of the best practices implementations. ....................................30
38
List of tables
Table 1. Data centres in Western Europe ................................................................. 5
Table 2. Number of data centres by size category and growth rates ............................ 7
Table 3. Average data of reporting facilities ............................................................15
Table 4. Average PUE by reporting year .................................................................16
Table 5. Geographical zoning with temperature and relative humidity average data .....22
Table 6. PUE average data for each free cooling technique .......................................25
Table 7. Minimum expected and optional Best practices categories. ...........................27
Table 8. Ten top implemented Best Practices ..........................................................28
Table 9. Ten less implemented Best Practices .........................................................28
Table 10. Best Practices that have never been implemented ....................................29

GETTING IN TOUCH WITH THE EU
In person
All over the European Union there are hundreds of Europe Direct information centres. You can find the address of the centre nearest you at: http://europea.eu/contact
On the phone or by email
Europe Direct is a service that answers your questions about the European Union. You can contact this service:
- by freephone: 00 800 6 7 8 9 10 11 (certain operators may charge for these calls),
- at the following standard number: +32 22999696, or
- by electronic mail via: http://europa.eu/contact
FINDING INFORMATION ABOUT THE EU
Online
Information about the European Union in all the official languages of the EU is available on the Europa website at: http://europa.eu
EU publications You can download or order free and priced EU publications from EU Bookshop at: http://bookshop.europa.eu. Multiple copies of free publications may be obtained by contacting Europe Direct or your local information centre (see http://europa.eu/contact).

KJ-N
A-2
8874-E
N-N
doi:10.2760/358256
ISBN 978-92-79-76445-5