trends in asthma morbidity and mortality (september 2012)
TRANSCRIPT
Trends in Asthma Morbidity and Mortality
American Lung Association
Epidemiology and Statistics Unit
Research and Health Education Division
September 2012
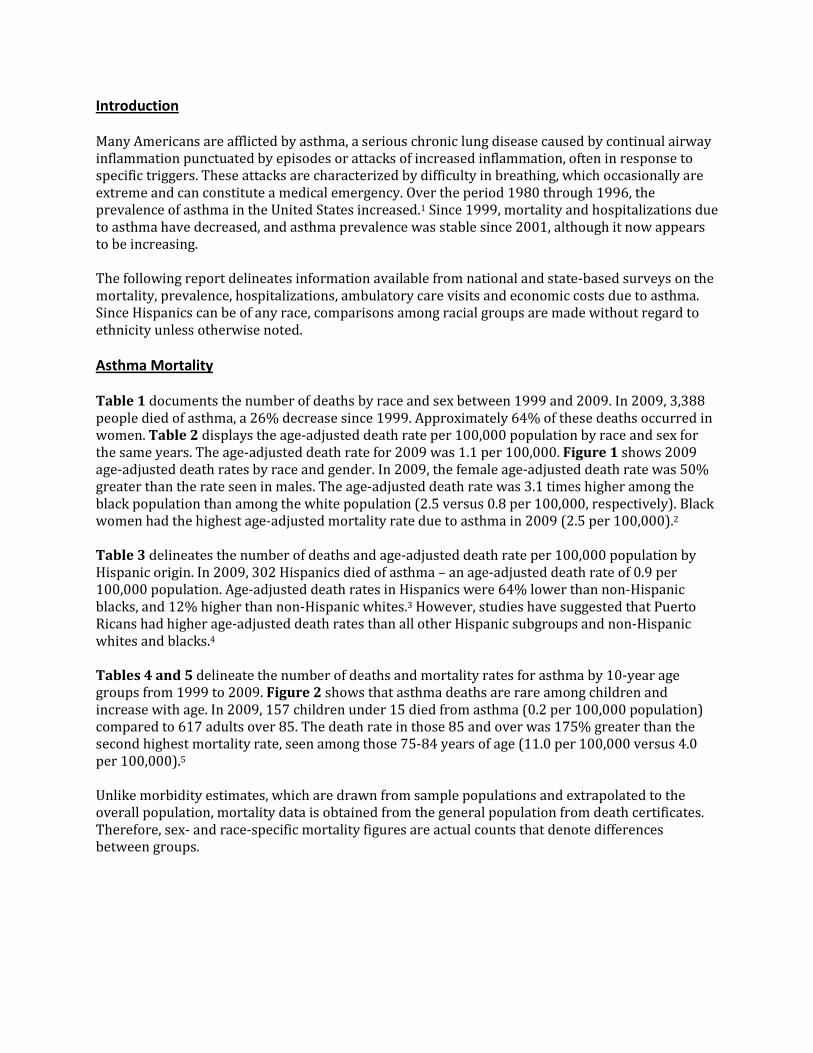
Table of Contents
Asthma Mortality, 1999-2009
Asthma Prevalence, 2001-2011
Asthma Hospital Discharges, 1989-2010
Asthma Ambulatory Care Visits, 1989-2010
Glossary and References
List of Tables and Figures
Table 1: Asthma – Number of Deaths by Race and Sex, 1999-2009
Table 2: Asthma – Age-Adjusted Death Rate per 100,000 population, by Race and Sex, 1999-2009
Figure 1: Asthma – Age-Adjusted Death Rates by Race and Sex, 2009
Table 3: Asthma – Number of Deaths and Age-Adjusted Death Rate per 100,000 population by Ethnic Origin and Sex,
1999-2009
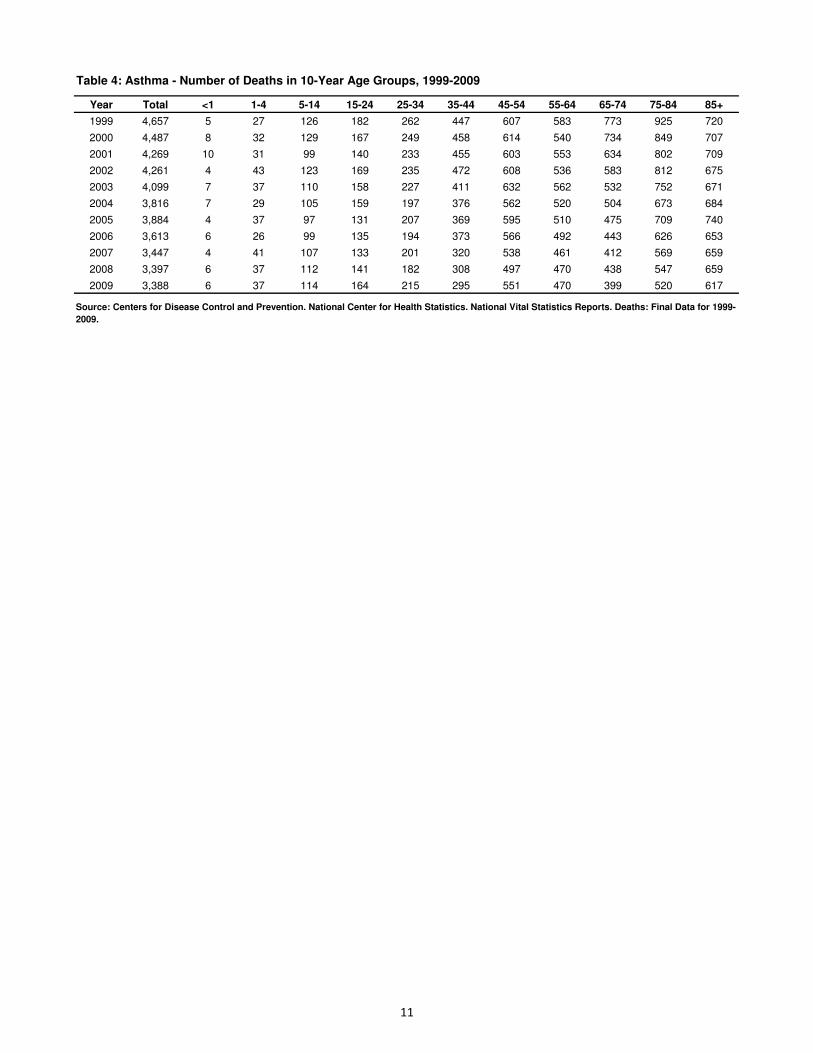
Table 4: Asthma – Number of Deaths in 10-Year Age Groups, 1999-2009
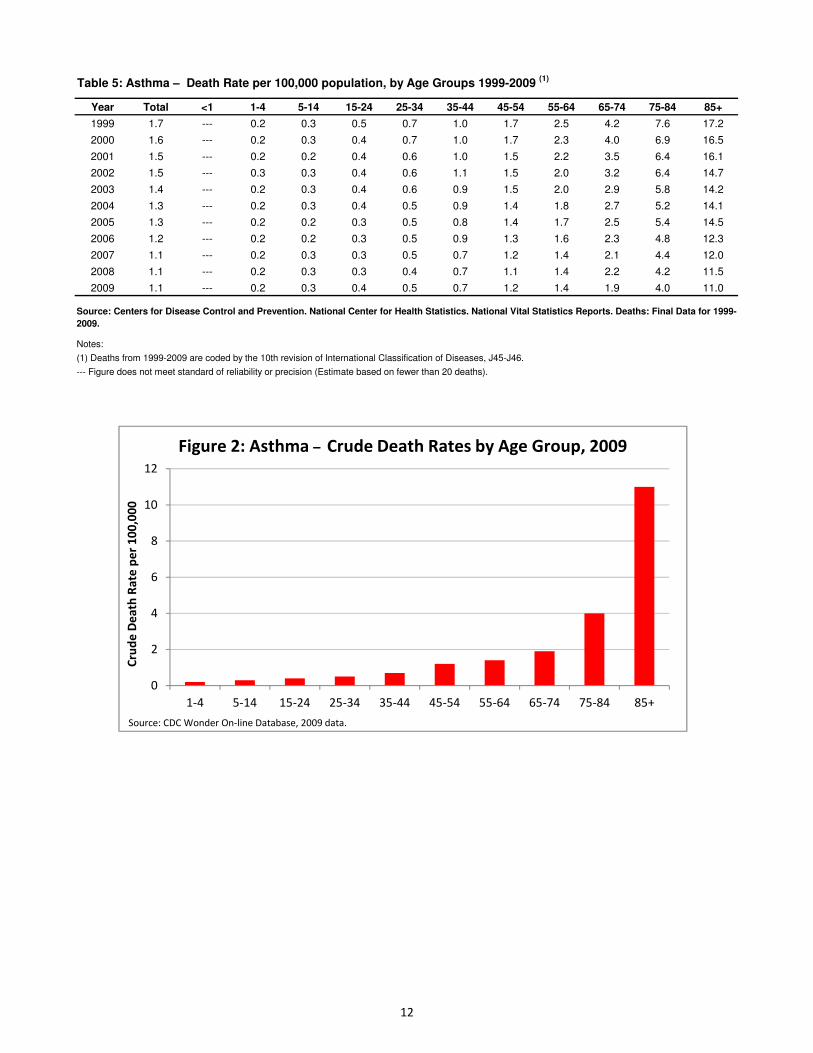
Table 5: Asthma – Death Rate per 100,000 population, by Age Group, 1999-2009
Figure 2: Asthma – Crude Death Rates by Age Group, 2009
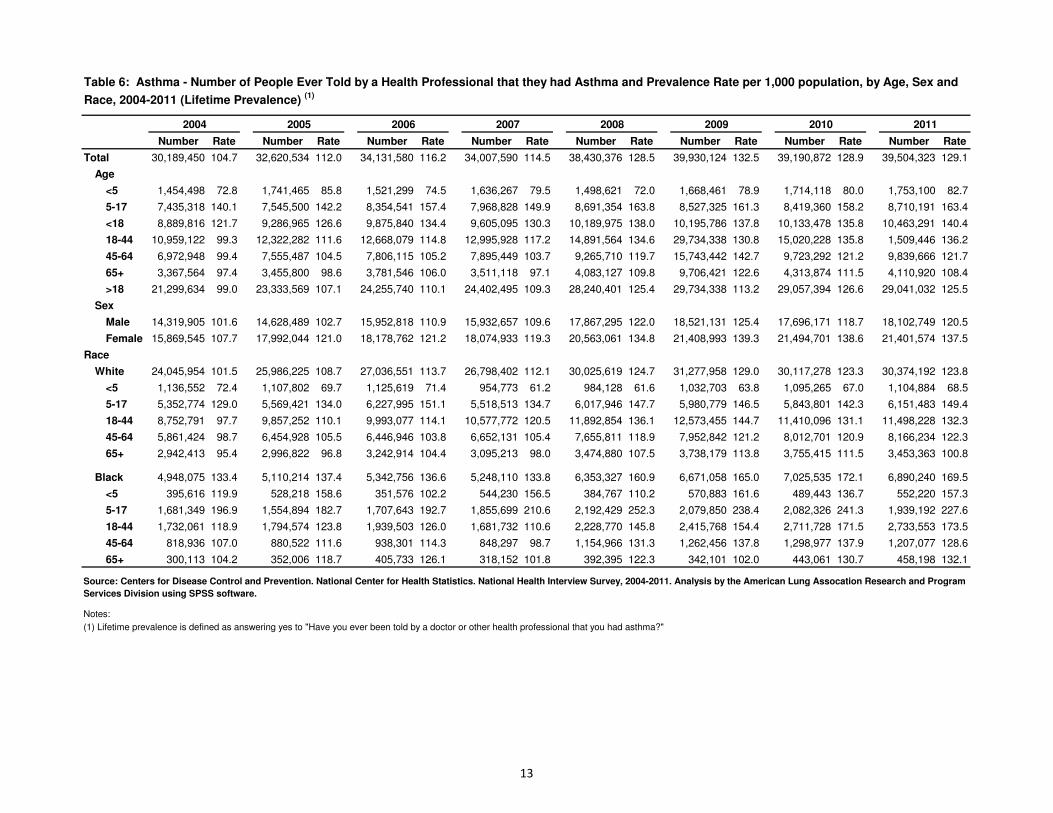
Table 6: Asthma – Number of People Ever Told by a Health Professional that they had Asthma and Prevalence Rate per
1,000 population, by Age, Sex and Race, 2004-2011 (Lifetime Prevalence)
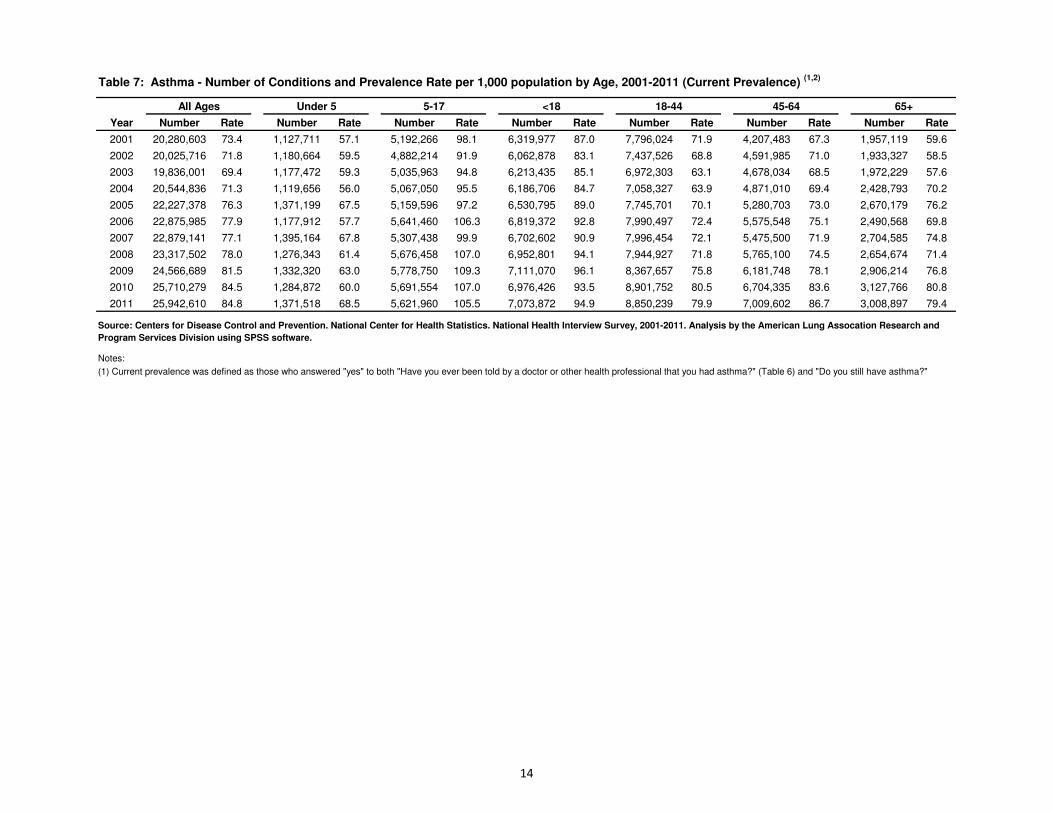
Table 7: Asthma – Number of Conditions and Prevalence Rate per 1,000 population by Age, 2001-2011 (Current
Prevalence)
Table 8: Asthma – Number of Conditions and Prevalence Rate per 1,000 population by Sex, 2001-2011 (Current
Prevalence)
Figure 3: Asthma – Current Prevalence Rate per 1,000 by Sex and Age, 2011
Table 9: Asthma – Number of Conditions and Prevalence Rate per 1,000 population by Race and Age, 2001-2011
(Current Prevalence)
Table 10: Asthma – Number of People Who Had an Asthma Attack or Episode and Prevalence Rate per 1,000 population
by Age, Sex and Race, 2004-2011 (Attack Prevalence)
Table 11: Asthma – Number of Conditions and Prevalence Rate per 1,000 population by Ethnic Origin, 2001-2011
Table 12: Asthma – Number of Conditions and Prevalence Rate (%) in Children and Adults by State and Period, 2011
Figure 4: Asthma – Current Adult Prevalence (%) by State, 2011
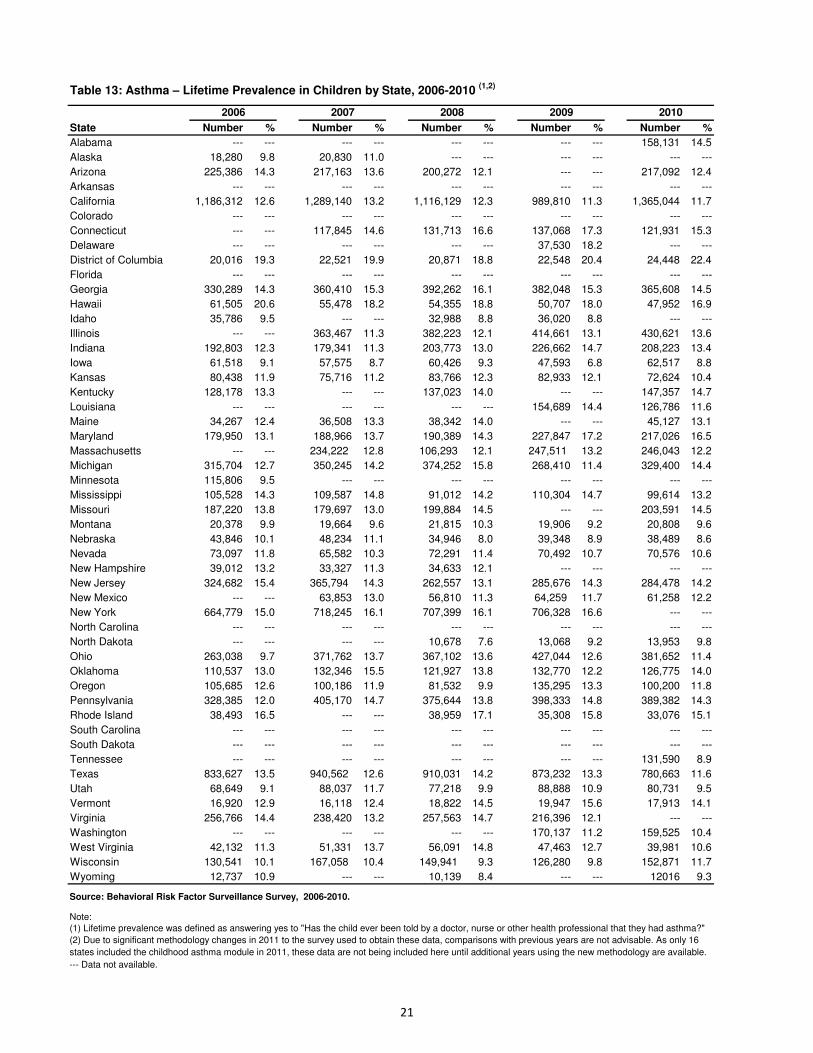
Table 13: Asthma – Lifetime Prevalence in Children by State, 2006-2010
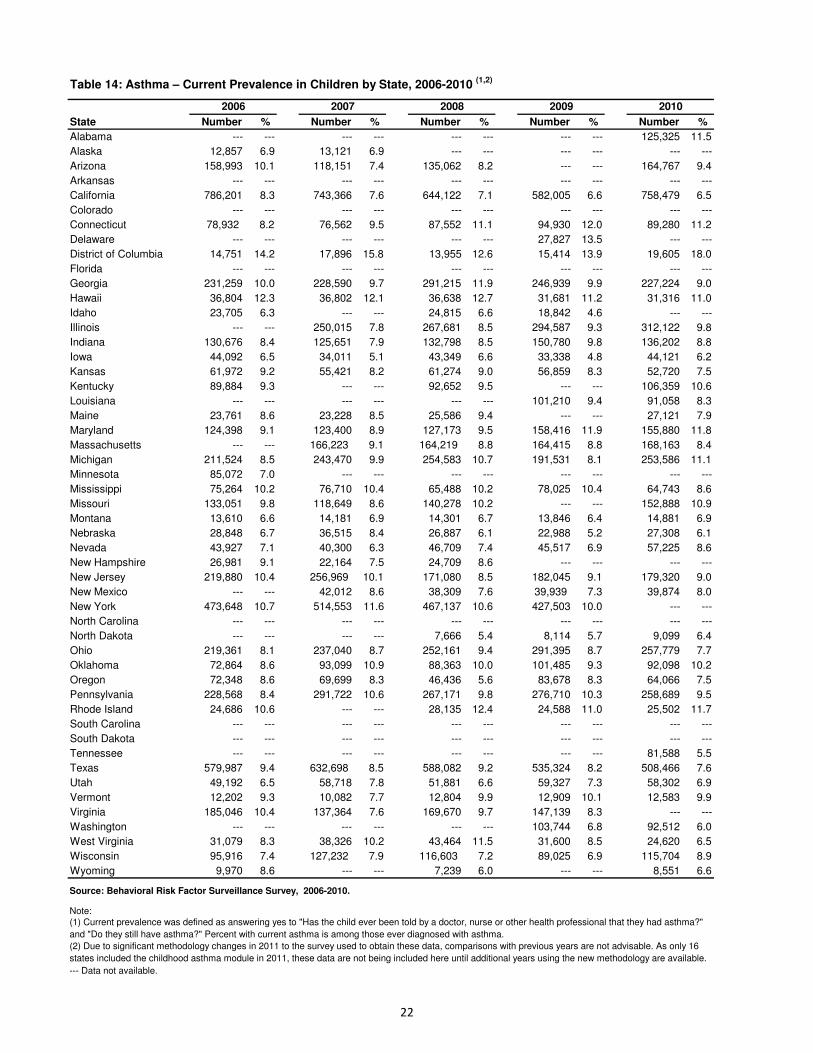
Table 14: Asthma – Current Prevalence in Children by State, 2006-2010
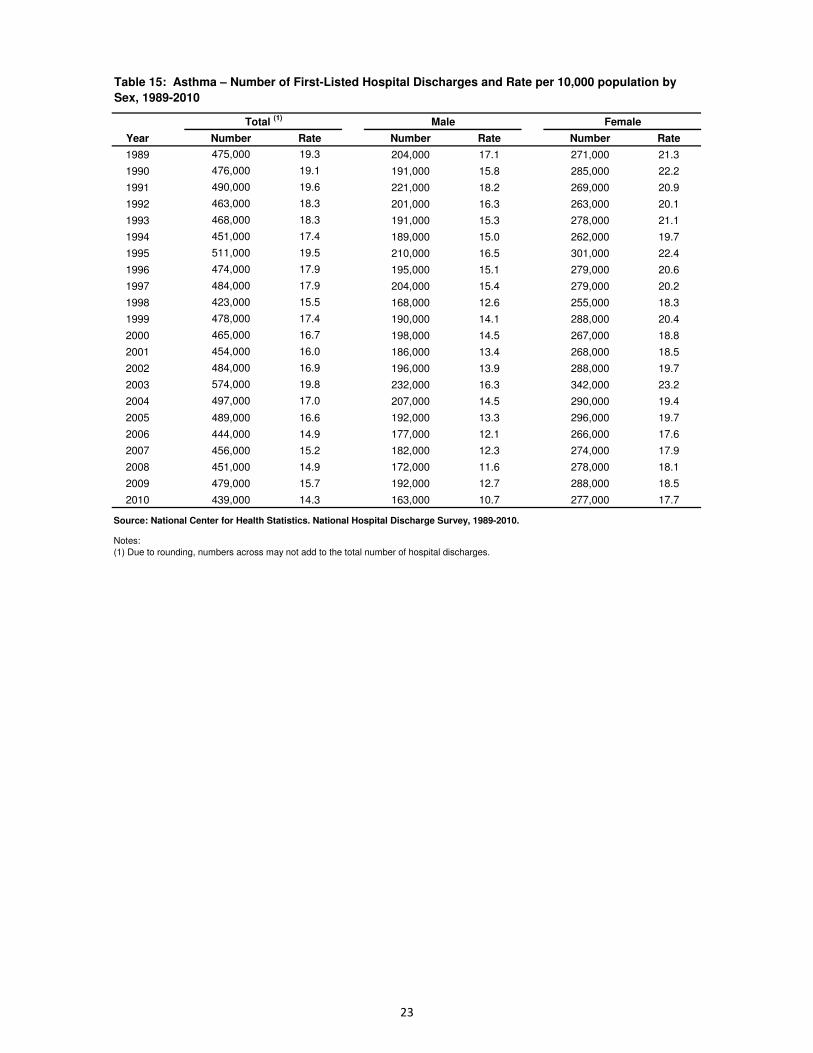
Table 15: Asthma – Number of First-Listed Hospital Discharges and Rate per 10,000 population by Sex, 1989-2010
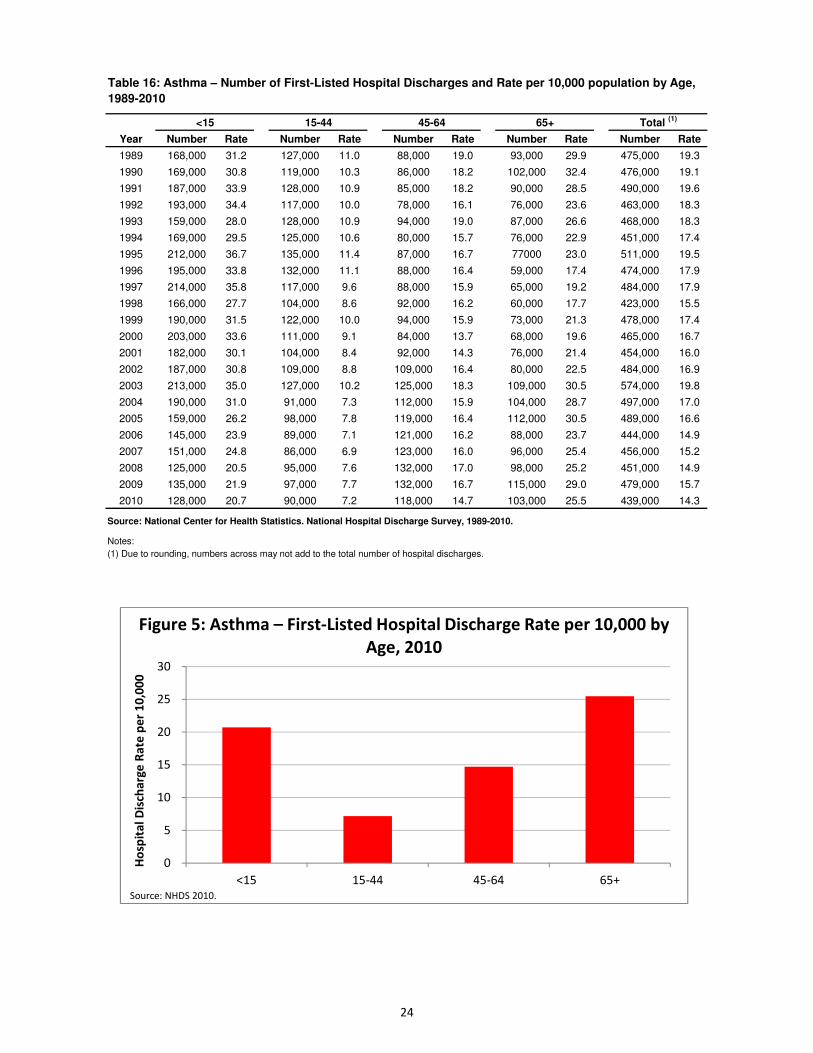
Table 16: Asthma – Number of First-Listed Hospital Discharges and Rate per 10,000 population by Age, 1989-2010
Figure 5: Asthma – First-Listed Hospital Discharge Rate per 10,000 by Age, 2010
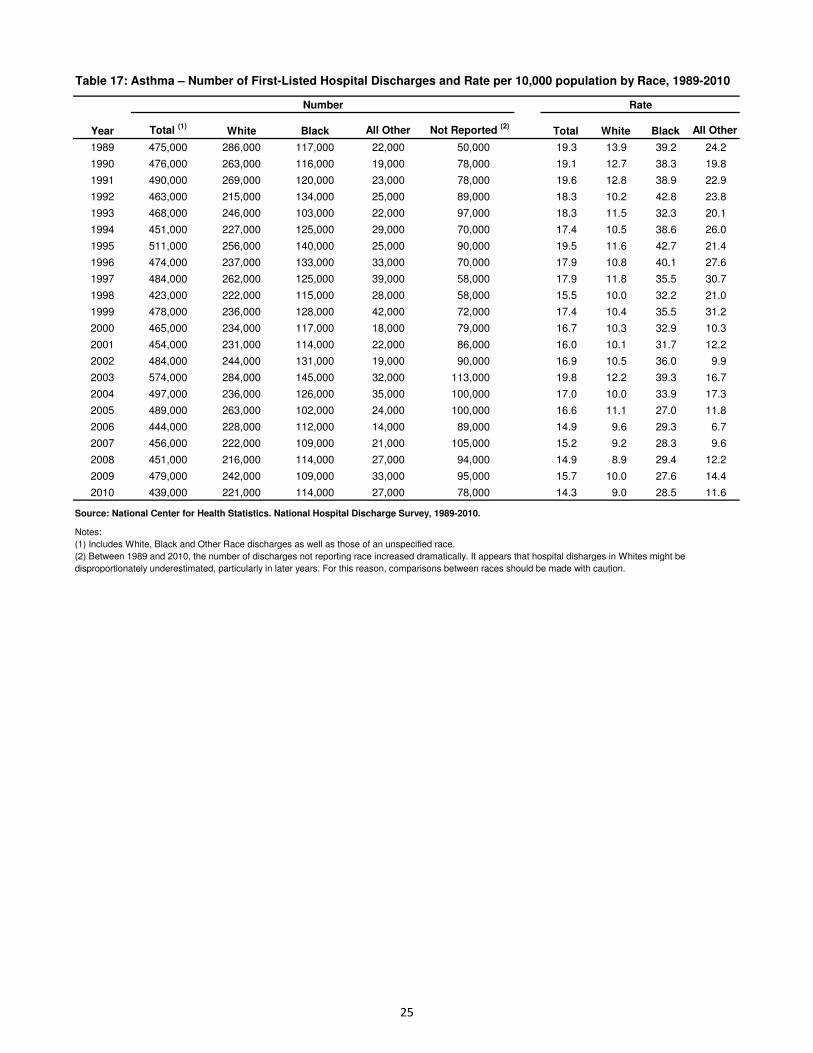
Table 17: Asthma – Number of First-Listed Hospital Discharges and Rate per 10,000 population by Race, 1989-2010
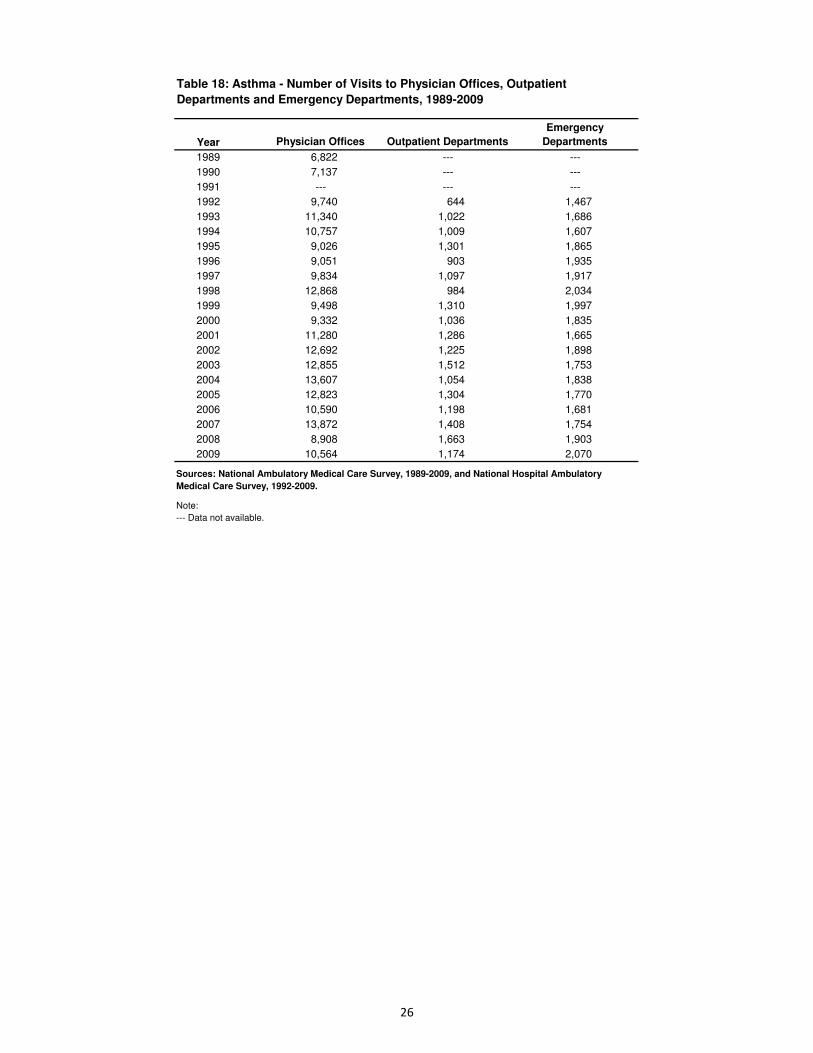
Table 18: Asthma – Number of Visits to Physician Offices, Outpatient Departments and Emergency Departments, 1989-
2009
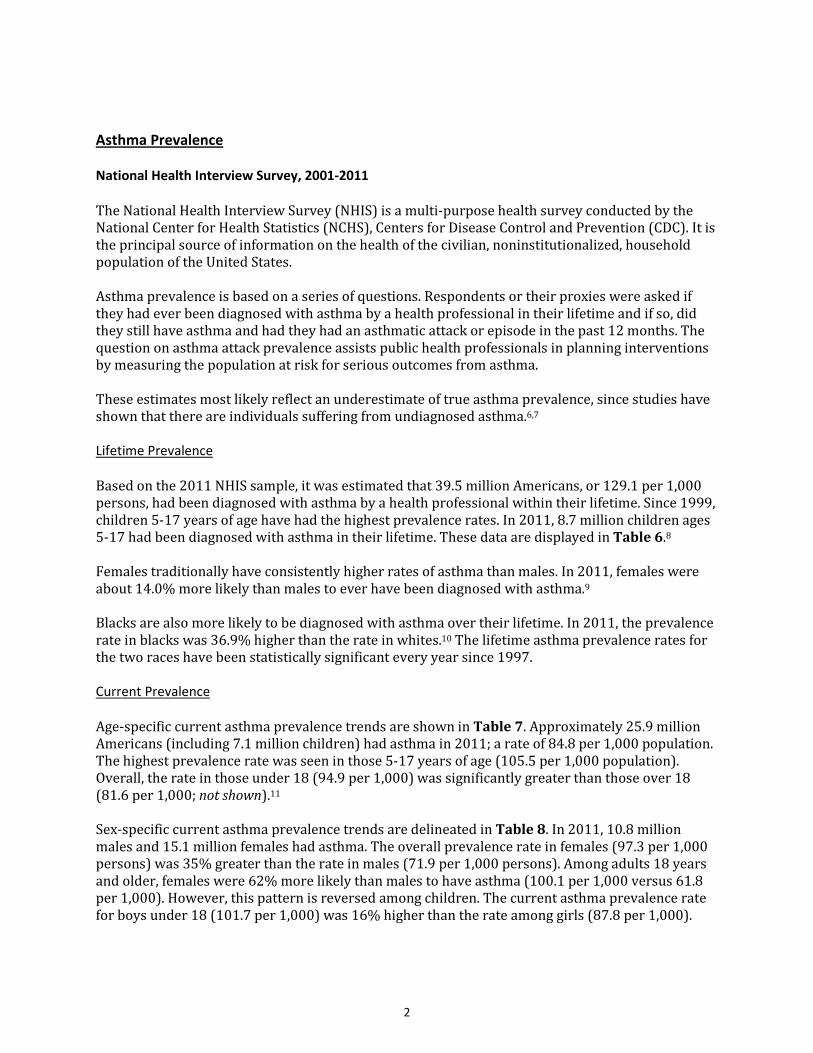
Introduction
Many Americans are afflicted by asthma, a serious chronic lung disease caused by continual airway inflammation punctuated by episodes or attacks of increased inflammation, often in response to specific triggers. These attacks are characterized by difficulty in breathing, which occasionally are extreme and can constitute a medical emergency. Over the period 1980 through 1996, the prevalence of asthma in the United States increased.1 Since 1999, mortality and hospitalizations due to asthma have decreased, and asthma prevalence was stable since 2001, although it now appears to be increasing. The following report delineates information available from national and state-based surveys on the mortality, prevalence, hospitalizations, ambulatory care visits and economic costs due to asthma. Since Hispanics can be of any race, comparisons among racial groups are made without regard to ethnicity unless otherwise noted.
Asthma Mortality
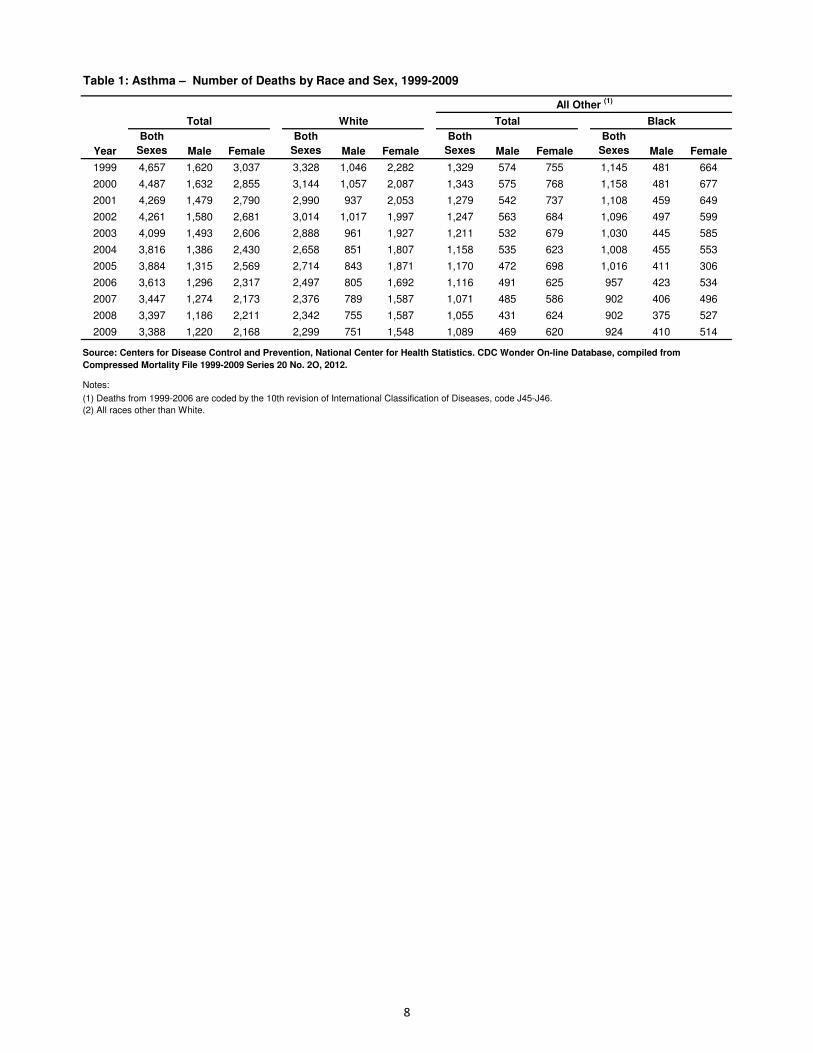
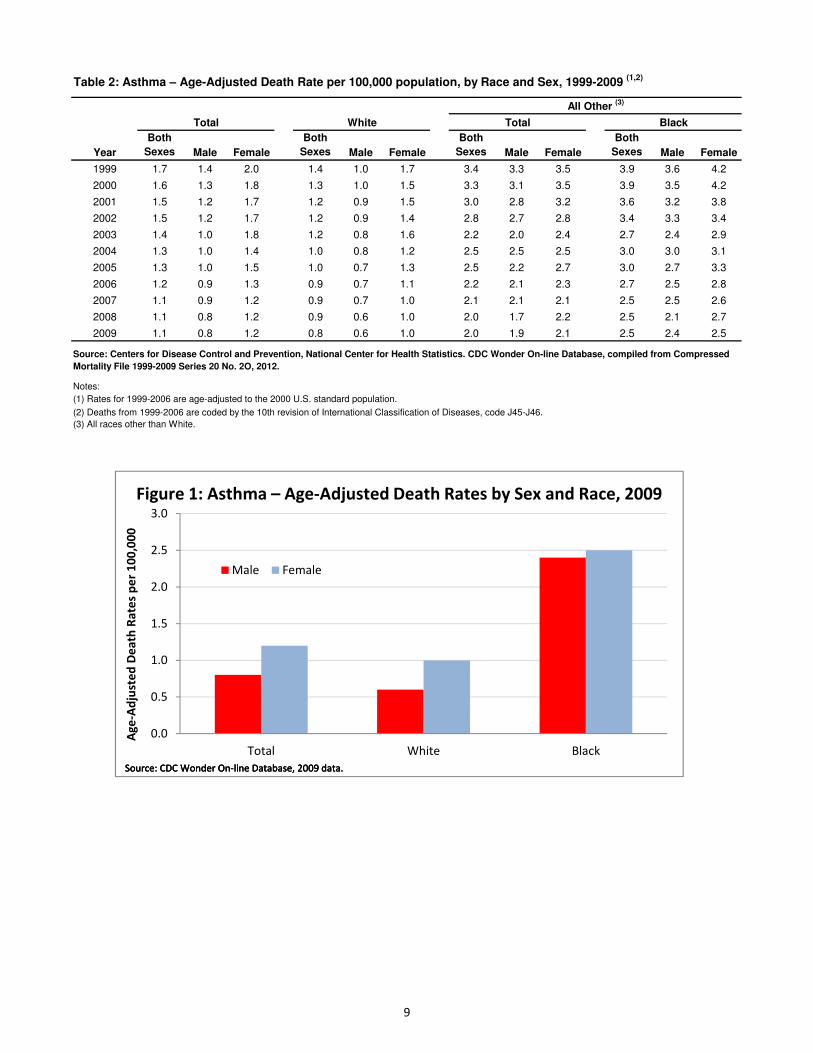
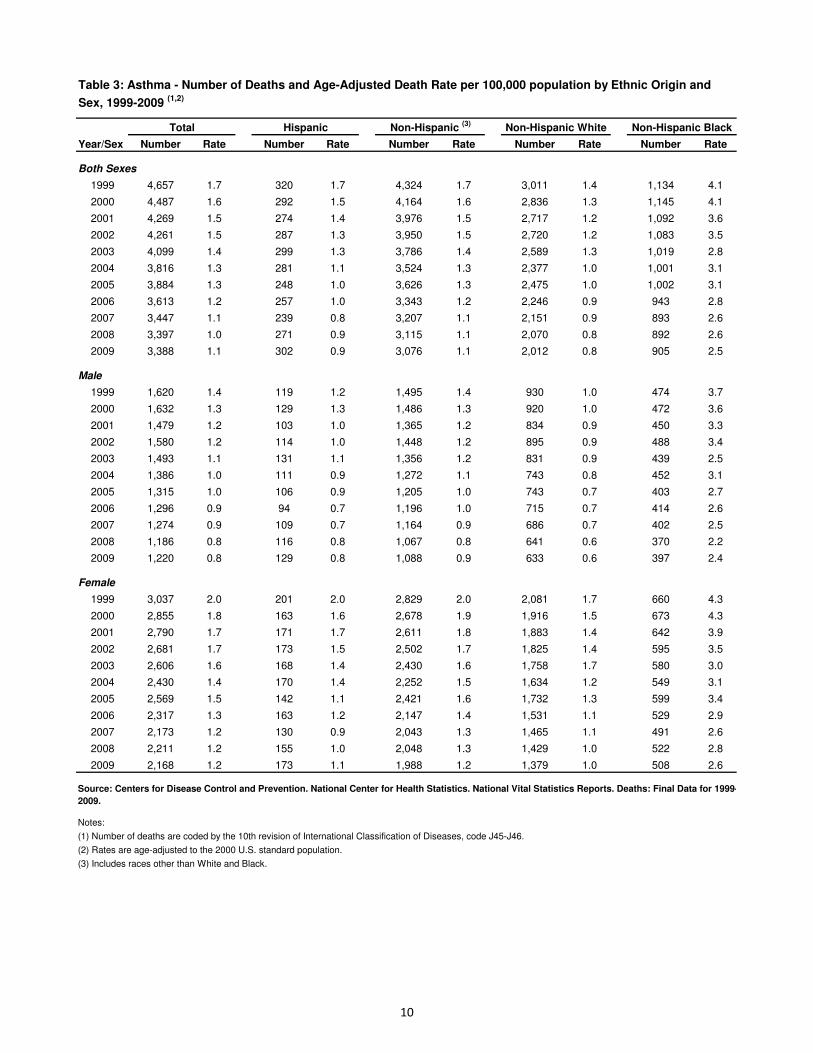
Table 1 documents the number of deaths by race and sex between 1999 and 2009. In 2009, 3,388 people died of asthma, a 26% decrease since 1999. Approximately 64% of these deaths occurred in women. Table 2 displays the age-adjusted death rate per 100,000 population by race and sex for the same years. The age-adjusted death rate for 2009 was 1.1 per 100,000. Figure 1 shows 2009 age-adjusted death rates by race and gender. In 2009, the female age-adjusted death rate was 50% greater than the rate seen in males. The age-adjusted death rate was 3.1 times higher among the black population than among the white population (2.5 versus 0.8 per 100,000, respectively). Black women had the highest age-adjusted mortality rate due to asthma in 2009 (2.5 per 100,000).2 Table 3 delineates the number of deaths and age-adjusted death rate per 100,000 population by Hispanic origin. In 2009, 302 Hispanics died of asthma – an age-adjusted death rate of 0.9 per 100,000 population. Age-adjusted death rates in Hispanics were 64% lower than non-Hispanic blacks, and 12% higher than non-Hispanic whites.3 However, studies have suggested that Puerto Ricans had higher age-adjusted death rates than all other Hispanic subgroups and non-Hispanic whites and blacks.4 Tables 4 and 5 delineate the number of deaths and mortality rates for asthma by 10-year age groups from 1999 to 2009. Figure 2 shows that asthma deaths are rare among children and increase with age. In 2009, 157 children under 15 died from asthma (0.2 per 100,000 population) compared to 617 adults over 85. The death rate in those 85 and over was 175% greater than the second highest mortality rate, seen among those 75-84 years of age (11.0 per 100,000 versus 4.0 per 100,000).5 Unlike morbidity estimates, which are drawn from sample populations and extrapolated to the overall population, mortality data is obtained from the general population from death certificates. Therefore, sex- and race-specific mortality figures are actual counts that denote differences between groups.
Asthma Prevalence
National Health Interview Survey, 2001-2011
The National Health Interview Survey (NHIS) is a multi-purpose health survey conducted by the National Center for Health Statistics (NCHS), Centers for Disease Control and Prevention (CDC). It is the principal source of information on the health of the civilian, noninstitutionalized, household population of the United States. Asthma prevalence is based on a series of questions. Respondents or their proxies were asked if they had ever been diagnosed with asthma by a health professional in their lifetime and if so, did they still have asthma and had they had an asthmatic attack or episode in the past 12 months. The question on asthma attack prevalence assists public health professionals in planning interventions by measuring the population at risk for serious outcomes from asthma. These estimates most likely reflect an underestimate of true asthma prevalence, since studies have shown that there are individuals suffering from undiagnosed asthma.6,7 Lifetime Prevalence
Based on the 2011 NHIS sample, it was estimated that 39.5 million Americans, or 129.1 per 1,000 persons, had been diagnosed with asthma by a health professional within their lifetime. Since 1999, children 5-17 years of age have had the highest prevalence rates. In 2011, 8.7 million children ages 5-17 had been diagnosed with asthma in their lifetime. These data are displayed in Table 6.8 Females traditionally have consistently higher rates of asthma than males. In 2011, females were about 14.0% more likely than males to ever have been diagnosed with asthma.9 Blacks are also more likely to be diagnosed with asthma over their lifetime. In 2011, the prevalence rate in blacks was 36.9% higher than the rate in whites.10 The lifetime asthma prevalence rates for the two races have been statistically significant every year since 1997. Current Prevalence
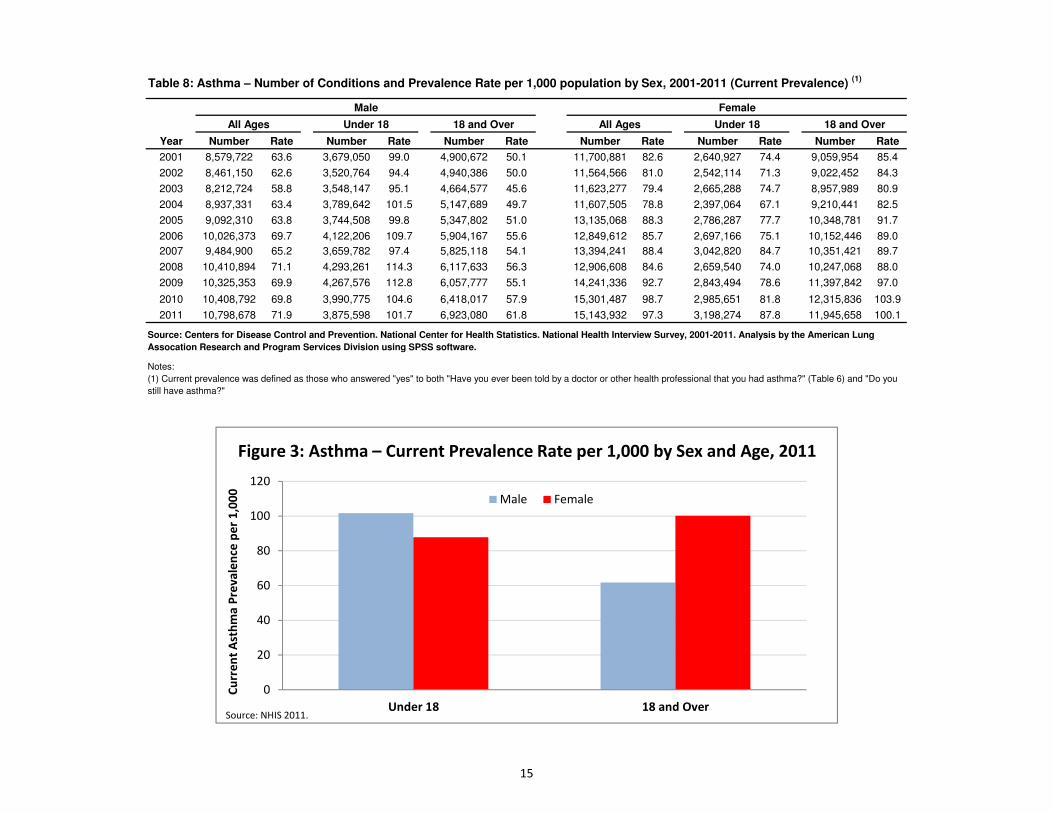
Age-specific current asthma prevalence trends are shown in Table 7. Approximately 25.9 million Americans (including 7.1 million children) had asthma in 2011; a rate of 84.8 per 1,000 population. The highest prevalence rate was seen in those 5-17 years of age (105.5 per 1,000 population). Overall, the rate in those under 18 (94.9 per 1,000) was significantly greater than those over 18 (81.6 per 1,000; not shown).11 Sex-specific current asthma prevalence trends are delineated in Table 8. In 2011, 10.8 million males and 15.1 million females had asthma. The overall prevalence rate in females (97.3 per 1,000 persons) was 35% greater than the rate in males (71.9 per 1,000 persons). Among adults 18 years and older, females were 62% more likely than males to have asthma (100.1 per 1,000 versus 61.8 per 1,000). However, this pattern is reversed among children. The current asthma prevalence rate for boys under 18 (101.7 per 1,000) was 16% higher than the rate among girls (87.8 per 1,000).
2
Figure 3 shows this comparison. The difference in rates between sexes was statistically significant in both children and adults.12 Race- and age-specific current asthma prevalence trends are displayed in Table 9. In 2011, the current asthma prevalence rate was 47% higher in blacks than in whites (118.0 versus 80.4 per 1,000 persons, respectively). This difference between races was statistically significant. The highest prevalence rates for whites and blacks were among the 5-17 age group.13 Attack Prevalence
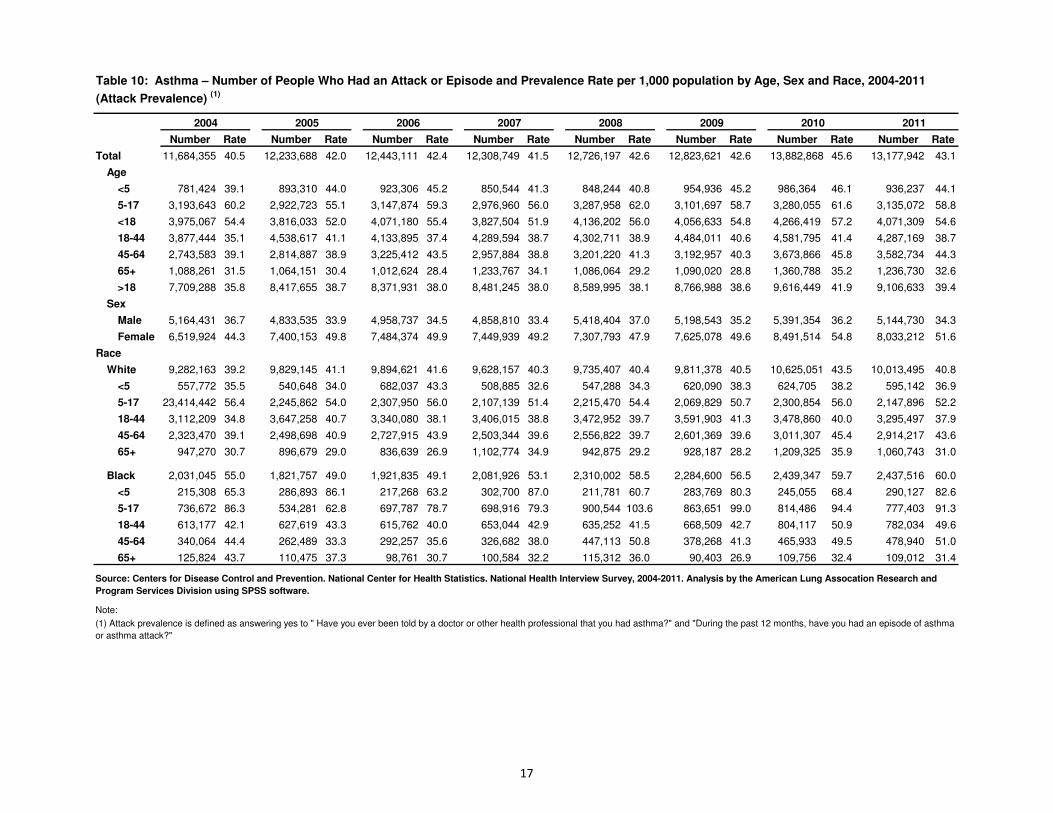
Table 10 displays asthma attack prevalence estimates between 2004 and 2011. In 2011, an estimated 13.2 million Americans (including 4.1 million children under 18) had an asthma attack. This represents 51% of the 25.9 million people who currently have asthma. The asthma attack rate was 43.1 per 1,000 population.14 For the past twelve years, 5-17 year olds had the highest attack prevalence rates while those over 65 had the lowest every year. Since 1999 the asthma attack prevalence rate in those under 18 has been significantly greater than among those over 18; in 2011, these rates were 54.6 versus 39.4 per 1,000 respectively.15 Females tend to have consistently higher attack prevalence rates than males. In 2011, 8.0 million females (51.6 per 1,000) had an asthma attack compared to 5.1 million males (34.3 per 1,000). The difference in attack prevalence rates between sexes has been significant each year since 1999.16 The asthma attack prevalence rate in blacks was 47% higher than the rate in whites. This difference between races was statistically significant. In 2011, asthma attack prevalence rates in whites and blacks were highest among the 5-17 age group and lowest in those 65 years and older.17 Asthma in Hispanics
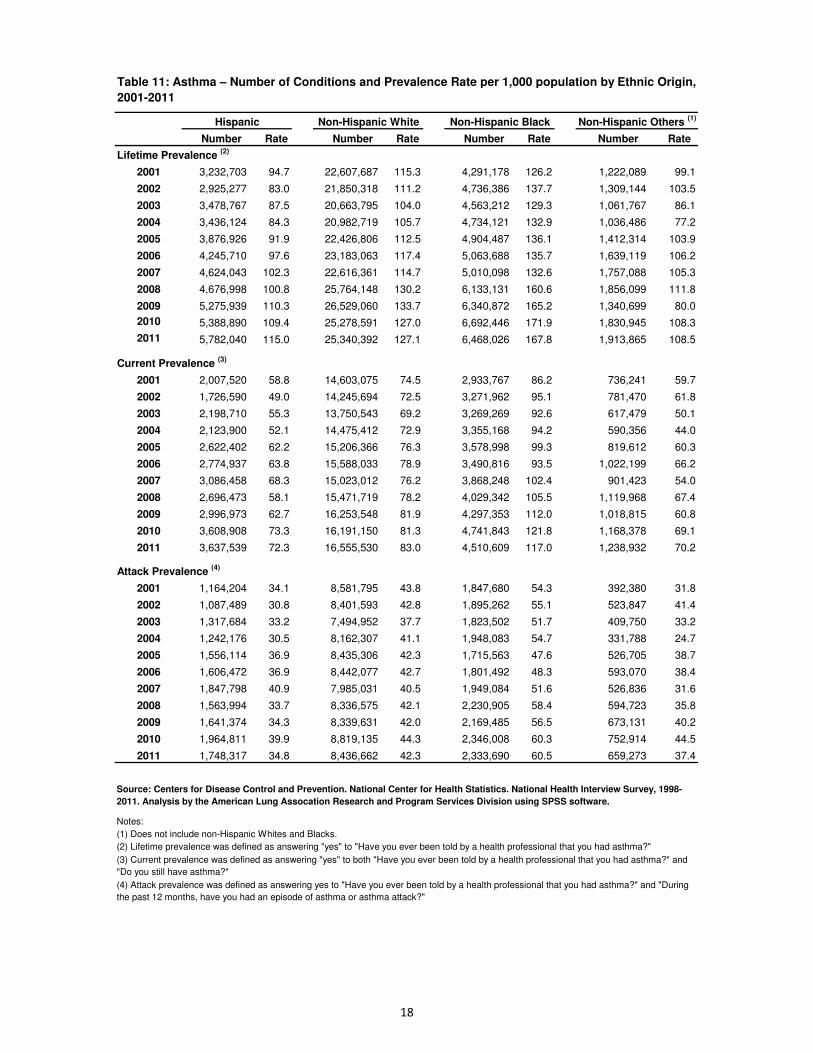
Table 11 displays the number of conditions and prevalence rates by Hispanic origin. In 2011, 5.8 million Hispanics had been diagnosed with asthma in their lifetime; 3.6 million reported that they still have the disease, and 1.7 million of those experienced an asthma attack in the past year. Lifetime, current and attack prevalence rates in Hispanics were significantly lower than non-Hispanic blacks and non-Hispanic whites in 2011.18 Studies have suggested that within Hispanic subgroups, Puerto Ricans may have higher rates of asthma than other Hispanic subgroups and non-Hispanic whites.
Behavioral Risk Factor Surveillance System, 2011
The Behavioral Risk Factor Surveillance System (BRFSS) is a state-based telephone survey of the noninstitutionalized U.S. population aged 18 and over that collects information about modifiable risk factors for chronic diseases and other leading causes of death. This is the first survey to collect state-specific asthma prevalence data for adults. The 2011 BRFSS was subject to two major methodology revisions, including the addition of cell phones to the sampling frame and adoption of a new weighting procedure. Because of these changes, comparisons to previous years of data are not advised.
3
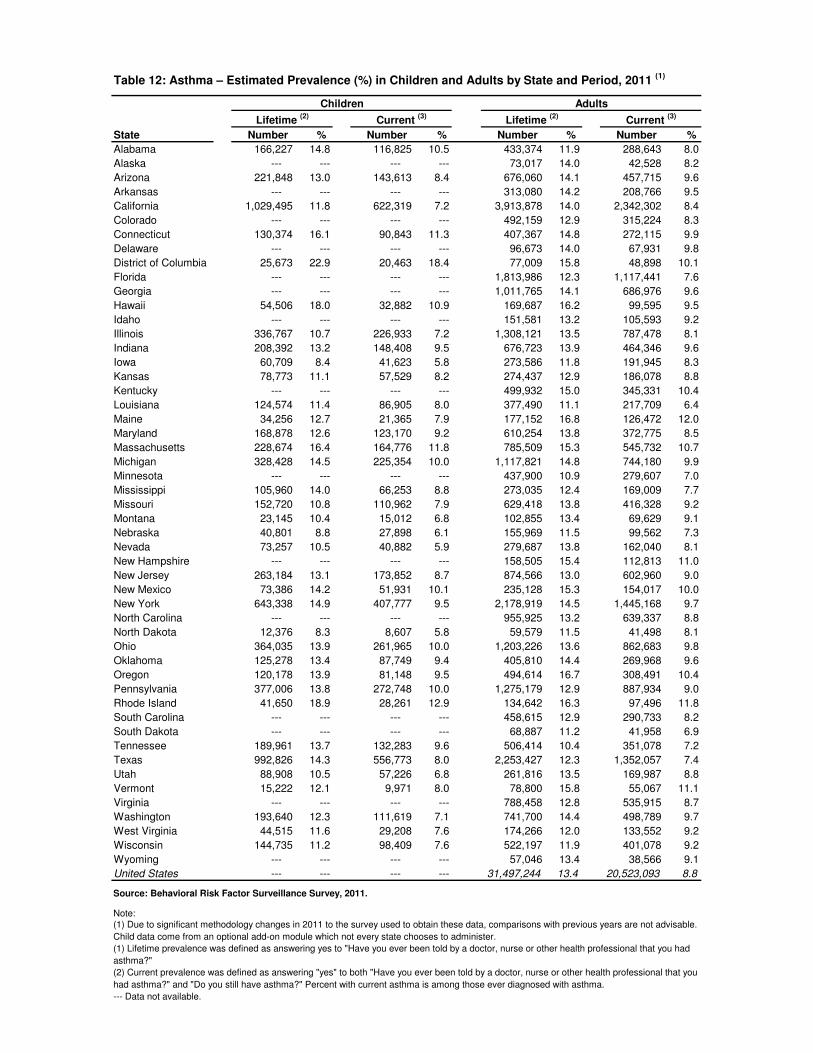
The BRFSS offers an optional module on asthma prevalence among children under 18 years of age. Adult respondents with one or more children in the household answer two questions about lifetime and current asthma prevalence for the child, if only one, or a randomly selected child, if two or more are reported. This module was introduced in 2001, but comparing estimates from before 2005 is not recommended as different sampling methods were used prior to that year. Unfortunately, not every state includes this module. Questions on lifetime and current asthma prevalence in the BRFSS are comparable to the National Health Interview Survey, but estimates vary due to sampling design. According to the 2011 BRFSS, an estimated 31.5 million adults (13.4%) had been diagnosed with asthma within their lifetime and 20.5 million adults (8.8%) still had asthma in 2011. This compares to 29.0 million adults (12.6 %) and 18.9 million adults (8.2%) who were diagnosed with lifetime and current asthma, respectively, in the 2011 National Health Interview Survey (NHIS). Confidence intervals for the prevalence rates indicate that the current but not lifetime estimates from both surveys were statistically different.19 Table 12 displays 2011 lifetime and current asthma prevalence by state in adults, and in children for select states. Figure 5 shows the 2011 state-specific current asthma prevalence in adults, which ranged from 6.4% in Louisiana to 12.0% in Maine.20 Tables 13 and 14 display state-specific lifetime and current asthma prevalence in children between 2006 and 2010. This data should not be compared to that from 2011. It is provided so those states with no 2011 data have some reference for the burden of child asthma between states.21
First-Listed Asthma Hospital Discharges
A first listed diagnosis is the diagnosis identified as the principal diagnosis or listed first on the medical record. The hospital discharge rate for asthma was stable in the early 1990s, peaking at 511,000 discharges (19.5 per 10,000 population) in 1995 and 574,000 (19.8 per 10,000 population) in 2003. During 2010, 439,000 discharges (14.3 per 10,000 population) were attributed to asthma. Between 2003 and 2010 there was a 24% decrease in the hospitalization discharge rate for asthma in the United States.22 Table 15 delineates the trend in the number of hospital discharges and rates by sex from 1989 to 2010. Between 2003 and 2010 the number of hospital discharges decreased 24% overall, 30% in males and 19% in females. In 2010, a total of 278,000 discharges were reported in females and 163,000 were reported in males.23 As shown in Table 16, between 2003 and 2010, hospital discharge rates for asthma decreased in all age groups, although less so in those 65 years of age and older. Unlike other chronic lung diseases, asthma discharges are very common among the pediatric population. Approximately 29% of the asthma discharges in 2010 were in those under 15, although only 21% of the U.S. population was less than 15 years old. Figure 5 depicts this age-specific comparison.24 The trend in hospital discharges by race is delineated in Table 17. The 2010 discharge rate for asthma in blacks (28.5 per 10,000) was 3.2 times higher than that seen in whites and 2.5 times higher than that seen in other races (9.0 and 11.6 per 10,000, respectively). These rates, however,
should be interpreted with caution due to a large percentage of discharges for which race was not reported.25
Asthma Ambulatory Care Visits
Table 18 displays the trend in visits to physician offices, hospital outpatient departments and emergency departments in the United States from 1989-2010. In 2010 there were 10.6 million physician office visits, 1.2 million hospital outpatient department visits and 2.1 million emergency room visits due to asthma.26
Economic Cost of Asthma
From 2002 to 2007, the annual economic cost of asthma in the U.S. was $56.0 billion; direct health care costs consisted of $50.1 billion with indirect costs (lost productivity) contributing an additional $5.9 billion.27
A study by the American Lung Association Asthma Clinical Research Centers found that the inactivated influenza vaccine is safe to administer to adults and children with asthma, including those with severe asthma.28 Influenza causes substantial morbidity in adults and children with asthma, and vaccination can prevent influenza and its complications. In 2011, 51.0% of children and 47.8% of adults with asthma received the influenza vaccine.29
Summary
After a long period of steady increase, evidence suggests that asthma mortality and health care utilization rates continue to plateau and/or decrease. The number of deaths due to asthma in 2009 was approximately 27% lower than the number of deaths seen in 1999.30 The number and rate of hospital discharges have both decreased 24% between 2003 and 2010.31 However, prevalence rates continue to rise after a period of plateauing. Rates have increased by an annual average of 2.7 percentage points since 1997 for lifetime prevalence, 1.5 since 2001 for current prevalence, and 0.3 since 1997 for attack prevalence. Asthma remains a major public health concern. In 2011, approximately 25.9 million Americans had asthma. In 2008, the condition accounted for an estimated 14.4 million lost school days in children and 14.2 million lost work days in adults.32 Asthma is a leading cause of activity limitation and costs our nation $56.0 billion in health care costs annually.33
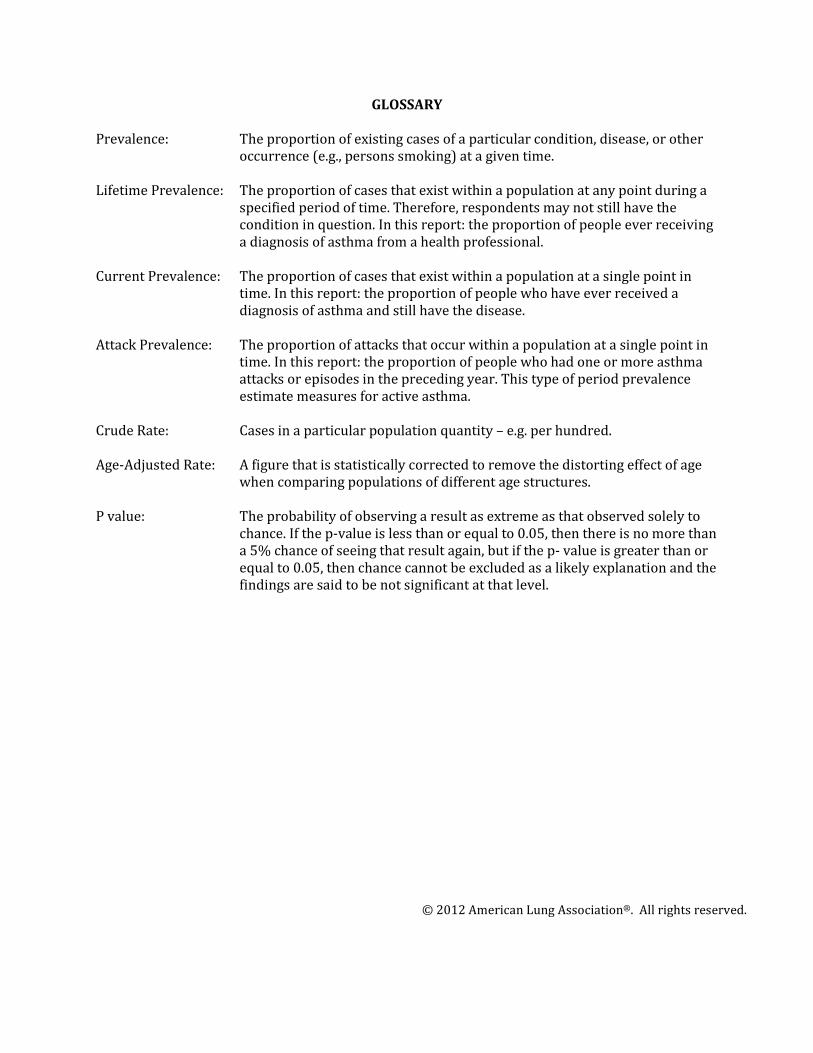
GLOSSARY
Prevalence: The proportion of existing cases of a particular condition, disease, or other
occurrence (e.g., persons smoking) at a given time. Lifetime Prevalence: The proportion of cases that exist within a population at any point during a
specified period of time. Therefore, respondents may not still have the condition in question. In this report: the proportion of people ever receiving a diagnosis of asthma from a health professional.
Current Prevalence: The proportion of cases that exist within a population at a single point in
time. In this report: the proportion of people who have ever received a diagnosis of asthma and still have the disease.
Attack Prevalence: The proportion of attacks that occur within a population at a single point in
time. In this report: the proportion of people who had one or more asthma attacks or episodes in the preceding year. This type of period prevalence estimate measures for active asthma.
Crude Rate: Cases in a particular population quantity – e.g. per hundred. Age-Adjusted Rate: A figure that is statistically corrected to remove the distorting effect of age
when comparing populations of different age structures. P value: The probability of observing a result as extreme as that observed solely to
chance. If the p-value is less than or equal to 0.05, then there is no more than a 5% chance of seeing that result again, but if the p- value is greater than or equal to 0.05, then chance cannot be excluded as a likely explanation and the findings are said to be not significant at that level.
© 2012 American Lung Association®. All rights reserved.
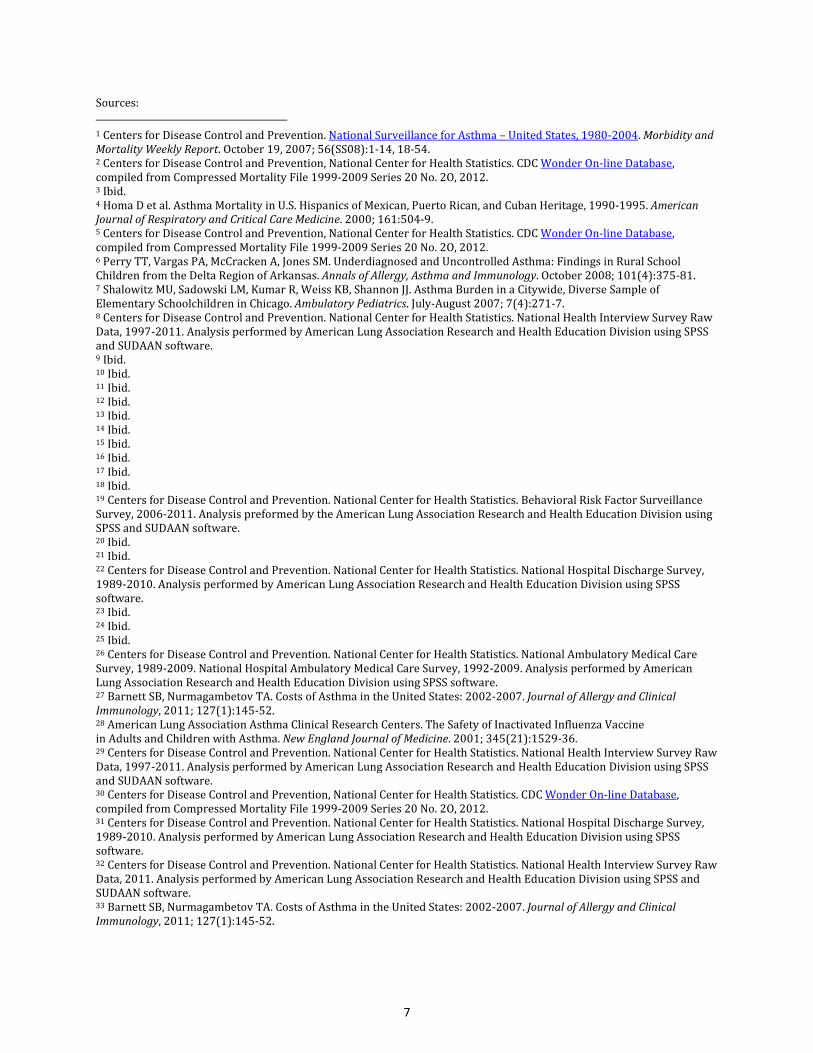
Sources:
1 Centers for Disease Control and Prevention. National Surveillance for Asthma – United States, 1980-2004. Morbidity and
Mortality Weekly Report. October 19, 2007; 56(SS08):1-14, 18-54. 2 Centers for Disease Control and Prevention, National Center for Health Statistics. CDC Wonder On-line Database, compiled from Compressed Mortality File 1999-2009 Series 20 No. 2O, 2012. 3 Ibid. 4 Homa D et al. Asthma Mortality in U.S. Hispanics of Mexican, Puerto Rican, and Cuban Heritage, 1990-1995. American
Journal of Respiratory and Critical Care Medicine. 2000; 161:504-9. 5 Centers for Disease Control and Prevention, National Center for Health Statistics. CDC Wonder On-line Database, compiled from Compressed Mortality File 1999-2009 Series 20 No. 2O, 2012. 6 Perry TT, Vargas PA, McCracken A, Jones SM. Underdiagnosed and Uncontrolled Asthma: Findings in Rural School Children from the Delta Region of Arkansas. Annals of Allergy, Asthma and Immunology. October 2008; 101(4):375-81. 7 Shalowitz MU, Sadowski LM, Kumar R, Weiss KB, Shannon JJ. Asthma Burden in a Citywide, Diverse Sample of Elementary Schoolchildren in Chicago. Ambulatory Pediatrics. July-August 2007; 7(4):271-7. 8 Centers for Disease Control and Prevention. National Center for Health Statistics. National Health Interview Survey Raw Data, 1997-2011. Analysis performed by American Lung Association Research and Health Education Division using SPSS and SUDAAN software. 9 Ibid. 10 Ibid. 11 Ibid. 12 Ibid. 13 Ibid. 14 Ibid. 15 Ibid. 16 Ibid. 17 Ibid. 18 Ibid. 19 Centers for Disease Control and Prevention. National Center for Health Statistics. Behavioral Risk Factor Surveillance Survey, 2006-2011. Analysis preformed by the American Lung Association Research and Health Education Division using SPSS and SUDAAN software. 20 Ibid. 21 Ibid. 22 Centers for Disease Control and Prevention. National Center for Health Statistics. National Hospital Discharge Survey, 1989-2010. Analysis performed by American Lung Association Research and Health Education Division using SPSS software. 23 Ibid. 24 Ibid. 25 Ibid. 26 Centers for Disease Control and Prevention. National Center for Health Statistics. National Ambulatory Medical Care Survey, 1989-2009. National Hospital Ambulatory Medical Care Survey, 1992-2009. Analysis performed by American Lung Association Research and Health Education Division using SPSS software. 27 Barnett SB, Nurmagambetov TA. Costs of Asthma in the United States: 2002-2007. Journal of Allergy and Clinical
Immunology, 2011; 127(1):145-52. 28 American Lung Association Asthma Clinical Research Centers. The Safety of Inactivated Influenza Vaccine in Adults and Children with Asthma. New England Journal of Medicine. 2001; 345(21):1529-36. 29 Centers for Disease Control and Prevention. National Center for Health Statistics. National Health Interview Survey Raw Data, 1997-2011. Analysis performed by American Lung Association Research and Health Education Division using SPSS and SUDAAN software. 30 Centers for Disease Control and Prevention, National Center for Health Statistics. CDC Wonder On-line Database, compiled from Compressed Mortality File 1999-2009 Series 20 No. 2O, 2012. 31 Centers for Disease Control and Prevention. National Center for Health Statistics. National Hospital Discharge Survey, 1989-2010. Analysis performed by American Lung Association Research and Health Education Division using SPSS software. 32 Centers for Disease Control and Prevention. National Center for Health Statistics. National Health Interview Survey Raw Data, 2011. Analysis performed by American Lung Association Research and Health Education Division using SPSS and SUDAAN software. 33 Barnett SB, Nurmagambetov TA. Costs of Asthma in the United States: 2002-2007. Journal of Allergy and Clinical
Immunology, 2011; 127(1):145-52.
7
Year
Both
Sexes Male Female
Both
Sexes Male Female
Both
Sexes Male Female
Both
Sexes Male Female
1999 4,657 1,620 3,037 3,328 1,046 2,282 1,329 574 755 1,145 481 664
2000 4,487 1,632 2,855 3,144 1,057 2,087 1,343 575 768 1,158 481 677
2001 4,269 1,479 2,790 2,990 937 2,053 1,279 542 737 1,108 459 649
2002 4,261 1,580 2,681 3,014 1,017 1,997 1,247 563 684 1,096 497 599
2003 4,099 1,493 2,606 2,888 961 1,927 1,211 532 679 1,030 445 585
2004 3,816 1,386 2,430 2,658 851 1,807 1,158 535 623 1,008 455 553
2005 3,884 1,315 2,569 2,714 843 1,871 1,170 472 698 1,016 411 306
2006 3,613 1,296 2,317 2,497 805 1,692 1,116 491 625 957 423 534
2007 3,447 1,274 2,173 2,376 789 1,587 1,071 485 586 902 406 496
2008 3,397 1,186 2,211 2,342 755 1,587 1,055 431 624 902 375 527
2009 3,388 1,220 2,168 2,299 751 1,548 1,089 469 620 924 410 514
Notes:
(1) Deaths from 1999-2006 are coded by the 10th revision of International Classification of Diseases, code J45-J46.
Source: Centers for Disease Control and Prevention, National Center for Health Statistics. CDC Wonder On-line Database, compiled from
Compressed Mortality File 1999-2009 Series 20 No. 2O, 2012.
(2) All races other than White.
Table 1: Asthma – Number of Deaths by Race and Sex, 1999-2009
All Other (1)
Total White Total Black
8
Year
Both
Sexes Male Female
Both
Sexes Male Female
Both
Sexes Male Female
Both
Sexes Male Female
1999 1.7 1.4 2.0 1.4 1.0 1.7 3.4 3.3 3.5 3.9 3.6 4.2
2000 1.6 1.3 1.8 1.3 1.0 1.5 3.3 3.1 3.5 3.9 3.5 4.2
2001 1.5 1.2 1.7 1.2 0.9 1.5 3.0 2.8 3.2 3.6 3.2 3.8
2002 1.5 1.2 1.7 1.2 0.9 1.4 2.8 2.7 2.8 3.4 3.3 3.4
2003 1.4 1.0 1.8 1.2 0.8 1.6 2.2 2.0 2.4 2.7 2.4 2.9
2004 1.3 1.0 1.4 1.0 0.8 1.2 2.5 2.5 2.5 3.0 3.0 3.1
2005 1.3 1.0 1.5 1.0 0.7 1.3 2.5 2.2 2.7 3.0 2.7 3.3
2006 1.2 0.9 1.3 0.9 0.7 1.1 2.2 2.1 2.3 2.7 2.5 2.8
2007 1.1 0.9 1.2 0.9 0.7 1.0 2.1 2.1 2.1 2.5 2.5 2.6
2008 1.1 0.8 1.2 0.9 0.6 1.0 2.0 1.7 2.2 2.5 2.1 2.7
2009 1.1 0.8 1.2 0.8 0.6 1.0 2.0 1.9 2.1 2.5 2.4 2.5
Notes:
Table 2: Asthma – Age-Adjusted Death Rate per 100,000 population, by Race and Sex, 1999-2009 (1,2)
Source: Centers for Disease Control and Prevention, National Center for Health Statistics. CDC Wonder On-line Database, compiled from Compressed
Mortality File 1999-2009 Series 20 No. 2O, 2012.
All Other (3)
Total White Total Black
(1) Rates for 1999-2006 are age-adjusted to the 2000 U.S. standard population.
(3) All races other than White.
(2) Deaths from 1999-2006 are coded by the 10th revision of International Classification of Diseases, code J45-J46.
0.0
0.5
1.0
1.5
2.0
2.5
3.0
Total White Black
Ag
e-A
dju
ste
d D
ea
th R
ate
s p
er
10
0,0
00
Male Female
Source: CDC Wonder On-line Database, 2009 data.Source: CDC Wonder On-line Database, 2009 data.Source: CDC Wonder On-line Database, 2009 data.
Figure 1: Asthma – Age-Adjusted Death Rates by Sex and Race, 2009
9
Year/Sex Number Rate Number Rate Number Rate Number Rate Number Rate
Both Sexes
1999 4,657 1.7 320 1.7 4,324 1.7 3,011 1.4 1,134 4.1
2000 4,487 1.6 292 1.5 4,164 1.6 2,836 1.3 1,145 4.1
2001 4,269 1.5 274 1.4 3,976 1.5 2,717 1.2 1,092 3.6
2002 4,261 1.5 287 1.3 3,950 1.5 2,720 1.2 1,083 3.5
2003 4,099 1.4 299 1.3 3,786 1.4 2,589 1.3 1,019 2.8
2004 3,816 1.3 281 1.1 3,524 1.3 2,377 1.0 1,001 3.1
2005 3,884 1.3 248 1.0 3,626 1.3 2,475 1.0 1,002 3.1
2006 3,613 1.2 257 1.0 3,343 1.2 2,246 0.9 943 2.8
2007 3,447 1.1 239 0.8 3,207 1.1 2,151 0.9 893 2.6
2008 3,397 1.0 271 0.9 3,115 1.1 2,070 0.8 892 2.6
2009 3,388 1.1 302 0.9 3,076 1.1 2,012 0.8 905 2.5
Male
1999 1,620 1.4 119 1.2 1,495 1.4 930 1.0 474 3.7
2000 1,632 1.3 129 1.3 1,486 1.3 920 1.0 472 3.6
2001 1,479 1.2 103 1.0 1,365 1.2 834 0.9 450 3.3
2002 1,580 1.2 114 1.0 1,448 1.2 895 0.9 488 3.4
2003 1,493 1.1 131 1.1 1,356 1.2 831 0.9 439 2.5
2004 1,386 1.0 111 0.9 1,272 1.1 743 0.8 452 3.1
2005 1,315 1.0 106 0.9 1,205 1.0 743 0.7 403 2.7
2006 1,296 0.9 94 0.7 1,196 1.0 715 0.7 414 2.6
2007 1,274 0.9 109 0.7 1,164 0.9 686 0.7 402 2.5
2008 1,186 0.8 116 0.8 1,067 0.8 641 0.6 370 2.2
2009 1,220 0.8 129 0.8 1,088 0.9 633 0.6 397 2.4
Female
1999 3,037 2.0 201 2.0 2,829 2.0 2,081 1.7 660 4.3
2000 2,855 1.8 163 1.6 2,678 1.9 1,916 1.5 673 4.3
2001 2,790 1.7 171 1.7 2,611 1.8 1,883 1.4 642 3.9
2002 2,681 1.7 173 1.5 2,502 1.7 1,825 1.4 595 3.5
2003 2,606 1.6 168 1.4 2,430 1.6 1,758 1.7 580 3.0
2004 2,430 1.4 170 1.4 2,252 1.5 1,634 1.2 549 3.1
2005 2,569 1.5 142 1.1 2,421 1.6 1,732 1.3 599 3.4
2006 2,317 1.3 163 1.2 2,147 1.4 1,531 1.1 529 2.9
2007 2,173 1.2 130 0.9 2,043 1.3 1,465 1.1 491 2.6
2008 2,211 1.2 155 1.0 2,048 1.3 1,429 1.0 522 2.8
2009 2,168 1.2 173 1.1 1,988 1.2 1,379 1.0 508 2.6
Notes:
Table 3: Asthma - Number of Deaths and Age-Adjusted Death Rate per 100,000 population by Ethnic Origin and
Sex, 1999-2009 (1,2)
(1) Number of deaths are coded by the 10th revision of International Classification of Diseases, code J45-J46.
(2) Rates are age-adjusted to the 2000 U.S. standard population.
(3) Includes races other than White and Black.
Source: Centers for Disease Control and Prevention. National Center for Health Statistics. National Vital Statistics Reports. Deaths: Final Data for 1999-
2009.
Non-Hispanic BlackTotal Hispanic Non-Hispanic (3)
Non-Hispanic White
10
Year Total <1 1-4 5-14 15-24 25-34 35-44 45-54 55-64 65-74 75-84 85+
1999 4,657 5 27 126 182 262 447 607 583 773 925 720
2000 4,487 8 32 129 167 249 458 614 540 734 849 707
2001 4,269 10 31 99 140 233 455 603 553 634 802 709
2002 4,261 4 43 123 169 235 472 608 536 583 812 675
2003 4,099 7 37 110 158 227 411 632 562 532 752 671
2004 3,816 7 29 105 159 197 376 562 520 504 673 684
2005 3,884 4 37 97 131 207 369 595 510 475 709 740
2006 3,613 6 26 99 135 194 373 566 492 443 626 653
2007 3,447 4 41 107 133 201 320 538 461 412 569 659
2008 3,397 6 37 112 141 182 308 497 470 438 547 659
2009 3,388 6 37 114 164 215 295 551 470 399 520 617
Table 4: Asthma - Number of Deaths in 10-Year Age Groups, 1999-2009
Source: Centers for Disease Control and Prevention. National Center for Health Statistics. National Vital Statistics Reports. Deaths: Final Data for 1999-
2009.
11
Year Total <1 1-4 5-14 15-24 25-34 35-44 45-54 55-64 65-74 75-84 85+
1999 1.7 --- 0.2 0.3 0.5 0.7 1.0 1.7 2.5 4.2 7.6 17.2
2000 1.6 --- 0.2 0.3 0.4 0.7 1.0 1.7 2.3 4.0 6.9 16.5
2001 1.5 --- 0.2 0.2 0.4 0.6 1.0 1.5 2.2 3.5 6.4 16.1
2002 1.5 --- 0.3 0.3 0.4 0.6 1.1 1.5 2.0 3.2 6.4 14.7
2003 1.4 --- 0.2 0.3 0.4 0.6 0.9 1.5 2.0 2.9 5.8 14.2
2004 1.3 --- 0.2 0.3 0.4 0.5 0.9 1.4 1.8 2.7 5.2 14.1
2005 1.3 --- 0.2 0.2 0.3 0.5 0.8 1.4 1.7 2.5 5.4 14.5
2006 1.2 --- 0.2 0.2 0.3 0.5 0.9 1.3 1.6 2.3 4.8 12.3
2007 1.1 --- 0.2 0.3 0.3 0.5 0.7 1.2 1.4 2.1 4.4 12.0
2008 1.1 --- 0.2 0.3 0.3 0.4 0.7 1.1 1.4 2.2 4.2 11.5
2009 1.1 --- 0.2 0.3 0.4 0.5 0.7 1.2 1.4 1.9 4.0 11.0
Notes:
--- Figure does not meet standard of reliability or precision (Estimate based on fewer than 20 deaths).
Table 5: Asthma – Death Rate per 100,000 population, by Age Groups 1999-2009 (1)
Source: Centers for Disease Control and Prevention. National Center for Health Statistics. National Vital Statistics Reports. Deaths: Final Data for 1999-
2009.
(1) Deaths from 1999-2009 are coded by the 10th revision of International Classification of Diseases, J45-J46.
0
2
4
6
8
10
12
1-4 5-14 15-24 25-34 35-44 45-54 55-64 65-74 75-84 85+
Cru
de
De
ath
Ra
te p
er
10
0,0
00
Figure 2: Asthma – Crude Death Rates by Age Group, 2009
Source: CDC Wonder On-line Database, 2009 data.
12
Number Rate Number Rate Number Rate Number Rate Number Rate Number Rate Number Rate Number Rate
Total 30,189,450 104.7 32,620,534 112.0 34,131,580 116.2 34,007,590 114.5 38,430,376 128.5 39,930,124 132.5 39,190,872 128.9 39,504,323 129.1
Age
<5 1,454,498 72.8 1,741,465 85.8 1,521,299 74.5 1,636,267 79.5 1,498,621 72.0 1,668,461 78.9 1,714,118 80.0 1,753,100 82.7
5-17 7,435,318 140.1 7,545,500 142.2 8,354,541 157.4 7,968,828 149.9 8,691,354 163.8 8,527,325 161.3 8,419,360 158.2 8,710,191 163.4
<18 8,889,816 121.7 9,286,965 126.6 9,875,840 134.4 9,605,095 130.3 10,189,975 138.0 10,195,786 137.8 10,133,478 135.8 10,463,291 140.4
18-44 10,959,122 99.3 12,322,282 111.6 12,668,079 114.8 12,995,928 117.2 14,891,564 134.6 29,734,338 130.8 15,020,228 135.8 1,509,446 136.2
45-64 6,972,948 99.4 7,555,487 104.5 7,806,115 105.2 7,895,449 103.7 9,265,710 119.7 15,743,442 142.7 9,723,292 121.2 9,839,666 121.7
65+ 3,367,564 97.4 3,455,800 98.6 3,781,546 106.0 3,511,118 97.1 4,083,127 109.8 9,706,421 122.6 4,313,874 111.5 4,110,920 108.4
>18 21,299,634 99.0 23,333,569 107.1 24,255,740 110.1 24,402,495 109.3 28,240,401 125.4 29,734,338 113.2 29,057,394 126.6 29,041,032 125.5
Sex
Male 14,319,905 101.6 14,628,489 102.7 15,952,818 110.9 15,932,657 109.6 17,867,295 122.0 18,521,131 125.4 17,696,171 118.7 18,102,749 120.5
Female 15,869,545 107.7 17,992,044 121.0 18,178,762 121.2 18,074,933 119.3 20,563,061 134.8 21,408,993 139.3 21,494,701 138.6 21,401,574 137.5
Race
White 24,045,954 101.5 25,986,225 108.7 27,036,551 113.7 26,798,402 112.1 30,025,619 124.7 31,277,958 129.0 30,117,278 123.3 30,374,192 123.8
<5 1,136,552 72.4 1,107,802 69.7 1,125,619 71.4 954,773 61.2 984,128 61.6 1,032,703 63.8 1,095,265 67.0 1,104,884 68.5
5-17 5,352,774 129.0 5,569,421 134.0 6,227,995 151.1 5,518,513 134.7 6,017,946 147.7 5,980,779 146.5 5,843,801 142.3 6,151,483 149.4
18-44 8,752,791 97.7 9,857,252 110.1 9,993,077 114.1 10,577,772 120.5 11,892,854 136.1 12,573,455 144.7 11,410,096 131.1 11,498,228 132.3
45-64 5,861,424 98.7 6,454,928 105.5 6,446,946 103.8 6,652,131 105.4 7,655,811 118.9 7,952,842 121.2 8,012,701 120.9 8,166,234 122.3
65+ 2,942,413 95.4 2,996,822 96.8 3,242,914 104.4 3,095,213 98.0 3,474,880 107.5 3,738,179 113.8 3,755,415 111.5 3,453,363 100.8
Black 4,948,075 133.4 5,110,214 137.4 5,342,756 136.6 5,248,110 133.8 6,353,327 160.9 6,671,058 165.0 7,025,535 172.1 6,890,240 169.5
<5 395,616 119.9 528,218 158.6 351,576 102.2 544,230 156.5 384,767 110.2 570,883 161.6 489,443 136.7 552,220 157.3
5-17 1,681,349 196.9 1,554,894 182.7 1,707,643 192.7 1,855,699 210.6 2,192,429 252.3 2,079,850 238.4 2,082,326 241.3 1,939,192 227.6
18-44 1,732,061 118.9 1,794,574 123.8 1,939,503 126.0 1,681,732 110.6 2,228,770 145.8 2,415,768 154.4 2,711,728 171.5 2,733,553 173.5
45-64 818,936 107.0 880,522 111.6 938,301 114.3 848,297 98.7 1,154,966 131.3 1,262,456 137.8 1,298,977 137.9 1,207,077 128.6
65+ 300,113 104.2 352,006 118.7 405,733 126.1 318,152 101.8 392,395 122.3 342,101 102.0 443,061 130.7 458,198 132.1
Notes:
Table 6: Asthma - Number of People Ever Told by a Health Professional that they had Asthma and Prevalence Rate per 1,000 population, by Age, Sex and
Race, 2004-2011 (Lifetime Prevalence) (1)
(1) Lifetime prevalence is defined as answering yes to "Have you ever been told by a doctor or other health professional that you had asthma?"
Source: Centers for Disease Control and Prevention. National Center for Health Statistics. National Health Interview Survey, 2004-2011. Analysis by the American Lung Assocation Research and Program
Services Division using SPSS software.
2004 2005 2006 2007 2008 2009 2010 2011
13
Year Number Rate Number Rate Number Rate Number Rate Number Rate Number Rate Number Rate
2001 20,280,603 73.4 1,127,711 57.1 5,192,266 98.1 6,319,977 87.0 7,796,024 71.9 4,207,483 67.3 1,957,119 59.6
2002 20,025,716 71.8 1,180,664 59.5 4,882,214 91.9 6,062,878 83.1 7,437,526 68.8 4,591,985 71.0 1,933,327 58.5
2003 19,836,001 69.4 1,177,472 59.3 5,035,963 94.8 6,213,435 85.1 6,972,303 63.1 4,678,034 68.5 1,972,229 57.6
2004 20,544,836 71.3 1,119,656 56.0 5,067,050 95.5 6,186,706 84.7 7,058,327 63.9 4,871,010 69.4 2,428,793 70.2
2005 22,227,378 76.3 1,371,199 67.5 5,159,596 97.2 6,530,795 89.0 7,745,701 70.1 5,280,703 73.0 2,670,179 76.2
2006 22,875,985 77.9 1,177,912 57.7 5,641,460 106.3 6,819,372 92.8 7,990,497 72.4 5,575,548 75.1 2,490,568 69.8
2007 22,879,141 77.1 1,395,164 67.8 5,307,438 99.9 6,702,602 90.9 7,996,454 72.1 5,475,500 71.9 2,704,585 74.8
2008 23,317,502 78.0 1,276,343 61.4 5,676,458 107.0 6,952,801 94.1 7,944,927 71.8 5,765,100 74.5 2,654,674 71.4
2009 24,566,689 81.5 1,332,320 63.0 5,778,750 109.3 7,111,070 96.1 8,367,657 75.8 6,181,748 78.1 2,906,214 76.8
2010 25,710,279 84.5 1,284,872 60.0 5,691,554 107.0 6,976,426 93.5 8,901,752 80.5 6,704,335 83.6 3,127,766 80.8
2011 25,942,610 84.8 1,371,518 68.5 5,621,960 105.5 7,073,872 94.9 8,850,239 79.9 7,009,602 86.7 3,008,897 79.4
Notes:
Source: Centers for Disease Control and Prevention. National Center for Health Statistics. National Health Interview Survey, 2001-2011. Analysis by the American Lung Assocation Research and
Program Services Division using SPSS software.
(1) Current prevalence was defined as those who answered "yes" to both "Have you ever been told by a doctor or other health professional that you had asthma?" (Table 6) and "Do you still have asthma?"
Table 7: Asthma - Number of Conditions and Prevalence Rate per 1,000 population by Age, 2001-2011 (Current Prevalence) (1,2)
All Ages Under 5 5-17 <18 18-44 45-64 65+
14
Year Number Rate Number Rate Number Rate Number Rate Number Rate Number Rate
2001 8,579,722 63.6 3,679,050 99.0 4,900,672 50.1 11,700,881 82.6 2,640,927 74.4 9,059,954 85.4
2002 8,461,150 62.6 3,520,764 94.4 4,940,386 50.0 11,564,566 81.0 2,542,114 71.3 9,022,452 84.3
2003 8,212,724 58.8 3,548,147 95.1 4,664,577 45.6 11,623,277 79.4 2,665,288 74.7 8,957,989 80.9
2004 8,937,331 63.4 3,789,642 101.5 5,147,689 49.7 11,607,505 78.8 2,397,064 67.1 9,210,441 82.5
2005 9,092,310 63.8 3,744,508 99.8 5,347,802 51.0 13,135,068 88.3 2,786,287 77.7 10,348,781 91.7
2006 10,026,373 69.7 4,122,206 109.7 5,904,167 55.6 12,849,612 85.7 2,697,166 75.1 10,152,446 89.0
2007 9,484,900 65.2 3,659,782 97.4 5,825,118 54.1 13,394,241 88.4 3,042,820 84.7 10,351,421 89.7
2008 10,410,894 71.1 4,293,261 114.3 6,117,633 56.3 12,906,608 84.6 2,659,540 74.0 10,247,068 88.0
2009 10,325,353 69.9 4,267,576 112.8 6,057,777 55.1 14,241,336 92.7 2,843,494 78.6 11,397,842 97.0
2010 10,408,792 69.8 3,990,775 104.6 6,418,017 57.9 15,301,487 98.7 2,985,651 81.8 12,315,836 103.9
2011 10,798,678 71.9 3,875,598 101.7 6,923,080 61.8 15,143,932 97.3 3,198,274 87.8 11,945,658 100.1
Notes:
Source: Centers for Disease Control and Prevention. National Center for Health Statistics. National Health Interview Survey, 2001-2011. Analysis by the American Lung
Assocation Research and Program Services Division using SPSS software.
(1) Current prevalence was defined as those who answered "yes" to both "Have you ever been told by a doctor or other health professional that you had asthma?" (Table 6) and "Do you
still have asthma?"
Table 8: Asthma – Number of Conditions and Prevalence Rate per 1,000 population by Sex, 2001-2011 (Current Prevalence) (1)
Male Female
All Ages Under 18 18 and Over All Ages Under 18 18 and Over
0
20
40
60
80
100
120
Under 18 18 and Over
Cu
rre
nt
Ast
hm
a P
rev
ale
nce
pe
r 1
,00
0
Male Female
Source: NHIS 2011.
Figure 3: Asthma – Current Prevalence Rate per 1,000 by Sex and Age, 2011
15

Year Number Rate Number Rate Number Rate Number Rate Number Rate Number Rate
2001 15,897,376 71.9 689,084 46.3 3,836,665 95.6 6,209,214 73.3 3,491,749 66.6 1,670,664 57.7
2002 15,475,067 69.4 681,148 45.7 3,515,172 87.0 5,806,930 68.8 3,753,208 69.5 1,718,609 59.1
2003 15,764,764 66.7 712,084 45.5 3,582,880 85.7 5,637,921 62.6 4,085,667 70.1 1,746,212 57.2
2004 16,390,255 69.2 782,879 49.9 3,709,265 89.4 5,604,879 62.6 4,120,743 69.4 2,172,489 70.5
2005 17,594,734 73.6 822,609 51.8 3,477,676 91.1 6,112,174 68.2 4,557,893 74.5 2,314,382 74.8
2006 18,102,518 76.1 842,705 53.5 4,170,650 101.2 6,411,485 73.2 4,564,948 73.5 2,112,730 68.0
2007 17,818,348 74.5 801,099 51.3 3,608,489 88.1 6,417,722 73.1 4,616,492 73.1 2,374,546 75.2
2008 17,922,870 74.4 805,346 50.4 3,838,544 94.2 6,335,706 72.5 4,629,422 71.9 2,313,852 71.6
2009 18,919,628 78.1 775,660 47.9 3,914,797 95.9 6,700,247 77.1 4,977,889 75.9 2,551,035 77.6
2010 19,430,738 79.5 738,938 45.2 3,909,229 95.2 6,571,063 75.5 5,507,608 83.1 2,703,900 80.3
2011 19,731,872 80.4 892,043 55.3 3,787,112 92.0 6,696,659 77.0 5,831,131 87.3 2,524,927 73.7
Year Number Rate Number Rate Number Rate Number Rate Number Rate Number Rate
2001 3,053,514 88.2 323,209 109.7 960,289 116.9 1,089,907 76.6 488,195 74.8 191,914 70.9
2002 3,355,658 95.7 373,140 126.1 1,030,164 125.5 1,201,855 83.9 586,386 85.8 164,113 59.6
2003 3,369,723 92.7 408,342 125.0 1,180,065 138.9 122,577 78.2 503,141 68.2 155,598 54.5
2004 3,478,451 94.2 292,406 88.6 1,222,293 143.2 1,205,919 82.8 547,399 71.5 210,434 73.0
2005 3,721,281 100.1 469,857 141.1 1,099,549 129.2 1,291,843 89.1 587,452 74.5 272,580 91.9
2006 3,685,130 94.2 308,660 89.7 1,261,526 142.3 1,208,699 78.6 624,522 76.0 281,723 87.6
2007 4,045,683 103.2 496,932 142.9 1,403,745 159.3 1,205,631 79.3 689,291 80.2 250,084 80.0
2008 4,157,754 105.3 348,345 99.8 1,542,877 177.6 1,149,238 75.2 841,223 95.6 276,071 86.1
2009 4,509,125 111.5 501,832 142.0 1,562,485 179.1 1,335,096 85.3 871,405 95.1 238,307 71.0
2010 4,977,902 121.9 443,815 123.9 1,460,028 169.2 1,837,603 116.2 909,310 96.5 327,146 96.5
2011 4,795,671 118.0 494,175 140.8 1,476,851 173.4 1,648,714 104.6 856,344 91.2 319,587 92.1
Notes:
45-64 65+
(1) Current prevalence was defined as those who answered "yes" to both "Have you ever been told by a doctor or other health professional that you had asthma?" (Table 6) and "Do
you still have asthma?"
Table 9: Asthma - Number of Conditions and Prevalence Rate per 1,000 population by Race and Age, 2001-2011 (Current
Prevalence) (1)
White
All Ages Under 5 5-17 18-44 45-64 65+
Source: Centers for Disease Control and Prevention. National Center for Health Statistics. National Health Interview Survey, 2001-2011. Analysis by the American Lung
Assocation Research and Program Services Division using SPSS software.
Black
All Ages Under 5 5-17 18-44
16
Number Rate Number Rate Number Rate Number Rate Number Rate Number Rate Number Rate Number Rate
Total 11,684,355 40.5 12,233,688 42.0 12,443,111 42.4 12,308,749 41.5 12,726,197 42.6 12,823,621 42.6 13,882,868 45.6 13,177,942 43.1
Age
<5 781,424 39.1 893,310 44.0 923,306 45.2 850,544 41.3 848,244 40.8 954,936 45.2 986,364 46.1 936,237 44.1
5-17 3,193,643 60.2 2,922,723 55.1 3,147,874 59.3 2,976,960 56.0 3,287,958 62.0 3,101,697 58.7 3,280,055 61.6 3,135,072 58.8
<18 3,975,067 54.4 3,816,033 52.0 4,071,180 55.4 3,827,504 51.9 4,136,202 56.0 4,056,633 54.8 4,266,419 57.2 4,071,309 54.6
18-44 3,877,444 35.1 4,538,617 41.1 4,133,895 37.4 4,289,594 38.7 4,302,711 38.9 4,484,011 40.6 4,581,795 41.4 4,287,169 38.7
45-64 2,743,583 39.1 2,814,887 38.9 3,225,412 43.5 2,957,884 38.8 3,201,220 41.3 3,192,957 40.3 3,673,866 45.8 3,582,734 44.3
65+ 1,088,261 31.5 1,064,151 30.4 1,012,624 28.4 1,233,767 34.1 1,086,064 29.2 1,090,020 28.8 1,360,788 35.2 1,236,730 32.6
>18 7,709,288 35.8 8,417,655 38.7 8,371,931 38.0 8,481,245 38.0 8,589,995 38.1 8,766,988 38.6 9,616,449 41.9 9,106,633 39.4
Sex
Male 5,164,431 36.7 4,833,535 33.9 4,958,737 34.5 4,858,810 33.4 5,418,404 37.0 5,198,543 35.2 5,391,354 36.2 5,144,730 34.3
Female 6,519,924 44.3 7,400,153 49.8 7,484,374 49.9 7,449,939 49.2 7,307,793 47.9 7,625,078 49.6 8,491,514 54.8 8,033,212 51.6
Race
White 9,282,163 39.2 9,829,145 41.1 9,894,621 41.6 9,628,157 40.3 9,735,407 40.4 9,811,378 40.5 10,625,051 43.5 10,013,495 40.8
<5 557,772 35.5 540,648 34.0 682,037 43.3 508,885 32.6 547,288 34.3 620,090 38.3 624,705 38.2 595,142 36.9
5-17 23,414,442 56.4 2,245,862 54.0 2,307,950 56.0 2,107,139 51.4 2,215,470 54.4 2,069,829 50.7 2,300,854 56.0 2,147,896 52.2
18-44 3,112,209 34.8 3,647,258 40.7 3,340,080 38.1 3,406,015 38.8 3,472,952 39.7 3,591,903 41.3 3,478,860 40.0 3,295,497 37.9
45-64 2,323,470 39.1 2,498,698 40.9 2,727,915 43.9 2,503,344 39.6 2,556,822 39.7 2,601,369 39.6 3,011,307 45.4 2,914,217 43.6
65+ 947,270 30.7 896,679 29.0 836,639 26.9 1,102,774 34.9 942,875 29.2 928,187 28.2 1,209,325 35.9 1,060,743 31.0
Black 2,031,045 55.0 1,821,757 49.0 1,921,835 49.1 2,081,926 53.1 2,310,002 58.5 2,284,600 56.5 2,439,347 59.7 2,437,516 60.0
<5 215,308 65.3 286,893 86.1 217,268 63.2 302,700 87.0 211,781 60.7 283,769 80.3 245,055 68.4 290,127 82.6
5-17 736,672 86.3 534,281 62.8 697,787 78.7 698,916 79.3 900,544 103.6 863,651 99.0 814,486 94.4 777,403 91.3
18-44 613,177 42.1 627,619 43.3 615,762 40.0 653,044 42.9 635,252 41.5 668,509 42.7 804,117 50.9 782,034 49.6
45-64 340,064 44.4 262,489 33.3 292,257 35.6 326,682 38.0 447,113 50.8 378,268 41.3 465,933 49.5 478,940 51.0
65+ 125,824 43.7 110,475 37.3 98,761 30.7 100,584 32.2 115,312 36.0 90,403 26.9 109,756 32.4 109,012 31.4
Note:
2011
Table 10: Asthma – Number of People Who Had an Attack or Episode and Prevalence Rate per 1,000 population by Age, Sex and Race, 2004-2011
(Attack Prevalence) (1)
Source: Centers for Disease Control and Prevention. National Center for Health Statistics. National Health Interview Survey, 2004-2011. Analysis by the American Lung Assocation Research and
Program Services Division using SPSS software.
(1) Attack prevalence is defined as answering yes to " Have you ever been told by a doctor or other health professional that you had asthma?" and "During the past 12 months, have you had an episode of asthma
or asthma attack?"
201020092004 2005 2006 2007 2008
17
Number Rate Number Rate Number Rate Number Rate
2001 3,232,703 94.7 22,607,687 115.3 4,291,178 126.2 1,222,089 99.1
2002 2,925,277 83.0 21,850,318 111.2 4,736,386 137.7 1,309,144 103.5
2003 3,478,767 87.5 20,663,795 104.0 4,563,212 129.3 1,061,767 86.1
2004 3,436,124 84.3 20,982,719 105.7 4,734,121 132.9 1,036,486 77.2
2005 3,876,926 91.9 22,426,806 112.5 4,904,487 136.1 1,412,314 103.9
2006 4,245,710 97.6 23,183,063 117.4 5,063,688 135.7 1,639,119 106.2
2007 4,624,043 102.3 22,616,361 114.7 5,010,098 132.6 1,757,088 105.3
2008 4,676,998 100.8 25,764,148 130.2 6,133,131 160.6 1,856,099 111.8
2009 5,275,939 110.3 26,529,060 133.7 6,340,872 165.2 1,340,699 80.0
2010 5,388,890 109.4 25,278,591 127.0 6,692,446 171.9 1,830,945 108.3
2011 5,782,040 115.0 25,340,392 127.1 6,468,026 167.8 1,913,865 108.5
2001 2,007,520 58.8 14,603,075 74.5 2,933,767 86.2 736,241 59.7
2002 1,726,590 49.0 14,245,694 72.5 3,271,962 95.1 781,470 61.8
2003 2,198,710 55.3 13,750,543 69.2 3,269,269 92.6 617,479 50.1
2004 2,123,900 52.1 14,475,412 72.9 3,355,168 94.2 590,356 44.0
2005 2,622,402 62.2 15,206,366 76.3 3,578,998 99.3 819,612 60.3
2006 2,774,937 63.8 15,588,033 78.9 3,490,816 93.5 1,022,199 66.2
2007 3,086,458 68.3 15,023,012 76.2 3,868,248 102.4 901,423 54.0
2008 2,696,473 58.1 15,471,719 78.2 4,029,342 105.5 1,119,968 67.4
2009 2,996,973 62.7 16,253,548 81.9 4,297,353 112.0 1,018,815 60.8
2010 3,608,908 73.3 16,191,150 81.3 4,741,843 121.8 1,168,378 69.1
2011 3,637,539 72.3 16,555,530 83.0 4,510,609 117.0 1,238,932 70.2
2001 1,164,204 34.1 8,581,795 43.8 1,847,680 54.3 392,380 31.8
2002 1,087,489 30.8 8,401,593 42.8 1,895,262 55.1 523,847 41.4
2003 1,317,684 33.2 7,494,952 37.7 1,823,502 51.7 409,750 33.2
2004 1,242,176 30.5 8,162,307 41.1 1,948,083 54.7 331,788 24.7
2005 1,556,114 36.9 8,435,306 42.3 1,715,563 47.6 526,705 38.7
2006 1,606,472 36.9 8,442,077 42.7 1,801,492 48.3 593,070 38.4
2007 1,847,798 40.9 7,985,031 40.5 1,949,084 51.6 526,836 31.6
2008 1,563,994 33.7 8,336,575 42.1 2,230,905 58.4 594,723 35.8
2009 1,641,374 34.3 8,339,631 42.0 2,169,485 56.5 673,131 40.2
2010 1,964,811 39.9 8,819,135 44.3 2,346,008 60.3 752,914 44.5
2011 1,748,317 34.8 8,436,662 42.3 2,333,690 60.5 659,273 37.4
Notes:
Table 11: Asthma – Number of Conditions and Prevalence Rate per 1,000 population by Ethnic Origin,
2001-2011
(4) Attack prevalence was defined as answering yes to "Have you ever been told by a health professional that you had asthma?" and "During
the past 12 months, have you had an episode of asthma or asthma attack?"
Non-Hispanic Black Non-Hispanic Others (1)
Non-Hispanic White
Attack Prevalence (4)
Lifetime Prevalence (2)
Current Prevalence (3)
(2) Lifetime prevalence was defined as answering "yes" to "Have you ever been told by a health professional that you had asthma?"
(3) Current prevalence was defined as answering "yes" to both "Have you ever been told by a health professional that you had asthma?" and
"Do you still have asthma?"
(1) Does not include non-Hispanic Whites and Blacks.
Source: Centers for Disease Control and Prevention. National Center for Health Statistics. National Health Interview Survey, 1998-
2011. Analysis by the American Lung Assocation Research and Program Services Division using SPSS software.
Hispanic
18
State Number % Number % Number % Number %
Alabama 166,227 14.8 116,825 10.5 433,374 11.9 288,643 8.0
Alaska --- --- --- --- 73,017 14.0 42,528 8.2
Arizona 221,848 13.0 143,613 8.4 676,060 14.1 457,715 9.6
Arkansas --- --- --- --- 313,080 14.2 208,766 9.5
California 1,029,495 11.8 622,319 7.2 3,913,878 14.0 2,342,302 8.4
Colorado --- --- --- --- 492,159 12.9 315,224 8.3
Connecticut 130,374 16.1 90,843 11.3 407,367 14.8 272,115 9.9
Delaware --- --- --- --- 96,673 14.0 67,931 9.8
District of Columbia 25,673 22.9 20,463 18.4 77,009 15.8 48,898 10.1
Florida --- --- --- --- 1,813,986 12.3 1,117,441 7.6
Georgia --- --- --- --- 1,011,765 14.1 686,976 9.6
Hawaii 54,506 18.0 32,882 10.9 169,687 16.2 99,595 9.5
Idaho --- --- --- --- 151,581 13.2 105,593 9.2
Illinois 336,767 10.7 226,933 7.2 1,308,121 13.5 787,478 8.1
Indiana 208,392 13.2 148,408 9.5 676,723 13.9 464,346 9.6
Iowa 60,709 8.4 41,623 5.8 273,586 11.8 191,945 8.3
Kansas 78,773 11.1 57,529 8.2 274,437 12.9 186,078 8.8
Kentucky --- --- --- --- 499,932 15.0 345,331 10.4
Louisiana 124,574 11.4 86,905 8.0 377,490 11.1 217,709 6.4
Maine 34,256 12.7 21,365 7.9 177,152 16.8 126,472 12.0
Maryland 168,878 12.6 123,170 9.2 610,254 13.8 372,775 8.5
Massachusetts 228,674 16.4 164,776 11.8 785,509 15.3 545,732 10.7
Michigan 328,428 14.5 225,354 10.0 1,117,821 14.8 744,180 9.9
Minnesota --- --- --- --- 437,900 10.9 279,607 7.0
Mississippi 105,960 14.0 66,253 8.8 273,035 12.4 169,009 7.7
Missouri 152,720 10.8 110,962 7.9 629,418 13.8 416,328 9.2
Montana 23,145 10.4 15,012 6.8 102,855 13.4 69,629 9.1
Nebraska 40,801 8.8 27,898 6.1 155,969 11.5 99,562 7.3
Nevada 73,257 10.5 40,882 5.9 279,687 13.8 162,040 8.1
New Hampshire --- --- --- --- 158,505 15.4 112,813 11.0
New Jersey 263,184 13.1 173,852 8.7 874,566 13.0 602,960 9.0
New Mexico 73,386 14.2 51,931 10.1 235,128 15.3 154,017 10.0
New York 643,338 14.9 407,777 9.5 2,178,919 14.5 1,445,168 9.7
North Carolina --- --- --- --- 955,925 13.2 639,337 8.8
North Dakota 12,376 8.3 8,607 5.8 59,579 11.5 41,498 8.1
Ohio 364,035 13.9 261,965 10.0 1,203,226 13.6 862,683 9.8
Oklahoma 125,278 13.4 87,749 9.4 405,810 14.4 269,968 9.6
Oregon 120,178 13.9 81,148 9.5 494,614 16.7 308,491 10.4
Pennsylvania 377,006 13.8 272,748 10.0 1,275,179 12.9 887,934 9.0
Rhode Island 41,650 18.9 28,261 12.9 134,642 16.3 97,496 11.8
South Carolina --- --- --- --- 458,615 12.9 290,733 8.2
South Dakota --- --- --- --- 68,887 11.2 41,958 6.9
Tennessee 189,961 13.7 132,283 9.6 506,414 10.4 351,078 7.2
Texas 992,826 14.3 556,773 8.0 2,253,427 12.3 1,352,057 7.4
Utah 88,908 10.5 57,226 6.8 261,816 13.5 169,987 8.8
Vermont 15,222 12.1 9,971 8.0 78,800 15.8 55,067 11.1
Virginia --- --- --- --- 788,458 12.8 535,915 8.7
Washington 193,640 12.3 111,619 7.1 741,700 14.4 498,789 9.7
West Virginia 44,515 11.6 29,208 7.6 174,266 12.0 133,552 9.2
Wisconsin 144,735 11.2 98,409 7.6 522,197 11.9 401,078 9.2
Wyoming --- --- --- --- 57,046 13.4 38,566 9.1
United States --- --- --- --- 31,497,244 13.4 20,523,093 8.8
Note:
--- Data not available.
Lifetime (2)
Current (3)
Table 12: Asthma – Estimated Prevalence (%) in Children and Adults by State and Period, 2011 (1)
Children Adults
(1) Lifetime prevalence was defined as answering yes to "Have you ever been told by a doctor, nurse or other health professional that you had
asthma?"
(2) Current prevalence was defined as answering "yes" to both "Have you ever been told by a doctor, nurse or other health professional that you
had asthma?" and "Do you still have asthma?" Percent with current asthma is among those ever diagnosed with asthma.
Source: Behavioral Risk Factor Surveillance Survey, 2011.
Lifetime (2)
Current (3)
(1) Due to significant methodology changes in 2011 to the survey used to obtain these data, comparisons with previous years are not advisable.
Child data come from an optional add-on module which not every state chooses to administer.
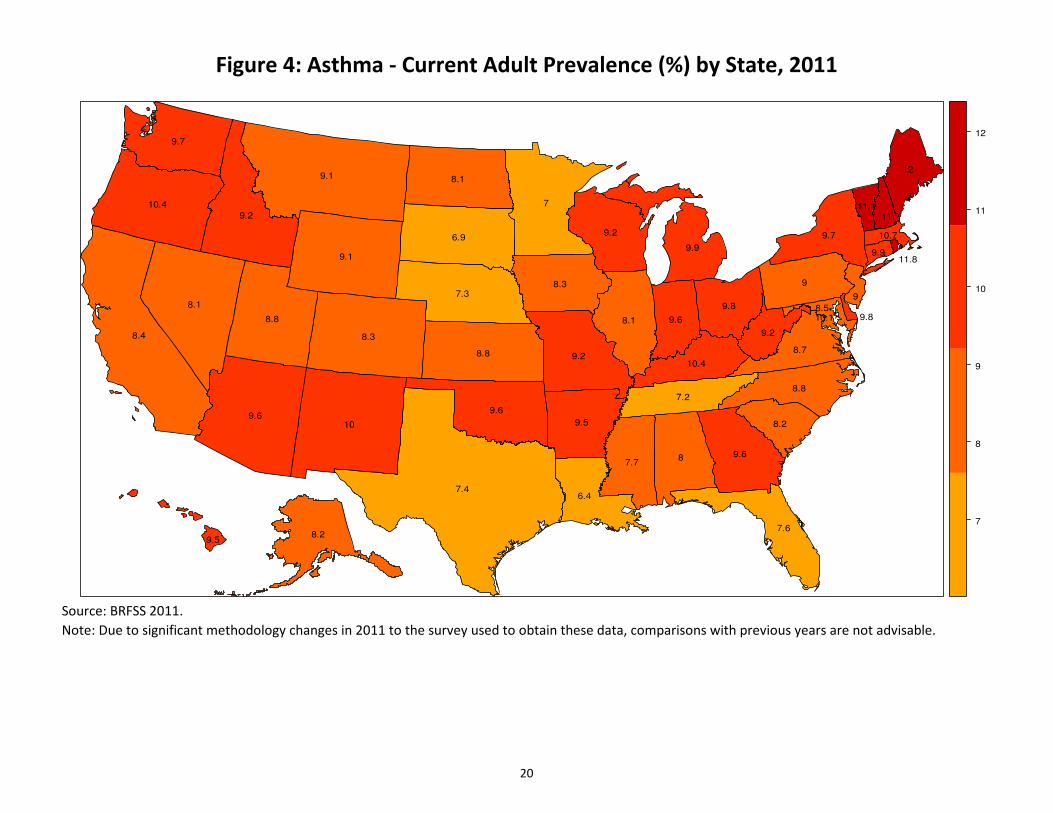
Source: BRFSS 2011.
Note: Due to significant methodology changes in 2011 to the survey used to obtain these data, comparisons with previous years are not advisable.
Figure 4: Asthma - Current Adult Prevalence (%) by State, 2011
8.29.5
9.7
9.112
8.1
6.9
9.1
9.2
9.211.1710.4
11
8.3
10.7
7.3
9.7
9
9.911.8
9
9.6
8.1
8.8
8.4
9.8
8.1 10.1 9.8
9.2
8.5
8.3
10.48.8 8.7
9.2
9.69.6
8.87.2
7.4
10
87.7
9.6
8.29.5
6.4
7.6
9.9
7
8
9
10
11
12
20
State Number % Number % Number % Number % Number %
Alabama --- --- --- --- --- --- --- --- 158,131 14.5
Alaska 18,280 9.8 20,830 11.0 --- --- --- --- --- ---
Arizona 225,386 14.3 217,163 13.6 200,272 12.1 --- --- 217,092 12.4
Arkansas --- --- --- --- --- --- --- --- --- ---
California 1,186,312 12.6 1,289,140 13.2 1,116,129 12.3 989,810 11.3 1,365,044 11.7
Colorado --- --- --- --- --- --- --- --- --- ---
Connecticut --- --- 117,845 14.6 131,713 16.6 137,068 17.3 121,931 15.3
Delaware --- --- --- --- --- --- 37,530 18.2 --- ---
District of Columbia 20,016 19.3 22,521 19.9 20,871 18.8 22,548 20.4 24,448 22.4
Florida --- --- --- --- --- --- --- --- --- ---
Georgia 330,289 14.3 360,410 15.3 392,262 16.1 382,048 15.3 365,608 14.5
Hawaii 61,505 20.6 55,478 18.2 54,355 18.8 50,707 18.0 47,952 16.9
Idaho 35,786 9.5 --- --- 32,988 8.8 36,020 8.8 --- ---
Illinois --- --- 363,467 11.3 382,223 12.1 414,661 13.1 430,621 13.6
Indiana 192,803 12.3 179,341 11.3 203,773 13.0 226,662 14.7 208,223 13.4
Iowa 61,518 9.1 57,575 8.7 60,426 9.3 47,593 6.8 62,517 8.8
Kansas 80,438 11.9 75,716 11.2 83,766 12.3 82,933 12.1 72,624 10.4
Kentucky 128,178 13.3 --- --- 137,023 14.0 --- --- 147,357 14.7
Louisiana --- --- --- --- --- --- 154,689 14.4 126,786 11.6
Maine 34,267 12.4 36,508 13.3 38,342 14.0 --- --- 45,127 13.1
Maryland 179,950 13.1 188,966 13.7 190,389 14.3 227,847 17.2 217,026 16.5
Massachusetts --- --- 234,222 12.8 106,293 12.1 247,511 13.2 246,043 12.2
Michigan 315,704 12.7 350,245 14.2 374,252 15.8 268,410 11.4 329,400 14.4
Minnesota 115,806 9.5 --- --- --- --- --- --- --- ---
Mississippi 105,528 14.3 109,587 14.8 91,012 14.2 110,304 14.7 99,614 13.2
Missouri 187,220 13.8 179,697 13.0 199,884 14.5 --- --- 203,591 14.5
Montana 20,378 9.9 19,664 9.6 21,815 10.3 19,906 9.2 20,808 9.6
Nebraska 43,846 10.1 48,234 11.1 34,946 8.0 39,348 8.9 38,489 8.6
Nevada 73,097 11.8 65,582 10.3 72,291 11.4 70,492 10.7 70,576 10.6
New Hampshire 39,012 13.2 33,327 11.3 34,633 12.1 --- --- --- ---
New Jersey 324,682 15.4 365,794 14.3 262,557 13.1 285,676 14.3 284,478 14.2
New Mexico --- --- 63,853 13.0 56,810 11.3 64,259 11.7 61,258 12.2
New York 664,779 15.0 718,245 16.1 707,399 16.1 706,328 16.6 --- ---
North Carolina --- --- --- --- --- --- --- --- --- ---
North Dakota --- --- --- --- 10,678 7.6 13,068 9.2 13,953 9.8
Ohio 263,038 9.7 371,762 13.7 367,102 13.6 427,044 12.6 381,652 11.4
Oklahoma 110,537 13.0 132,346 15.5 121,927 13.8 132,770 12.2 126,775 14.0
Oregon 105,685 12.6 100,186 11.9 81,532 9.9 135,295 13.3 100,200 11.8
Pennsylvania 328,385 12.0 405,170 14.7 375,644 13.8 398,333 14.8 389,382 14.3
Rhode Island 38,493 16.5 --- --- 38,959 17.1 35,308 15.8 33,076 15.1
South Carolina --- --- --- --- --- --- --- --- --- ---
South Dakota --- --- --- --- --- --- --- --- --- ---
Tennessee --- --- --- --- --- --- --- --- 131,590 8.9
Texas 833,627 13.5 940,562 12.6 910,031 14.2 873,232 13.3 780,663 11.6
Utah 68,649 9.1 88,037 11.7 77,218 9.9 88,888 10.9 80,731 9.5
Vermont 16,920 12.9 16,118 12.4 18,822 14.5 19,947 15.6 17,913 14.1
Virginia 256,766 14.4 238,420 13.2 257,563 14.7 216,396 12.1 --- ---
Washington --- --- --- --- --- --- 170,137 11.2 159,525 10.4
West Virginia 42,132 11.3 51,331 13.7 56,091 14.8 47,463 12.7 39,981 10.6
Wisconsin 130,541 10.1 167,058 10.4 149,941 9.3 126,280 9.8 152,871 11.7
Wyoming 12,737 10.9 --- --- 10,139 8.4 --- --- 12016 9.3
Note:
--- Data not available.
(2) Due to significant methodology changes in 2011 to the survey used to obtain these data, comparisons with previous years are not advisable. As only 16
states included the childhood asthma module in 2011, these data are not being included here until additional years using the new methodology are available.
Table 13: Asthma – Lifetime Prevalence in Children by State, 2006-2010 (1,2)
(1) Lifetime prevalence was defined as answering yes to "Has the child ever been told by a doctor, nurse or other health professional that they had asthma?"
2010
Source: Behavioral Risk Factor Surveillance Survey, 2006-2010.
2009200820072006
21
State Number % Number % Number % Number % Number %
Alabama --- --- --- --- --- --- --- --- 125,325 11.5
Alaska 12,857 6.9 13,121 6.9 --- --- --- --- --- ---
Arizona 158,993 10.1 118,151 7.4 135,062 8.2 --- --- 164,767 9.4
Arkansas --- --- --- --- --- --- --- --- --- ---
California 786,201 8.3 743,366 7.6 644,122 7.1 582,005 6.6 758,479 6.5
Colorado --- --- --- --- --- --- --- --- --- ---
Connecticut 78,932 8.2 76,562 9.5 87,552 11.1 94,930 12.0 89,280 11.2
Delaware --- --- --- --- --- --- 27,827 13.5 --- ---
District of Columbia 14,751 14.2 17,896 15.8 13,955 12.6 15,414 13.9 19,605 18.0
Florida --- --- --- --- --- --- --- --- --- ---
Georgia 231,259 10.0 228,590 9.7 291,215 11.9 246,939 9.9 227,224 9.0
Hawaii 36,804 12.3 36,802 12.1 36,638 12.7 31,681 11.2 31,316 11.0
Idaho 23,705 6.3 --- --- 24,815 6.6 18,842 4.6 --- ---
Illinois --- --- 250,015 7.8 267,681 8.5 294,587 9.3 312,122 9.8
Indiana 130,676 8.4 125,651 7.9 132,798 8.5 150,780 9.8 136,202 8.8
Iowa 44,092 6.5 34,011 5.1 43,349 6.6 33,338 4.8 44,121 6.2
Kansas 61,972 9.2 55,421 8.2 61,274 9.0 56,859 8.3 52,720 7.5
Kentucky 89,884 9.3 --- --- 92,652 9.5 --- --- 106,359 10.6
Louisiana --- --- --- --- --- --- 101,210 9.4 91,058 8.3
Maine 23,761 8.6 23,228 8.5 25,586 9.4 --- --- 27,121 7.9
Maryland 124,398 9.1 123,400 8.9 127,173 9.5 158,416 11.9 155,880 11.8
Massachusetts --- --- 166,223 9.1 164,219 8.8 164,415 8.8 168,163 8.4
Michigan 211,524 8.5 243,470 9.9 254,583 10.7 191,531 8.1 253,586 11.1
Minnesota 85,072 7.0 --- --- --- --- --- --- --- ---
Mississippi 75,264 10.2 76,710 10.4 65,488 10.2 78,025 10.4 64,743 8.6
Missouri 133,051 9.8 118,649 8.6 140,278 10.2 --- --- 152,888 10.9
Montana 13,610 6.6 14,181 6.9 14,301 6.7 13,846 6.4 14,881 6.9
Nebraska 28,848 6.7 36,515 8.4 26,887 6.1 22,988 5.2 27,308 6.1
Nevada 43,927 7.1 40,300 6.3 46,709 7.4 45,517 6.9 57,225 8.6
New Hampshire 26,981 9.1 22,164 7.5 24,709 8.6 --- --- --- ---
New Jersey 219,880 10.4 256,969 10.1 171,080 8.5 182,045 9.1 179,320 9.0
New Mexico --- --- 42,012 8.6 38,309 7.6 39,939 7.3 39,874 8.0
New York 473,648 10.7 514,553 11.6 467,137 10.6 427,503 10.0 --- ---
North Carolina --- --- --- --- --- --- --- --- --- ---
North Dakota --- --- --- --- 7,666 5.4 8,114 5.7 9,099 6.4
Ohio 219,361 8.1 237,040 8.7 252,161 9.4 291,395 8.7 257,779 7.7
Oklahoma 72,864 8.6 93,099 10.9 88,363 10.0 101,485 9.3 92,098 10.2
Oregon 72,348 8.6 69,699 8.3 46,436 5.6 83,678 8.3 64,066 7.5
Pennsylvania 228,568 8.4 291,722 10.6 267,171 9.8 276,710 10.3 258,689 9.5
Rhode Island 24,686 10.6 --- --- 28,135 12.4 24,588 11.0 25,502 11.7
South Carolina --- --- --- --- --- --- --- --- --- ---
South Dakota --- --- --- --- --- --- --- --- --- ---
Tennessee --- --- --- --- --- --- --- --- 81,588 5.5
Texas 579,987 9.4 632,698 8.5 588,082 9.2 535,324 8.2 508,466 7.6
Utah 49,192 6.5 58,718 7.8 51,881 6.6 59,327 7.3 58,302 6.9
Vermont 12,202 9.3 10,082 7.7 12,804 9.9 12,909 10.1 12,583 9.9
Virginia 185,046 10.4 137,364 7.6 169,670 9.7 147,139 8.3 --- ---
Washington --- --- --- --- --- --- 103,744 6.8 92,512 6.0
West Virginia 31,079 8.3 38,326 10.2 43,464 11.5 31,600 8.5 24,620 6.5
Wisconsin 95,916 7.4 127,232 7.9 116,603 7.2 89,025 6.9 115,704 8.9
Wyoming 9,970 8.6 --- --- 7,239 6.0 --- --- 8,551 6.6
Note:
--- Data not available.
(2) Due to significant methodology changes in 2011 to the survey used to obtain these data, comparisons with previous years are not advisable. As only 16
states included the childhood asthma module in 2011, these data are not being included here until additional years using the new methodology are available.
Source: Behavioral Risk Factor Surveillance Survey, 2006-2010.
Table 14: Asthma – Current Prevalence in Children by State, 2006-2010 (1,2)
(1) Current prevalence was defined as answering yes to "Has the child ever been told by a doctor, nurse or other health professional that they had asthma?"
and "Do they still have asthma?" Percent with current asthma is among those ever diagnosed with asthma.
20102009200820072006
22
Year Number Rate Number Rate Number Rate
1989 475,000 19.3 204,000 17.1 271,000 21.3
1990 476,000 19.1 191,000 15.8 285,000 22.2
1991 490,000 19.6 221,000 18.2 269,000 20.9
1992 463,000 18.3 201,000 16.3 263,000 20.1
1993 468,000 18.3 191,000 15.3 278,000 21.1
1994 451,000 17.4 189,000 15.0 262,000 19.7
1995 511,000 19.5 210,000 16.5 301,000 22.4
1996 474,000 17.9 195,000 15.1 279,000 20.6
1997 484,000 17.9 204,000 15.4 279,000 20.2
1998 423,000 15.5 168,000 12.6 255,000 18.3
1999 478,000 17.4 190,000 14.1 288,000 20.4
2000 465,000 16.7 198,000 14.5 267,000 18.8
2001 454,000 16.0 186,000 13.4 268,000 18.5
2002 484,000 16.9 196,000 13.9 288,000 19.7
2003 574,000 19.8 232,000 16.3 342,000 23.2
2004 497,000 17.0 207,000 14.5 290,000 19.4
2005 489,000 16.6 192,000 13.3 296,000 19.7
2006 444,000 14.9 177,000 12.1 266,000 17.6
2007 456,000 15.2 182,000 12.3 274,000 17.9
2008 451,000 14.9 172,000 11.6 278,000 18.1
2009 479,000 15.7 192,000 12.7 288,000 18.5
2010 439,000 14.3 163,000 10.7 277,000 17.7
Notes:
(1) Due to rounding, numbers across may not add to the total number of hospital discharges.
Table 15: Asthma – Number of First-Listed Hospital Discharges and Rate per 10,000 population by
Sex, 1989-2010
Total (1)
Male Female
Source: National Center for Health Statistics. National Hospital Discharge Survey, 1989-2010.
23
Year Number Rate Number Rate Number Rate Number Rate Number Rate
1989 168,000 31.2 127,000 11.0 88,000 19.0 93,000 29.9 475,000 19.3
1990 169,000 30.8 119,000 10.3 86,000 18.2 102,000 32.4 476,000 19.1
1991 187,000 33.9 128,000 10.9 85,000 18.2 90,000 28.5 490,000 19.6
1992 193,000 34.4 117,000 10.0 78,000 16.1 76,000 23.6 463,000 18.3
1993 159,000 28.0 128,000 10.9 94,000 19.0 87,000 26.6 468,000 18.3
1994 169,000 29.5 125,000 10.6 80,000 15.7 76,000 22.9 451,000 17.4
1995 212,000 36.7 135,000 11.4 87,000 16.7 77000 23.0 511,000 19.5
1996 195,000 33.8 132,000 11.1 88,000 16.4 59,000 17.4 474,000 17.9
1997 214,000 35.8 117,000 9.6 88,000 15.9 65,000 19.2 484,000 17.9
1998 166,000 27.7 104,000 8.6 92,000 16.2 60,000 17.7 423,000 15.5
1999 190,000 31.5 122,000 10.0 94,000 15.9 73,000 21.3 478,000 17.4
2000 203,000 33.6 111,000 9.1 84,000 13.7 68,000 19.6 465,000 16.7
2001 182,000 30.1 104,000 8.4 92,000 14.3 76,000 21.4 454,000 16.0
2002 187,000 30.8 109,000 8.8 109,000 16.4 80,000 22.5 484,000 16.9
2003 213,000 35.0 127,000 10.2 125,000 18.3 109,000 30.5 574,000 19.8
2004 190,000 31.0 91,000 7.3 112,000 15.9 104,000 28.7 497,000 17.0
2005 159,000 26.2 98,000 7.8 119,000 16.4 112,000 30.5 489,000 16.6
2006 145,000 23.9 89,000 7.1 121,000 16.2 88,000 23.7 444,000 14.9
2007 151,000 24.8 86,000 6.9 123,000 16.0 96,000 25.4 456,000 15.2
2008 125,000 20.5 95,000 7.6 132,000 17.0 98,000 25.2 451,000 14.9
2009 135,000 21.9 97,000 7.7 132,000 16.7 115,000 29.0 479,000 15.7
2010 128,000 20.7 90,000 7.2 118,000 14.7 103,000 25.5 439,000 14.3
Notes:
Source: National Center for Health Statistics. National Hospital Discharge Survey, 1989-2010.
(1) Due to rounding, numbers across may not add to the total number of hospital discharges.
Table 16: Asthma – Number of First-Listed Hospital Discharges and Rate per 10,000 population by Age,
1989-2010
<15 15-44 45-64 65+ Total (1)
0
5
10
15
20
25
30
<15 15-44 45-64 65+
Ho
spit
al
Dis
cha
rge
Ra
te p
er
10
,00
0
Figure 5: Asthma – First-Listed Hospital Discharge Rate per 10,000 by
Age, 2010
Source: NHDS 2010.
24
Year Total (1)
White Black All Other Not Reported (2)
Total White Black All Other
1989 475,000 286,000 117,000 22,000 50,000 19.3 13.9 39.2 24.2
1990 476,000 263,000 116,000 19,000 78,000 19.1 12.7 38.3 19.8
1991 490,000 269,000 120,000 23,000 78,000 19.6 12.8 38.9 22.9
1992 463,000 215,000 134,000 25,000 89,000 18.3 10.2 42.8 23.8
1993 468,000 246,000 103,000 22,000 97,000 18.3 11.5 32.3 20.1
1994 451,000 227,000 125,000 29,000 70,000 17.4 10.5 38.6 26.0
1995 511,000 256,000 140,000 25,000 90,000 19.5 11.6 42.7 21.4
1996 474,000 237,000 133,000 33,000 70,000 17.9 10.8 40.1 27.6
1997 484,000 262,000 125,000 39,000 58,000 17.9 11.8 35.5 30.7
1998 423,000 222,000 115,000 28,000 58,000 15.5 10.0 32.2 21.0
1999 478,000 236,000 128,000 42,000 72,000 17.4 10.4 35.5 31.2
2000 465,000 234,000 117,000 18,000 79,000 16.7 10.3 32.9 10.3
2001 454,000 231,000 114,000 22,000 86,000 16.0 10.1 31.7 12.2
2002 484,000 244,000 131,000 19,000 90,000 16.9 10.5 36.0 9.9
2003 574,000 284,000 145,000 32,000 113,000 19.8 12.2 39.3 16.7
2004 497,000 236,000 126,000 35,000 100,000 17.0 10.0 33.9 17.3
2005 489,000 263,000 102,000 24,000 100,000 16.6 11.1 27.0 11.8
2006 444,000 228,000 112,000 14,000 89,000 14.9 9.6 29.3 6.7
2007 456,000 222,000 109,000 21,000 105,000 15.2 9.2 28.3 9.6
2008 451,000 216,000 114,000 27,000 94,000 14.9 8.9 29.4 12.2
2009 479,000 242,000 109,000 33,000 95,000 15.7 10.0 27.6 14.4
2010 439,000 221,000 114,000 27,000 78,000 14.3 9.0 28.5 11.6
Notes:
(2) Between 1989 and 2010, the number of discharges not reporting race increased dramatically. It appears that hospital disharges in Whites might be
disproportionately underestimated, particularly in later years. For this reason, comparisons between races should be made with caution.
Table 17: Asthma – Number of First-Listed Hospital Discharges and Rate per 10,000 population by Race, 1989-2010
Number Rate
Source: National Center for Health Statistics. National Hospital Discharge Survey, 1989-2010.
(1) Includes White, Black and Other Race discharges as well as those of an unspecified race.
25
Year Physician Offices Outpatient Departments
Emergency
Departments
1989 6,822 --- ---
1990 7,137 --- ---
1991 --- --- ---
1992 9,740 644 1,467
1993 11,340 1,022 1,686
1994 10,757 1,009 1,607
1995 9,026 1,301 1,865
1996 9,051 903 1,935
1997 9,834 1,097 1,917
1998 12,868 984 2,034
1999 9,498 1,310 1,997
2000 9,332 1,036 1,835
2001 11,280 1,286 1,665
2002 12,692 1,225 1,898
2003 12,855 1,512 1,753
2004 13,607 1,054 1,838
2005 12,823 1,304 1,770
2006 10,590 1,198 1,681
2007 13,872 1,408 1,754
2008 8,908 1,663 1,903
2009 10,564 1,174 2,070
Note:
Table 18: Asthma - Number of Visits to Physician Offices, Outpatient
Departments and Emergency Departments, 1989-2009
Sources: National Ambulatory Medical Care Survey, 1989-2009, and National Hospital Ambulatory
Medical Care Survey, 1992-2009.
--- Data not available.
26