tree growth response along seismic lines in alberta
TRANSCRIPT
Tree Growth Response Along Seismic Lines in Alberta
by
I.E. Bellal
Introduction
Oil, gas and to a lesser extent, coal exploration and total forest area. development activities result in forests being cut over consid- erable areas; seismic lines constitute the largest portion, Although cleared lines do benefit forest management and about 70°/o of such disturbances.2 Additional forest land other uses through improved access, they have two major losses occur from roads, powerline and pipeline right-of- impacts of interest to the forest land manager: ( I ) the imme- ways. In the 1970's, the petroleum industry rivaled the forest diate loss, unless salvaged, of merchantable timber on these industry in the amount of forest cleared in Alberta (Dancik et cleared areas, and (2) their effect on the growth of stands a/. 1979). According to that report, 234 000 ha had been dis- adjacent to the openings. turbed between 1956 and 1976 by exploration lines alone, compared with 255 692 ha that were harvested for timber. In The immediate loss of timber can be estimated by stan- 1976, the figures were 14 483 ha for the petroleum industry dard forest industry inventory techniques, and was not the and 19 068 ha for the forest industry. To put these figures in object of this study. The assessment of possible effects On perspective, it should be noted that all nonrenewable growth is a more difficult problem. Casual observations of resource-related disturbances amounted to under 1 O/O of the trees on stand edges and studies along logging trails and
roads in other forest cover types (Landbeck 1965; Pfister
'Northern Foresty Centre, Canad~an Forestry Serv~ce, 5320 - 122 Street, 1969) suggested greater diameter and height growth of trees Edmonton. Alberta T6H 355 adjacent to openings compared with trees located within the 2Hardy Associates ( I 978) Ltd 1981. Forest depletion by energy development in stands. the green area of Alberta. Unpublished report.
February 1986 the Forestry Chronicle 29

The purpose of this study was to assess tree growth along cut lines for the major tree species and a range of stand conditions, and to estimate change in future yields for the entire forest area involved (i.e., lines cleared plus adjacent stocked area).
Sampling Area and Methods
The most valuable timber, mainly coniferous, is located in the western part of Alberta. This is also the prime area for oil and gas exploration. Sampling was concentrated in the Edson and Whitecourt forests, and to a lesser extent in the Rocky- Clearwater, Grande Prairie, and Slave Lake Forests (Figure 1 ). Emphasis was on sampling lodgepole pine (Pinus contorta Dougl. var, latifolia Engelm.) and white spruce (Picea glauca (Moench) Voss) cover types, but some black spruce (Picea mariana (Mill.) B.S.P.) and hardwood (e.g., aspen, Populus tremuloides Michx.) types were also included. In the summer of 1981,192 sample transacts were established in stand types between 20 and 100 years old (1 0 years and over in aspen) to represent the range of site conditions present in the area (Table 1 ).
Only stands with cut lines established at least 10 years earlier were sampled. First, total mean height (H) and age at stump height of three or four dominant and codominant trees were determined. In any one stand, up to three sample tran- sects (plots) were established using a relascope-line sam- pling procedure (Figure 2) where the following information was recorded:
a. length of transect, L = H (m); b. aspect and slope; c. diameter at breast height (dbh) (cm) of all "in" trees by
species and distance from edge (m); d. ten (1 0) sample trees (8 dominants and codominants, 2
intermediates) were selected in pure stands where at least 80% of basal area (BA) was in one species; in mixed two-species stands, 14 trees were selected in proportion to the species mix (10 dominants and codominants and 4 intermediates). Sample trees were marked to identify the side toward the cut line and felled. A stem disc was obtained from each tree sampled at breast height. In the laboratory, one surface of each disc was sanded and four radii marked: R1 - radius towards line opening; R2 - radius away from line opening; R3 and R4 -two mean radii based on the section's diame-
ter under bark.
The following points were marked on each radius: (1 ) time of line clearing, (2) 5 years before clearing, (3) 2 years
II -
'River Slave Lake
Forest
30
Grande Prairie Slave Lake
Figure 1. Provincial forests in which sample plots were located.
after, then every 5 years after clearing until the cambrium of the current year's annual ring was reached. Measurements were done on an ADDO-X ring measuring machine.
Analysis
The analysis consisted of three phases. The first series of analyses was conducted to identify and quantify (screen) the effect of all the measured independent variables that influ- ence tree growth along seismic lines in different periods before and after line clearing. Of greatest interest was deter- mining the importance of the tree variable "distance from stand edge" in explaining variation in radial growth after line clearing. Nonsignificance of the distance variable would sug-
Table 1. Number of sample transects by species and age.
Age class Species1 0-10 11-20 21-30 31-40 41-50 51-60 61-70 71-80 81-90 91-100 101-110 111-120 121+ Total
1 P 5 30 16 27 2 6 13 2 1 1 103
WS 2 5 15 3 25
bS 2 12 2 2 1 2 3 24
tA 2 3 18 15 2 40
Total 2 8 50 38 56 7 8 14 4 4 1 192
11 P = lodgepole pine wS = white spruce bS = black spruce tA = trembling
February 1986 the Forestry Chronicle

1 . 2 ....... 10 Trees sampled 1, . 1 , ,1 , ....... Tree distance from cut l ~ n e
L =(Length Of Transect)
Independent variables: LR distance ratio: a fraction of tree distance to
length of transect LR2 LR squared AG EAC tree age at breast height, at the time of line
clearings AD quadratic mean stand diameter at the time
of sampling (cm) R AC average stem radius at bh at the time of
sampling (cm) R AC' RAC squared H/A mean dominant height over age at stump
height at the time of sampling (m) B A stand basal area m2/ ha at the time of sam-
pling RD BAI JAD, a stand density index (after Cur-
tis 1982) YSC years since line clearlng
Figure 2. Sampling procedure. A preliminary analysis of the data showed no significant differences in radial increment between stem radius towards opening and radius away from opening in the growth periods
gest lack of influence on tree growth, The second series of following line clearing. Therefore, in the ensuing analysis the
analyses was performed to derive regression functions for average Of the stem radii per was used.
estimating tree diameter growth at breast height adjacent to seismic lines under the ranae of conditions samoled. The final Results and Discussion phase was to convert those tree growth relaiionships into stand growth. Screening for Variables Affecting Periodic Increment
The analyses of radial increment for the four species groups - lodgepole pine, white spruce, black spruce, and trembling aspen were conducted by multiple linear regression techniques using backward elimination that included tree and stand characteristics as independent variables.
The dependent variables, all radial increments in cm, were:
INC -5 for the 5 years preceding line clearing INC +2 for the first 2 years after line clearing INC +305 between 3-5 years (i.e., 3-year period after
clearing INC+6.10 for the 5-year period 6-1 0 years after line
clearing INC +11 01 5 for the 5-year period 11 -1 5 years after line
clearing INC +I6020 for the 5-year period 16-20 years after line
clearing RlNC in any one of the above periods after line
clearing (mm/yr)
These analyses found that prior to line clearing, six signif- icant (P < 0.01 ) variables explained as much as56% variation in radial increment of lodgepole pine, and about 47% in aspen.
In the 2-year period after line clearing in pine, the number of significant variables dropped to three and the amount varia- tion explained to 36%. This suggests that clearing temporarily increased the amount of random variation in increment. In the subsequent periods, the amount of variations explained increased and tree distance from edge (LR) emerged as the second most important variable after age (AGEAC).
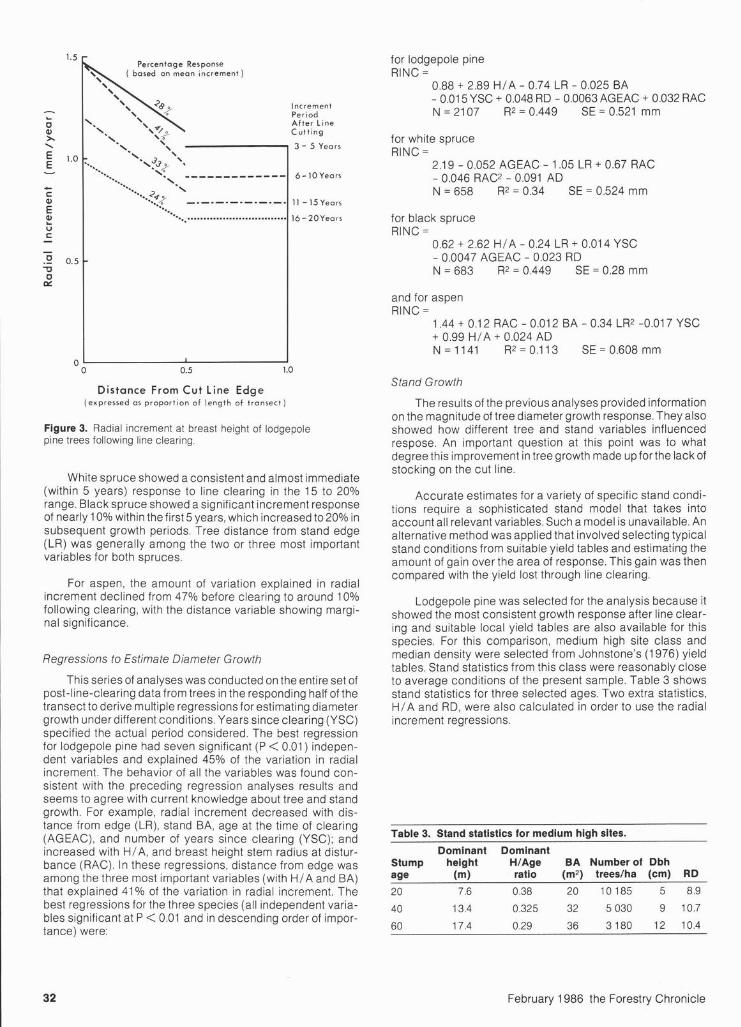
Table 2 shows the amount of variation in increment explained by AGEAC and LR in pine. These regressions de- scribe tree increment from stand edge to halfway (LR < 0.5) along the transect, as related analyses indicated that release effect extends only to half the total tree height into the stand. Trends plotted from these regressions are shown in Figure 3. Overall, the increase in radial increment at breast height var- ied from 24% for the 15-20-year period to 41 O/O for the 5-10- year period after line clearing. Thus, highest response occurred during the first 10 years after clearing.
Table 2. Breast height radial increment regression statistics for lodgepole pine.
Regression coefficeints Mean increment Number Response No resp.
Dependent Mean XI = LR X, = AGEAC of half half Response variable AGEAC a bl b2 observ. R2 or 1'2 mmlyear O/O
INC+3.5 26.8 2.09 -0.702 -0.023 577 0.388 1 .37 1 .06 28 26.8 1.95 NA' -0.022 577 0.369 1 .37 1 .06 28
INC+6.10 26.3 1.91 -1 .OO -0.01 7 549 0.351 1.28 0.91 41 26.3 1.72 N A -0.01 6 549 0.293 1.28 0.91 41
INC+1 1.15 28.4 1.59 -0.72 -0.01 4 309 0.240 1.04 0.78 33 28.4 1.44 N A -0.01 4 309 0.205 1.04 0.78 33
1 Not appl~cable.
February 1986 the Forestry Chronicle 31
Increment Period After Line Cut t ing
3 - 5 Years
6-lo years
11 - 15Years
16-20Years
Distance From Cut Line Edge (expressed as proportion of length of transect)
Figure 3. Radial increment at breast height of lodgepole pine trees following line clearing.
White spruce showed a consistent and almost immediate (within 5 years) response to line clearing in the 15 to 20% range. Black spruce showed a significant increment response of nearly 10% within the first 5 years, which increased to20°/0 in subsequent growth periods. Tree distance from stand edge (LR) was generally among the two or three most important variables for both spruces.
For aspen, the amount of variation explained in radial increment declined from 47% before clearing to around 10% following clearing, with the distance variable showing margi- nal significance.
Regressions to Estimate Diameter Growth
This series of analyses was conducted on the entire set of post-line-clearing data from trees in the responding half of the transect to derive multiple regressions for estimating diameter growth under different conditions. Years since clearing (YSC) specified the actual period considered. The best regression for lodgepole pine had seven significant (P < 0.01 ) indepen- dent variables and explained 45% of the variation in radial increment. The behavior of all the variables was found con- sistent with the preceding regression analyses results and seems to agree with current knowledge about tree and stand growth. For example, radial increment decreased with dis- tance from edge (LR), stand BA, age at the time of clearing (AGEAC), and number of years since clearing (YSC); and increased with HIA, and breast height stem radius at distur- bance (RAC). In these regressions, distance from edge was among the three most important variables (with H I A and BA) that explained 41% of the variation in radial increment. The best regressions for the three species (all independent varia- bles significant at P < 0.01 and in descending order of impor- tance) were:
for lodgepole pine RlNC =
0.88 + 2.89 H I A - 0.74 LR - 0.025 BA - 0.01 5 YSC + 0.048 RD - 0.0063 AGEAC + 0.032 RAC N = 21 07 R2 = 0.449 SE = 0.521 mm
for white spruce RlNC =
2.1 9 - 0.052 AGEAC - 1.05 LR + 0.67 RAC - 0.046 RAC2 - 0.091 AD N = 658 R2 = 0.34 SE = 0.524 mm
for black spruce RlNC =
0.62 + 2.62 H/A - 0.24 LR + 0.014 YSC - 0.0047 AGEAC - 0.023 RD N = 683 R2 = 0.449 SE = 0.28 mm
and for aspen RlNC =
1.44 + 0.1 2 RAC - 0.01 2 BA - 0.34 LR' -0.01 7 YSC + 0.99 H IA + 0.024 AD N = 11 41 R2 = 0.1 13 SE = 0.608 mm
Stand Growth
The results of the previous analyses provided information on the magnitude of tree diameter growth response. They also showed how different tree and stand variables influenced respose. An important question at this point was to what degree this improvement in tree growth made up for the lack of stocking on the cut line.
Accurate estimates for a variety of specific stand condi- tions require a sophisticated stand model that takes into account all relevant variables. Such a model is unavailable. An alternative method was applied that involved selecting typical stand conditions from suitable yield tables and estimating the amount of gain over the area of response. This gain was then compared with the yield lost through line clearing.
Lodgepole pine was selected for the analysis because it showed the most consistent growth response after line clear- Ing and suitable local yield tables are also ava~lable for this species. For this comparison, medium high site class and median density were selected from Johnstone's (1 976) yield tables. Stand statistics from this class were reasonably close to average conditions of the present sample. Table 3 shows stand statist~cs for three selected ages. Two extra statistics, H I A and RD, were also calculated in order to use the radial increment regressions.
Table 3. Stand statistics for medium high sites.
Dominant Dominant Stump height HIAge BA Number of Dbh age (m) ratio (m2) treeslha (cm) RD
2 0 7.6 0.38 20 10185 5 8.9
40 13.4 0.325 32 5 030 9 10.7
60 17.4 0.29 36 3180 12 10.4
February 1986 the Forestry Chronicle
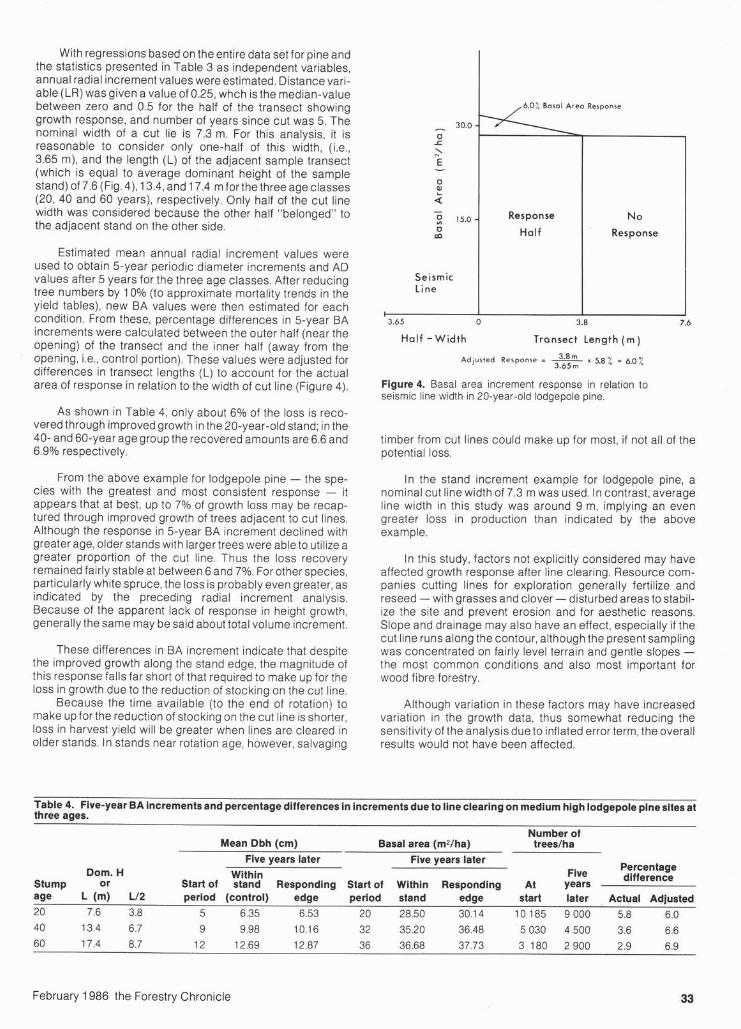
With regressions based on the entire data set for pine and the statistics presented in Table 3 as independent variables, annual radial increment values were estimated. Distance vari- able (LR) was given a value of 0.25, whch is the median-value between zero and 0.5 for the half of the transect showing growth response, and number of years since cut was 5. The nominal width of a cut lie is 7.3 m. For this analysis, it is reasonable to consider only one-half of this width, (i.e., 3.65 m), and the length (L) of the adjacent sample transect (which is equal to average dominant height of the sample stand) of 7.6 (Fig. 4), 13.4, and 17.4 m forthe three age classes (20, 40 and 60 years), respectively. Only half of the cut line width was considered because the other half "belonged" to the adjacent stand on the other side.
Estimated mean annual radial increment values were used to obtain 5-year periodic diameter increments and AD values after 5 years for the three age classes. After reducing tree numbers by 10% (to approximate mortality trends in the yield tables), new BA values were then estimated for each condition. From these, percentage differences in 5-year BA increments were calculated between the outer half (near the opening) of the transect and the inner half (away from the opening, i.e., control portion). These values were adjusted for differences in transect lengths (L) to account for the actual area of response in relation to the width of cut line (Figure 4).
As shown in Table 4, only about 6% of the loss is reco- vered through improved growth in the 20-year-old stand; in the 40- and 60-year age group the recovered amounts are 6.6 and 6.9% respectively.
From the above example for lodgepole pine - the spe- cies with the greatest and most consistent response - it appears that at best, up to 7% of growth loss may be recap- tured through improved growth of trees adjacent to cut lines. Although the response in 5-year BA increment declined with greater age, older stands with larger trees were able to utilize a greater proportion of the cut line. Thus the loss recovery remained fairly stable at between 6 and 7%. For other species, particularly white spruce, the loss is probably even greater, as indicated by the preceding radial increment analysis. Because of the apparent lack of response in height growth, generally the same may be said about total volume increment.
These differences in BA increment indicate that despite the improved growth along the stand edge, the magnitude of this response falls far short of that required to make up for the loss in growth due to the reduction of stocking on the cut line.
Because the time available (to the end of rotation) to make up for the reduction of stocking on the cut line is shorter, loss in harvest yield will be greater when lines are cleared in older stands. In stands near rotation age, however, salvaging
,6.0% Basal Area Response
0
? Q - 51 15.0- Response N o O
m Half Response
Seismic Line I I I
3.65 0 3.8 7.6
Half - W i d t h Tronsect Length ( m )
Adjusted Response = x 5.8 % = 6.0%
Figure 4. Basal area increment response in relation to seismic line width in 20-year-old lodgepole pine.
timber from cut lines could make up for most, if not all of the potential loss.
In the stand increment example for lodgepole pine, a nominal cut l ~ne width of 7.3 m was used. In contrast, average line width in this study was around 9 m, implying an even greater loss in production than indicated by the above example.
In this study, factors not explicitly considered may have affected growth response after line clearing. Resource com- panies cutting lines for exploration generally fertilize and reseed -with grasses and clover - disturbed areas to stabil- ize the site and prevent erosion and for aesthetic reasons. Slope and drainage may also have an effect, especially if the cut line runs along the contour, although the present sampling was concentrated on fairly level terrain and gentle slopes - the most common conditions and also most important for wood fibre forestry.
Although variation in these factors may have increased variation in the growth data, thus somewhat reducing the sensitivity of the analysis dueto inflated error term, the overall results would not have been affected.
Table 4. Five-year BA increments and percentage differences in increments due to line clearing on medium high lodgepole pine sites at three aaes.
Number of Mean Dbh (cm) Basal area (mzlha) treeslha
Five years later Five years later Dom. H Within Five Percentage
Stump or difference
Start of stand Responding Start of Within Responding At Years age L (m) Ll2 period (control) edge period stand edge start later Actual Adjusted 20 7.6 3.8 5 6.35 6.53 20 28.50 30.1 4 10 185 9 000 5.8 6.0
February 1986 the Forestry Chronicle 33
The chief causal factors of improved tree growth along openings are greater availability of (1) nutrients and moisture, and (2) space and sunshine. With time, the effect of the latter is generally manifested by increases in crown-stem dimension ratios (i.e., crown length over total height, or crown width over diameter). Analysis of the present data, covering a maximum of 25 years after line clearing, has not yet shown a significant change in these ratios.
Summary And Conclusions
1. Line clearing in forest stands in western Alberta has resulted in a significant and consistent positive growth response in tree radial increment at breast height for the three major coniferous species, lodgepole pine, white spruce, and black spruce. Aspen showed no consistent response.
2. The largest response was in lodgepole pine, where radial increment increased as much as 40% within a distance of one-half dominant height from stand edge and within 10 years after line clearing but leveled off to about 20% in the following 10 years. White spruce and black spruce had responses between 15 and 20%.
3. The most important factors affecting tree growth and response to opening were: dominant height over age at the time of the survey, distance from stand edge, age at the time of clearing, and number of years since clearing.
4. The lack of significant growth response in aspen may in part be due to the clonal habit of the species and difficulties in accurate growth determination arising from the pres- ence of false rings,
5. Stand growth - the ultimate criterion in assessing response - was evaluated from BA estimates, which in turn are directly related to volume growth. With radial increment regressions developed for lodgepole pine, together with appropriate yield table statistics, it was found
that a maximum of only about 7% of the growth loss due to line clearing is recaptured through improved tree growth along such openings in medium-density stands on medium high sites.
6. Losses of about the same magnitude as for lodgepole pine may be expected for black spruce; for white spruce the losses would be somewhat greater and for aspen substan- tially greater.
7. This study conclusively shows that although cutting lines in forest stands stimulates tree growth along such openings, the magnitude of growth response falls far short of the wood lost due to cutting. Salvaging timber from cut lines in older stands however, would greatly help to minimize this loss during the current rotation.
Acknowledgements A number of people worked on this cooperative study between
the Forest Research Branch and the Alberta Energy and Natural Resources and the Canadian Forestry Serv~ce. Special credit is due to Ted Mueller and Albert Dobokay, Forest Research Branch, Alberta Forest Service, who did a major portion of the field sampling and stem analysis. D. Kuhnke, Canadian Forestry Service, conducted the necessary computer processing and statistical analysis and was also involved in report preparation.
References
Curtis, R.O. 1982. A simple index of stand density for Douglas-fir. For. Sci. 28: 92-94.
Dancik. B.P.. D.I. Crosslev. J.F. Revnolds and A.D. Crerar. 1979. i h e environmental effects of-forestry operations in Alberta. Environmental Council of Alberta.
Johnstone, W.D. 1976. Variable density yield tables for natural stands of lodgepole pine in Alberta. Fish. Environ. Can., Can. For. Serv., Ottawa, Ont., For. Tech. Rep. 20.
Landbeck, H. 1965. Road width and edge effect in Scots pine. (Origi- nal in German). Arch. Forstl. 14: 41 -59.
Pfister, R.D. 1969. Effect of roads on growth of western white pine plantations in northern Idaho. USDA For, Serv., Intermt. For. Range Exp. Stn. Res. Pap. 65.
Tel.: (819) 326-3559
TIMMERLINN
TlMMERLlNN k E k PROFESSIONAL AND TECHNICAL SERVICES
IN FORESTRY AND ENVIRONMENTAL SCIENCES
R.R. No. 2, STE. AGATHE DES MONTS, QUE. J8C 228
February 1986 the Forestry Chronicle