treasury risk management - citibank · average r$2.35 for ambev’s 2015 dollar cogs hedge in...
TRANSCRIPT
Treasury Risk
Management
Macro Trends and the
Implications for Corporations
Andre Secron
Head of Foreign Exchange Corporate Sales
and Structuring
Latin America
+1 (212) 723-1351
Treasury and Trade Solutions
1. Market Trend—The Strong US$ Cycle
2. The Implications of the Strong US$ for Corporations
3. Considerations for Hedging Policies
4. Key Takeaways

1. Market Trend—The Strong US$ Cycle
2. The Implications of the Strong US$ for Corporations
3. Considerations for Hedging Policies
4. Key Takeaways

70
90
110
130
150
1973 1978 1983 1988 1993 1998 2003 2008 2013 2018
History Suggests Continued Dollar Appreciation in Current Cycle
Since the inception of floating currencies, peak-to-trough cycles in the US$ have lasted between 6–9 years. With potentially 3–6 years remaining in current cycle, US$ may
strengthen by a further 10–30%. And while cycles may revert eventually, the long-run may encapsulate significant volatility impacting current performance.
US$ Since 1973
US Traded Weighted Real Major Currencies Dollar Index
6–7 years
60% (7.5% ann.)
7–8 years
(40)% (5)% ann.)
6–7 years
60% (7.5% ann.) ~9 years
(33)% (4)% ann.)
Current Cycle
Potentially 3–6 years
Remaining Potential 10–30%
US Corporations Benefited
Greatly from the Previous
9 year Cycle of US$ Weakness
Source: Bloomberg.
4

US$ Appreciation Projected Across the Board
Source: Bloomberg, Citi GEOS.
Note: Projections based on Citi FX forecasts. Market data as of 1/19/2015.
DM Currencies EM Currencies Commodity Currencies
10.9%
-0.6%
3.3%
-0.6%
2.6%
-6.6%
3.9%
0.4%
16.1%
13.7%
7.4%
11.6%
8.8% 8%
10% 10%
7.1% 7.1%
Current 3.22 634 15.1 2590 1.08 121 1.49 0.77 1.26 1Y Forecast 3.57 655 15.5 2690 0.93 130 1.37 0.7 1.35
Long Term 3.2 630 14.1 2600 0.95 135 1.38 0.7 1.35
MXN
5
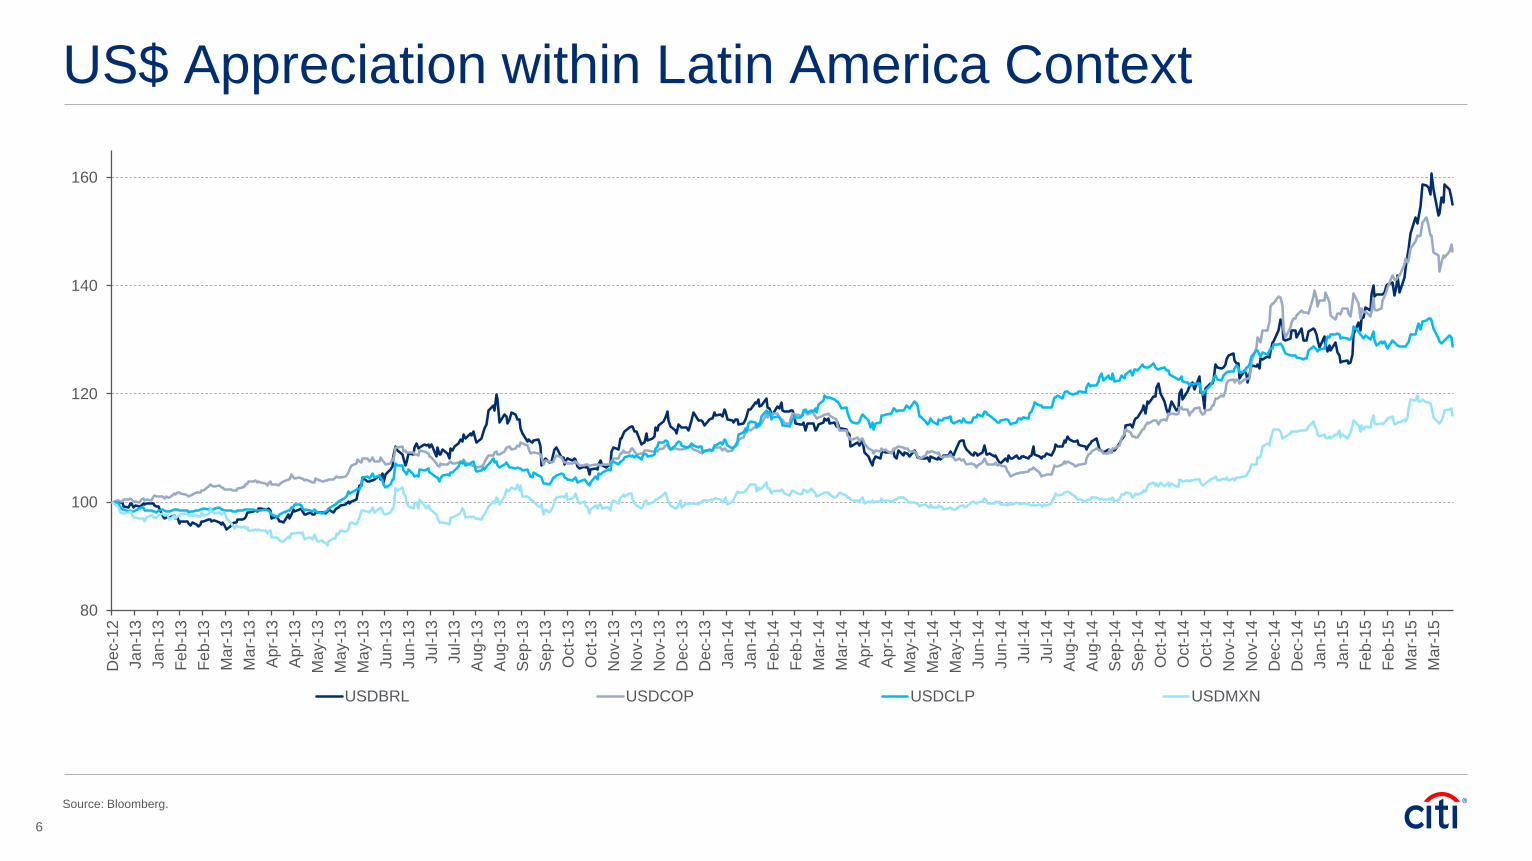
US$ Appreciation within Latin America Context
Source: Bloomberg.
80
100
120
140
160
Dec-1
2
Ja
n-1
3
Ja
n-1
3
Feb-1
3
Feb-1
3
Ma
r-13
Ma
r-13
Apr-
13
Apr-
13
Ma
y-1
3
Ma
y-1
3
Ma
y-1
3
Ju
n-1
3
Ju
n-1
3
Ju
l-1
3
Ju
l-1
3
Aug
-13
Aug
-13
Sep
-13
Sep
-13
Oct-
13
Oct-
13
Nov-1
3
Nov-1
3
Nov-1
3
Dec-1
3
Dec-1
3
Ja
n-1
4
Ja
n-1
4
Feb-1
4
Feb-1
4
Ma
r-14
Ma
r-14
Apr-
14
Apr-
14
Ma
y-1
4
Ma
y-1
4
Ma
y-1
4
Ju
n-1
4
Ju
n-1
4
Ju
l-1
4
Ju
l-1
4
Aug
-14
Aug
-14
Sep
-14
Sep
-14
Oct-
14
Oct-
14
Oct-
14
Nov-1
4
Nov-1
4
Dec-1
4
Dec-1
4
Ja
n-1
5
Ja
n-1
5
Feb-1
5
Feb-1
5
Ma
r-15
Ma
r-15
USDBRL USDCOP USDCLP USDMXN
6

US$—The Multi-Year Bull Trend: Why?
Stronger Expected US
Economic Growth
Declining unemployment rate (under 6%)
Strengthening activity in industrials and
service sectors
Improving personal consumption
expenditures
3% forecasted GDP growth in 2015–2016
Divergence in Central
Bank Action
Sustained US economic recovery
supporting US Fed tightening
Persistent sluggish growth in Eurozone and
Japan supporting further easing
Unexpected central bank actions (i.e.
removal of EURCHF floor) drive volatility
Lower Oil Prices
Oil producing countries experiencing
declining revenues, increasing budget
deficits, and adverse exchange rate impact
Slowdown in Expected
EM Growth
China’s slower transition towards a
domestic consumption driven economy
Broader EM headwinds due to current
account deficits
GDP growth slowing to low 7% in China
Expectation of Sluggish Growth
in Eurozone and Japan
Persistent low/negative inflation despite
unprecedented easing
Weak labor markets with
structural challenges
Stronger
US$
7

1. Market Trend—The Strong US$ Cycle
2. The Implications of the Strong US$ for Corporations
3. Considerations for Hedging Policies
4. Key Takeaways

Strong Dollar Already Affecting Corporates
Our largest exposure remains the euro. […] we’ve hedged
roughly 50% of our 2015 euro exposure […] Considering
these impacts, FX will be a sales headwind for 2015 [ … ],
which works out to about $0.10 per share.
Dollar’s rise against the ringgit was partly to blame for
lower quarterly revenues. About 70% of the company’s
debt is in U.S. dollars, and its bond yields spiked as the
ringgit fell nearly 9% in the past six months.
3M estimates that year-on-year currency effects, including
hedging impacts, decreased net income attributable to 3M
by approximately $10 million for the three months ended
September 30, 2014.
The net income and EPS include a charge of EUR 180
million from negative FX revaluation in the third quarter
due to the strong strengthening of the dollar. […] we
increased the pace of hedging activity due to the favorable
dollar environment.
Source: Bloomberg.
9

Stronger US$ Impacts Multiple Corporate Dimensions A stronger US$ impacts corporates across the financial statements, potentially pressuring margins, overseas valuations, and the
ability to compete in the future. Prudent risk management can help to mitigate these concerns.
Timing mismatch between contract and payment in a foreign currency
Competitor pricing
Lower channel costs
Mismatches between sales in one currency and costs in another currency
Market volatility as well as uncertainty in revenues
Foreign-based subsidiaries may create earnings volatility
Can impact earnings per share (EPS), credit ratings and cost of capital
Potential covenant breaches
Interest cost can be minimized
Match currency exposure of cash flows (CF) and net assets
Protecting shareholder’s investments in foreign subsidiary
Expected repatriation of overseas cash
Increasing global footprint
Potential cross-border acquisitions
Internal investment: Predicable cash flow = more investment
Sufficient liquidity
Operational
Financial
Economic/Strategic
Transactional
Cash Flow
Operating Earnings
Debt/Liabilities
Assets
Business Growth
Competition
Capital
Income
Statement
Balance Sheet
10

Who are Most Impacted?
Multinational Corporates
US multinationals with significant
sales abroad will see their foreign
cash flows erode
Non-US multinationals with US
revenue exposures will benefit from
stronger US$
Non-US multinationals that fund in
US$ will see negative impact on their
balance sheet as US$ strengthens
US$-Funded EM Corporates
EM multinationals with large US
revenue exposures will benefit from
stronger US$
EM multinationals that fund in US$
will see negative impact on their
balance sheet as US$ strengthens
Global Commodity Producers
While revenues of foreign oil
producers will decrease due to falling
oil prices, a stronger US$ will
mitigate the negative impact
US producers will benefit from
lower foreign production costs as
US$ strengthens
Careful analysis is key to
understanding how FX/commodity
correlation impacts corporate top and
bottom lines
11

1. Market Trend—The Strong US$ Cycle
2. The Implications of the Strong US$ for Corporations
3. Considerations for Hedging Policies
4. Key Takeaways
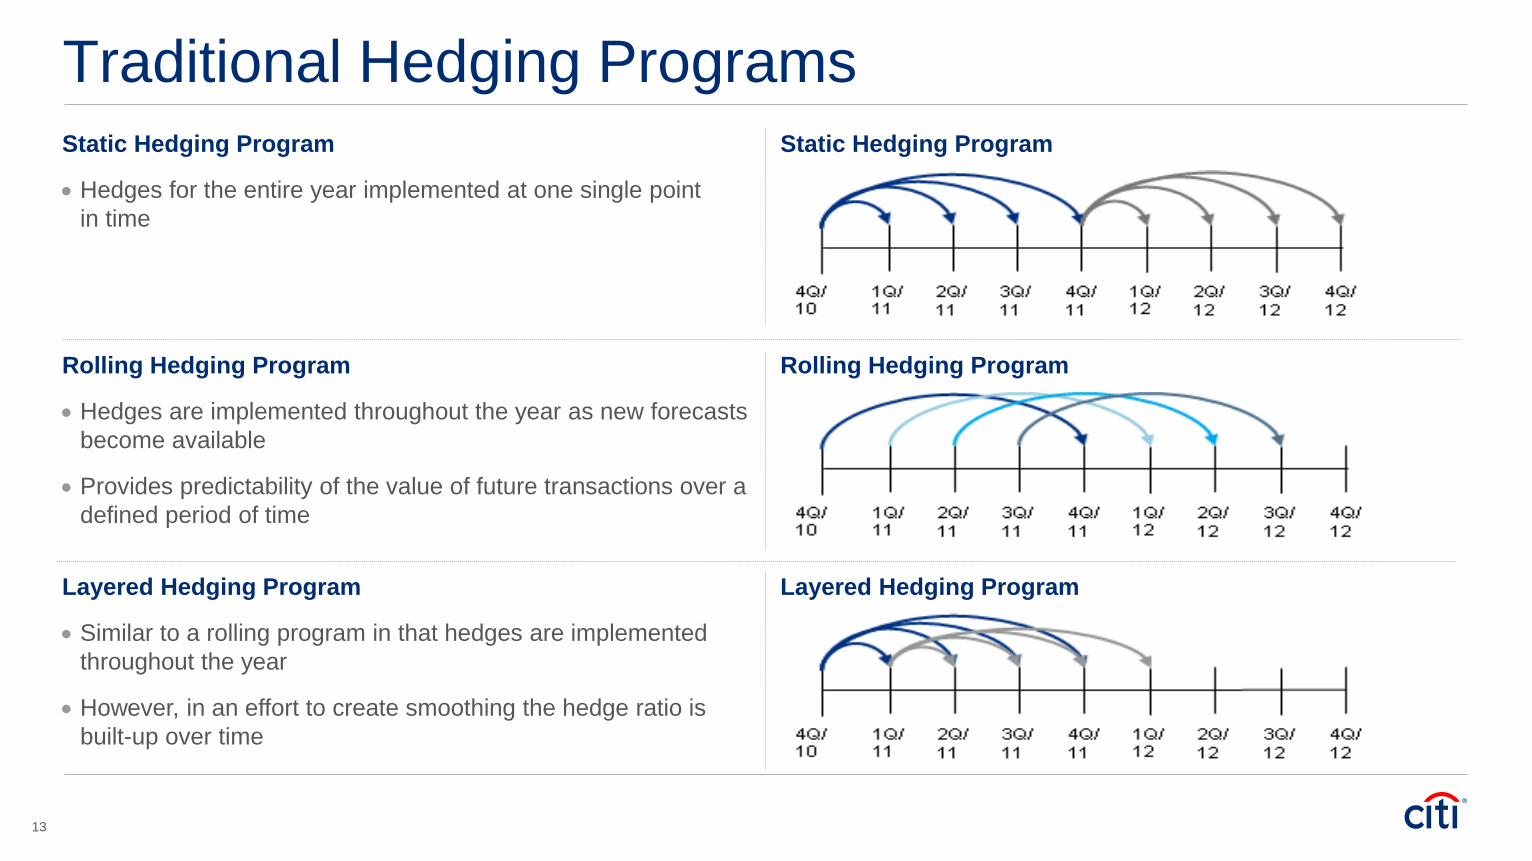
Traditional Hedging Programs Static Hedging Program
Hedges for the entire year implemented at one single point
in time
Rolling Hedging Program
Hedges are implemented throughout the year as new forecasts
become available
Provides predictability of the value of future transactions over a
defined period of time
Layered Hedging Program
Similar to a rolling program in that hedges are implemented
throughout the year
However, in an effort to create smoothing the hedge ratio is
built-up over time
Static Hedging Program
Rolling Hedging Program
Layered Hedging Program
13

A Customized Solution to Protect Against US$ Strength
Front-loading the hedging schedule to increase value at risk (VaR) reduction
Adding options to the mix of hedge instruments to maintain the flexibility lost from front-loading. This is particularly important as the
strengthening in the US$ is unlikely to be in a straight line over time
Standard Layered Hedging
Dynamic Layered Hedging
Extending hedge duration
14

Portfolio Diversification Portfolio diversification can be a powerful tool to stabilize the performance of a hedging portfolio. In particular, the strategy is highly
effective in periods of increased market volatility.
CitiFX ran a backtest analysis of the hypothetical performance of four different hedging strategies and an unhedged portfolio
The simulation assumes a quarterly rolling hedging strategy. Follows ahead the results of the combined portfolios
Hedging
Period
FX Spot at
Beginning
FX Spot at
End Forward Strategy A Strategy B Strategy C Portfolio1 Portfolio 2
1Q13 13.68 12.61 13.92 13.64 13.50 13.92 13.16 13.42
2Q13 12.96 12.27 13.21 12.95 12.82 13.21 12.64 12.81
3Q13 12.61 12.62 12.84 12.59 12.46 12.62 12.58 12.57
4Q13 12.27 12.99 12.46 12.39 12.99 12.55 12.88 12.73
1Q14 12.62 13.51 12.83 12.68 12.44 12.90 13.09 12.88
2Q14 12.99 13.11 13.17 12.90 12.77 13.11 13.02 12.97
3Q14 13.51 12.96 13.69 13.42 13.28 13.69 13.22 13.34
15

Portfolio Diversification (Cont’d)
12.00
12.50
13.00
13.50
14.00
1Q 2013 2Q 2013 3Q 2013 4Q 2013 1Q 2014 2Q 2014 3Q 2014
FX Spot at End Forward Portfolio1 Porfolio 2
FX Spot at End Forward Strategy A Strategy B Strategy C
Portfolio 1 50% 0% 0% 25% 25%
Portfolio 2 25% 0% 25% 25% 25%
16

1. Market Trend—The Strong US$ Cycle
2. The Implications of the Strong US$ for Corporations
3. Considerations for Hedging Policies
4. Key Takeaways

Key Takeaways—Risks, Implications and Solutions
Risks
Implications
Solutions
Widening growth prospects between US and rest of world, and sustained divergence in central bank policies will
drive US$ stronger in current cycle. Meanwhile, corporates have become more global with a higher percentage
of revenues coming from overseas
Exposure to FX risk is a predominant driver of earnings volatility, while changing volatility and correlation
dynamics today may negatively impact corporate earnings
The turn of US$ cycle from weakness to strength requires corporates today to review and adjust their risk
management strategies
Holistic assessment of a corporate’s market risk exposures that takes into consideration correlation and volatility
dynamics are critical to effective risk management
Effective risk management can potentially boost valuation and improve growth prospects. Corporates should
adjust hedging strategies and capital deployment policies in today’s strong US$ cycle
Stronger US$ may affect corporates in multiple dimensions, with implications on cash flows, balance sheets, and
business strategies
The implications vary for different types of global corporates, depending on their market risks exposures
Many corporates have reported negative impacts from US$ strength in recent quarters with potential for more
downside risk in coming quarters
18

Key Takeaways—Tangible Results
“…dollar COGS hedge is the most “attractive” in several years. A second factor is, following Citi’s recently revised f/x estimate, the value of
Ambev’s dollar COGS hedge for 2015 has increased significantly. This is true both for its own earnings growth potential as well as relative
to its beverage peers (brewers and bottlers alike) who either can’t hedge their dollar-linked COGS against a weaker f/x or hedge less
effectively. We incorporate Citi’s average 2015 real/dollar f/x estimate of R$2.83 (from Jan/26), 13% weaker than the estimate in October
(before the elections), implying a 20% depreciation YoY. More importantly, this average market rate is well above our assumption of an
average R$2.35 for Ambev’s 2015 dollar COGS hedge in Brazil, which we believe no other beverage peer has. R$2.35 implies a 7%
weaker hedge than 2014 (when it was 15% higher YoY), suggesting less pressure compared to prior years. The benefit of the hedge is
partly offset by less favorable commodities hedge this year versus last year.”
Alexander Robats, Head of Citi's Latin American Consumer Staples Equity Research team. In the Food/Beverage/HPC sectors –
January 28th, 2015
“Based on a less onerous beverage tax (see note), more than expected Brazil margin expansion, recent sharp currency
depreciation (increasing the value of its dollar COGS hedge), and an undemanding valuation, we argue Ambev’s de-rating is over
and upgrade to Buy.”
19

Citi believes that sustainability is good business practice. We work closely with our clients, peer financial institutions, NGOs and other partners to finance solutions to climate change, develop industry standards, reduce our own
environmental footprint, and engage with stakeholders to advance shared learning and solutions. Highlights of Citi’s unique role in promoting sustainability include: (a) releasing in 2007 a Climate Change Position Statement, the
first US financial institution to do so; (b) targeting $50 billion over 10 years to address global climate change: includes significant increases in investment and financing of renewable energy, clean technology, and other carbon-
emission reduction activities; (c) committing to an absolute reduction in GHG emissions of all Citi owned and leased properties around the world by 10% by 2011; (d) purchasing more than 234,000 MWh of carbon neutral power for
our operations over the last three years; (e) establishing in 2008 the Carbon Principles; a framework for banks and their U.S. power clients to evaluate and address carbon risks in the financing of electric power projects; (f)
producing equity research related to climate issues that helps to inform investors on risks and opportunities associated with the issue; and (g) engaging with a broad range of stakeholders on the issue of climate change to help
advance understanding and solutions.
Citi works with its clients in greenhouse gas intensive industries to evaluate emerging risks from climate change and, where appropriate, to mitigate those risks.
efficiency, renewable energy and mitigation
© 2015 Citibank, N.A. All rights reserved. Citi and Citi and Arc Design are trademarks and service marks of Citigroup Inc. or its affiliates and are used and registered throughout the world.
IRS Circular 230 Disclosure: Citigroup Inc. and its affiliates do not provide tax or legal advice. Any discussion of tax matters in these materials (i) is not intended or written to be used, and cannot be used or
relied upon, by you for the purpose of avoiding any tax penalties and (ii) may have been written in connection with the "promotion or marketing" of any transaction contemplated hereby ("Transaction").
Accordingly, you should seek advice based on your particular circumstances from an independent tax advisor.
In any instance where distribution of this communication is subject to the rules of the US Commodity Futures Trading Commission (“CFTC”), this communication constitutes an invitation to consider entering
into a derivatives transaction under U.S. CFTC Regulations §§ 1.71 and 23.605, where applicable, but is not a binding offer to buy/sell any financial instrument.
Any terms set forth herein are intended for discussion purposes only and are subject to the final terms as set forth in separate definitive written agreements. This presentation is not a commitment to lend, syndicate a
financing, underwrite or purchase securities, or commit capital nor does it obligate us to enter into such a commitment, nor are we acting as a fiduciary to you. By accepting this presentation, subject to applicable law or
regulation, you agree to keep confidential the information contained herein and the existence of and proposed terms for any Transaction.
Prior to entering into any Transaction, you should determine, without reliance upon us or our affiliates, the economic risks and merits (and independently determine that you are able to assume these risks) as well as the legal,
tax and accounting characterizations and consequences of any such Transaction. In this regard, by accepting this presentation, you acknowledge that (a) we are not in the business of providing (and you are not relying on us
for) legal, tax or accounting advice, (b) there may be legal, tax or accounting risks associated with any Transaction, (c) you should receive (and rely on) separate and qualified legal, tax and accounting advice and (d) you
should apprise senior management in your organization as to such legal, tax and accounting advice (and any risks associated with any Transaction) and our disclaimer as to these matters. By acceptance of these materials,
you and we hereby agree that from the commencement of discussions with respect to any Transaction, and notwithstanding any other provision in this presentation, we hereby confirm that no participant in any Transaction
shall be limited from disclosing the U.S. tax treatment or U.S. tax structure of such Transaction.
We are required to obtain, verify and record certain information that identifies each entity that enters into a formal business relationship with us. We will ask for your complete name, street address, and taxpayer ID number.
We may also request corporate formation documents, or other forms of identification, to verify information provided.
Any prices or levels contained herein are preliminary and indicative only and do not represent bids or offers. These indications are provided solely for your information and consideration, are subject to change at any time
without notice and are not intended as a solicitation with respect to the purchase or sale of any instrument. The information contained in this presentation may include results of analyses from a quantitative model which
represent potential future events that may or may not be realized, and is not a complete analysis of every material fact representing any product. Any estimates included herein constitute our judgment as of the date hereof
and are subject to change without any notice. We and/or our affiliates may make a market in these instruments for our customers and for our own account. Accordingly, we may have a position in any such instrument at
any time.
Although this material may contain publicly available information about Citi corporate bond research, fixed income strategy or economic and market analysis, Citi policy (i) prohibits employees from offering, directly or indirectly,
a favorable or negative research opinion or offering to change an opinion as consideration or inducement for the receipt of business or for compensation; and (ii) prohibits analysts from being compensated for specific
recommendations or views contained in research reports. So as to reduce the potential for conflicts of interest, as well as to reduce any appearance of conflicts of interest, Citi has enacted policies and procedures designed to
limit communications between its investment banking and research personnel to specifically prescribed circumstances.