travel & tourism investment in asean - home | … | world travel & tourism council 1. the...
TRANSCRIPT
TRAVEL & TOURISMINVESTMENT IN ASEAN
For more information, please contact:
ROCHELLE TURNER | Research [email protected]
EVELYNE FREIERMUTH | Policy & Research [email protected]©2016 World Travel & Tourism Council
CONTENTS
1. THE IMPORTANCE OF INVESTMENT IN SUPPORTING THE ASEAN TRAVEL & TOURISM SECTOR 2
The role of investment in the Travel & Tourism sector 4
The strong link between Travel & Tourism investment,infrastructure and sector performance 4
2. THE STATE OF TRAVEL & TOURISM INFRASTRUCTURE IN ASEAN AND THE OUTLOOK FOR FUTURE INVESTMENT SPEND AND DEMAND 7
The state of ASEAN Travel & Tourism infrastructure today 7
The outlook for ASEAN Travel & Tourism investment spending 11
Will ASEAN economies invest enough to achieve the Travel & Tourism sector’s future demand and growth potential and address existing infrastructure weaknesses? 12
3. SUMMARY - PUTTING TRAVEL & TOURISM INFRASTRUCTURE AND INVESTMENT ON THE AGENDA OF GOVERNMENTS 15
TRAVEL & TOURISM INVESTMENT IN ASEAN | 1
TRAVEL & TOURISM INVESTMENT IN ASEANWILL INFRASTRUCTURE AND INVESTMENT CONSTRAIN OR SUPPORT FUTURE SECTOR GROWTH?OCTOBER 2016
Understanding and addressing the challenges inhibiting the sustainable growth of our sector is paramount for all industry stakeholders. WTTC is pleased to have produced this report on Travel & Tourism investment in the ASEAN region, continuing our series of reports looking at the state of investment in Travel & Tourism across the world. This study seeks to understand whether and where within ASEAN, infrastructure and investment will constrain or support future industry growth, and draws on data from WTTC’s annual Travel & Tourism Economic Impact Research 2016 and the World Economic Forum’s Travel & Tourism Competitiveness Report 2015.
Collectively, the ten countries that make up the ASEAN region are more dependent on Travel & Tourism to drive their economies than all other regions in the world. A favourable climate, proximity to large outbound markets, good infrastructure, connectivity to further origin markets and price competitiveness make many parts of the region highly attractive tourism destinations. WTTC has forecast that there will be US$782 billion worth of Travel & Tourism investment made in the ASEAN economies over the next decade - nearly 10% of total cumulative world infrastructure spending for the sector. However, with the sector forecast to achieve average annual Travel & Tourism GDP growth rates of 6.2% for each of the years to 2026, not only is there a divergence across the ASEAN economies with respect to their ability to deliver the infrastructure needed for the future Travel & Tourism demand, but the challenge for all countries will be to ensure that capacity volume and quality expands sustainably and in line with visitor expectations.
Our research highlights the differences in current infrastructure provision and future need across the ASEAN economies. While Laos and Vietnam look on-course to achieve the investment their growth requires, there may be potential capacity constraints in Myanmar, Cambodia and the Philippines. And while Brunei Darussalam, Singapore, Indonesia and Malaysia all seem well-placed to continue building on infrastructure that compares positively by global standards, there is need for a critical look at Thailand’s future T&T infrastructure requirements given its sharp growth in tourism demand.
With such strong growth forecast for Travel & Tourism in the region, the ASEAN countries that exploit the opportunity of low interest rates to foster necessary infrastructure and investment opportunities will be best-placed to create quality jobs and tax revenues that will contribute strongly to their economies well into the future.
David ScowsillPresident & CEOWorld Travel & Tourism Council
2 | WORLD TRAVEL & TOURISM COUNCIL
1. THE IMPORTANCE OF INVESTMENT IN SUPPORTING THE ASEANTRAVEL & TOURISM SECTOR
The economic contribution of the global Travel & Tourism (T&T) sector continues to grow in value and importance relative to the rest of the economy. According to WTTC’s latest annual economic impact research (March 2016), the total economic contribution of T&T was 9.8% of global GDP in 2015, supporting one in 11 of all jobs in the world.
Collectively, the ten countries that make up the ASEAN1 region are more dependent on T&T to drive their economies than all other regions in the world. In 2015 T&T directly accounted for 5% of the region’s total economy GDP, and a further 7.4% in indirect and induced GDP (Figure 1-1). Over 32 million jobs across the ten countries are supported directly or indirectly by Travel & Tourism.
The total contribution of T&T to the ASEAN economy, 12.4% of GDP in 2015, is around 3 percentage points (pp) higher than the equivalent share in Europe, and just less than 4pp higher than in the Americas. A favourable climate, proximity to large outbound markets like China, good infrastructure by the standards of emerging economies, connectivity to further afield origin markets, and price competitiveness by the standards of developed economies, make many countries within the ASEAN region highly attractive travel destinations.
In economic terms, ASEAN GDP is approximately US$2.4 trillion with an average GDP per capita of around US$3,900. The difference in range is significant, however, from US$53,000 in Singapore to less than US$1,300 in Cambodia and Myanmar. Over the last decade the ASEAN economy has grown on average by just over 5% per annum and is forecast by Oxford Economics to continue to grow strongly at just under 5% per year for the next decade. The region has a rapidly growing middle class, with the proportion of households with annual income above US$20,000 rising from less than 3% in 2000 to almost 13% in recent years, and is set to rise to around one-third by 2025.
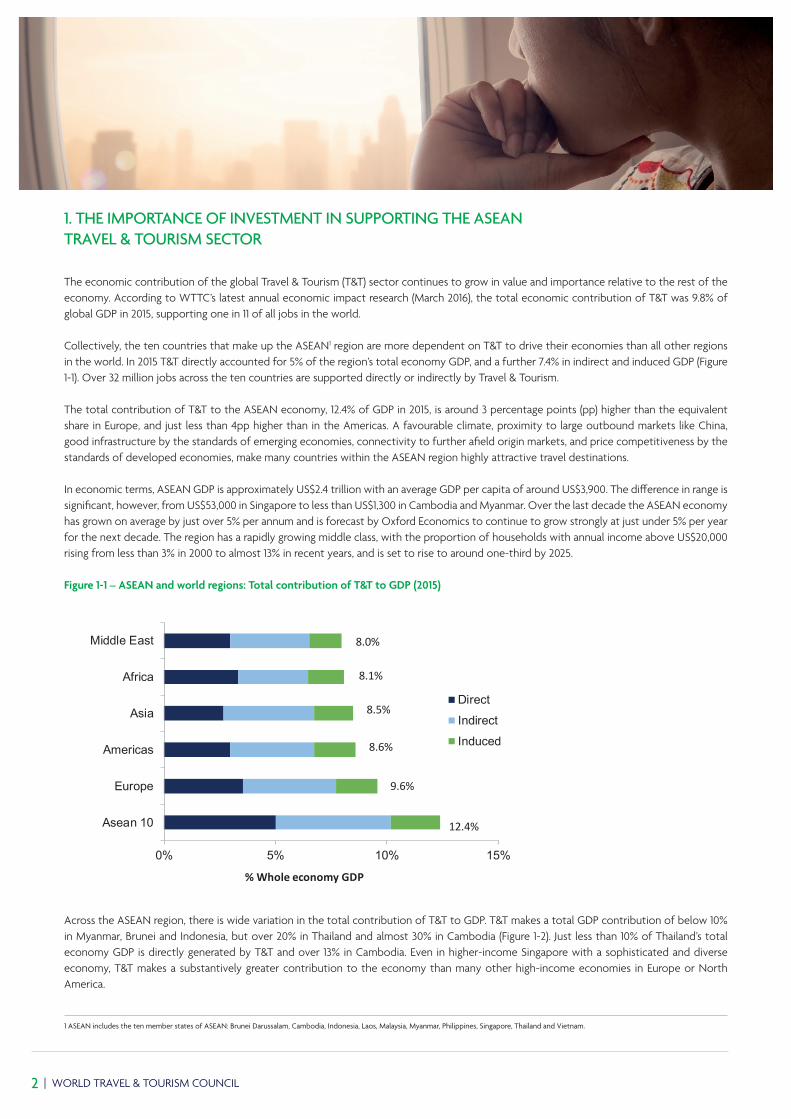
Figure 1-1 – ASEAN and world regions: Total contribution of T&T to GDP (2015)
0% 5% 10% 15%
Asean 10
Europe
Americas
Asia
Africa
Middle East
% Whole economy GDP
Direct
Indirect
Induced
Sources: WTTC, Oxford Economics
8.5%
9.6%
12.4%
8.6%
8.1%
8.0%
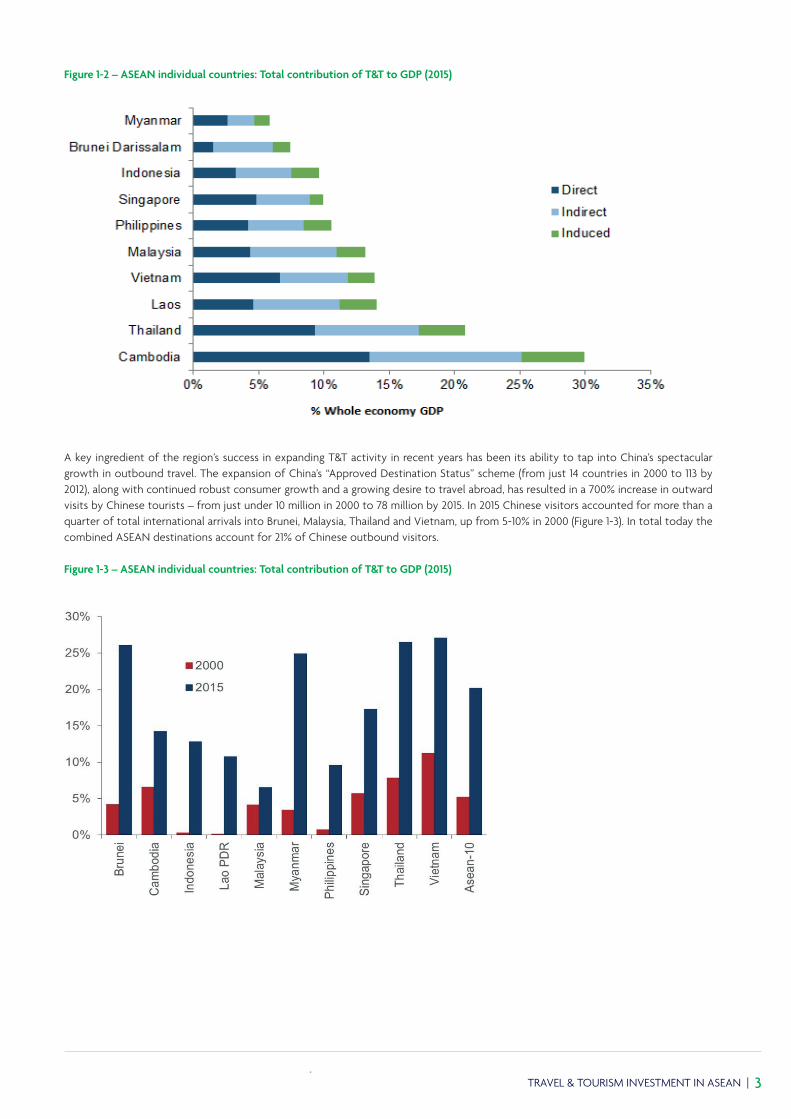
Across the ASEAN region, there is wide variation in the total contribution of T&T to GDP. T&T makes a total GDP contribution of below 10% in Myanmar, Brunei and Indonesia, but over 20% in Thailand and almost 30% in Cambodia (Figure 1-2). Just less than 10% of Thailand’s total economy GDP is directly generated by T&T and over 13% in Cambodia. Even in higher-income Singapore with a sophisticated and diverse economy, T&T makes a substantively greater contribution to the economy than many other high-income economies in Europe or North America.
1 ASEAN includes the ten member states of ASEAN: Brunei Darussalam, Cambodia, Indonesia, Laos, Malaysia, Myanmar, Philippines, Singapore, Thailand and Vietnam.
TRAVEL & TOURISM INVESTMENT IN ASEAN | 3
Figure 1-2 – ASEAN individual countries: Total contribution of T&T to GDP (2015)
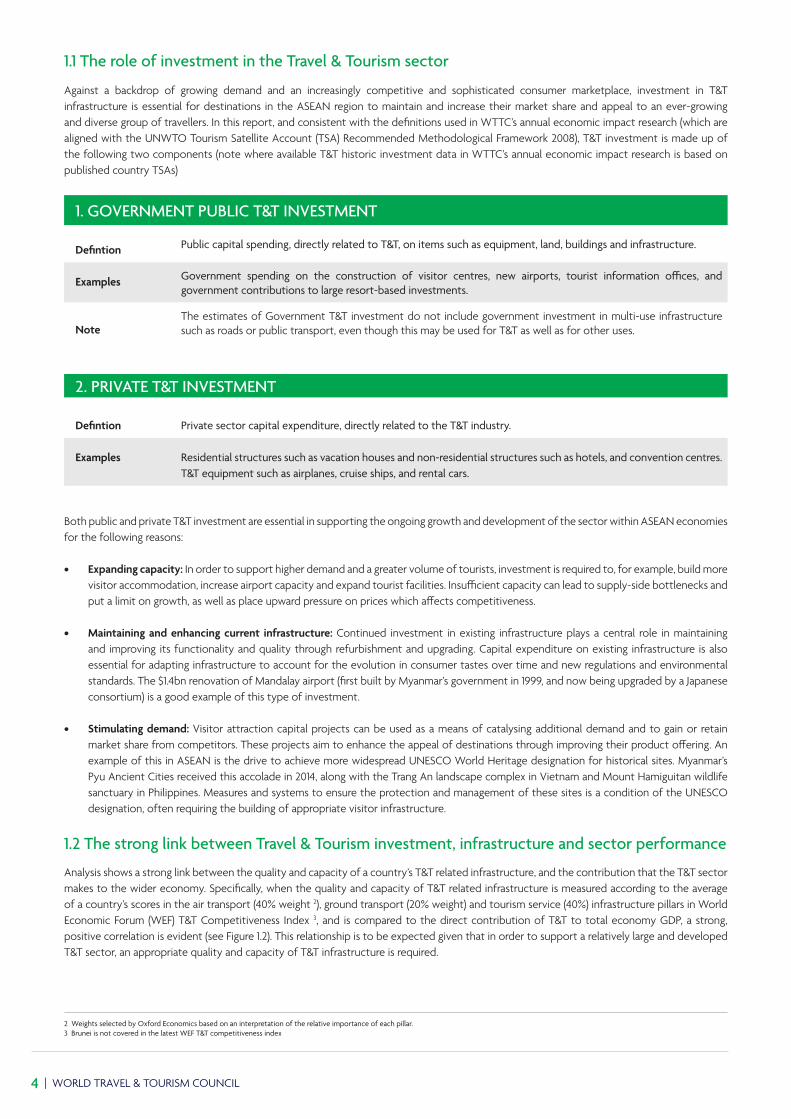
A key ingredient of the region’s success in expanding T&T activity in recent years has been its ability to tap into China’s spectacular growth in outbound travel. The expansion of China’s “Approved Destination Status” scheme (from just 14 countries in 2000 to 113 by 2012), along with continued robust consumer growth and a growing desire to travel abroad, has resulted in a 700% increase in outward visits by Chinese tourists – from just under 10 million in 2000 to 78 million by 2015. In 2015 Chinese visitors accounted for more than a quarter of total international arrivals into Brunei, Malaysia, Thailand and Vietnam, up from 5-10% in 2000 (Figure 1-3). In total today the combined ASEAN destinations account for 21% of Chinese outbound visitors.
Figure 1-3 – ASEAN individual countries: Total contribution of T&T to GDP (2015)
4 | WORLD TRAVEL & TOURISM COUNCIL
1.1 The role of investment in the Travel & Tourism sector
Against a backdrop of growing demand and an increasingly competitive and sophisticated consumer marketplace, investment in T&T infrastructure is essential for destinations in the ASEAN region to maintain and increase their market share and appeal to an ever-growing and diverse group of travellers. In this report, and consistent with the definitions used in WTTC’s annual economic impact research (which are aligned with the UNWTO Tourism Satellite Account (TSA) Recommended Methodological Framework 2008), T&T investment is made up of the following two components (note where available T&T historic investment data in WTTC’s annual economic impact research is based on published country TSAs)
1. GOVERNMENT PUBLIC T&T INVESTMENT
Defintion Public capital spending, directly related to T&T, on items such as equipment, land, buildings and infrastructure.
Examples Government spending on the construction of visitor centres, new airports, tourist information offices, and government contributions to large resort-based investments.
NoteThe estimates of Government T&T investment do not include government investment in multi-use infrastructure such as roads or public transport, even though this may be used for T&T as well as for other uses.
2. PRIVATE T&T INVESTMENT
Defintion Private sector capital expenditure, directly related to the T&T industry.
Examples Residential structures such as vacation houses and non-residential structures such as hotels, and convention centres. T&T equipment such as airplanes, cruise ships, and rental cars.
Both public and private T&T investment are essential in supporting the ongoing growth and development of the sector within ASEAN economies for the following reasons:
• Expanding capacity: In order to support higher demand and a greater volume of tourists, investment is required to, for example, build more visitor accommodation, increase airport capacity and expand tourist facilities. Insufficient capacity can lead to supply-side bottlenecks and put a limit on growth, as well as place upward pressure on prices which affects competitiveness.
• Maintaining and enhancing current infrastructure: Continued investment in existing infrastructure plays a central role in maintaining and improving its functionality and quality through refurbishment and upgrading. Capital expenditure on existing infrastructure is also essential for adapting infrastructure to account for the evolution in consumer tastes over time and new regulations and environmental standards. The $1.4bn renovation of Mandalay airport (first built by Myanmar’s government in 1999, and now being upgraded by a Japanese consortium) is a good example of this type of investment.
• Stimulating demand: Visitor attraction capital projects can be used as a means of catalysing additional demand and to gain or retain market share from competitors. These projects aim to enhance the appeal of destinations through improving their product offering. An example of this in ASEAN is the drive to achieve more widespread UNESCO World Heritage designation for historical sites. Myanmar’s Pyu Ancient Cities received this accolade in 2014, along with the Trang An landscape complex in Vietnam and Mount Hamiguitan wildlife sanctuary in Philippines. Measures and systems to ensure the protection and management of these sites is a condition of the UNESCO designation, often requiring the building of appropriate visitor infrastructure.
1.2 The strong link between Travel & Tourism investment, infrastructure and sector performance
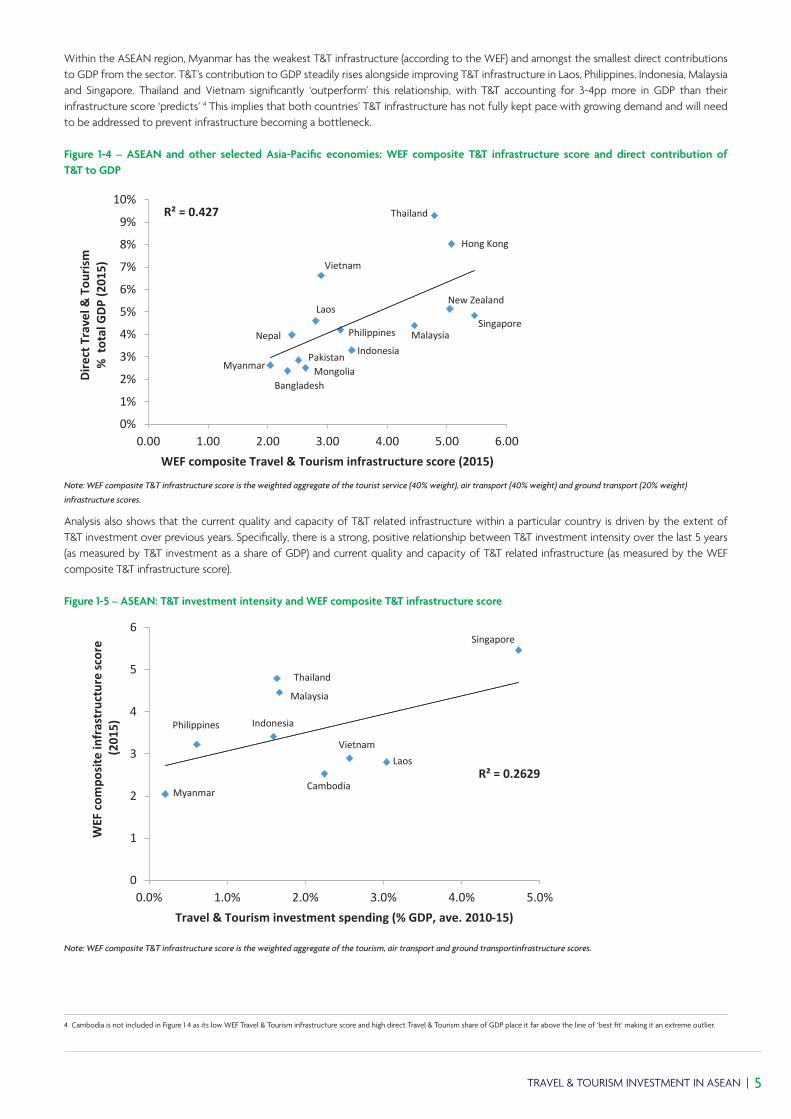
Analysis shows a strong link between the quality and capacity of a country’s T&T related infrastructure, and the contribution that the T&T sector makes to the wider economy. Specifically, when the quality and capacity of T&T related infrastructure is measured according to the average of a country’s scores in the air transport (40% weight 2), ground transport (20% weight) and tourism service (40%) infrastructure pillars in World Economic Forum (WEF) T&T Competitiveness Index 3, and is compared to the direct contribution of T&T to total economy GDP, a strong, positive correlation is evident (see Figure 1.2). This relationship is to be expected given that in order to support a relatively large and developed T&T sector, an appropriate quality and capacity of T&T infrastructure is required.
2 Weights selected by Oxford Economics based on an interpretation of the relative importance of each pillar. 3 Brunei is not covered in the latest WEF T&T competitiveness index
TRAVEL & TOURISM INVESTMENT IN ASEAN | 5
Within the ASEAN region, Myanmar has the weakest T&T infrastructure (according to the WEF) and amongst the smallest direct contributions to GDP from the sector. T&T’s contribution to GDP steadily rises alongside improving T&T infrastructure in Laos, Philippines, Indonesia, Malaysia and Singapore. Thailand and Vietnam significantly ‘outperform’ this relationship, with T&T accounting for 3-4pp more in GDP than their infrastructure score ‘predicts’ 4 This implies that both countries’ T&T infrastructure has not fully kept pace with growing demand and will need to be addressed to prevent infrastructure becoming a bottleneck.
Figure 1-4 – ASEAN and other selected Asia-Pacific economies: WEF composite T&T infrastructure score and direct contribution of T&T to GDP
R² = 0.427
0%
1%
2%
3%
4%
5%
6%
7%
8%
9%
10%
0.00 1.00 2.00 3.00 4.00 5.00 6.00
Dire
ct T
rave
l & T
ouris
m%
tot
al G
DP (2
015)
WEF composite Travel & Tourism infrastructure score (2015)Sources: WEF, WTTC, Oxford Economics
Vietnam
SingaporePhilippines Malaysia
Laos
Thailand
MyanmarIndonesia
Hong Kong
New Zealand
Nepal
MongoliaBangladesh
Pakistan
Note: WEF composite T&T infrastructure score is the weighted aggregate of the tourist service (40% weight), air transport (40% weight) and ground transport (20% weight)
infrastructure scores.
Analysis also shows that the current quality and capacity of T&T related infrastructure within a particular country is driven by the extent of T&T investment over previous years. Specifically, there is a strong, positive relationship between T&T investment intensity over the last 5 years (as measured by T&T investment as a share of GDP) and current quality and capacity of T&T related infrastructure (as measured by the WEF composite T&T infrastructure score).
Figure 1-5 – ASEAN: T&T investment intensity and WEF composite T&T infrastructure score
R² = 0.2629
0
1
2
3
4
5
6
0.0% 1.0% 2.0% 3.0% 4.0% 5.0%
WEF
com
posi
te in
fras
truc
ture
scor
e(2
015)
Travel & Tourism investment spending (% GDP, ave. 2010-15)Sources: WTTC, Oxford Economics, WEF
Myanmar
Philippines Indonesia
Singapore
Laos
Cambodia
Vietnam
Malaysia
Thailand
Note: WEF composite T&T infrastructure score is the weighted aggregate of the tourism, air transport and ground transportinfrastructure scores.
4 Cambodia is not included in Figure 1 4 as its low WEF Travel & Tourism infrastructure score and high direct Travel & Tourism share of GDP place it far above the line of ‘best fit’ making it an extreme outlier.
6 | WORLD TRAVEL & TOURISM COUNCIL
Across the ASEAN region in recent years, some countries have clearly prioritised both investment in general, and specifically investment in their T&T infrastructure. Thailand and Malaysia have sustained T&T investment spending of 1.5% of GDP on average from 2010-2015 and today have amongst the best-rated T&T infrastructure in the region. Singapore is even better, investing a higher share of GDP in T&T and having the best-rating T&T infrastructure in the region. Examples of T&T investment projects in recent years in these three countries include:
• Thailand: New Suvarnabhumi Airport in Bangkok and renovations to Don Mueang Airport, and a host of new resort developments in locations such as Phuket.
• Malaysia: Langkawi cable car, Aquaria KLCC and aircraft purchases by Malaysian Airlines.• Singapore: Universal Studios Singapore, runway extensions and new runways at Seletar and Changi airports, aircraft purchases by Singapore
Airlines and a number of new resort developments.
At the other end of the spectrum Philippines and Myanmar have invested substantially less in T&T infrastructure over the past few years (as a share of GDP), and by consequence their T&T infrastructure ranks lower (Figure 1 5).
Given these two relationships between (1) T&T infrastructure quality & capacity and importance of the sector to the economy, and (2) T&T investment intensity and infrastructure quality & capacity, it can be concluded that there is a strong and positive relationship between T&T investment and development of the T&T sector.
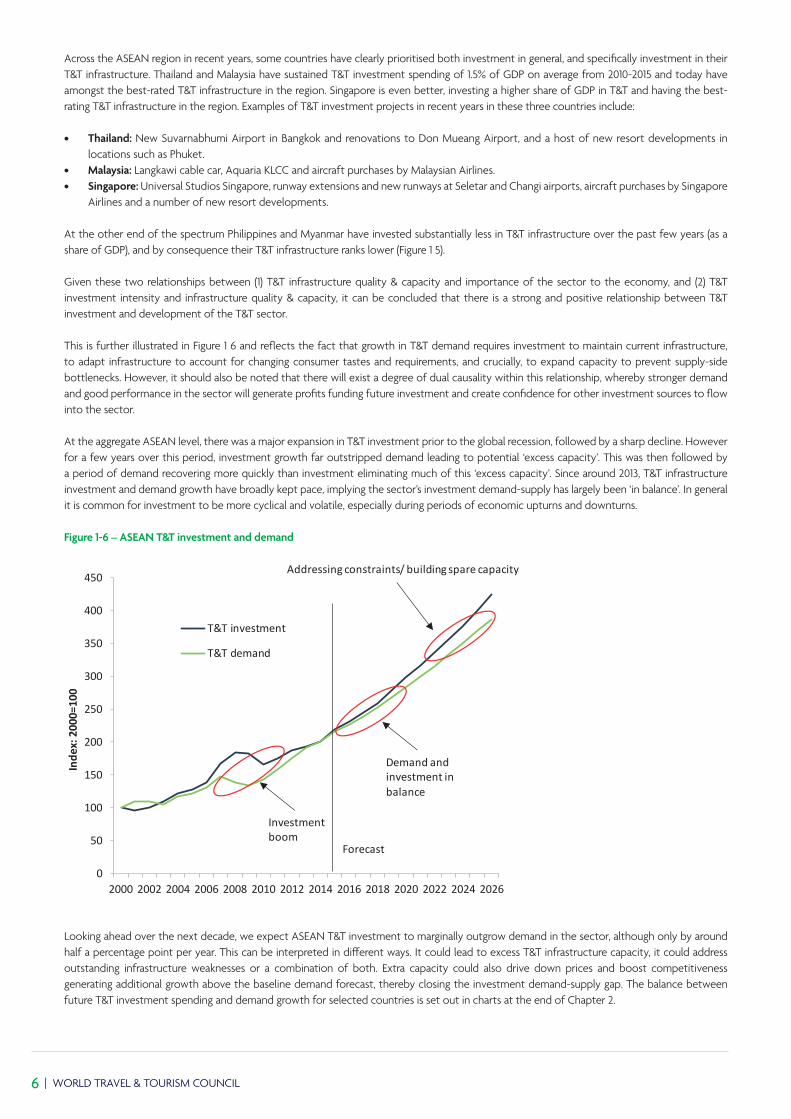
This is further illustrated in Figure 1 6 and reflects the fact that growth in T&T demand requires investment to maintain current infrastructure, to adapt infrastructure to account for changing consumer tastes and requirements, and crucially, to expand capacity to prevent supply-side bottlenecks. However, it should also be noted that there will exist a degree of dual causality within this relationship, whereby stronger demand and good performance in the sector will generate profits funding future investment and create confidence for other investment sources to flow into the sector.
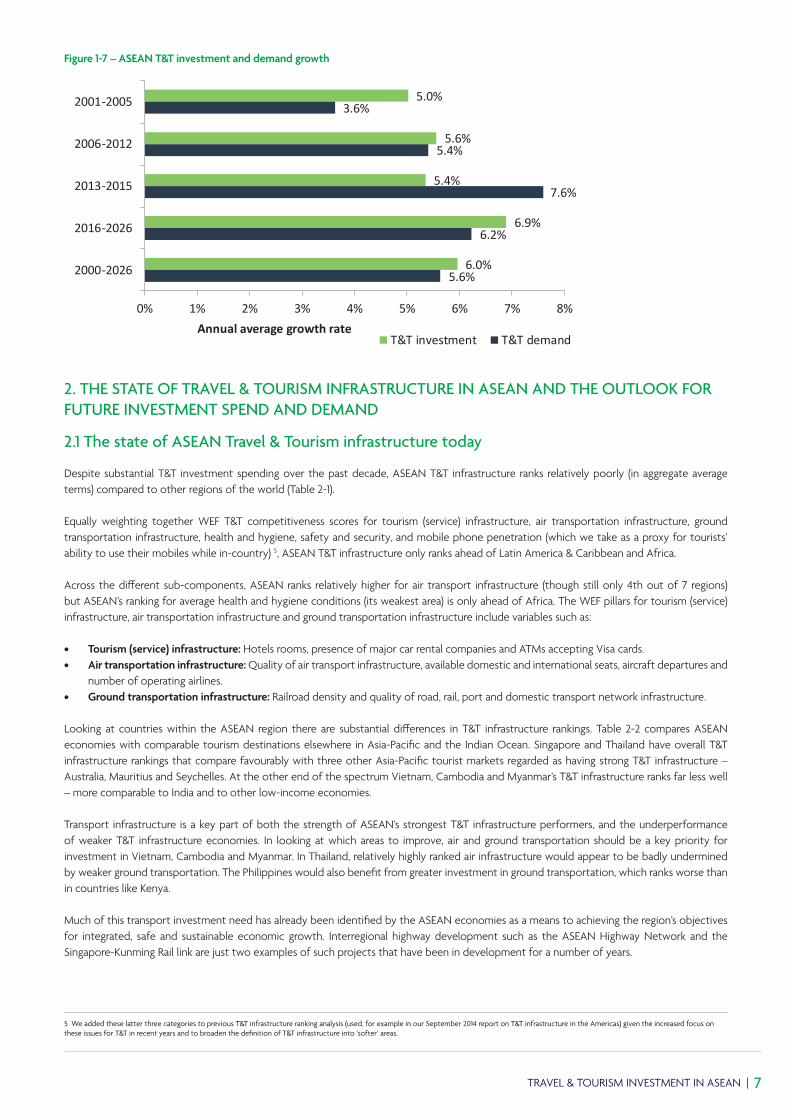
At the aggregate ASEAN level, there was a major expansion in T&T investment prior to the global recession, followed by a sharp decline. However for a few years over this period, investment growth far outstripped demand leading to potential ‘excess capacity’. This was then followed by a period of demand recovering more quickly than investment eliminating much of this ‘excess capacity’. Since around 2013, T&T infrastructure investment and demand growth have broadly kept pace, implying the sector’s investment demand-supply has largely been ‘in balance’. In general it is common for investment to be more cyclical and volatile, especially during periods of economic upturns and downturns.
Figure 1-6 – ASEAN T&T investment and demand
0
50
100
150
200
250
300
350
400
450
2000 2002 2004 2006 2008 2010 2012 2014 2016 2018 2020 2022 2024 2026
Inde
x: 2
000=
100
T&T investment
T&T demand
Forecast
Sources: WTTC, Oxford Economics
Addressing constraints/ building spare capacity
Demand and investment in balance
Investment boom
Looking ahead over the next decade, we expect ASEAN T&T investment to marginally outgrow demand in the sector, although only by around half a percentage point per year. This can be interpreted in different ways. It could lead to excess T&T infrastructure capacity, it could address outstanding infrastructure weaknesses or a combination of both. Extra capacity could also drive down prices and boost competitiveness generating additional growth above the baseline demand forecast, thereby closing the investment demand-supply gap. The balance between future T&T investment spending and demand growth for selected countries is set out in charts at the end of Chapter 2.
TRAVEL & TOURISM INVESTMENT IN ASEAN | 7
Figure 1-7 – ASEAN T&T investment and demand growth
2. THE STATE OF TRAVEL & TOURISM INFRASTRUCTURE IN ASEAN AND THE OUTLOOK FOR FUTURE INVESTMENT SPEND AND DEMAND
2.1 The state of ASEAN Travel & Tourism infrastructure today
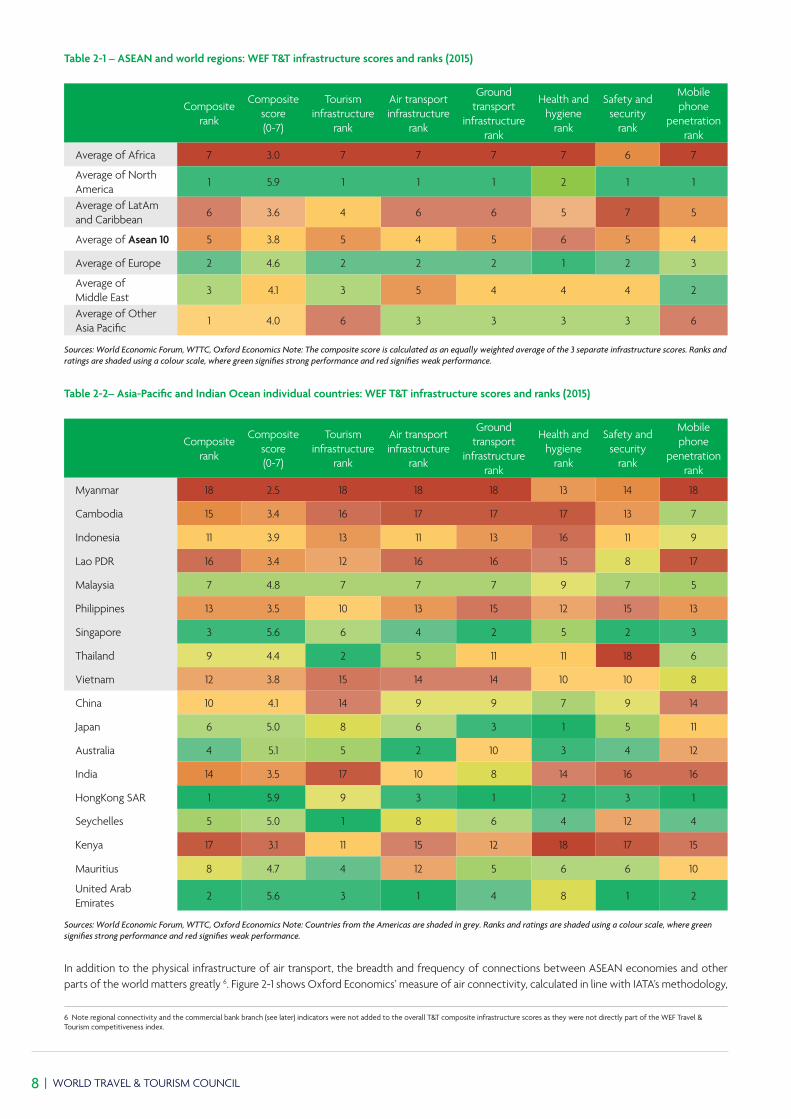
Despite substantial T&T investment spending over the past decade, ASEAN T&T infrastructure ranks relatively poorly (in aggregate average terms) compared to other regions of the world (Table 2-1).
Equally weighting together WEF T&T competitiveness scores for tourism (service) infrastructure, air transportation infrastructure, ground transportation infrastructure, health and hygiene, safety and security, and mobile phone penetration (which we take as a proxy for tourists’ ability to use their mobiles while in-country) 5, ASEAN T&T infrastructure only ranks ahead of Latin America & Caribbean and Africa.
Across the different sub-components, ASEAN ranks relatively higher for air transport infrastructure (though still only 4th out of 7 regions) but ASEAN’s ranking for average health and hygiene conditions (its weakest area) is only ahead of Africa. The WEF pillars for tourism (service) infrastructure, air transportation infrastructure and ground transportation infrastructure include variables such as:
• Tourism (service) infrastructure: Hotels rooms, presence of major car rental companies and ATMs accepting Visa cards.• Air transportation infrastructure: Quality of air transport infrastructure, available domestic and international seats, aircraft departures and
number of operating airlines.• Ground transportation infrastructure: Railroad density and quality of road, rail, port and domestic transport network infrastructure.
Looking at countries within the ASEAN region there are substantial differences in T&T infrastructure rankings. Table 2-2 compares ASEAN economies with comparable tourism destinations elsewhere in Asia-Pacific and the Indian Ocean. Singapore and Thailand have overall T&T infrastructure rankings that compare favourably with three other Asia-Pacific tourist markets regarded as having strong T&T infrastructure – Australia, Mauritius and Seychelles. At the other end of the spectrum Vietnam, Cambodia and Myanmar’s T&T infrastructure ranks far less well – more comparable to India and to other low-income economies.
Transport infrastructure is a key part of both the strength of ASEAN’s strongest T&T infrastructure performers, and the underperformance of weaker T&T infrastructure economies. In looking at which areas to improve, air and ground transportation should be a key priority for investment in Vietnam, Cambodia and Myanmar. In Thailand, relatively highly ranked air infrastructure would appear to be badly undermined by weaker ground transportation. The Philippines would also benefit from greater investment in ground transportation, which ranks worse than in countries like Kenya.
Much of this transport investment need has already been identified by the ASEAN economies as a means to achieving the region’s objectives for integrated, safe and sustainable economic growth. Interregional highway development such as the ASEAN Highway Network and the Singapore-Kunming Rail link are just two examples of such projects that have been in development for a number of years.
5 We added these latter three categories to previous T&T infrastructure ranking analysis (used, for example in our September 2014 report on T&T infrastructure in the Americas) given the increased focus on these issues for T&T in recent years and to broaden the definition of T&T infrastructure into ‘softer’ areas.
5.0%
5.6%
5.4%
6.9%
6.0%
3.6%
5.4%
7.6%
6.2%
5.6%
0% 1% 2% 3% 4% 5% 6% 7% 8%
2001-2005
2006-2012
2013-2015
2016-2026
2000-2026
Annual average growth rateT&T investment T&T demandSources: WTTC, Oxford Economics
8 | WORLD TRAVEL & TOURISM COUNCIL
Table 2-1 – ASEAN and world regions: WEF T&T infrastructure scores and ranks (2015)
Composite rank
Composite score (0-7)
Tourism infrastructure
rank
Air transport infrastructure
rank
Ground transport
infrastructure rank
Health and hygiene
rank
Safety and security
rank
Mobile phone
penetration rank
Average of Africa 7 3.0 7 7 7 7 6 7
Average of North America
1 5.9 1 1 1 2 1 1
Average of LatAm and Caribbean
6 3.6 4 6 6 5 7 5
Average of Asean 10 5 3.8 5 4 5 6 5 4
Average of Europe 2 4.6 2 2 2 1 2 3
Average of Middle East
3 4.1 3 5 4 4 4 2
Average of Other Asia Pacific
1 4.0 6 3 3 3 3 6
Sources: World Economic Forum, WTTC, Oxford Economics Note: The composite score is calculated as an equally weighted average of the 3 separate infrastructure scores. Ranks and ratings are shaded using a colour scale, where green signifies strong performance and red signifies weak performance.
Table 2-2– Asia-Pacific and Indian Ocean individual countries: WEF T&T infrastructure scores and ranks (2015)
Composite rank
Composite score (0-7)
Tourism infrastructure
rank
Air transport infrastructure
rank
Ground transport
infrastructure rank
Health and hygiene
rank
Safety and security
rank
Mobile phone
penetration rank
Myanmar 18 2.5 18 18 18 13 14 18
Cambodia 15 3.4 16 17 17 17 13 7
Indonesia 11 3.9 13 11 13 16 11 9
Lao PDR 16 3.4 12 16 16 15 8 17
Malaysia 7 4.8 7 7 7 9 7 5
Philippines 13 3.5 10 13 15 12 15 13
Singapore 3 5.6 6 4 2 5 2 3
Thailand 9 4.4 2 5 11 11 18 6
Vietnam 12 3.8 15 14 14 10 10 8
China 10 4.1 14 9 9 7 9 14
Japan 6 5.0 8 6 3 1 5 11
Australia 4 5.1 5 2 10 3 4 12
India 14 3.5 17 10 8 14 16 16
HongKong SAR 1 5.9 9 3 1 2 3 1
Seychelles 5 5.0 1 8 6 4 12 4
Kenya 17 3.1 11 15 12 18 17 15
Mauritius 8 4.7 4 12 5 6 6 10
United Arab Emirates 2 5.6 3 1 4 8 1 2
Sources: World Economic Forum, WTTC, Oxford Economics Note: Countries from the Americas are shaded in grey. Ranks and ratings are shaded using a colour scale, where green signifies strong performance and red signifies weak performance.
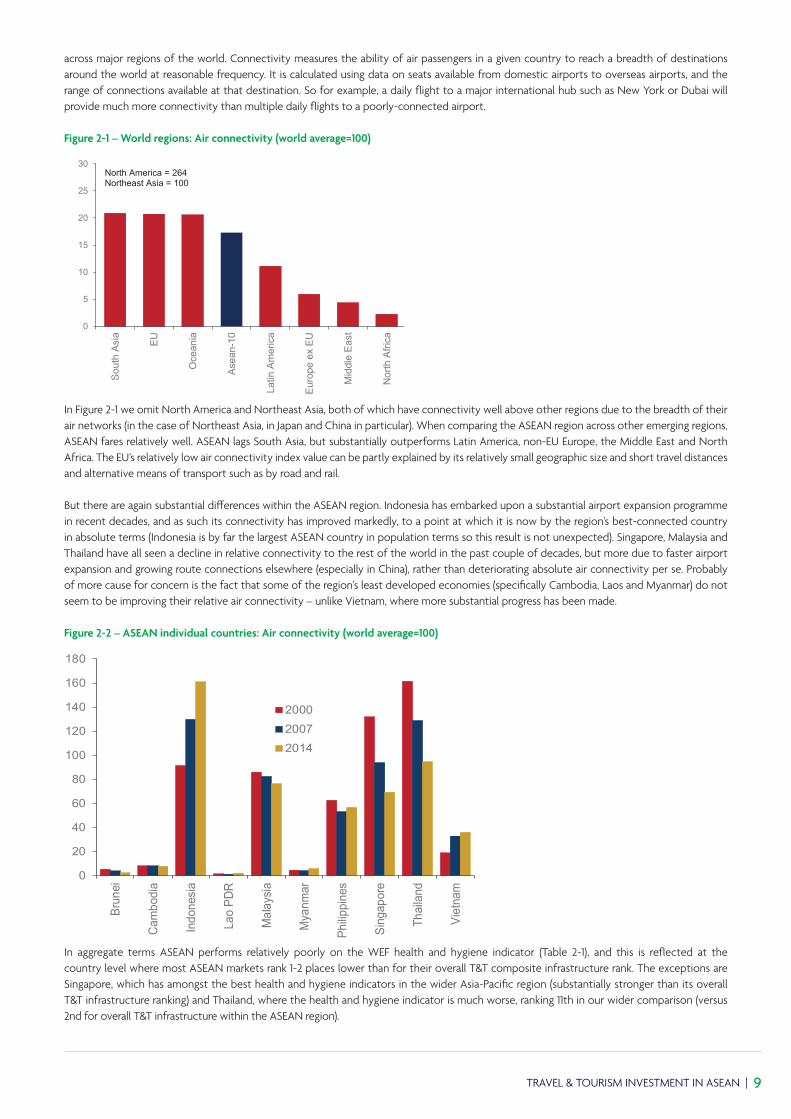
In addition to the physical infrastructure of air transport, the breadth and frequency of connections between ASEAN economies and other parts of the world matters greatly 6. Figure 2-1 shows Oxford Economics’ measure of air connectivity, calculated in line with IATA’s methodology,
6 Note regional connectivity and the commercial bank branch (see later) indicators were not added to the overall T&T composite infrastructure scores as they were not directly part of the WEF Travel & Tourism competitiveness index.
TRAVEL & TOURISM INVESTMENT IN ASEAN | 9
across major regions of the world. Connectivity measures the ability of air passengers in a given country to reach a breadth of destinations around the world at reasonable frequency. It is calculated using data on seats available from domestic airports to overseas airports, and the range of connections available at that destination. So for example, a daily flight to a major international hub such as New York or Dubai will provide much more connectivity than multiple daily flights to a poorly-connected airport.
Figure 2-1 – World regions: Air connectivity (world average=100)
In Figure 2-1 we omit North America and Northeast Asia, both of which have connectivity well above other regions due to the breadth of their air networks (in the case of Northeast Asia, in Japan and China in particular). When comparing the ASEAN region across other emerging regions, ASEAN fares relatively well. ASEAN lags South Asia, but substantially outperforms Latin America, non-EU Europe, the Middle East and North Africa. The EU’s relatively low air connectivity index value can be partly explained by its relatively small geographic size and short travel distances and alternative means of transport such as by road and rail.
But there are again substantial differences within the ASEAN region. Indonesia has embarked upon a substantial airport expansion programme in recent decades, and as such its connectivity has improved markedly, to a point at which it is now by the region’s best-connected country in absolute terms (Indonesia is by far the largest ASEAN country in population terms so this result is not unexpected). Singapore, Malaysia and Thailand have all seen a decline in relative connectivity to the rest of the world in the past couple of decades, but more due to faster airport expansion and growing route connections elsewhere (especially in China), rather than deteriorating absolute air connectivity per se. Probably of more cause for concern is the fact that some of the region’s least developed economies (specifically Cambodia, Laos and Myanmar) do not seem to be improving their relative air connectivity – unlike Vietnam, where more substantial progress has been made.
Figure 2-2 – ASEAN individual countries: Air connectivity (world average=100)
0
20
40
60
80
100
120
140
160
180
Brun
ei
Cam
bodi
a
Indo
nesia
Lao
PDR
Mal
aysia
Mya
nmar
Philip
pine
s
Sing
apor
e
Thai
land
Viet
nam
200020072014
Source : Oxford Economics/Haver AnalyticsIn aggregate terms ASEAN performs relatively poorly on the WEF health and hygiene indicator (Table 2-1), and this is reflected at the country level where most ASEAN markets rank 1-2 places lower than for their overall T&T composite infrastructure rank. The exceptions are Singapore, which has amongst the best health and hygiene indicators in the wider Asia-Pacific region (substantially stronger than its overall T&T infrastructure ranking) and Thailand, where the health and hygiene indicator is much worse, ranking 11th in our wider comparison (versus 2nd for overall T&T infrastructure within the ASEAN region).
0
5
10
15
20
25
30
Sou
th A
sia
EU
Oce
ania
Ase
an-1
0
Latin
Am
eric
a
Eur
ope
ex E
U
Mid
dle
Eas
t
Nor
th A
frica
Source : Oxford Economics/Haver Analytics
North America = 264Northeast Asia = 100
10 | WORLD TRAVEL & TOURISM COUNCIL
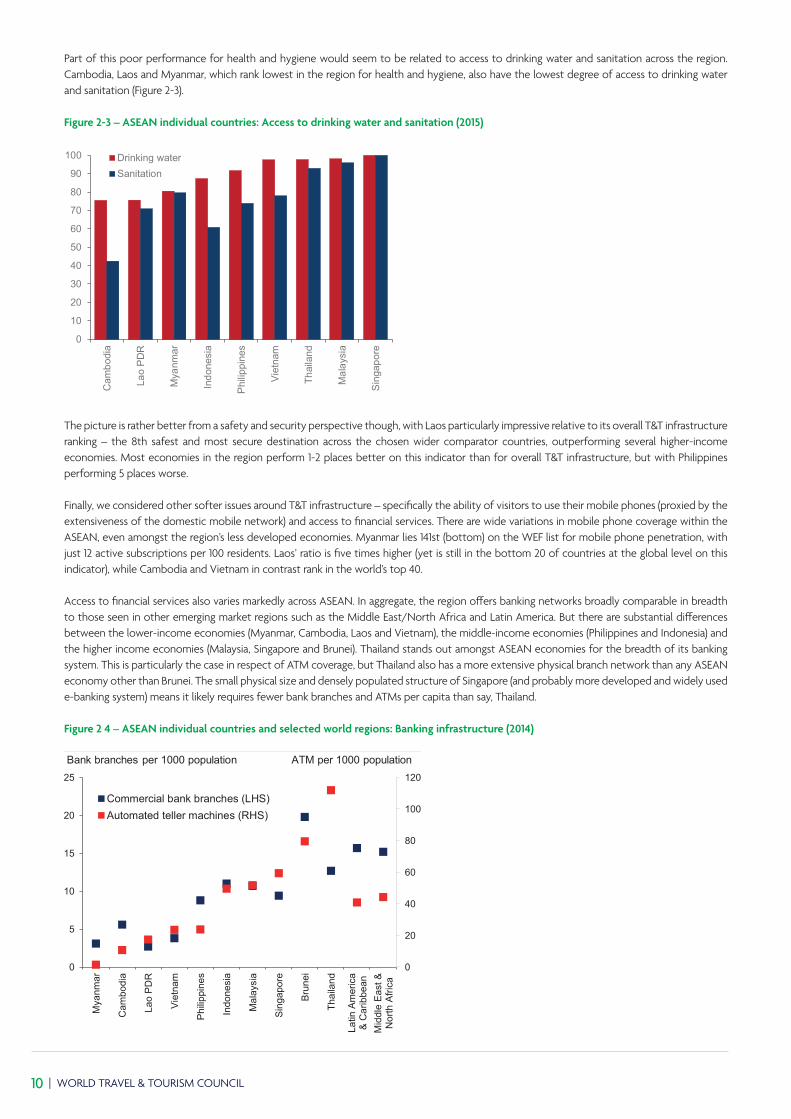
Part of this poor performance for health and hygiene would seem to be related to access to drinking water and sanitation across the region. Cambodia, Laos and Myanmar, which rank lowest in the region for health and hygiene, also have the lowest degree of access to drinking water and sanitation (Figure 2-3).
Figure 2-3 – ASEAN individual countries: Access to drinking water and sanitation (2015)
0
10
20
30
40
50
60
70
80
90
100
Cam
bodi
a
Lao
PD
R
Mya
nmar
Indo
nesi
a
Phi
lippi
nes
Vie
tnam
Thai
land
Mal
aysi
a
Sin
gapo
re
Drinking waterSanitation
Source : Oxford Economics/World Development Indicators
The picture is rather better from a safety and security perspective though, with Laos particularly impressive relative to its overall T&T infrastructure ranking – the 8th safest and most secure destination across the chosen wider comparator countries, outperforming several higher-income economies. Most economies in the region perform 1-2 places better on this indicator than for overall T&T infrastructure, but with Philippines performing 5 places worse.
Finally, we considered other softer issues around T&T infrastructure – specifically the ability of visitors to use their mobile phones (proxied by the extensiveness of the domestic mobile network) and access to financial services. There are wide variations in mobile phone coverage within the ASEAN, even amongst the region’s less developed economies. Myanmar lies 141st (bottom) on the WEF list for mobile phone penetration, with just 12 active subscriptions per 100 residents. Laos’ ratio is five times higher (yet is still in the bottom 20 of countries at the global level on this indicator), while Cambodia and Vietnam in contrast rank in the world’s top 40.
Access to financial services also varies markedly across ASEAN. In aggregate, the region offers banking networks broadly comparable in breadth to those seen in other emerging market regions such as the Middle East/North Africa and Latin America. But there are substantial differences between the lower-income economies (Myanmar, Cambodia, Laos and Vietnam), the middle-income economies (Philippines and Indonesia) and the higher income economies (Malaysia, Singapore and Brunei). Thailand stands out amongst ASEAN economies for the breadth of its banking system. This is particularly the case in respect of ATM coverage, but Thailand also has a more extensive physical branch network than any ASEAN economy other than Brunei. The small physical size and densely populated structure of Singapore (and probably more developed and widely used e-banking system) means it likely requires fewer bank branches and ATMs per capita than say, Thailand.
Figure 2 4 – ASEAN individual countries and selected world regions: Banking infrastructure (2014)
0
20
40
60
80
100
120
0
5
10
15
20
25
Mya
nmar
Cam
bodi
a
Lao
PD
R
Vie
tnam
Phi
lippi
nes
Indo
nesi
a
Mal
aysi
a
Sin
gapo
re
Bru
nei
Thai
land
Latin
Am
eric
a&
Car
ibbe
anM
iddl
e Ea
st &
Nor
th A
frica
Commercial bank branches (LHS)Automated teller machines (RHS)
Bank branches per 1000 population
Source : Oxford Economics/World Bank
ATM per 1000 population
TRAVEL & TOURISM INVESTMENT IN ASEAN | 11
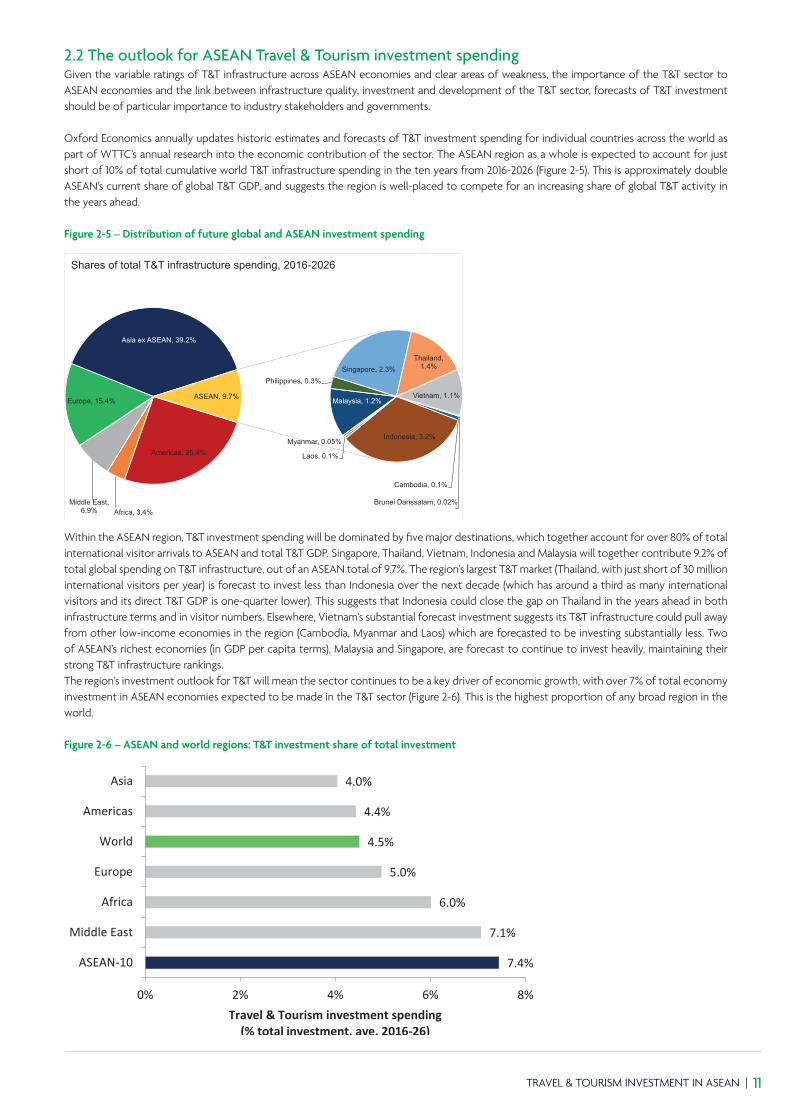
2.2 The outlook for ASEAN Travel & Tourism investment spendingGiven the variable ratings of T&T infrastructure across ASEAN economies and clear areas of weakness, the importance of the T&T sector to ASEAN economies and the link between infrastructure quality, investment and development of the T&T sector, forecasts of T&T investment should be of particular importance to industry stakeholders and governments.
Oxford Economics annually updates historic estimates and forecasts of T&T investment spending for individual countries across the world as part of WTTC’s annual research into the economic contribution of the sector. The ASEAN region as a whole is expected to account for just short of 10% of total cumulative world T&T infrastructure spending in the ten years from 2016-2026 (Figure 2-5). This is approximately double ASEAN’s current share of global T&T GDP, and suggests the region is well-placed to compete for an increasing share of global T&T activity in the years ahead.
Figure 2-5 – Distribution of future global and ASEAN investment spending
Within the ASEAN region, T&T investment spending will be dominated by five major destinations, which together account for over 80% of total international visitor arrivals to ASEAN and total T&T GDP. Singapore, Thailand, Vietnam, Indonesia and Malaysia will together contribute 9.2% of total global spending on T&T infrastructure, out of an ASEAN total of 9.7%. The region’s largest T&T market (Thailand, with just short of 30 million international visitors per year) is forecast to invest less than Indonesia over the next decade (which has around a third as many international visitors and its direct T&T GDP is one-quarter lower). This suggests that Indonesia could close the gap on Thailand in the years ahead in both infrastructure terms and in visitor numbers. Elsewhere, Vietnam’s substantial forecast investment suggests its T&T infrastructure could pull away from other low-income economies in the region (Cambodia, Myanmar and Laos) which are forecasted to be investing substantially less. Two of ASEAN’s richest economies (in GDP per capita terms), Malaysia and Singapore, are forecast to continue to invest heavily, maintaining their strong T&T infrastructure rankings.The region’s investment outlook for T&T will mean the sector continues to be a key driver of economic growth, with over 7% of total economy investment in ASEAN economies expected to be made in the T&T sector (Figure 2-6). This is the highest proportion of any broad region in the world.
Figure 2-6 – ASEAN and world regions: T&T investment share of total investment
7.4%
7.1%
6.0%
5.0%
4.5%
4.4%
4.0%
0% 2% 4% 6% 8%
ASEAN-10
Middle East
Africa
Europe
World
Americas
Asia
Travel & Tourism investment spending (% total investment, ave. 2016-26)
Sources: WTTC, Oxford Economics
Americas, 25.4%
Africa, 3.4%Middle East,
6.9%
Europe, 15.4%
Asia ex ASEAN, 39.2%
Brunei Darissalam, 0.02%
Cambodia, 0.1%
Indonesia, 3.2%
Laos, 0.1%
Myanmar, 0.05%
Malaysia, 1.2%
Philippines, 0.3%Singapore, 2.3%
Thailand, 1.4%
Vietnam, 1.1%ASEAN, 9.7%
Source: WTTC, Oxford Economics
Shares of total T&T infrastructure spending, 2016-2026
12 | WORLD TRAVEL & TOURISM COUNCIL
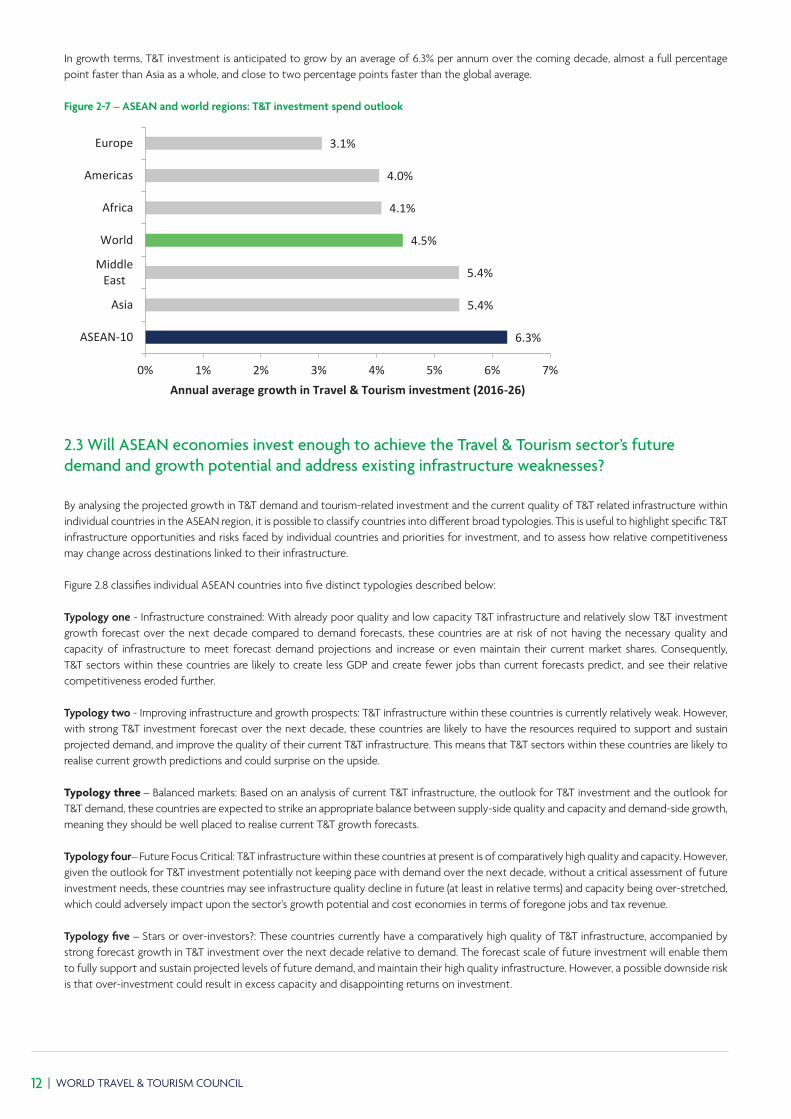
In growth terms, T&T investment is anticipated to grow by an average of 6.3% per annum over the coming decade, almost a full percentage point faster than Asia as a whole, and close to two percentage points faster than the global average.
Figure 2-7 – ASEAN and world regions: T&T investment spend outlook
6.3%
5.4%
5.4%
4.5%
4.1%
4.0%
3.1%
0% 1% 2% 3% 4% 5% 6% 7%
ASEAN-10
Asia
MiddleEast
World
Africa
Americas
Europe
Annual average growth in Travel & Tourism investment (2016-26)
Sources: WTTC, Oxford Economics
2.3 Will ASEAN economies invest enough to achieve the Travel & Tourism sector’s future demand and growth potential and address existing infrastructure weaknesses?
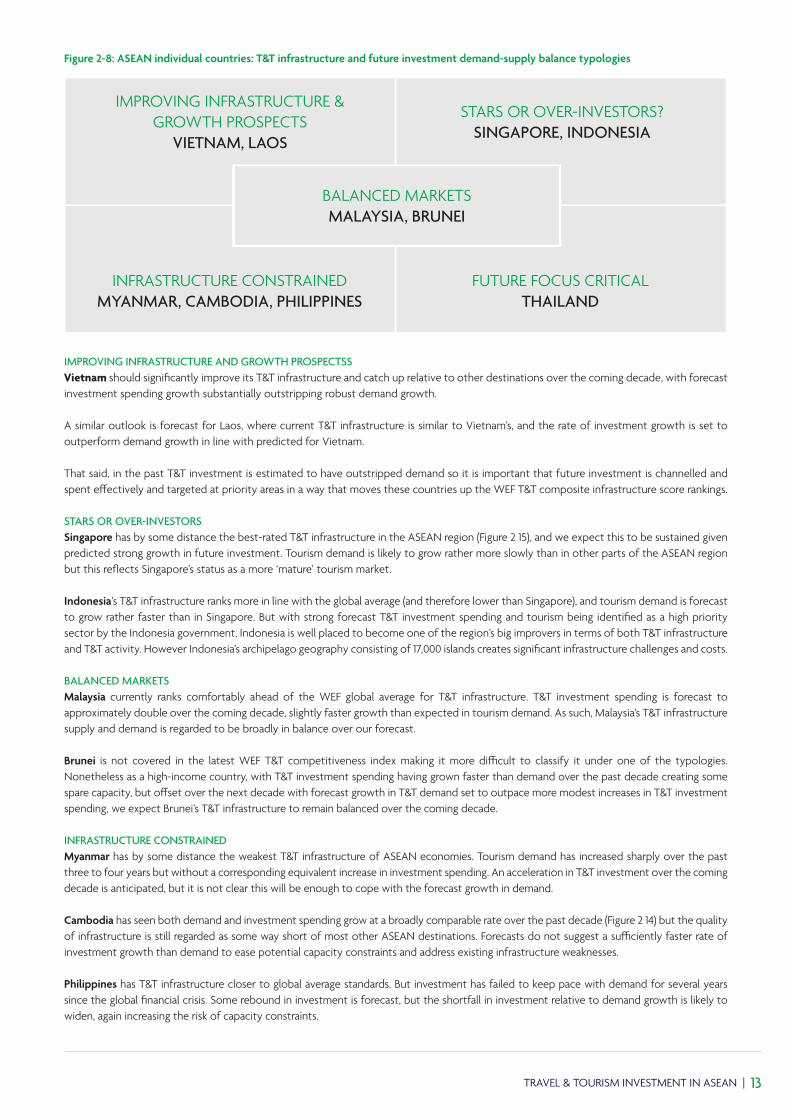
By analysing the projected growth in T&T demand and tourism-related investment and the current quality of T&T related infrastructure within individual countries in the ASEAN region, it is possible to classify countries into different broad typologies. This is useful to highlight specific T&T infrastructure opportunities and risks faced by individual countries and priorities for investment, and to assess how relative competitiveness may change across destinations linked to their infrastructure.
Figure 2.8 classifies individual ASEAN countries into five distinct typologies described below:
Typology one - Infrastructure constrained: With already poor quality and low capacity T&T infrastructure and relatively slow T&T investment growth forecast over the next decade compared to demand forecasts, these countries are at risk of not having the necessary quality and capacity of infrastructure to meet forecast demand projections and increase or even maintain their current market shares. Consequently, T&T sectors within these countries are likely to create less GDP and create fewer jobs than current forecasts predict, and see their relative competitiveness eroded further.
Typology two - Improving infrastructure and growth prospects: T&T infrastructure within these countries is currently relatively weak. However, with strong T&T investment forecast over the next decade, these countries are likely to have the resources required to support and sustain projected demand, and improve the quality of their current T&T infrastructure. This means that T&T sectors within these countries are likely to realise current growth predictions and could surprise on the upside.
Typology three – Balanced markets: Based on an analysis of current T&T infrastructure, the outlook for T&T investment and the outlook for T&T demand, these countries are expected to strike an appropriate balance between supply-side quality and capacity and demand-side growth, meaning they should be well placed to realise current T&T growth forecasts.
Typology four– Future Focus Critical: T&T infrastructure within these countries at present is of comparatively high quality and capacity. However, given the outlook for T&T investment potentially not keeping pace with demand over the next decade, without a critical assessment of future investment needs, these countries may see infrastructure quality decline in future (at least in relative terms) and capacity being over-stretched, which could adversely impact upon the sector’s growth potential and cost economies in terms of foregone jobs and tax revenue.
Typology five – Stars or over-investors?: These countries currently have a comparatively high quality of T&T infrastructure, accompanied by strong forecast growth in T&T investment over the next decade relative to demand. The forecast scale of future investment will enable them to fully support and sustain projected levels of future demand, and maintain their high quality infrastructure. However, a possible downside risk is that over-investment could result in excess capacity and disappointing returns on investment.
TRAVEL & TOURISM INVESTMENT IN ASEAN | 13
Figure 2-8: ASEAN individual countries: T&T infrastructure and future investment demand-supply balance typologies
IMPROVING INFRASTRUCTURE & GROWTH PROSPECTS
VIETNAM, LAOS
STARS OR OVER-INVESTORS?SINGAPORE, INDONESIA
FUTURE FOCUS CRITICALTHAILAND
INFRASTRUCTURE CONSTRAINEDMYANMAR, CAMBODIA, PHILIPPINES
BALANCED MARKETSMALAYSIA, BRUNEI
IMPROVING INFRASTRUCTURE AND GROWTH PROSPECTSSVietnam should significantly improve its T&T infrastructure and catch up relative to other destinations over the coming decade, with forecast investment spending growth substantially outstripping robust demand growth.
A similar outlook is forecast for Laos, where current T&T infrastructure is similar to Vietnam’s, and the rate of investment growth is set to outperform demand growth in line with predicted for Vietnam.
That said, in the past T&T investment is estimated to have outstripped demand so it is important that future investment is channelled and spent effectively and targeted at priority areas in a way that moves these countries up the WEF T&T composite infrastructure score rankings.
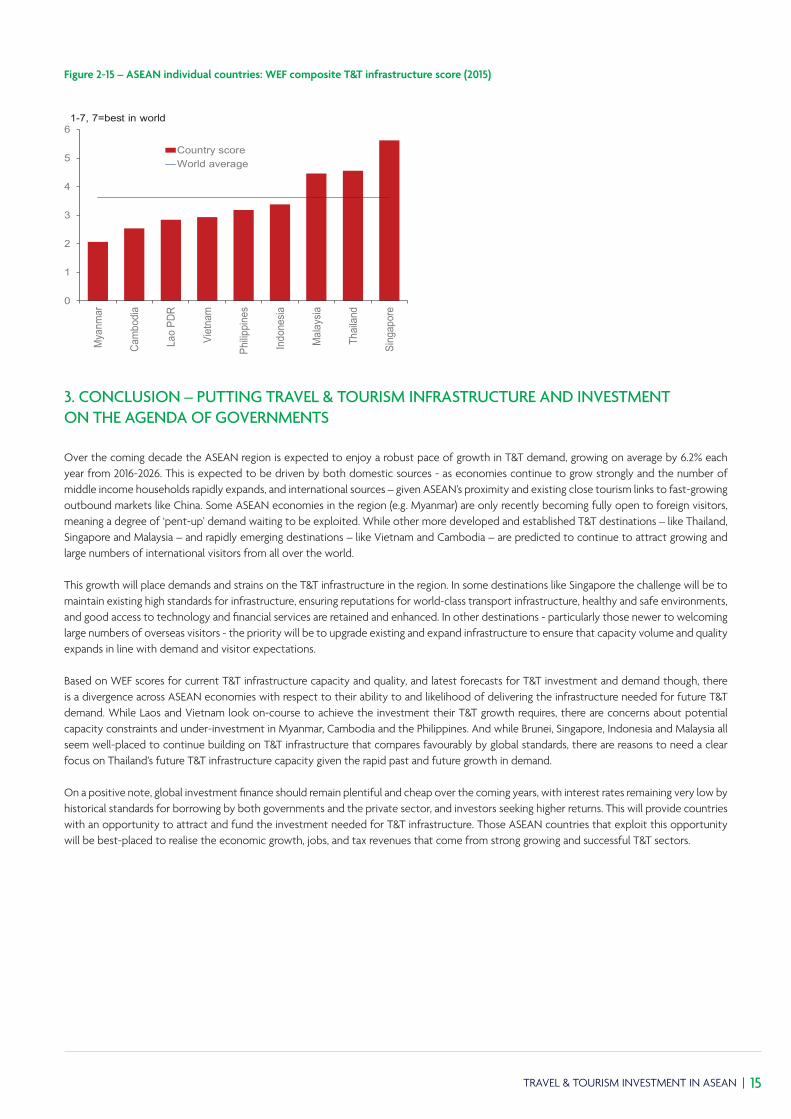
STARS OR OVER-INVESTORSSingapore has by some distance the best-rated T&T infrastructure in the ASEAN region (Figure 2 15), and we expect this to be sustained given predicted strong growth in future investment. Tourism demand is likely to grow rather more slowly than in other parts of the ASEAN region but this reflects Singapore’s status as a more ‘mature’ tourism market.
Indonesia’s T&T infrastructure ranks more in line with the global average (and therefore lower than Singapore), and tourism demand is forecast to grow rather faster than in Singapore. But with strong forecast T&T investment spending and tourism being identified as a high priority sector by the Indonesia government, Indonesia is well placed to become one of the region’s big improvers in terms of both T&T infrastructure and T&T activity. However Indonesia’s archipelago geography consisting of 17,000 islands creates significant infrastructure challenges and costs.
BALANCED MARKETSMalaysia currently ranks comfortably ahead of the WEF global average for T&T infrastructure. T&T investment spending is forecast to approximately double over the coming decade, slightly faster growth than expected in tourism demand. As such, Malaysia’s T&T infrastructure supply and demand is regarded to be broadly in balance over our forecast.
Brunei is not covered in the latest WEF T&T competitiveness index making it more difficult to classify it under one of the typologies. Nonetheless as a high-income country, with T&T investment spending having grown faster than demand over the past decade creating some spare capacity, but offset over the next decade with forecast growth in T&T demand set to outpace more modest increases in T&T investment spending, we expect Brunei’s T&T infrastructure to remain balanced over the coming decade.
INFRASTRUCTURE CONSTRAINEDMyanmar has by some distance the weakest T&T infrastructure of ASEAN economies. Tourism demand has increased sharply over the past three to four years but without a corresponding equivalent increase in investment spending. An acceleration in T&T investment over the coming decade is anticipated, but it is not clear this will be enough to cope with the forecast growth in demand.
Cambodia has seen both demand and investment spending grow at a broadly comparable rate over the past decade (Figure 2 14) but the quality of infrastructure is still regarded as some way short of most other ASEAN destinations. Forecasts do not suggest a sufficiently faster rate of investment growth than demand to ease potential capacity constraints and address existing infrastructure weaknesses.
Philippines has T&T infrastructure closer to global average standards. But investment has failed to keep pace with demand for several years since the global financial crisis. Some rebound in investment is forecast, but the shortfall in investment relative to demand growth is likely to widen, again increasing the risk of capacity constraints.
14 | WORLD TRAVEL & TOURISM COUNCIL
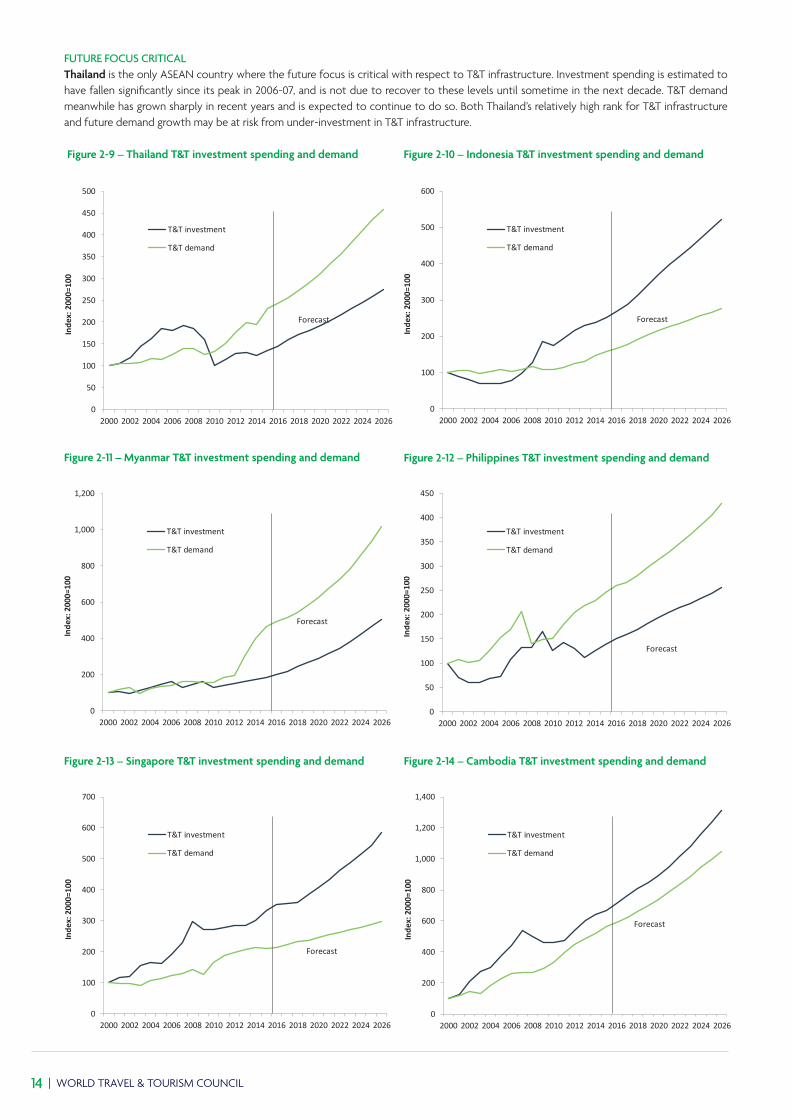
FUTURE FOCUS CRITICALThailand is the only ASEAN country where the future focus is critical with respect to T&T infrastructure. Investment spending is estimated to have fallen significantly since its peak in 2006-07, and is not due to recover to these levels until sometime in the next decade. T&T demand meanwhile has grown sharply in recent years and is expected to continue to do so. Both Thailand’s relatively high rank for T&T infrastructure and future demand growth may be at risk from under-investment in T&T infrastructure.
Figure 2-9 – Thailand T&T investment spending and demand
0
50
100
150
200
250
300
350
400
450
500
2000 2002 2004 2006 2008 2010 2012 2014 2016 2018 2020 2022 2024 2026
Inde
x: 2
000=
100
T&T investment
T&T demand
Forecast
Sources: WTTC, Oxford Economics
Figure 2-10 – Indonesia T&T investment spending and demand
0
100
200
300
400
500
600
2000 2002 2004 2006 2008 2010 2012 2014 2016 2018 2020 2022 2024 2026
Inde
x: 2
000=
100
T&T investment
T&T demand
Forecast
Sources: WTTC, Oxford Economics
Figure 2-13 – Singapore T&T investment spending and demand
0
100
200
300
400
500
600
700
2000 2002 2004 2006 2008 2010 2012 2014 2016 2018 2020 2022 2024 2026
Inde
x: 2
000=
100
T&T investment
T&T demand
Forecast
Sources: WTTC, Oxford Economics
0
200
400
600
800
1,000
1,200
1,400
2000 2002 2004 2006 2008 2010 2012 2014 2016 2018 2020 2022 2024 2026
Inde
x: 2
000=
100
T&T investment
T&T demand
Forecast
Sources: WTTC, Oxford Economics
Figure 2-14 – Cambodia T&T investment spending and demand
0
200
400
600
800
1,000
1,200
2000 2002 2004 2006 2008 2010 2012 2014 2016 2018 2020 2022 2024 2026
Inde
x: 2
000=
100
T&T investment
T&T demand
Forecast
Sources: WTTC, Oxford Economics
Figure 2-11 – Myanmar T&T investment spending and demand Figure 2-12 – Philippines T&T investment spending and demand
0
50
100
150
200
250
300
350
400
450
2000 2002 2004 2006 2008 2010 2012 2014 2016 2018 2020 2022 2024 2026
Inde
x: 2
000=
100
T&T investment
T&T demand
Forecast
Sources: WTTC, Oxford Economics
TRAVEL & TOURISM INVESTMENT IN ASEAN | 15
Figure 2-15 – ASEAN individual countries: WEF composite T&T infrastructure score (2015)
0
1
2
3
4
5
6
Mya
nmar
Cam
bodi
a
Lao
PDR
Viet
nam
Philip
pine
s
Indo
nesia
Mal
aysia
Thai
land
Sing
apor
e
Country scoreWorld average
1-7, 7=best in world
Source : Oxford Economics/WEF
3. CONCLUSION – PUTTING TRAVEL & TOURISM INFRASTRUCTURE AND INVESTMENT ON THE AGENDA OF GOVERNMENTS
Over the coming decade the ASEAN region is expected to enjoy a robust pace of growth in T&T demand, growing on average by 6.2% each year from 2016-2026. This is expected to be driven by both domestic sources - as economies continue to grow strongly and the number of middle income households rapidly expands, and international sources – given ASEAN’s proximity and existing close tourism links to fast-growing outbound markets like China. Some ASEAN economies in the region (e.g. Myanmar) are only recently becoming fully open to foreign visitors, meaning a degree of ‘pent-up’ demand waiting to be exploited. While other more developed and established T&T destinations – like Thailand, Singapore and Malaysia – and rapidly emerging destinations – like Vietnam and Cambodia – are predicted to continue to attract growing and large numbers of international visitors from all over the world.
This growth will place demands and strains on the T&T infrastructure in the region. In some destinations like Singapore the challenge will be to maintain existing high standards for infrastructure, ensuring reputations for world-class transport infrastructure, healthy and safe environments, and good access to technology and financial services are retained and enhanced. In other destinations - particularly those newer to welcoming large numbers of overseas visitors - the priority will be to upgrade existing and expand infrastructure to ensure that capacity volume and quality expands in line with demand and visitor expectations.
Based on WEF scores for current T&T infrastructure capacity and quality, and latest forecasts for T&T investment and demand though, there is a divergence across ASEAN economies with respect to their ability to and likelihood of delivering the infrastructure needed for future T&T demand. While Laos and Vietnam look on-course to achieve the investment their T&T growth requires, there are concerns about potential capacity constraints and under-investment in Myanmar, Cambodia and the Philippines. And while Brunei, Singapore, Indonesia and Malaysia all seem well-placed to continue building on T&T infrastructure that compares favourably by global standards, there are reasons to need a clear focus on Thailand’s future T&T infrastructure capacity given the rapid past and future growth in demand.
On a positive note, global investment finance should remain plentiful and cheap over the coming years, with interest rates remaining very low by historical standards for borrowing by both governments and the private sector, and investors seeking higher returns. This will provide countries with an opportunity to attract and fund the investment needed for T&T infrastructure. Those ASEAN countries that exploit this opportunity will be best-placed to realise the economic growth, jobs, and tax revenues that come from strong growing and successful T&T sectors.
16 | WORLD TRAVEL & TOURISM COUNCIL
The World Travel & Tourism Council is the global authority on the economic and social contribution of Travel & Tourism.
WTTC promotes sustainable growth for the sector, working with governments and international institutions to create jobs, to drive exports and to generate prosperity. For 25 years, WTTC has been the voice of this sector globally. Council Members are the Chairs, Presidents and Chief Executives of the world’s leading, private sector Travel & Tourism businesses.
Travel & Tourism is a key driver for investment and economic growth globally. By the end of 2016, Travel & Tourism will contribute US$7.4 trillion or nearly 10% of global GDP, once all direct, indirect and induced impacts are taken into account. The sector will account for 290 million jobs and 9.6% of total employment, or one in eleven of all jobs on the planet.
Oxford Economics was founded in 1981 as a commercial venture with Oxford University’s business college to provide economic forecasting and modelling to UK companies and financial institutions expanding abroad.
Since then, we have become one of the world’s foremost independent global advisory firms, providing reports, forecasts and analytical tools on 200 countries, 100 industrial sectors and over 3,000 cities. Our best-of-class global economic and industry models and analytical tools give us an unparalleled ability to forecast external market trends and assess their economic, social and business impact.
Headquartered in Oxford, England, with regional centres in London, New York, and Singapore, Oxford Economics has offices across the globe in Belfast, Chicago, Dubai, Miami, Milan, Paris, Philadelphia, San Francisco, and Washington DC. We employ over 250 full-time staff, including 150 professional economists, industry experts and business editors—one of the largest teams of macroeconomists and thought leadership specialists. Our global team is highly skilled in a full range of research techniques and thought leadership capabilities, from econometric modelling, scenario framing, and economic impact analysis to market surveys, case studies, expert panels, and web analytics. Underpinning our in-house expertise is a contributor network of over 500 economists, analysts and journalists around the world.
Oxford Economics is a key adviser to corporate, financial and government decision-makers and thought leaders. Our worldwide client base now comprises over 1,000 international organisations, including leading multinational companies and financial institutions; key government bodies and trade associations; and top universities, consultancies, and think tanks.
Copyright © World Travel & Tourism Council: “Travel & Tourism Investment in ASEAN” 2016. All rights retained The permitted use of the Content is defined by the copyright law of the United Kingdom. By exception (“fair dealing”), you are allowed to copy limited extracts of the Content when the use is for non-commercial research, private study, criticism or review, quotation or news reporting. A condition of fair dealing with a copyright work is that where possible the work is accompanied with a sufficient acknowledgement of the title and author of the work. WTTC requires that the acknowledgment be in the following form: “Copyright © World Travel & Tourism Council: “Travel & Tourism Investment in ASEAN”. All rights retained.”
If your use of the Content would not be permitted under the determination of fair dealing then you must operate under, and display the terms of a Creative Commons (“CC”) licence from WTTC. All CC licenses require you provide attribution and mark the material when you share it publicly. WTTC requires attribution in the following form:
“Travel & Tourism Investment in ASEAN” by World Travel & Tourism Council is licensed under a Creative Commons Attribution-NoDerivatives 4.0 International License. Based on a work at wttc.org. This licence prohibits you from applying effective technological measures or imposing legal terms that would prevent others from doing what the licence permits. It terminates automatically when you fail to comply with the stated terms. Under the terms of this licence, you must fix the problem within 30 days of discovery or you may become eligible for criminal prosecution.
THE AUTHORITY ON WORLD TRAVEL & TOURISMWORLD TRAVEL & TOURISM COUNCIL (WTTC), THE HARLEQUIN BUILDING, 65 Southwark Street, London SE1 0HR, United KingdomTel: +44 (0) 207 481 8007 | Fax: +44 (0) 207 488 1008 | Email: [email protected] | www.wttc.org