transportation p3s – case studies contrasting the canadian ...€¦ · p3 agencies emerge (1)...
TRANSCRIPT
May 2017
Transportation P3s – Case Studies contrasting the Canadian and U.S. ApproachesNUTC Spring Industry Workshop

1
Minimize use of scarce public resources Personnel Monetary
Access private sector capital to reduce/delay public sector outlays Debt and equity
Cost certainty
Projects return to the Public Sector
Accelerate delivery of high priority projects
Streamlined development process
Fast-tracked financing using private sector experience and capital resources
Government can present that projects are moving forward and completed
Reallocate risks to the private sector Revenue/Rates Construction Technology Operations/Maintenance Lifecycle/Capital Reinvestment
Access to top international firms
New technologies
Operational best practices
Drive value with lifecycle costing
‘Pre-paid’ O&M and Lifecycle
Why Governments Use P3 for Infrastructure
RISK TRANSFER EXPERTISE
RESOURCES TIME

2
Infrastructure Procurement AlternativesR
isk
Tran
sfer
to P
rivat
e Se
ctor
0%
100%
Design – Build
Design – Build w/ operating contract
Design – Build – Finance
Design – Build – Finance –Operate – Maintain
Government contracts for the design and construction of assets directly
Contractor Coordinates Mix of interim and completion payments Government to manage and operate assets
Construction (mitigated through time-certain, fixed-price contract)
Financing, operations, maintenance, residual value retained by government entity
Traditional procurement with an operating contract with Private sector for operating the assets post construction
Often operating contract includes a payment penalty mechanism to ensure performance
Only format that allows municipal bond financing for non-transportation assets
Construction, financing, maintenance, residual Operations outsourced to Private sector with
payment penalty mechanism Often used with already constructed assets or
Governmental services
Government contracts with Private sector to deliver constructed assets
Payment at completion or paid over time as lease Government to manage and operate assets
Private sector takes construction and financing risk Government retains ownership risks including
operating, maintenance and residual
Government contracts with Private sector to deliver constructed assets and manage and operate assets under long-term concession
Option for Government to pay fixed “availability” amount or have Private sector collect fees or tolls on asset
Private sector takes all risks except residual as assets typically revert to Government at end of concession
Payment over time often with monetary penalties for substandard performance
Una
djus
ted
Cos
t to
Gov
ernm
ent
low
high
GOVERNMENT RETAINED RISKSALTERNATIVE DESCRIPTION
Design – Bid – Build
Traditional Procurement Designer/Architect is agent of the government Significant skill required to manage cost over-
runs/change orders
Some price mitigation from fixed price contracts Significant interface risk between contractor and
designer/architect Key criteria is low construction price and not whole
life costing

3
Public-private partnership (“P3”) concession structures vary by: Scope: Greenfield (new construction) vs. Brownfield (asset monetization); and Payment Mechanism: Revenue Risk (tolling/user fees) vs. Availability Payments (from government to private
sector)
Greenfields facilitate project delivery and Brownfields result in an upfront payment to the government sponsor (e.g. for budget deficit reduction)
Risk Matrix
DBFOM MODEL – FOUR PROJECT TYPES
Revenue Risk
Private developer collects user fee
revenues from the project
Availability Payment
Governmental sponsor makes performance-
based payments to the private developer
Midtown Tunnel SR-125
North Tarrant Expressway JFK Terminal 4
Chicago SkywayIndiana Toll RoadSan Juan Airport
Chicago Parking GaragesChicago Metered Parking
Presidio ParkwayDenver FasTracks
Port of Miami TunnelLong Beach Courthouse
East End CrossingIndianapolis Courthouse
Penn Bridges
Several portfolio sales in Canada and Europe
Greenfield Construction
Brownfield Asset Monetization
Tolls/User Fees
Availability Payments from Government
Higher Risk Lower Risk
Hig
her R
isk
Low
er R
isk

4
Market Comparison – Closed Transactions

5
Market Comparison – Closed Transactions

6
Market Comparison – Closed Transactions

7
SOURCES AND USES OF PROJECT FUNDING ($000S)
Sources Uses
PABs plus Original Issue Premium $675,003 Construction Works $1,468,460TIFIA Loan 467,977 Tolling and O&M 219,762Revenue During Construction 368,212 Debt Interest & Fees 225,628VDOT Public Funds 308,605 Debt Service Reserve 18,547Equity Contribution 221,043 Major Maintenance Reserve 46,573
Transaction Costs 61,870$2,040,840 $2,040,840
$663,750,000 Tax-Exempt Private Activity Bonds, Series 2012 The Virginia Department of Transportation (“VDOT”) and
Elizabeth River Crossings OpCo LLC (“ERC”) entered into a 58-year DBFOM public private partnership to toll the Elizabeth River crossing in Norfolk, Virginia. ERC will carry out three major infrastructure improvement
programs across the Elizabeth River (the “Project”):– New Midtown Tunnel– MLK Expressway Extension– Improvement of Existing Assets
ERC is owned by Macquarie (50%) and Skanska (50%) ERC will transfer all design and construction obligations to
the design-build contractor (“DBJV”), a joint venture of major construction firms including Skanska, Kiewit and Weeks Marine.
Construction works will be performed over a 5 year period at a cost of $1.47 billion
Tolling and maintenance operations will be carried out by Federal Signal through an Operating Agreement
Project financing involves an innovative capital structure utilizing a mix of private activity bonds (“PABs”), subsidized loans from the U.S. DOT (“TIFIA Loans”), VDOT public funding, private equity contributions and revenues during construction Tolling proceeds during the operational phase are the only
source of revenue for repayment for the Project capital sources
Case Study: Midtown Tunnel P3 Project
PROJECT MAP AND KEY PARTICIPANTSKey
Blue = Brownfield componentsGreen = Greenfield components
Midtown Tunnel
MLK Extension Downtown Tunnel
Equity Sponsors
Public Sponsor

8
The Indiana Finance Authority (“IFA”) is procuring the Ohio River Bridges – East End Crossing project (“ORB” or the “Project”) as a public-private partnership
The scope of the Project includes the design, construction, financing, operation and maintenance (“DBFOM”) of a new river crossing across the Ohio River, connecting Indiana and Kentucky just northeast of the city of Louisville
The Project will be delivered under a ~39-year Public-Private Agreement (“PPA”) Estimated 4 year construction period plus scheduled 35 year
operating period Estimated capital requirement of $1+ billion will be funded
through private sources on a non-recourse, project financing basis Debt and equity investors will be repaid through milestone
payments made from the IFA during construction and through availability payments made by the IFA during the operating period
Financial close reached in March 2013 Project was funded through long-term, tax-exempt private
activity bonds issued in the U.S. capital markets
Case Study: Ohio River Bridges – East End Crossing Project
PROJECT OVERVIEW MAP
East End Crossing Project Public-private partnership (“P3”) procurement New crossing will connect SR265 in Indiana
with I-265 in Kentucky
Downtown Crossing Project Traditional (non-P3) procurement
New twin crossing of existing Kennedy Bridge will double capacity of crossing in downtown
area
Greater Louisville, KY, Area
Indiana

9
Availability Evolution – the 407 Experience
407 ETR - 1999 407 EE – 2012/2014
Model Revenue Availability
Term 99 years 30 years + construction
Financing Short Term bank Bridge to Capital Markets
Short Term Bank and Bond with Long Term Amortizer
Consortium CINTRA/SNC/Pension Fund
CINTRA/SNC
Rating A A
Payment $3 Billion None
Revenue Risk Traffic Volume None
Price Setting Consortium sets tolls Government sets tolls
Contract Project Agreement Project Agreement

10
Stage 1: Exploratory Projects
Individual, unconnected projects No coordinated program Public P3 – Authorizations Pioneering Projects(1)
Stage 2: Developing Programs
Ramp-up in activity P3 Agencies emerge (1)
Dominant Models emerge Dominant Sectors emerge
Stage 3: Mature Market
Dominant procurement method established Adoption as sustainable policy strategy Addition of new asset classes (1)
Stage 4: Consolidation
Holdout jurisdictions join the process Long term participants empty of projects Resistant sectors and jurisdictions added (1)
(1) Bolded in following summary slide
P3 Market Development Stages

11
Canadian P3 HistoryFirst Wave Second Wave Third Wave Fourth WaveExploratory Projects Developing Programs Mature Market Consolidation
1988 Pearson Terminal 3 2000 Wastewater programs: 2006 Golden Ears Bridge 2012 Ottawa LRTPort Hardy/Canmore/Goderich
1991 Teranet Infrastructure Ontario2001 Calgary Ride the Wind Transit 2013 Iqaluit Airport (Nunavut)
1992 Vancouver Airport Bruce Nuclear Plant 2007 North Bay HospitalAutoroute 25
1993 Confederation Bridge 2002 Cook Chill Food Program Calgary Ring Road 2014 John Hart GeneratingViva Bus Waterloo LRT
1995 Charleswood Bridge Britannia Waste to Energy Swift Current Health (Sask)2003 Vancouver Waste to Energy 2008 Alberta Schools I Saskatoon Civic Ops (Sask)
1996 NAV Canada Driver Examination Services Guelph Data CentreHighway 104 Autoroute 30 2015 Eglinton LRT
Partnerships BC Program St Lawrence Bridge (Federal)1997 Nova Scotia Schools 2009 Fort St John Hospital
2004 Sierra Yoyo Desan Moncton Courts1998 F-M Highway William Osler Hospital BridgePoint Health
Moncton Water Treatment Abbotsford Hospital CAMHLeo Hayes High School Royal Ottawa Hospital Niagara Health
Toronto Detention1999 407 ETR 2005 Edmonton Ring Road Montreal Concert Hall
Enwave District Heating Britannia Mine TreatmentTrans-Canada Highway (NB) 2010 Quinte CourtsSea to Sky Highway -2011 Waterloo CourtsCanada Line CSEC LTAP HQBennett Bridge RCMP E-Division
ON Forensic CentreOPP ModernizationWindsor Essex ParkwayMcGill HospitalToronto Airport TunnelPan-am Games Facilities

12
Summary of potential reasons for differences in P3 evolution between jurisdictions
Early stages, with majority of development and innovation only at DOTs
Focus on deficit reduction and self funding projects
Lower political sensitivity to tolls
Significant federal government incentives for transportation projects
Tax subsidy savings for transportation projects
Consensus required at political level
Lack of a catalyzing state funded health care system
Differences in P3 evolution

13
Case Study: Maryland Purple Line Transit P3
OVERVIEW
The Purple Line is a 16-mile light rail line that will extend from Bethesda in Montgomery County to New Carrollton in Prince George's County. It will provide a direct connection to the Metrorail Red, Green and Orange Lines; at Bethesda, Silver Spring, College Park, and New Carrollton. The Purple Line will also connect to MARC, Amtrak, and local bus services.
The Purple Line will be light rail and will operate mainly in dedicated or exclusive lanes.
Twenty-one stations are planned. The Maryland Transit Administration a division of the state DOT is leading
the project. The project will consist of an approximately 5 year construction and 30
year operating period The project will be completed on a DBFOM basis that includes the supply
of the vehicles. The concessionaire will be owned by Meridiam, Fluor and Star America. The debt potion of the financing was raised through the TIFIA program and
the issuance of Private Activity Bonds.
RFI & Industry Forum – Spring 2013 RFQ released – November 2013 Shortlist announced – January 2014 Bids submitted – December 2015 Preferred Bidder announced – February 2016 Financial Close – June 2016 Design and Construction – 2016-2021
PROJECT TIMELINE

14
Case Study: Eglinton Crosstown LRT
The Eglinton Crosstown LRT project is part ofMetrolinx’s regional transportation plan. It is the first ofseveral new transit projects planned for the Torontoarea and will help to reduce congestion, and improveboth the reliability and integration of the transit servicesavailable to Toronto residents
The Eglinton Crosstown LRT will run across EglintonAvenue between Mount Dennis and Kennedy Station.The 19-kilometer corridor will include a 10-kilometerunderground portion between Keele Street and LairdDrive. It will have 25 stops and stations, linking tonumerous bus routes, three subway stations, andvarious GO Transit lines
The Preferred Proponent selected by IO, who procuredthe project on behalf of Metrolinx, is responsible for theDesign, Build, Finance, and Maintenance of the project
The maintenance phase will last for a 30-year periodfollowing construction
Large size of the project required financing with a combination of short term and long term financing achievable within capacity of the Canadian capital markets
Complexity involved in transit project requires that risks are appropriately allocated among stakeholders while achieving an investment grade rating and a risk transfer model that is acceptable to the market
APPENDIX A: CASE STUDIES
PROJECT OVERVIEW
Request for Qualifications – January 2013 Short-list of Bidders Selected – December 2013 Winning Bidder Selected – July 2015 Construction Begins – March 2016
PROJECT TIMELINE

15
States with P3 AuthorizationHome Rule Note: Cities with “home rule” governance such as Chicago and Pittsburgh are able to enact local P3s without statewide authorization or approval
35 U.S. States and 1 U.S. territory that have enacted statutes that enable the use of various P3 approaches for the private development of infrastructure
States with P3 CommissionsStates without Authorizing Legislation
States with P3 Commissions and Authorizing Legislation
States with Authorizing Legislation

16
A separate agency to shepherd project – avoids legacy department politics
Non-political leadership – senior staff drawn from private sector and career Government employees
Build project teams that focus on expertise Use VFM studies and fairness advisor to further
emphasize transparency to public and bidders Ministry department is the client
Use existing template to maximize both bidder and global lender interest
Complete new projects using the same standardized docs and experienced staff
Collaborative approach (Bidder meetings) to identify risk transfer savings – improve on existing documents and refine to local market
Release final documents to the public with only major commercial terms excised
A number of items have led to the success of the P3 model
Not all of them were intentional and came from improving on initial errors or from private sector feedback
Success has been at the state level
Key Success Factors
PROCUREMENT AGENCY EXISTING TEMPLATE
Start with relatively simple, well supported projects Work out the ‘kinks’ before trying more complex
projects Initially avoid municipal projects where you can’t fully
direct process Create a transparent pipeline of projects - attracts
bidders to set-up locally
Public support comes from perceived problems with cost overruns
Clinical (eg doctors/nurses) left out of structure –project not introduced as a way to reduce or outsource staff
Collaborative approach between construction and public sector union objectives
PROJECT SELECTION FOCUS ON CONSTRUCTION

17
The characteristics of the 'right' project is very similar, whether it's the first project of a multiple project program or the first and only deal a municipality or department will be doing in the near future.
The key characteristics we have observed are as follows:
Size - The optimal size is $250 to $1.5 billion.
Easy to define boundary - usually a physical limit which could be a building or a segment of roadway.
Build, not sell or outsource - it's beneficial to avoid early projects that attract negative attention from unions and interest groups.
Whole Life Benefit - the P3 format works best in projects where the private sector takes both construction and operations risk.
Funding is in place - the biggest concern from potential bidders is the risk that the government owner will not achieve financial close.
Not completely designed - optimizing design leads to cost savings and the best opportunity for whole life savings.
Value for Money!
Picking the Right Availability Project
18
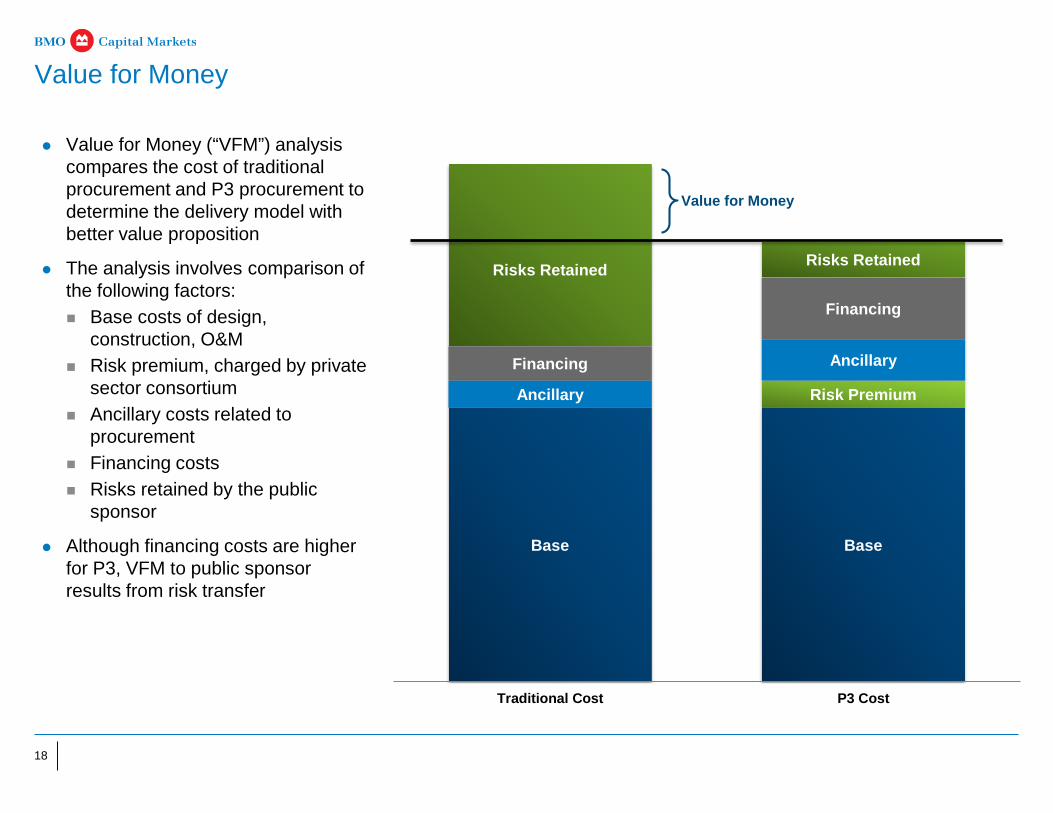
Value for Money
Value for Money (“VFM”) analysis compares the cost of traditional procurement and P3 procurement to determine the delivery model with better value proposition
The analysis involves comparison of the following factors: Base costs of design,
construction, O&M Risk premium, charged by private
sector consortium Ancillary costs related to
procurement Financing costs Risks retained by the public
sponsor
Although financing costs are higher for P3, VFM to public sponsor results from risk transfer
Base Base
Risk PremiumAncillary
AncillaryFinancing
Financing
Risks Retained Risks Retained
Traditional Cost P3 Cost
Value for Money

19
BMO assumes no responsibility for verification of the information in these materials, and no representation or warranty is made as to the accuracy or completeness of such information. BMO assumes no obligation to correct or update these materials. These materials do not contain all information that may be required to evaluate, and do not constitute a recommendation with respect to, any transaction or matter. Any recipient of these materials should conduct its own independent analysis of the matters referred to herein.
“BMO Capital Markets” is a trade name used by BMO Financial Group for the wholesale banking businesses of Bank of Montreal, BMO Harris Bank N.A. (formerly Harris N.A.) and Bank of Montreal Ireland p.l.c, and the institutional broker dealer businesses of BMO Capital Markets Corp. and BMO Capital Markets GKST Inc. in the U.S., BMO Nesbitt Burns Inc. (Member – Canadian Investor Protection Fund) in Canada, Europe and Asia, BMO Nesbitt Burns Securities Limited (registered in the United States and a member of FINRA), BMO Capital Markets Limited in Europe, Asia and Australia and BMO Advisors Private Limited in India.
BMO does not provide tax or legal advice. Any discussion of tax matters in these materials (i) is not intended to be used, and cannot be used or relied upon, for the purposes of avoiding any tax penalties and (ii) may have been written in connection with the “promotion or marketing” of the transaction or matter described herein. Accordingly, the recipient should seek advice based on its particular circumstances from an independent tax advisor.
As part of any proposed engagement with the BMO client or potential client, please be advised that we will not be serving as a “municipal advisor,” as that term is defined in the Securities and Exchange Commission’s Rule 15Ba1-1 (the “Municipal Advisor Rule”) promulgated under the Securities Exchange Act of 1934, as amended (the “Exchange Act”). We will not be providing advice to or on behalf of you or any other Municipal Entity or Obligated Person with respect to Municipal Financial Products or the issuance of municipal securities, including advice with respect to the structure, timing, terms, or other similar matters concerning such financial products or issues, unless an Independent Registered Municipal Advisor is retained in connection therewith in such manner as to exempt our provision of any advice to you or on your behalf from the requirement to register as a municipal advisor under the Municipal Advisor Rule. In the event that municipal securities are to be issued as part of the financing of any potential Project, please be advised that you must retain an Independent Registered Municipal Advisor in such manner as to exempt our provision of any advice to you or on your behalf from the requirement to register as a municipal advisor under the Municipal Advisor Rule. Capitalized terms used in the preceding sentences shall have the meanings ascribed to such terms in the Municipal Advisor Rule and the Exchange Act.
If you have any questions or concerns about the disclosures described above, you should make those questions or concerns known immediately to BMO. In addition, you should consult with your own financial and/or municipal, legal, accounting, tax and other advisors, as applicable, to the extent you deem appropriate.
Disclaimers