transportation labour market outlook … labour market outlook for the asia pacific gateway corridor...
TRANSCRIPT

—
TRANSPORTATION LABOUR MARKET OUTLOOK FOR THE ASIA PACIFIC GATEWAY CORRIDOR 2016–2025—ASIA PACIFIC GATEWAY CORRIDOR
—

The Asia Pacific Gateway Skills Table wishes to acknowledge the funding support from the Government of Canada’s Sectoral Initiatives Program.
—
La Table sur les compétences de la Porte d'entrée de l'Asie-Pacifique reçoit le soutien financier du Programme d’ initiatives sectorielles du gouvernement du Canada.
The opinions and interpretations in this publication are those of the author and do not necessarily reflect those of the Government of Canada.
—
Les opinions et les interprétations figurant dans la présente publication sont celles de l’auteur et ne représentent pas nécessairement celles du gouvernement du Canada.
—
www.apgst.ca

CONTENT
APPENDIX
Chapter1 EXECUTIVESUMMARY 6
LabourDemand 7
LabourSupply 8
HiringDifficultyIndex 8
Chapter2 HIGHLIGHTS 9
AirSector 10
LogisticsSector 13
RailSector 16
TruckingSector 19
Chapter3 KEYFACTS2016–2025 22
HiringDifficultyIndex 22
LabourDemand 23Expansion 24
LabourSupply 25Replacement 26
BaseSupply 27
NewSupply 28
NewEntrants 29
Immigration 30
Mobility 31
Chapter4 IMPACTOFTHEECONOMICSCENARIOS 32 Chapter5 CONCLUSIONS 34
AppendixA DescriptionofMetricsandGlossaryofTerms 38
AppendixB EconomicIndicatorsandMajorProjects includedintheEconomicScenarios 43
AppendixC DataTablesbySectorandEconomicScenario: TheAsiaPacificGatewayCorridor 52
APGC–AllSectors 52
Air 55
Logistics 58
Rail 61
Trucking 64 AppendixE TheAsiaPacificGatewayCorridorOccupations 67

4 Asia Pacific Gateway Corridor Transportation Labour Market Outlook for the Asia Pacific Gateway Corridor 2016–2025
The Asia Pacific Gateway Skills Table (APGST) and its partners developed this report to provide comprehensive and up-to-date information on employment needs over a 5- and 10-year forecast period, with a focus on key occupations in the Asia Pacific Gateway Corridor (APGC). Reports are also available covering sector outlooks and occupational snapshots for 34 occupations considered essential to the APGC. The snapshots contain detailed supply and demand information, highlights, and data tables. Reports can be found at lmionline.ca.
This forecast provides valuable information that can be used to facilitate labour market planning for decision makers and employers, and can help workers make informed choices about their careers and futures. Forecasts are developed with a leading-edge economic modeling system using data from a variety of reliable sources, and are validated by key stakeholders. The statements and assessments of labour market conditions in this report are based on forecasts; they are “expected” conditions and outcomes relative to the economic conditions used to create the information.
The APGST generates the information in these reports from a labour market forecast based on three economic scenarios: the High Investment Scenario, Moderate Investment Scenario, and Low Investment Scenario. Definitions of these scenarios and a full description of labour market metrics used in the analysis can be found in Appendix A. The analysis that follows, unless otherwise indicated, is based on a Moderate Investment Scenario, which takes into account projects that are planned and likely to proceed. Provincial information is included for British Columbia, Alberta, Saskatchewan and Manitoba in Appendix B. The data tables for the APGC, by sector and economic scenario, are provided in Appendix C.
Related reports that may be of interest are:JJ British Columbia Regional Outlook 2016–2025JJ Alberta Regional Outlook 2016–2025JJ Saskatchewan Regional Outlook 2016–2025JJ Manitoba Regional Outlook 2016–2025JJ Air Sector Outlook 2016–2025JJ Logistics Sector Outlook 2016–2025JJ Rail Sector Outlook 2016–2025JJ Trucking Sector Outlook 2016–2025
These and other documents can be found at lmionline.ca.
ABOUTTHISREPORT
LabourMarketInformationisdataaboutthesupplyofanddemandforlabourinkeyoccupations,sectors,andregionsoftheeconomy.

5 Asia Pacific Gateway Corridor Transportation Labour Market Outlook for the Asia Pacific Gateway Corridor 2016–2025
of jobs are generated by Expansion in the first 5 years of the forecast. See pages 24–26 for more information on Replacement vs. Expansion.
of workers move into the 34 APGC Occupations from other occupations in the labour force. See page 31 for more information on Labour Force Mobility.
of new workers are immigrants to Canada. See page 30 for more information on Immigration.
BYTHENUMBERS
Air Logistics Rail Trucking APGC Total
Average Jobs1 181,514 190,145 186,892 270,475 557,162
New Positions 13,250 13,673 14,409 19,332 40,037
Net New Workers 11,772 12,413 13,063 17,196 36,109
Growth (%) 7.6% 7.5% 8.1% 7.4% 7.5%
Replacement 49,060 45,440 53,097 68,568 139,056
Replacement Rate for Today’s Workforce
27.3% 24.1% 28.7% 25.3% 25.0%
Job Openings 61,020 59,917 67,296 84,870 177,374
Total New Supply 60,556 58,955 66,628 84,900 176,239
New Supply by Type
Labour Force Mobility
29,112 29,200 27,585 52,904 98,841
International Mobility
9,991 5,958 11,355 12,388 23,880
Mobility 2,801 7,029 5,475 6,824 17,402
New Entrants 18,652 16,768 22,213 12,784 36,116
1 Occupations are not unique to a sector; some are found in all four. As a result, the sum of the sectors will be higher than the total for the APGC.
24 20 14

6
Chapter 1
Asia Pacific Gateway Corridor Transportation Labour Market Outlook for the Asia Pacific Gateway Corridor 2016–2025
Executive Summary
British Columbia’s geographic location provides a natural advantage as the gateway between North America and Asia. Each of the provinces in the Corridor has vastly different labour, recruitment, and retention challenges. The location of BC’s ports means the sailing time to markets in Asia is two days less than it is from other ports in the Western hemisphere. This adds intensity to British Columbia’s potential liquefied natural gas (LNG) industry and its rich natural resource base; together with the impact of changing oil projects in Alberta, and changes in metals mining in Saskatchewan and Manitoba, there is substantial variability in the economy across the four provinces. If the developments in the Moderate or High Economic Scenarios come to pass in the next decade, then competition for labour will increase dramatically in what is already a very tight labour market for skilled and experienced occu-pations. If the conditions in the Low Scenario dominate the decade, then the challenge across the provinces will be the replacement of experienced workers, who will retire in large numbers.
The support and maintenance of the APGC and its labour force is considered central to supporting expansion in the Canadian economy; a robust and flexible transportation sector will be required to truly capture the area’s full potential. A skilled, mobile labour force will also be essential. The APGC Labour Market Information (LMI) Project provides the foundation for insight into the labour conditions for APG businesses. By doing so, it supports the strong function of this central element of Canada’s economy.
The APGC is forecast to continue to grow during the 10 years of the forecast as trade activity between North America and Asia continues to be a key economic driver for the APGC economy. This growth will intensify the need for an available, well-trained workforce. The forecast shows that employers will face some challenges in hiring the workers they need in the 34 occupations starting in 2017, and the situation will remain challenging through the balance of the forecast period. This trend is similar across the four sectors, which include Air, Logistics, Rail, and Trucking.
See the Sector Outlook reports for in-depth information for each of the sectors.
EXECUTIVESUMMARY
TheAsiaPacificGatewayCorridor(APGC)isanintegratedsupplychain,thatincludesairports,seaports,railways,roadways,andbordercrossings,connectingCanadaandtheNorthAmericanmarkettoAsiaandtheworld.

7
Chapter 1
Asia Pacific Gateway Corridor Transportation Labour Market Outlook for the Asia Pacific Gateway Corridor 2016–2025
Figure 1 Components of New Supply, APGC, 2016 and 2025
80%
60%
40%
20%
0
-20%
-40%
Perc
ent o
f Tot
al N
ew S
uppl
y
NewEntrants
Mobility Labour ForceMobility
Intl.Mobility
2016 2025
LABOURDEMANDOver the next 10 years, 177,375 jobs will need to be filled, with 22% generated by Expansion and 78% by Replacement (see page 26). The number of Job Openings will peak in 2018 and decline slowly but steadily thereafter, with a slight rebound in 2025.
By sector, Job Opening numbers are approximately:JJ 61,120 in AirJJ 59,915 in LogisticsJJ 67,295 in RailJJ 84,870 in Trucking
The number of positions increases by 7.5%, for a total of 40,035 new positions over the forecast period.
LABOURSUPPLYThe forecast shows New Supply is not keeping pace with Job Openings, especially in Alberta. However, in Manitoba, supply and demand growth are balanced. The composition of New Supply will shift over the 10 years, with increasing reliance on Immigration (Figure 1).
For the New Supply of workers across the four sectors of the APGC:JJ 25% of the workers in the 34 occupations today will retire and
leave the APGC labour market by the end of the forecast period.JJ More than 56% of the New Supply will come from New Entrants.JJ Just under 15% of new workers will come from other countries.JJ 10% of new workers will move to the APGC from other provinces.JJ Approximately 20% will move into the 34 occupations from other
occupations or by returning to the labour force.
Investment Scenario Comparison The forecast shows that both supply and demand for all 34 occupations in all four sectors in the APGC are influenced by the economic scenarios. In the APGC, the High Investment Scenario will generate about 34,085 more Job Openings (47%) than the Low in the first 5 years of the fore-cast. In the final 5 years, between 2021 and 2025, the Low Investment Scenario outperforms the High by 9,265 Job Openings, for a net effect that has the High Investment Scenario generating about 24,820 more Job Openings (16%).
All four sectors show the same pattern. The Logistics and Trucking Sectors show the largest impact from the economic scenarios in both the first 5 years and the full 10 years. Trucking has the largest (49%, or 16,115 Job Openings) 5-year impact among the four sectors, and Rail the smallest (36%, or 10,510 Job Openings) 10-year impact. The analysis in this report is based on the Moderate Investment Scenario (the expected scenario), which takes into account projects that are planned and likely to proceed (see Appendix B).
Executive Summary

8
Chapter 1
Asia Pacific Gateway Corridor Transportation Labour Market Outlook for the Asia Pacific Gateway Corridor 2016–2025
Executive Summary
HIRINGDIFFICULTYINDEXThe Hiring Difficulty Index assesses the overall challenges for employers who are trying to hire in the labour market. It aggregates five metrics and combines them to provide a single measure that reflects the different interactions between the labour market components. For example, the metrics can show the ratio of workers to Job Openings (the Market Tightness) as “Tight”, with International Reliance and Supply Lag Low and Mobility positive (i.e., workers are moving in), while the Loss of Experience is Moderate and the reliance on New Entrants is Extreme. This implies quite different labour market conditions than a situation where the Market Tightness is “Tightening” (i.e., less difficult), but International Reliance is High, supply is growing much more slowly than Job Openings, and a high portion of current workers are leaving to work in other provinces. For more information on labour market metrics, see Appendix A.
The labour market for the 34 occupations included in the APGC forecast will provide some challenges for employers to find the workers they need for most years of the forecast (see Table 1). The forecast anticipates 2016 as the year with the most flexibility.
Table 1 Hiring Difficulty Index for the APGC and the Sectors
Sector 2016 2017 2018 2019 2020 2021 2022 2023 2024 2025
Airsome
challengesdifficult some challenges
Logisticseasy
marketsome challenges
Raileasy
marketsome challenges
Truckingeasy
marketsome challenges
APGC Totaleasy
marketsome challenges
Oversupplied Market 0–8
Easy Market 9–15
Difficult 23–29
Extremely Difficult 30+
Some Challenges 16–22

9 Asia Pacific Gateway Corridor Transportation Labour Market Outlook for the Asia Pacific Gateway Corridor 2016–2025
Chapter 2 Highlights
By 2024, Asia–Pacific container traffic providing goods to consumers across Canada and arriving at British Columbia’s deep water ports is expected to increase by more than 70%. Exports of goods (grain, potash, metals and minerals) from all four APGC provinces, driven by demand from our Asian trading partners, is also expected to grow (by 60% or more). To compete successfully for this growing trade and capitalize on Canada’s natural geographic advantage, APGC partners—federal and provincial governments, their agencies, ports, railways, and airport authorities— have set ambitious growth targets for British Columbia’s ports and airports. Major public–private investments have increased capacity and will eliminate congestion and streamline operations. Projects to expand and enhance port, rail, road, and airport infrastructure currently planned or underway total well over $20 billion.
This study indicates that there could be 40,035 more jobs by 2025 than there are today in the 34 APGC occupations assessed across the four provinces in the APGC. It also shows that 177,375 jobs will need to be filled over the 10 years of the forecast: 22% generated by Expansion and 78% by Replacement in those same occupations. This is about 9% of the estimated 2,052,720 Job Openings forecast for all occupations in the four provinces of the APGC.
This section provides labour market highlights for the following four key sectors in the APGC:
HIGHLIGHTS
TheAPGCisforecasttocontinuetogrowinthe10yearsoftheforecastastradeactivitybetweenNorthAmericaandAsiaaccelerates.ToachievethisgrowthandcapturethevalueoftheinfrastructureandcapacityinvestmentsbeingmadeintheCorridor,avibrant,well-trained,resilientworkforcemustbeavailabletoemployers.Demographics,economicchanges,andaccesstotrainingopportunitiesallaffecttheavailabilityoflabour.
Air Logistics Rail Trucking

10 Asia Pacific Gateway Corridor Transportation Labour Market Outlook for the Asia Pacific Gateway Corridor 2016–2025
AIRSECTOR
Chapter 2 Highlights — Air Sector
By the Numbers
Job Openings to be filled 61,020 34% of APGC total
Replacement Job Openings 49,060 80% of Job Openings
Job Openings created by Expansion
11,958 15% of Job Openings in first 5 years
Workers who will retire and leave the labour force
49,060 29% of today’s workers
New workers – New Entrants to the industry
29,112 48% of the New Supply
New workers – from other countries
9,991 16% of the New Supply
New workers – from other provinces
2,801 5% of the New Supply
New workers – from other parts of the labour force
18,652 31% of the New Supply
Average time left in the industry 16 – 26 years until retirement (between the ages of 60–70)
Air cargo comprises mostly perishables and low-weight, high-value consumer goods. While the volume by weight of air cargo is substantially smaller than in any other mode, the value in dollars is equivalent to that moved by rail. Developing and expanding various aspects of the air cargo business is a strategic focus inside the APGC.
The APGC LMI Project Air Sector includes 15 occupations. For details on individual occupations, please refer to the Occupational Snapshots.
Airtransportusingcargoaircraftisavitalcomponentofmanyinternationallogisticsnetworks.

11 Asia Pacific Gateway Corridor Transportation Labour Market Outlook for the Asia Pacific Gateway Corridor 2016–2025
Chapter 2 Highlights — Air Sector
Table 2 Air Sector Occupations and Job Openings
NOC Occupation Title Job Openings
0016 Senior Managers – Construction, Transportation, Production and Utilities
24,060
0714 Facility Operation and Maintenance Managers
27,380
0731 Managers in Transportation 15,518
1525 Dispatchers 10,291
1526 Transportation Route and Crew Schedulers
1,485
2131 Civil Engineers 24,220
2241 Electrical and Electronics Engineering Technologists and Technicians
11,655
2243 Industrial Instrument Technicians and Mechanics
2,951
2261 Non-Destructive Testers and Inspection Technicians
3,128
2262 Engineering Inspectors and Regulatory Officers
1,896
2263 Inspectors in Public and Environmental Health and Occupational Health and Safety
13,415
2271 Air Pilots, Flight Engineers and Flying Instructors
4,654
7231 Machinists and Machining and Tooling Inspectors
9,932
7311 Construction Millwrights and Industrial Mechanics
20,993
7315 Aircraft Mechanics and Aircraft Inspectors
5,153
The forecast for 2016–2025 shows 2017 as the most challenging year that employers will face. In most of the forecast, employers will have some challenges in hiring the workers they need in the 15 occupations. This trend is similar across the four provinces, with Manitoba showing difficult conditions more often than the others.
Job Openings are more likely to be created by Replacement (80%) than by Expansion. More than 1 in 4 workers will retire and leave the sector, a little higher than in the APGC as a whole. More than 2 in 5 Senior Managers – Construction, Transportation, Production and Utilities will have retired and left the Labour Force by 2025, as will more than a third of Managers in Transportation.
Almost half of all new workers in the Air Sector will be New Entrants. Virtually all new Industrial Instrument Technicians and Mechanics will be New Entrants, which means employers will need to invest in more on-the-job training to enable newly trained workers to contribute to overall productivity. Aircraft Mechanics and Aircraft Inspectors and Air Pilots, Flight Engineers and Flying Instructors show a significant loss of workers to other provinces. Almost a third of new workers in the 15 occupations of the APGC Air Sector are from other parts of the labour force, but there is a wide variance, with 90% of Managers in Transportation coming from this source while Air Pilots, Flight Engineers and Flying Instructors lose the equivalent of more than a third of New Supply to other occupations. Just over 15% of the New Supply of workers will come from other countries. For Air Pilots, Flight Engineers and Flying Instructors, more than 50% of new workers are from other countries.
36% of the workers in the APGC Air Sector live in BC, 47% in Alberta, 8% in Saskatchewan, and 9% in Manitoba.

12 Asia Pacific Gateway Corridor Transportation Labour Market Outlook for the Asia Pacific Gateway Corridor 2016–2025
Chapter 2 Highlights — Air Sector
APGST Labour Market Metrics for the Air Sector The following table shows the six APGST labour market metrics. When considered together, these indicators provide a quick reference “scorecard” on the conditions of the labour market. For more information on labour market metrics, see Appendix A or the Occupational Snapshots, available at lmionline.ca.
Table 3 APGST Labour Market Metrics for the Air Sector in the APGC
Metric 2016 2017 2018 2019 2020 2021 2022 2023 2024 2025
Hiring Difficulty Index
some challenges
difficult some challenges
Market Tightness
3
Mobility fewer jobs
low leaving
moving in
Supply Lag low medium high medium low
International Reliance
high medium low medium
Loss of Experience
high medium high
In the first 5 years of the forecast, the High Investment Scenario will generate 9,915 (40%) more Job Openings than the Low. In the second half, the Low Investment Scenario will generate 4,775 more Job Openings, for a net effect that has the High Investment Scenario generating 5,140 (9%) more Job Openings than the Low.

13 Asia Pacific Gateway Corridor Transportation Labour Market Outlook for the Asia Pacific Gateway Corridor 2016–2025
Chapter 2 Highlights — Logistics Sector
LOGISTICSSECTOR
By the Numbers
Job Openings to be filled 59,917 34% of APGC total
Replacement Job Openings 45,440 76% of Job Openings
Job Openings created by Expansion
14,482 18% of Job Openings in first 5 years
Workers who will retire and leave the labour force
45,440 26% of today’s workers
New workers – New Entrants to the industry
29,200 50% of the New Supply
New workers – from other countries
5,958 10% of the New Supply
New workers – from other provinces
7,029 12% of the New Supply
New workers – from other parts of the labour force
16,768 28% of the New Supply
Average time left in industry 18 – 28 years until retirement (between the ages of 60–70)
When used with reference to business, the term logistics often occurs in conjunction with the terms supply chain or supply chain management. Supply chain and logistics refers to the science of ensuring that the move - ments to and from each segment of the chain are carried out as efficiently and economically as possible. In the APGC, logistics deals with the movement of goods from source to destination using air, marine, rail, and trucking resources.
The APGC LMI Project Logistics Sector includes 12 occupations. For details on individual occupations, please refer to the Occupational Snapshots.
Logisticsreferstotheformalprocessesbywhichbusinessesensurethatsuppliesareprocuredfromtherightsources,transportedtowheretheyareneeded,andarriveattherighttime.

14 Asia Pacific Gateway Corridor Transportation Labour Market Outlook for the Asia Pacific Gateway Corridor 2016–2025
Chapter 2 Highlights — Logistics Sector
The forecast for 2016–2025 shows 2016 and 2017 as the least challenging years that employers will face. Throughout most of the forecast, employers will have some challenges hiring the workers they need in the twelve occupations. This trend is similar across the four provinces, with Manitoba showing difficult conditions more often than the others.
Job Openings are more likely to be created by Replacement (76%) than Expansion; however, in the first 5 years, close to 1 in 3 Job Openings are generated by Expansion. Just under 1 in 4 workers will retire and leave the sector, about the same as in the APGC as a whole. Close to 1 in 3 Supervisors, Supply Chain, Tracking and Scheduling Co-ordination Occupations and Managers in Transportation will have retired and left the labour force by 2025.
Half of all new workers in the industry will be New Entrants and 4 in 5 for Customs, Ship and Other Brokers, and Production Logistics Co-ordinators and Shippers and Receivers; employers will need to invest in more on-the-job training to enable newly trained workers to contribute to overall productivity. All of the occupations gain some of their New Supply from other provinces, with Purchasing Agents and Officers gaining almost half of their New Supply from other provinces. More than 1 in 4 new workers in the APGC are from other parts of the labour force, with half of the New Supply in Saskatchewan coming from this source along with 9 in 10 Managers in Transportation, Supervisors, Supply Chain, Tracking and Scheduling Co-ordination Occupations and Retail and Wholesale Buyers. About 1 in 10 new workers come from other countries; however, in Saskatchewan, the 12 occupations in the Logistics Sector lose the equivalent of 15% of the New Supply to workers leaving Canada. Across the APGC, 1 in 3 Inspectors in Public and Environmental Health and Occupational Health and Safety will come from other countries.
38% of the workers in the APGC Logistics Sector live in BC, 44% in Alberta, 8% in Saskatchewan and 10% in Manitoba.
Table 4 Logistics Sector Occupations and Job Openings
NOC Occupation Title Job Openings
0113 Purchasing Managers 5,563
0731 Managers in Transportation 15,518
1215 Supervisors, Supply Chain, Tracking and Scheduling Co-ordination Occupations
15,487
1225 Purchasing Agents and Officers 19,174
1315 Customs, Ship and Other Brokers 1,041
1521 Shippers and Receivers 31,850
1523 Production Logistics Co-ordinators 5,580
1524 Purchasing and Inventory Control Workers
8,845
2262 Engineering Inspectors and Regulatory Officers
1,896
2263 Inspectors in Public and Environ - mental Health and Occupational Health and Safety
13,415
6222 Retail and Wholesale Buyers 8,974
7452 Material Handlers 52,099

15 Asia Pacific Gateway Corridor Transportation Labour Market Outlook for the Asia Pacific Gateway Corridor 2016–2025
APGST Labour Market Metrics for the Logistics Sector In the first 5 years of the forecast, the High Investment Scenario will generate 12,305 more Job Openings than the Low. In the second half of the forecast, the Low Investment Scenario will generate 2,135 more Job Openings than the High, for a net effect that has the High Investment Scenario generating 10,170 more Job Openings (19%) than the Low.
Table 5 APGST Labour Market Metrics for the Logistics Sector in the APGC
Metric 2016 2017 2018 2019 2020 2021 2022 2023 2024 2025
Hiring Difficulty Index
easy market some challenges
Market Tightness
3
Mobility moving in
Supply Lag low medium high medium low
International Reliance
none medium
Loss of Experience
high medium high
Chapter 2 Highlights — Logistics Sector

16 Asia Pacific Gateway Corridor Transportation Labour Market Outlook for the Asia Pacific Gateway Corridor 2016–2025
Highlights — Rail SectorChapter 2
RAILSECTOR
By the Numbers
Job Openings to be filled 67,296 38% of APGC total
Replacement Job Openings 53,097 79% of Job Openings
Job Openings created by Expansion
14,199 18% of Job Openings in first 5 years
Workers who will retire and leave the labour force
53,095 30% of today’s workers
New workers – New Entrants to the industry
27,585 41% of the New Supply
New workers – from other countries
11,355 17% of the New Supply
New workers – from other provinces
5,475 8% of the New Supply
New workers – from other parts of the labour force
22,213 33% of the New Supply
Average time left in the industry 16 –26 years until retirement (between the ages of 60–70)
TheRailSectormanagestheoperationsofrailwaysandrailwayyardstomovelargequantitiesofbulkandotherformsofcargoacrossthecountry.
A freight train is a group of freight cars hauled by one or more locomotives on a railway, ultimately transporting cargo between two points as part of the logistics chain. Trains can be as long as four kilometres or more, operated by a crew of two. Trains may haul bulk material, intermodal containers, general freight, or specialized freight in purpose-designed cars. When considered in terms of tonne-kilometres hauled per unit of consumed energy, rail transport is more efficient than other means of transportation. Additional economies are often realized with bulk commodities (e.g., coal), especially when hauled over long distances. With bulk shipments, distances as short as 30 kilometres are sufficient to make rail transport economically viable.
The APGC LMI Project Rail Sector incudes 19 occupations. For details on individual occupations, please refer to the Occupational Snapshots.
The forecast for 2016–2025 shows 2016 as the least challenging year that employers will face. For most of the forecast period, employers will have some challenges in hiring the workers they need in the 19 occupations. This trend is similar across the four provinces, with Saskatchewan and Manitoba showing difficult conditions more often than the others.
Job Openings are more likely to be created by Replacement (79%) than Expansion; however, in the first 5 years, close to 1 in 4 Job Openings are generated by Expansion. Just under 1 in 4 workers will retire and leave the sector, about the same as in the APGC as a whole. Close to 2 in 5 Railway and Yard Locomotive Engineers and Railway Carmen/women will have retired and left the labour force by 2025.

17 Asia Pacific Gateway Corridor Transportation Labour Market Outlook for the Asia Pacific Gateway Corridor 2016–2025
Highlights — Rail SectorChapter 2
Table 6 Rail Sector Occupations and Job Openings
NOC Occupation Title Job Openings
0016 Senior Managers – Construction, Transportation, Production and Utilities
24,060
0714 Facility Operation and Maintenance Managers
27,380
0731 Managers in Transportation 15,518
1525 Dispatchers 10,291
1526 Transportation Route and Crew Schedulers
1,485
2131 Civil Engineers 24,220
2231 Civil Engineering Technologists and Technicians
8,033
2241 Electrical and Electronics Engineering Technologists and Technicians
11,655
2243 Industrial Instrument Technicians and Mechanics
2,951
2261 Non-Destructive Testers and Inspection Technicians
3,128
2262 Engineering Inspectors and Regulatory Officers
1,896
2263 Inspectors in Public and Environmental Health and Occupational Health and Safety
13,415
7242 Industrial Electricians 9,004
7304 Supervisors, Railway Transport Operations
1,569
7311 Construction Millwrights and Industrial Mechanics
20,993
7314 Railway Carmen/women 2,743
7361 Railway and Yard Locomotive Engineers
5,462
7362 Railway Conductors and Brakemen/women
6,994
7531 Railway Track Maintenance Workers
4,838
Just over 40% of all new workers in the industry will be New Entrants. Virtually all Industrial Instrument Technicians and Mechanics are New Entrants, which means employers will need to invest in on-the-job training to enable newly trained workers to contribute to overall productivity. All of the occupations gain some of their New Supply from other provinces; Railway Conductors and Brakemen/women gain almost a third of their New Supply from other provinces. 1 in 3 new workers in the APGC are from other parts of the labour force, with close to two thirds of New Supply in Saskatchewan coming from this source along with 9 in 10 Managers in Transportation, Facility Operation and Maintenance Managers and Super visors, Railway Transport Operations. Just over 15% of new workers come from other countries; in BC, it is closer to 25%. Across the APGC, close to 1 in 3 Railway Track Maintenance Workers, Non-Destructive Testers and Inspection T echnicians and Civil Engineers will come from other countries.
35% of the workers in the APGC Rail Sector live in BC, 47% in Alberta, 9% in Saskatchewan, and 9% in Manitoba.

18 Asia Pacific Gateway Corridor Transportation Labour Market Outlook for the Asia Pacific Gateway Corridor 2016–2025
Chapter 2 Highlights — Rail Sector
Table 7 APGST Labour Market Metrics for the Rail Sector in the APGC
Metric 2016 2017 2018 2019 2020 2021 2022 2023 2024 2025
Hiring Difficulty Index
easy market
some challenges
Market Tightness
3
Mobility moving in
Supply Lag low medium high medium low
International Reliance
none medium
Loss of Experience
high medium high
APGST Labour Market Metrics for the Rail Sector In the first 5 years of the forecast, the High Investment Scenario will generate 10,510 more Job Openings (36%) than the Low. In the second half of the forecast, the Low Investment Scenario generates 4,415 more Job Openings than the High, for a net effect that has the High Investment Scenario generating 6,095 more Job Openings (10%) than the Low.

19 Asia Pacific Gateway Corridor Transportation Labour Market Outlook for the Asia Pacific Gateway Corridor 2016–2025
Chapter 2 Highlights — Trucking Sector
TRUCKINGSECTOR
By the Numbers
Job Openings to be filled 84,870 48% of APGC total
Replacement Job Openings 68,568 81% of Job Openings
Job Openings created by Expansion
16,309 8% of Job Openings in first 5 years
Workers who will retire and leave the labour force
68,570 28% of today’s workers
New workers – New Entrants to the industry
52,904 62% of the New Supply
New workers – from other countries
12,388 15% of the New Supply
New workers – from other provinces
6,824 8% of the New Supply
New workers – from other parts of the labour force
12,784 15% of the New Supply
Average time left in the industry 17 – 27 years until retirement (between the ages of 60-70)
Table 8 Trucking Sector Occupations and Job Openings
NOC Occupation Title Job Openings
0016 Senior Managers – Construction, Transportation, Production and Utilities
24,060
0731 Managers in Transportation 15,518
1525 Dispatchers 10,291
1526 Transportation Route and Crew Schedulers
1,485
2241 Electrical and Electronics Engineering Technologists and Technicians
11,655
2243 Industrial Instrument Technicians and Mechanics
2,951
2262 Engineering Inspectors and Regulatory Officers
1,896
2263 Inspectors in Public and Environmental Health and Occupational Health and Safety
13,415
7242 Industrial Electricians 9,004
7305 Supervisors, Motor Transport and Other Ground Transit Operators
4,914
7321 Automotive Service Technicians, Truck and Bus Mechanics and Mechanical Repairers
41,598
7511 Transport Truck Drivers 111,712
Truckingfirmsprovideanessentialservicebytransportingfinishedgoodsandrawmaterialsoverland,typicallytoandfrommanufacturingplants,retailfacilities,anddistributioncentres.Itisestimatedthattruckingofgoodsiscost-competitivetorailfordistancesupto800kilometres.
The APGC LMI Project Trucking Sector incudes 12 occupations. For details on individual occupations, please refer to the Occupational Snapshots.

20 Asia Pacific Gateway Corridor Transportation Labour Market Outlook for the Asia Pacific Gateway Corridor 2016–2025
Chapter 2 Highlights — Trucking Sector
The forecast for 2016–2025 shows 2016 as the least challenging year that employers will face. For most of the forecast period, employers will have some challenges in hiring the workers they need in all 12 occupations. This trend is similar across the four provinces, with Saskatchewan showing more ease in the later years and Manitoba showing difficult conditions more often than the others.
Job Openings are more likely to be created by Replacement (81%) than Expansion; however, in the first 5 years, close to 1 in 5 Job Openings are generated by Expansion. Just over 1 in 4 workers will retire and leave the sector, a little higher than in the APGC as a whole. Close to 1 in 3 Managers in Transportation and Supervisors, Motor Transport and Other Ground Transit Operators will have retired and left the labour force by 2025.
Almost 2 in 3 new workers in the industry will be New Entrants, virtually all Industrial Instrument Technicians and Mechanics are New Entrants, which means employers will need to invest in more on-the-job training to enable newly trained workers to contribute to overall productivity. For the APGC as a whole, just under 1 in 10 new workers will come from other provinces; all of the occupations gain some of their New Supply from other provinces. About 15% of new workers in the APGC are from other parts of the labour force, with 9 in 10 Managers in Transportation and Supervisors, Motor Transport and Other Ground Transit Operators. Another 15% of new workers come from other countries, higher in Saskatchewan and Manitoba at close to 1 in 5. Across the APGC, 1 in 3 Automotive Service Technicians, Truck and Bus Mechanics and Mechanical Repairers, Electrical and Electronics Engineering Technologists and Technicians and Inspectors in Public and Environmental Health and Occupational Health and Safety will come from other countries.
35% of the workers in the APGC Trucking Sector live in BC, 44% in Alberta, 10% in Saskatchewan and 11% in Manitoba.
21 Asia Pacific Gateway Corridor Transportation Labour Market Outlook for the Asia Pacific Gateway Corridor 2016–2025
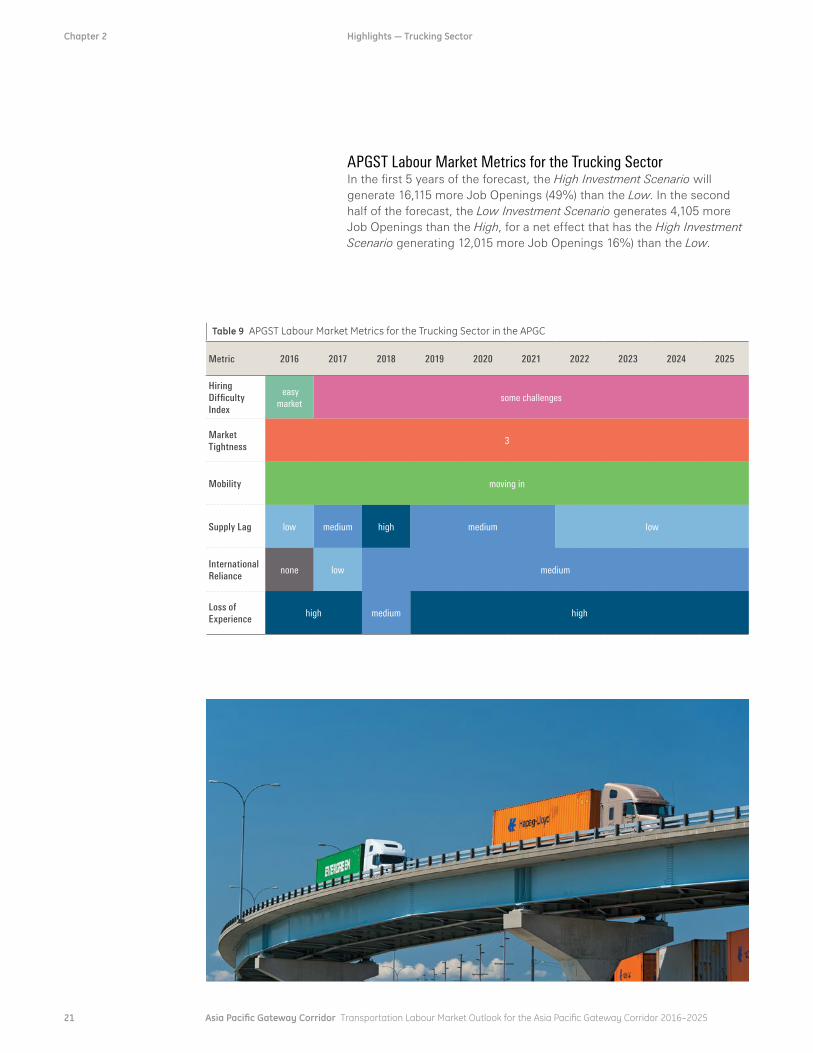
Chapter 2 Highlights — Trucking Sector
Table 9 APGST Labour Market Metrics for the Trucking Sector in the APGC
Metric 2016 2017 2018 2019 2020 2021 2022 2023 2024 2025
Hiring Difficulty Index
easy market
some challenges
Market Tightness
3
Mobility moving in
Supply Lag low medium high medium low
International Reliance
none low medium
Loss of Experience
high medium high
APGST Labour Market Metrics for the Trucking Sector In the first 5 years of the forecast, the High Investment Scenario will generate 16,115 more Job Openings (49%) than the Low. In the second half of the forecast, the Low Investment Scenario generates 4,105 more Job Openings than the High, for a net effect that has the High Investment Scenario generating 12,015 more Job Openings 16%) than the Low.

22 Asia Pacific Gateway Corridor Transportation Labour Market Outlook for the Asia Pacific Gateway Corridor 2016–2025
The APGC is forecast to grow in the 10 years of the forecast as trade activity between North America and Asia expands. This growth will increase the need for an available, well-trained workforce. The forecast shows that employers will face some challenges in hiring the workers they need in the 34 occupations starting in 2017 and throughout the balance of the forecast period. This trend is similar across the four sectors. See the Sector Outlook reports for more information.
Chapter 3 Key Facts 2016–2025
KEYFACTS2016–2025
ThisforecastprovidesimportantinformationaboutsupplyanddemandfortheAPGC,withafocusonfoursectorsinthefourprovincesthatmakeuptheAPGC.
Table 10 Hiring Difficulty Index for All Sectors in the APGC
Sector 2016 2017 2018 2019 2020 2021 2022 2023 2024 2025
Airsome
challengesdifficult
some challenges
Logistics easy
marketsome
challenges
Rail easy
marketsome
challenges
Trucking easy
marketsome
challenges
APGC Total easy
marketsome
challenges
HIRINGDIFFICULTYINDEXThe Hiring Difficulty Index assesses the overall challenges for employers trying to hire in the labour market. It uses five metrics, combining them to provide a single measure that reflects the impacts and interactions between the labour market components. For a complete description of each metric, see Appendix A.

23 Asia Pacific Gateway Corridor Transportation Labour Market Outlook for the Asia Pacific Gateway Corridor 2016–2025
LABOURDEMAND
Chapter 3 Key Facts 2016–2025
Approximately 177,375 Job Openings, from both growth and retirements combined, are expected to be created across the APGC sectors between 2016 and 2025 (see Table 11).
By sector, Job Openings number approximately:JJ 61,020 in AirJJ 59,915 in LogisticsJJ 67,296 in RailJJ 84,870 in Trucking
The number of positions increases by 7.5%, with a total of 40,035 new positions over the forecast period.
By sector, new positions number approximately:JJ 13,250 (7.6%) in AirJJ 13,675 (7.5%) in LogisticsJJ 14,410 (8.1%) in RailJJ 19,330 (7.4%) in Trucking
Labour Demand is created by the business environment, economic circumstances, and decisions affecting employers’ operations. It reflects the number of jobs available to be filled in an occupation.
Figure 2 Job Openings by Sector, Moderate Scenario
25,000
20,000
15,000
10,000
5,000
02016 2017 2018 2019 2020 2021 2022 2023 2024 2025
APGC Total Air Logistics Rail Trucking
Table 11 Demand and Job Openings in the APGC
Sector Average Annual Number
of Jobs
Total Job Openings,
2016–2025
Jobs Created by Expansion,
2016–2020
Jobs Created by Expansion,
2021–2025
Expansion as a % of
Job Openings
Air 181,515 61,020 6,505 5,455 20%
Logistics 190,145 59,915 8,970 5,510 24%
Rail 186,890 67,295 8,335 5,850 21%
Trucking 270,475 84,870 6,930 9,375 19%
APGC Total 557,160 177,375 20,900 17,420 22%
Growth of Positions in the APGC
7.5%

24 Asia Pacific Gateway Corridor Transportation Labour Market Outlook for the Asia Pacific Gateway Corridor 2016–2025
Expansion Demand is defined as the number of Job Openings in an occupation created by economic or business growth.
Expansion In the APGC, Expansion accounts for approximately 22% of Job Openings over the entire forecast period, with Replacement accounting for the remainder. While 2016 shows declines in all sectors except for Logistics, in the first 5 years, 24% of Job Openings are created by Expansion due to the number of large-scale projects forecast for that period. By sector, Expansion Demand varies greatly, with the lowest impact being in Air and Rail (Figure 3).
Chapter 3 Key Facts 2016–2025
Figure 3 Expansion Demand by Sector
3,000
2,000
1,000
0
-1,000
-2,000
-3,000
-4,000
2016 2025
Jobs
Air Rail Trucking APGC TotalLogistics
Table 12 Expansion Demand by Sector
Sector Expansion Rate, 2016–2020 Expansion Rate, 2016–2025
Air 21% 20%
Logistics 29% 24%
Rail 24% 21%
Trucking 17% 19%
APGC Total 23% 22%
Expansion Demand is higher between 2016 and 2020 in every sector except for Trucking, which shows a slightly higher impact in the second half of the forecast, with the highest averages in Logistics and Rail (Table 12). For more information about Job Openings by occupation, see the Occupational Snapshots at lmionline.ca.

25 Asia Pacific Gateway Corridor Transportation Labour Market Outlook for the Asia Pacific Gateway Corridor 2016–2025
Labour Supply is created by the number of workers who have the skills and/or certifications to be qualified to work in each occupation in each year, including those who are newly trained, have moved from other provinces or countries, or have moved from other occupations.
Chapter 3 Key Facts 2016–2025
LABOURSUPPLYLabour Supply in the APGC is expected to grow by about 36,110 workers over the 10 years of the forecast. With the growth in New Supply not keeping pace with Job Openings, the forecast shows a consistent gap between the growth in supply and the growth in Job Openings in all provinces except Manitoba.
By sector, labour supply is expected to increase by approximately:JJ 11,770 in AirJJ 12,415 in LogisticsJJ 13,065 in RailJJ 17,195 in Trucking
The Supply Lag Measure assesses the extent to which New Supply is keeping pace with Job Openings. It allows for an assessment of the extent to which conditions are tightening or loosening in the labour market (Table 13).
Table 13 Supply Lag Measure for All Sectors in the APGC
Sector 2016 2017 2018 2019 2020 2021 2022 2023 2024 2025
Air low medium high medium low
Logistics low medium high medium low
Rail low medium high medium low
Trucking low medium high medium low
APGC Total low medium high medium low
Growth in the labour supply
Average age of workers in the APGC
6.3%43YEARS
Count Too Small Job Openings or New Supply
is less than 6
No New Supply New Supply is 0 or negative
Medium New Supply is 93–97%
of Job Openings
High New Supply is 93% or
less of Job Openings
Low New Supply is 97% or more
of Job Openings

26 Asia Pacific Gateway Corridor Transportation Labour Market Outlook for the Asia Pacific Gateway Corridor 2016–2025
Replacement Demand is defined as the number of Job Openings created by workers who leave each occupation, and the labour market as a whole, due to retirement or death each year.
ReplacementReplacement continues to be the primary driver of Job Openings, although its impact has declined from previous forecasts as more workers remain in the workforce after the age of 65, and the impact of the baby boom generation moving out of the workforce lessens. In the APGC, Replacement will generate 139,055 Job Openings over 10 years (Table 14).
Close to 13,905 experienced workers will leave the workforce across the APGC each year.
By sector, this means an annual loss of approximately:JJ 4,905 in AirJJ 4,545 in LogisticsJJ 5,310 in RailJJ 6,855 in Trucking
Chapter 3 Key Facts 2016–2025
Table 14 Impact of Replacement on Job Openings
Sector Replacement Job Openings, 2016–2020
Replacement Job Openings, 2021–2025
Replacement Job Openings %
Air 23,810 25,250 80%
Logistics 21,795 23,645 76%
Rail 26,030 27,065 79%
Trucking 33,835 34,730 81%
APGC Total 68,050 71,005 78%
Table 15 Loss of Experience Measure for All Sectors in the APGC
Sector 2016 2017 2018 2019 2020 2021 2022 2023 2024 2025
Air high medium high
Logistics high medium high
Rail high medium high
Trucking high medium high
APGC Total high medium high
Loss of Experience assesses the rate at which experienced workers are retiring in relation to the number of Job Openings. The rate of loss is High for most of the forecast in all four sectors (Table 15).
Low 35% of Job Openings
represented by Replacement
Medium 35–70% of Job Openings
represented by Replacement
High More than 70% of Job
Openings represented
by Replacement

27 Asia Pacific Gateway Corridor Transportation Labour Market Outlook for the Asia Pacific Gateway Corridor 2016–2025
Base Supply is calculated as the total supply less the average number of unemployed workers, less Replacement from each year of the forecast. Base Supply calculations demonstrate the changes in each year of the forecast period to the cohort of workers as compared with the first year of the forecast.
Chapter 3 Key Facts 2016–2025
Base Supply In the APGC, Base Supply is expected to decline by 24% over the fore - cast period. There is some variance between sectors (Table 16), but with this decline, employers in all sectors will need to explore alternative recruiting methods to replace their most experienced workers.
Table 16 Changes to Base Labour Supply for the APGC, All Sectors, 2016–2025
Sector Base Supply 2016
Decline 2016–2020
% Decline 2016–2025
%
Air 180,535 -23,810 -13% -49,060 -27%
Logistics 189,375 -21,795 -12% -45,440 -24%
Rail 185,430 -26,030 -14% -53,095 -29%
Trucking 271,960 -33,835 -12% -68,565 -25%
APGC Total 557,510 -68,050 -12% -139,055 -25%
Base Supply is a measure of the decline in the number of workers who are active in an occupation at the beginning of the forecast and sub- sequently leave due to Replacement over the forecast period.

28 Asia Pacific Gateway Corridor Transportation Labour Market Outlook for the Asia Pacific Gateway Corridor 2016–2025
New Supply is defined as the number of workers who are new to the occupations from Immigration, other provinces or regions, or other occupations, or who are New Entrants—newly trained and new to the workforce.
New Supply The forecast shows New Supply largely keeping pace with Job Openings for the entire forecast period. 3 of the 4 sectors will have greater challenges finding workers in the first 5 years, especially the Air and Logistics sectors. In the Trucking Sector, the growth in supply keeps pace with Job Openings throughout the forecast period.
The composition of New Supply will shift over the forecast, with increasing reliance on Immigration and New Entrants (see Figure 4).
Chapter 3 Key Facts 2016–2025
Table 17 Labour Supply Characteristics
Sector Average Number of Qualified Workers
New Entrants
International Mobility
Mobility Labour Force Mobility
Air 191,225 18,650 9,990 2,800 29,110
Logistics 201,310 16,770 5,960 7,030 29,200
Rail 197,330 22,215 11,355 5,475 27,585
Trucking 289,160 12,785 12,390 6,825 52,905
APGC Total 593,325 36,100 23,880 17,400 98,840
Figure 4 Components of New Supply, APGC Total, 2016–2025
Labour Force Mobility20%
Mobility10%
International Mobility 14%
New Entrants56%

29 Asia Pacific Gateway Corridor Transportation Labour Market Outlook for the Asia Pacific Gateway Corridor 2016–2025
Chapter 3 Key Facts 2016–2025
New Entrants For the New Supply of workers across all sectors in the APGC, 56% are New Entrants—newly trained and new to the workforce. With many workers being new to the workforce, employers in some sectors will benefit from good training programs to help integrate these New Entrants.
By sector, New Entrants make up:JJ 48% in AirJJ 50% in LogisticsJJ 41% in RailJJ 62% in Trucking
The number of New Entrants takes into consideration previous participation in the labour force: If a new graduate has never worked before, they would be counted as 1.0 New Entrant, and if a new graduate worked 25% of the year prior to graduating, they would be counted as 0.75 of a New Entrant. The number of New Entrants may not match administrative data for graduates, as graduates do not always end up in the labour force.
New Entrants refer to the number of graduates from school or training programs who are filling Job Openings.

30 Asia Pacific Gateway Corridor Transportation Labour Market Outlook for the Asia Pacific Gateway Corridor 2016–2025
Immigration refers to workers coming to Canada from other countries. It includes foreign workers as well as immigrants to Canada.
ImmigrationImmigration is expected to add 14% to the total New Supply of APGC workers.
With some workers expected to come from other countries in all of the sectors, employers may need to explore different methods of recruitment when adding to their workforce.
By sector, the amount of workers coming from other countries is:JJ 16% in AirJJ 10% in LogisticsJJ 17% in RailJJ 15% in Trucking
The International Reliance Measure assesses the extent to which the New Supply of workers is dependent on Immigration. Employers do not have control over Immigration, so this measure provides insight into how New Supply expectations could be affected by changes to Immigration policy (Table 18).
Chapter 3 Key Facts 2016–2025
Table 18 International Reliance Measure for All Sectors in the APGC
Sector 2016 2017 2018 2019 2020 2021 2022 2023 2024 2025
Air high medium low medium
Logistics none medium
Rail none medium
Trucking none low medium
APGC Total none medium
No New Supply New Supply is 0 or negative
None International workers are not
part of New Supply
Extreme 50% or more of New Supply
represented by Immigration
Low Less than 10% of New Supply
represented by Immigration
Medium 10% to 25% of New Supply
represented by Immigration
High 25% to 50% of New Supply
represented by Immigration
31 Asia Pacific Gateway Corridor Transportation Labour Market Outlook for the Asia Pacific Gateway Corridor 2016–2025
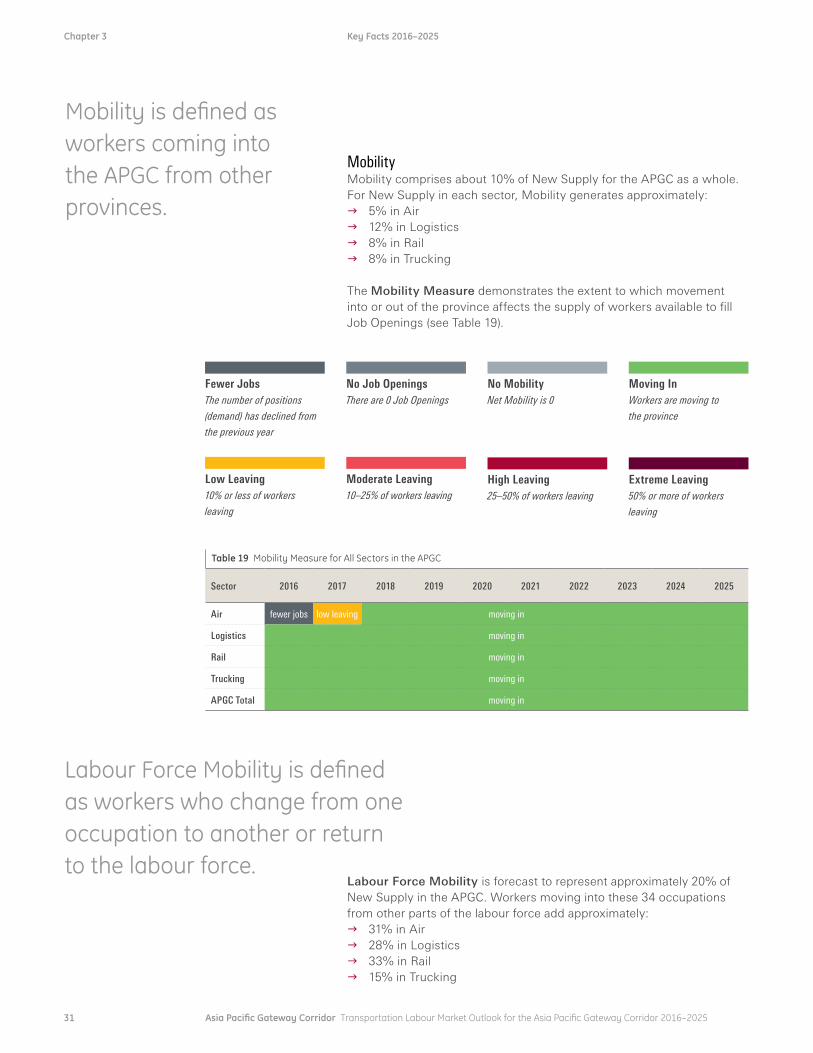
Chapter 3 Key Facts 2016–2025
MobilityMobility comprises about 10% of New Supply for the APGC as a whole. For New Supply in each sector, Mobility generates approximately:JJ 5% in AirJJ 12% in LogisticsJJ 8% in RailJJ 8% in Trucking
The Mobility Measure demonstrates the extent to which movement into or out of the province affects the supply of workers available to fill Job Openings (see Table 19).
Mobility is defined as workers coming into the APGC from other provinces.
Labour Force Mobility is defined as workers who change from one occupation to another or return to the labour force.
Table 19 Mobility Measure for All Sectors in the APGC
Sector 2016 2017 2018 2019 2020 2021 2022 2023 2024 2025
Air fewer jobs low leaving moving in
Logistics moving in
Rail moving in
Trucking moving in
APGC Total moving in
Labour Force Mobility is forecast to represent approximately 20% of New Supply in the APGC. Workers moving into these 34 occupations from other parts of the labour force add approximately:JJ 31% in AirJJ 28% in LogisticsJJ 33% in RailJJ 15% in Trucking
Fewer Jobs The number of positions
(demand) has declined from
the previous year
No Job Openings There are 0 Job Openings
No Mobility Net Mobility is 0
Moving In Workers are moving to
the province
Low Leaving 10% or less of workers
leaving
Moderate Leaving 10–25% of workers leaving
Extreme Leaving 50% or more of workers
leaving
High Leaving 25–50% of workers leaving
32 Asia Pacific Gateway Corridor Transportation Labour Market Outlook for the Asia Pacific Gateway Corridor 2016–2025
The scenarios were developed in January 2016, and reflect the infor-mation available at that time. The changes in oil and commodity prices between 2015 and 2016 made a substantial difference to the overall economic outlook for the APGC, as did declining growth expectations for the Chinese and other Asian economies. Meanwhile, the falling Canadian dollar will be a stimulus for many areas of the Canadian economy, especially trade and export. Along with the federal government’s commitments to invest in infrastructure, this should provide growth in areas other than natural resources. Both the Moderate and High Invest-ment Scenarios include less investment. However, the Low scenario includes more investment, as several projects, including Site C, have begun development. See Appendix B for the list of factors and projects influencing the scenarios.
Chapter 4 Impact Of The Economic Scenarios
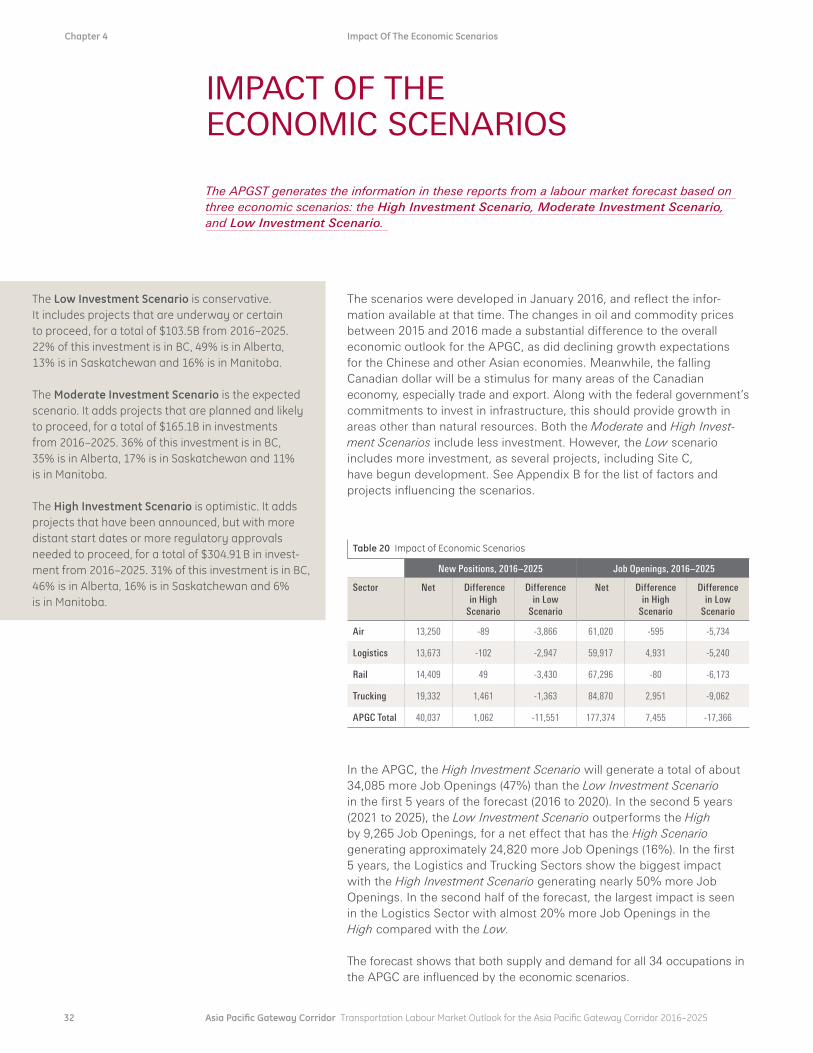
IMPACTOFTHEECONOMICSCENARIOS
The Low Investment Scenario is conservative. It includes projects that are underway or certain to proceed, for a total of $103.5B from 2016–2025. 22% of this investment is in BC, 49% is in Alberta, 13% is in Saskatchewan and 16% is in Manitoba.
The Moderate Investment Scenario is the expected scenario. It adds projects that are planned and likely to proceed, for a total of $165.1B in investments from 2016–2025. 36% of this investment is in BC, 35% is in Alberta, 17% is in Saskatchewan and 11% is in Manitoba.
The High Investment Scenario is optimistic. It adds projects that have been announced, but with more distant start dates or more regulatory approvals needed to proceed, for a total of $304.91 B in invest-ment from 2016–2025. 31% of this investment is in BC, 46% is in Alberta, 16% is in Saskatchewan and 6% is in Manitoba.
TheAPGSTgeneratestheinformationinthesereportsfromalabourmarketforecastbasedonthreeeconomicscenarios:theHigh Investment Scenario,Moderate Investment Scenario,andLow Investment Scenario.
Table 20 Impact of Economic Scenarios
New Positions, 2016–2025 Job Openings, 2016–2025
Sector Net Difference in High
Scenario
Difference in Low
Scenario
Net Difference in High
Scenario
Difference in Low
Scenario
Air 13,250 -89 -3,866 61,020 -595 -5,734
Logistics 13,673 -102 -2,947 59,917 4,931 -5,240
Rail 14,409 49 -3,430 67,296 -80 -6,173
Trucking 19,332 1,461 -1,363 84,870 2,951 -9,062
APGC Total 40,037 1,062 -11,551 177,374 7,455 -17,366
In the APGC, the High Investment Scenario will generate a total of about 34,085 more Job Openings (47%) than the Low Investment Scenario in the first 5 years of the forecast (2016 to 2020). In the second 5 years (2021 to 2025), the Low Investment Scenario outperforms the High by 9,265 Job Openings, for a net effect that has the High Scenario generating approximately 24,820 more Job Openings (16%). In the first 5 years, the Logistics and Trucking Sectors show the biggest impact with the High Investment Scenario generating nearly 50% more Job Openings. In the second half of the forecast, the largest impact is seen in the Logistics Sector with almost 20% more Job Openings in the High compared with the Low.
The forecast shows that both supply and demand for all 34 occupations in the APGC are influenced by the economic scenarios.
33 Asia Pacific Gateway Corridor Transportation Labour Market Outlook for the Asia Pacific Gateway Corridor 2016–2025
Figure 6 Labour Force Supply for BC, All Occupations
630,000
620,000
610,000
600,000
590,000
580,000
570,000
560,000
2016 2017 2018 2019 2020 2021 2022 2023 2024 2025
Labo
ur S
uppl
y
High Moderate Low
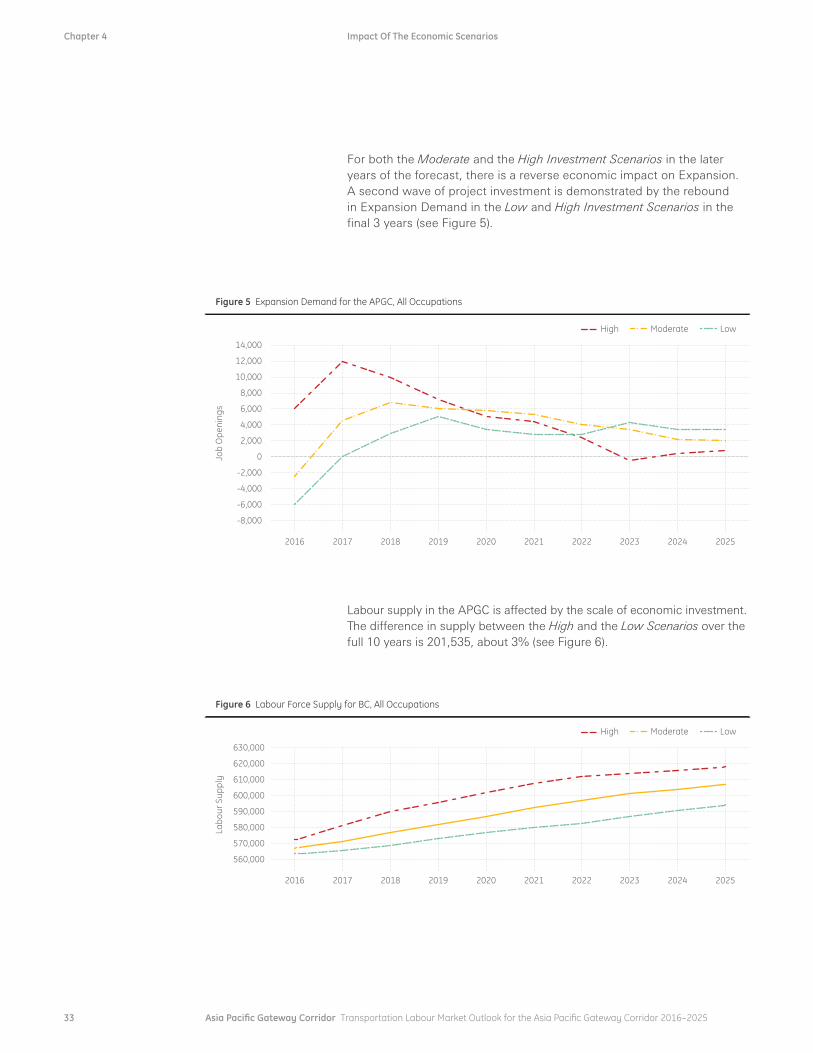
For both the Moderate and the High Investment Scenarios in the later years of the forecast, there is a reverse economic impact on Expansion. A second wave of project investment is demonstrated by the rebound in Expansion Demand in the Low and High Investment Scenarios in the final 3 years (see Figure 5).
Chapter 4 Impact Of The Economic Scenarios
Figure 5 Expansion Demand for the APGC, All Occupations
14,000
12,000
10,000
8,000
6,000
4,000
2,000
0
-2,000
-4,000
-6,000
-8,000
2016 2017 2018 2019 2020 2021 2022 2023 2024 2025
Job
Ope
ning
s
High Moderate Low
Labour supply in the APGC is affected by the scale of economic investment. The difference in supply between the High and the Low Scenarios over the full 10 years is 201,535, about 3% (see Figure 6).

34 Asia Pacific Gateway Corridor Transportation Labour Market Outlook for the Asia Pacific Gateway Corridor 2016–2025
THEAPGCEmployers will face some challenges from 2017 onward, mostly driven by high rates of retirement (Replacement) over the whole forecast period, and in the middle years with supply growth not keeping pace with Job Openings. The loss of workers to other provinces in both Saskatchewan and Manitoba also contributes to the challenges that employers will face in hiring workers in the 34 occupations in the APGC between 2016 and 2025.
New Supply, which keeps pace with Job Openings, except in the middle years of the forecast, is driven mostly by New Entrants and by workers moving into these 34 occupations from other occupations or other parts of the labour force. Over the forecast period, reliance on New Entrants increases as does reliance on international workers, while workers from other provinces and other occupations become a smaller part of the New Supply.
The Moderate Investment Scenario shows growth in the APGC over the first five years, with slow but steady declines in the second half of the forecast. This could be moderated or reversed if there is more investment made in large-scale projects in the APGC in the second half of the forecast. In contrast, the Low Investment Scenario shows slower but steady growth throughout the 10 years of the forecast, while the High Investment Scenario shows sharp growth in the first half and contracts somewhat in the last years of the forecast.
Employers can reduce impacts of the forecasted labour market conditions by building programs and strategies to ensure the attraction of an adequate labour supply and retention of the mature workforce to slow the rate of retirement.
Chapter 5 Conclusions
CONCLUSIONS

35 Asia Pacific Gateway Corridor Transportation Labour Market Outlook for the Asia Pacific Gateway Corridor 2016–2025
Chapter 5 Conclusions
AIRThe 15 occupations in the APGC Air Sector have slightly more difficult conditions than the APGC as a whole, with a loss of workers to other occupations in the first two years and greater reliance on international workers to meet the need for new workers. These occupations rely more on workers from provinces and they also show the smallest impact of the three scenarios, with less than a 10% difference in Job Openings between the High and Low Investment Scenarios.
LOGISTICSThe 12 occupations in the APGC Logistics Sector have slightly less difficult conditions than the APGC as a whole, with a lower rate of retirement and less reliance on international workers to meet the need for new workers. These occupations rely less on New Entrants and more on workers from other occupations and they also show the largest impact of the three scenarios, with a 19% difference in Job Openings between the High and Low Investment Scenarios.
RAILThe 19 occupations in the APGC Rail Sector have about the same conditions as the APGC as a whole. These occupations have a higher rate of retirement and reliance on international workers to meet the need for new workers. These occupations rely much less on New Entrants and more on workers from other occupations and they also show a lower impact of the three scenarios than the APGC as a whole with a 10% difference in Job Openings between the High and Low Investment Scenarios.
TRUCKINGThe 12 occupations in the APGC Trucking Sector have about the same conditions as the APGC as a whole. These occupations have a higher rate of retirement and lower reliance on international workers to meet the need for new workers. They rely much more on New Entrants and much less on workers from other occupations. The 12 Trucking Sector occupations show about the same impact of the three scenarios as the APGC as a whole with a 16% difference in Job Openings between the High and Low Investment Scenarios. This sector has the largest impact in the first five years with 49% more Job Openings in the High Investment Scenario.


APPENDIX
AppendixA DescriptionofMetricsandGlossaryofTerms 38
AppendixB EconomicIndicatorsandMajorProjectsincluded intheEconomicScenarios 43
AppendixC DataTablesbySectorandEconomicScenario: TheAsiaPacificGatewayCorridor 52
AppendixD TheAsiaPacificGatewayCorridorOccupations 67

38 Asia Pacific Gateway Corridor Transportation Labour Market Outlook for the Asia Pacific Gateway Corridor 2016–2025
Appendix A Description of Metrics and Glossary of Terms
APPENDIXA DESCRIPTIONOFMETRICSANDGLOSSARYOFTERMS
Assesses the overall challenges for employers who are trying to hire in the labour market. It aggregates five metrics and combines them to provide a single measure that reflects the different interactions between the labour market components. For example, the metrics can show the ratio of workers to Job Openings (the Market Tightness) as “Tight”, with International Reliance and Supply Lag Low and Mobility positive (i.e., workers are moving in), while the Loss of Experience is Moderate and the reliance on New Entrants is Extreme. This implies quite different labour market conditions than a situation where the Market Tightness is “Tightening” (i.e., less difficult) but International Reliance is High, supply is growing much more slowly than Job Openings, and a high portion of current workers are leaving to work in other provinces.
Oversupplied Market 0–8
No New Supply New Supply is 0 or negative
Easy Market 9–15
None International workers are not part of New Supply
Low Less than 10% of New Supply represented by Immigration
Difficult 23–29
Medium 10% to 25% of New Supply represented by Immigration
Extreme 50% or more of New Supply represented by Immigration
Extremely Difficult 30+
High 25% to 50% of New Supply represented by Immigration
Hiring Difficulty Index
International Reliance Measure
Assesses the extent to which the New Supply of workers is dependent on workers from other countries. Given that the levers that control Immigration are not in the control of employers, this measure provides insight into the potential for New Supply expectations to be influenced by changes in Immigration policy.
Some Challenges 16–22

39 Asia Pacific Gateway Corridor Transportation Labour Market Outlook for the Asia Pacific Gateway Corridor 2016–2025
Appendix A Description of Metrics and Glossary of Terms
1 2
4
3
Fewer Jobs The number of positions (demand) has declined from the previous year
Low 35% of Job Openings represented by Replacement
Excess Supply More than 60% higher than normal unemployment
No Job Openings There are 0 Job Openings
No Mobility Net Mobility is 0
Moving In Workers are moving to the province
Medium 35–70% of Job Openings represented by Replacement
Balanced Supply and demand Between 30–60% higher than normal unemployment
Low Leaving 10% or less of workers leaving
Moderate Leaving 10–25% of workers leaving
Extreme Leaving 50% or more of workers leaving
High Leaving 25–50% of workers leaving
High More than 70% of Job Openings represented by Replacement
Excess Demand, Limited Supply Below normal unemployment
Nearing a Tight Labour Market Between 0–30% higher than normal unemployment
Mobility Measure
Loss of Experience
Market Tightness
Demonstrates the extent to which movement into or out of the province affects the supply of workers available to fill Job Openings.
Assesses the rate at which experienced workers are retiring in relation to the number of Job Openings.
Assesses the “tightness” of the labour market; i.e., the degree of difficulty an employer may experience in trying to hire into the occupation.

40 Asia Pacific Gateway Corridor Transportation Labour Market Outlook for the Asia Pacific Gateway Corridor 2016–2025
Appendix A Description of Metrics and Glossary of Terms
A measure of the decline in the number of workers who are active in an occupation at the beginning of the forecast and subsequently leave due to Replacement over the forecast period. Base Supply is calculated as the total supply less the average number of unemployed workers, less Replacement from each year of the forecast. Base Supply calculations demonstrate the changes in each year of the forecast period to the cohort of workers as compared with the first year of the forecast.
Low Investment Scenario Conservative scenario. It includes projects that are underway or certain to proceed, for a total of $103.5B from 2016 – 2025. 22% of this investment is in BC, 49% is in Alberta, 13% is in Saskatchewan and 16% is in Manitoba.
Moderate Investment Scenario Expected scenario. It adds projects that are planned and likely to proceed, for a total of $165.1B in invest-ments from 2016 – 2025. 36% of this investment is in BC, 35% is in Alberta, 17% is in Saskatchewan and 11% is in Manitoba.
High Investment Scenario Optimistic scenario. It adds projects that have been announced, but with more distant start dates or more regulatory approvals needed to proceed, for a total of $304.91B in investment from 2016 – 2025. 31% of this investment is in BC, 46% is in Alberta, 16% is in Saskatchewan and 6% is in Manitoba.
Base Supply
Economic Scenarios
Assesses the extent to which New Supply is keeping pace with Job Openings. It allows for an assessment of the extent to which conditions are tightening or loosening in the labour market.
Count Too Small Job Openings or New Supply is less than 6
No New Supply New Supply is 0 or negative
Medium New Supply is 93–97% of Job Openings
High New Supply is 93% or less of Job Openings
Supply Lag Measure
Low New Supply is 97% or more of Job Openings

41 Asia Pacific Gateway Corridor Transportation Labour Market Outlook for the Asia Pacific Gateway Corridor 2016–2025
Appendix A Description of Metrics and Glossary of Terms
Expansion is defined here as the number of job openings in an occupation created by economic or business growth.
International Mobility refers to the NET number of workers that coming to Canada from other countries. It includes temporary foreign workers as well as immigrants to Canada. When more workers leave for other countries than come to Canada this can be a negative number.
Job openings is defined here as the need for new workers in an occupation created by expansion and/or replacement demand.
Labour Demand is defined here as the number of jobs available for workers who have the skills and/or required certifications to be considered qualified to work in each occupation in each year.
Labour Force Mobility refers to workers who are in the workforce and change from one occupation to another. An example of this is a worker who was a Heavy Duty Equipment operator and changes employment to become a Truck Driver, or who returns to the workforce after a short period away, such as after a disability leave.
The number of workers who have the skills and/or certifications to be qualified to work in each occupation each year, including those who are newly trained, have moved from other provinces or countries, or have moved from other occupations.
Mobility refers to the net number of workers coming into the APGC from other provinces. Net means the difference between those who leave the APGC to work in other provinces and those who come to the APGC from other provinces.
New Entrants are generally between the ages of 15 and 30. The number of new entrants is not the same as the number of graduates from school/training such as that measured by educational institution administrative data. New entrants refer to the number of graduates from school/training that fill the job openings. This number would not likely be the same as the administrative data for graduates since graduates do not always end up in the labour force. The number of New Entrants also considers previous participation in the labour force—if a new graduate has never worked before graduation they would be counted as 1.0 New Entrant. If a new graduate has worked 25% time before graduation, they would be counted as .075% of a New Entrant.
Expansion or Expansion Demand
International Mobility
Job Openings
Labour Demand
Labour Force Mobility
Labour Supply
Mobility
New Entrants

42 Asia Pacific Gateway Corridor Transportation Labour Market Outlook for the Asia Pacific Gateway Corridor 2016–2025
Appendix A Description of Metrics and Glossary of Terms
New Supply or Net New Workers is the number of workers who are new to the occupations from four sources: immigration, other provinces or regions, other occupations, or those who are newly trained and new to the workforce. This creates growth in labour supply.
Replacement is defined here as the number of job openings in an occupation created by attrition—that is, the number of workers who leave each occupation, and the labour market as a whole, due to retirement or death each year.
Labour Supply is defined here as the number of workers who have the skills and/or required certifications to be considered qualified to work in each occupation in each year.
New Supply or Net New Workers
Replacement or Replacement Demand
Supply

43 Asia Pacific Gateway Corridor Transportation Labour Market Outlook for the Asia Pacific Gateway Corridor 2016–2025
Economic Indicators and Major Projects included in the Economic ScenariosAppendix B
APPENDIXB ECONOMICINDICATORSANDMAJORPROJECTSINCLUDEDINTHEECONOMICSCENARIOS
The APGST LMI program uses Three Economic Scenarios:
Low InvestmentJJ Most ConservativeJJ Intended to be a
floor optionJJ Most project certaintyJJ Closest to Provincial
forecasts
Moderate InvestmentJJ Considered Most likelyJJ Intended to be the
most realistic optionJJ Project certainly decreasedJJ Closest to major eco-
nomic indicator forecasts
High InvestmentJJ Considered optimisticJJ Intended to be a ceiling,
but possible optionJJ Project certainty is lowestJJ Reflects a large amount of
economic stimulation
Economic Indicators by Scenario
Scenario Moderate1,2 Low High
Region Indicator 2016 2017–21 2021+ 2016 2017–21 2021+ 2016 2017–21 2021+
British ColumbiaGDP 2.4 2.2 2.1 2.2 1.3 1.6 5.1 3.4 1.8
Unemployment Rate 5.8 5.7 5.2 6.0 6.6 6.4 5.1 4.4 4.8
AlbertaGDP -1.3 1.2 1.7 -1.6 0.8 1.3 -0.4 1.7 2.0
Unemployment Rate 7.3 6.4 5.2 7.6 6.9 5.9 6.8 5.7 4.8
SaskatchewanGDP 1.0 1.1 0.7 0.0 0.7 0.4 2.0 2.3 1.0
Unemployment Rate 5.4 5.2 5.2 5.8 5.9 5.6 5.0 4.3 5.0
ManitobaGDP 2.6 1.7 1.8 2.2 1.4 1.7 2.9 2.0 2.0
Unemployment Rate 5.1 5.2 5.1 5.3 5.6 5.6 5.0 4.8 4.6
Country3 Indicator 2016 2017–21 2021+ 2016 2017–21 2021+ 2016 2017–21 2021+
ChinaGDP 6.2 5.9 6.0 5.0 4.9 5.0 6.7 6.8 7.0
Unemployment Rate 4.1 4.1 4.1 4.1 4.2 4.2 4.1 4.0 4.0
IndiaGDP 7.5 7.6 7.8 7.5 5.9 6.5 7.5 9.4 9.6
Unemployment Rate – – – – – – – – –
JapanGDP 1.0 0.7 0.7 1.0 0.6 0.5 1.0 1.1 1.0
Unemployment Rate 3.7 3.8 3.7 3.7 3.8 3.8 3.7 3.7 3.7
KoreaGDP 3.3 3.6 3.7 3.3 2.8 2.9 3.3 5.4 5.5
Unemployment Rate 3.6 3.4 3.3 3.6 3.4 3.4 3.6 3.3 3.2
United StatesGDP 2.6 2.5 2.2 2.4 2.0 1.7 2.8 2.9 2.7
Unemployment Rate 5.5 5.0 4.8 5.5 5.1 4.9 5.5 4.9 4.8
1 Canadian Data Source: APGC Forecast Model
2 International Data Source: World Bank
3 The Country data is generated as high, low and moderate, which may not align with the impact of expected commodity prices, they are included to assess the impact of economic differences in key trading partners.
Commodity Price Forecasts by Scenario
Scenario Moderate Low High
Commodity 2016 2017–21 2021+ 2016 2017–21 2021+ 2016 2017–21 2021+
Coal, Australia $/mt $63 $63 $63 $63 $50 $51 $63 $64 $65
WTI Oil (US$) $/bbl $33 $47 $72 $32 $46 $66 $34 $49 $77
Natural gas LNG, Japan $/mmbtu $10 $11 $12 $10 $8 $8 $10 $14 $15
Henry Hub Natural Gas (US$) $/mmbtu $2.6 $3.7 $5.2 $2.6 $3.6 $5 $2.7 $3.8 $5.6
Wheat, US, HRW $/mt $265 $253 $233 $265 $201 $197 $265 $390 $383
Timber Index, 2010=100 $96 $97 $101 $96 $84 $85 $96 $115 $120
Copper $/mt $6,152 $6,175 $6,190 $6,152 $5,800 $5,900 $6,152 $6,500 $7,000
Nickel $/mt $15,144 $14,943 $14,656 $15,144 $11,623 $11,569 $15,144 $16,000 $17,500
Gold $/toz $1,174 $1,092 $963 $1,174 $879 $855 $1,174 $1,307 $1,459
44 Asia Pacific Gateway Corridor Transportation Labour Market Outlook for the Asia Pacific Gateway Corridor 2016–2025
Appendix B Economic Indicators and Major Projects included in the Economic Scenarios
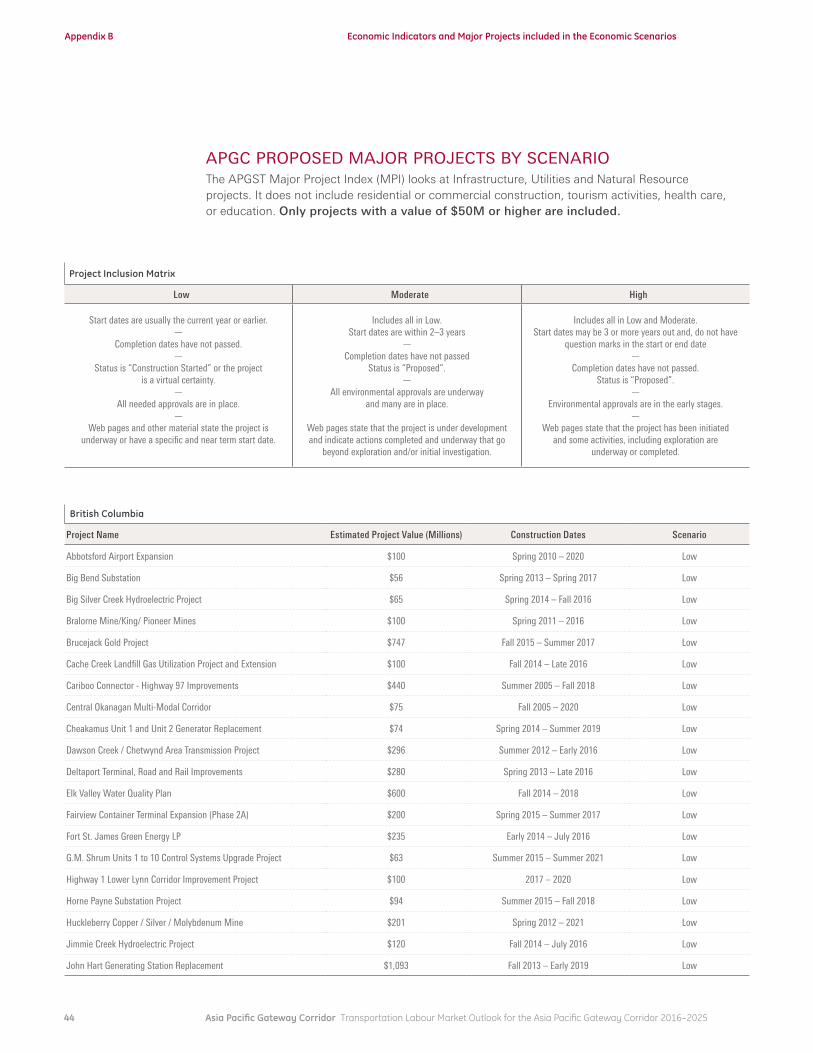
Project Inclusion Matrix
Low Moderate High
Start dates are usually the current year or earlier.—
Completion dates have not passed. —
Status is “Construction Started” or the project is a virtual certainty.
—All needed approvals are in place.
—Web pages and other material state the project is
underway or have a specific and near term start date.
Includes all in Low.Start dates are within 2–3 years
—Completion dates have not passed
Status is “Proposed”.—
All environmental approvals are underway and many are in place.
Web pages state that the project is under development and indicate actions completed and underway that go
beyond exploration and/or initial investigation.
Includes all in Low and Moderate.Start dates may be 3 or more years out and, do not have
question marks in the start or end date—
Completion dates have not passed.Status is “Proposed”.
—Environmental approvals are in the early stages.
—Web pages state that the project has been initiated
and some activities, including exploration are underway or completed.
British Columbia
Project Name Estimated Project Value (Millions) Construction Dates Scenario
Abbotsford Airport Expansion $100 Spring 2010 – 2020 Low
Big Bend Substation $56 Spring 2013 – Spring 2017 Low
Big Silver Creek Hydroelectric Project $65 Spring 2014 – Fall 2016 Low
Bralorne Mine/King/ Pioneer Mines $100 Spring 2011 – 2016 Low
Brucejack Gold Project $747 Fall 2015 – Summer 2017 Low
Cache Creek Landfill Gas Utilization Project and Extension $100 Fall 2014 – Late 2016 Low
Cariboo Connector - Highway 97 Improvements $440 Summer 2005 – Fall 2018 Low
Central Okanagan Multi-Modal Corridor $75 Fall 2005 – 2020 Low
Cheakamus Unit 1 and Unit 2 Generator Replacement $74 Spring 2014 – Summer 2019 Low
Dawson Creek / Chetwynd Area Transmission Project $296 Summer 2012 – Early 2016 Low
Deltaport Terminal, Road and Rail Improvements $280 Spring 2013 – Late 2016 Low
Elk Valley Water Quality Plan $600 Fall 2014 – 2018 Low
Fairview Container Terminal Expansion (Phase 2A) $200 Spring 2015 – Summer 2017 Low
Fort St. James Green Energy LP $235 Early 2014 – July 2016 Low
G.M. Shrum Units 1 to 10 Control Systems Upgrade Project $63 Summer 2015 – Summer 2021 Low
Highway 1 Lower Lynn Corridor Improvement Project $100 2017 – 2020 Low
Horne Payne Substation Project $94 Summer 2015 – Fall 2018 Low
Huckleberry Copper / Silver / Molybdenum Mine $201 Spring 2012 – 2021 Low
Jimmie Creek Hydroelectric Project $120 Fall 2014 – July 2016 Low
John Hart Generating Station Replacement $1,093 Fall 2013 – Early 2019 Low
APGCPROPOSEDMAJORPROJECTSBYSCENARIOThe APGST Major Project Index (MPI) looks at Infrastructure, Utilities and Natural Resource projects. It does not include residential or commercial construction, tourism activities, health care, or education. Only projects with a value of $50M or higher are included.

45 Asia Pacific Gateway Corridor Transportation Labour Market Outlook for the Asia Pacific Gateway Corridor 2016–2025
Appendix B Economic Indicators and Major Projects included in the Economic Scenarios
Project Name Estimated Project Value (Millions) Construction Dates Scenario
Johnson Street Bridge Replacement $94 May 2013 – Spring 2017 Low
Kelowna International Airport Expansion $150 Feb 2008 – 2025 Low
McKenzie Interchante $85 2017 – 2018 Low
Meikle Wind Energy Project $400 Spring 2015 – Late 2016 Low
Merritt Green Energy Project $235 Late 2013 – Oct 2016 Low
North Creek Hydroelectric Project $71 May 2014 – May 2016 Low
Port of Stewart Expansion - Phase 3 $70 Spring 2015 – 2016 Low
Roberts Bank Container Expansion Program Terminal 2 and Deltaport 3rd Berth
$1,150 Feb 2007 – 2023 Low
Ruskin Dam Safety and Powerhouse Upgrade $748 Early 2011 – Summer 2017 Low
Site C Clean Energy Project $8,335 Summer 2015 – Fall 2024 Low
Skytrain - Evergreen Line $1,430 Early 2012 – Fall 2016 Low
Skytrain Expansion - Expo Line $3,100 Fall 2008 – 2020 Low
Surrey Organics Biofuel Facility $68 Spring 2015 – Early 2017 Low
Tilbury LNG Facility Expansion $400 Oct 2014 – Summer 2016 Low
Trans Canada Hwy Improvements - Monte Creek to Pritchard $60 Oct 2011 – Spring 2016 Low
Trans Canada Hwy Improvements - Pritchard to Hoffman's Bluff $62 Spring 2013 – Fall 2016 Low
Tretheway Creek Waterpower Project $60 Spring 2014 – Fall 2016 Low
Upper Lillooet River Hydroelectric Project $420 Spring 2014 – June 2016 Low
Vancouver International Airport Expansion $1,775 April 2000 – 2027 Low
216 Street Interchange/ Highway 1 Widening $59 2016 – Spring 2018 Moderate
Bremner/Trio Hydro Project $90 Summer 2015 – 2016 Moderate
Centerm Expansion Project $250 Late 2016 – 2020 Moderate
Core Area Wastewater Management Project - Seaterra Program $788 2020 Moderate
George Massey Tunnel Replacement Project $2,400 2017 – Dec 2022 Moderate
Highway 97 Improvements - Highway 33 to Edwards Road $60 2016 – 2018 Moderate
Horseshoe Bay Terminal Upgrades $200 2020 – 2022 Moderate
Lions Gate Sewage Treatment Plant $400 2020 Moderate
LNG Facility $25,000 2017 – 2022 Moderate
LNG Pipeline $4,800 2017 – 2020 Moderate
Metro Vancouver Waste-to-Energy Incineration Facility $450 Fall 2015 – 2018 Moderate
Nanaimo Sewage Plant Upgrades $86 Summer 2015 – 2016 Moderate
Narrows Inlet Hydro Project $210 Sep 2015 – Nov 2017 Moderate
Pattullo Bridge Replacement $1,000 2017 – 2025 Moderate
Skytrain - UBC Line $2,800 2017 – 2020 Moderate
Terminal A Extension Project $250 2016 – 2018 Moderate
Terrace Kitimat Line Replacement $115 2017 – 2018 Moderate
Tumbler Ridge Wind Energy Project $125 2017 – 2018 Moderate
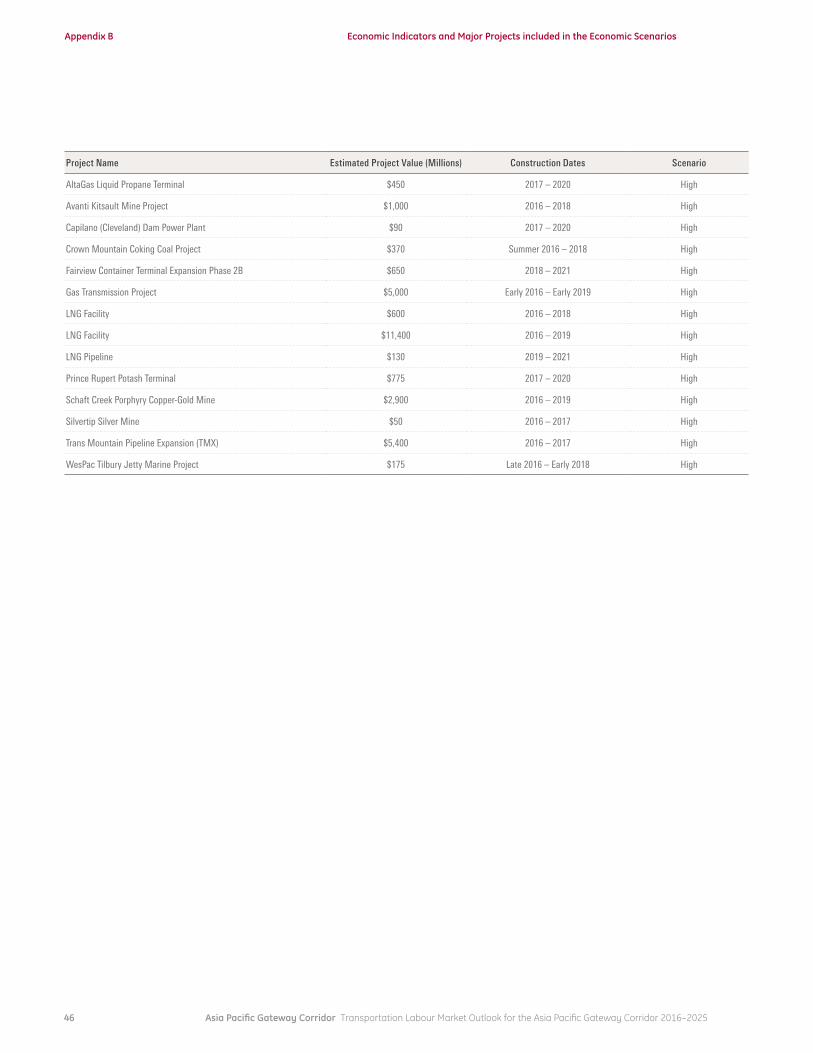
46 Asia Pacific Gateway Corridor Transportation Labour Market Outlook for the Asia Pacific Gateway Corridor 2016–2025
Appendix B Economic Indicators and Major Projects included in the Economic Scenarios
Project Name Estimated Project Value (Millions) Construction Dates Scenario
AltaGas Liquid Propane Terminal $450 2017 – 2020 High
Avanti Kitsault Mine Project $1,000 2016 – 2018 High
Capilano (Cleveland) Dam Power Plant $90 2017 – 2020 High
Crown Mountain Coking Coal Project $370 Summer 2016 – 2018 High
Fairview Container Terminal Expansion Phase 2B $650 2018 – 2021 High
Gas Transmission Project $5,000 Early 2016 – Early 2019 High
LNG Facility $600 2016 – 2018 High
LNG Facility $11,400 2016 – 2019 High
LNG Pipeline $130 2019 – 2021 High
Prince Rupert Potash Terminal $775 2017 – 2020 High
Schaft Creek Porphyry Copper-Gold Mine $2,900 2016 – 2019 High
Silvertip Silver Mine $50 2016 – 2017 High
Trans Mountain Pipeline Expansion (TMX) $5,400 2016 – 2017 High
WesPac Tilbury Jetty Marine Project $175 Late 2016 – Early 2018 High

47 Asia Pacific Gateway Corridor Transportation Labour Market Outlook for the Asia Pacific Gateway Corridor 2016–2025
Appendix B Economic Indicators and Major Projects included in the Economic Scenarios
Alberta
Project Name Estimated Project Value (Millions) Construction Dates Scenario
17th Ave Transitway $98 2016 – 2018 Low
AGLC Distribution Centre $92 Commencing 2016 Low
Anthony Henday Drive NE Divided Roadway $1,810 2012 – 2016 Low
Bowness Sanitary Offload Trunk $50 2015 – 2016 Low
Centrifuge Plant for Mature Fine Tailings $1,900 2012 – 2015 Low
CFB Cold Lake Infrastructure Upgrades $120 2006 – 2015 Low
Christina Lake Thermal Expansion Project $2,700 2012 – 2017 Low
Cold Lake Pipeline Twinning Foster Creek $1,200 2013 – 2016 Low
Crude Oil Pipeline Edmonton to Hardisty $844 2014 – 2015 Low
Edmonton Terminal South Expansion $260 2013 – 2015 Low
Fort Hills Oil Sands Mine $13,500 2013 – 2017 Low
Foster Creek Oil Sands Project $2,000 2012 – 2017 Low
Glenmore Trail Improvements $83 2015 – 2017 Low
Grand Rapids Pipeline Project $3,200 2014 – 2016 Low
Hangingstone SAGD Commercial Production Project $774 2013 – 2016 Low
Heartland Pipeline and TC Terminal $900 2014 – 2016 Low
Highway 2 and 41 Avenue SW Interchange $205 2014 – 2015 Low
Highway 63 Grade, Base and Pave $130 2013 – 2016 Low
Highway 63 Grade, Base and Pave 771710 $130 2013 – 2016 Low
Horizon Oil Sands Project Phase 2 and 3 $2,060 2012 – 2017 Low
Kirby North Phase 1 Oil Sands Project $1,450 2015 – 2016 Low
Macleod Trail and 162 Ave S Interchange $65 2015 – 2017 Low
Narrows Lake In Situ Oil Sands Project $1,600 2013 – 2017 Low
North West Bitumen Upgrader Phase 1 $8,500 2013 – 2017 Low
Northern Courier Pipeline Project $660 2014 – 2017 Low
Polaris Expansion Narrows Lake Connection $72 2013 – 2016 Low
Polyethylene Facility Expansion $1,000 2013 – 2016 Low
Red Deer Area Transmission Development $350 2014 – 2016 Low
Redwater RFS 2 Fractionator Twinning $415 2013 – 2015 Low
Saturn 2 $170 2013 – 2015 Low
Simonette Gas Plant Modifications $90 2014 – 2015 Low
South Foothills Transmission Project $345 2014 – 2015 Low
Southwest Calgary Ring Road - Hwy 22 to Glenmore $1,900 2016 – 2025 Low
Surmont Phase 2 Oil Sands Development $2,000 2010 – 2015 Low
Walterdale Bridge Replacement $155 2013 – 2017 Low
Wastewater Treatment Plant Upgrades Phase 2 $58 2012 – 2015 Low

48 Asia Pacific Gateway Corridor Transportation Labour Market Outlook for the Asia Pacific Gateway Corridor 2016–2025
Appendix B Economic Indicators and Major Projects included in the Economic Scenarios
Project Name Estimated Project Value (Millions) Construction Dates Scenario
Alberta Carbon Trunk Line $600 2014 – 2015 Moderate
ATCO Gas Fired Power Plant $800 2014 – 2017 Moderate
Biorefinery $200 2014 – 2015 Moderate
Bonnybrook Wastewater Treatment Plant Upgrade $126 2014 – 2018 Moderate
Gilead Research and Development Lab $50 2014 – 2016 Moderate
Highway 19 Twinning $80 Announced Moderate
HR Milner Generating Station Expansion $1,400 2014 – 2020 Moderate
Northern Gateway Pipeline $1,580 2015 – 2018 Moderate
Pelican Lake Grand Rapids SAGD Oil Sands Project $2,000 2014 – 2017 Moderate
Picture Butte - Etzikom Coulee Transmission Line $160 2014 – 2015 Moderate
Terminal Expansion $100 2014 – 2015 Moderate
Aspen Oil Sands Project $7,000 2016 – 2020 High
Audet Lands Oil Sands Facility $550 2015 – 2016 High
Baseline Terminal $672 2015 – 2019 High
Birchwood SAGD Oil Sands Project $510 2016 – 2017 High
Blackrod SAGD Oil Sands Project Phase 1 $802 2014 – 2016 High
Bonnybrook Wastewater Treatment Plant D Expansion $600 2017 – 2022 High
Calgary Urban Pipeline Replacement Project $450 2016 – 2018 High
Canadian Diluent Hub Phase 1 $350 2016 – 2017 High
Christina Lake SAGD Project Phase 3 $500 2016 – 2018 High
Deerland Peaking Station $140 2016 High
Dover Commercial Project Phase 1 $2,500 2014 – 2017 High
Dunkirk Project $123 2015 – 2016 High
Edmonton Terminal Expansion Project Phase 2 $112 2015 – 2017 High
Edmonton Urban Pipeline Replacement Project $250 2015 – 2018 High
Fort McMurray West Transmission Line $1,430 2017 – 2019 High
Frontier Oil Sands Mine $20,000 2019 – 2026 High
Genesee Generating Station Units 4 and 5 Project $1,400 2016 – 2019 High
Germain Commercial Demonstration Project Phase 2 $110 2013 – 2015 High
Great Spirit Power Project $1,000 2015 – 2017 High
Grouse In Situ Oil Sands Project $1,530 2015 – 2017 High
Hoole Grand Rapids SAGD Project Phase 1 $452 2014 – 2016 High
Iron / Vanadium Mine and Mill Buildings $300 2018 – 2020 High
Iron / Vanadium Mine Power Plant $75 2018 – 2020 High
Iron / Vanaium Mine Infrastructure $100 2018 – 2020 High
Kathleen Andrews Transit Garage $196 Commencing 2015 High
Keyera NGL Expansion $220 2015 – 2016 High

49 Asia Pacific Gateway Corridor Transportation Labour Market Outlook for the Asia Pacific Gateway Corridor 2016–2025
Appendix B Economic Indicators and Major Projects included in the Economic Scenarios
Muskwa SAGD Oil Sands Project $800 2014 - 2017 High
Northern NGL Pipeline System Expansion Phase 2 $415 2015 – 2016 High
Peace NGL Pipeline System Expansion $415 2016 – 2019 High
Pike Oil Sands Project $3,800 2016 – 2018 High
Pipeline System Expansions Phase 3 $2,400 2015 – 2017 High
Propane Dehydrogenation Facility $800 2016 – 2019 High
Redwater RFS 3 Fractionator $460 2016 – 2017 High
Rigel Oil Sands Project $390 2015 – 2017 High
Saleski Oil Sands Pilot Project Expansion $520 2015 – 2017 High
Saleski Thermal Oil Sands Project $300 2015 – 2017 High
Sasol Natural Gas to Liquid Refinery $12,500 Commencing 2017 High
Sepiko Kesik (Saleski East) Oil Sands Project $70 2016 – 2018 High
Stoney CNG Transit Bus Garage $200 2016 – 2018 High
Strathcona Salt Cavern Storage Project $200 2015 – 2017 High
Sundance 7 Gas-Fired Power Plant $1,600 2020 – 2022 High
Taiga Oil Sands Project $1,570 2015 – 2018 High
Telephone Lake SAGD Project Phase 1 $1,000 2014 – 2018 High
Trans Mountain Pipeline Expansion $5,400 2016 – 2018 High
Transmission Line Castle Rock Ridge to Chapel Rock $500 2017 – 2018 High
Valley Line LRT $1,800 2016 – 2020 High
Voyageur South Mine $4,400 Commencing 2018 High
Walleye SAGD Oil Sands Project $450 2015 – 2016 High
Peace NGL Pipeline System Expansion $415 2016 – 2019 High
Baseline Terminal $672 2015 – 2019 High
Windy Point Wind Farm $150 2016 – 2017 High
Wood Buffalo Crude Oil Pipeline Extension $1,300 2015 – 2017 High
Saskatchewan
Project Name Estimated Project Value (Millions) Construction Dates Scenario
2014/2015 Highways Capital Program - Fall 2014 Tender Plan $200.0 2014 – 2015 Low
Agriculture and Oil terminal $94.7.0 2013 – 2016 Low
Agrium’s Potash Mine Expansion $2,470 2015 – 2017 Low
Biomass Generator Power Plant $150.0 2014 – 2016 Low
Carbon Capture Test Facility $70.0 2013 – 2015 Low
Hwy 16 Twinning $55.0 2014 – 2019 Low
K+S’s New Legacy Potash Mine $4100.0 2012 – 2016 Low
Large Diameter pipe mill $200.0 2015 – 2018 Low
Legacy Uranium Mine and Mill Site Clean Up $250.0 2007 – 2020 Low

50 Asia Pacific Gateway Corridor Transportation Labour Market Outlook for the Asia Pacific Gateway Corridor 2016–2025
Appendix B Economic Indicators and Major Projects included in the Economic Scenarios
Project Name Estimated Project Value (Millions) Construction Dates Scenario
Line - Aberdeen to Wolverine - 230kV - New $73.4.0 2013 – 2017 Low
Line - I1K - 230kV - New $380.0 2013 – 2015 Low
Line - TCP Piapot to Swift Current - 230kV - New $58.0 2013 – 2016 Low
Mid-Saskatchewan Pipeline System $100.0 2014 – 2015 Low
Mosaic’s Potash Mine Expansion $1700.0 2015 – 2017 Low
New Bypass $53.0 2010 – 2015 Low
New Stadium at Evraz Place $278.2 2014 – 2017 Low
Oil Refining Expansion $100.0 2013 – 2015 Low
Pipeline Network $115.0 2015 – 2015 Low
Queen Elizabeth Repowering $532.0 2013 – 2015 Low
Regina Bypass-Connects Hwy 11 with the Trans-Canada Hwy $1880.0 2015 – 2019 Low
Waste Water Treatment Plant $130.0 2004 – N/A Low
Wastewater Treatment Plant Upgrades $224.3 2008 – 2016 Low
Areva’s Uranium Mine Project $1050.0 2018 – 2022 Moderate
BHP: Jansen mine Part 1 (Phase 2) $2,600.0 2014 – 2019 Moderate
Cast Iron Water Main Replacement $117.0 2015 – 2035 Moderate
Enbridge: Line 3 Replacement 3136 2015 – 2017 Moderate
Genesis Grain and Fertilizer Plant - near Belle Plaine $1760.0 2015 – N/A Moderate
Karnalyte’s 625,000 tonnes per year Greenfield Solution Potash Mine and Processing Facility
$593.0 2016 – 2017 Moderate
Line 3 Replacement $4830.0 2015 – 2017 Moderate
McOrmond/Highway #5 and Boychuck/Highway #16 Interchanges $80.0 2015 – 2017 Moderate
Natural gas Power Plant $750.0 2016 – 2019 Moderate
North Commuter Parkway and Traffic Bridge Project $252.0 2012 – 2018 Moderate
SaskPower: Tazi Twe hydroelectric project 630 2016 – 2020 Moderate
BHP: Jansen mine Part 2-Included to maintain growth $4,500.0 2020 – 2022 High
Cameco’s Uranium Mine $2600 2018 – 2022 High
Energy East Pipeline Project $863.0 2017 – 2019 High
Fortune Minerals: Processing facility $230 2016 – 2018 High
Keystone XL Oil Pipeline Project $800.0 2010 – N/A High
New Solutions Potash $2500.0 2016 – N/A High
Roughrider Advance Exploration $300.0 2014 – 2022 High
Solution Potash Mine and Processing Facility Upgrade to 2.13 million tonnes per year (2nd Phase)
$2000.0 2014 – 2016 High
Vale’s New Solution Potash Mine $3000.0 2016 – 2020 High
Western Potash Corp: Milestone Pilot Project 80 2017 – 2018 High
Western Potash Corp’s New Potash Mine $3300.0 2017 – 2018 High

51 Asia Pacific Gateway Corridor Transportation Labour Market Outlook for the Asia Pacific Gateway Corridor 2016–2025
Appendix B Economic Indicators and Major Projects included in the Economic Scenarios
Manitoba
Project Name Estimated Project Value (Millions) Construction Dates Scenario
Canada Inns to Develop New Hotel at McPhillips Station Casino $50 2015 – 2016 Low
East Side Transportation Initiative $1000 2014 – 2023 Low
Enbridge : Line 3 Pipeline Replacement $1372 2015 – 2017 Low
Energy East Pipeline $563.6 2015 – 2018 Low
Manitoba Hydro Dam $6500 2012 – 2021 Low
Manitoba Hydro Hydro Dam $560 2010 – 2015 Low
Manitoba Hydro Hydro Transmission lines - Bipole III $5280 2012 – 2018 Low
Manitoba Hydro Reil $1200 2015 – 2018 Low
Permanent Flood Channel - Lake St. Martin and Lake Winnipeg $250 2016 – 2021 Low
Winnipeg Convention Centre - Convention Centre Addition $210 2013 – 2016 Low
Lalor Mine - concentrator 200 2017 – 2019 Moderate
Southwest Rapid Transitway (Stage 2) $400 2016 – 2019 Moderate
Vale Mine Expansion 500 2016 – 2019 Moderate
Water Treatment Plant, NEWPCC - Biological Nutrient Removal (BNR) -2230 Main Street
$547 2016 – 2019 Moderate
Water Treatment Plant, SEWPCC - Biological Nutrient Removal (BNR) -100 Ed Spencer Drive
$272 2015 – 2017 Moderate
Highway 1 and Highway 16 Overpass $130 2020 – 2022 High
Manitoba Minnesota Transmission Project $350 2018 – 2021 High
Project Name Estimated Project Value (Millions) Construction Dates Scenario
Line - Aberdeen to Wolverine - 230kV - New $73.4.0 2013 – 2017 Low
Line - I1K - 230kV - New $380.0 2013 – 2015 Low
Line - TCP Piapot to Swift Current - 230kV - New $58.0 2013 – 2016 Low
Mid-Saskatchewan Pipeline System $100.0 2014 – 2015 Low
Mosaic’s Potash Mine Expansion $1700.0 2015 – 2017 Low
New Bypass $53.0 2010 – 2015 Low
New Stadium at Evraz Place $278.2 2014 – 2017 Low
Oil Refining Expansion $100.0 2013 – 2015 Low
Pipeline Network $115.0 2015 – 2015 Low
Queen Elizabeth Repowering $532.0 2013 – 2015 Low
Regina Bypass-Connects Hwy 11 with the Trans-Canada Hwy $1880.0 2015 – 2019 Low
Waste Water Treatment Plant $130.0 2004 – N/A Low
Wastewater Treatment Plant Upgrades $224.3 2008 – 2016 Low
Areva’s Uranium Mine Project $1050.0 2018 – 2022 Moderate
BHP: Jansen mine Part 1 (Phase 2) $2,600.0 2014 – 2019 Moderate
Cast Iron Water Main Replacement $117.0 2015 – 2035 Moderate
Enbridge: Line 3 Replacement 3136 2015 – 2017 Moderate
Genesis Grain and Fertilizer Plant - near Belle Plaine $1760.0 2015 – N/A Moderate
Karnalyte’s 625,000 tonnes per year Greenfield Solution Potash Mine and Processing Facility
$593.0 2016 – 2017 Moderate
Line 3 Replacement $4830.0 2015 – 2017 Moderate
McOrmond/Highway #5 and Boychuck/Highway #16 Interchanges $80.0 2015 – 2017 Moderate
Natural gas Power Plant $750.0 2016 – 2019 Moderate
North Commuter Parkway and Traffic Bridge Project $252.0 2012 – 2018 Moderate
SaskPower: Tazi Twe hydroelectric project 630 2016 – 2020 Moderate
BHP: Jansen mine Part 2-Included to maintain growth $4,500.0 2020 – 2022 High
Cameco’s Uranium Mine $2600 2018 – 2022 High
Energy East Pipeline Project $863.0 2017 – 2019 High
Fortune Minerals: Processing facility $230 2016 – 2018 High
Keystone XL Oil Pipeline Project $800.0 2010 – N/A High
New Solutions Potash $2500.0 2016 – N/A High
Roughrider Advance Exploration $300.0 2014 – 2022 High
Solution Potash Mine and Processing Facility Upgrade to 2.13 million tonnes per year (2nd Phase)
$2000.0 2014 – 2016 High
Vale’s New Solution Potash Mine $3000.0 2016 – 2020 High
Western Potash Corp: Milestone Pilot Project 80 2017 – 2018 High
Western Potash Corp’s New Potash Mine $3300.0 2017 – 2018 High

52 Asia Pacific Gateway Corridor Transportation Labour Market Outlook for the Asia Pacific Gateway Corridor 2016–2025
Appendix C Data Tables by Sector and Economic Scenario: The Asia Pacific Gateway Corridor
APPENDIXC DATATABLESBYSECTORANDECONOMICSCENARIO:THEASIAPACIFICGATEWAYCORRIDOR
APGC — All Sectors — Low Investment Scenario
Historical Data Forecast
2016 2017 2018 2016 2017 2018 2019 2020 2021 2022 2023 2024 2025
Hiring Difficulty Index
some challenges
difficultsome
challengessome
challenges easy
marketsome
challengessome
challengessome
challengessome
challengessome
challengessome
challengessome
challengessome
challenges
Employment 521,096 527,390 536,314 530,983 531,192 534,200 538,916 542,449 545,459 548,194 552,419 556,070 559,469
Expansion Demand 9,685 6,510 9,332 -5,840 22 2,985 4,807 3,549 3,003 2,715 4,282 3,688 3,413
Replacement Demand
11,980 12,513 12,750 13,169 13,314 13,505 13,653 13,782 13,870 13,934 13,991 14,054 14,117
Job Openings 21,665 19,020 22,078 7,330 13,340 16,491 18,458 17,334 16,869 16,646 18,273 17,738 17,529
Net New Positions – 6,294 8,924 -5,331 209 3,008 4,716 3,533 3,010 2,735 4,225 3,651 3,399
Labour Force Supply
553,000 558,926 572,681 571,728 572,792 575,422 579,358 582,469 585,116 587,677 591,271 594,699 597,824
Net New Supply 21,856 18,435 26,501 12,218 14,379 16,142 17,591 16,891 16,519 16,488 17,582 17,479 17,243
New Entrants 10,062 9,970 10,126 9,922 9,711 9,644 9,629 9,548 9,570 9,670 9,819 9,868 9,890
Intl. Mobility 3,574 15,710 4,938 3,789 -2,528 3,233 3,673 3,279 2,790 2,269 2,804 3,003 3,199
Mobility 2,068 3,501 2,402 124 3,025 -636 99 808 1,489 1,848 2,037 1,907 1,510
Labour Force Mobility
6,152 -10,746 9,035 -1,617 4,171 3,901 4,190 3,256 2,670 2,701 2,922 2,701 2,644
Average Age 43 42 42 43 43 43 43 43 43 43 43 43 43
Market Tightness 4 4 3 3 3 3 3 3 3 3 3 3 3
Mobilitymoving
inmoving
inmoving
inmoving
inmoving
inlow
leavingmoving
inmoving
inmoving
inmoving
inmoving
inmoving
inmoving
in
Supply Lag low medium low low low low medium low low low medium low low
Intl. Reliance medium extreme medium high none medium medium medium medium medium medium medium medium
Loss of Experience medium medium medium high high high high high high high high high high

53 Asia Pacific Gateway Corridor Transportation Labour Market Outlook for the Asia Pacific Gateway Corridor 2016–2025
Appendix C Data Tables by Sector and Economic Scenario: The Asia Pacific Gateway Corridor
APGC — All Sectors — Moderate Investment Scenario
Historical Data Forecast
2016 2017 2018 2016 2017 2018 2019 2020 2021 2022 2023 2024 2025
Hiring Difficulty Index
some challenges
difficultsome
challenges easy
marketsome
challengessome
challengessome
challengessome
challengessome
challengessome
challengessome
challengessome
challengessome
challenges
Employment 521,096 527,390 536,314 534,263 538,771 545,242 551,327 556,953 562,244 566,243 569,982 572,291 574,300
Expansion Demand 9,685 6,510 9,332 -2,358 4,581 6,661 6,249 5,768 5,407 4,040 3,770 2,260 1,944
Replacement Demand
11,980 12,513 12,750 13,168 13,439 13,658 13,828 13,959 14,066 14,142 14,205 14,268 14,323
Job Openings 21,665 19,020 22,078 10,812 18,022 20,316 20,075 19,727 19,472 18,179 17,978 16,528 16,265
Net New Positions – 6294 8924 -2051 4508 6471 6085 5626 5291 3999 3739 2309 2009
Labour Force Supply
553,000 558,926 572,681 573,759 577,606 582,634 587,699 592,356 596,894 600,650 604,424 607,382 609,868
Net New Supply 21,856 18,435 26,501 14,244 17,292 18,678 18,892 18,614 18,600 17,900 17,979 17,232 16,808
New Entrants 10,062 9,970 10,126 9,959 9,792 9,761 9,769 9,712 9,767 9,885 10,035 10,079 10,082
Intl. Mobility 3,574 15,710 4,938 -4,574 -641 4,164 4,064 4,172 4,134 3,191 3,200 3,083 3,087
Mobility 2068 3501 2402 3243 2780 262 760 1222 2004 2232 2070 1640 1189
Labour Force Mobility
6152 -10746 9035 5616 5361 4491 4299 3508 2695 2592 2674 2430 2450
Average Age 43 42 42 43 43 43 43 43 43 43 43 43 43
Market Tightness 4 4 3 3 3 3 3 3 3 3 3 3 3
Mobilitymoving
inmoving
inmoving
inmoving
inmoving
inmoving
inmoving
inmoving
inmoving
inmoving
inmoving
inmoving
inmoving
in
Supply Lag low medium low low medium high medium medium medium low low low low
Intl. Reliance medium extreme medium none none medium medium medium medium medium medium medium medium
Loss of Experience medium medium medium high high medium medium high high high high high high

54 Asia Pacific Gateway Corridor Transportation Labour Market Outlook for the Asia Pacific Gateway Corridor 2016–2025
APGC — All Sectors — High Investment Scenario
Historical Data Forecast
2016 2017 2018 2016 2017 2018 2019 2020 2021 2022 2023 2024 2025
Hiring Difficulty Index
some challenges
difficultsome
challengessome
challengesdifficult difficult
some challenges
some challenges
some challenges
some challenges
some challenges
some challenges
difficult
Employment 521,096 527,390 536,314 541,993 553,397 562,908 570,001 575,083 579,397 581,933 581,735 582,183 583,092
Expansion Demand 9,685 6,510 9,332 5,846 11,891 9,881 7,317 5,191 4,375 2,488 -397 287 773
Replacement Demand
11,980 12,513 12,750 13,167 13,081 13,355 13,575 13,745 13,873 13,984 14,064 14,132 14,210
Job Openings 21,665 19,020 22,078 19,009 24,974 23,234 20,891 18,931 18,246 16,476 13,666 14,418 14,984
Net New Positions – 6,294 8,924 5,679 11,404 9,511 7,093 5,082 4,314 2,536 -198 448 909
Labour Force Supply
553,000 558,926 572,681 578,212 586,730 594,317 600,545 605,450 610,037 613,347 615,211 617,127 618,915
Net New Supply 21,856 18,435 26,501 18,688 21,602 20,949 19,797 18,648 18,461 17,294 15,930 16,049 15,996
New Entrants 11,795 8,470 16,377 10,034 9,935 9,948 9,983 9,935 9,993 10,100 10,215 10,234 10,222
Intl. Mobility 5,644 19,218 7,342 16,945 3,826 3,849 4,134 4,250 3,958 4,102 2,947 2,183 8,875
Mobility 2,068 3,501 2,402 1,258 1,932 1,878 1,489 1,248 1,590 1,376 1,064 1,356 -5,476
Labour Force Mobility
3,574 15,710 4,938 -9,549 5,909 5,274 4,191 3,215 2,920 1,716 1,704 2,276 2,375
Average Age 43 42 42 42 42 42 42 42 42 42 43 43 43
Market Tightness 4 4 3 3 4 4 4 4 4 4 4 3 3
Mobilitymoving
inmoving
inmoving
inmoving
inmoving
inmoving
inmoving
inmoving
inmoving
inmoving
inmoving
inmoving
inhigh
leaving
Supply Lag low medium low low high high medium low low low low low low
Intl. Reliance medium extreme medium extreme medium medium medium medium medium medium medium medium extreme
Loss of Experience medium medium medium medium medium medium medium high high high high high high
Data Tables by Sector and Economic Scenario: The Asia Pacific Gateway CorridorAppendix C

55 Asia Pacific Gateway Corridor Transportation Labour Market Outlook for the Asia Pacific Gateway Corridor 2016–2025
Air Sector — Low Investment Scenario
Historical Data Forecast
2016 2017 2018 2016 2017 2018 2019 2020 2021 2022 2023 2024 2025
Hiring Difficulty Index
some challenges
difficultsome
challengessome
challengessome
challengessome
challengessome
challengessome
challengessome
challengessome
challengessome
challengessome
challengessome
challenges
Employment 169,605 173,101 175,144 172,718 172,683 173,734 175,391 176,672 177,619 178,463 179,875 181,063 182,102
Expansion Demand 3,134 3,644 2,078 -2,590 -92 1,050 1,685 1,290 940 831 1,422 1,195 1,036
Replacement Demand
4,245 4,426 4,476 4,629 4,668 4,723 4,785 4,846 4,895 4,936 4,974 5,013 5,052
Job Openings 7,377 8,069 6,554 2,039 4,579 5,775 6,470 6,138 5,832 5,764 6,395 6,207 6,087
Net New Positions – 3,496 2,043 -2,426 -35 1,051 1,657 1,281 947 844 1,412 1,188 1,039
Labour Force Supply
177,945 181,184 185,061 184,108 184,259 185,128 186,497 187,618 188,457 189,244 190,442 191,568 192,539
Net New Supply 7,384 7,666 8,352 3,678 4,819 5,598 6,156 5,967 5,733 5,718 6,172 6,138 6,024
New Entrants 2,971 2,968 2,984 2,919 2,855 2,839 2,835 2,814 2,818 2,847 2,891 2,904 2,912
Intl. Mobility 1,296 6,167 1,235 1,952 2,008 939 1,061 894 623 411 698 750 811
Mobility 1,245 1,995 589 -410 -1,014 -184 43 246 358 420 528 508 388
Labour Force Mobility
1,872 -3,464 3,544 -783 970 2,004 2,217 2,013 1,934 2,040 2,055 1,976 1,913
Average Age 44 44 44 44 44 44 44 44 44 44 44 44 44
Market Tightness 4 4 3 2 2 2 2 3 3 3 3 3 3
Mobilitymoving
inmoving
inmoving
infewer jobs
fewer jobs
low leaving
moving in
moving in
moving in
moving in
moving in
moving in
moving in
Supply Lag low medium low low low medium medium low low low medium low low
Intl. Reliance medium extreme medium extreme high medium medium medium medium low medium medium medium
Loss of Experience medium medium medium high high high high high high high high high high
Data Tables by Sector and Economic Scenario: The Asia Pacific Gateway CorridorAppendix C

56 Asia Pacific Gateway Corridor Transportation Labour Market Outlook for the Asia Pacific Gateway Corridor 2016–2025
Air Sector — Moderate Investment Scenario
Historical Data Forecast
2016 2017 2018 2016 2017 2018 2019 2020 2021 2022 2023 2024 2025
Hiring Difficulty Index
some challenges
difficultsome
challengessome
challengesdifficult
some challenges
some challenges
some challenges
some challenges
some challenges
some challenges
some challenges
some challenges
Employment 169,605 173,101 175,144 173,807 175,242 177,486 179,560 181,591 183,336 184,678 185,870 186,516 187,057
Expansion Demand 3,134 3,644 2,078 -1,447 1,452 2,303 2,117 2,078 1,771 1,349 1,196 624 515
Replacement Demand
4,245 4,426 4,476 4,629 4,684 4,761 4,838 4,900 4,959 5,009 5,054 5,096 5,130
Job Openings 7,377 8,069 6,554 3,184 6,139 7,062 6,956 6,978 6,728 6,357 6,252 5,719 5,645
Net New Positions – 3496 2043 -1337 1435 2244 2074 2031 1745 1342 1192 646 541
Labour Force Supply
177,945 181,184 185,061 184,782 185,907 187,615 189,326 190,999 192,499 193,756 194,969 195,845 196,554
Net New Supply 7,384 7,666 8,352 4,351 5,812 6,465 6,549 6,573 6,457 6,266 6,270 5,971 5,842
New Entrants 2,971 2,968 2,984 2,930 2,881 2,874 2,877 2,863 2,878 2,913 2,958 2,970 2,968
Intl. Mobility 1,296 6,167 1,235 1,565 1,500 1,108 1,115 1,146 928 545 669 689 726
Mobility 1245 1995 589 -101 -297 89 226 366 537 669 610 424 278
Labour Force Mobility
1872 -3464 3544 -43 1728 2394 2331 2198 2114 2139 2033 1888 1870
Average Age 44 44 44 44 44 44 44 44 44 44 44 44 44
Market Tightness 4 4 3 3 3 3 3 3 3 3 3 3 3
Mobilitymoving
inmoving
inmoving
infewer jobs
low leaving
moving in
moving in
moving in
moving in
moving in
moving in
moving in
moving in
Supply Lag low medium low low medium high medium medium medium low low low low
Intl. Reliance medium extreme medium high high medium medium medium medium low medium medium medium
Loss of Experience medium medium medium high high medium medium high high high high high high
Data Tables by Sector and Economic Scenario: The Asia Pacific Gateway CorridorAppendix C

57 Asia Pacific Gateway Corridor Transportation Labour Market Outlook for the Asia Pacific Gateway Corridor 2016–2025
Air Sector — High Investment Scenario
Historical Data Forecast
2016 2017 2018 2016 2017 2018 2019 2020 2021 2022 2023 2024 2025
Hiring Difficulty Index
some challenges
difficultsome
challengesdifficult
some challenges
difficultsome
challengessome
challengessome
challengessome
challengessome
challengessome
challengesdifficult
Employment 169,605 173,101 175,144 176,606 180,435 183,540 185,920 187,718 188,932 189,758 189,562 189,581 189,767
Expansion Demand 3,134 3,644 2,078 1,493 3,965 3,203 2,442 1,834 1,210 808 -261 -34 140
Replacement Demand
4,245 4,426 4,476 4,629 4,174 4,292 4,399 4,493 4,577 4,667 4,736 4,800 4,865
Job Openings 7,377 8,069 6,554 6,120 8,138 7,494 6,840 6,323 5,789 5,475 4,475 4,765 5,006
Net New Positions – 3,496 2,043 1,462 3,829 3,105 2,380 1,798 1,214 826 -196 19 186
Labour Force Supply
177,945 181,184 185,061 186,454 189,251 191,700 193,769 195,469 196,789 197,834 198,322 198,819 199,293
Net New Supply 7,384 7,666 8,352 6,020 6,977 6,743 6,462 6,192 5,897 5,711 5,225 5,297 5,342
New Entrants 2,971 2,968 2,984 2,957 2,932 2,934 2,945 2,932 2,944 2,974 3,007 3,011 3,006
Intl. Mobility 1,296 6,167 1,235 48,075 751 854 930 1,003 383 1,046 561 350 4,454
Mobility 1,245 1,995 589 218 580 433 288 204 131 89 9 77 -3,974
Labour Force Mobility
1,872 -3,464 3,544 -45,230 2,714 2,522 2,299 2,053 2,439 1,602 1,648 1,859 1,856
Average Age 44 44 44 42 43 43 43 43 43 43 43 44 44
Market Tightness 4 4 3 3 3 4 4 4 4 4 4 3 3
Mobilitymoving
inmoving
inmoving
inmoving
inmoving
inmoving
inmoving
inmoving
inmoving
inmoving
inmoving
inmoving
inextreme leaving
Supply Lag low medium low low high high medium low low low low low low
Intl. Reliance medium extreme medium extreme medium medium medium medium low medium medium low extreme
Loss of Experience medium medium medium high medium medium medium high high high high high high
Data Tables by Sector and Economic Scenario: The Asia Pacific Gateway CorridorAppendix C

58 Asia Pacific Gateway Corridor Transportation Labour Market Outlook for the Asia Pacific Gateway Corridor 2016–2025
Logistics Sector — Low Investment Scenario
Historical Data Forecast
2016 2017 2018 2016 2017 2018 2019 2020 2021 2022 2023 2024 2025
Hiring Difficulty Index
difficult difficultsome
challengessome
challenges easy
marketsome
challengessome
challengessome
challengessome
challengessome
challengessome
challengessome
challengessome
challenges
Employment 178,771 181,974 181,499 181,092 181,650 182,847 184,500 185,685 186,606 187,488 188,906 190,183 191,395
Expansion Demand 1,679 3,324 -573 -473 530 1,193 1,679 1,186 911 871 1,435 1,289 1,216
Replacement Demand
3,630 3,825 3,938 4,101 4,210 4,329 4,421 4,497 4,560 4,610 4,659 4,705 4,749
Job Openings 5,309 7,146 3,362 3,628 4,739 5,523 6,099 5,686 5,469 5,481 6,092 5,992 5,968
Net New Positions – 3,203 -475 -407 558 1,197 1,653 1,185 921 882 1,418 1,277 1,212
Labour Force Supply
189,033 191,676 193,246 193,715 194,640 195,781 197,210 198,278 199,081 199,887 201,071 202,255 203,367
Net New Supply 4,922 6,467 5,502 4,573 5,133 5,473 5,851 5,561 5,369 5,415 5,841 5,887 5,863
New Entrants 2,998 2,978 2,948 2,922 2,872 2,856 2,854 2,830 2,837 2,865 2,908 2,923 2,930
Intl. Mobility 3,804 8,198 461 984 -1,661 1,269 1,228 956 670 620 915 1,030 1,120
Mobility 595 341 145 319 1,696 -271 79 352 546 642 714 693 561
Labour Force Mobility
-2,475 -5,050 1,948 348 2,226 1,619 1,690 1,423 1,316 1,288 1,304 1,241 1,252
Average Age 41 41 41 41 42 42 42 42 42 42 42 42 42
Market Tightness 3 4 3 3 3 3 3 3 3 3 3 3 3
Mobilitymoving
inmoving
inmoving
inmoving
inmoving
inlow
leavingmoving
inmoving
inmoving
inmoving
inmoving
inmoving
inmoving
in
Supply Lag high high low low low low medium low low low medium low low
Intl. Reliance extreme extreme low medium none medium medium medium medium medium medium medium medium
Loss of Experience medium medium high high high high high high high high high high high
Data Tables by Sector and Economic Scenario: The Asia Pacific Gateway CorridorAppendix C

59 Asia Pacific Gateway Corridor Transportation Labour Market Outlook for the Asia Pacific Gateway Corridor 2016–2025
Logistics Sector — Moderate Investment Scenario
Historical Data Forecast
2016 2017 2018 2016 2017 2018 2019 2020 2021 2022 2023 2024 2025
Hiring Difficulty Index
difficult difficultsome
challengeseasy
marketeasy
marketsome
challengessome
challengessome
challengessome
challengessome
challengessome
challengessome
challengessome
challenges
Employment 178,771 181,974 181,499 182,142 184,051 186,336 188,468 190,291 191,868 193,079 194,292 195,112 195,815
Expansion Demand 1,679 3,324 -573 635 1,950 2,345 2,183 1,859 1,596 1,213 1,217 803 681
Replacement Demand
3,630 3,825 3,938 4,101 4,255 4,388 4,484 4,565 4,631 4,686 4,732 4,777 4,821
Job Openings 5,309 7,146 3,362 4,735 6,206 6,734 6,665 6,423 6,226 5,896 5,950 5,582 5,500
Net New Positions – 3203 -475 643 1909 2285 2132 1823 1577 1211 1213 820 703
Labour Force Supply
189,033 191,676 193,246 194,346 196,097 197,941 199,738 201,248 202,567 203,667 204,864 205,890 206,759
Net New Supply 4,922 6,467 5,502 5,202 6,006 6,229 6,282 6,073 5,950 5,786 5,928 5,807 5,692
New Entrants 2,998 2,978 2,948 2,933 2,892 2,887 2,892 2,874 2,887 2,920 2,962 2,976 2,977
Intl. Mobility 3,804 8,198 461 - 1,325 - 2,109 1,481 1,351 1,261 1,166 950 1,057 1,059 1,067
Mobility 595 341 145 1150 2158 33 271 435 604 669 662 593 454
Labour Force Mobility
-2475 -5050 1948 2444 3065 1828 1768 1503 1293 1247 1247 1179 1194
Average Age 41 41 41 41 42 42 42 42 42 42 42 42 42
Market Tightness 3 4 3 3 3 3 3 3 3 3 3 3 3
Mobilitymoving
inmoving
inmoving
inmoving
inmoving
inmoving
inmoving
inmoving
inmoving
inmoving
inmoving
inmoving
inmoving
in
Supply Lag high high low low medium high medium medium medium low low low low
Intl. Reliance extreme extreme low none none medium medium medium medium medium medium medium medium
Loss of Experience medium medium high high medium medium medium high high high high high high
Data Tables by Sector and Economic Scenario: The Asia Pacific Gateway CorridorAppendix C

60 Asia Pacific Gateway Corridor Transportation Labour Market Outlook for the Asia Pacific Gateway Corridor 2016–2025
Logistics Sector — High Investment Scenario
Historical Data Forecast
2016 2017 2018 2016 2017 2018 2019 2020 2021 2022 2023 2024 2025
Hiring Difficulty Index
difficult difficultsome
challengessome
challengesdifficult difficult
some challenges
some challenges
some challenges
some challenges
some challenges
some challenges
difficult
Employment 178,771 181,974 181,499 184,658 188,767 192,026 194,417 195,998 197,120 197,785 197,705 197,893 198,229
Expansion Demand 1,679 3,324 -573 3,292 4,269 3,369 2,455 1,599 1,114 635 -145 140 290
Replacement Demand
3,630 3,825 3,938 4,101 4,567 4,690 4,787 4,858 4,908 4,944 4,973 4,994 5,015
Job Openings 5,309 7,146 3,362 7,392 8,837 8,059 7,239 6,453 6,022 5,582 4,827 5,134 5,303
Net New Positions – 3,203 -475 3,159 4,109 3,259 2,391 1,581 1,122 665 -80 188 336
Labour Force Supply
189,033 191,676 193,246 195,737 198,912 201,546 203,650 205,184 206,409 207,296 207,881 208,558 209,193
Net New Supply 4,922 6,467 5,502 6,587 7,738 7,331 6,887 6,387 6,131 5,835 5,557 5,670 5,649
New Entrants 2,998 2,978 2,948 2,952 2,929 2,937 2,948 2,933 2,945 2,973 3,005 3,011 3,007
Intl. Mobility 3,804 8,198 461 -24,884 1,844 1,475 1,495 1,378 1,197 1,016 964 963 1,970
Mobility 595 341 145 592 516 626 567 548 622 597 547 569 -478
Labour Force Mobility
-2,475 -5,050 1,948 27,927 2,449 2,293 1,877 1,528 1,367 1,249 1,041 1,127 1,150
Average Age 41 41 41 42 42 42 42 42 42 42 42 42 43
Market Tightness 3 4 3 3 4 4 4 4 4 4 4 3 3
Mobilitymoving
inmoving
inmoving
inmoving
inmoving
inmoving
inmoving
inmoving
inmoving
inmoving
inmoving
inmoving
inlow
leaving
Supply Lag high high low high high high medium low low low low low low
Intl. Reliance extreme extreme low none medium medium medium medium medium medium medium medium high
Loss of Experience medium medium high medium medium medium medium high high high high high high
Data Tables by Sector and Economic Scenario: The Asia Pacific Gateway CorridorAppendix C

61 Asia Pacific Gateway Corridor Transportation Labour Market Outlook for the Asia Pacific Gateway Corridor 2016–2025
Rail Sector — Low Investment Scenario
Historical Data Forecast
2016 2017 2018 2016 2017 2018 2019 2020 2021 2022 2023 2024 2025
Hiring Difficulty Index
some challenges
some challenges
some challenges
some challenges
easy market
some challenges
difficultsome
challengessome
challengessome
challengessome
challengessome
challengessome
challenges
Employment 176,655 177,620 178,789 177,308 177,727 178,959 180,622 181,909 182,893 183,760 185,244 186,476 187,551
Expansion Demand 2,011 935 1,160 -1,588 388 1,237 1,689 1,289 973 852 1,495 1,239 1,072
Replacement Demand
4,425 4,606 4,911 5,052 5,095 5,171 5,223 5,270 5,299 5,318 5,331 5,350 5,370
Job Openings 6,437 5,540 6,070 3,462 5,486 6,409 6,913 6,563 6,271 6,166 6,826 6,588 6,439
Net New Positions – 965 1,169 -1,481 419 1,232 1,663 1,287 984 867 1,484 1,232 1,075
Labour Force Supply
185,978 186,736 189,555 189,347 190,033 191,127 192,509 193,616 194,479 195,290 196,557 197,734 198,741
Net New Supply 6,934 5,364 7,729 4,843 5,782 6,272 6,606 6,375 6,160 6,124 6,598 6,527 6,379
New Entrants 2,849 2,816 2,814 2,757 2,702 2,689 2,684 2,664 2,667 2,696 2,742 2,756 2,763
Intl. Mobility 2,294 -13,833 1,030 2,412 -1,635 1,634 1,525 1,483 1,312 1,144 1,164 1,187 1,204
Mobility 748 -473 501 -84 1,956 -299 -9 202 401 517 644 612 480
Labour Force Mobility
1,043 16,854 3,384 -242 2,759 2,248 2,406 2,026 1,780 1,767 2,048 1,972 1,932
Average Age 43 44 44 44 44 44 44 44 44 44 44 44 44
Market Tightness 3 4 3 2 2 2 3 3 3 3 3 3 3
Mobilitymoving
inlow
leavingmoving
infewer jobs
moving in
low leaving
low leaving
moving in
moving in
moving in
moving in
moving in
moving in
Supply Lag low medium low low low low medium low low low medium low low
Intl. Reliance high none medium high none high medium medium medium medium medium medium medium
Loss of Experience medium high high high high high high high high high high high high
Data Tables by Sector and Economic Scenario: The Asia Pacific Gateway CorridorAppendix C

62 Asia Pacific Gateway Corridor Transportation Labour Market Outlook for the Asia Pacific Gateway Corridor 2016–2025
Rail Sector — Moderate Investment Scenario
Historical Data Forecast
2016 2017 2018 2016 2017 2018 2019 2020 2021 2022 2023 2024 2025
Hiring Difficulty Index
some challenges
some challenges
some challenges
easy market
some challenges
some challenges
some challenges
some challenges
some challenges
some challenges
some challenges
some challenges
some challenges
Employment 176,655 177,620 178,789 178,416 180,324 182,747 184,833 186,962 188,801 190,227 191,541 192,242 192,825
Expansion Demand 2,011 935 1,160 -427 1,958 2,491 2,131 2,184 1,869 1,437 1,322 681 553
Replacement Demand
4,425 4,606 4,911 5,052 5,142 5,220 5,286 5,331 5,371 5,396 5,414 5,436 5,449
Job Openings 6,437 5,540 6,070 4,627 7,099 7,710 7,416 7,515 7,238 6,832 6,740 6,116 6,003
Net New Positions – 965 1169 -373 1908 2423 2086 2129 1839 1426 1314 701 583
Labour Force Supply
185,978 186,736 189,555 190,023 191,686 193,615 195,352 197,103 198,697 200,041 201,382 202,330 203,086
Net New Supply 6,934 5,364 7,729 5,517 6,809 7,146 7,021 7,081 6,959 6,746 6,758 6,385 6,206
New Entrants 2,849 2,816 2,814 2,767 2,726 2,722 2,724 2,711 2,726 2,761 2,807 2,821 2,820
Intl. Mobility 2,294 -13,833 1,030 -1,546 782 1,736 1,546 1,755 1,708 1,528 1,404 1,249 1,193
Mobility 748 -473 501 1345 659 95 264 405 603 657 630 474 343
Labour Force Mobility
1043 16854 3384 2951 2642 2593 2487 2210 1922 1800 1917 1841 1850
Average Age 43 44 44 44 44 44 44 44 44 44 44 44 44
Market Tightness 3 4 3 3 3 3 3 3 3 3 3 3 3
Mobilitymoving
inlow
leavingmoving
inmoving
inmoving
inmoving
inmoving
inmoving
inmoving
inmoving
inmoving
inmoving
inmoving
in
Supply Lag low medium low low medium high medium medium medium low low low low
Intl. Reliance high none medium none medium medium medium medium medium medium medium medium medium
Loss of Experience medium high high high high medium high high high high high high high
Data Tables by Sector and Economic Scenario: The Asia Pacific Gateway CorridorAppendix C

63 Asia Pacific Gateway Corridor Transportation Labour Market Outlook for the Asia Pacific Gateway Corridor 2016–2025
Rail Sector — High Investment Scenario
Historical Data Forecast
2016 2017 2018 2016 2017 2018 2019 2020 2021 2022 2023 2024 2025
Hiring Difficulty Index
some challenges
some challenges
some challenges
difficult difficult difficultsome
challengesdifficult difficult difficult
some challenges
some challenges
some challenges
Employment 176,655 177,620 178,789 181,270 185,581 188,825 191,304 193,290 194,616 195,528 195,413 195,499 195,728
Expansion Demand 2,011 935 1,160 2,577 4,483 3,350 2,549 2,038 1,330 896 -176 30 182
Replacement Demand
4,425 4,606 4,911 5,052 4,670 4,786 4,881 4,961 5,025 5,079 5,125 5,168 5,215
Job Openings 6,437 5,540 6,070 7,627 9,153 8,135 7,431 6,997 6,354 5,975 4,950 5,197 5,397
Net New Positions – 965 1,169 2,481 4,311 3,244 2,479 1,986 1,326 912 -115 86 229
Labour Force Supply
185,978 186,736 189,555 191,733 195,062 197,684 199,848 201,728 203,177 204,328 204,927 205,514 206,044
Net New Supply 6,934 5,364 7,729 7,223 8,004 7,412 7,046 6,841 6,474 6,229 5,726 5,757 5,747
New Entrants 2,849 2,816 2,814 2,794 2,774 2,775 2,787 2,777 2,788 2,820 2,854 2,860 2,856
Intl. Mobility 2,294 -13,833 1,030 25,470 1,360 1,272 1,411 1,746 1,797 1,641 1,173 1,015 1,288
Mobility 748 -473 501 394 754 609 456 363 305 275 182 81 -304
Labour Force Mobility
1,043 16,854 3,384 -21,435 3,116 2,756 2,392 1,955 1,584 1,493 1,517 1,801 1,907
Average Age 43 44 44 43 43 43 43 43 43 43 44 44 44
Market Tightness 3 4 3 3 4 4 4 4 4 4 4 3 3
Mobilitymoving
inlow
leavingmoving
inmoving
inmoving
inmoving
inmoving
inmoving
inmoving
inmoving
inmoving
inmoving
inlow
leaving
Supply Lag low medium low medium high high medium low low low low low low
Intl. Reliance high none medium extreme medium medium medium high high high medium medium medium
Loss of Experience medium high high medium medium medium medium high high high high high high
Data Tables by Sector and Economic Scenario: The Asia Pacific Gateway CorridorAppendix C

64 Asia Pacific Gateway Corridor Transportation Labour Market Outlook for the Asia Pacific Gateway Corridor 2016–2025
Trucking Sector — Low Investment Scenario
Historical Data Forecast
2016 2017 2018 2016 2017 2018 2019 2020 2021 2022 2023 2024 2025
Hiring Difficulty Index
easy market
difficultsome
challengessome
challengessome
challengesdifficult
some challenges
some challenges
some challenges
some challenges
some challenges
some challenges
some challenges
Employment 250,975 255,165 262,953 258,255 257,670 258,870 261,049 262,743 264,329 265,804 267,921 269,683 271,301
Expansion Demand 6,698 4,364 8,261 -5,103 -724 1,179 2,224 1,708 1,597 1,479 2,156 1,786 1,632
Replacement Demand
6,268 6,526 6,472 6,666 6,685 6,718 6,757 6,797 6,818 6,834 6,849 6,867 6,886
Job Openings 12,966 10,889 14,732 1,561 5,964 7,897 8,982 8,506 8,414 8,313 9,006 8,651 8,514
Net New Positions – 4,190 7,788 -4,698 -585 1,200 2,179 1,694 1,586 1,475 2,117 1,762 1,618
Labour Force Supply
266,887 271,209 281,255 279,404 279,085 279,980 281,708 283,152 284,546 285,953 287,805 289,494 291,001
Net New Supply 13,263 10,844 16,514 4,816 6,367 7,614 8,484 8,238 8,212 8,242 8,701 8,556 8,389
New Entrants 5,354 5,314 5,459 5,318 5,195 5,153 5,144 5,100 5,116 5,174 5,258 5,285 5,298
Intl. Mobility -1,756 20,009 3,429 899 1,388 1,025 1,487 1,381 1,261 955 1,202 1,251 1,344
Mobility 427 3,027 1,623 -99 -743 -175 37 339 692 889 954 856 664
Labour Force Mobility
9,238 -17,506 6,003 -1,302 527 1,611 1,816 1,418 1,143 1,224 1,287 1,164 1,083
Average Age 44 43 43 43 43 43 43 43 43 43 43 43 43
Market Tightness 4 4 3 3 3 3 3 3 3 3 3 3 3
Mobilitymoving
inmoving
inmoving
infewer jobs
fewer jobs
low leaving
moving in
moving in
moving in
moving in
moving in
moving in
moving in
Supply Lag low low low low low medium medium medium low low medium low low
Intl. Reliance none extreme medium medium medium medium medium medium medium medium medium medium medium
Loss of Experience medium medium medium high high high high high high high high high high
Data Tables by Sector and Economic Scenario: The Asia Pacific Gateway CorridorAppendix C

65 Asia Pacific Gateway Corridor Transportation Labour Market Outlook for the Asia Pacific Gateway Corridor 2016–2025
Trucking Sector — Moderate Investment Scenario
Historical Data Forecast
2016 2017 2018 2016 2017 2018 2019 2020 2021 2022 2023 2024 2025
Hiring Difficulty Index
easy market
difficultsome
challenges easy
marketsome
challengessome
challengessome
challengessome
challengessome
challengessome
challengessome
challengessome
challengessome
challenges
Employment 250,975 255,165 262,953 259,854 261,410 264,365 267,169 269,933 272,792 274,987 276,934 278,120 279,186
Expansion Demand 6,698 4,364 8,261 -3,401 1,558 3,045 2,885 2,845 2,945 2,237 1,977 1,175 1,043
Replacement Demand
6,268 6,526 6,472 6,665 6,710 6,770 6,825 6,866 6,901 6,928 6,949 6,970 6,984
Job Openings 12,966 10,889 14,732 3,263 8,268 9,813 9,709 9,710 9,844 9,164 8,929 8,143 8,027
Net New Positions – 4190 7788 -3099 1556 2955 2804 2764 2859 2195 1947 1186 1066
Labour Force Supply
266,887 271,209 281,255 280,394 281,488 283,640 285,907 288,163 290,640 292,752 294,760 296,288 297,590
Net New Supply 13,263 10,844 16,514 5,801 7,811 8,919 9,090 9,121 9,374 9,043 8,956 8,497 8,288
New Entrants 5,354 5,314 5,459 5,335 5,238 5,216 5,218 5,187 5,222 5,293 5,378 5,405 5,412
Intl. Mobility -1,756 20,009 3,429 -168 580 1,529 1,669 1,799 1,828 1,229 1,276 1,295 1,351
Mobility 427 3027 1623 470 396 200 337 558 1072 1277 1128 819 567
Labour Force Mobility
9238 -17506 6003 164 1597 1974 1866 1577 1252 1244 1174 978 958
Average Age 44 43 43 43 43 43 43 43 43 43 43 43 43
Market Tightness 4 4 3 3 3 3 3 3 3 3 3 3 3
Mobilitymoving
inmoving
inmoving
inmoving
inmoving
inmoving
inmoving
inmoving
inmoving
inmoving
inmoving
inmoving
inmoving
in
Supply Lag low low low low medium high medium medium medium low low low low
Intl. Reliance none extreme medium none low medium medium medium medium medium medium medium medium
Loss of Experience medium medium medium high high medium high high high high high high high
Data Tables by Sector and Economic Scenario: The Asia Pacific Gateway CorridorAppendix C

66 Asia Pacific Gateway Corridor Transportation Labour Market Outlook for the Asia Pacific Gateway Corridor 2016–2025
Trucking Sector — High Investment Scenario
Historical Data Forecast
2016 2017 2018 2016 2017 2018 2019 2020 2021 2022 2023 2024 2025
Hiring Difficulty Index
easy market
difficultsome
challengesdifficult
some challenges
difficultsome
challengessome
challengessome
challengesdifficult
some challenges
some challenges
difficult
Employment 250,975 255,165 262,953 263,510 268,460 273,027 276,446 279,044 281,705 283,295 283,377 283,721 284,303
Expansion Demand 6,698 4,364 8,261 492 5,167 4,757 3,539 2,670 2,732 1,596 -4 276 528
Replacement Demand
6,268 6,526 6,472 6,664 6,287 6,398 6,491 6,569 6,633 6,701 6,741 6,776 6,818
Job Openings 12,966 10,889 14,732 7,153 11,454 11,153 10,031 9,236 9,363 8,296 6,736 7,053 7,346
Net New Positions – 4,190 7,788 557 4,950 4,567 3,419 2,598 2,661 1,590 82 344 582
Labour Force Supply
266,887 271,209 281,255 282,490 285,906 289,431 292,397 294,875 297,629 299,648 300,783 301,867 302,890
Net New Supply 13,263 10,844 16,514 7,895 9,707 9,924 9,454 9,048 9,386 8,721 7,874 7,862 7,840
New Entrants 5,354 5,314 5,459 5,371 5,308 5,312 5,331 5,307 5,350 5,418 5,487 5,503 5,502
Intl. Mobility -1,756 20,009 3,429 29,804 941 1,496 1,696 1,873 1,636 2,377 1,484 768 6,553
Mobility 427 3,027 1,623 517 973 867 630 490 770 615 442 752 -5,090
Labour Force Mobility
9,238 -17,506 6,003 -27,797 2,485 2,249 1,797 1,378 1,630 311 461 839 875
Average Age 44 43 43 43 43 43 43 43 43 43 43 43 43
Market Tightness 4 4 3 3 3 4 4 4 4 4 4 3 3
Mobilitymoving
inmoving
inmoving
inmoving
inmoving
inmoving
inmoving
inmoving
inmoving
inmoving
inmoving
inmoving
inextreme leaving
Supply Lag low low low low high high medium low low low low low low
Intl. Reliance none extreme medium extreme low medium medium medium medium high medium low extreme
Loss of Experience medium medium medium high medium medium medium high high high high high high
Data Tables by Sector and Economic Scenario: The Asia Pacific Gateway CorridorAppendix C

67 Asia Pacific Gateway Corridor Transportation Labour Market Outlook for the Asia Pacific Gateway Corridor 2016–2025
Appendix D The Asia Pacific Gateway Corridor Occupations
NOC Sector Occupation Title
1. 0016 Air, Rail, Trucking Senior Managers – Construction, Transportation, Production and Utilities
2. 0113 Logistics Purchasing Managers
3. 0714 Air, Rail Facility Operation and Maintenance Managers
4. 0731 Air, Logistics, Rail, Trucking Managers in Transportation
5. 1215 Logistics Supervisors, Supply chain, Tracking and Scheduling Co-ordination Occupations
6. 1225 Logistics Purchasing Agents and Officers
7. 1315 Logistics Customs, Ship and Other Brokers
8. 1521 Logistics Shippers and Receivers
9. 1523 Logistics Production Logistics Co-ordinators
10. 1524 Logistics Purchasing and Inventory Control Workers
11. 1525 Air, Rail, Trucking Dispatchers
12. 1526 Air, Rail, Trucking Transportation Route and Crew Schedulers
13. 2131 Air, Rail Civil Engineers
14. 2231 Rail Civil Engineering Technologists and Technicians
15. 2241 Air, Rail, Trucking Electrical and Electronics Engineering Technologists and Technicians
16. 2243 Air, Rail, Trucking Industrial Instrument Technicians and Mechanics
17. 2261 Air, Rail Non-destructive Testers and Inspection Technicians
18. 2262 Air, Logistics, Rail, Trucking Engineering Inspectors and Regulatory Officers
19. 2263 Air, Logistics, Rail, Trucking Inspectors in Public and Environmental Health and Occupational Health and Safety
20. 2271 Air Air Pilots, Flight Engineers and Flying Instructors
21. 6222 Logistics Retail and Wholesale Buyers
22. 7231 Air Machinists and Machining and Tooling Inspectors
23. 7242 Rail, Trucking Industrial Electricians
24. 7304 Rail Supervisors, Railway Transport Operations
25. 7305 Trucking Supervisors, Motor Transport and Other Ground Transit Operators
26. 7311 Air, Rail Construction Millwrights and Industrial Mechanics
27. 7314 Rail Railway Carmen/women
28. 7315 Air Aircraft Mechanics and Aircraft Inspectors
29. 7321 Trucking Automotive Service Technicians, Truck and Bus Mechanics and Mechanical Repairers
30. 7361 Rail Railway and Yard Locomotive Engineers
31. 7362 Rail Railway Conductors and Brakemen/women
32. 7452 Logistics Material Handlers
33. 7511 Trucking Transport Truck Drivers
34. 7531 Rail Railway Track Maintenance Workers
APPENDIXD THEASIAPACIFICGATEWAYCORRIDOROCCUPATIONS

#407 – 55 Water Street Vancouver, BC V6B 1A1— O: 604.684.1471 E: [email protected] —
www.apgst.ca— www.lmionline.ca
Transportation Labour Market Outlook for the Asia Pacific Gateway Corridor 2016–2025 —Prepared by Asia Pacific Gateway Skills Table© May 2016