transportation demand management (tdm)...
TRANSCRIPT

TRANSPORTATION DEMAND MANAGEMENT (TDM) GUIDANCE
Vermont Agency of Transportation
Policy, Planning, and Intermodal Development Division
One National Life Drive
Montpelier, VT 05633‐5001
802‐828‐2784
www.aot.state.vt.us
February 2016

Transportation Demand Management (TDM) Guidance February 2017
VTrans Policy & Planning Page i
Table of Contents
1.0 Introduction ....................................................................................................... 1
1.1 Purpose of This Guidance .............................................................................. 1
1.2 Implementation of the Guidance ..................................................................... 1
1.3 Audience ..................................................................................................... 2
1.4 Overview – How to Use This Guide .................................................................. 2
2.0 Overview of TDM in Vermont .............................................................................. 4
2.1 What Is Transportation Demand Management? ................................................. 4
2.2 A Brief History of TDM ................................................................................... 4
2.3 TDM Measures for Vermont ............................................................................ 5
2.4 Effectiveness of TDM Strategies ...................................................................... 6
2.5 Who Implements TDM? ................................................................................. 6
3.0 Process for Obtaining Trip Reduction Credits for TDM ........................................ 9
4.0 Allowable Trip Reductions for TDM ................................................................... 11
4.1 Trip Reduction Credits by TDM Measure and Area Type .................................... 11
4.2 Option to Join a TMA ................................................................................... 12
4.3 Accounting for Internal Trip Capture and Pass-by Trips .................................... 13
5.0 Documenting TDM Commitments ..................................................................... 18
6.0 Monitoring Compliance with Commitments ...................................................... 20
6.1 TDM Implementation Reporting .................................................................... 20
6.2 Enforcing TDM Commitments ....................................................................... 20
6.3 Monitoring Effectiveness of TDM Measures ..................................................... 21
Acknowledgments .................................................................................................... 23
Appendix A. Trip Reductions from the Literature and Other Practice Examples ..... 24
A.1 Exhibits .................................................................................................... 29

February 2017 Transportation Demand Management (TDM) Guidance
Page ii VTrans Policy & Planning
List of Tables
Table 2.1 TDM Measures Appropriate for Vermont ....................................................... 5
Table 2.2 Agencies Supporting TDM in Vermont .......................................................... 7
Table 2.3 Local and Regional Transit Service Providers in Vermont .................................. 8
Table 4.1 Allowable Trip Reductions ........................................................................ 15
Table A.1 Trip or VMT Reductions from the Literature and Other Practice Examples ........ 27
List of Figures
Figure 3.1 Process for Obtaining Trip Reduction Credits for TDM ..................................... 9

Transportation Demand Management (TDM) Guidance February 2017
VTrans Policy & Planning Page 1
1.0 Introduction
1.1 Purpose of This Guidance
The purpose of this Transportation Demand Management (TDM) Guidance document is to provide guidance on how to estimate vehicle trip reductions from TDM measures implemented for new developments. These estimates may inform adjustments to any impact or mitigation fee paid under Act 250 and/or Act 145 proportional to traffic generated by the site.
VTrans’ Traffic Impact Study (TIS) Guidelines recommend that TDM measures, such as vanpools, ridesharing, flextime, etc., be considered as part of traffic mitigation measures for new development.1 In addition, the agency’s Level of Service (LOS) Policy notes that TDM strategies may be used to mitigate traffic impacts when geometric improvements are not sufficient to maintain an acceptable level of service.2
This guidance provides a tool to help estimate the potential reduction in vehicle trip generation for TDM strategies in different contexts but is not an adopted policy or standard of the Vermont Agency of Transportation.
Transportation demand management provides a number of benefits that support state goals and benefit Vermont’s residents and businesses. The benefits of TDM include:
Helping to mitigate the traffic impacts of new development, in ways that may be less costly and/or less impactive to the community than roadway capacity increases;
Benefiting Vermont’s economy and environment by reducing air pollutant and greenhouse gas emissions, saving energy, and reducing costs and environmental impacts associated with parking; and
Expanding the range of options for commuting and other travel, benefiting Vermont’s residents through improved mobility and businesses through improved access to workers.
1.2 Implementation of the Guidance
Developers proposing a project subject to review under a municipal development review process or Act 250 may propose to reduce their project’s estimated trip generation by incorporating TDM measures in the design of the project, and/or by establishing commitments for the property owner or manager to continue to implement TDM measures serving occupants of the site. Any such commitment may be incorporated as conditions in Act 250 or municipal land use permits.
1 Vermont Agency of Transportation, Traffic Impact Study Guidelines, 2008. 2 Vermont Agency of Transportation, Highway Design “Level of Service” Policy, 2007.

February 2017 Transportation Demand Management (TDM) Guidance
Page 2 VTrans Policy & Planning
The guidance sets forth recommended trip rate reductions, expressed as a percentage reduction relative to rates computed from the Institute of Transportation Engineers (ITE) Trip Generation Manual. Reductions are provided for individual TDM measures and for combinations of measures. The recommended trip rate reductions vary depending upon the area type/geographic context, reflecting the fact that it is easier to reduce vehicle trips in areas with a mix of uses in close proximity and with good transit service. Different land use types also may have different sets of appropriate TDM measures.
Any provisions for monitoring and enforcing compliance with a developer’s TDM commitments may be included in Act 250 or municipal land use permit conditions. This guidance recommends reporting to track implementation of commitments at the end of the first and third year after an occupancy permit is issued, at which time the overall effectiveness of the TDM measure should be evaluated and adjustments made if necessary. Monitoring of actual trip generation rates is not required.
1.3 Audience
The guidance is intended for use by:
Developers and their consultants preparing traffic impact studies and developing traffic mitigation measures;
VTrans staff reviewing traffic impact studies and permitting requests;
Act 250 District Commissions, to assist in reviewing traffic impact studies and permitting requests; and
Regional planning commissions (RPC), municipalities, and others who also may want to estimate potential benefits of TDM measures.
1.4 Overview – How to Use This Guide
Section 2.0 provides an introduction to TDM, describes TDM strategies appropriate to Vermont, summarizes evidence on effectiveness, and identifies Vermont resources for TDM implementation. It is intended as an aid for developers and others crafting a TDM program, and for VTrans staff, or others evaluating the appropriateness of proposed measures.
Section 3.0 provides a flowchart of the steps a developer should take in order to obtain trip reduction credits for TDM measures.
Section 4.0 provides tables showing recommended trip reductions for different TDM measures. This section is the core reference for developers, consultants, and VTrans staff to determine TDM credits in traffic impact analysis and mitigation studies.

Transportation Demand Management (TDM) Guidance February 2017
VTrans Policy & Planning Page 3
Section 5.0 discusses how TDM commitments should be documented to provide confidence that the projected traffic reductions will be achieved.
Section 6.0 discusses how Act 250 District Commissions, with the support of VTrans and/or other implementing agencies, can monitor compliance with TDM commitments to ensure that trip reductions are sustained over time.
Appendix A provides supporting information from the literature on the trip reductions that might be expected from different TDM measures, along with examples of other jurisdictions that have applied trip reduction credits for TDM.

February 2017 Transportation Demand Management (TDM) Guidance
Page 4 VTrans Policy & Planning
2.0 Overview of TDM in Vermont
2.1 What Is Transportation Demand Management?
“Transportation demand management” can be defined as a broad set of strategies that strive to either reduce or reallocate automobile travel to achieve benefits such as reduced roadway congestion, improved air quality, reduced energy use and greenhouse gas emissions, reduced parking demand, improved public health for those biking or walking, and reduced commuting and travel costs.
TDM may include the following types of strategies:
Physical – The infrastructure required to support mode shift or trip reduction, e.g., parking reductions, pedestrian and bicycle infrastructure, transit facilities, on-site amenities;
Operational – Actions to facilitate mode shift or trip reduction, e.g., ridematching software, transit services, real-time travel information;
Financial – Using economics to affect trip choice, e.g., parking pricing, cash-out, pretax or discounted transit passes; and
Organizational – Efforts that bring activities and institutions together to implement TDM, e.g., education and information distribution, employer promotion of telework or alternative work schedules, land use planning, and transportation management associations (TMA).
2.2 A Brief History of TDM
TDM has been implemented in the U.S. since the oil crises in the 1970s. The early focus was on ridesharing, vanpooling, transit, and nonmotorized travel. Interest has waxed and waned over the years depending upon fuel prices, traffic congestion, and policy initiatives related to air quality and climate change. Over time, technology has expanded the range of TDM options. Telecommuting and alternative work schedules are now widely feasible. Within the past few years, multimodal traveler information has become much more prevalent. Information technology has enabled new services such as bikesharing, carsharing, real-time ridematching, and transportation network companies, as well as personalized travel planning and rewards systems.
TDM strategies are often implemented in large urban areas that have significant traffic and/or air quality problems. However, many TDM strategies are relevant to smaller cities, towns, and even rural areas, such as are found in Vermont. TDM is most effective when it provides alternatives to driving alone that are attractive from a time, cost, and/or convenience standpoint. Long trip distances, localized congestion, limited parking at some destinations, and rising fuel costs are all factors potentially supporting TDM in Vermont, as are compact, walkable communities, and environmental values held by residents.

Transportation Demand Management (TDM) Guidance February 2017
VTrans Policy & Planning Page 5
2.3 TDM Measures for Vermont
Table 2.1 provides an overview of common TDM measures that may be appropriate at sites in Vermont. Some of these may be applicable to any new development. Others may be relevant at larger sites (e.g., at least 25,000 to 50,000 square feet of commercial space, 50 to 100 workers, or 30 to 50 dwelling units) where there is a “critical mass” of workers, residents, or other travelers to support services such as transit. This could include multiple smaller buildings that are adjacent to or within easy walking distance of each other, or multiple employers in a single larger building.
Table 2.1 TDM Measures Appropriate for Vermont
Measure Description/Examples
Physical Measures
Transit site design and access improvements
Bus stop, shelter, pedestrian walkways to transit, site design to support transit access
Bicycle facilities Secure/protected bicycle parking, showers/changing facilities, access paths/routes
Building amenities Café/convenience store, business center, ATM, wiring for ease of telework, etc.
Parking management Limited parking supply (usually implemented in conjunction with pricing) or shared with neighboring uses
Mixed-use/quality pedestrian environment
Colocation with retail/services; sidewalks/internal connectivity
Operational Measures
Modified work schedules Flextime, compressed work week, telecommute
Preferential parking For carpools and vanpools
Carpool and vanpool programs Ridematching services, vanpool services and subsidies, guaranteed ride home
Carsharing, bikesharing, e-bikes
Shared vehicles provided for the use of residents, workers, and visitors
Transit service/shuttle Service to areas of trip origins, stop for existing transit service
Financial Measures
Incentive/reward programs Rewards for participation in alternative travel – prizes, drawings, commuter clubs
Parking pricing Paid parking, cash-out, unbundled from lease or rent costs
Transit incentives Discounted or pretax transit passes, corporate pass programs
Organizational Measures
Marketing/information program
Providing information to building tenants on travel options, events/fairs, designated transportation coordinator

February 2017 Transportation Demand Management (TDM) Guidance
Page 6 VTrans Policy & Planning
Many of the measures are primarily implemented at commercial locations, especially offices and institutional uses such as medical and educational. However, some TDM measures are also appropriate for retail, industrial, residential, and or lodging uses. Table 4.1 in Section 4.0 provides additional guidance on which measures are most applicable by land use and size of the site.
2.4 Effectiveness of TDM Strategies
Considerable literature exists evaluating the effectiveness of TDM strategies. Effectiveness is often distinguished according to the level of transit service, with many (but not all) TDM strategies being more effective in areas with high levels of transit service (high-frequency bus or rail, providing access to many residences and jobs) than in areas with lesser or no service. Vermont does not have any areas of “high” transit service as characterized in the literature (rail or bus rapid transit), but some cities and towns are served by “moderate” transit service characterized by peak bus headways of 20 to 30 minutes. Other contextual factors supporting effective TDM include walkable, mixed-use environments, where people can make short trips (such as midday or post-work errands) without a car; high levels of traffic congestion; and paid parking.
Overall, purely information and promotional strategies have been found to have the lowest impact on their own (up to a 3 to 5 percent reduction in vehicle trips). Alternative commute services, such as transit, ridesharing, and vanpooling services, can collectively have trip reduction impacts of up to 10 percent in moderate transit service areas. Financial incentives can have the largest impact, up to 15 percent in moderate transit service areas. Combined effects of strategies are greater if there is a cost for parking at the site. Combined effects in areas with low transit service are more modest, ranging from around 3 to 7 percent, since travel options tend to be limited to ridesharing and alternative work schedules. However, the literature also cautions that the effectiveness of any individual (or combined) TDM measures can vary widely based on characteristics of the specific site, its occupants/travelers and travel markets, its geographic context, and how the strategy is implemented (e.g., how aggressively is it promoted).3
Appendix A provides additional detail on evidence on the effects of individual TDM measures.
2.5 Who Implements TDM?
Different parties may be responsible for implementing different types of strategies.
Physical strategies are typically implemented by the developer (as part of new development) or the property owner (as part of improvements to existing property).
Operational strategies may be implemented by a property management company, tenant, or association of tenants (e.g., local ridematching or vanpooling arrangement). They may also be implemented by off-site service providers, such as a transit agency, ridematching
3 Cambridge Systematics, UrbanTrans, and ESTC Inc. for Fairfax County (Virginia) DOT (2010).

Transportation Demand Management (TDM) Guidance February 2017
VTrans Policy & Planning Page 7
brokerage, commercial vanpool operator, carshare or bikeshare operator, or TMA serving businesses and institutions in a defined geographic area.
Financial strategies may be implemented by a property owner or manager (e.g., parking pricing), business (e.g., subsidized transit passes for employees), or by the service provider.
Organizational strategies may be implemented from any level (from a business or property manager to a regional or state agency) and often involve cooperation across multiple agencies.
There are a number of organizations supporting TDM in Vermont. Table 2.2 shows existing organizations, their service areas, and services provided. These agencies can serve as resources in defining a locally appropriate TDM program. Table 2.3 provides a list of transit service providers that provide both fixed-route and demand-responsive services.
Table 2.2 Agencies Supporting TDM in Vermont
Agency/Program Services Provided Geographic Area Served
Chittenden Area Transportation Management Association (CATMA)
Tailored employee commute programs, travel option information, employee transportation coordinator network, information/outreach, data collection
Chittenden County/Metropolitan Area
Upper Valley TMA Tailored employee commute programs, travel option information, data collection, other information/outreach
Upper Valley (Hanover, Lebanon, White River Junction, etc.)
Go! Chittenden County Travel and commute option information/resources and outreach/educational events
Chittenden County
Carsharing – Nonprofit and for-profit providers (e.g., Carshare Vermont, ZipCar)
Carsharing Various communities
Local Motion Bicycling and walking education, information, and advocacy
Statewide
VTrans/Go! Vermont Public transit operating assistance, Go! Vermont carpool-matching and vanpool services, bus and biking information
Statewide

February 2017 Transportation Demand Management (TDM) Guidance
Page 8 VTrans Policy & Planning
Table 2.3 Local and Regional Transit Service Providers in Vermont
Agency Service Area
Chittenden County Transit Authority Chittenden County
Advance Transit Upper Valley, including Norwich and White River Junction
Addison County Transit Resources Middlebury Area
Southeast Vermont Transit Windham and Southern Windsor Counties
Green Mountain Community Network, Inc. Bennington County
Green Mountain Transit Agency Central Vermont and the Franklin/Grand Isle region
Marble Valley Regional Transit District Rutland County and Manchester (Bennington County)
Rural Community Transportation Northeast Kingdom
Stagecoach Transportation Services, Inc. Northern Windsor and Orange Counties

Transportation Demand Management (TDM) Guidance February 2017
VTrans Policy & Planning Page 9
3.0 Process for Obtaining Trip Reduction Credits for TDM
A developer wishing to take credit for TDM measures should take the steps illustrated in Figure 3.1 and described below.
Figure 3.1 Process for Obtaining Trip Reduction Credits for TDM
1. Determine area type, land use, and project size. The area type describes whether the area is mixed-use or single-use and the level of transit accessibility. This will affect the recommended TDM credits and also possibly the appropriate TDM strategies. Area type definitions are provided in Section 4.1. The type of land use (e.g., residential, commercial office, retail, industrial) and size of the development may also affect which TDM strategies are most appropriate to implement. Table 4.1 identifies which TDM strategies are most appropriate by land use type and size, and provides trip reduction rates that vary by area type.
2. Select appropriate TDM measures. TDM measures may be selected from the list in Table 4.1, considering site-specific needs and implementation responsibilities. The
1. Determine area type, land use, and project size
2. Select appropriate TDM
measures3. Look up percent
reductions
4. Develop TDM Implementation Plan
5. Submit to District Commission as part
of Act 250 application for
review and approval
6. Implement TDM measures
7. Submit TDM Implementation Progress Reports
8. Adjust program if necessary

February 2017 Transportation Demand Management (TDM) Guidance
Page 10 VTrans Policy & Planning
developer may wish to consult with a local TMA if they are in a TMA service area, or with other resource agencies listed in Tables 2.2 and 2.3.
3. Look up percent reductions from Table 4.1. The developer can determine the estimated trip reductions by adding the percentages shown in Table 4.1 for their selected measures. Estimated reductions will vary by area type. The developer may propose other TDM measure not shown, along with an estimated trip reduction percentage and a justification of this estimate.
4. Develop a TDM/Trip Reduction Plan. The TDM/Trip Reduction Plan explains what TDM measures will be implemented, by whom, and how implementation will be monitored. Section 5.0 provides a sample outline.
5. Submit the TDM/Trip Reduction Plan to the Act 250 District Commission, or municipal development review board, as part of the developer’s permit application. The Commission or DRB will review the application and, with input from VTrans or other professional staff, will determine whether it is appropriate to provide the requested trip reduction credits. The Commission or DRB will determine the adjusted impact fee and set any conditions for monitoring and enforcement of commitments.
6. Implement TDM measures. Physical measures should be incorporated in the design of the building and site improvements. Operational, financial, and institutional measures should be implemented once an occupancy permit is granted.
7. Submit TDM Implementation Progress Reports. Progress reports should be submitted after one and three years of building occupancy or as set forth in the Act 250 or local permit, as described in Section 6.0.
8. Adjust program if necessary. If TDM measures are not being implemented as planned or are ineffective, adjustments may be needed to the measures implemented, as described in Section 6.0.

Transportation Demand Management (TDM) Guidance February 2017
VTrans Policy & Planning Page 11
4.0 Allowable Trip Reductions for TDM
4.1 Trip Reduction Credits by TDM Measure and Area Type
Table 4.1 shows recommended allowable trip reduction credits for TDM measures in Vermont. These credits are expressed as a percentage of PM peak period vehicle trips as estimated for the corresponding land use(s) using the latest version of the ITE Trip Generation manual. The resulting number of vehicle trips should be rounded to the nearest trip for the purpose of calculating an impact fee.
The credits may be adjusted at the discretion of the District Commission (with input from VTrans) if the developer provides evidence supporting a higher effectiveness estimate or if VTrans or the District Commission has reason to believe that a higher or lower trip reduction would be achieved. Lower amounts of credits may be assigned, for example, for partial implementation of a measure (e.g., if only half the workers at the site are expected to be eligible for telecommuting or compressed work schedules). Maximum combined credit levels for different types of measures are also provided. Finally, rather than (or in addition to) accounting for credits from individual TDM measures, a developer may also join a transportation management association and take credit for the services provided by the TMA, as discussed in Section 4.2.
Table 4.1 also shows for which land use types the measure may receive credits. In some cases, credits may only be applied to the fraction of trips generated by workers (for example, commute-focused measures at a retail or lodging site). Finally, Table 4.1 suggests whether the measure is likely to be appropriate at any site or at larger sites only.
Different trip reduction credits are recommended for three different area types. These area types are:
1. Mixed-Use/Moderate Transit – Mixed-use downtown, neighborhood, or college campus (see mixed-use definition below) with peak-hour transit headways of 30 minutes or less on a single route.
2. Mixed-Use/Low Transit – Mixed-use downtown, neighborhood, or college campus with peak-hour transit headways greater than 30 minutes.
3. Other – Single-use environment.
A proposed development site is considered to be in a mixed-use area if it meets at least one of the following criteria:
Located in an “urban area” as defined by the U.S. Census Bureau for the 2010 Census and having a Walk Score greater than 60;
Located in an “urban area” as defined by the U.S. Census Bureau for the 2010 Census and at least 10 destinations (restaurants, coffee shops, bars, grocery stores, parks, schools,

February 2017 Transportation Demand Management (TDM) Guidance
Page 12 VTrans Policy & Planning
shopping, entertainment, banks, pharmacies, small businesses, medical facilities) within a quarter-mile walk of building entrances at the proposed development, linked with complete pedestrian facilities; or
Located in a Planned Growth Area as identified in a regional plan. Each regional planning commission may have a slightly different term to define an area planned for growth. However, this represents the shared goal to plan development in order to maintain the historic settlement pattern of compact village and urban centers separated by rural countryside. For more information see V.S.A. §4301-4498.
4.2 Option to Join a TMA
A transportation management association is a nonprofit organization that provides transportation services to institutional members of the association. TMAs active in Vermont in 2015 included the Chittenden Area and Upper Valley TMAs (Table 2.3). These organizations provide a variety of services, including tailored employee commute programs, an employee transportation coordinator network, travel option information, ridematching, a guaranteed ride home program, negotiated transit pass discounts with transit providers, participation in third-party financial incentives and rewards programs, and data collection such as employee mode share surveys.
A developer may propose to join a TMA rather than implementing the individual programs and services that would be provided by that TMA. The recommended trip reduction credit for joining the TMA is greater than the sum of the credits for the individual services offered by Vermont’s TMAs.
An annual membership fee is required to join a TMA. However, participation in the TMA can provide significant benefits to developers, property managers, and tenants. These benefits include:
The TMA provides a prepackaged suite of services to assist employees with commute options, as well as staff with expertise in designing and implementing TDM measures appropriate for a specific organization, saving the property manager effort and supporting a more effective program;
The TDM implementation plan and trip reduction calculation is greatly simplified, as joining a TMA can substitute for multiple individual measures that would otherwise be the responsibility of the developer and subsequent property managers; and
The TMA can provide program reports that substitute for or supplement the TDM implementation report described in Section 6.0.
Joining a TMA can substitute for many of the operational, financial, and organizational measures listed in Table 4.1. A developer will still want to build in physical measures such as bus stops, walk and bike access, and parking management, and may want to commit to operational or financial measures beyond those offered by the TMA (e.g., deep-discount transit

Transportation Demand Management (TDM) Guidance February 2017
VTrans Policy & Planning Page 13
passes, commitment to flexible work schedules, bikeshare station). Additional credits can be provided for these measures. However, additional credits would not be provided for any measures already included in the TMA’s service bundle.
4.3 Accounting for Internal Trip Capture and Pass-by Trips
Internal Trip Capture
When a development contains a mix of uses located close together in a walkable setting, conditions exist where people need not leave the site to satisfy multiple trip-making needs. ITE classifies such a development as a “Multiuse Development” and publishes data on typical internal capture rates between residential, retail, and office land uses.
When internal trip capture is calculated to reduce vehicle-trips to the site, this calculation should be performed before the TDM trip reduction credits are applied. The TDM measure would then be assumed to reduce additional trips on a percentage basis from the new baseline (i.e., after internal trip capture).
The TDM measure effectiveness would be estimated using the same area type criteria as defined in Section 3.1. If the development is in an area meeting at least one of the criteria for mixed-use, trip reductions would be selected consistent with that area type. If the development captures some internal trips but does not meet the mixed-use area type criteria, TDM reductions would be selected from the “other” area type column.
An example can be provided based on the Killington Village Phase I Master Plan.4 The study projected that 105 peak-hour trips would be completed internal to the village, with the remaining 173 trips completed external to the project site. While the project itself is mixed-use, it is not located in a broader mixed-use area; therefore the area type is “other.” Assume that the developer committed to providing the following TDM measures:
Bus stop with shelter – 0.5 percent;
Design site to support transit and walk access – 1 percent;
Secure bicycle parking – 1 percent;
Off-site path improvements – 1 percent;
Ridematching (for employees) – 1 percent; and
Partial transit subsidy (for employees) – 0.5 percent.
These TDM measures would provide an additional 5 percent reduction in external trips, or 9 trips reduced for a new total external peak-hour trips of 164.
4 RSG, Inc. Phase I Killington Village Master Plan Traffic Impact Study. December 2011, modified April 2012.

February 2017 Transportation Demand Management (TDM) Guidance
Page 14 VTrans Policy & Planning
Note that it would not be appropriate to take TDM credit for on-site amenities or for shared parking, as these characteristics are inherent in a mixed-use development and will be accounted for in the internal trip capture estimates.
Pass-by Trips
Buildings such as retail establishments, certain restaurants, banks, service stations, and convenience markets attract some of their traffic from the passing stream of traffic rather than as new trips to the destination. The ITE Trip Generation Manual recommends adjustments to trip generation rates to account for pass-by traffic.
Pass-by traffic is primarily generated at retail sites where TDM measures may have limited potential. However, if TDM credits are being requested at a site where reductions for pass-by traffic are also considered, the TDM reductions should be applied (on a percentage basis) to the new external trip generation estimates developed after the pass-by factors have been applied. This would be similar to the application of TDM credits to sites with internal capture as illustrated above.

Transportatio
n Dem
and M
anage
men
t (TDM) G
uidance
March
2016
VTran
s Policy &
Plan
ning
Page 1
5
Table 4.1 Allowable Trip Reductions Percent of PM Peak
Percent Trip Reduction Applicable Land Uses
Applicable Sitesa
TDM Measure Mix
ed-U
se/
M
oder
ate
Tran
sit
Mix
ed-U
se/
Lo
w T
ran
sit
Oth
er
Off
ice
– M
edic
al –
In
stit
uti
onal
Ind
ust
rial
Res
iden
tial
Ret
ail
Lod
gin
g
An
y S
ite
Larg
er S
ites
Notes
Physical
Bus stop with shelter 2% 1% 0.5% b Provided on-site or within 600-foot walk of building entrance
Design site to support transit and walk access
4% 2% 1% Front setback <20 feet from street, main entrance fronting on street with transit service, direct pedestrian connection to bus stop
Secure bicycle parking 1% 1% 1% b b Lockers or indoor parking (in addition to racks for short-term parking)
Bicycle racks only 0.5% 0.5% 0.5% b
Showers and lockers 1% 1% 1% b b
Sidewalk or shared-use path improvements
2% 2% 1% On-site sidewalk improvements might be considered a basic requirement
Parking supply management (provide <min or requirements met through shared parking)
5% 4% 3% Alternatively, trips may be reduced in proportion to reduction parking provided below minimum requirements
On-site amenities 1% 1% 1% Café/convenience store, business center, ATM, wiring for ease of telework, etc.
March
2016
Transportatio
n Dem
and M
anage
men
t (TDM) G
uidance
Page 1
6
VTran
s Policy &
Plan
ning
Percent Trip Reduction Applicable Land Uses
Applicable Sitesa
TDM Measure Mix
ed-U
se/
M
oder
ate
Tran
sit
Mix
ed-U
se/
Lo
w T
ran
sit
Oth
er
Off
ice
– M
edic
al –
In
stit
uti
onal
Ind
ust
rial
Res
iden
tial
Ret
ail
Lod
gin
g
An
y S
ite
Larg
er S
ites
Notes
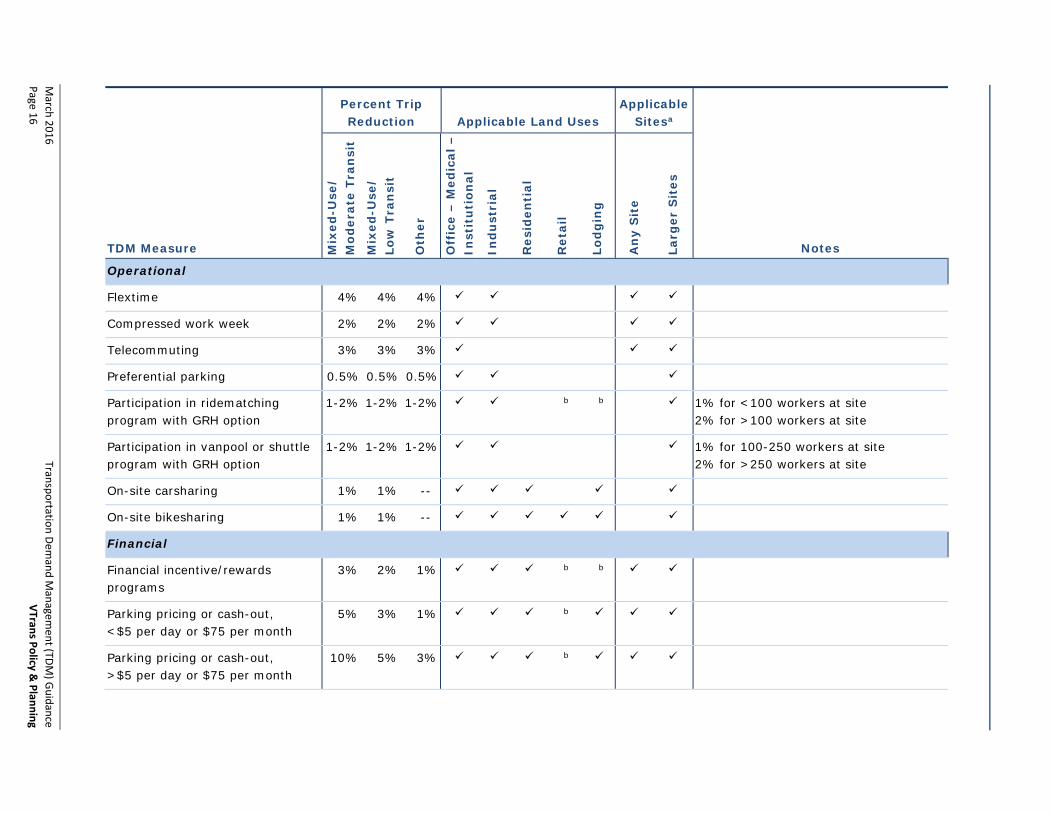
Operational
Flextime 4% 4% 4%
Compressed work week 2% 2% 2%
Telecommuting 3% 3% 3%
Preferential parking 0.5% 0.5% 0.5%
Participation in ridematching program with GRH option
1-2% 1-2% 1-2% b b 1% for <100 workers at site 2% for >100 workers at site
Participation in vanpool or shuttle program with GRH option
1-2% 1-2% 1-2% 1% for 100-250 workers at site 2% for >250 workers at site
On-site carsharing 1% 1% --
On-site bikesharing 1% 1% --
Financial
Financial incentive/rewards programs
3% 2% 1% b b
Parking pricing or cash-out, <$5 per day or $75 per month
5% 3% 1% b
Parking pricing or cash-out, >$5 per day or $75 per month
10% 5% 3% b

Transportatio
n Dem
and M
anage
men
t (TDM) G
uidance
March
2016
VTran
s Policy &
Plan
ning
Page 1
7
Percent Trip Reduction Applicable Land Uses
Applicable Sitesa
TDM Measure Mix
ed-U
se/
M
oder
ate
Tran
sit
Mix
ed-U
se/
Lo
w T
ran
sit
Oth
er
Off
ice
– M
edic
al –
In
stit
uti
onal
Ind
ust
rial
Res
iden
tial
Ret
ail
Lod
gin
g
An
y S
ite
Larg
er S
ites
Notes
Transit subsidies/discounts, <50% of fare
2.5% 1% 0.5% b b Only if local transit service exists within quarter-mile walk of building entrance with sidewalk/pathway access
Transit subsidies/discounts, >50% of fare
5% 2% 1% b b
Organizational
Marketing/information program 3% 2% 1% TDM plan should describe proposed program elements
Join a TMA (small site, <100 workers)
13% 10% 7% Do not take additional credit for any measures included in TMA servicesc
Join a TMA (large site, >100 workers)
15% 12% 9%
Maximum Combined Reductions
Physical measures only 6% 4% 3%
Physical and operational and organizational
15% 12% 9%
Including financial incentives 20% 15% 12%
a “Larger sites” are typically at least 25,000 to 50,000 square feet of commercial space, 50 to 100 workers, or 30 to 50 dwelling units.
b Only applies to trips generated by workers.
c TMA services are assumed to include: Ridematching, vanpool support, guaranteed ride home, financial incentive/rewards programs, transit subsidies/discounts <50% of fare, marketing/information.

February 2017 Transportation Demand Management (TDM) Guidance
Page 18 VTrans Policy & Planning
5.0 Documenting TDM Commitments As a prerequisite for being awarded trip reduction credits for TDM commitments, the developer should submit a TDM/Trip Reduction Plan as part of their traffic mitigation commitments. The plan should specify:
What TDM measures are to be implemented;
By whom;
When;
How implementation will be monitored; and
Potential adjustments to make if strategies are found to be ineffective.
Some TDM strategies may require ongoing implementation activity after the developer has handed over control of the property. The plan should explain any provisions to ensure that TDM commitments continue to be implemented even after transfer of property ownership, change of tenants, or a change in land use. Such provisions might include deed language that is transferred with property ownership, as well as lease clauses for tenants of the property.
The sidebar provides a sample outline for a TDM/Trip Reduction Plan. Implementation of the TDM/Trip Reduction Plan should be referenced as a condition of the Act 250 or municipal land use permit for the development.

Transportation Demand Management (TDM) Guidance February 2017
VTrans Policy & Planning Page 19
Sample TDM/Trip Reduction Plan Outline
Description of Proposed Development
Size of development, expected uses by square footage, amount of parking.
Area type (see Section 4.1) and local transit services.
What are the expected access patterns associated with the trips to and from development? (Employees, customers, visitors, students, etc.; any noteworthy patterns by time of day and/or mode of travel).
TDM Measures and Responsibilities
Description of TDM Measure: To Be Implemented by: When:
Measure #1…
Measure #2…
Etc.
Implementation Provisions
How will responsibilities for implementing TDM measures be transferred as property ownership or management changes?
Monitoring Provisions
Who will monitor the TDM measures to ensure they continue to be implemented?
At what time intervals will TDM implementation be reported on, and to whom? (See Section 6.1.)
Provisions for Adjusting the Program
How will effectiveness of the TDM measures be evaluated? (See Section 6.3.)
What are some adjustments that may be considered if measures are not proving to be effective?
Enforcement Provisions
What actions (if any) may be taken if the property owner or manager fails to undertake good-faith actions to implement the TDM commitments? (See Section 6.2.)

February 2017 Transportation Demand Management (TDM) Guidance
Page 20 VTrans Policy & Planning
6.0 Monitoring Compliance with Commitments
6.1 TDM Implementation Reporting
An Act 250 or municipal land use permit, could establish any actions that may be required to monitor compliance with the TDM commitments set forth in the permit, including monitoring actions. Such actions could include TDM Implementation Progress Reports at the end of the first year and the third year after an occupancy permit is granted. A TDM Implementation Progress Report could include:
Identify TDM activities that were undertaken during the reporting period;
Provide any available evidence (quantitative and/or qualitative) on their effectiveness;
Identify any committed TDM activities that were not undertaken, and explain why not; and
Note any recent or anticipated changes to TDM activities.
A sample report outline is provided below.
A review of the TDM report should be conducted three years after the project is open. If requested by the District Commission, or if specified in a permit condition, VTrans may review the report for projects with Act 250 permits. If TDM measures are determined to be consistently and effectively implemented, further TDM Implementation Progress Reports may not be required. If TDM measures are not being implemented or are not found to be effective, options for further action should be considered as described in the next section.
If the property manager and/or tenants are members of a local TMA, the TMA could be a resource to assist with producing the TDM Implementation Progress Report. Vermont’s TMAs monitor membership, maintain commuter profiles for participating organizations, and conduct implementation and mode share surveys. A TMA program report could be attached as part of the progress report. The progress report should also include information on any measures that were committed to in addition to TMA membership.
6.2 Enforcing TDM Commitments
An Act 250 District Commission or municipality may enforce compliance with a TDM plan required in a permit condition. Enforcement may be considered if the permittee fails to comply with the reporting and other requirements as set forth in a permit condition.
Enforcement should be considered after the third year TDM Implementation Report, and possibly earlier depending upon the significance of local traffic concerns. If, at this time, TDM measures are not being implemented or are not found to be effective, the following options may be considered:
The permittee may be required to submit an improvement plan to implement its committed measures more effectively or to implement alternative or additional TDM measures; and

Transportation Demand Management (TDM) Guidance February 2017
VTrans Policy & Planning Page 21
If the TDM estimate was the basis for a reduce transportation impact fee, the permittee may be required to pay a mitigation fee up to, but not exceeding, the amount by which the project’s mitigation fee was originally reduced in consideration of the TDM Implementation Plan.
6.3 Monitoring Effectiveness of TDM Measures
Consistency between actual and projected vehicle trip generation should not be the basis for determining the effectiveness of a TDM plan. Actual vehicle trip generation is influenced by many factors, not just TDM measures, and may vary among different locations, and the time period during which traffic counts are collected. Therefore, traffic counts to monitor the effect of TDM program impacts on trip generation should not typically be required. However, the permittee should be encouraged to collect other data to demonstrate the effectiveness of the TDM programs. Such data can be valuable in learning which efforts are most effective and refining and improving TDM activities. Examples include:
Transit passes distributed;
Utilization of bicycle parking;
Participation in incentive programs, carpool-matching, vanpools, etc.;
Results of mode share surveys; and
Actual vehicle trip generation.
TMAs can assist with monitoring effectiveness through their database and reporting systems.

February 2017 Transportation Demand Management (TDM) Guidance
Page 22 VTrans Policy & Planning
Sample Outline for TDM Implementation Progress Report
Description of Development
Size of development, location, uses by square footage, amount of parking.
Area type and local transit services.
Estimated vehicle trip rates and trip reduction credits (percent reduction and impact fee reduction) provided in the Act 250 or municipal permit.
TDM Measures and Implementation Status
Description of TDM Measure: Implemented by:
Implementation Status:
Evidence on Effectiveness, Successes, Challenges, etc.
Specific to Measure
Measure #1…
Measure #2…
Etc.
Overall Summary of Program Effectiveness
Who has taken responsibility for TDM program implementation?
What is your overall assessment of how effective the TDM measures have been at reducing vehicle trips?
What successes have been achieved? (E.g., utilization of bicycle parking, transit passes, or flexible work schedules; participation in ridematching or financial incentive programs; positive employee feedback.)
What challenges have been encountered?
Adjustments to Program
Are any adjustments to the program proposed to increase the effectiveness at reducing vehicle trips?

Transportation Demand Management (TDM) Guidance February 2017
VTrans Policy & Planning Page 23
Acknowledgments This guidance was prepared for the Vermont Agency of Transportation by Cambridge Systematics, Inc. with input from a working group comprised of representatives from VTrans Policy, Planning, and Research Bureau, Chittenden County Regional Planning Commission, Chittenden Area Transportation Management Association, and Upper Valley Transportation Management Association.

February 2017 Transportation Demand Management (TDM) Guidance
Page 24 VTrans Policy & Planning
Appendix A. Trip Reductions from the Literature and Other Practice Examples
Table A.1 presents a summary of trip reductions assigned by other states and municipalities, as well as evidence on reductions in vehicle-trips and/or vehicle miles of travel (VMT) from a variety of TDM measures, as taken from literature sources. Table A.1 is the basis for the recommended trip reduction percentages provided in Table 4.1, with adjustments for local considerations.
Some sources provide ranges of effectiveness, recognizing that the effectiveness of individual strategies can vary widely depending on factors such as the geographic context, site characteristics, and level of application. Exhibits A through D provide additional detail from the sources referenced in Table A.1.
The following sources are referenced in Table A.1 and its Exhibits.
Berkeley = Wilbur Smith Associates (2008). West Berkeley Circulation Master Plan. Prepared for City of Berkeley, California.
This plan provides estimated vehicle trip reductions from TDM measures as drawn from other sources, including the Transit Cooperative Research Program (TCRP) Report 95 series.
CAPCOA = California Air Pollution Control Officers Association (2010). Quantifying GHG Mitigation Measures.
Chapter 7, Section 3 of the report provides ranges of expected effects of project-level TDM strategies on VMT reduction. The quantification data are drawn from other sources, including Cambridge Systematics’ Moving Cooler, the Victoria Transportation Policy Institute TDM Encyclopedia, and TCRP Report 95, among others. The research referenced in this report spans a time period of at least three decades.
This source reports impacts in terms of VMT reductions, not trip reductions. It is included because it provides a recent comprehensive review of the literature on VMT impacts of TDM, transit, land use, and other transportation measures. The VMT reductions are often – but not always – proportional to trip reductions. For example, VMT reductions associated with compact land use are due to shorter trip lengths as well as non-auto trips. Walk and bike improvements will give proportionally smaller VMT reductions than trip reductions, since walk and bike trips are typically shorter than driving trips. VMT reductions for ridesharing and vanpooling may exceed trip reductions on a percentage basis, since these trips tend to be longer than average.

Transportation Demand Management (TDM) Guidance February 2017
VTrans Policy & Planning Page 25
DelDOT = Delaware Department of Transportation and Wilmington Area Planning Commission, Trip Reduction/Transportation Demand Management (TDM) Measures Selection Form.
This is an example of another state agency that provides quantitative trip reduction estimates for individual TDM measures.
Fairfax = Cambridge Systematics, Inc., UrbanTrans, and ESTC (2010). Increasing the Integration of TDM into the Land Use and Development Process: Task 2 – Best Practices Report (Working Paper No. 1). Prepared for Fairfax County (Virginia) Department of Transportation.
This report includes listings and definitions of TDM measures, as well as a “meta-analysis” using expert judgment to estimate ranges of trip reductions for groups of TDM measures (information/marketing, services, financial incentives) by level of transit service (high, moderate, low).
Moving Cooler = Cambridge Systematics, Inc. (2009). Moving Cooler: An Analysis of Transportation Strategies for Reducing Greenhouse Gas Emissions. Urban Land Institute.
This document is a comprehensive examination of the nationwide VMT and GHG reduction impacts of about 50 transportation strategies, including demand management. Estimates are prepared for seven area types – three metro area sizes each with low and high transit service, and other areas.
N\N = Nelson\Nygaard Consulting Associates Inc. (2013). Transportation Demand Management State of the Practice. Prepared for Michigan Sustainable Communities and Smart Growth America.
Table 7 of this report provides values of trip reductions for some TDM measures as drawn from other sources.
ORDEQ = Oregon Department of Environmental Quality (1996). Guidance for Estimating Trip Reductions from Commute Options, as cited in Richland (Washington) Transportation Plan, Table 10-1. http://www.ci.richland.wa.us/DocumentCenter/View/6240. Also found in Employee Commute Options Sample Trip Reduction Plan, 2006, http://www.deq.state.or.us/nwr/eco/docs/SamplePlan.pdf.
This guidance provides estimated ranges of trip reductions for a variety of TDM measures.
Sacramento = City of Sacramento, Sacramento City Code: 17.700.080, Transportation Management Plan – Evaluation Criteria for Trip Reduction Credits.
The Sacramento City Code is another example of a policy document providing quantitative trip reduction credits for TDM measures.

February 2017 Transportation Demand Management (TDM) Guidance
Page 26 VTrans Policy & Planning
TCRP 95 = Kuzmyak, J.R., et al. (2010). Traveler Response to Transportation System Changes: Chapter 19, Employer and Institutional TDM Strategies. Transit Cooperative Research Program Report 95.
The TCRP Report 95 series provides a comprehensive review of evidence on the impacts of transportation strategies that affect traveler behavior. Chapter 19 focuses on employer TDM but other chapters address other TDM-related strategies such as parking pricing (Chapter 13), parking management (Chapter 18), vanpools and buspools (Chapter 5), land use and nonmotorized travel (Chapters 15-17), and transit facilities, services, and operations (Chapters 4-11).
VTPI = Victoria Transportation Policy Institute. On-Line TDM Encyclopedia. http://www.vtpi.org/tdm/.
This web site presents an extensive review of information drawn from other sources on the definitions and impacts of TDM strategies.

Transportation Demand Management (TDM) Guidance February 2017
VTrans Policy & Planning Page 27
Table A.1 Trip or VMT Reductions from the Literature and Other Practice Examples
TDM Measure Source
Percent Trip or VMT Reduction Comments
Physical Increase local/neighborhood density CAPCOA 0.8-30% Increase location efficiency (CBD or infill site)
CAPCOA 10-65%
Increase diversity (mixed-use area) CAPCOA 9-30% Improve design of development CAPCOA 3-21% Bus stop/shelter/improvements DelDOT 0.5-1% Transit shelter Sacramento 2% Design site to support transit DelDOT 1-2% Bicycle storage DelDOT 0.5% Bicycle showers and lockers Sacramento 2-5% Bicycle paths DelDOT 0.5-1% All bike facilities CAPCOA 1-5% All bike facilities ORDEQ 0-10% Pedestrian pathways DelDOT 0.5% Pedestrian network improvements CAPCOA 0-2% Parking management (charging, limiting, cash-out)
DelDOT 2-5%
Limit parking supply CAPCOA 5-12% On-site amenities DelDOT 0.5-2% Operational Flextime Berkeley <4% Compressed work week CAPCOA 0.1-3.8% see Exhibit A Telecommuting CAPCOA 0.2-5.5% see Exhibit A Meeting guidelines to support CP/VP and transit
DelDOT 0.5%
Preferential parking for carpools and vanpools
DelDOT 0.5-1%
Preferential parking Sacramento 5% 10% in CBD Ridesharing programs CAPCOA 1-15% On-site ridematching ORDEQ 1-2% Guaranteed ride home Berkeley <1% Guaranteed ride home ORDEQ 1-3% Provide or contribute to shuttle service DelDOT 1.0-3.5% Vanpool or shuttle service CAPCOA 0.3-13% Vanpool or shuttle service Sacramento 10% On-site carsharing Berkeley <2% On-site carsharing CAPCOA 0.4-0.7% Combined voluntary trip reduction programs
CAPCOA 1.0-6.2%

February 2017 Transportation Demand Management (TDM) Guidance
Page 28 VTrans Policy & Planning
TDM Measure Source
Percent Trip or VMT Reduction Comments
Operational (continued) Combined services Fairfax 1-10% 1-3% in low transit area, 5-10%
in moderate transit area Combined services N/N 8.5% Financial Provide value incentive/disincentive DelDOT 0.5-2% Gifts/awards for alternative mode use ORDEQ 0-3% Parking pricing (office), unbundle parking costs (residential)
Berkeley 5-40%
Parking pricing ($1-$6 per day) CAPCOA 0.5-20% Varies by area type and price (see Exhibit C)
Parking pricing N/N 20-30% Parking pricing Sacramento 10% Parking management program (charging, limiting spaces, cash-out)
DelDOT 2-5%
Parking cash-out CAPCOA 0.6-7.7% Varies by area type (Exhibit D) Parking cash-out ORDEQ 2-9% 2-4% low transit, 5-9% med
transit Unbundle parking costs CAPCOA 2.6-13% Subsidized/discounted transit CAPCOA 0.3-20% Varies by level of subsidy and
location type (Exhibit B) Combined financial incentives Fairfax 1-15% 1-5% in low transit area, 5-15%
in moderate transit area Combined financial incentives N/N 8-18% Organizational Marketing/information program DelDOT 1-3% Marketing/information program CAPCOA 0.8-4% Join a TMA DelDOT 2% Join a TMA Sacramento 5-10% 5% for TMA with demonstrated
15% reduction, 10% for TMA with 30% reduction
Coordinate with other employers DelDOT 1-2% Conduct surveys/data collection Combined information/support Fairfax <3% <1% in low transit area, 1-3% in
moderate transit area Combined information/support N/N 1.4% Maximum Combined Reductions With free parking – moderate transit Fairfax 10-15% With free parking – low transit Fairfax 3-7% With paid parking – moderate transit Fairfax 15-20% With paid parking – low transit Fairfax N/A Unlikely to occur

Transportation Demand Management (TDM) Guidance February 2017
VTrans Policy & Planning Page 29
A.1 Exhibits
Exhibit A. VMT Reductions from Telecommuting and Compressed Work Week
Employee Participation 1% 3% 5% 10% 25% Percent Reduction in Commute VMT
9-day/80-hour work week 0.07% 0.21% 0.35% 0.70% 1.75%
4-day/40-hour work week 0.15% 0.45% 0.75% 1.50% 3.75%
Telecommuting 1.5 days 0.22% 0.66% 1.10% 2.20% 5.5%
Source: CAPCOA (2010), based on other literature sources as noted: Moving Cooler Technical Appendices, Fehr & Peers.
Note: The percentages from Moving Cooler incorporate a discount of 25% for rebound effects. The percentages beyond 1% employee participation are linearly extrapolated.
Exhibit B. VMT Reductions from Subsidized/Discounted Transit Fares
Commute Vehicle Trip Reduction Daily Transit Subsidy
Worksite Setting $0.75 $1.49 $2.98 $5.96
Low-density suburb, rideshare-oriented 0.1% 0.2% 0.6% 1.9%
Low-density suburb, mode-neutral 1.5% 3.3% 7.9% 21.7%a
Low-density suburb, transit-oriented 2.0% 4.2% 9.9% 23.2%a
Activity center, rideshare-oriented 1.1% 2.4% 5.8% 16.5%
Activity center, mode-neutral 3.4% 7.3% 16.4% 38.7%a
Activity center, transit-oriented 5.2% 10.9% 23.5%a 49.7%a
Regional CBD/Corridor, rideshare-oriented 2.2% 4.7% 10.9% 28.3%a
Regional CBD/Corridor, mode-neutral 6.2% 12.9% 26.9%a 54.3%a
Regional CBD/Corridor, transit-oriented 9.1% 18.1% 35.5%a 64.0%a
Source: CAPCOA (2010), based on other literature sources as noted.
a Discounts greater than 20% will be capped, as they exceed levels recommended by TCRP 95 Draft Chapter 19 and other literature.
Nelson\Nygaard (2010) updated a commute trip reduction table from VTPI Transportation Elasticities to account for inflation since the data was compiled. Data regarding commute vehicle trip reductions was originally from a study conducted by Comsys Corporation and the Institute of Transportation Engineers (ITE).

February 2017 Transportation Demand Management (TDM) Guidance
Page 30 VTrans Policy & Planning
Exhibit C. VMT Reductions from Parking Charges
Daily Parking Charge (2009 Dollars) Project Location $1 $2 $3 $6
Low-Density Suburb 0.5% 1.2% 1.9% 2.8%
Suburban Center 1.8% 3.7% 5.4% 6.8%
Urban Location 6.9% 12.5% 16.8% 19.7%
Source: Moving Cooler; VTPI; Fehr & Peers.
Percent Change in Commuting VMT
Strategy Description
Large Metropolitan
(Higher Transit Use)
Large Metropolitan
(Lower Transit Use)
Medium Metro
(Higher)
Medium Metro
(Lower)
Small Metro
(Higher)
Small Metro
(Lower)
Parking Charges
Parking Charge of $1 Per Day
6.9% 0.9% 1.8% 0.5% 1.3% 0.5%
Source: Moving Cooler.
Commute Vehicle Trip Reduction Daily Parking Charges
Worksite Setting $0.75 $1.49 $2.98 $5.96
Suburb 6.5% 15.1% 25.3%a 36.1%a
Suburban Center 12.3% 25.1%a 37.0%a 46.8%a
Central Business District 17.5% 31.8%a 42.6%a 50.0%a
Source: CAPCOA (2010), based on VTPI.
a Discounts greater than 20% should be capped, as they exceed levels recommended by TCRP 95 and other literature.
Exhibit D. VMT Reductions from Parking Cash-out
Percent Change in Commuting VMT
Strategy Description
Large Metropolitan
(higher transit use)
Large Metropolitan
(lower transit use)
Medium Metro
(higher)
Medium Metro
(lower)
Small Metro
(higher)
Small Metro
(lower)
Parking Cash-out
Subsidy of $1 Per Day
7.7% 3.7% 4.5% 3.0% 4.0% 3.0%
Source: CAPCOA (2010), based on Moving Cooler.