transportation asset management planasset management means a strategic and systematic process of...
TRANSCRIPT

Transportation Asset
Management Plan
2019

ITD Transportation Asset Management Plan 2019
i
Table of Contents Executive Summary ....................................................................................................................................... 1
Background ............................................................................................................................................... 1
TAMP Section Summaries ......................................................................................................................... 2
- Objectives................................................................................................................................ 1-1
Goals ...................................................................................................................................................... 1-1
Objectives .............................................................................................................................................. 1-1
- Asset Measures and Targets ................................................................................................... 2-1
Idaho Measures and Performance Targets – Pavements ...................................................................... 2-1
Idaho Performance Measures and Targets – Bridges ............................................................................ 2-3
Federal Performance Measures ............................................................................................................. 2-5
Comparing the Idaho and Federal Performance Measures ................................................................... 2-9
Conclusion ............................................................................................................................................ 2-12
- Summary Description of Assets .............................................................................................. 3-1
Background ............................................................................................................................................ 3-1
ITD Asset Classes .................................................................................................................................... 3-2
Pavements.............................................................................................................................................. 3-5
Bridge ................................................................................................................................................... 3-14
- Gap Analysis Process ............................................................................................................... 4-1
Steps in the Gap Analysis Process .......................................................................................................... 4-1
Non-Condition Based System Performance Gap Analysis ..................................................................... 4-3
Process Improvements Completed ........................................................................................................ 4-5
Additional Process Improvements ......................................................................................................... 4-6
- Life Cycle Planning Process ..................................................................................................... 5-1
Life Cycle Planning Requirements .......................................................................................................... 5-1
Data and Management System Requirements ...................................................................................... 5-1
+Overview of Life Cycle Planning ........................................................................................................... 5-2
Pavements.............................................................................................................................................. 5-4
Bridges ................................................................................................................................................. 5-23
- Risk Management Process ................................................................................................... 6-35
Identify Objectives and Risks ............................................................................................................... 6-35
Identification and Assessment of Risks ................................................................................................ 6-36
Part 667 Assets ..................................................................................................................................... 6-37
ITD Transportation Asset Management Plan 2019
ii
Risk Registers ....................................................................................................................................... 6-38
- Financial Planning Process ...................................................................................................... 7-1
ITD Funding Sources ............................................................................................................................... 7-2
Idaho Transportation Department Expenditures .................................................................................. 7-4
Funding Available for Highway Program................................................................................................ 7-5
Funding Available for Transportation Asset Management .................................................................... 7-8
Asset Valuation .................................................................................................................................... 7-19
- Investment Strategies ............................................................................................................. 8-1
Funding Allocations Overall Tradeoff Analysis Strategy ........................................................................ 8-5
Pavement Investments .......................................................................................................................... 8-6
Bridge Investments .............................................................................................................................. 8-14
Appendix A – Summary of NHS Pavement Assets
Appendix B – Summary of NHS Bridge Assets
Appendix C – Declared Emergency Events 1997-2019

ITD Transportation Asset Management Plan 2019
iii
Figures Figure 0-1: Idaho Transportation Network Asset Classes ............................................................................. 1 Figure 2: FY2018-2027 Proposed ITD Ten Year NHS Funding Summary ....................................................... 6 Figure 2-1: 2018 State Highway System (SHS) Pavement Long Term Trend and Forecast (Federal Criteria) ................................................................................................................................................................... 2-3 Figure 2-2: Crosswalk Idaho Bridge Measure to Federal Measure ............................................................ 2-4 Figure 2-3: ITD Dashboard Showing Bridge Condition ............................................................................... 2-4 Figure 2-4: Federal Bridge Performance Measures ................................................................................... 2-8 Figure 2-5: 2018 NHS Bridge Conditions .................................................................................................... 2-8 Figure 2-6: Percentage Good Interstate Pavement Performance Crosswalk .......................................... 2-10 Figure 2-7: Percentage Poor Interstate Pavement Performance Crosswalk .......................................... 2-11 Figure 2-8: Percentage Good Non-Interstate NHS Pavement Performance Crosswalk .......................... 2-11 Figure 2-9: Percentage Poor Non-Interstate NHS Pavement Performance Crosswalk ........................... 2-11 Figure 3-1: The I. B. Perrine Bridge, US 93, over the Snake River Canyon, Twin Falls, Idaho .................... 3-1 Figure 3-2: US 93 in Idaho, One of the Many Rural Roads so Important in the State. .............................. 3-2 Figure 3-3: Idaho Transportation Network Asset Classes .......................................................................... 3-3 Figure 3-4: SHS Lane Miles Distribution ..................................................................................................... 3-3 Figure 3-5: Distribution of Total Deck Area in Idaho ................................................................................. 3-4 Figure 3-6: Map of Idaho Commerce Routes ............................................................................................. 3-4 Figure 3-7: Idaho SHS Pavement Condition Trends (ITD Criteria). ............................................................ 3-5 Figure 3-8: NHS Pavement Performance Percent Change 2015-2018 (MAP-21 Criteria) ........................ 3-6 Figure 3-9: NHS Interstate Pavement Performance Percent Change 2015-2018 (MAP-21 Criteria) ........ 3-6 Figure 3-10: NHS Non-Interstate Pavement Performance Percent Change 2015-2018 (MAP-21 Criteria) 3-7 Figure 3-11: Overview of State Highway System Pavement Performance by District (ITD Criteria) ......... 3-8 Figure 3-12: Example of GIS Map to Report Pavement Conditions (ITD Criteria) ..................................... 3-9 Figure 3-13: National Highway System Pavement Conditions Calculated by the FHWA Standards ....... 3-12 Figure 3-14: Rutting Conditions on the National Highway System .......................................................... 3-12 Figure 3-15: Faulting Conditions on the National Highway System ........................................................ 3-13 Figure 3-16: National Highway System Cracking Percentage .................................................................. 3-13 Figure 3-17: SHS Bridge Distribution ........................................................................................................ 3-14 Figure 3-18: SHS Bridge Condition Distribution ....................................................................................... 3-15 Figure 3-19: SHS Bridge Age Histogram ................................................................................................... 3-16 Figure 3-20: SHS Forecasted Bridge Performance ................................................................................... 3-17 Figure 3-21: 2015 to 2018 Idaho SHS Condition Trend Bridge Performance (% Deck Area) ................... 3-17 Figure 3-22: 2015 to 2018 Idaho NHS Condition Trend Bridge Performance (Percent Deck Area) ........ 3-19 Figure 3-23: 2017 HPMS Pavement Conditions Based on 2016 data ...................................................... 3-20 Figure 3-24: Local NHS Performance Reporting ...................................................................................... 3-21 Figure 5-1: Schematic LCP Deterioration Curve ......................................................................................... 5-3 Figure 5-2: ITD Pavement Management Historical Timeline ..................................................................... 5-6 Figure 5-3: Pavement Lifecycle Process ..................................................................................................... 5-7 Figure 5-4: ITD's Profiler Van ..................................................................................................................... 5-7 Figure 5-5: ITD's Pavement Friction Tester (PFT) ....................................................................................... 5-8 Figure 5-6: ITD's Falling Weight Deflectometer (FWD) .............................................................................. 5-8

ITD Transportation Asset Management Plan 2019
iv
Figure 5-7: Performance Model Tree ....................................................................................................... 5-11 Figure 5-8: Flexible Pavement Performance Models – All Indices ........................................................... 5-12 Figure 5-9: Rigid Pavement Performance Model – All Indices ................................................................ 5-13 Figure 5-10: Upper Level Decision Tree Categories ................................................................................. 5-19 Figure 5-11: Flexible Non-Structural Distress Index Decision Tree .......................................................... 5-20 Figure 5-12: Flexible Structural Distress Index Decision Tree .................................................................. 5-20 Figure 5-13: Rigid Pavement IRI Decision Tree. ....................................................................................... 5-21 Figure 5-14: Aged-based Decision Tree. .................................................................................................. 5-21 Figure 5-15: Rigid Slab Decision Tree. ...................................................................................................... 5-21 Figure 5-16: The Rigid Pavement Faulting Decision Tree. ....................................................................... 5-22 Figure 5-17: Flexible Pavement Rutting Decision Tree. ........................................................................... 5-22 Figure 5-18: Rigid Joint Index Decision Tree. ........................................................................................... 5-22 Figure 5-19: Flexible IRI Decision Tree. .................................................................................................... 5-23 Figure 5-20: Rigid Pavement Studded Tire Decision Tree. ....................................................................... 5-23 Figure 5-21: Bridge Lifecycle Data Flow ................................................................................................... 5-27 Figure 5-22: Comparison of Restoration vs Preservation Cumulative Lifecycle Costs ............................ 5-32 Figure 5-23: Example of Poor Condition Bridge Deck .............................................................................. 5-33 Figure 6-1: Risk Matrix Used for the Asset Management Risk Assessment ............................................ 6-37 Figure 6-2: Risks to Maintaining Assets in a State of Good Repair .......................................................... 6-39 Figure 6-3: Risks Specific to Maintaining Pavements in a State of Good Repair ..................................... 6-40 Figure 6-4: Risks to Sustaining Adequate Investments for a State of Good Repair ................................. 6-41 Figure 6-5: Risks Specific to Maintaining Structures in a State of Good Repair ...................................... 6-42 Figure 6-6: Risks to Having Skilled Staff to Sustain Assets ....................................................................... 6-43 Figure 6-7: Data and Information Risks to Sustaining Assets in a State of Good Repair ......................... 6-44 Figure 6-8: Risks from External Threats That Could Affect Asset Conditions .......................................... 6-45 Figure 8-1: Screenshot of the Bridge and Pavement Condition Measures on the ITD Performance Dashboard .................................................................................................................................................. 8-3 Figure 8-2: Performance Contours versus Funding Levels......................................................................... 8-5 Figure 8-3: Forecasted Interstate Good Pavement Percentage vs Investment Level ................................ 8-8 Figure 8-4: Forecasted NHS - Non-Interstate Good Pavement Percentage vs Investment Level ............. 8-8 Figure 8-5: Interstate Condition 10-year Forecast with $100-million Budget ........................................... 8-9 Figure 8-6: Interstate Condition 10-year Forecast with $130-million Budget ........................................... 8-9 Figure 8-7: Interstate Condition 10-year Forecast with $160-million Budget ......................................... 8-10 Figure 8-8: Non-Interstate NHS Condition 10-year Forecast with $100-million Budget ......................... 8-10 Figure 8-9: Non-Interstate NHS Condition 10-year Forecast with $130-million Budget ......................... 8-11 Figure 8-10: Non-Interstate NHS Condition 10-year Forecast with $160-million Budget ....................... 8-11 Figure 8-11:$100-Million/Year Budget Forecasted NHS Lane Miles per Treatment Category ................ 8-12 Figure 8-12:$130-Million/Year Budget Forecasted NHS Lane Miles per Treatment Category ................ 8-13 Figure 8-13:$160-Million/Year Budget Forecasted NHS Lane Miles per Treatment Category ................ 8-13 Figure 8-14: Forecast Idaho State Highway System Bridge Performance vs Funding ............................. 8-14
ITD Transportation Asset Management Plan 2019
v
Tables Table 0-1: ITD’s NHS Performance Measures and Targets ........................................................................... 3 Table 2: Asset Summary ................................................................................................................................ 4 Table 2-1: OCI Distress Types ..................................................................................................................... 2-1 Table 2-2: Idaho Pavement Measures ....................................................................................................... 2-2 Table 2-3: Federal Measures for Asphalt and Concrete Pavements ......................................................... 2-6 Table 2-4: Idaho Interstate and NHS Pavement Conditions, 2019 HPMS Report...................................... 2-6 Table 2-5: 2018 HPMS Local NHS Pavement Performance ........................................................................ 2-7 Table 2-6: Pavement Measures and Condition Crosswalk Table ............................................................. 2-10 Table 2-7: Comparison between Idaho and Federal Performance Measures ......................................... 2-12 Table 2-8: Performance Measures and Targets Crosswalk ...................................................................... 2-12 Table 3-1: SHS Bridge Distribution ........................................................................................................... 3-14 Table 3-2: SHS Bridge Condition Summary .............................................................................................. 3-15 Table 3-3: Bridge Ownership.................................................................................................................... 3-18 Table 3-4: Bridge Ownership and Performance ....................................................................................... 3-18 Table 4-1: Federal Performance Measures and Targets for Pavements and NHS Bridges ........................ 4-2 Table 4-2: Federal Performance Measures Gaps ....................................................................................... 4-2 Table 5-1: Expected Performance of Asphalt Pavement Treatments...................................................... 5-12 Table 5-2: Concrete Performance Models by Repair Categories ............................................................. 5-13 Table 5-3: ITD Treatment Unit Costs ........................................................................................................ 5-14 Table 5-4: Treatment Hierarchy by Distresses ......................................................................................... 5-15 Table 5-5: Pavement Condition Distresses .............................................................................................. 5-15 Table 5-6: Repair Categories .................................................................................................................... 5-16 Table 5-7: Flexible Pavement Improvement Rules .................................................................................. 5-17 Table 5-8: Rigid Pavement Improvement Rules ....................................................................................... 5-17 Table 5-9: Flexible Pavement Supplemental Improvement Rules ........................................................... 5-17 Table 5-10: Rigid Pavement Supplemental Improvement Rules ............................................................. 5-18 Table 5-11: Treatment Priority and Exclusion Year Priority ..................................................................... 5-18 Table 5-12: Flexible Pavement Treatment Exclusion Years ..................................................................... 5-19 Table 5-13: Rigid Pavement Treatment Exclusion Years.......................................................................... 5-19 Table 5-14: Multi-Objective Variables ..................................................................................................... 5-25 Table 5-15: Bridge Preservation Lifecycle Planning Objectives and Strategies ....................................... 5-28 Table 5-16: Rehabilitation Strategy Life Cycle Planning Costs ................................................................. 5-32 Table 5-17: Preservation Strategy Life Cycle Planning Costs ................................................................... 5-32 Table 7-1: Forecasted State Revenue Sources ......................................................................................... 7-10 Table 7-2: Forecasted Federal Revenue Sources ..................................................................................... 7-11 Table 7-3: Forecasted Local Revenue Sources Plus Summary of All Sources .......................................... 7-12 Table 7-4: Department Operations Expenditures and Remaining Available Revenues .......................... 7-13 Table 7-5: Funding Available after Operation Costs are Deducted ......................................................... 7-14 Table 7-6: Funds Programed for Asset Management, Safety and Capacity Projects. ($Thousands) ..... 7-15 Table 7-7(Continued): Funds Programed for Asset Management, Safety and Capacity Projects. ($Thousands) ............................................................................................................................................ 7-16 Table 7-8(Continued): Funds Programed for Asset Management, Safety and Capacity Projects. ($Thousands) ............................................................................................................................................ 7-17
ITD Transportation Asset Management Plan 2019
vi
Table 7-9: Funding Allocation by Work Type ........................................................................................... 7-18 Table 7-10: Summary of Revenue and Expenditures ............................................................................... 7-19 Table 7-11: Estimated Depreciated Replacement Cost for ITD NHS Bridges. .......................................... 7-20 Table 7-12: Depreciated Replacement Costs for ITD NHS Pavements .................................................... 7-21 Table 8-1: The ITIP Development Cycle ..................................................................................................... 8-2
ITD Transportation Asset Management Plan 2019
vii
Glossary and Acronyms AASHTO: American Association of State Highway and Transportation Officials
AC: Asphalt Pavement
ACLM: Annualized Cost Per Lane-Mile
ADT: Average Daily Traffic
ASTM: American Society for Testing and Materials
ASI: Asset Sustainability Index
ACR: Asset Consumption Ratio
ASR: Asset Sustainability Ratio
Asset management: Asset management means a strategic and systematic process of operating, maintain-ing, and improving physical assets, with a focus on both engineering and economic analysis based upon quality information, to identify a structured sequence of maintenance, preservation, repair, rehabilitation, and replacement actions that will achieve and sustain a desired state of good repair over the life cycle of the assets at minimum practicable cost.
Asset Management Plan: A document that describes how a State DOT will carry out asset management. This includes how the State DOT will make risk-based decisions from a long-term assessment of the Na-tional Highway System (NHS), and other public roads included in the plan at the option of the State DOT, as it relates to managing its physical assets and laying out a set of investment strategies to address the condition and system performance gaps. This document describes how the highway network system will be managed to achieve State DOT targets for asset condition and system performance effectiveness while managing the risks, in a financially responsible manner, at a minimum practicable cost over the life cycle of its assets.
BMS: Bridge Management System
BrM: AASHTO’s Bridge Management Software, formerly known as PONTIS.
Bridge deck: Decks are the horizontal portion of the bridge, usually made of concrete; the deck is atop the superstructure and includes the traffic-carrying surface.
Bridge superstructure: The portion of the bridge that supports the deck, spans the opening, and connects the substructure elements.
Bridge substructure: The portions of the bridge including piers and abutments that transfer the load from the superstructure to the foundations.
BRR: Backlog Reduction Ratio
CAR: Cost Accrual Ratio (CAR)

ITD Transportation Asset Management Plan 2019
viii
CE: Construction Engineering
CMAQ: Congestion Mitigation/Air Quality
Cracking: As measured by the Federal definition, cracking refers to the percentage of the pavement area that exhibits visible cracking.
Culvert: A buried structure supporting a roadway with a span of at least 20-feet in length
Department/ITD: The Idaho Transportation Department
ERM: Enterprise Risk Management
FAST Act: Fixing America’s Surface Transportation Act
Faulting: A difference in elevation across a joint or crack usually associated with concrete pavement.
Federal-aid highways: A network of approximately 1 million miles of roads and highways out of about 4.1 million miles of public roads nationwide. Several categories of Federal Highway funds are eligible to be spent on the Federal-aid network. Most Federal-aid funds are not eligible off the Federal-aid system ex-cept for some bridge, safety, and transportation alternatives funds.
Federal Highway Administration (FHWA): The division of the U.S. Department of Transportation that oversees Federal highway programs.
Financial plan: As defined by FHWA, a financial plan means a long-term plan spanning 10 years or longer, presenting a State DOT’s estimates of projected available financial resources and predicted expenditures in major asset categories that can be used to achieve State DOT targets for asset condition during the plan period, and highlighting how resources are expected to be allocated based on asset strategies, needs, shortfalls, and agency policies.
FWD: Falling Weight Deflectometer
GARVEE: Grant Anticipation Revenue Vehicle
GIS: Geography Information System
GPR: Ground Penetrating Radar
HDA: Highway Distribution Account
HFP: Highway Funding Plan
HPMS: Highway Performance Monitoring System
HSIP: Highway Safety Investment Program
IDI: Individual Distress Index
Interstate Highway System: A national network of 48,500 miles of freeways signed as Interstate High-ways.
Investment strategies: Investment strategy means a set of strategies that result from evaluating various levels of funding to achieve State DOT targets for asset condition and system performance effectiveness

ITD Transportation Asset Management Plan 2019
ix
at a minimum practicable cost while managing risks.
IRI: The International Roughness Index (IRI) is a statistic used to estimate the amount of roughness in a measured longitudinal profile. It measures inches of roughness, or “bounce”, per mile of road.
Idaho Transportation Department (ITD) Board: A board that oversees the operations of the Idaho Trans-portation Department. The Idaho Transportation Board establishes state transportation policy and guides the planning, development and management of the transportation network.
LCA: Lifecycle Cost Analysis
LCP: Lifecycle Cost Planning
LHTAC: Local Highway Technical Assistance Council
LRS: Linear Referencing System
Local highways: Streets and roads owned by the cities and counties, as opposed to ITD.
Measures: As defined by FHWA, measures are an expression based on a metric that is used to establish targets and to assess progress toward achieving the established targets.
MMS: Maintenance Management System
MPO: Metropolitan Planning Organization
MWP: Master Work Program
National Highway System (NHS): Is a network of 222,000 miles that include the Interstates as well as other major arterials.
NBI: National Bridge Inventory
OCI: Overall Condition Index
PCC: Portland Cement Concrete
PE: Professional Engineering
Performance Gap: FHWA defines a performance gap as the difference between a desired condition level, or target, and the actual condition.
PFT: Pavement Friction Tester
PMS: Pavement Management System
QC: Quality Control
RDQMP: Roadway Data Quality Management Program
Risk: The positive or negative effect of uncertainty on objectives.
Risk Management: The systematic process of managing risk.
RSI: Remaining Service Interval
ITD Transportation Asset Management Plan 2019
x
Rutting: Rutting means longitudinal surface depressions in the pavement derived from measurements of a profile transverse to the path of travel on a highway lane.
S & C: Safety and Capacity
SHA: State Highway Account
SHS: State Highway System
SIPF: Strategic Initiatives Program and Fund
SPR: State Planning and Research
State of Good Repair: Means ITD is achieving the performance targets of Idaho’s TAMP.
STBG: Surface Transportation Block Grant
STIP: State Transportation Investment Program
STP: Surface Transportation
TAMP: Transportation Asset Management Plan
TAMS: Transportation Asset Management System
TAP: Transportation Alternatives Program
Target: As defined by FHWA means a quantifiable level of performance or condition, expressed as a value for the measure, to be achieved within a time period required by the Federal Highway Administration (FHWA).
TECM: Transportation Expansion and Congestion Mitigation
VMT: Vehicle Miles Traveled

June 30, 2019
Your Safety • Your Mobility
Your Economic Opportunity
Peter Hartman
Division Administrator
Federal Highways Administration - Idaho Division
3050 N Lakeharbor Ln # 126, Boise, ID 83703
Dear Mr. Hartman,
IDAHO TRANSPORTATION DEPARTMENT
P.O. Box 7129 • Boise, ID 83707-1129
(208) 334-8000 • itd.idaho.gov
On behalf of the Idaho Transportation Department, I approve and am submitting the Idaho Transportation
Department 2018 Transportation Asset Management Plan (TAMP). Per the requirements of 23 CFR
515.ll(a)(l),
The TAMP is one of four plans that ITD must produce under relatively recent Federal laws. The other plans
address highway safety, congestion, and freight movement. The TAMP is limited to the conditions of
bridges and pavements on the NHS. The TAMP describes in eight sections how ITD addresses the Federal
asset management requirements, and more importantly, how it manages Idaho's critical highway net
work. FHWA regulations also require that the plan include descriptions of how seven processes were used
to develop the plan. As a result, the plan includes not only conclusions and recommendations, but a
description of the processes used to reach them.
The seven required processes are to:
1. Complete a performance gap analysis and to identify strategies to close gaps,
2. Implement life cycle planning,
3. Manage risks with a risk management plan,
4. Develop a financial plan covering at least a 10-year period,
5. Develop investment strategies,
6. Obtaining necessary data from NHS owners other than the State DOT,
7. Ensure the TAMP is developed with the best available data and that the State DOT uses bridge
and pavement management systems meeting the requirements.
ITD requests that the FHWA- Idaho Division review and certify the reference document.
During the FHWA review process, please contact Jim Poorbaugh, ITD Asset Management Engineer,
([email protected]) to address any questions or concerns.
Brian W. Ness
Director, Idaho Transportation Department


ITD Transportation Asset Management Plan 2019
1
Executive Summary Background This is the federally required Transportation Asset Management Plan (TAMP) for the Idaho Transportation Department (ITD). It fulfills three objectives:
1. First, it satisfies detailed Federal requirements that each state must develop a TAMP that con-forms to the contents of this document.
2. Secondly, it informs FHWA of how effectively ITD manages the bridges and pavements that com-prise the National Highway System (NHS), which includes the Interstate. ITD manages many other assets that are not included in this plan because they are not required to be in the FHWA asset management plan.
3. Thirdly, this plan describes the current and forecasted condition of the NHS major roadway assets and presents processes the Department will utilize to manage them over the next decade.
The Idaho Transportation Department (ITD) is committed to the effective management of the state’s high-ways to protect the public’s safety and its massive investment in this important infrastructure. As part of this commitment, ITD has demonstrated a focus on the effective utilization of technology and asset man-agement practices for over 40 years. The TAMP is focused on all NHS bridge and pavement assets within Idaho. With respect to the NHS, ITD has stewardship over 96 percent of this network with local agencies manag-ing the balance of the NHS. ITD annually collects performance data for the entirety of the NHS regardless of ownership and is committed to communicating the performance of the local agencies. ITD is develop-ing dashboard and GIS tools to streamline accessibility to local agencies.
Figure 1: Idaho Transportation Network Asset Classes
Local Roads System ~48,000 lane miles
& 2,160 Bridges
Idaho Transportation Network
~60,000 Lane Miles & 4,000 Bridges
State NHS 7,140 lane miles & 807 Bridges Non-Interstate 4,633 lane
miles & 378 Bridges
Interstate 2,507 lane miles & 429 Bridges
Local NHS 441 lane miles & 63 Bridges
State Highway System 12,273 lane miles &
1,835 Bridges
State Non-NHS 4,692 lane miles &
1,028 Bridges
ITD Transportation Asset Management Plan 2019
2
ITD processes and procedures have always been, and will remain, equally applied across the entirety of the State Highway System (SHS). That is to say, ITD does not solely consider facility classification; rather, ITD looks through the lens of overall benefit to the visitors and residents of Idaho. This focus has placed ITD in the enviable position that the SHS roads and bridges are nearing or exceeding both Federal & ITD targets and goals. The NHS is a subset of 174,000 of the most important roads nationally. In Idaho, over 7,580 lane miles are on the NHS including the Interstates and major routes such as I-84, I-90, US 95, US 30, US 20, US 12, SH 55 and others. Congress emphasizes the condition of the NHS because of its freight and travel importance. Federal requirements require each state and territory to develop a Transportation Asset Management Plan (TAMP), ITD understands that the TAMP is the mechanism by which a state com-municates their processes for monitoring, communicating, planning, financing and management of the assets they oversee. This plan focuses mainly on the NHS but ITD emphasizes its need to adequately maintain and manage all ITD jurisdictional roads to the best benefit of the citizens of Idaho. ITD under-stands the significance and importance of the NHS to the national transportation system. Confirmation and commitment to this view are demonstrated by well-established processes for project selection, which prioritize NHS assets for treatment and maintenance.
The Idaho’s transportation network is one of Idaho’s most valuable assets and is integral to the public’s safety, mobility and economic opportunity. Idaho's transportation system includes a statewide network of more than 60,000 lane miles of roads and 4,000 bridges. Of these, ITD manages the SHS with over 12,273 lane miles of highways and 1,835 bridges. ITD manages just over 20 percent of all roadway miles in Idaho. However, the state system carries 55 percent of Idaho’s total vehicle miles of travel (VMT). Although a small percentage of total lane miles within the State of Idaho, 4.2 percent, the Interstate high-ways alone carry 25 percent of miles traveled in Idaho. Within the SHS that ITD manages, the interstate accounts for 45 percent of the VMT. These assets are aging but as they do, they become even more important. From 1996 to 2018, vehicle miles travelled on the state highway system grew more than 38 percent. The Interstate system experienced a 55 percent increase in travel over the same period while the state system, excluding the interstates, experienced a 27 percent increase. This growth reflects the increasing mobility of Idaho’s population and the growing importance of freight movement to our econ-omy.
TAMP Section Summaries The TAMP is organized to address specific Federal requirements. Each plan must include eight sections that describe the agency’s asset management objectives, targets, and how it invests to achieve them. The organization and content of this plan are structured to satisfy the Federal requirements and to expedite Federal review. Failure to develop a certifiable plan can bring substantial Federal penalties and re-strictions on how ITD can use Federal highway funds. The following sections provide a brief summary of the content of each section. Beginning in June of 2019, FHWA annually will review ITD processes for consistency with this TAMP.
Chapter 1 - Objectives Chapter 1 describes the specific objectives that ITD seeks to achieve. Its objectives are described in Chapter 1 and include:
1. Continually reduce fatalities
ITD Transportation Asset Management Plan 2019
3
2. Provide a mobility-focused transportation system that drives economic opportunity 3. Maintain the pavement in good or fair condition 4. Maintain the bridges in good or fair condition
These objectives are focused on managing ITD’s NHS bridge and pavement assets. ITD has other objec-tives relating to customer service, safety, and financial efficiencies that are outside the scope of this plan.
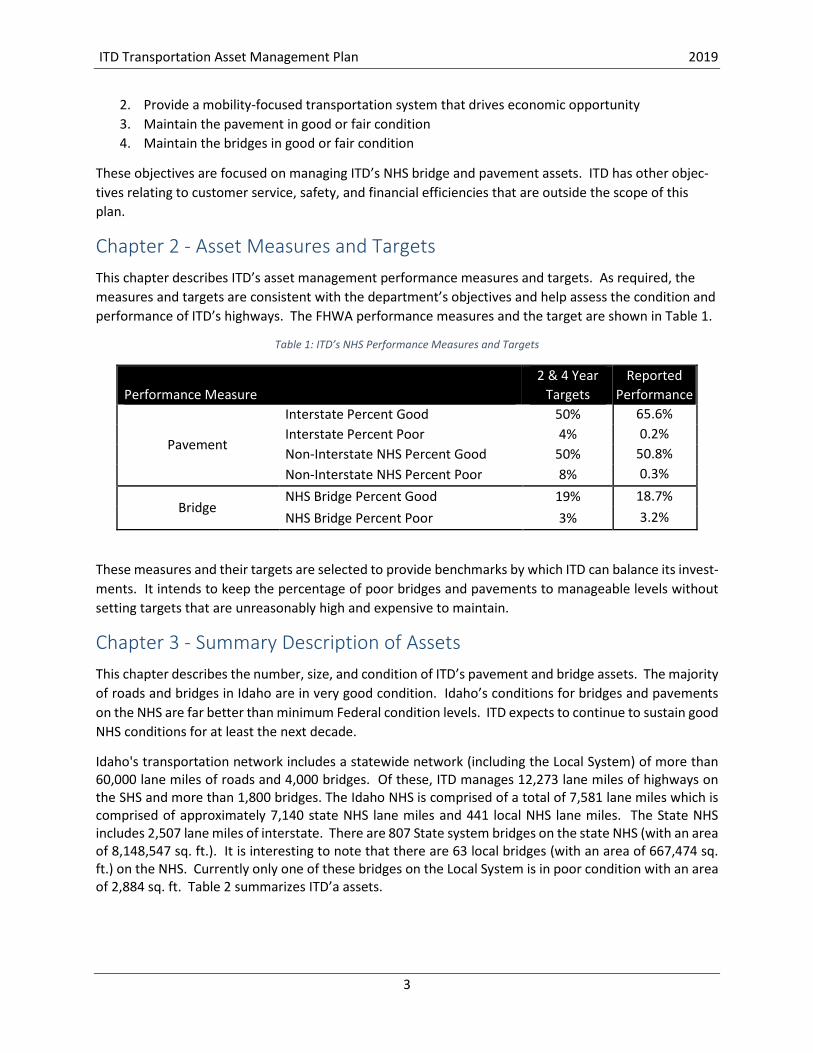
Chapter 2 - Asset Measures and Targets This chapter describes ITD’s asset management performance measures and targets. As required, the measures and targets are consistent with the department’s objectives and help assess the condition and performance of ITD’s highways. The FHWA performance measures and the target are shown in Table 1.
Table 1: ITD’s NHS Performance Measures and Targets
Performance Measure 2 & 4 Year
Targets Reported
Performance
Pavement
Interstate Percent Good 50% 65.6% Interstate Percent Poor 4% 0.2% Non-Interstate NHS Percent Good 50% 50.8% Non-Interstate NHS Percent Poor 8% 0.3%
Bridge NHS Bridge Percent Good 19% 18.7% NHS Bridge Percent Poor 3% 3.2%
These measures and their targets are selected to provide benchmarks by which ITD can balance its invest-ments. It intends to keep the percentage of poor bridges and pavements to manageable levels without setting targets that are unreasonably high and expensive to maintain.
Chapter 3 - Summary Description of Assets This chapter describes the number, size, and condition of ITD’s pavement and bridge assets. The majority of roads and bridges in Idaho are in very good condition. Idaho’s conditions for bridges and pavements on the NHS are far better than minimum Federal condition levels. ITD expects to continue to sustain good NHS conditions for at least the next decade.
Idaho's transportation network includes a statewide network (including the Local System) of more than 60,000 lane miles of roads and 4,000 bridges. Of these, ITD manages 12,273 lane miles of highways on the SHS and more than 1,800 bridges. The Idaho NHS is comprised of a total of 7,581 lane miles which is comprised of approximately 7,140 state NHS lane miles and 441 local NHS lane miles. The State NHS includes 2,507 lane miles of interstate. There are 807 State system bridges on the state NHS (with an area of 8,148,547 sq. ft.). It is interesting to note that there are 63 local bridges (with an area of 667,474 sq. ft.) on the NHS. Currently only one of these bridges on the Local System is in poor condition with an area of 2,884 sq. ft. Table 2 summarizes ITD’a assets.

ITD Transportation Asset Management Plan 2019
4
Table 2: Asset Summary
Idaho Federal
Population Interstate, U.S. Route
and State Highway System
National Highway System
Lane Miles 12,273 7,581 # of Bridges 1,835 870
Deck Area (sq. ft.) 12,659,970 8,816,021
Chapter 4 - Gap Analysis Process This chapter describes ITD’s lack of performance gaps. In fact, ITD far surpasses the minimum Federal standards set nationally for NHS bridges and Interstate pavements. FHWA defines a performance gap as the difference between a desired condition level, or target, and the actual condition. By the Federal def-inition, ITD has only a very small gap between its current asset conditions and its targets for asset condi-tions. That gap is that while ITD set a target of keeping 50 percent of the Non-Interstate NHS pavements in good condition and presently 48.9 percent are good. In Idaho, the amount of poor NHS bridge area is only 3.2 percent. (The percentage is calculated by bridge area, not by the number of bridges.)
For Interstate Highways, FHWA set a minimum condition level of no more than 5 percent of the lane miles to be in poor condition. In Idaho, only 0.20 percent of the Interstate lane miles are poor and only 0.30 percent of the NHS lane miles are poor. These percentages are based on recent FHWA measures of good, fair, and poor. They differ from the measure ITD and other states have used in the past.
In addition, this chapter discusses self-identified gaps in asset management processes. In order to strengthen future asset management plans ITD is taking steps to enhance several asset management pro-cesses. These include:
• Enhance pavement management model; • Continue developing the BrM Bridge Management System; • Assess the long-term consequences of the Non-Commerce Route treatments; • Assess the Long-Term Needs of ITD’s Large Structures.
Chapter 5 - Life Cycle Planning Process This chapter describes ITD’s lifecycle planning which is a process to manage an asset class over its whole life while minimizing costs and preserving or improving its condition. This chapter describes how ITD uses a mix of preservation, maintenance, rehabilitation, and timely replacement of assets to sustain them over their entire life for lower cost. Bridges and pavements perform better and cost less when timely repairs are made when assets are beginning to deteriorate. ITD describes how it attempts to lower the life-cycle cost of its assets through sophisticated pavement modeling that suggests what types of treatments are needed for each pavement. For bridges, ITD examines the details of inspection reports to match treat-ments to each structure’s need.

ITD Transportation Asset Management Plan 2019
5
Chapter 6 Risk Management Process This section identifies risks considered in the plan and ITD’s responses to those risks. FHWA defines risk as the positive or negative effects of uncertainty or variability upon agency objectives. Any plan that seeks for 10 years to meet condition targets for thousands of assets faces many uncertainties and risks. This chapter discusses many of the key risks facing the achievement of this plan’s objectives, such as uncertain Federal funding, changing Federal rules, and a growing state population that increases demand for capac-ity-expanding projects. This chapter identifies the risks that could influence the asset management ob-jectives and summarizes how ITD plans to manage those risks.
Specific risk categories reviewed included:
• Risks to maintaining assets in a state of good repair; • Risks specific to maintaining pavements in a state of good repair; • Risks to sustaining adequate investments for a state of good repair; • Risks specific to maintaining structures in a state of good repair; • Risks to having skilled staff sustain assets; • Data and information risks; • External and environmental threats.
The highest rated risks identified are:
• ITD may not be able to sustain assets in a state of good repair if: o …federal funding decreases; o …program selection priorities do not emphasize sustaining asset conditions; o …changes to Federal Rules consume more ITD resources; o …the donor/donee state financial balance changes.
• ITD may not achieve the pavement quality needed if ITD and contractor community do not adapt performance-based specifications.
• Bridges may deterioration if ITD does not dedicate adequate resources towards bridge mainte-nance.
• ITD may need to divert all bridge funds to a few large structures if ITD does not develop a pro-gram to address large structures needing rehabilitation/replacement in the next decade.
• Conflicting information caused by not having a single source of truth aligned with linear refer-encing system.
One opportunity identified as part of the risk assessment was that if the PMS was improved then ITD would have an opportunity to improve and enhance modeling and forecasting of pavement perfor-mance.
Chapter 7 - Financial Planning Process This chapter describes the required 10-year financial plan to support the asset management strategies. For many years, ITD has produced the Idaho Transportation Investment Program (ITIP) that was a five-year list of revenues and projects. Recently, Idaho extended ITIP to seven years to improve the long-term planning for projects. This chapter discusses the ITIP and illustrates how it fulfills the Federal require-ments for an asset management financial plan. FHWA requires a realistic financial plan that can pay for

ITD Transportation Asset Management Plan 2019
6
the bridge and pavement investments included in the asset management plan. ITD extended the ITIP by 3-years assuming a flat projection (i.e. no growth in funding for either State or Federal funds) to serve as the federally required 10-year asset management financial plan.
Out of a total of $7.3 billion expected to be available between 2019 and 2028 (see Table 7-3: Forecasted Local Revenue Sources Plus Summary of All Sources on page 7-12), about $676 million is planned to be spent on basic pavement and bridge programs off the NHS. The ITD plans to spend $2.8 billion on the NHS. With almost $700 million will be spent on bridges, $888 million on NHS pavements, and the balance is divided among other programs on the NHS as shown in Figure 2. The remaining revenue goes to oper-ations, maintenance, debt, salaries, local programs, safety and other needs.
Figure 2: FY 2019-2028 Proposed ITD Ten Year NHS Funding Summary
Chapter 8 - Investment Strategies This chapter describes ITD’s investment strategies to achieve the plan’s objectives, measures, and tar-gets based upon analysis of various alternatives. ITD has balanced its expenditures across a mix of preservation and rehabilitation projects to achieve its targets while maintaining acceptable conditions on the entire SHS. This chapter describes the methodology used to forecast SHS pavement performance for a ten-year period considering various assumed funding levels. From these forecasts, NHS interstate and non-interstate performance information was extracted. SHS pavements annual funding levels fore-casted were $100, $130, and $160 million. Based on the analysis ITD has determined that $130 million annual investment in SHS pavments is required to maintain NHS performance targets. A 10-year fore-cast is also presented for SHS bridges. The assumed funding level was maintained at the current level of $80-million annually. The forecast shows that ITD will achieve 80 percent of bridges will be in good con-dition around 2023.
NHS Pavement, $888,189,000 , 31%
NHS Bridge, $697,609,000 , 24%
Safety & Capacity , $708,229,000 , 25%
Supporting Infrastructure
Assets, $49,828,000 , 2%
Federal Discrtionary,
$122,505,000 , 4%
Freight, $73,857,000 , 3%
GARVEE, $307,499,000 , 11%

ITD Transportation Asset Management Plan 2019
7
ITD Transportation Asset Management Plan 2019
1-1
- Objectives Idaho’s transportation infrastructure is a deeply imbedded component of life in Idaho. Due to the large distances between population centers, the state's citizens use Idaho's transportation system to get to work, school, friends and recreation. They also rely on that system to bring goods to their stores, services to their doorstep, and to make sure the state's goods and services are delivered to the customers of the nation and the world. From the food they eat, to the letters they read, to the movies they drive to, Ida-hoans are empowered by transportation in complex and substantial ways.
Idaho's leaders and transportation officials understand the essential role transportation plays as a corner-stone for the state's economic and social health. The transportation department's mandate is to provide the people of Idaho with a transportation system that includes various means of travel. Idaho's transpor-tation system is the backbone of the state's economy. Safe and efficient roads and bridges promote the expansion of Idaho's economy. The cost of doing business is affected by how well goods and people move across town, across the country and around the world. Thus, Idaho's economic performance is tied to the quality of our transportation system.
Goals ITD developed the ITD 2017 -2020 Strategic Plan. This plan for-mally documents the department’s mission, goals and objec-tives. The following are the organizational goals from the stra-tegic plan that are also adopted as asset management goals:
1. Commits to having the safest transportation system possible
2. Provide a mobility focused transportation system that drives economic opportunity
3. Become the best organization by continually develop-ing employees and implementing innovative business practices
Objectives ITD’ s asset management goals are supported by the following objectives from the ITD 2017- 2020 ITD Strategic Plan and which are adopted as the asset management plan goals:
1. Reduce Fatalities 2. Maintain the Pavement in Good or Fair Condition 3. Maintain the Bridges in Good or Fair Condition 4. Keep Highways Clear of Snow and Ice During Winter
Storms 5. Hold Administration and Planning Expenditures Con-
stant
ITD 2016-2020 Mission & Vision
MISSION: Your Safety.
Your Mobility.
Your Economic Opportunity
KEY VISION ELEMENTS: • Continually getting better with
the goal of being the best trans-portation department in the country.
• Being transparent, accounta-ble, and delivering on promises.
• Being more effective and saving costs through increased effi-ciencies.
• Providing remarkable customer service.
• Using partnerships effectively. • Valuing teamwork and using it
as a tool to improve. • Placing a high value on employ-
ees and their development and retention.

ITD Transportation Asset Management Plan 2019
1-2
6. Complete Project Designs On Time 7. Hold Construction Cost at Award to Programmed Budget 8. Hold Final Construction Cost to Contract Award
These objectives are congruent not only with ITD’s mission statement but are consistent with the purpose of asset management, which is to achieve and sustain the desired state of good repair over the life cycle of the assets at a minimum practicable cost. Federal regulation says that the state’s objectives should support the national transportation goals. By incorporating these objectives into the TAMP, the Idaho Transportation Department is contributing toward achievement of the National transportation goals enacted by Congress, which are:
1. Safety - To achieve a significant reduction in traffic fatalities and serious injuries on all public roads. ITD understands that keeping pavements and bridge assets in good condition directly con-tributes to improving the safety of the traveling public. For example, by monitoring and incorpo-rating pavement rut depth into the ITD performance model ITD can actively plan maintenance activities or projects to mitigate which will greatly reduce the risk of a vehicle crash caused by wet weather.
2. Infrastructure condition - To maintain the highway infrastructure asset system in a state of good repair. Keeping good pavements good is important to ITD because the further a pavement dete-riorates the more expensive they are to return to a state of good repair. ITD asset management systems consider infrastructure condition as the primary driver in program development.
3. Congestion reduction - To achieve a significant reduction in congestion on the National Highway System. As Idaho continues to experience rapid growth, ITD is committed to effective asset man-agement that is coordinated with long-range transportation plans. This will ensure that ITD is not only maintaining assets in a state of good repair, that we are also seeking to consider expansion projects. Additionally, ITD understands that when assets are in a good state of repair, the public will be able to more effectively use facilities at higher speeds and capacities.
4. System reliability - To improve the efficiency of the surface transportation system. With effective life cycle management of assets, ITD is able to provide a transportation network, which the trav-eling public can rely upon to get them to their destination consistently and efficiently. This is demonstrated by standardized maintenance activities that keep good roads good and does not let them get to poor condition.
5. Freight movement and economic vitality - To improve the national freight network, strengthen the ability of rural communities to access national and international trade markets, and support regional economic development. ITD understands that maintaining assets in a state of good re-pair plays a significant role in addressing the demands of the commercial sector to increase truck weights and volume. ITD leverages performance data to improve pavement designs which in turn minimizes the increased funding requirements associated with repeated truck loads that shorten pavement life.
6. Environmental sustainability - To enhance the performance of the transportation system while protecting and enhancing the natural environment. At lower travel speeds, vehicles create more pollution through greater emissions. Incorporating asset management allows ITD to ensure that infrastructure condition issues are not contributing toward slower traffic speeds. Additionally, using effective life cycle maintenance strategies reduces the amount of material and energy re-quired to be used over the life of the asset.

ITD Transportation Asset Management Plan 2019
1-3
7. Reduced project delivery delays - To reduce project costs, promote jobs and the economy, and expedite the movement of people and goods by accelerating project completion. Coordinating pavement projects with other asset improvements limits disruption to the traveling public. Addi-tionally, effective asset management applies lower impact treatments over time versus a few large impact treatments. This approach insures that ITD is limiting the disruption to the traveling public and completing work on time and on budget.
ITD Transportation Asset Management Plan 2019
2-1
- Asset Measures and Targets Performance measures and targets are integral to ITD’s successful implementation of asset management. Measures and targets drive commitment to and focus on accountability for assets. FHWA defines measures as an expression based on a metric that is used to establish targets and to assess progress to-ward achieving the established target. Idaho’s performance measures are very similar in nature to FHWA’s measures. In other words, the measure is “what we are measuring” such as pavement smooth-ness or traffic crash rates. The target is the numeric level of desired performance for each measure. An example of a measure is pavement smoothness as measured by the International Roughness Index or IRI. The target could be that no more than five percent of the lane miles be poor for the measure of roughness.
Idaho has been using performance measures since about 2006. Idaho’s performance measures for pave-ments and bridges are slightly different from FHWA’s. In this chapter, the differences will be explained and clarified. ITD recognized early on the value of using performance measures for asset management balanced by available funding and predicting future asset condition.
Idaho Measures and Performance Targets – Pavements Similar to the FHWA measures, Idaho uses three measures to quantify performance; these are Interna-tional Roughness Index (IRI), rutting depth, and Overall Condition Index (OCI). Developed as part of re-finements to ITD’s Transportation Asset Management System (TAMS), the OCI is unique to Idaho.
Idaho Measures - Pavement The Overall Condition Index (OCI) provides an overall pavement serviceability measure. The OCI is the weighted average of many different pavement performance factors and there is flexibility to add other measure that are deemed relevant. The OCI varies between 100 representing the best possible pavement and zero (0) denoting the poorest possible pavement. The American Society for Testing & Materials (ASTM) has adopted this rating criteria as a standard for determining the pavement condition of a road-way.
Under the OCI method pavement distresses are recorded and quantified. The distresses rec-orded are related to the pavement type being considered. Table 2-1 shows the various dis-tresses utilized during analysis. Quantification of distress type is based on extent and sever-ity. These values are input, for each distress type, into an equation that yields an Individual Distress Index (IDI). When each individual dis-tress type has been calculated, all of the IDI values are then input into the Overall Condition Index formula to compute the OCI for the pavement sec-tion. For each pavement type, two additional indices are computed with the methodology. Rigid pave-ment has the Slab Index and the Joint Index computed, while flexible pavements have the Structural Dis-tress Index and the Non-Structural Index computed. The main function of these values is to assist in PMS
OCI Pavement Distress Types
Flexible Rigid
Fatigue Cracking Slab Cracking Edge Cracking Joint Seal Damage
Transverse Cracking Joint Spalling Block Cracking Faulting
Patch Deterioration Map Cracking Raveling Studded Tire Wear
Table 2-1: OCI Distress Types

ITD Transportation Asset Management Plan 2019
2-2
decision tree configuration and treatment selection. A copy of the AgileAssets Pavement Management System Engineering Configuration Document is available upon request.
Idaho has adopted the pavement performance measures shown in Table 2-2. Measures for IRI and rutting are the same as federal measures. OCI is on a scale of 0 – 100, with 100 representing “perfect” pavements. This index is useful as it allows non-technical consumers of the data a quick and intuitive means to under-stand overall performance without needing to understand the details of the scores directly.
Table 2-2: Idaho Pavement Measures
Idaho Pavement Measures
International Roughness Index (IRI)
<95 Good 96-170 Fair >171 Poor
Overall Condition Index (OCI)
>=80 Good 79 - 60 Fair
< 59 Poor
Rutting Asphalt
<0.2 inches Good 0.21 - 0.4 inches Fair
>0.4 inches Poor
Idaho Performance Target - Pavement For all other non-NHS routes, ITD retains its existing pavement target that no more than 20 percent of lane miles are in poor condition. ITD will not use as the measure for these Non-NHS pavements the same criteria of Good, Fair, and Poor that it reports for the Federal measures (See Table 2-2). ITD believes that its own long-standing measures provide more insight into the distresses on each pavement, which allows more refined and timely identification of the proper pavement treatment. The non-NHS assets are not officially included in this asset management plan. In order to provide context for the other assets the agency manages, federal regulation allows mentioning these non-NHS assets.
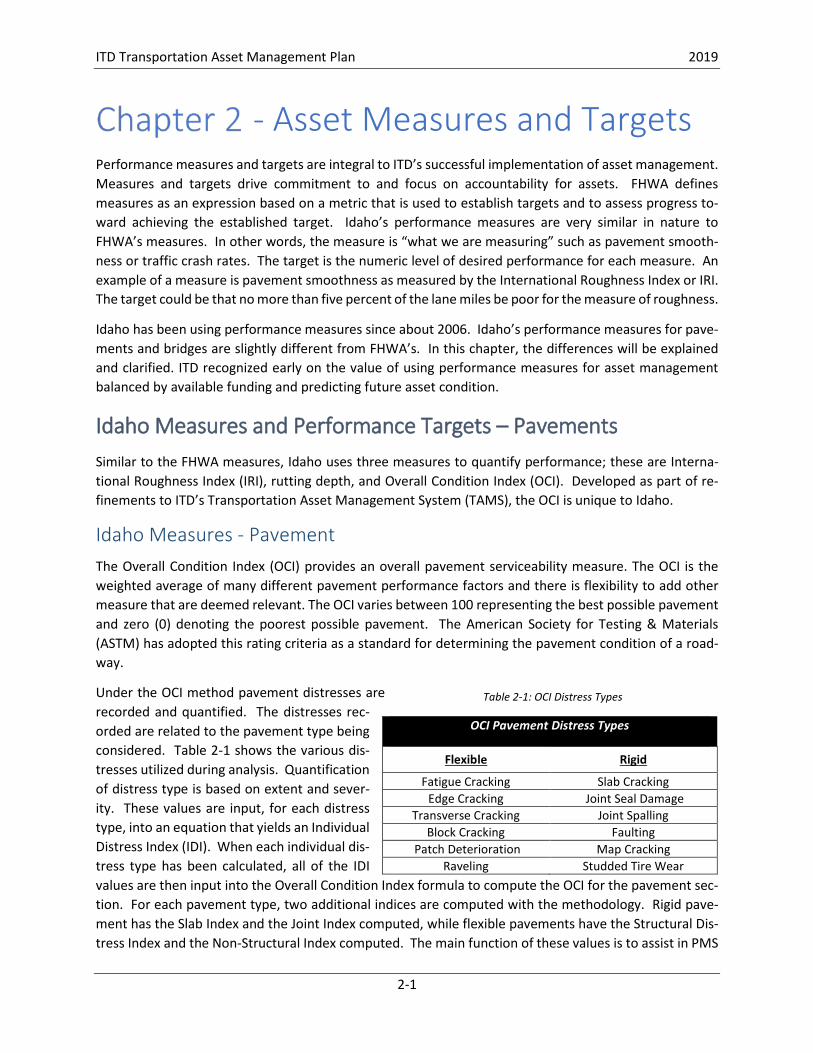
As seen in Figure 2-1, 85 percent of the entire State Highway System (SHS) is in good or fair condition. Because ITD maintains Interstates and Commerce routes to higher levels than all routes statewide, it ap-pears likely that ITD will continue meeting the Federal target. In addition, ITD uses a stricter standard for “poor” pavement than does FHWA. The long-term Idaho trend is for pavements to be generally stable with funding from the past 15-years keeping pavement conditions within a narrow range between 80 and 85 percent in good or fair condition for the entire network.
ITD Transportation Asset Management Plan 2019
2-3
Idaho Performance Measures and Targets – Bridges
Idaho Measures - Bridge ITD has successfully used a bridge performance measure for over 10 years for the purposes of prioritizing and optimizing the selection of its bridge preservation, rehabilitation, and replacement projects.
The Idaho Performance Measure for Bridges is the square footage of deck area on all State Highway Sys-tem (SHS) bridges in Good condition. There are several key things to note with this measure. First, ITD defines a bridge as any structure, including culverts, having a span length of 10 feet or greater. Second, using this definition for a bridge, the SHS is composed of currently 1,835 bridges with 12,659,970 square feet of deck area. This is the deck area of all bridges longer than 10 feet on Interstate, U.S. routes, and State Highway routes in Idaho. Finally, ITD evaluates the primary components on each bridge: the deck, superstructure, and substructure, or culvert condition.
• Decks are the horizontal portion of the bridge, usually made of concrete; the deck is atop the superstructure and includes the traffic-carrying surface.
• Bridge superstructure is the portion of the bridge that supports the deck, spans the opening, and connects the substructure elements.
• Bridge substructure is the portions of the bridge including piers and abutments that transfer the load from the superstructure to the foundations.
• Culvert is a buried structure such as a large pipe or box carrying a roadway
ITD evaluates each of these components and assigns a numeric (0-9) scale for each component per the definitions in the National Bridge Inventory (NBI). Each number on the scale corresponds to a condition descriptor, with 9 being a component in excellent or like new condition with no problems. The scale concludes at zero (0) with that component having failed and no longer useable or able to perform its intended function. The full depiction of the 0-9 scale is shown in Figure 2-2.
80% 81% 80% 82% 84%87% 86% 85% 86% 85% 85%
88%91% 93% 92% 92% 91% 90% 90% 90% 88% 86% 85%
50%55%60%65%70%75%80%85%90%95%
100%
% P
avm
ent G
ood
or F
air
Percent Pavment in Good or Fair Condition
Actual Projected Goal
Figure 2-1: 2018 State Highway System (SHS) Pavement Long Term Trend and Forecast (Federal Criteria)

ITD Transportation Asset Management Plan 2019
2-4
Figure 2-2: Crosswalk Idaho Bridge Measure to Federal Measure
NBI Rating 0 1 2 3 4 5 6 7 8 9
Description Failed Imminent Failure Critical Serious Poor Fair Satisfactory Good Very
Good Excellent
The lowest component rating for the deck, superstructure, and substructure or culvert sets the overall rating for the bridge. Any bridge with the deck, superstructure, and substructure or culvert all rated six or better is considered “Good” condition. Any bridge with any of these components rated less than sat-isfactory (six) is considered “Not Good”. The total deck area of all bridges in Good condition is summed up and compared to the total deck area for all SHS bridges.
Most recent Idaho Bridge Performance:
Figure 2-3: ITD Dashboard Showing Bridge Condition
Idaho Performance Target - Bridge The target for the Idaho Bridge Performance Measure is to achieve and maintain at least 80 percent of bridges in “Good” condition (six or better). Again, this is measured by deck area. For calendar year 2018, 75 percent of all of Idaho’s bridges on the interstate, U.S. routes and State Highway routes were in Good condition. Later chapters will discuss the 5 percent gap between the current performance and the desired target as well as strategies Idaho is taking to close this gap.
NOT GOOD GOOD

ITD Transportation Asset Management Plan 2019
2-5
Federal Performance Measures In 2012, Congress passed the Moving Ahead for Progress in the 21st Century Act, known as MAP-21. That act moved the Federal Highway program towards a performance-based focus. Included in the act were requirements to establish performance measures and to set performance targets. In addition, the act requires states to develop 10-year asset management plans for how they will sustain pavements and bridges in a state of good repair.
FHWA sets some performance measures and it has set two minimum condition levels. One minimum level is that no more than five percent of Interstate Highway pavement lane miles can be in poor condi-tion. Furthermore, no more than 10 percent of NHS bridge deck area can be in poor condition for three consecutive years.
The Federally required performance measures are:
1. Pavements.
• Percentage of Interstate pavements in Good condition • Percentage of Interstate pavements in Poor condition • Percentage of pavements on the non-Interstate NHS in Good condition • Percentage of pavements on non-Interstate NHS in Poor condition.
2. Bridges
• Percentage of NHS bridges in Good condition • Percentage of NHS bridges in Poor condition
Federal Performance Measure - Pavements For pavements, FHWA has separate methods for assessing the conditions of asphalt and concrete pave-ments. For asphalt pavements, it requires measurement by:
• IRI, which is the International Roughness Index, or a measure of how smooth the pavement is. A sophisticated data-collection vehicle determines the amount of “bounce” or roughness per mile.
• Cracking, or the percentage of cracks on each mile of pavement. • Rutting, or the amount of depression in the wheel path.
For concrete pavements, the metrics differ somewhat because concrete pavements don’t rut but they do “fault”, which means that the individual slabs rise or fall creating a “bump” between slabs. For concrete pavements, the measures are:
• IRI • Cracking • Faulting
Table 2-3 includes the measures and thresholds FHWA uses to determine if pavements are good, fair, or poor. If states have more than 5 percent of their Interstate pavements in poor condition, they must in-crease investments in Interstate pavements until they reach the five percent level.

ITD Transportation Asset Management Plan 2019
2-6
Table 2-3: Federal Measures for Asphalt and Concrete Pavements
Asphalt Pavements Concrete Pavements
International Roughness Index (IRI) International Roughness Index (IRI)
<95 Good <95 Good 96-170 Fair 96-170 Fair >171 Poor >171 Poor
Percent Cracking Percent Cracking
<5% Good <5% Good 6%-20% Fair 6%-15% Fair
>20% Poor >15% Poor
Rutting Faulting
<0.2 inches Good <0.1 inches Good 0.21 - 0.4 inches Fair 0.11 – 0.15 inches Fair
>0.4 inches Poor >0.15 inches Poor
The 2017 ITD HPMS pavement data, Table 2-4, indicate that ITD’s interstate pavement conditions are better than the required minimum Federal condition levels. The performance of the non-interstate NHS is slightly below the performance target.
Table 2-4: Idaho Interstate and NHS Pavement Conditions, 2019 HPMS Report
Percent Good Percent Fair Percent Poor
Interstate 65.6 34.2 0.2
Non-Interstate NHS 50.8 48.9 0.3
As seen in Table 2-4 , the amount of poor Interstate pavement conditions could triple and Idaho would remain beneath the federal minimum condition level of no more than five percent poor. The percentage of “Good” NHS pavement is slightly below the ITD target value of 50 percent has chosen. Chapter Four presents further discussion of this performance gap and mitigation strategies. The federal metrics, measures and performance criteria are the basis of these performance measures.
Although ITD has identified the NHS-Local jurisdiction as a sub-asset class and requested that it be ex-cluded from lifecycle planning, ITD acknowledges the importance of collecting data, monitoring the per-formance, and communicating to the jurisdictional agencies. ITD has and will continue to collect pave-ment data for this sub-class of assets. Table 2-5 is provided to demonstrate this commitment. Based on 2016 biennial HPMS data, this table shows both the performance of the Local NHS as well as the contri-bution to the overall SHS NHS performance. In Chapter Three, - Summary Description of Assets, examples

ITD Transportation Asset Management Plan 2019
2-7
are given of how ITD communicates system performance data.
Table 2-5: 2018 HPMS Local NHS Pavement Performance
NHS-Local % Good % Fair % Poor Not
Collected
NHS-Local 17.1% 42.4% 0.80% 39.7%
Contribution NHS Overall Performance 0.84% 2.08% 0.04% 4.91%
It warrants emphasis that ITD uses the same measures for asphalt and concrete pavements as set forth by federal regulation. ITD will continue to utilize these metrics to report, assess and predict NHS perfor-mance. Additionally, ITD has well established processes for pavement data collection that, for the near future, supports collection of pavement performance data to this end. That said, ITD utilizes accepted internal metrics, measures and reporting criteria for system performance monitoring, and lifecycle plan-ning. These measures are compared to the federal criteria and are shown in Table 2-6 on page 2-10.
Federal Performance Target – Pavement For this asset management plan, ITD sets the following pavement targets:
Target for Interstate pavements:
For Interstate Highway System pavement, the target is that no more than four percent of lane miles will be in poor condition, with poor defined as per the Federal measure of two or more distresses in the poor category. This gives ITD significant cushion to have Interstate conditions deteriorate and still be within the Federal target. For the percentage of good pavements, ITD adopts an Interstate Highway target of 50 percent.
Target for NHS pavements:
For NHS pavement, the target is that no more than eight percent of NHS lane miles will be in poor condi-tion as per the Federal measures of two or more distresses in the poor category and that 50 percent be in good condition.
Federal Performance Measure - Bridge For the Federally required asset management plan and performance reporting, ITD follows the criteria set by the FHWA for determining if bridges are in good, fair, or poor condition. The Federal Performance Measure is similar to the Idaho Performance Measure, but also has a couple of notable differences:
• A bridge is any structure, including culverts, having a span length of greater than 20 feet. • Only those bridges on the National Highway System (NHS) are considered for this measure. In
Idaho, there are 870 bridges with 8,816,021 square feet of deck area on the NHS.
Similar to the Idaho Performance Measure for Bridges, the Federal Performance Measure evaluates the
ITD Transportation Asset Management Plan 2019
2-8
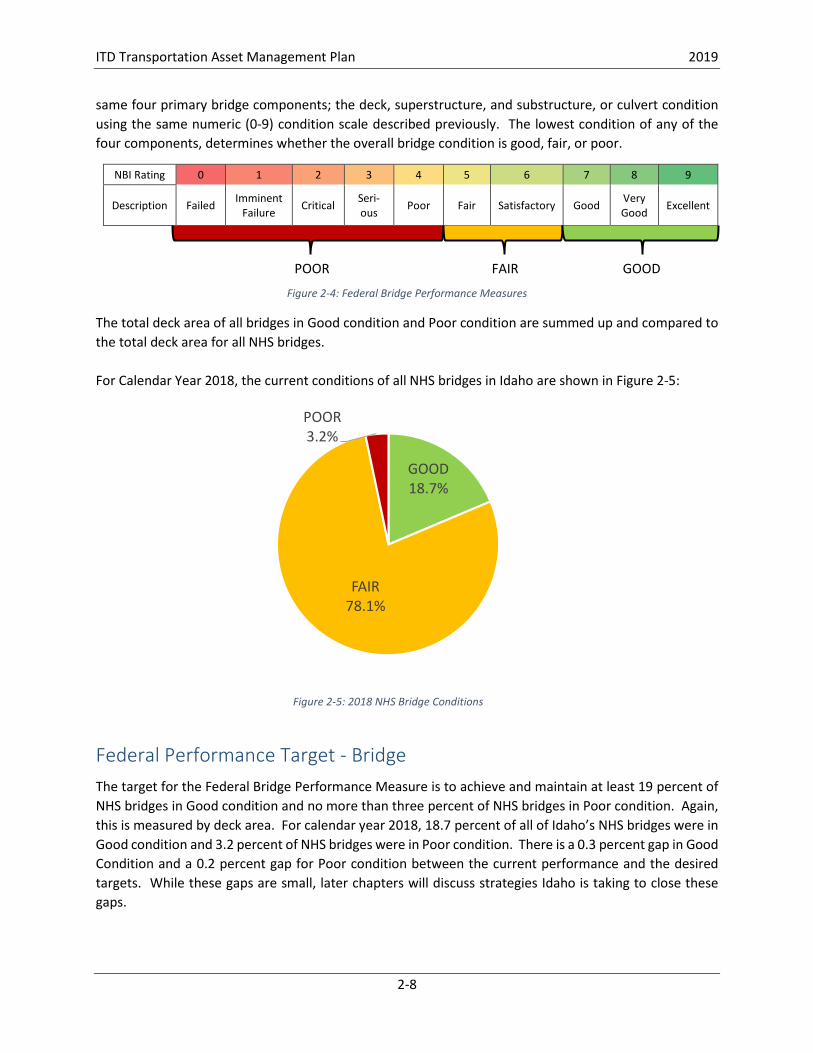
same four primary bridge components; the deck, superstructure, and substructure, or culvert condition using the same numeric (0-9) condition scale described previously. The lowest condition of any of the four components, determines whether the overall bridge condition is good, fair, or poor.
NBI Rating 0 1 2 3 4 5 6 7 8 9
Description Failed Imminent Failure Critical Seri-
ous Poor Fair Satisfactory Good Very Good Excellent
Figure 2-4: Federal Bridge Performance Measures
The total deck area of all bridges in Good condition and Poor condition are summed up and compared to the total deck area for all NHS bridges. For Calendar Year 2018, the current conditions of all NHS bridges in Idaho are shown in Figure 2-5:
Federal Performance Target - Bridge The target for the Federal Bridge Performance Measure is to achieve and maintain at least 19 percent of NHS bridges in Good condition and no more than three percent of NHS bridges in Poor condition. Again, this is measured by deck area. For calendar year 2018, 18.7 percent of all of Idaho’s NHS bridges were in Good condition and 3.2 percent of NHS bridges were in Poor condition. There is a 0.3 percent gap in Good Condition and a 0.2 percent gap for Poor condition between the current performance and the desired targets. While these gaps are small, later chapters will discuss strategies Idaho is taking to close these gaps.
POOR GOOD FAIR
GOOD18.7%
FAIR78.1%
POOR3.2%
Figure 2-5: 2018 NHS Bridge Conditions

ITD Transportation Asset Management Plan 2019
2-9
Comparing the Idaho and Federal Performance Measures
Pavements With respect to pavement condition reporting Idaho’s determination of good, fair or poor is different from the federal measure. The federal measure is new and based upon criteria of roughness, rutting, faulting, and percent cracking. The basis for determining roughness and rutting condition are the same between ITD and the federal measures. For example for pavement cracking, ITD measures the same pavement distresses but compiles them into a different index, the Overall Condition Index or OCI. ITD emphasizes that this measure is consistent with ITD internal reporting purposes only: supplanting the federal crack measure is not the intent. The most fundamental difference lies not with the measures, but rather with the way measures are utilized to assign the performance condition. As shown in Table 2-6, the difference between ITD performance criteria to federal criteria is that the lowest measure (roughness, OCI, rutting) determines the pavement section overall performance. This is analogous to the so-called, three leg stool model, which means that the stool will lean in the direction of the lowest of the three legs. Federal per-formance is much more liberal in that it requires two of the three criteria to be poor for the section to be rated as poor. More specifically, the federal performance criteria require all three measures must be good to be classified as good condition; poor condition requires two measures to be poor. Everything else is fair condition.

ITD Transportation Asset Management Plan 2019
2-10
Table 2-6: Pavement Measures and Condition Crosswalk Table
FHWA ITD
Performance Measures:
International Roughness Index (IRI) International Roughness Index (IRI)
Percent Cracking (Asphalt or Concrete) Overall Condition Index (OCI)*
Rutting (Asphalt Only) Rutting (Asphalt Only)
Faulting Concrete (Concrete Only)
Performance Criteria:
All performance measures “Good” = “Good”
Lowest of performance measures determines pavement performance. Two Performance measures “Poor” = “Poor”
All other combinations = “Fair”
*The Overall Condition Index is a composite index (0-100) based on structural and non-struc-tural pavement distresses determined by the manifestation of various crack types. Good: OCI >80; Fair: OCI Between or equal to 60 & 80; Poor: OCI<60. A complete discussion on the computation and use of OCI is contained in the most current version of the “Pavement Management System Engineering Configuration Document “maintained by ITD Asset Manage-ment.
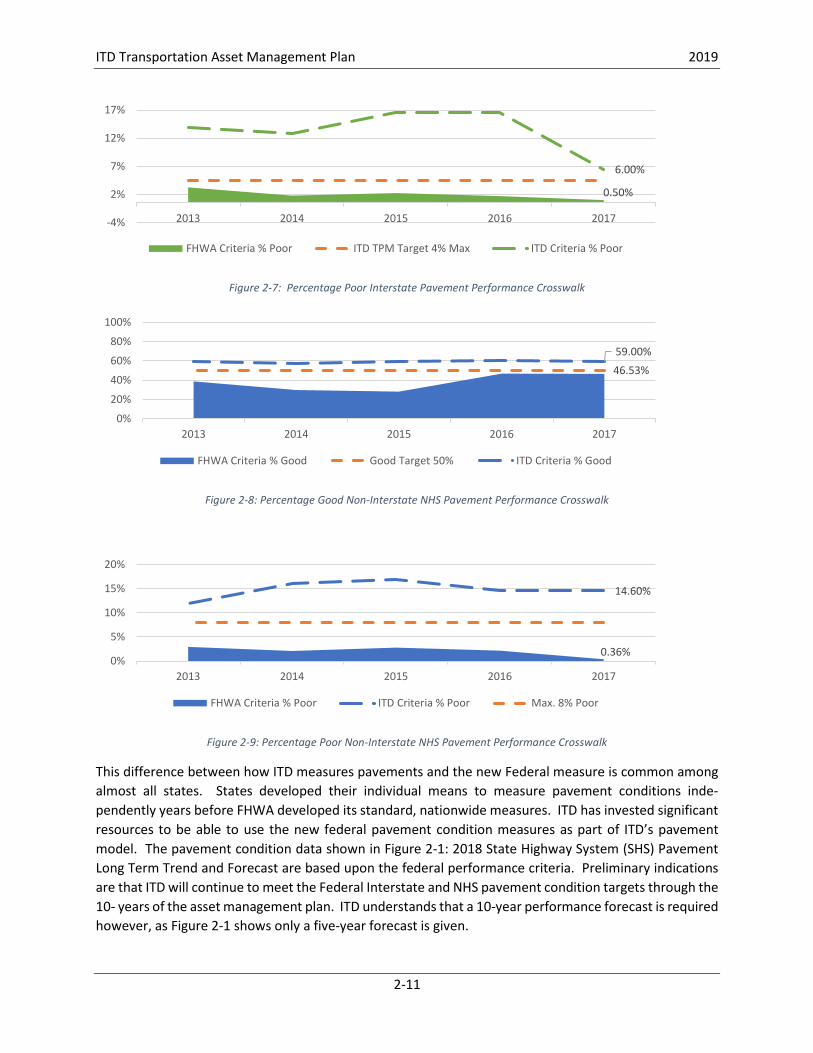
ITD reviewed past performance of the interstate and non-NHS assets, according to the federal criteria, to establish the pavement performance targets. For all criteria reviewed, there is a difference between the FHWA value and the ITD value. This is the manifestation of the difference in approach to performance criteria given in Table 2-6. Figure 2-6 through Figure 2-9 show this data.
Figure 2-6: Percentage Good Interstate Pavement Performance Crosswalk
52.67%
71.34%
0%
20%
40%
60%
80%
100%
2013 2014 2015 2016 2017
FHWA Criteria % Good ITD TPM Target 50% ITD Criteria % Good
ITD Transportation Asset Management Plan 2019
2-11
Figure 2-7: Percentage Poor Interstate Pavement Performance Crosswalk
Figure 2-8: Percentage Good Non-Interstate NHS Pavement Performance Crosswalk
Figure 2-9: Percentage Poor Non-Interstate NHS Pavement Performance Crosswalk
This difference between how ITD measures pavements and the new Federal measure is common among almost all states. States developed their individual means to measure pavement conditions inde-pendently years before FHWA developed its standard, nationwide measures. ITD has invested significant resources to be able to use the new federal pavement condition measures as part of ITD’s pavement model. The pavement condition data shown in Figure 2-1: 2018 State Highway System (SHS) Pavement Long Term Trend and Forecast are based upon the federal performance criteria. Preliminary indications are that ITD will continue to meet the Federal Interstate and NHS pavement condition targets through the 10- years of the asset management plan. ITD understands that a 10-year performance forecast is required however, as Figure 2-1 shows only a five-year forecast is given.
0.50%
6.00%
-4%
2%
7%
12%
17%
2013 2014 2015 2016 2017
FHWA Criteria % Poor ITD TPM Target 4% Max ITD Criteria % Poor
46.53%59.00%
0%
20%
40%
60%
80%
100%
20172016201520142013
FHWA Criteria % Good Good Target 50% ITD Criteria % Good
0.36%
14.60%
0%
5%
10%
15%
20%
20172016201520142013
FHWA Criteria % Poor ITD Criteria % Poor Max. 8% Poor

ITD Transportation Asset Management Plan 2019
2-12
Bridge When comparing the Idaho and Federal Performance Measures it is important to note that the Idaho Performance Measure distinguishes between “Not Good” and “Good” whereas the Federal Performance Measure uses three striations, “Poor”, “Fair” and “Good”. ITD utilizes this approach, as it is simpler and is particularly helpful when talking with the public and our Idaho State Legislature. Table 2-7 presents a crosswalk between the Idaho and Federal Performance Measures.
Table 2-7: Comparison between Idaho and Federal Performance Measures
Rating Condition Idaho
Performance Measure
Federal Performance
Measure 0 Failed
“Not Good” Poor
1 Imminent Failure 2 Critical 3 Serious 4 Poor 5 Fair
Fair 6 Satisfactory
“Good” 7 Good
Good 8 Very Good 9 Excellent
Conclusion ITD uses the FHWA performance measures as its measures for the asset management plan and for the required FHWA performance reporting. ITD has set two and four year targets as shown in Table 2-8.
Table 2-8: Performance Measures and Targets Crosswalk
Performance Measure Federal Measure
Federal 2 & 4 Year
Targets ITD Measure ITD 2 & 4
Year Targets
Pavement
Interstate NHS Percent Good 50%
SHS Percent Good or Fair 80%
Interstate NHS Percent Poor 4% Non-Interstate NHS Percent Good
50%
Non-Interstate NHS Percent Poor
8%
Bridge NHS Bridge Percent Good 19%
SHS Bridges Percent Good 80% NHS Bridge Percent Poor 3%

ITD Transportation Asset Management Plan 2019
3-1
- Summary Description of As-sets Background ITD manages a diverse highway network that serves the rapidly growing Boise area, mountainous tourist areas such as Coeur d’Alene, near-desert climates, and sprawling regions stretching from northern Utah to the Canadian border.
ITD’s transportation inventory reflects the geology, geography, and economy of the state. Idaho is a rel-atively large, lightly populated state with a growing population. It is the nation’s 14th largest in terms of area with 83,569 square miles.i Its 2016 estimated population of 1.68 million is the nation’s 13th smallest. Idaho’s population grew by 115,558 between 2010 and 2016, the 10th fastest growing state in the nation. ii However, the growth is concentrated with 83 percent of it occurring in three counties, Ada, Canyon, and
Kootenai. Ada and Canyon counties include the met-ropolitan Boise area while Kootenai County includes Coeur d’Alene. Twenty counties lost population between 2010 and 2016, while another 16 grew by less than 1,000 people over five years.iii
A snapshot of the state’s population and economy shows a lightly populated state with a diverse econ-omy. Boise is by far the state’s largest city with 218,281 people, more than
twice the size of the next largest which are Meridian and Nampa with both around 90,000 people. Idaho’s unemployment rate is low with a February 2018 unemployment rate of 2.9 percent. However, it has the 15th lowest annual household income of $47,583 per year. iv A list of Idaho’s 35 largest private employers is dominated by hospitals and retailers but also includes Micron manufacturing, Battelle Energy Alliance, Bechtel Marine Propulsion, and several manufacturers employing more than 1,000 people. v Tourism also is a large sector in Idaho employing an estimated 2,800 people and contributing about $500 million in direct payroll. vi
Commodities are a significant portion of the Idaho economy and create demand for heavy trucks. Forestry and timbering contributed to Idaho’s economy about $2.6 billion in 2014 in direct sales. vii The mining and oil industries employ about 3,200 workers with a payroll of about $278 million in 2012. viii In addition,
Figure 3-1: The I. B. Perrine Bridge, US 93, over the Snake River Canyon, Twin Falls, Idaho
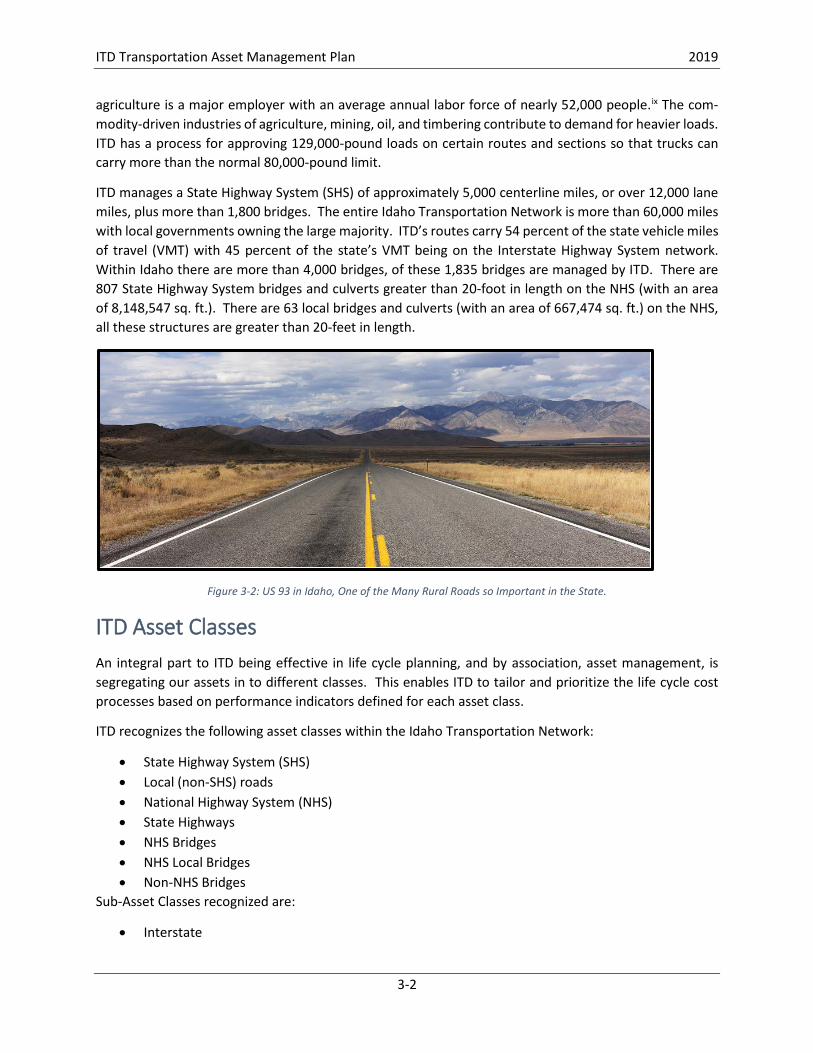
ITD Transportation Asset Management Plan 2019
3-2
agriculture is a major employer with an average annual labor force of nearly 52,000 people.ix The com-modity-driven industries of agriculture, mining, oil, and timbering contribute to demand for heavier loads. ITD has a process for approving 129,000-pound loads on certain routes and sections so that trucks can carry more than the normal 80,000-pound limit.
ITD manages a State Highway System (SHS) of approximately 5,000 centerline miles, or over 12,000 lane miles, plus more than 1,800 bridges. The entire Idaho Transportation Network is more than 60,000 miles with local governments owning the large majority. ITD’s routes carry 54 percent of the state vehicle miles of travel (VMT) with 45 percent of the state’s VMT being on the Interstate Highway System network. Within Idaho there are more than 4,000 bridges, of these 1,835 bridges are managed by ITD. There are 807 State Highway System bridges and culverts greater than 20-foot in length on the NHS (with an area of 8,148,547 sq. ft.). There are 63 local bridges and culverts (with an area of 667,474 sq. ft.) on the NHS, all these structures are greater than 20-feet in length.
Figure 3-2: US 93 in Idaho, One of the Many Rural Roads so Important in the State.
ITD Asset Classes An integral part to ITD being effective in life cycle planning, and by association, asset management, is segregating our assets in to different classes. This enables ITD to tailor and prioritize the life cycle cost processes based on performance indicators defined for each asset class.
ITD recognizes the following asset classes within the Idaho Transportation Network:
• State Highway System (SHS) • Local (non-SHS) roads • National Highway System (NHS) • State Highways • NHS Bridges • NHS Local Bridges • Non-NHS Bridges
Sub-Asset Classes recognized are:
• Interstate

ITD Transportation Asset Management Plan 2019
3-3
• State Jurisdictional NHS • Local Jurisdictional NHS • Commerce Routes • Non-Commerce Routes. • Rigid Pavements • Flexible Pavements
Figure 3-3 presents graphical representation of this taxonomy.
Figure 3-3: Idaho Transportation Network Asset Classes
The Figure 3-4 summarizes the distri-bution of lane miles based on the asset classes recognized by ITD. As shown in Figure 3-4, the majority of the State Highway System, 62 percent, is com-prised of National Highway System (NHS) facilities. Non-Interstate road-ways comprise two-thirds of the Idaho NHS system. With respect to bridges, Figure 3-5 shows the distribution of to-tal deck area and highlights that 47 percent of the total deck area is lo-cated on the NHS, with just four per-cent of that belonging to local jurisdic-tions. Provided in Appendix A is a complete listing of the assets by asset class.
State Non -NHS38%
Interstate21%
NHS - Non Interstate
41%
State NHS 62%
Figure 3-4: SHS Lane Miles Distribution
Local Roads System ~48,000 lane miles
& 2,160 Bridges
Idaho Transportation Network
~60,000 Lane Miles & 4,000 Bridges
State NHS 7,140 lane miles & 807 Bridges
Non-Interstate 4,633 lane miles & 378 Bridges
Interstate 2,507 lane miles & 429 Bridges
Local NHS 441 lane miles & 63 Bridges
State Highway System 12,273 lane miles &
1,835 Bridges
State Non-NHS 4,692 lane miles &
1,028 Bridges
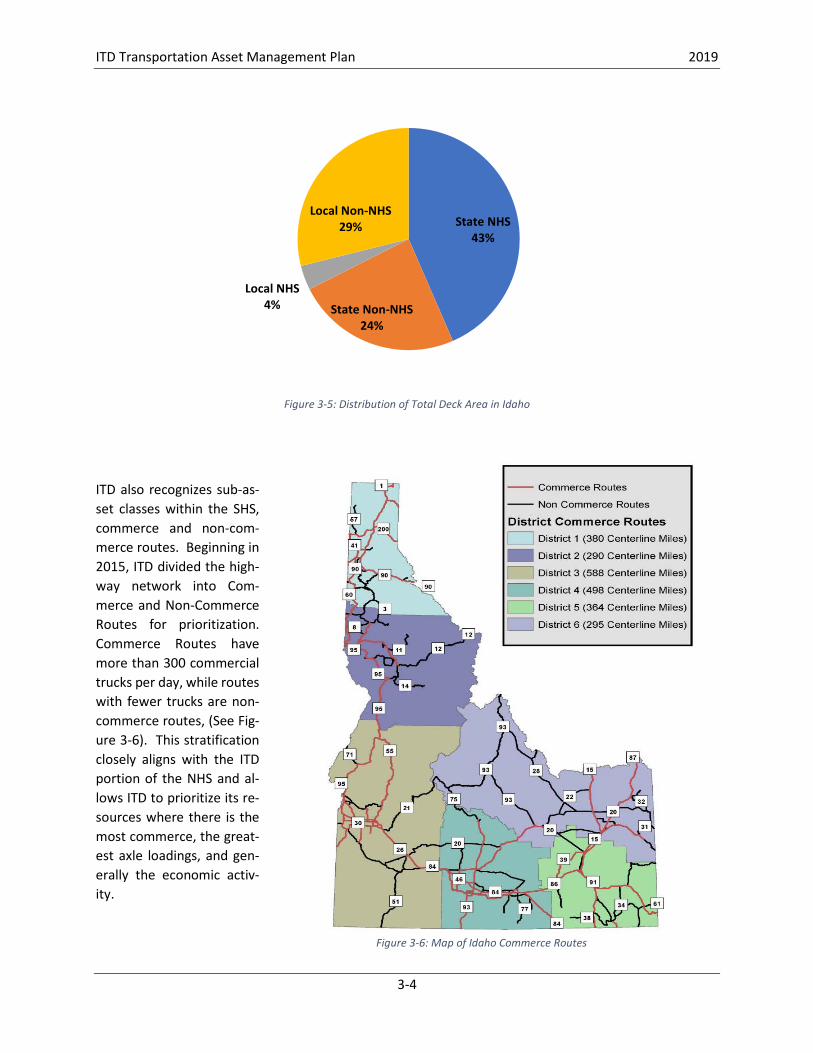
ITD Transportation Asset Management Plan 2019
3-4
ITD also recognizes sub-as-set classes within the SHS, commerce and non-com-merce routes. Beginning in 2015, ITD divided the high-way network into Com-merce and Non-Commerce Routes for prioritization. Commerce Routes have more than 300 commercial trucks per day, while routes with fewer trucks are non-commerce routes, (See Fig-ure 3-6). This stratification closely aligns with the ITD portion of the NHS and al-lows ITD to prioritize its re-sources where there is the most commerce, the great-est axle loadings, and gen-erally the economic activ-ity.
State NHS43%
State Non-NHS24%
Local NHS4%
Local Non-NHS29%
Figure 3-6: Map of Idaho Commerce Routes
Figure 3-5: Distribution of Total Deck Area in Idaho
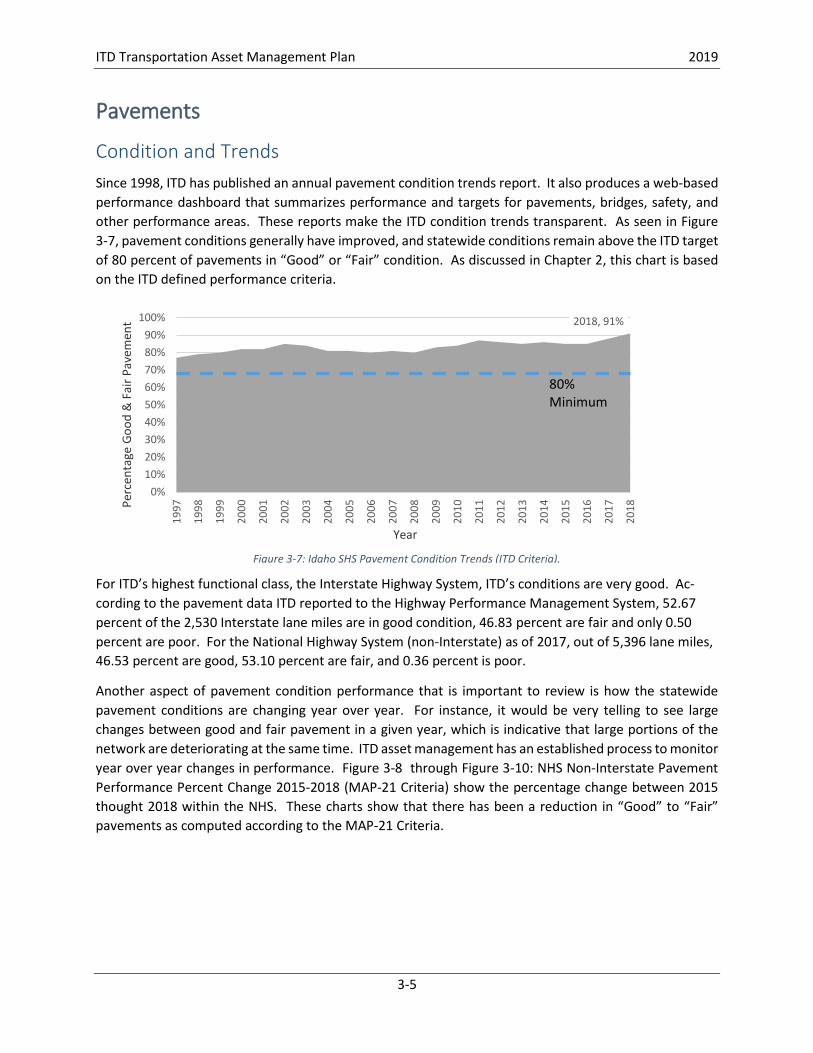
ITD Transportation Asset Management Plan 2019
3-5
Pavements
Condition and Trends Since 1998, ITD has published an annual pavement condition trends report. It also produces a web-based performance dashboard that summarizes performance and targets for pavements, bridges, safety, and other performance areas. These reports make the ITD condition trends transparent. As seen in Figure 3-7, pavement conditions generally have improved, and statewide conditions remain above the ITD target of 80 percent of pavements in “Good” or “Fair” condition. As discussed in Chapter 2, this chart is based on the ITD defined performance criteria.
For ITD’s highest functional class, the Interstate Highway System, ITD’s conditions are very good. Ac-cording to the pavement data ITD reported to the Highway Performance Management System, 52.67 percent of the 2,530 Interstate lane miles are in good condition, 46.83 percent are fair and only 0.50 percent are poor. For the National Highway System (non-Interstate) as of 2017, out of 5,396 lane miles, 46.53 percent are good, 53.10 percent are fair, and 0.36 percent is poor.
Another aspect of pavement condition performance that is important to review is how the statewide pavement conditions are changing year over year. For instance, it would be very telling to see large changes between good and fair pavement in a given year, which is indicative that large portions of the network are deteriorating at the same time. ITD asset management has an established process to monitor year over year changes in performance. Figure 3-8 through Figure 3-10: NHS Non-Interstate Pavement Performance Percent Change 2015-2018 (MAP-21 Criteria) show the percentage change between 2015 thought 2018 within the NHS. These charts show that there has been a reduction in “Good” to “Fair” pavements as computed according to the MAP-21 Criteria.
Figure 3-7: Idaho SHS Pavement Condition Trends (ITD Criteria).
2018, 91%
0%10%20%30%40%50%60%70%80%90%
100%
1997
1998
1999
2000
2001
2002
2003
2004
2005
2006
2007
2008
2009
2010
2011
2012
2013
2014
2015
2016
2017
2018Pe
rcen
tage
Goo
d &
Fai
r Pav
emen
t
Year
80% Minimum

ITD Transportation Asset Management Plan 2019
3-6
Figure 3-8: NHS Pavement Performance Percent Change 2015-2018 (MAP-21 Criteria)
Figure 3-9: NHS Interstate Pavement Performance Percent Change 2015-2018 (MAP-21 Criteria)
15.2%
0.2%
18.3%
Good
Fair
0.2%
Poor
0.0%
0.1%
18.5%
15.5%
16.3%
0.3%
21.0%
Good
Fair
0.1%
Poor
0.0%
0.1%
21.3% 16.5%
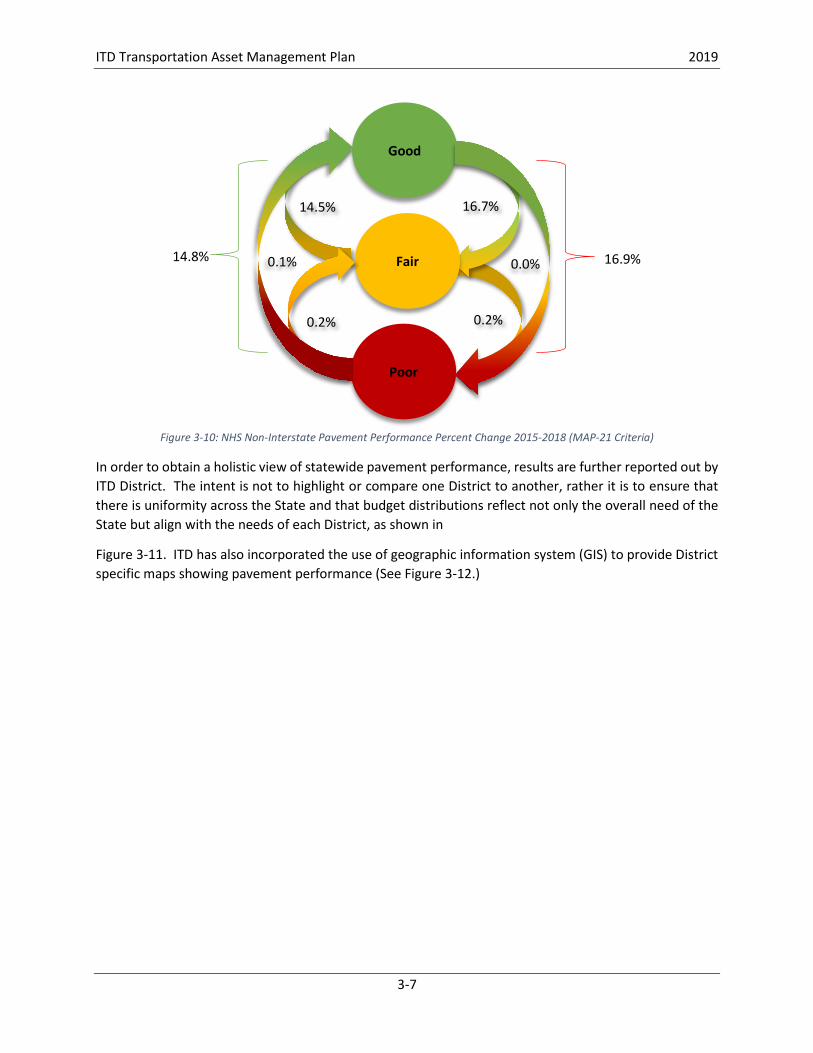
ITD Transportation Asset Management Plan 2019
3-7
Figure 3-10: NHS Non-Interstate Pavement Performance Percent Change 2015-2018 (MAP-21 Criteria)
In order to obtain a holistic view of statewide pavement performance, results are further reported out by ITD District. The intent is not to highlight or compare one District to another, rather it is to ensure that there is uniformity across the State and that budget distributions reflect not only the overall need of the State but align with the needs of each District, as shown in
Figure 3-11. ITD has also incorporated the use of geographic information system (GIS) to provide District specific maps showing pavement performance (See Figure 3-12.)
14.5%
0.2%
16.7%
Good
Fair
0.2%
Poor
0.0%
0.1%
16.9% 14.8%

ITD Transportation Asset Management Plan 2019
3-8
Figure 3-11: Overview of State Highway System Pavement Performance by District (ITD Criteria)

ITD Transportation Asset Management Plan 2019
3-9
Figure 3-12: Example of GIS Map to Report Pavement Conditions (ITD Criteria)

ITD Transportation Asset Management Plan 2019
3-10
Measurement and Management Process ITD uses a more stringent performance standard for assessing pavement condition. The reader is referred to Table 2-6: Pavement Measures and Condition Crosswalk Table on page 2-10. The intent of the ITD performance standard is to identify and mitigate deficient pavements well in advance of the national per-formance standard set by FHWA. This section describes the history, process, measures, and results of ITD’s pavement management process.
Over the years, ITD has updated the pavement management and pavement-selection processes. In 1978, it acquired a mainframe Pavement Management System (PMS) and by 1986, it was using the system to perform simplistic economic analysis and optimization. In 2007, it shifted to the Highway Economic Re-quirements System State model (HERS-ST). In 2009, it purchased a commercial pavement and Mainte-nance Management System (MMS). The PMS includes inventories, calibrated deterioration curves, deci-sion trees, performance models, and an optimization analysis engine.
ITD uses the current system at a network level to indicate how much should be invested in pavements to achieve the department’s target, and how the funds should be split between preservation and rehabilita-tion or replacement. The system is not used at the project level. The network analysis is broken down by district, and the analysis used to allocate funds to the districts.
Once districts receive their pavement allocations, they identify projects based partially on the PMS infor-mation. Often, district engineers pick projects based upon local conditions, pavement condition reports, their own judgment, and local political input. ITD has pavement-design manuals, which help material engineers design treatments to maximize the pavement’s lifecycle performance. The analyses have led to many pavement rehabilitation projects on the higher-volume Interstates to achieve a good life-cycle result. In addition, the districts have a preservation budget to work with which they also can use to im-prove the life-cycle performance of pavements.
The district-identified pavement projects are directly uploaded into the pavement management system and ITD runs the projects in the PMS analysis engine. The analysis uses the deterioration curves and programmed projects to calculate how the program will benefit the pavement network.
The extent of ITD’s pavement data collection and analysis allow staff to analyze pavement conditions from many perspectives to assess overall performance. ITD is not only concerned about pavement smoothness but this process also analyzes rutting which, when excessive, can contribute to crashes because of water laying in the wheel path depressions. Cracking can also be analyzed to determine what types of treatments a pavement requires, or how long a pavement will perform. ITD provides substantial pavement distress data to its districts for them to analyze their pavement conditions and needed treatments. Examples of this data, based on the FHWA measures, are shown in Figure 3-13 through Figure 3-16. These figures show the percentage of good, fair, poor as well as three year average of the data.
Historically, the PMS used thresholds in the cracking index and roughness index to determine whether or not a pavement is Good, Fair, “Poor” or “Very Poor”. These thresholds were triggered by two tiers of thresholds, based on the functional class of a roadway:
• Tier 1: Interstates and arterials • Tier 2: Collectors
ITD Transportation Asset Management Plan 2019
3-11
Districts would use the “Poor” or “Very Poor” threshold notification to realize that a roadway was ready for a structural project. Through 2009, what was called the Classic Methodology employed only two measurements to determine performance rating: the cracking index and roughness index. In 2010, an improved Profiler van technology and the new PMS system led to the addition of a third measurement to determine pavement performance and rutting depth. Rutting depth was first applied in 2010 as a method to rate pavements. Utilizing three criteria to determine performance is often referred to as the “3-legged stool” model. The analogy is that if one leg of a 3-legged stool is broken, then the stool will not stand. Likewise, if any one of the three criteria that determines pavement performance is “Poor” or “Very Poor” is then the roadway is classified as “Poor” or “Very Poor” irrespective of the other two indices.
ITD vs. Federal Pavement Measurement The ITD standard of considering a pavement to be rated as “Poor” if one criteria is poor is more stringent than the Federal standard. FHWA regulation considers a pavement to be poor only if it is poor in two of the three criteria. Although ITD uses its own tried and true criteria for measuring its pavements and qualifying pavement performance and conditions, when ITD measures its pavements by the Federal standards it shows very little poor pavement. Table 2-4 shows that when measured by the Federal criteria, only 0.6 percent of the 2018 State Highway System was in what FHWA could classify as poor condition. By the Federal measure, 52.8 percent was good in 2018 and 46.7 percent was fair.
Although ITD reports the pavement data to FHWA to satisfy the Federal regulations, ITD also utilizes this information to monitor the different aspects of pavement performance. Examples of these charts are provided on the following pages. ITD will continue using its performance criteria for reporting pavement performance to its Board, the public, and to its District Offices. ITD believes that its criteria better supports pavement-selection decisions.

ITD Transportation Asset Management Plan 2019
3-12
Figure 3-13: National Highway System Pavement Conditions Calculated by the FHWA Standards
Figure 3-14: Rutting Conditions on the National Highway System
2015 SHS 2016 SHS 2017 SHS 2016 HPMS:Interstate
2016 HPMS:Non-Interstate
Projected2017 HPMS -
Interstate
Projected2017 HPMS -
Non-Interstate% Good 54.9% 50.8% 50.9% 49.9% 46.8% 52.0% 47.0%
% Fair 44.8% 48.8% 48.6% 48.9% 51.0% 47.0% 52.0%
% Poor 0.3% 0.4% 0.5% 1.2% 2.2% 1.0% 1.0%
0%
15%
30%
45%
60%Pe
rcen
t of M
iles
2015 2016 2017Percent Good 78.63% 74.71% 72.83%Percent Fair 19.53% 22.70% 23.82%Percent Poor 1.84% 2.60% 3.35%
0%
20%
40%
60%
80%
100%
Perc
ent o
f Mile
s
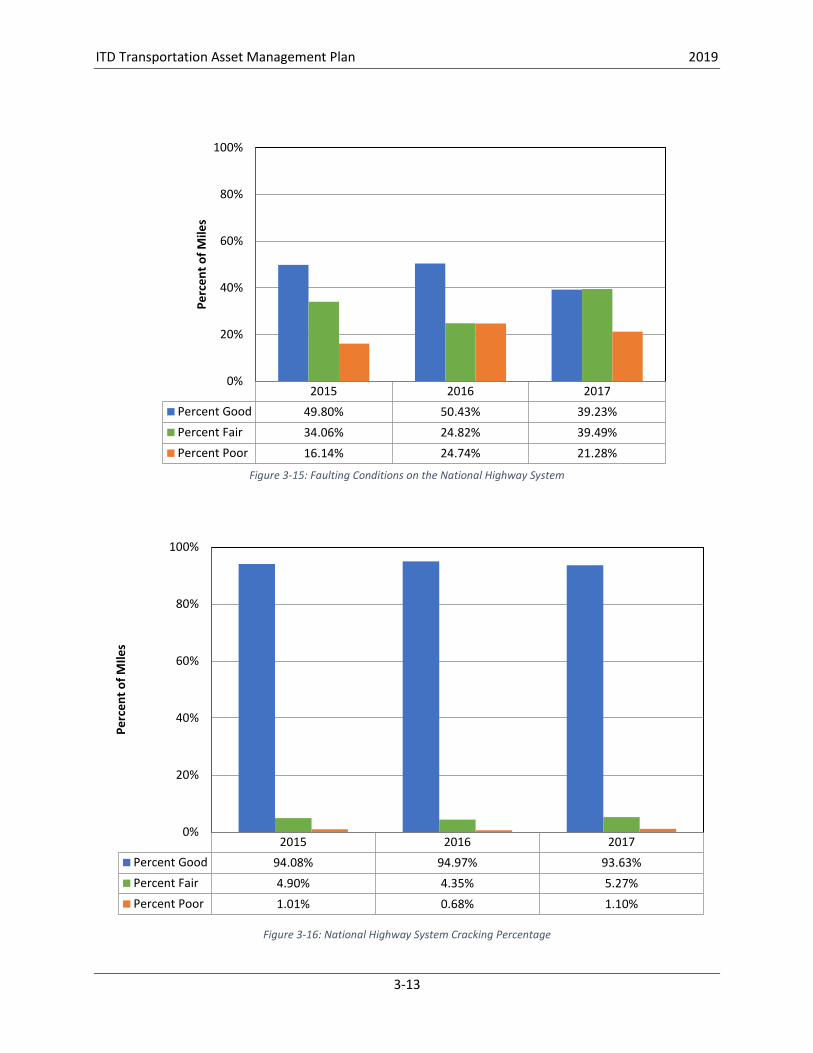
ITD Transportation Asset Management Plan 2019
3-13
2015 2016 2017Percent Good 94.08% 94.97% 93.63%Percent Fair 4.90% 4.35% 5.27%Percent Poor 1.01% 0.68% 1.10%
0%
20%
40%
60%
80%
100%
Perc
ent o
f MIle
s
2015 2016 2017Percent Good 49.80% 50.43% 39.23%Percent Fair 34.06% 24.82% 39.49%Percent Poor 16.14% 24.74% 21.28%
0%
20%
40%
60%
80%
100%
Perc
ent o
f Mile
s
Figure 3-15: Faulting Conditions on the National Highway System
Figure 3-16: National Highway System Cracking Percentage

ITD Transportation Asset Management Plan 2019
3-14
Bridge There are 4,283 bridges within the State of Idaho owned by State and local governments. These include bridges that are greater than 10 feet in length on the State system and greater than 20 feet in length on the Local system. A description of bridge assets, their conditions and trends will be presented in a similar manner as the performance measures and targets presented in Chapter 2. For the Idaho Bridge Perfor-mance Measure, bridge data for the State Highway System (SHS) will be presented. For the Federal Bridge Performance Measure, bridge data for the National Highway System (NHS) will be presented.
Idaho SHS Description of Assets ITD owns and manages the State Highway System (SHS) in the State of Idaho. The SHS includes all inter-state, U.S. and State Highway routes in the State of Idaho. On all of these routes, there are 1,835 bridges greater than 10 feet in length and they comprise 12,659,970 square feet of deck area, seen in Figure 3-17 and Table 3-1. Idaho’s Bridge Performance Measure as presented in Chapter 2 includes all of the SHS bridges in that measure.
Table 3-1: SHS Bridge Distribution
SHS Bridges* Count Deck Area
Interstate Bridges 711 6,320,395 sq. ft.
US Route Bridges 571 4,006,997 sq. ft.
Other State Route Bridges 553 2,332,578 sq. ft.
Total State Highway System (SHS) Bridges 1835 12,659,970 sq. ft.
*Includes bridges with spans between 10’ to 20’
Other State Route Bridges, 18.4%
US Route Bridges, 31.7%
Interstate Bridges, 49.9%
Figure 3-17: SHS Bridge Distribution
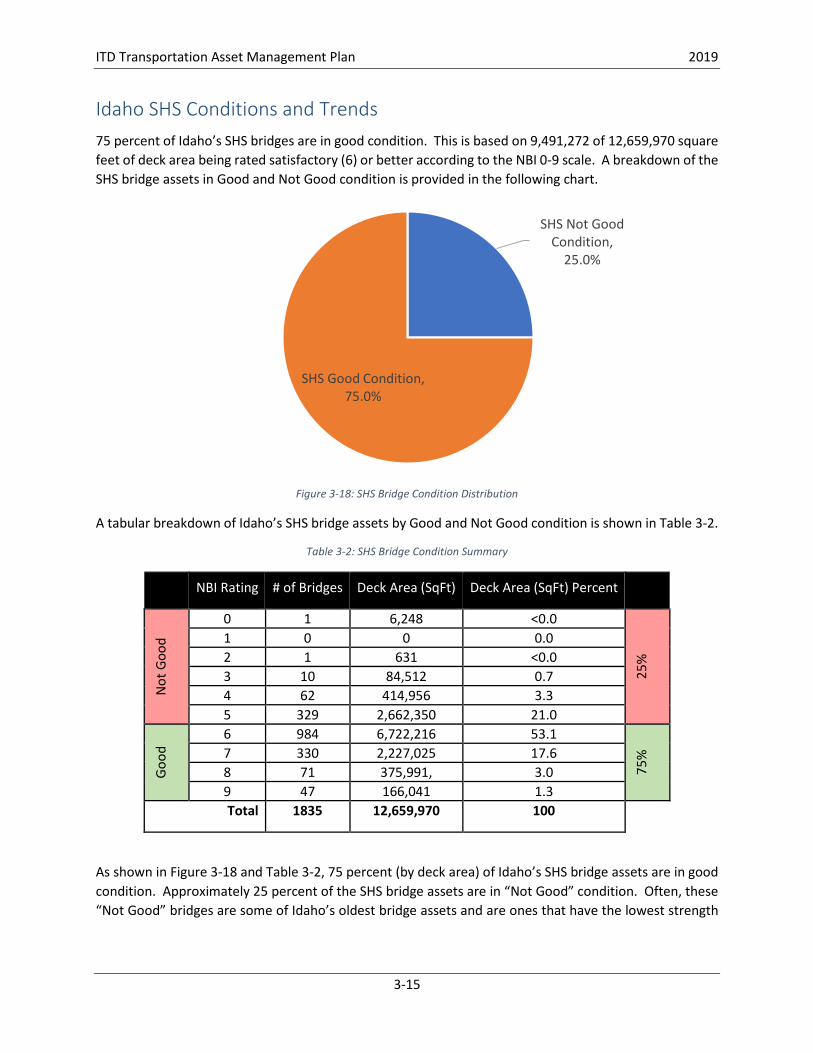
ITD Transportation Asset Management Plan 2019
3-15
Idaho SHS Conditions and Trends 75 percent of Idaho’s SHS bridges are in good condition. This is based on 9,491,272 of 12,659,970 square feet of deck area being rated satisfactory (6) or better according to the NBI 0-9 scale. A breakdown of the SHS bridge assets in Good and Not Good condition is provided in the following chart.
Figure 3-18: SHS Bridge Condition Distribution
A tabular breakdown of Idaho’s SHS bridge assets by Good and Not Good condition is shown in Table 3-2.
Table 3-2: SHS Bridge Condition Summary
NBI Rating # of Bridges Deck Area (SqFt) Deck Area (SqFt) Percent
Not
Goo
d
0 1 6,248 <0.0 25
%
1 0 0 0.0 2 1 631 <0.0 3 10 84,512 0.7 4 62 414,956 3.3 5 329 2,662,350 21.0
Good
6 984 6,722,216 53.1
75%
7 330 2,227,025 17.6 8 71 375,991, 3.0 9 47 166,041 1.3 Total 1835 12,659,970 100
As shown in Figure 3-18 and Table 3-2, 75 percent (by deck area) of Idaho’s SHS bridge assets are in good condition. Approximately 25 percent of the SHS bridge assets are in “Not Good” condition. Often, these “Not Good” bridges are some of Idaho’s oldest bridge assets and are ones that have the lowest strength
SHS Not Good Condition,
25.0%
SHS Good Condition, 75.0%
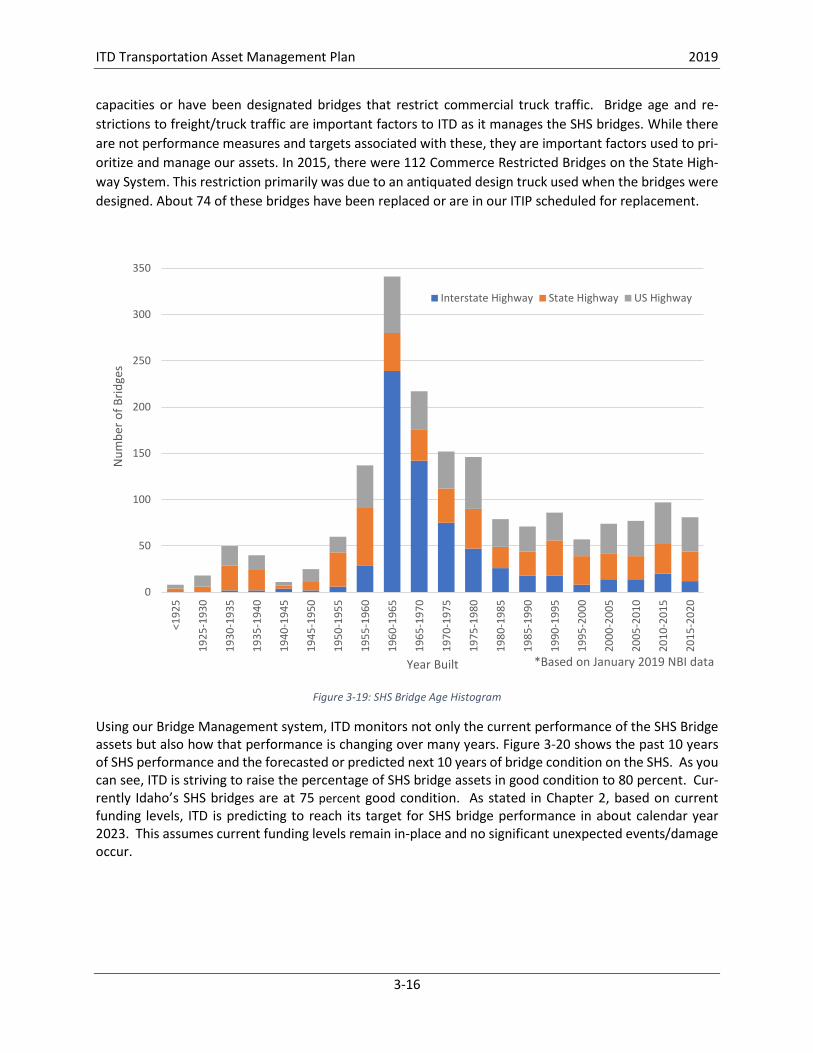
ITD Transportation Asset Management Plan 2019
3-16
capacities or have been designated bridges that restrict commercial truck traffic. Bridge age and re-strictions to freight/truck traffic are important factors to ITD as it manages the SHS bridges. While there are not performance measures and targets associated with these, they are important factors used to pri-oritize and manage our assets. In 2015, there were 112 Commerce Restricted Bridges on the State High-way System. This restriction primarily was due to an antiquated design truck used when the bridges were designed. About 74 of these bridges have been replaced or are in our ITIP scheduled for replacement.
Figure 3-19: SHS Bridge Age Histogram
Using our Bridge Management system, ITD monitors not only the current performance of the SHS Bridge assets but also how that performance is changing over many years. Figure 3-20 shows the past 10 years of SHS performance and the forecasted or predicted next 10 years of bridge condition on the SHS. As you can see, ITD is striving to raise the percentage of SHS bridge assets in good condition to 80 percent. Cur-rently Idaho’s SHS bridges are at 75 percent good condition. As stated in Chapter 2, based on current funding levels, ITD is predicting to reach its target for SHS bridge performance in about calendar year 2023. This assumes current funding levels remain in-place and no significant unexpected events/damage occur.
0
50
100
150
200
250
300
350
<192
5
1925
-193
0
1930
-193
5
1935
-194
0
1940
-194
5
1945
-195
0
1950
-195
5
1955
-196
0
1960
-196
5
1965
-197
0
1970
-197
5
1975
-198
0
1980
-198
5
1985
-199
0
1990
-199
5
1995
-200
0
2000
-200
5
2005
-201
0
2010
-201
5
2015
-202
0
Num
ber o
f Brid
ges
Year Built *Based on January 2019 NBI data
Interstate Highway State Highway US Highway

ITD Transportation Asset Management Plan 2019
3-17
Figure 3-20: SHS Forecasted Bridge Performance
Figure 3-21, shows changes in SHS bridge conditions for the past 4 years (2015-2018). Later chapters will discuss how ITD is managing its SHS bridge assets and the strategies it is using to improve performance of the SHS bridges.
67% 68% 67%70% 71%
74%72%
74% 74% 75% 75% 74% 75% 76% 76%78%
79% 80% 80% 80% 80% 80% 80%
50%
55%
60%
65%
70%
75%
80%
85%
Actual Predicted ITD Goal: 80%
Figure 3-21: 2015 to 2018 Idaho SHS Condition Trend Bridge Performance (% Deck Area)
4.1%
1.0%
5.6%
Good (NBI Rating
7 - 9)
Fair (NBI Rating
6, 5)
0.4%
Poor (NBI Rating
0 - 4)
1.2%
2.0%
7.8%
6.5%

ITD Transportation Asset Management Plan 2019
3-18
Idaho NHS Description of Assets There are 870 Bridges on the National Highway System (NHS) in the State of Idaho. Consistent with the Federal definition of a bridge and as stated in Chapter 2, these are bridges, including culverts, which are longer than 20 feet in length. ITD owns and manages the vast majority of NHS bridges in the State at 92 percent, but not all of the NHS bridges are state owned. Local governments in Idaho own a small portion of the NHS at about eight percent of total deck area. The Federal Bridge Performance Measure as pre-sented in Chapter 2 includes all of the NHS bridges in that measure. Table 3-3 shows the portions of the NHS that are owned by the State and local governments in Idaho.
Table 3-3: Bridge Ownership
Bridge Asset Class Bridge Count Deck Area
Sq. Ft. Percent
State owned NHS Bridges 807 8,148,547 92.4%
Local owned NHS Bridges 63 667,474 7.6%
Total NHS System 870 8,816,021 100.0%
Note: Includes bridges and culverts > 20-foot in length
Idaho NHS Conditions and Trends Of the 870 bridges, and over 8.8 million square feet of deck area, 19 percent, 78 percent, and three per-cent of Idaho’s NHS bridges are in good, fair and poor condition, respectively. Table 3-4 shows the break-down of NHS bridge assets in Good, Fair, and Poor condition as well as the portions owned by the State and the local governments. This table is based on the end of Calendar Year 2018 data.
Table 3-4: Bridge Ownership and Performance
Bridge Asset Class
Federal Condition Criteria Good Fair Poor Total
State NHS
Bridges
157 bridges with 1,487,757 SF of deck area
16.9% by deck area
622 bridges with 6,378,352 SF of deck area
72.3% by deck area
28 bridges with 282,438 SF of deck area
3.2% by deck area
807 bridges with 8,148,547 SF of deck area
92.4% by deck area
Local NHS
Bridges
25 bridges with 161,983 SF of deck area
1.8% by deck area
37 bridges with 502,607 SF of deck area
5.7% by deck area
1 bridges with 2,884 SF of deck area <0.0% by deck area
63 bridges with 667,474 SF of deck area
7.6% by deck area
Total NHS System
182 bridges with 1,649,740 SF of deck area
18.7% by deck area
659 bridges with 6,880,959 SF of deck area
78.1% by deck area
29 bridges with 285,322 SF of deck area
3.2% by deck area
870 bridges with 8,816,021 SF deck area
100% by deck area
Note: Includes bridges and culverts > 20-foot in length

ITD Transportation Asset Management Plan 2019
3-19
Using our Bridge Management system, ITD monitors not only the current performance of the NHS Bridge assets but also how that performance is changing over many years. As shown in the Figure 3-22, changes in bridge conditions for the NHS are shown for the past four years (2015-2018).
Figure 3-22: 2015 to 2018 Idaho NHS Condition Trend Bridge Performance (Percent Deck Area)
For the years 2015-2018, approximately 6.8 percent of NHS bridge deck area declined in condition. This decline in condition is largely attributable to normal wear and tear on bridges from vehicular traffic, nor-mal deterioration from weather and exposure to the elements, as well as damage caused by unexpected events whether that be human caused or natural disasters. Through the transportation investments that ITD and the locals made in the NHS bridge assets, approximately 7.4 percent of NHS bridge deck area im-proved in condition. These investments came in the form of replacing worn out bridges, repairing bridges, and preserving those bridges that were in good and fair condition. ITD is striving to hold the percentage of NHS bridge assets in good condition at 19 percent. Currently Idaho’s NHS bridges are at 18.7 percent in good condition with another 78.1 percent in fair condition. Only 3.2 percent of NHS bridges are in poor condition. As stated in Chapter 2, based on current funding levels, ITD’s target for NHS bridge performance is to maintain current conditions. Later chapters will discuss how ITD is managing its NHS bridge assets and the strategies it is using to main-tain performance of the NHS bridges.
2.9%
2.2%
4.6%
Good (NBI Rating
7 - 9)
Fair (NBI Rating
5, 6)
2.2%
Poor (NBI Rating
0 - 4)
0.0%
2.3%
6.8%
7.4%

ITD Transportation Asset Management Plan 2019
3-20
Obtaining Data from Local NHS Owners
A FHWA requirement is that States develop processes for obtaining data on locally owned NHS pavements and bridges. ITD collects pavement condition annually on the entire NHS. ITD also inspects all the bridges on the NHS. Therefore, ITD will have no problem continuing to acquire condition and performance data on the entire NHS network. ITD has developed many web-based tools to facilitate communication of condition information to the various jurisdictions owning NHS assets.
Communicating the performance data is equally important to collection and analysis. In order to facilitate compiling, synthesizing and communication of performance data ITD has made significant investments to incorporate geographical information systems (GIS) within the asset management framework. Examples are presented on the following pages in Figure 3-23 and Figure 3-24.
Figure 3-23: 2017 HPMS Pavement Conditions Based on 2016 data
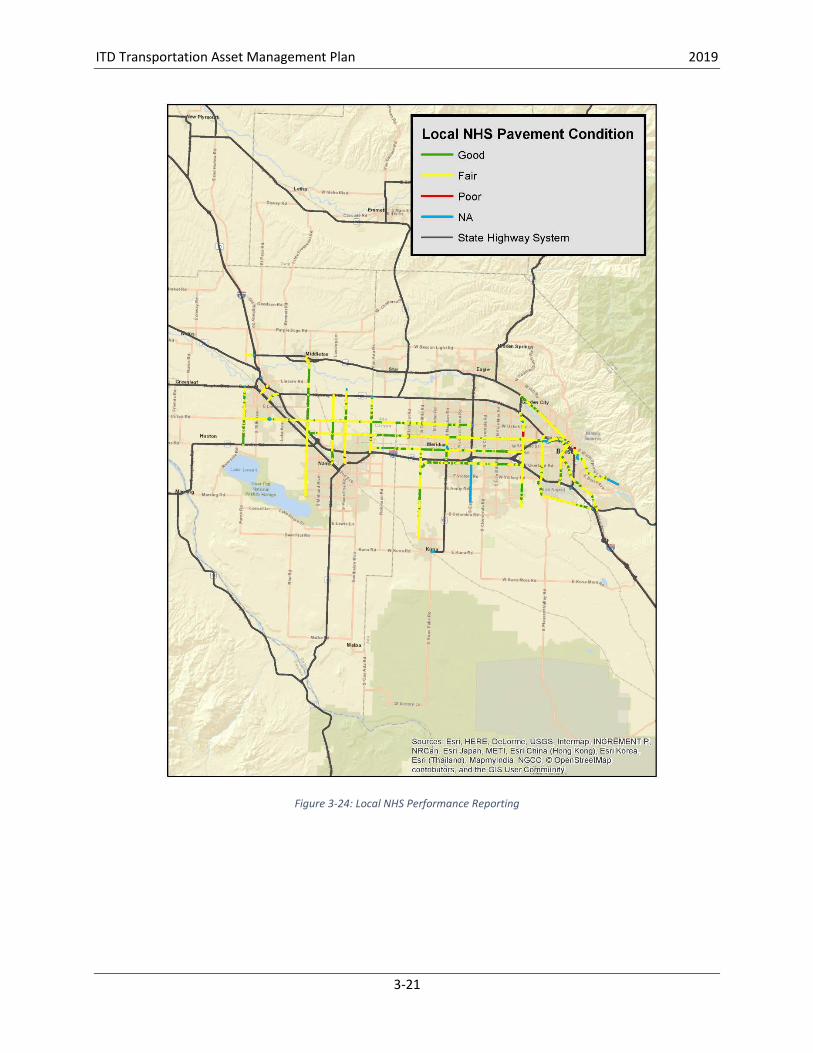
ITD Transportation Asset Management Plan 2019
3-21
Figure 3-24: Local NHS Performance Reporting
ITD Transportation Asset Management Plan 2019
3-22
i U.S. Census State Area Measurements and Internal Point Coordinates, 2016 ii U.S. Census Table 1 Annual Estimates of Population for the United States, Regions, States, and Puerto Rico: April 1, 2010, to July 1, 2016 iii Idaho Department of Labor, Idaho 2015 Census Tables, County Estimates, May 19, 2016 iv U.S. Census American Fact Finder Median Household Income 2011-2015 Estimates v Idaho Department of Labor, Top Private Businesses in Idaho vi Hyer, J., Idaho Tourism Industry, 2013, for the Idaho Department of Labor, vii The College of Natural Resources at the University of Idaho and the Bureau of Business and Economic Research at the University of Montana, Idaho’s Forest Products Industry Current Conditions and 2015 Forecast, January 2015. viii Petersen, S., Economic Impacts of Idaho Mining Association Member Firms, 2007-2012, Dec. 2016 ix Idaho Department of Labor, Total estimated agricultural employment by area and year, as of December 2016

ITD Transportation Asset Management Plan 2019
4-1
- Gap Analysis Process HWA regulations require the asset management plan to include a perfor-
mance gap analysis which FHWA defines as the gaps between the current asset conditions and the targets for asset con-ditions. In addition, gaps could be issues in which asset conditions prevent the transportation system from operating ef-fectively because of poor conditions.
By the Federal definition, ITD does not have a gap between its current pavement asset conditions and its targets for asset conditions.
ITD’s bridge conditions surpass its targets of having at least 19 percent good and no more than 3 percent poor. ITD NHS bridges and Interstate pavements easily surpass the Federal minimum condition levels.
For the 2018 TAMP a gap existed in ITD’s ability to use its management systems to forecast the condition of State Highway System pavements and bridges. For the 2019 TAMP ITD reports closing this gap. ITD has the ability to perform analysis for the 10 years of the asset management-planning horizon. ITD also will continue its focus on Interstate and NHS pave-ments to achieve the 50 percent good target level, while not exceeding its threshold for poor conditions.
Steps in the Gap Analysis Process In preparation for developing and updating the Idaho Transportation Investment Program and for demon-strating asset management plan implementation, ITD conducts annual reviews of updated pavement and bridge condition data. ITD staff compares the results of the annual condition data with the forecasted
F Gap Requirements The asset management rule in Sec. 515.7 (a) says, “A State DOT shall establish a process for conducting performance gap analysis to identify deficiencies hindering progress to-ward improving or preserving the NHS and achieving and sustaining the desired state of good repair. The asset man-agement rule describes a performance gap as:
Performance gap means the gaps between the current asset condition and State DOT targets for asset condition, and the gaps in system performance effectiveness that are best ad-dressed by improving the physical assets.
FHWA’s guidance to its divisions that will be certifying TAMPs tells them to look for the following required ele-ments.
The TAMP must describe a methodology, with regard to the physical condition of the assets, for:
• Identifying gaps affecting the State DOT targets for the condition of NHS pavements and bridges as es-tablished pursuant to 23 U.S.C. 150(d).
• Identifying deficiencies hindering progress toward achieving and sustaining the desired state of good repair (as defined by the State DOT).
• Developing alternative strategies that will close or address the identified gaps.
The TAMP must describe a methodology for analyzing gaps in the performance of the NHS that affect NHS bridges and pavements regardless of their physical condition that will:
• Identify deficiencies in the effectiveness of the NHS in providing safe and efficient movement of people and goods. (23 CFR 515.7(a)(2)
• Identify strategies to close or address the identified gaps. (23 CFR 515.7(a)(3))
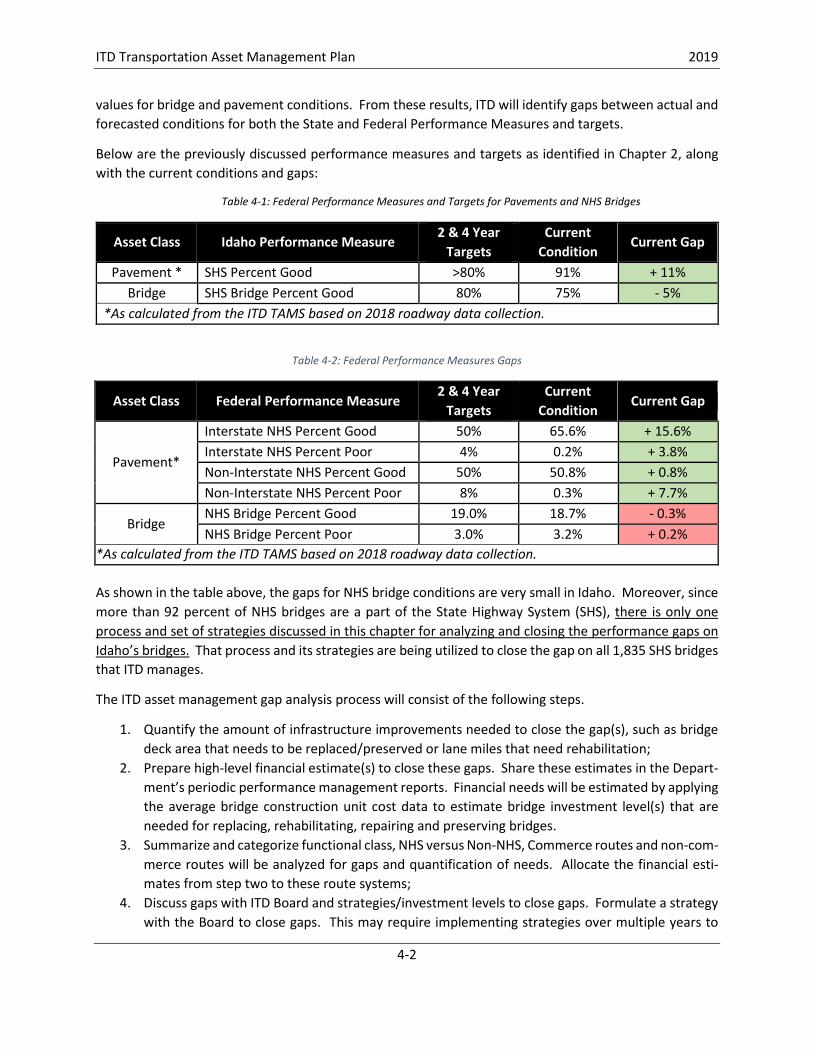
ITD Transportation Asset Management Plan 2019
4-2
values for bridge and pavement conditions. From these results, ITD will identify gaps between actual and forecasted conditions for both the State and Federal Performance Measures and targets.
Below are the previously discussed performance measures and targets as identified in Chapter 2, along with the current conditions and gaps:
Table 4-1: Federal Performance Measures and Targets for Pavements and NHS Bridges
Table 4-2: Federal Performance Measures Gaps
Asset Class Federal Performance Measure 2 & 4 Year
Targets Current
Condition Current Gap
Pavement*
Interstate NHS Percent Good 50% 65.6% + 15.6% Interstate NHS Percent Poor 4% 0.2% + 3.8% Non-Interstate NHS Percent Good 50% 50.8% + 0.8% Non-Interstate NHS Percent Poor 8% 0.3% + 7.7%
Bridge NHS Bridge Percent Good 19.0% 18.7% - 0.3% NHS Bridge Percent Poor 3.0% 3.2% + 0.2%
*As calculated from the ITD TAMS based on 2018 roadway data collection. As shown in the table above, the gaps for NHS bridge conditions are very small in Idaho. Moreover, since more than 92 percent of NHS bridges are a part of the State Highway System (SHS), there is only one process and set of strategies discussed in this chapter for analyzing and closing the performance gaps on Idaho’s bridges. That process and its strategies are being utilized to close the gap on all 1,835 SHS bridges that ITD manages.
The ITD asset management gap analysis process will consist of the following steps.
1. Quantify the amount of infrastructure improvements needed to close the gap(s), such as bridge deck area that needs to be replaced/preserved or lane miles that need rehabilitation;
2. Prepare high-level financial estimate(s) to close these gaps. Share these estimates in the Depart-ment’s periodic performance management reports. Financial needs will be estimated by applying the average bridge construction unit cost data to estimate bridge investment level(s) that are needed for replacing, rehabilitating, repairing and preserving bridges.
3. Summarize and categorize functional class, NHS versus Non-NHS, Commerce routes and non-com-merce routes will be analyzed for gaps and quantification of needs. Allocate the financial esti-mates from step two to these route systems;
4. Discuss gaps with ITD Board and strategies/investment levels to close gaps. Formulate a strategy with the Board to close gaps. This may require implementing strategies over multiple years to
Asset Class Idaho Performance Measure 2 & 4 Year
Targets Current
Condition Current Gap
Pavement * SHS Percent Good >80% 91% + 11% Bridge SHS Bridge Percent Good 80% 75% - 5%
*As calculated from the ITD TAMS based on 2018 roadway data collection.

ITD Transportation Asset Management Plan 2019
4-3
align with funding, resource, or economic constraints. 5. Work with District staff to prioritize needs on the NHS, SHS, and other systems. Working from
route system level needs described in step three, the Department will formulate buildable pro-jects and program those projects which improve the overall system performance the most;
6. Vet projects through the annual Idaho Transportation Investment Program development process. Once approved, develop and build the projects;
7. Work with the Idaho State Legislature to increase transportation revenue and work with other stakeholders to identify alternative sources of funding such as public-private partnerships as needed.
Non-Condition Based System Performance Gap Analysis ITD incorporates our mission of safety mobility and economic opportunity into our planning efforts. Some of the goals from our planning documents are provided to demonstrate this:
Freight:
• Improve the safety of operations for freight carriers in Idaho • Enhance Idaho’s freight system mobility for industries to efficiently transport goods to market • Support the economy and the vitality of Idaho and its communities.
Public Transportation:
• Ensure the Safety and Security of Public Transportation • Encourage Public Transportation as an Important Element of an Effective Multi-Modal Transpor-
tation System in Idaho • Preserve the Existing Public Transportation Network • Provide a Transportation System that Drives Economic Opportunity
Active Transportation:
• Support economic vitality that enables a high standard of living, facilitates the retention and growth of Idaho businesses, attracts new business to the state, and enables employers to attract and retain a highly skilled and creative workforce
• Develop and maintain a transportation system that is safe, effective, reliable, and accessible for residents and visitors as they use all modes to travel anywhere, from within their neighborhoods and communities to throughout the state
ITD’s 2040 Long-Range Transportation Plan (pending FHWA approval) shares the same planning perspec-tive of incorporating ITD’s mission of safety, mobility by reaffirming those themes in our long-term goals:
• Commit to providing the safest transportation system possible. • Provide a mobility-focused transportation system that drives economic opportunity. • Become the best organization by continually developing employees and implementing innova-
tive business practices.
ITD’s 2040 Long-Range Transportation Plan incorporates the importance of asset management planning

ITD Transportation Asset Management Plan 2019
4-4
as part of the planning process by identifying the importance of using life cycle curves that account for growth by updating conditions and traffic information on a regular basis. In addition to the highlighting of ITD’s asset management planning, ITD’s Long-Range Transportation Plan identifies the role of engineer-ing and data assistance in the planning for asset life cycle versus public involvement in system manage-ment. This helps identify to the public the expectation of participation in various planning roles at ITD.
For non-asset management project selection of highway projects. ITD has a Safety and Capacity Program that strategically pools several funding sources to maximize the ability to provide projects that both en-hance safety and provide additional capacity in congestion areas. Several of the funding sources are state funded and have legislatives requirements that must be met. The projects that are constructed from this program contribute to asset management by resetting life cycle curves to new or rehabilitated conditions.
ITD also has a legislatively authorized Grant Anticipation Revenue Vehicle (GARVEE) program that allows for additional improvements to state highways. There are corridors across that state that are eligible for GARVEE funds, a combination of congestion, safety and asset conditions are used by the Idaho Transpor-tation Board for the selection of GARVEE funded projects.
Along with the process described above, ITD staff are always collaborating across the organization amongst bridge and pavement subject matter experts to include:
• Materials and Pavement Engineers; • District construction staff and personnel; • ITD staff who develops the Highway Safety Improvement plan; • Those who issue truck size and weight permits; • MPO and ITD travel demand modelers who assess travel time across the highway network, par-
ticularly in urban areas; • Agency leadership to innovate and find ways to stretch limited transportation revenues further.
In addition, ITD is constantly analyzing its asset management data and process to:
• Determine if increased investments or tradeoffs from other programs would result in better sys-tem performance;
• Review materials, treatment types, and construction methods to find more durable longer lasting solutions;
• Continually calibrate the Department’s asset deterioration curves and other elements of bridge and pavement forecasting models;
• Continually assess financial trends in the highway construction market through construction cost data to optimize advertising and letting of construction contracts;
• Assess whether increased maintenance efforts will result in cost effective gains in closing the performance gaps.
Consultation also will occur through the Three “C “planning process (continuing, cooperative, comprehen-sive) that occurs with the MPOs. The recent planning rule, Sec. 450.314(h) requires that States, MPOs, and operators of public transportation jointly agree upon and develop specific written provisions for co-operatively developing and sharing information related to transportation performance data, the selection
ITD Transportation Asset Management Plan 2019
4-5
of performance targets, the reporting of performance targets, the reporting of performance to be used in tracking progress toward attainment of critical outcomes for the region of the MPO, and the collection of data for the State asset management plan for the NHS. As part of this joint, collaborative process, ITD will seek from the regional planners and operators of transit agencies any identified gaps that impede achieve-ment of the safe, efficient movement of goods or people on the NHS.
As part of finding solutions to close performance gaps, ITD will use its planning and asset management process to develop alternative investment strategies to present to the Idaho Transportation Board. In order to present several alternatives to the Board, ITD staff will:
• Run several iterations of bridge and pavement investment strategy scenarios using the bridge and pavement models. These iterations will be run to ensure optimal balances between asset classes are being achieved;
• Analyze several investment scenarios. These scenarios could include varying levels of increasing investments in assets and tradeoffs between asset classes.
o Additional scenarios could also be run to address specific concerns. For example, ITD would analyze the effects of increasing bridge investments if posted structures were found to be restricting freight movement on NHS connectors or other key routes.
• Review maintenance strategies to determine if any of the gaps could be alleviated through a shift in maintenance forces and resources;
• Make adjustments in targets; • Promote adoption of new or different materials or treatments if, for example, a new material
emerges that is superior to conventional methods and practices;
As alternative strategies are developed, they will be presented to the ITD board along with their implica-tions related to funding, tradeoffs with other asset classes, and/or their impact on system performance. At the direction of the Idaho Transportation Board, the approved strategies will be implemented to ad-dress the performance of the SHS and NHS and to close performance gaps.
Process Improvements Completed As part of the 2018 TAMP, ITD identified that there was a gap in the pavement performance module. Extensive work occurred to close this gap resulting. This effort was part of the continuous improvement process that ITD applies to all of its asset management efforts.
These specific system enhancements have been completed and implemented in 2019:
1. Revision to performance models and analysis of actual performance to comply with FHWA requirement to report and forecast performance on 1/10-mile interval out to the required 10-year horizon.
2. ITD developed and incorporated a process to model and forecast the FHWA specified perfor-mance measures.
3. ITD TAMS Database was modified better track and report out ITD targets for each asset class or asset sub-group into the LCCP analysis.

ITD Transportation Asset Management Plan 2019
4-6
Additional Process Improvements Even with current asset management systems in place and performance management well integrated into the culture of ITD, the Department continues to take steps to enhance several asset management pro-cesses. These enhancements will improve the accuracy of future asset management plans and further optimize the Department’s management of its road and bridge assets. Planned enhancements include:
ITD will continue developing the BrM Bridge Management System. ITD has been using the AASHTO Bridge Management system known as “BrM” for many years to house current and historical condition data for bridge assets. While condition data collection and storage is well engrained at ITD, the bridge deterioration forecasting, modeling of future conditions and investment scenario optimization modules are still relatively new. Further, the software vendor is still developing these modules to improve fore-casting reliability and accuracy. ITD is currently implementing these additional modules of BrM to com-plement the multi-objective optimization processes that ITD has been using for many years. The multi-objective process is discussed in Chapter 5. ITD will continue to implement the deterioration forecasting, modeling, and scenario optimization modules in BrM to enhance its bridge asset management processes. This work is partially dependent upon improvements being made to BrM by the software vendor.
ITD commits to the following work plan for bridge management process improvements:
• Continue to refine BrM decision trees to reflect ITD policy by 2020; • Continue to calibrate BrM deterioration models to match Idaho’s historical bridge performance
by 2021; • Continue to incorporate cost/benefit analysis and life cycle cost analysis into ITD’s planning and
programming (STIP) by 2021.
Assess the long-term consequences of the Non-Commerce Route treatments. ITD has divided all routes into Commerce and Non-Commerce routes. Non-Commerce routes handle less than 300 trucks per day. Because of higher priorities in other programs, ITD has limited for several years the treatments on Non-Commerce routes to preservation-type treatments and is not funding structural repairs to Non-Commerce pavements. Although Non-Commerce pavement conditions improved from 2015 to 2016, many district staff expressed concern that the strategy is not sustainable. They fear that only applying chip seals or thin surface treatments will lead to pavement structure deterioration that will be costly in the long term to correct. ITD will assess the long-term effects and determine the degree to which the Non-Commerce routes can be sustained with the current policy.
Assess the Long-Term Needs of ITD’s Largest Bridge Structures. ITD’s ten (10) largest bridges by deck area have an average age of 31 - years old and comprise 1,525,306, square feet of deck area. Just these 10 bridges out of the 1,835 represent 12 percent of all bridge deck area on the SHS. These bridges are on key routes carrying some of the highest traffic volumes in the State and often are key crossings with long and costly detours around them if one or more were closed or restricted to traffic. Several of them have current conditions in the fair range and are expected to decline due to normal wear and tear as these bridges continue to age. Within the next 20 years, several of them will need major rehabilitation, which will create inordinately high costs for ITD.
To plan for these costly investments, ITD has begun developing individual Bridge Asset Management Plans

ITD Transportation Asset Management Plan 2019
4-7
for eight high cost replacement bridges in ITD’s inventory. Most of these bridges are on the NHS. Individ-ual asset management plans are being developed for each bridge and will contain a detailed management strategy specific to that bridge. This detailed information helps ITD to create an optimal plan and schedule of bridge preservation and rehabilitation activities to extend these bridges’ service lives to as far as 100 years. In addition, the plans are also developing strategies for the ultimate and very expensive replace-ment action that will eventually be needed when each of these bridges reach the end of their service lives.
These individual asset management plans help ITD manage these assets, which are larger, more complex, and costly than the typical assets in ITD’s bridge inventory. The information helps ITD to analyze future funding scenarios and investment tradeoffs to ultimately pay for replacing these expensive assets. ITD plans to develop additional individual asset management plans for other large and complex bridges in ITD’s inventory.
ITD will define processes and modify required systems to forecast and report financial investments on the NHS for all five work types as well as define basis of unit costs for work types.
Although Chapter 7 does show the funding forecast across four of the five work types as defined in 23 CFR 515.5, ITD will continue to develop, document, and refine the processes employed to determine work type unit costs for NHS pavements and bridges. Specific improvements will include the following:
• ITD will define and document five work types (as defined in 23 CFR 515) as well as the activities that are applicable to each work type by 2021;
• Defined and document a process ITD uses to estimate maintenance and work type expenditure for NHS bridges and pavements and develop a process for determination of average annual work type costs for these facilities by 2021;
• Work with executive management to refine programing categories on the STIP to refine funding categories as to eliminate confusion with work types by 2021;
• Develop capability to report actual and programed NHS expenditures by work types by 2021.
ITD will define a process and dedicate personnel responsible for coordinating with local agencies on Local NHS.
ITD commits to defining a process and personnel to ensure coordination with local agencies owning part of the NHS. In 2019 ITD has designated within the Asset Management section dedicated personnel re-sponsible for ensuring asset data is collected, processed, and reported back to local NHS owners. Spe-cific actions will include the following:
• Development of a Standard Operating Procedure for how information is collected, processed, forecasted and communicated between ITD and local agencies in support of TPM requirements by 2021;
• Conduct meetings with each agency during each fiscal year by 2021; • ITD will communicate the local agency current NHS performance, forecast future performance,
model proposed treatments, and make recommendations for future treatments; • ITD will incorporate any local NHS planned projects into performance models and forecasts.

ITD Transportation Asset Management Plan 2019
5-1
- Life Cycle Planning Process Life Cycle Planning Requirements The federal asset management regula-tion says that each state must have a process for managing the life cycle of the assets included in the asset man-agement plan.
FHWA provides several definitions rele-vant to how it wants states to approach Life cycle Cost Planning (LCP) and Life cycle Cost Analysis (LCA). Life cycle Cost Analysis means the cost of managing an asset class or asset sub-group for its whole life, from initial construction to its replacement. Life cycle planning means a process to estimate the cost of managing an asset class, or asset sub-group over its whole life with consider-ation for minimizing cost while preserv-ing or improving the condition.
For the pavements and bridges included in the asset management plan, FHWA wants the state to document how it is managing them to reduce the total life cycle cost through the timely and ap-propriate application of preservation, maintenance, rehabilitation, and recon-struction at the appropriate times in the assets’ life cycle.
Data and Management System Requirements Additionally, FHWA regulations require that states use their bridge and pave-ment management systems to analyze the condition of NHS pavements and bridges and to develop and implement
Life Cycle Planning Requirements The asset management rule says in Sec. 515.7 (b)
“A State DOT shall establish a process for conducting life-cycle planning for an asset class or asset subgroup at the network level (network to be defined by the State DOT). As a State DOT develops its life-cycle planning process, the State DOT should include future changes in demand; information on current and future environmental condi-tions including extreme weather events, climate change, and seismic activity; and other factors that could impact whole of life costs of assets. The State DOT may propose excluding one or more asset sub-groups from its lifecycle planning if the State DOT can demonstrate to FHWA the exclusion of the asset sub-group would have no material adverse effect on the development of sound investment strategies due to the limited number of assets in the asset sub-group, the low level of cost associated with managing the assets in that asset sub-group, or other justifiable rea-sons. A life-cycle planning process shall, at a minimum, include the following:
(1) The State DOT targets for asset condition for each as-set class or asset sub-group;
(2) Identification of deterioration models for each asset class or asset subgroup, provided that identification of de-terioration models for assets other than NHS pavements and bridges is optional;
(3) Potential work types across the whole life of each as-set class or asset sub-group with their relative unit cost; and
(4) A strategy for managing each asset class or asset sub-group by minimizing its life-cycle costs, while achieving the State DOT targets for asset condition for NHS pave-ments and bridges under 23 U.S.C. 150(d).
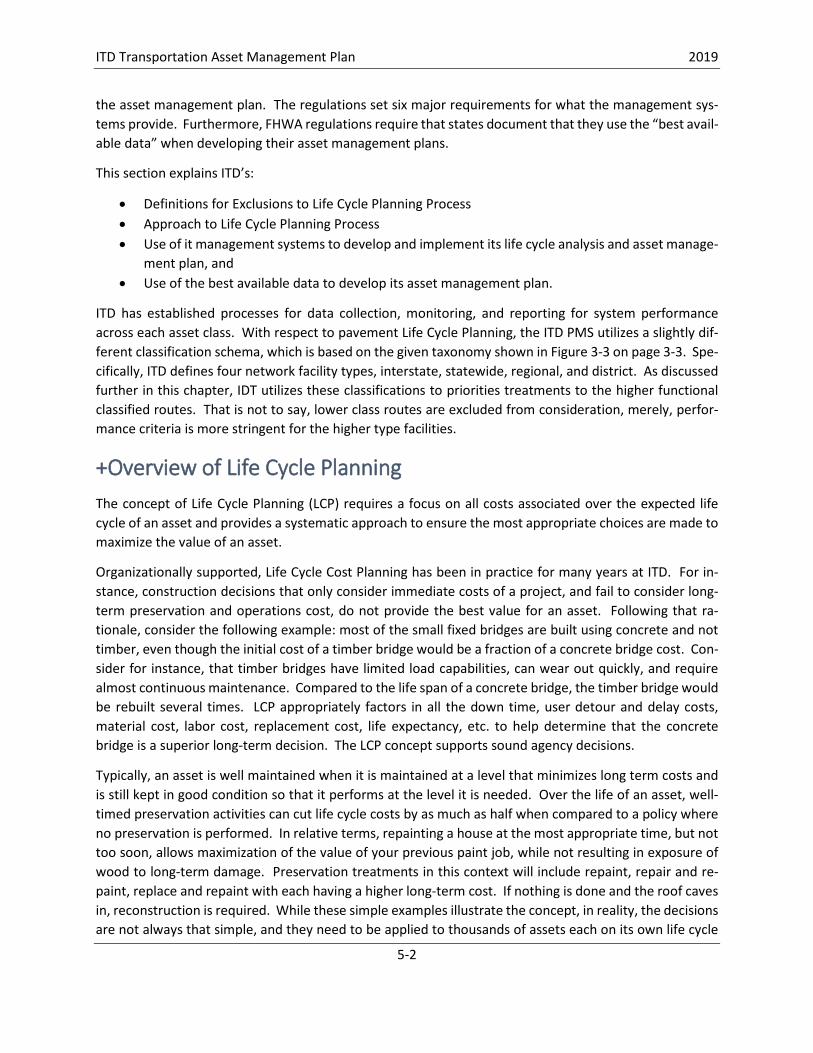
ITD Transportation Asset Management Plan 2019
5-2
the asset management plan. The regulations set six major requirements for what the management sys-tems provide. Furthermore, FHWA regulations require that states document that they use the “best avail-able data” when developing their asset management plans.
This section explains ITD’s:
• Definitions for Exclusions to Life Cycle Planning Process • Approach to Life Cycle Planning Process • Use of it management systems to develop and implement its life cycle analysis and asset manage-
ment plan, and • Use of the best available data to develop its asset management plan.
ITD has established processes for data collection, monitoring, and reporting for system performance across each asset class. With respect to pavement Life Cycle Planning, the ITD PMS utilizes a slightly dif-ferent classification schema, which is based on the given taxonomy shown in Figure 3-3 on page 3-3. Spe-cifically, ITD defines four network facility types, interstate, statewide, regional, and district. As discussed further in this chapter, IDT utilizes these classifications to priorities treatments to the higher functional classified routes. That is not to say, lower class routes are excluded from consideration, merely, perfor-mance criteria is more stringent for the higher type facilities.
+Overview of Life Cycle Planning The concept of Life Cycle Planning (LCP) requires a focus on all costs associated over the expected life cycle of an asset and provides a systematic approach to ensure the most appropriate choices are made to maximize the value of an asset.
Organizationally supported, Life Cycle Cost Planning has been in practice for many years at ITD. For in-stance, construction decisions that only consider immediate costs of a project, and fail to consider long-term preservation and operations cost, do not provide the best value for an asset. Following that ra-tionale, consider the following example: most of the small fixed bridges are built using concrete and not timber, even though the initial cost of a timber bridge would be a fraction of a concrete bridge cost. Con-sider for instance, that timber bridges have limited load capabilities, can wear out quickly, and require almost continuous maintenance. Compared to the life span of a concrete bridge, the timber bridge would be rebuilt several times. LCP appropriately factors in all the down time, user detour and delay costs, material cost, labor cost, replacement cost, life expectancy, etc. to help determine that the concrete bridge is a superior long-term decision. The LCP concept supports sound agency decisions.
Typically, an asset is well maintained when it is maintained at a level that minimizes long term costs and is still kept in good condition so that it performs at the level it is needed. Over the life of an asset, well-timed preservation activities can cut life cycle costs by as much as half when compared to a policy where no preservation is performed. In relative terms, repainting a house at the most appropriate time, but not too soon, allows maximization of the value of your previous paint job, while not resulting in exposure of wood to long-term damage. Preservation treatments in this context will include repaint, repair and re-paint, replace and repaint with each having a higher long-term cost. If nothing is done and the roof caves in, reconstruction is required. While these simple examples illustrate the concept, in reality, the decisions are not always that simple, and they need to be applied to thousands of assets each on its own life cycle
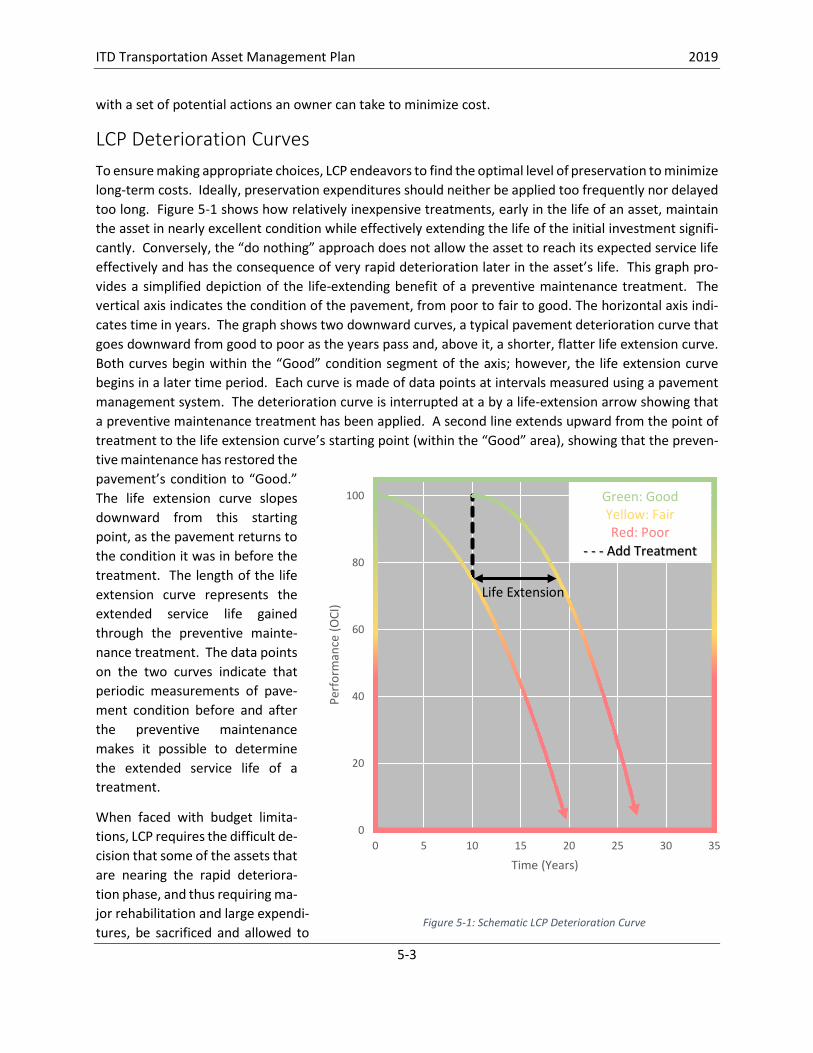
ITD Transportation Asset Management Plan 2019
5-3
with a set of potential actions an owner can take to minimize cost.
LCP Deterioration Curves To ensure making appropriate choices, LCP endeavors to find the optimal level of preservation to minimize long-term costs. Ideally, preservation expenditures should neither be applied too frequently nor delayed too long. Figure 5-1 shows how relatively inexpensive treatments, early in the life of an asset, maintain the asset in nearly excellent condition while effectively extending the life of the initial investment signifi-cantly. Conversely, the “do nothing” approach does not allow the asset to reach its expected service life effectively and has the consequence of very rapid deterioration later in the asset’s life. This graph pro-vides a simplified depiction of the life-extending benefit of a preventive maintenance treatment. The vertical axis indicates the condition of the pavement, from poor to fair to good. The horizontal axis indi-cates time in years. The graph shows two downward curves, a typical pavement deterioration curve that goes downward from good to poor as the years pass and, above it, a shorter, flatter life extension curve. Both curves begin within the “Good” condition segment of the axis; however, the life extension curve begins in a later time period. Each curve is made of data points at intervals measured using a pavement management system. The deterioration curve is interrupted at a by a life-extension arrow showing that a preventive maintenance treatment has been applied. A second line extends upward from the point of treatment to the life extension curve’s starting point (within the “Good” area), showing that the preven-tive maintenance has restored the pavement’s condition to “Good.” The life extension curve slopes downward from this starting point, as the pavement returns to the condition it was in before the treatment. The length of the life extension curve represents the extended service life gained through the preventive mainte-nance treatment. The data points on the two curves indicate that periodic measurements of pave-ment condition before and after the preventive maintenance makes it possible to determine the extended service life of a treatment.
When faced with budget limita-tions, LCP requires the difficult de-cision that some of the assets that are nearing the rapid deteriora-tion phase, and thus requiring ma-jor rehabilitation and large expendi-tures, be sacrificed and allowed to
0
20
40
60
80
100
0 5 10 15 20 25 30 35
Perf
orm
ance
(OCI
)
Time (Years)
Life Extension
Green: Good Yellow: Fair Red: Poor
- - - Add Treatment
Figure 5-1: Schematic LCP Deterioration Curve

ITD Transportation Asset Management Plan 2019
5-4
reach their end of life (and very poor condition) in order to more appropriately spend the available dollars to get the maximum cost benefit for the remaining assets in the entire asset pool. The tools in ITD’s Pavement Management System (PMS) and Bridge Management System (BMS) provide the capability of evaluating this trade-off.
Treatment Definitions All physical assets deteriorate with age and use. As assets deteriorate, applying appropriate treatments can slow or repair that deterioration. In general, treatments are categorized by their impact and cost:
• Corrective maintenance treatments generally involve repairs to specific elements or aspects of an asset. These treatments are typically used for assets that are in fair to good condition, but in need of specific repairs. Examples of corrective repairs include replacing a leaking expansion joint on a bridge or bump grinding on pavement. These types of treatments are not part of ITDs LCP approach.
• Preservation and Resurfacing treatments typically arrest minor deterioration without signifi-cantly improving condition or provide a modest improvement in condition. While these types of treatments do not provide a significant improvement in condition, they are very effective at ex-tending the time an asset remains in good or fair condition. Examples of preservation mainte-nance treatments include bridge deck sealing, pavement crack sealing, thin pavement overlays, and chip sealing.
• Restoration treatments are similar to preservation treatments except that they are more in depth. Restoration treatments seek to arrest moderate deterioration and correct defects such as rutting or concrete overlay of a bridge deck. These treatments are usually applied to assets in fair condition with the intention of bringing them back into the good condition realm.
• Rehabilitation is required for assets, which still have a potential for significant remaining service but have a substantial number of components in need of repair, or major components in need of substantial repair. These treatments are usually applied to assets in poor condition with the in-tention of bringing them back to good condition. Examples of rehabilitation treatments include bridge deck replacement and thicker pavement milling and inlay.
• Replacement/reconstruction is required when an asset has reached the end of its service life and can no longer be extended though repair or rehabilitation. This is a complete rebuilding project and resets the asset’s service life.
Pavements ITD’s pavement management system conforms to the requirements set out in the federal asset manage-ment rule. The description in this section explains that ITD uses:
• its pavement management system for life cycle planning; • the best data available for LCA; • PMS to develop and implement its asset management plan.

ITD Transportation Asset Management Plan 2019
5-5
Background The Idaho Transportation Department has over a 40-year history of collecting and reporting pavement performance data as well as implementing pavement management systems (PMS) with the ever-present desire of obtaining the greatest longevity for the minimal cost and ensuring good stewardship of the road-way system with which we are entrusted. As shown in Figure 5-2, ITD began utilizing computer programs to track pavement performance in the late 1970’s. Although rudimentary by today’s technology stand-ards, ITD demonstrated a desire to utilize emerging technology more holistically to manage pavements. By the mid-80’s this PMS was able to perform very simple economic trade off analysis between competing pavement needs. This experience in economic forecasting and assessment has continued to this day for determining economic benefits between competing projects. In 2007, ITD decided to replace the existing PMS with the Highway Economic System (HERS-ST) PMS. Utilization of HERS-ST proved difficult and anal-ysis parameters did not reflect the Idaho climate or organizational decision process. In 2009, ITD decided to phase out HERS-ST. This long history and commitment to effective pavement management is directly attributable to Idaho roads being in an excellent state of good repair.
In 2009, ITD purchased an asset management software package from Agile Assets called TAMS. This new software has a Pavement Management System (PMS) and a Maintenance Management System (MMS) to work in tandem as part of the Department’s long-term vision for asset management. Fully integrated by 2011, AgileAssets Pavement Analyst System became the official ITD PMS. This software contains a robust database that houses several kinds of data, such as bridge condition surveys, maintenance activities, pave-ment condition ratings, traffic data, friction data and several others.
At the time of the software procurement, ITD identified the value of engineering input during setup of this PMS. ITD hired Kercher Engineering Inc. (KEI) to develop the framework and configure the software for ITD with input provided by an expert panel of ITD staff members. The expert panel consisted of mem-bers of ITD Headquarters, pavement management, materials, and IT departments, as well as District Office staff from around the state. The outcome of this initial implementation phase was a fully functional pave-ment management system that included the most up-to-date and best knowledge available. In 2011, ITD brought back KEI for a Phase II implementation of performance model refinement. This process included the review of past historical condition data to determine if the original expert panel developed models should be revised. The outcome of the Phase II work was adjustments to the models based on the data analysis.
In 2014, Phase III of the engineering support for PMS was given notice to proceed. This phase of the work included the refinement of the configuration and included development of condition-data-collection pro-cesses to better define condition indices. This phase also included many adjustments to the overall deci-sion-making and performance-modeling framework. A field review of pavement conditions was carried out to provide additional insight into the deterioration trends of the state’s pavements. Finally, perfor-mance measures and overall business rule changes were made that required reconfiguration in PMS.
ITD continues become more efficient in data management. Part of this evolution is changing the way in which we reference and refer to the location of roadway locations. The current PMS referencing basis uses segment codes and mileposts. This system has evolved and been utilized for many decades. How-

ITD Transportation Asset Management Plan 2019
5-6
ever its’ utility is rapidly nearing an end as Geographic Information Systems (GIS) based on mapping coor-dinates (Latitude / Longitude) become more widely utilized. Founded on GIS principles and based on geospatial coordinates newer PMS systems, even that provided by the current vendor, require the use of a Linear Reference System (LRS). ESRI Roads and Highways is the GIS platform ITD has chosen to imple-ment for LRS. ITD has undertaken a project to identify, assess and implement a newer version of Asset Management Software compatible with ESRI Roads and Highways.
The PMS has allowed ITD to refine the way it invests in and maintains pavement by:
• Implementing new pavement performance curves calibrated by ITD engineers; • Implementing decision trees that mimic ITD District engineering choices; • Creating performance models that accurately track and display pavement projects; • Employing an analysis engine that uses integer optimization to maximize benefit.
These components directly address and satisfy FHWA’s requirements for the functionality of pavement management systems.
With all users of the PMS having instant access to all available data, the system gives the District pavement designers and engineers an extensive toolbox at their disposal. It also gives Headquarters Asset Manage-ment engineers an equitable method to distribute funding throughout the state based on predicted and modeled need. The system suggests optimized pavement project choices based on budget constraints, which the engineers balance against needs and their expert knowledge of the system. Figure 5-3, is a high level overview of how roadway performance data is aquired, utilized, and reviewed in concert with the development the State Transportation Investment Program (STIP). The PMS is aligned with, supports and facilitates each step of the pavement lifecycle data flow. Central to the is process is a review of the existing system performance and forecasting future performance based on the project decision made today.
1978 Pavement Performance
Information System
1986 Begin simple economic analysis
2007 Highway Economic Requirements System
(HERS-ST)
2009 AgileAssetsTAMS
Figure 5-2: ITD Pavement Management Historical Timeline

ITD Transportation Asset Management Plan 2019
5-7
Figure 5-3: Pavement Lifecycle Process
Data Collection Idaho collects pavement data annually using a Pathways Profiler Van, Dynatest Pavement Friction Tester (PFT), and a Dynatest Falling Weight Deflectometer. The asset management engineer performs an annual inspection with a district representative. The Profiler van drives the same highways, collecting thousands of miles of video images, rutting data, and roughness data.
The Path Runner Profiler Van
Since 1995, Idaho has used PathRunner Profiler van technology to gather the ma-jority of the roadway data. The initial road profile van was replaced in 2007. In 2017, ITD purchased a replacement road profiler van, greatly enhancing the data quality and quantity that we are able to obtain and process. The profiler van drives every mile of the SHS and digitally records its condi-tion. From that data, the Pavement Analy-sis section extracts pavement performance data, which includes cracking, roughness, faulting and rutting depth.
ITD retains 5-years of video for reference. Additionally the video images from the forward facing cameras as well as the pavement surface are available to anyone using a windows based computer online at:
•In Compliance with RDQMP
•Collection of Roadway Data
•Process Data•QC Processes•Upload to
Pavment Management System
Collect Pavement Data
•Review current performance
•Run Forecast•Prepare annual
reports•Update ITD
Metrics and dashboards
Performance Projections
•Review/modify treatment senarios
•Run treatment senarios
•Review forecast•Re-run senarios•District budgets
based on senarios
Project Recommendations
•Districts' review of senarios
•District modifications
•Forecast against revisions
•ITIP Developed
STIP Development
Figure 5-4: ITD's Profiler Van
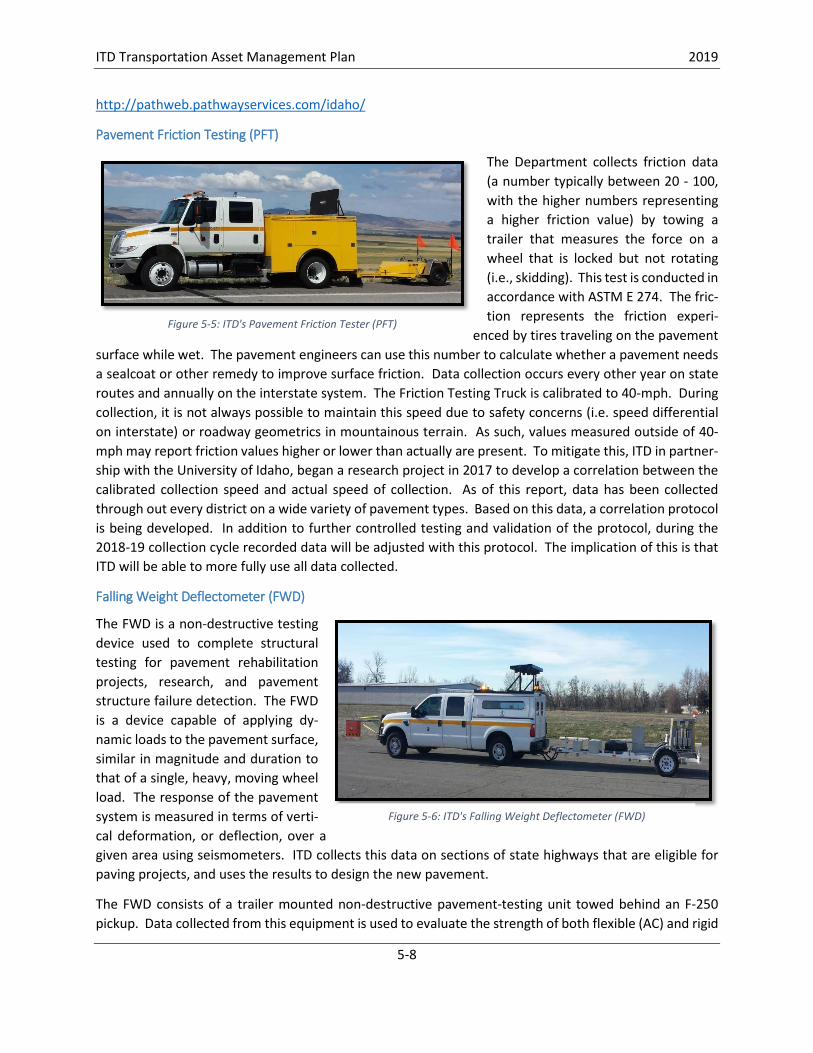
ITD Transportation Asset Management Plan 2019
5-8
http://pathweb.pathwayservices.com/idaho/
Pavement Friction Testing (PFT)
The Department collects friction data (a number typically between 20 - 100, with the higher numbers representing a higher friction value) by towing a trailer that measures the force on a wheel that is locked but not rotating (i.e., skidding). This test is conducted in accordance with ASTM E 274. The fric-tion represents the friction experi-
enced by tires traveling on the pavement surface while wet. The pavement engineers can use this number to calculate whether a pavement needs a sealcoat or other remedy to improve surface friction. Data collection occurs every other year on state routes and annually on the interstate system. The Friction Testing Truck is calibrated to 40-mph. During collection, it is not always possible to maintain this speed due to safety concerns (i.e. speed differential on interstate) or roadway geometrics in mountainous terrain. As such, values measured outside of 40-mph may report friction values higher or lower than actually are present. To mitigate this, ITD in partner-ship with the University of Idaho, began a research project in 2017 to develop a correlation between the calibrated collection speed and actual speed of collection. As of this report, data has been collected through out every district on a wide variety of pavement types. Based on this data, a correlation protocol is being developed. In addition to further controlled testing and validation of the protocol, during the 2018-19 collection cycle recorded data will be adjusted with this protocol. The implication of this is that ITD will be able to more fully use all data collected.
Falling Weight Deflectometer (FWD)
The FWD is a non-destructive testing device used to complete structural testing for pavement rehabilitation projects, research, and pavement structure failure detection. The FWD is a device capable of applying dy-namic loads to the pavement surface, similar in magnitude and duration to that of a single, heavy, moving wheel load. The response of the pavement system is measured in terms of verti-cal deformation, or deflection, over a given area using seismometers. ITD collects this data on sections of state highways that are eligible for paving projects, and uses the results to design the new pavement.
The FWD consists of a trailer mounted non-destructive pavement-testing unit towed behind an F-250 pickup. Data collected from this equipment is used to evaluate the strength of both flexible (AC) and rigid
Figure 5-5: ITD's Pavement Friction Tester (PFT)
Figure 5-6: ITD's Falling Weight Deflectometer (FWD)
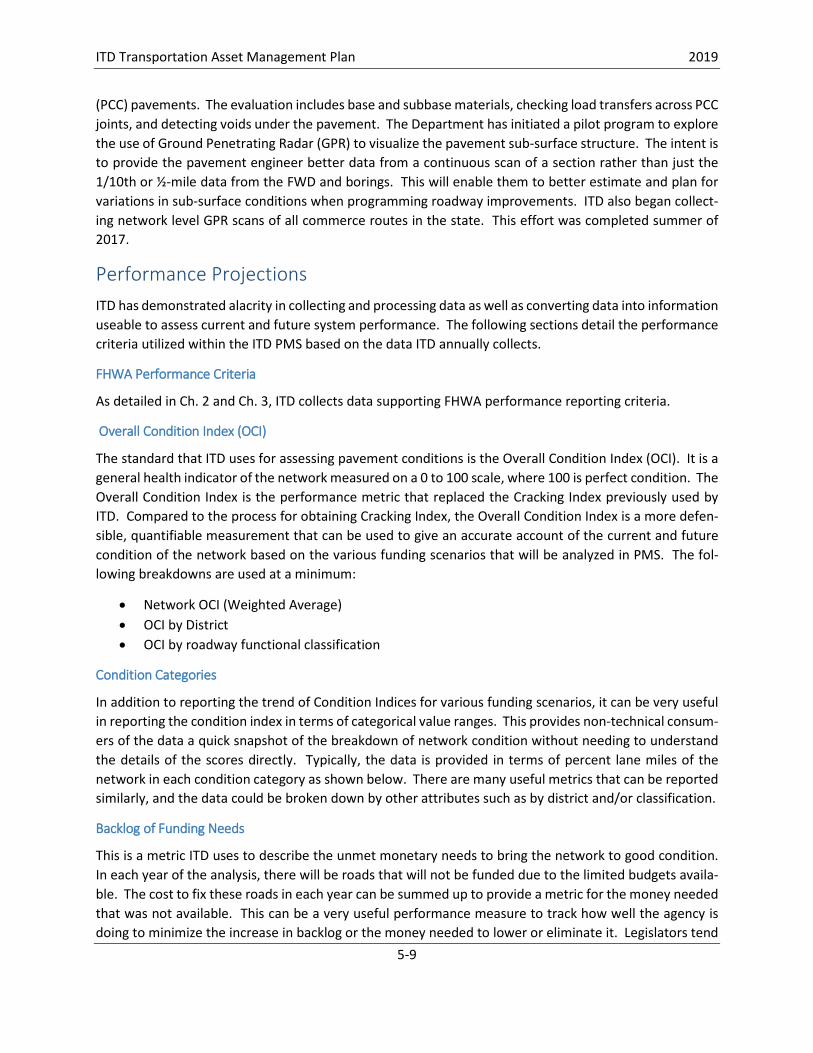
ITD Transportation Asset Management Plan 2019
5-9
(PCC) pavements. The evaluation includes base and subbase materials, checking load transfers across PCC joints, and detecting voids under the pavement. The Department has initiated a pilot program to explore the use of Ground Penetrating Radar (GPR) to visualize the pavement sub-surface structure. The intent is to provide the pavement engineer better data from a continuous scan of a section rather than just the 1/10th or ½-mile data from the FWD and borings. This will enable them to better estimate and plan for variations in sub-surface conditions when programming roadway improvements. ITD also began collect-ing network level GPR scans of all commerce routes in the state. This effort was completed summer of 2017.
Performance Projections ITD has demonstrated alacrity in collecting and processing data as well as converting data into information useable to assess current and future system performance. The following sections detail the performance criteria utilized within the ITD PMS based on the data ITD annually collects.
FHWA Performance Criteria
As detailed in Ch. 2 and Ch. 3, ITD collects data supporting FHWA performance reporting criteria.
Overall Condition Index (OCI)
The standard that ITD uses for assessing pavement conditions is the Overall Condition Index (OCI). It is a general health indicator of the network measured on a 0 to 100 scale, where 100 is perfect condition. The Overall Condition Index is the performance metric that replaced the Cracking Index previously used by ITD. Compared to the process for obtaining Cracking Index, the Overall Condition Index is a more defen-sible, quantifiable measurement that can be used to give an accurate account of the current and future condition of the network based on the various funding scenarios that will be analyzed in PMS. The fol-lowing breakdowns are used at a minimum:
• Network OCI (Weighted Average) • OCI by District • OCI by roadway functional classification
Condition Categories
In addition to reporting the trend of Condition Indices for various funding scenarios, it can be very useful in reporting the condition index in terms of categorical value ranges. This provides non-technical consum-ers of the data a quick snapshot of the breakdown of network condition without needing to understand the details of the scores directly. Typically, the data is provided in terms of percent lane miles of the network in each condition category as shown below. There are many useful metrics that can be reported similarly, and the data could be broken down by other attributes such as by district and/or classification.
Backlog of Funding Needs
This is a metric ITD uses to describe the unmet monetary needs to bring the network to good condition. In each year of the analysis, there will be roads that will not be funded due to the limited budgets availa-ble. The cost to fix these roads in each year can be summed up to provide a metric for the money needed that was not available. This can be a very useful performance measure to track how well the agency is doing to minimize the increase in backlog or the money needed to lower or eliminate it. Legislators tend

ITD Transportation Asset Management Plan 2019
5-10
to find this type of metric easy to understand given that it is quantifying network condition in terms of dollars. By monetizing pavement deterioration, it provides a metric that allows ITD to illustrate the change in condition in terms of money. For example, if the funding level is increased by $50 million over the next ten years, it will eliminate $150 million in pavement deterioration (backlog); we have found elected offi-cials are more likely to react to change in “dollars” than change in a condition index. In other words, if they do not spend the $50 million, they will have $150 million of pavement deterioration that will have to be fixed at some point.
Performance Measures for Life Cycle Planning
In addition to the OCI and backlog of funding needs, ITD also will produce analysis in its life cycle process and for its asset management implementation of the new federal pavement performance measures, those being:
• IRI • Rutting • Cracking • Faulting
The scenarios considered by the PMS will forecast the network conditions by these new Federal perfor-mance measures, which also are incorporated into this asset management plan, see Chapter 4, page 4-5.
Project Recommendations Performance Model Development
The Performance Models in the PMS are used to predict pavement performance into the future in an Optimization Analysis. As a component to the development of Performance Models, KEI and ITD com-pleted field condition data reviews. In addition, the data gathered in the field was then brought into the office for processing by plotting the pavement ages versus the Distress Indices in an attempt to develop performance trends.
Pavement Performance Model Tree Structure
The Performance Model Tree Structure uses a tree node structure to group similarly performing roads into model groups based on defined sets of attributes. The Performance Model Tree Structure takes each Performance Model Type Category, defined by the Pavement Type and Repair Category, and assigns the correct Performance Model to each node.

ITD Transportation Asset Management Plan 2019
5-11
Figure 5-7: Performance Model Tree
Treatment Repair Category
Pavement performance is closely linked with the treatments that are placed on the pavement through its life cycle. The models developed are specific to Idaho based on the process described above. The Perfor-mance Categories that are used for performance modeling are listed below.
• Reconstruction • Rehabilitation • Restoration • Resurfacing • Preservation
In addition, Preservation treatments deteriorate under specific rules. The life expectancy of these treat-ments was provided by ITD staff as typical representations of field performance of these treatments. The Figure 5-8 identifies the key model points for the various Repair Categories. The final Piecewise Linear Models are shared across the Structural Distress, Non-Structural Distress, and OCI Indices for the Repair Categories.

ITD Transportation Asset Management Plan 2019
5-12
Figure 5-8: Flexible Pavement Performance Models – All Indices
Table 5-1: Expected Performance of Asphalt Pavement Treatments
Year Resurfacing Year Restoration Year Rehab. Year Reconst. 0 100 0 100 0 100 0 100 2 96 2 97 2 98 4 96 4 90 5 89 6 89 6 92 6 80 8 78 9 80 11 80 10 60 13 58 15 60 15 70 12 50 16 47 18 50 18 60 15 38 19 36 21 40 21 50 18 28 22 26 24 30 24 40 22 14 26 15 28 20 32 20 32 0 38 0 43 0 48 0
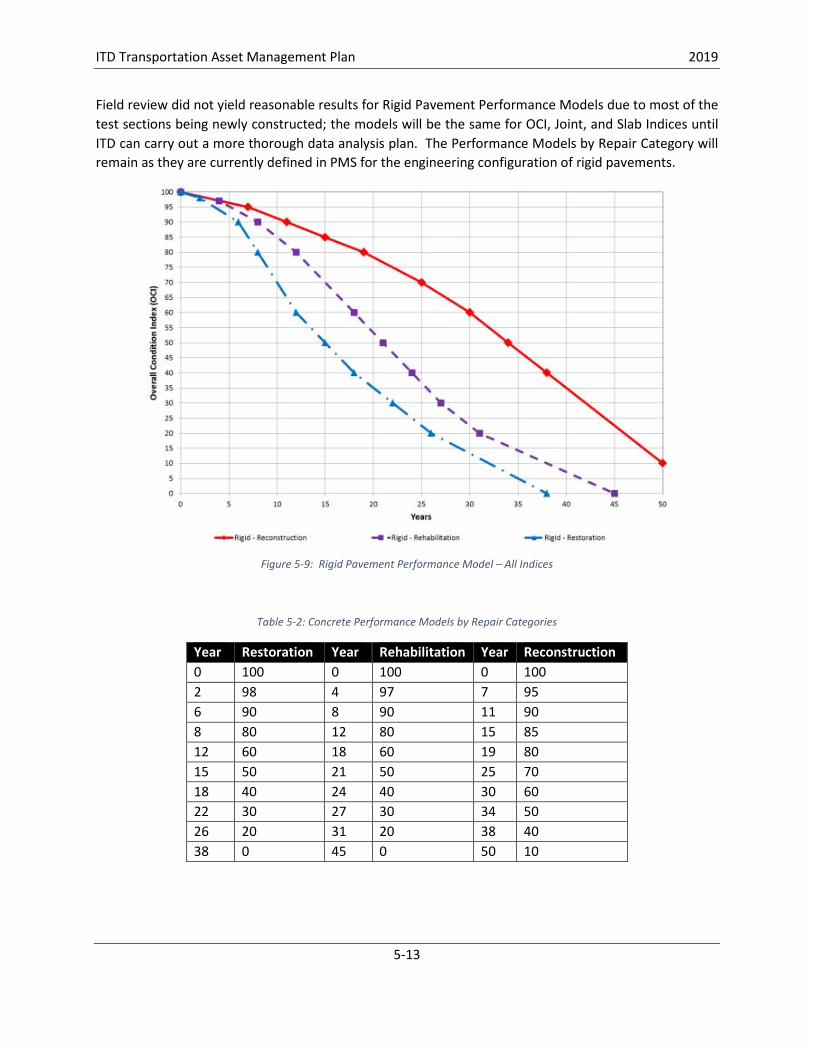
ITD Transportation Asset Management Plan 2019
5-13
Field review did not yield reasonable results for Rigid Pavement Performance Models due to most of the test sections being newly constructed; the models will be the same for OCI, Joint, and Slab Indices until ITD can carry out a more thorough data analysis plan. The Performance Models by Repair Category will remain as they are currently defined in PMS for the engineering configuration of rigid pavements.
Figure 5-9: Rigid Pavement Performance Model – All Indices
Table 5-2: Concrete Performance Models by Repair Categories
Year Restoration Year Rehabilitation Year Reconstruction 0 100 0 100 0 100 2 98 4 97 7 95 6 90 8 90 11 90 8 80 12 80 15 85 12 60 18 60 19 80 15 50 21 50 25 70 18 40 24 40 30 60 22 30 27 30 34 50 26 20 31 20 38 40 38 0 45 0 50 10

ITD Transportation Asset Management Plan 2019
5-14
Pavement Treatment Unit Costs
ITD understands that the pavement treatment unit cost determination is critical to the accuracy with which the PMS can forecasts cost. Table 5-3 reports the current unit cost incorporated into the PMS. Costs are defined based on the treatment types forecasted (preservation, reconstruction, rehabilitation, resurfacing) and type of pavement (rigid or flexible).
Table 5-3: ITD Treatment Unit Costs
Treatment Average SY Cost
Estimated Cost Per Lane Mile
Preservation - Flexible $4.00 $28,160.00
Preservation - Rigid $10.00 $70,400.00
Reconstruction - Flexible $75.00 $528,000.00
Reconstruction - Rigid $110.00 $774,400.00
Rehabilitation - Flexible $33.00 $232,320.00
Rehabilitation - Rigid $46.00 $323,840.00
Restoration - Flexible $20.00 $140,800.00
Restoration - Rigid $18.00 $126,720.00
Resurfacing - Flexible $12.00 $84,480.00
Unit costs are derived using a combination of analogous and parametric estimating techniques. To de-velop analogous estimates, current project construction costs and quantities are reviewed by the asset management section. The estimates derived from project reviews are then validated using a parametric procedure, which is defined in the ITD design manual. Recently, ITD has created a Construction Cost Man-agement section. Future unit costs will be derived utilizing the expertise within this section.
Pavement Management System (PMS) Configuration
One of the most important aspects of ITD’s PMS is the comprehensive analysis of the various pavement condition indexes, and their use as triggers, identifying timely preservation or rehabilitation treatments that enhance and maximize potential life cycle cost benefits. The PMS software is used to analyze this data to determine a recommended treatment for each segment of roadway based on unlimited funds, essentially defining the base need. Recommended treatments have a fixed life, because the pavement continues to deteriorate, so the next step is to generate recommended treatments for a given time period based on a defined budget. When there is a need to select a treatment contrary to the PMS recommen-dation, the District must justify and document the request. For example, if a minor preservation treat-ment is recommended, and oil/gas water fracking trucks have traveled over that pavement, the recom-mended preservation treatment might no longer be a valid selection and must be adjusted.
In order to ensure that the treatments recommended are in line with the Department’s objectives and goals, the PMS was calibrated and configured. In 2015, ITD developed a PMS Configuration Document that details the means and methods that were used to configure the PMS. Table 5-4 provides an overview of the pavement management system variables that were included as part of the configuration process.
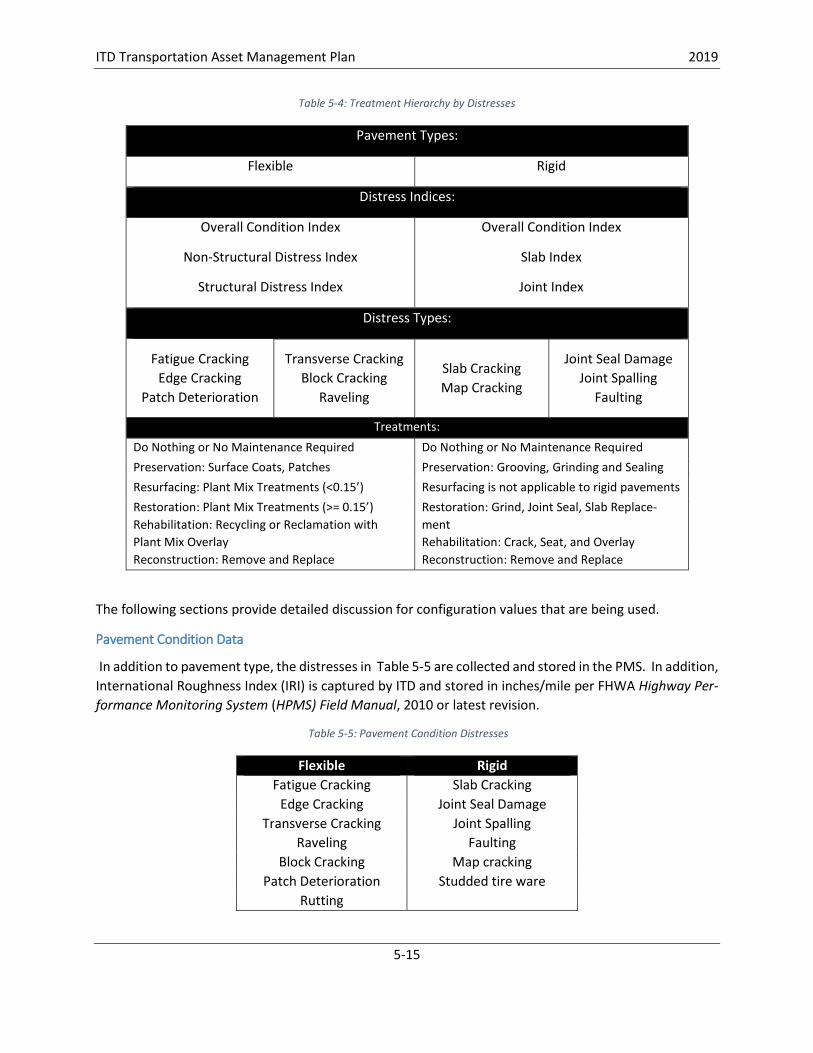
ITD Transportation Asset Management Plan 2019
5-15
Table 5-4: Treatment Hierarchy by Distresses
The following sections provide detailed discussion for configuration values that are being used.
Pavement Condition Data
In addition to pavement type, the distresses in Table 5-5 are collected and stored in the PMS. In addition, International Roughness Index (IRI) is captured by ITD and stored in inches/mile per FHWA Highway Per-formance Monitoring System (HPMS) Field Manual, 2010 or latest revision.
Table 5-5: Pavement Condition Distresses
Pavement Types:
Flexible Rigid
Distress Indices:
Overall Condition Index
Non-Structural Distress Index
Structural Distress Index
Overall Condition Index
Slab Index
Joint Index
Distress Types:
Fatigue Cracking Edge Cracking
Patch Deterioration
Transverse Cracking Block Cracking
Raveling
Slab Cracking Map Cracking
Joint Seal Damage Joint Spalling
Faulting
Treatments: Do Nothing or No Maintenance Required Do Nothing or No Maintenance Required Preservation: Surface Coats, Patches Preservation: Grooving, Grinding and Sealing Resurfacing: Plant Mix Treatments (<0.15’) Resurfacing is not applicable to rigid pavements Restoration: Plant Mix Treatments (>= 0.15’) Rehabilitation: Recycling or Reclamation with Plant Mix Overlay
Restoration: Grind, Joint Seal, Slab Replace-ment Rehabilitation: Crack, Seat, and Overlay
Reconstruction: Remove and Replace Reconstruction: Remove and Replace
Flexible Rigid Fatigue Cracking Slab Cracking
Edge Cracking Joint Seal Damage Transverse Cracking Joint Spalling
Raveling Faulting Block Cracking Map cracking
Patch Deterioration Studded tire ware Rutting

ITD Transportation Asset Management Plan 2019
5-16
For all pavement types, the rules for defining the distresses, severity and extent ranges are determined by ITD for field data collection. For each survey section, distress and extent measurements are collected for three levels of severity: Low, Medium, and High. The extent range is continuous from zero to 100 percent. The definitions of Distress Severity shown below are defined per the Federal Highway Admin-istration Publication No. FHWA-RD-03-031 Distress Identification Manual for the Long-Term Pavement Performance Program, June 2003, or latest revision. ITD distress data collection processing takes ad-vantage of the automated data collection capabilities of the Pathways van currently owned and operated by ITD. With the more detailed data collection approach, the calculation of Individual Distress Indices allows the PMS to be configured to calculate the most accurate OCI. The reader is referred to the ITD PMS Configuration Document for detailed explanation of how existing conditions are measured and OCI is com-puted. The OCI is used to define the general health of the pavement section by combining the distress indices into a calculated value. It is also used for defining Benefit in the Optimization Analysis. The OCI is a calculated score that has been configured and is a significant divergence from the historic method for assigning Cracking Index subjectively to a pavement. It represents a much more defensible overall esti-mate of pavement health. For OCI, all distresses are combined in the calculation for each pavement type.
Treatments and Repair Categories
Treatments are the specific names defining the material and work that was applied at a location. These are typically found in Construction History and Master Work Plan data. However, Repair Categories are generally defined to represent Treatments of similar attributes for Optimization Analysis output. There is a relationship that exists in the PMS between Treatments, Work Codes, Pavement Type, and Performance Model Type. Performance Model Type is the performance class variable that identifies which models will be assigned when a treatment is applied.
Table 5-6: Repair Categories
Repair Category Description Do Nothing No Maintenance Required
Preservation Surface Coats, Patches Grooving, Grinding and Sealing
Resurfacing Plant Mix Treatments (<0.15’)
Restoration Plant Mix Treatments (>= 0.15’) Grind, Joint Seal, Slab Replacement
Rehabilitation Recycling or Reclamation with Plant Mix Overlay, Crack, Seat, and Overlay
Reconstruction Remove and Replace
Condition Index Improvement Rules
When a Treatment is selected in the Optimization Analysis, the deteriorating condition indices stored in the Network Master per management section is improved by a user specified amount. The PMS has been configured with the following condition indices and improvements when a Repair Category is selected.

ITD Transportation Asset Management Plan 2019
5-17
Table 5-7: Flexible Pavement Improvement Rules
Condition Indices Preservation Resurfacing Restoration Rehab. Recon. Structural Dis-tress Index
Add 5 Add 30 Add 50 Add 80 Reset to 100
Non-Structural Distress Index
Add 20 Add 50 Add 70 Reset to 100 Reset to 100
OCI Add 15 Add 40 Add 60 Add 80 Reset to 100
Table 5-8: Rigid Pavement Improvement Rules
Condition Indices Preservation Restoration Rehabilitation Reconstruction
Slab Distress Index Add 15 Add 30 Add 50 Reset to 100
Joint Distress Index Add 20 Add 30 Add 50 Reset to 100
OCI Add 20 Add 30 Add 50 Reset to 100
Supplemental Improvement Rules
Supplemental Improvement Rules are attribute values that do not deteriorate with time during the anal-ysis but do reset based on the treatment that was selected. The PMS has been configured with the fol-lowing improvements when a Repair Category is selected.
Table 5-9: Flexible Pavement Supplemental Improvement Rules
Improvement Variable
Preserva-tion
Resurfac-ing
Restora-tion
Rehabilita-tion
Reconstruc-tion
Performance Model Type
N/A Set to Value
Set to Value
Set to Value Set to Value
Pavement Age N/A Set to 0 Set to 0 Set to 0 Set to 0
IRI Average – in/mile N/A Set to 0 Set to 0 Set to 0 Set to 0
Rutting Medium – Percent
N/A Set to 0 Set to 0 Set to 0 Set to 0
Rutting High - Percent N/A Set to 0 Set to 0 Set to 0 Set to 0

ITD Transportation Asset Management Plan 2019
5-18
Table 5-10: Rigid Pavement Supplemental Improvement Rules
Improvement Variable Preservation Restoration Rehabilitation Reconstruction
Performance Model Type N/A Set to Value Set to Value Set to Value
Pavement Age N/A Set to 0 Set to 0 Set to 0
Map Cracking - Percent N/A Set to 0 Set to 0 Set to 0
Pavement Type Change N/A N/A Change to Flex-ible
N/A
IRI Average - inch/mile N/A Set to 0 Set to 0 Set to 0
Studded Tire Wear Medium - Percent
N/A Set to 0 Set to 0 Set to 0
Studded Tire Wear High - Percent
N/A Set to 0 Set to 0 Set to 0
Faulting Medium - Percent Set to 0 Set to 0 Set to 0 Set to 0
Faulting High - Percent Set to 0 Set to 0 Set to 0 Set to 0
Treatment Priority and Exclusion Years/Priority
Each Treatment is assigned a Treatment Priority value. The priority value allows the system to choose a dominant Treatment when the analysis arrives at more than one possible Treatment solution. The anal-ysis arrives at more than one Treatment solution when more than one Decision Tree is configured in the system for the management section’s attributes.
Exclusion Years have been configured in the PMS window to require the analysis to wait a specified num-ber of years before an equal or higher Exclusion Priority Treatment can be applied. Exclusion Priority Scores were taken as being equal to the Treatment Priority Scores because there was not a justification for making them different.
Table 5-11: Treatment Priority and Exclusion Year Priority
Repair Category Treatment Priority Exclusion Year Priority Do Nothing 100 100 Preservation 300 300 Resurfacing 400 400 Restoration 500 500 Rehabilitation 600 600 Reconstruction 700 700

ITD Transportation Asset Management Plan 2019
5-19
Exclusion years have been incorporated according to the following rules unless noted otherwise. Based on these rules and an initial modeling of deterioration model relationships, the following exclusion years have been configured.
Table 5-12: Flexible Pavement Treatment Exclusion Years
Repair Category Exclusion Year Do Nothing N/A Preservation 7 Resurfacing 10 Restoration 12 Rehabilitation 15 Reconstruction 20
Table 5-13: Rigid Pavement Treatment Exclusion Years. Repair Category Exclusion Year Do Nothing N/A Preservation 10 Restoration 12 Rehabilitation 15 Reconstruction 30
Decision Tree Configuration
To ensure repeatability and consistency in the evaluation and selection process, Decision Trees have been developed and are used in the PMS to capture the decision-making rules necessary for the Optimization Analysis. There are two levels of trees, Upper and Lower. The Upper Level Trees streamline the configuration process by allowing sim-ilar node structures to be defined and reused for all Lower Level Trees. The Lower Level Trees consist of the detailed decision nodes structures necessary to trigger Treatments in the Optimization Analysis.
Based on the Decision Tree Categories, multiple lower level trees were assigned to each pavement type. The lower level decision trees have been categorized based on Structural Distress Index, Non-structural Distress Index, Slab Distress Index, Joint Distress Index, IRI, and Rutting, shown in the following figures.
Figure 5-10: Upper Level Decision Tree Categories

ITD Transportation Asset Management Plan 2019
5-20
Figure 5-12: Flexible Structural Distress Index Decision Tree
Figure 5-11: Flexible Non-Structural Distress Index Decision Tree

ITD Transportation Asset Management Plan 2019
5-21
Figure 5-15: Rigid Slab Decision Tree.
Figure 5-13: Rigid Pavement IRI Decision Tree.
Figure 5-14: Aged-based Decision Tree.

ITD Transportation Asset Management Plan 2019
5-22
Figure 5-16: The Rigid Pavement Faulting Decision Tree.
Figure 5-17: Flexible Pavement Rutting Decision Tree.
Figure 5-18: Rigid Joint Index Decision Tree.
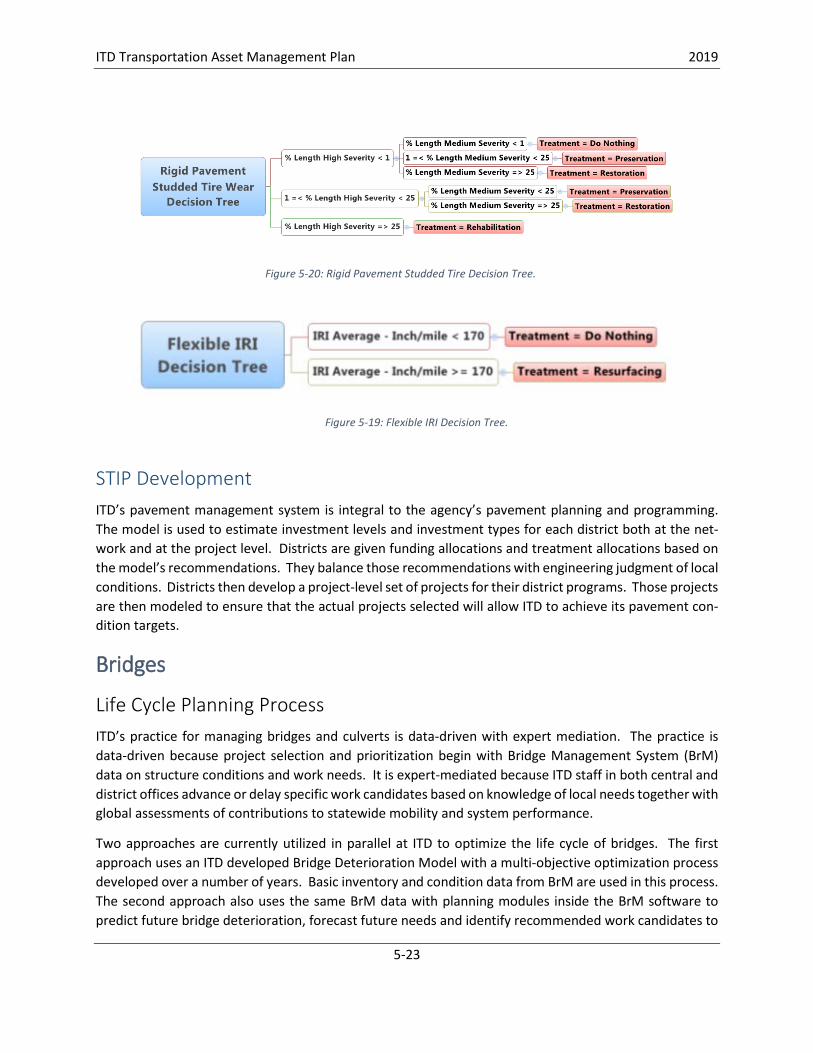
ITD Transportation Asset Management Plan 2019
5-23
STIP Development ITD’s pavement management system is integral to the agency’s pavement planning and programming. The model is used to estimate investment levels and investment types for each district both at the net-work and at the project level. Districts are given funding allocations and treatment allocations based on the model’s recommendations. They balance those recommendations with engineering judgment of local conditions. Districts then develop a project-level set of projects for their district programs. Those projects are then modeled to ensure that the actual projects selected will allow ITD to achieve its pavement con-dition targets.
Bridges
Life Cycle Planning Process ITD’s practice for managing bridges and culverts is data-driven with expert mediation. The practice is data-driven because project selection and prioritization begin with Bridge Management System (BrM) data on structure conditions and work needs. It is expert-mediated because ITD staff in both central and district offices advance or delay specific work candidates based on knowledge of local needs together with global assessments of contributions to statewide mobility and system performance.
Two approaches are currently utilized in parallel at ITD to optimize the life cycle of bridges. The first approach uses an ITD developed Bridge Deterioration Model with a multi-objective optimization process developed over a number of years. Basic inventory and condition data from BrM are used in this process. The second approach also uses the same BrM data with planning modules inside the BrM software to predict future bridge deterioration, forecast future needs and identify recommended work candidates to
Figure 5-19: Flexible IRI Decision Tree.
Figure 5-20: Rigid Pavement Studded Tire Decision Tree.

ITD Transportation Asset Management Plan 2019
5-24
address needs. The in-house developed approach primarily drives decisions for projects that will be con-structed in the next 1-7 years, which is the same time horizon of the Idaho Transportation Investment Program. Whereas the second approach, the planning modules of the BrM software, primarily drives decisions about investments needed 8-15 years into the future.
Recall from chapter 3, that 92 percent of all NHS bridges are on the SHS. ITD manages all of the SHS bridges and thus 92 percent of the NHS system using these two processes. ITD does not differentiate, prioritize or optimize the NHS or SHS bridges differently. They are all managed with the same underlying objective – to maximize service life for the lowest overall cost. While all bridges are managed with the same objective, it is important to acknowledge that these processes do tend to put more emphasis on Interstate bridges and other high traffic volume routes. In addition, generally higher traffic routes are on the NHS.
Bridge Management System
ITD uses the Bridge Management System (BrM) which is developed by the American Association of State Highway and Transportation Officials (AASHTO). ITD uses BrM to store inventory data, condition data, and inspectors’ recommended work candidates.
The first step in Life Cycle Planning is for ITD Bridge subject matter experts to examine BrM data for all bridge conditions, age and truck weight capacity in order to group assets into good, fair, and poor perfor-mance categories, as shown in Figure 2-2 and Figure 2-4 shown in chapter 2. These groupings facilitate making general high-level observations of entire networks (such as the SHS or NHS). From this, observa-tions are made about global changes in system performance along with beginning the process to identify specific low performing bridge assets that may be a hindrance to the route or network’s performance. For example, a load posted bridge in poor condition on a route that otherwise contains fair to good con-ditions bridges capable of carrying legal truck loads is a low performer that is affecting the service of a segment of a route. Depending on where this route is between destinations, proximity of suitable of a detour route and other factors will influence how high a priority it is to be addressed.
ITD Bridge Deterioration Model and Multi-Objective Optimization Process
Using historical Idaho National Bridge Inventory (NBI) condition data from the last 25 years, ITD has de-veloped an in-house bridge deterioration model similar to any basic asset management model. The ITD bridge deterioration model is based on the entirety of the state bridge system not individual bridges and is primarily used to drive investment decisions for the time horizon of the Idaho Transportation Invest-ment Program (ITIP) which are the next 1-7 years in the future. The amount of square footage area of bridge that becomes deficient every year (approximately 90,000 square foot assuming a severe deterio-ration rate) drives the model. Historically deterioration varies by yearly weather conditions, deicing chem-ical usage, and our aging bridge population. To account for bridge deterioration modeling inaccuracies the model assumes a benign, moderate and severe deterioration. Bridge replacement project candidates are chosen and evaluated in order to build the list of projects in the ITIP with respect to a set amount of funding. This is done with the primary objective to move ITD’s bridge performance measure from 75 percent to 80 percent of bridge deck square footage area to be in a “State or Good Repair” or “Good” Condition.
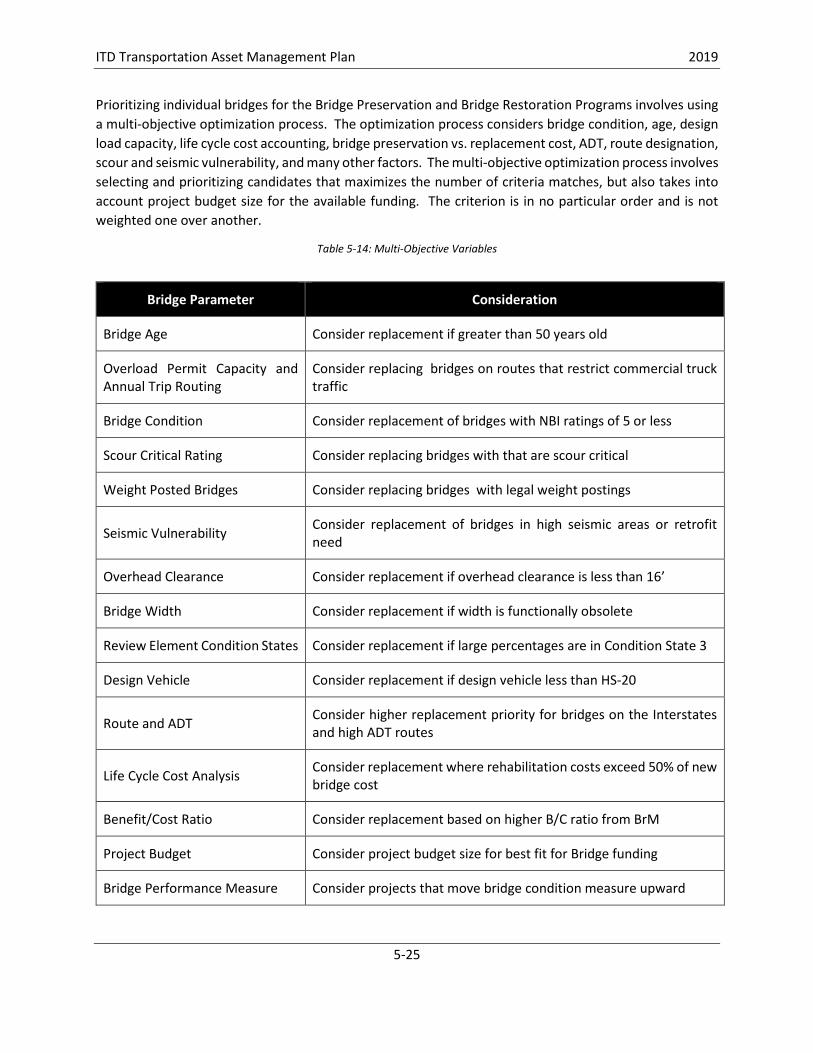
ITD Transportation Asset Management Plan 2019
5-25
Prioritizing individual bridges for the Bridge Preservation and Bridge Restoration Programs involves using a multi-objective optimization process. The optimization process considers bridge condition, age, design load capacity, life cycle cost accounting, bridge preservation vs. replacement cost, ADT, route designation, scour and seismic vulnerability, and many other factors. The multi-objective optimization process involves selecting and prioritizing candidates that maximizes the number of criteria matches, but also takes into account project budget size for the available funding. The criterion is in no particular order and is not weighted one over another.
Table 5-14: Multi-Objective Variables
Bridge Parameter Consideration
Bridge Age Consider replacement if greater than 50 years old
Overload Permit Capacity and Annual Trip Routing
Consider replacing bridges on routes that restrict commercial truck traffic
Bridge Condition Consider replacement of bridges with NBI ratings of 5 or less
Scour Critical Rating Consider replacing bridges with that are scour critical
Weight Posted Bridges Consider replacing bridges with legal weight postings
Seismic Vulnerability Consider replacement of bridges in high seismic areas or retrofit need
Overhead Clearance Consider replacement if overhead clearance is less than 16’
Bridge Width Consider replacement if width is functionally obsolete
Review Element Condition States Consider replacement if large percentages are in Condition State 3
Design Vehicle Consider replacement if design vehicle less than HS-20
Route and ADT Consider higher replacement priority for bridges on the Interstates and high ADT routes
Life Cycle Cost Analysis Consider replacement where rehabilitation costs exceed 50% of new bridge cost
Benefit/Cost Ratio Consider replacement based on higher B/C ratio from BrM
Project Budget Consider project budget size for best fit for Bridge funding
Bridge Performance Measure Consider projects that move bridge condition measure upward
ITD Transportation Asset Management Plan 2019
5-26
While ITD’s Bridge Condition Performance measure is primarily driven by bridge condition, other func-tional aspects of bridges are taken into account through the multi-objective optimization process. When bridges are replaced in the Bridge Restoration program, they are modernized to appropriate design stand-ards and take into account other modes of traffic such as accommodation for pedestrian, bicyclist and future light rail compatibility as appropriate.
Deterioration Forecasting and Prioritization
In addition to using the ITD Bridge Deterioration Model and multi-objective optimization process de-scribed above, ITD also uses planning modules within BrM to perform bridge deterioration modeling, fore-casting future conditions, and investment scenario optimization. This second method uses algorithms, decision trees, utility profiles and deterioration rates that are built into the BrM software with some cus-tomization by ITD. Decision trees, and to some extent algorithms, have been customized by Bridge staff to align with the business practices and policies of ITD. Deterioration rate curves have been derived from analysis of years of historical ITD bridge data.
All of the information fed into BrM is used to model future conditions on bridges. Recall, the BrM software is primarily used to model conditions well into the future beyond the seven year horizon of the Idaho Transportation Investment Program. BrM identifies and quantifies bridge needs for 8-15 years into the future and drives overall investment planning levels, not individual project selection for that time horizon. BrM makes predictions about future bridge performance levels based on several funding scenarios. High, medium and low funding scenarios are run. Medium is considered maintaining current funding levels. High and low levels represent an increase and a decrease in funding levels respectively. All of this infor-mation is reviewed by Bridge staff to ascertain optimal investment levels for the time period just beyond the Idaho Transportation Investment Program, 8-15 years into the future.
Planning this far into the future helps ITD to manage bridge performance through uncertain funding levels, economic cycles, variable environment (weather) patterns which have some influence on how fast bridges deteriorate, and cost increases and volatility in the highway construction market sector. Currently the BrM software is used as planning tool for ITD. The modules described above are relatively new when compared to the inspection data collection and storage modules. ITD in partnership with the software developer, AASHTOware has committed to further enhance the accuracy of this planning tool. This work is described in more detail in the “Additional Process Improvements” section in Chapter 4.
Synthesizing Results and Developing the Bridge Programs
Using the information from ITD’s in-house Bridge Deterioration Model, BrM condition data, and output from BrM planning modules, subject matter experts in Bridge develop a draft list of best value investments for the SHS bridges. These investments are developed or scoped at a planning level into projects and grouped into similar work programs of restoration and preservation work. This information is reviewed jointly by ITD staff in the central office and in district offices. As buildable projects emerge, staff from the central office and district offices collaboratively develop the final list of projects for the Bridge Restoration and Bridge Preservation programs. Some consideration is given to reasonably balance programs across the state.

ITD Transportation Asset Management Plan 2019
5-27
The final work programs for Bridge Preservation and Bridge Restoration are established with considera-tion to yearly funding levels set by the ITD Board. Increased funding over the past few years has enabled ITD to invest in improving an increasing amount (when compared to historical levels) of bridge deck area from deficient to “Good “condition or to a “State of Good Repair”. The amount of improving deck area has been greater than the amount of deck area that is declining. This shift from deficient to a State of Good Repair is the basis for a positive trend in ITD’s SHS Bridge performance measure as well as the Fed-eral Bridge Performance Measure for the NHS.
Figure 5-21, is a high-level schematic overview of how bridge performance data is acquired, utilized, and reviewed in concert with the development the Idaho Transportation Investment Program (ITIP).
Figure 5-21: Bridge Lifecycle Data Flow
It is important to note that the bridge programs that ITD uses to address bridge deficiencies are project oriented and include all project costs such as approach roadway work and other ancillary highway work such as traffic control, drainage, and/or lighting. For example, Interstate System Interchange projects that include bridges can be and are programed in the Bridge Restoration Program at times. Funding on these larger and complex projects to address bridge deficiencies may be less than one-half the total project cost.
Bridge Life Cycle Strategy ITD’s goal in using Bridge Preservation and Restoration programs and a life cycle planning process is to maximize a bridge’s utility while simultaneously minimizing costs (investments) over the bridge’s service life, usually 75 plus years. See Table 5-15 below for lifecycle planning objectives and strategies employed by ITD. Typically, after initial construction of a bridge and its subsequent opening to the public, cyclic maintenance is programmed for the bridge in order to maintain it in “Good” condition. Protective deck overlays, joint replacements, and painting are examples of cyclic maintenance. Sometimes as the bridge ages, more extensive bridge rehabilitation or repairs are necessary such as deck overlay or complete deck replacement.
These strategies show that ITD is moving toward managing bridges with the lowest lifecycle cost, although financial constraints and other uncertainties such as increasing heavy truck loads, increasing use of deicing
•Establishes the National Bridge Inventory (NBI) Rating
•Data stored in Bridge Management System
Bridge Inspections
•Assess Bridge Conditon ratings
•Prioritize network of Bridges based on condition
•District Meetings synthesis
Work Programing
•Optimize selection of candidate bridges and further prioritize based on defined performance criteria.
Multi-Objective Analysis
•Build ITIP based on Board allocated Bridge Funding
•Group similar work and final list of projects
ITIP Development
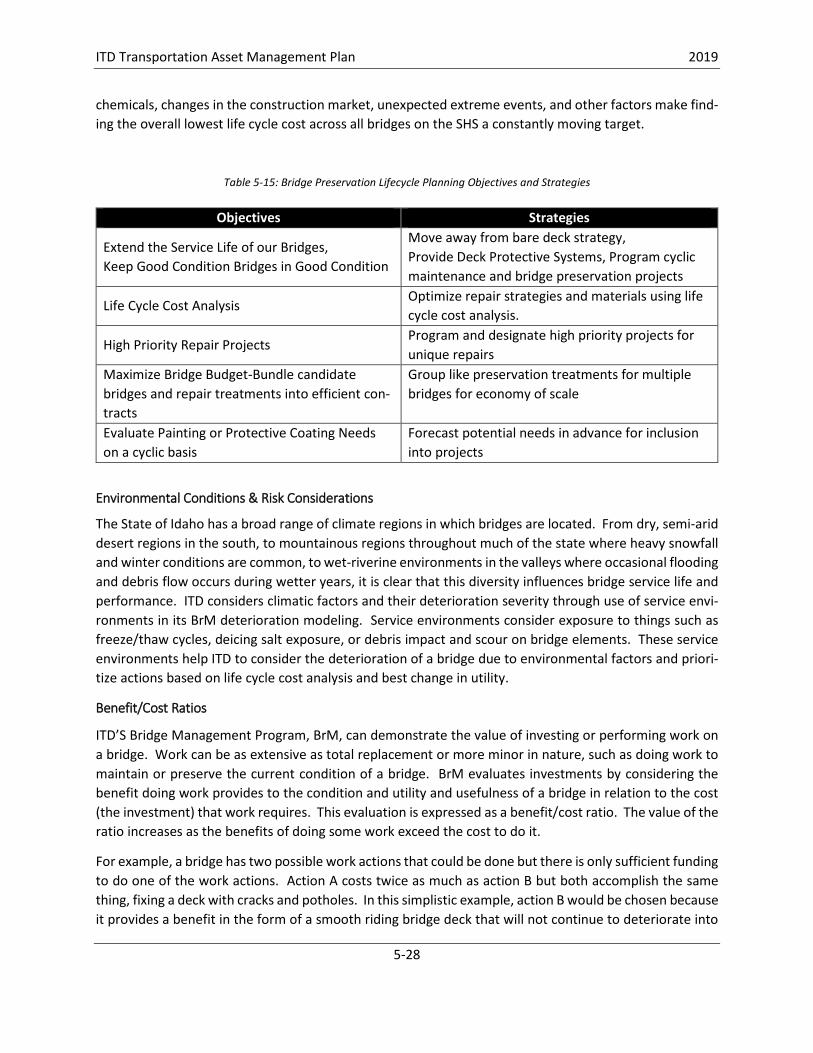
ITD Transportation Asset Management Plan 2019
5-28
chemicals, changes in the construction market, unexpected extreme events, and other factors make find-ing the overall lowest life cycle cost across all bridges on the SHS a constantly moving target.
Table 5-15: Bridge Preservation Lifecycle Planning Objectives and Strategies
Environmental Conditions & Risk Considerations
The State of Idaho has a broad range of climate regions in which bridges are located. From dry, semi-arid desert regions in the south, to mountainous regions throughout much of the state where heavy snowfall and winter conditions are common, to wet-riverine environments in the valleys where occasional flooding and debris flow occurs during wetter years, it is clear that this diversity influences bridge service life and performance. ITD considers climatic factors and their deterioration severity through use of service envi-ronments in its BrM deterioration modeling. Service environments consider exposure to things such as freeze/thaw cycles, deicing salt exposure, or debris impact and scour on bridge elements. These service environments help ITD to consider the deterioration of a bridge due to environmental factors and priori-tize actions based on life cycle cost analysis and best change in utility.
Benefit/Cost Ratios
ITD’S Bridge Management Program, BrM, can demonstrate the value of investing or performing work on a bridge. Work can be as extensive as total replacement or more minor in nature, such as doing work to maintain or preserve the current condition of a bridge. BrM evaluates investments by considering the benefit doing work provides to the condition and utility and usefulness of a bridge in relation to the cost (the investment) that work requires. This evaluation is expressed as a benefit/cost ratio. The value of the ratio increases as the benefits of doing some work exceed the cost to do it.
For example, a bridge has two possible work actions that could be done but there is only sufficient funding to do one of the work actions. Action A costs twice as much as action B but both accomplish the same thing, fixing a deck with cracks and potholes. In this simplistic example, action B would be chosen because it provides a benefit in the form of a smooth riding bridge deck that will not continue to deteriorate into
Objectives Strategies
Extend the Service Life of our Bridges, Keep Good Condition Bridges in Good Condition
Move away from bare deck strategy, Provide Deck Protective Systems, Program cyclic maintenance and bridge preservation projects
Life Cycle Cost Analysis Optimize repair strategies and materials using life cycle cost analysis.
High Priority Repair Projects Program and designate high priority projects for unique repairs
Maximize Bridge Budget-Bundle candidate bridges and repair treatments into efficient con-tracts
Group like preservation treatments for multiple bridges for economy of scale
Evaluate Painting or Protective Coating Needs on a cyclic basis
Forecast potential needs in advance for inclusion into projects

ITD Transportation Asset Management Plan 2019
5-29
an unsafe condition for half the cost of action A. Action B’s benefit/cost (B/C) ratio is two, while action A’s B/C ratio is one. The expected service life of either action A or B is not considered in this simplistic example.
Right Investment at the Right Time
As bridges age, carry traffic, are exposed to weather such as freeze/thaw cycles, and periodically experi-ence unexpected extreme events such as a flood, they deteriorate. Every new bridge starts its life in excellent condition and slowly begins a decline to poor condition. ITD makes investments periodically throughout a bridge’s life to slow this inevitable decline. Using its staff’s subject matter expertise of all the available investment types or treatments along with recommendations from BrM, ITD makes decisions about what treatment(s) are the best fit for the problem(s) facing a bridge. This analysis is done at several levels. First, it is done at a high-level, system wide for many bridges to determine the optimal balance of preservation versus restoration of bridges with respect to the amount of transportation funding available. The next section will discuss this in greater detail.
Once preservation and restoration program budgets are set, ITD HQ bridge staff, using information from BrM and their knowledge of effective treatments, consult with district staff to determine what bridges need what treatments. For example, some possible treatments could be epoxy deck sealing, concrete overlay, replacing leaking expansion joints, fiber wrapping damaged girders, or installing countermeasures to arrest scour in a riverbed. ITD’s objective is to apply the most appropriate and cost effective treatment to address the problem(s) on the bridge. A range of investments is considered. Using principles of life cycle planning, often times treatments that have a higher initial cost than other treatments but last sub-stantially longer are chosen because they are cheaper and more cost effective when looking at the entire life span and costs incurred to operate a bridge for 75 plus years.
In addition to applying the right treatment, applying the treatment at the right time is the other corner-stone to good life cycle planning. For example, painting a steel bridge at the right time is highly effective in prolonging its life. However, if painting is delayed, at some point, too much of the steel is eaten away by rust, painting is no longer effective, and a much more expensive rehabilitation or replacement action is required. ITD bridge staff generally follow typical industry bridge maintenance schedules as a starting point to time investments. Then using information from BrM, they adjust either up or down the specific year investments are made on a given bridge in response to how fast deterioration is occurring on the bridge. Deterioration may be more severe or mild than expected due to a variety of factors. Such as a series of harsh winters and the subsequent heavier than normal use of deicing chemicals on a bridge deck would cause it to deteriorate faster than normal. Other factors affect timing of investments such as cost volatility in construction markets or the possibility to bundle similar work on other bridges in an area to achieve savings from increasing economies of scale.
Finally four times a year, Bridge staff share minor maintenance and preservation needs with the districts. Districts primarily complete this minor work with their own forces. This type of work extends the life of bridge and stops minor problems from developing into bigger more costly problems. This work includes activities such as minor spot repairs, deck sweeping, expansion joint cleaning/repair, and gutter and drain cleanout.
ITD Transportation Asset Management Plan 2019
5-30
Investing in Preservation vs Restoration Work
ITD has funding dedicated to Bridge Preservation and to Bridge Restoration programs. These dedicated funding programs are integral to ITD’s focus on improving performance of bridges. Preservation and res-toration, together, have allowed ITD to shift away from a worst first approach to best value work pro-gramming. To achieve this shift, ITD staff analyzed the outcome of bridge conditions that would result from several different funding splits between bridge preservation and restoration.
In the analysis, bridge conditions were related to age. Costs for preservation and restoration projects were expressed in terms of bridge deck area. As mentioned, several budget levels were investigated. Greater or lesser budgets delivered preservation and restoration at greater or lesser aggregate quantity of bridge deck area. The analysis showed that funding directed to a mix of preservation and restoration projects would lead to better conditions across all SHS bridges. The result of the study set ITD’s current strategy for managing SHS bridges and culverts. ITD’s management strategy directs approximately 20 percent of funding to Bridge Preservation and 80 percent of funding to Bridge Restoration. With 75 per-cent of bridges in a state of good repair and a target to be at 80 percent in a state of good repair, this 80/20 balance between restoration and preservation is optimal. As bridge conditions improve, as they are forecasted to do, ITD will reevaluate this balance and determine if there is more optimal balance in how funds are split between restoration and preservation when the performance targets are achieved and the gaps are closed.
As mentioned, ITD currently directs approximately 20 percent of its bridge funding to preservation and 80 percent to restoration. Investing in bridge preservation keeps our “Good” bridges in “Good” condition and flattens the rate of bridge deterioration that normally occurs over time. Companioned with this is an 80 percent funding allocation to restoration work. This work takes bridges in poor condition and returns them to good condition. Most of the time this is through replacement of poor, obsolete, and restricted bridges with new bridges in excellent condition capable of carrying modern heavy vehicles loads. Some bridges are restored through rehabilitation work. Such as a bridge with a deck in poor condition and girders in fair-to-good condition. The optimal investment type for this bridge may be to replace the deck only and do spot repairs on the girders and foundation. The current 80/20 split coupled with an $80M per year investment in bridgework overall is sustainable with given funding. As shown in chapter 3, Figure 3-17, given the current funding level, this split shows ITD will meet its performance target and close the current performance gap in about 5 years.
When the performance target is achieved, investing a larger percentage of bridge funds in preservation may be optimal in the future. However, for the current conditions, as ITD strives to reach our bridge performance target, with given funding levels, the 80/20 split in bridge funding is appropriate.
Bridge Preservation Project selection for the Bridge Preservation Program centers on keeping our bridges that are in “Good” condition in “Good” Condition. Project selection is not necessarily condition based, but with more of a focus on cyclic maintenance and preserving current conditions. Candidate selection emphasizes similarity of preservation treatments amongst groupings of bridges in an area while applying the right treatment at the right time for optimal cost effectiveness. Another way to look at the Bridge Preservation program at
ITD Transportation Asset Management Plan 2019
5-31
ITD is that with the yearly 20 percent investment of Bridge Program dollars into preservation approxi-mately 1,000,000 sq. ft. of bridge deck area in “Good” Condition are maintained in “Good Condition”.
Cyclic maintenance in Bridge Preservation projects involve activities performed roughly at predetermined intervals to maintain current conditions on bridges. Following these intervals and implementing these activities will delay deterioration. ITD strives to implement deck protective systems within one to three years after original construction is complete. Depending on a bridge’s condition and the type of treatment chosen ITD expects to reapply the treatment on a 10 to 30-year cycle. See Table 5-17 for an illustration of a preservation life cycle planning approach. While the ITD preservation strategy requires more treat-ments to be undertaken though out the life cycle of the structure, the costs are much lower than doing nothing for many years and then implementing fewer but much more costly treatments to maintain a bridge. This is illustrated in Figure 5-22: Comparison of Restoration vs Preservation Cumulative Lifecycle Costs shown on page 5-32. It can be seen that the cumulative net present value of the preservation strat-egy saves $161 per square foot of deck over the life of the structure as compared to the rehabilitation strategy.
It is important to note that preserving a bridge in good condition in most cases will not show a high value benefit/cost ratio, as there most likely will be no change in the condition of the bridge deck. However, over time and with our deterioration modeling, a positive benefit/cost ratio is shown as the bridge deck condition would have deteriorated without the benefit of the bridge preservation treatment. Running multiple modeling scenarios using different funding splits for perseveration and restoration show high value positive benefit/cost ratios because decline in condition is delayed with relatively low cost bridge preservation treatments in comparison to more costly rehabilitation or replacement actions.
Cyclic Bridge Preservation
As another example of ITD’s life cycle planning approach is how we determine the right action or invest-ment at the right time. Typically, when a new bridge is constructed a protective bridge deck overlay will be installed within approximately one to three years after it is opened to traffic. The selection of the type of protective overlay is dependent on route, ADT and cost. For lower ADT routes, many times a protective overlay applied on a cyclic schedule can prove to have a high cost benefit ratio. On the other hand, for high traffic routes like the Interstates a more costly but longer lasting more durable protective overlay proves to be more cost effective over the life of the bridge considering the high traffic these bridges tend to carry, the high cost to control traffic during installation, the associated safety concerns on these high speed bridges, the high traffic volumes on these routes and the impact or user costs to the public if these were bridges under more frequent construction installing cheaper, less durable treatments.
Further, ITD’s life cycle cost analysis takes into consideration other typical maintenance activities such as joint or bearing work and application of other protective coatings. The initial costs of these activities and the estimated life of these activities are considered. The objective is to time these other activities with the next cyclic application or bridge preservation activity takes place to realize savings in administering construction contracts and contractor costs mobilizing to a bridge site to do work.
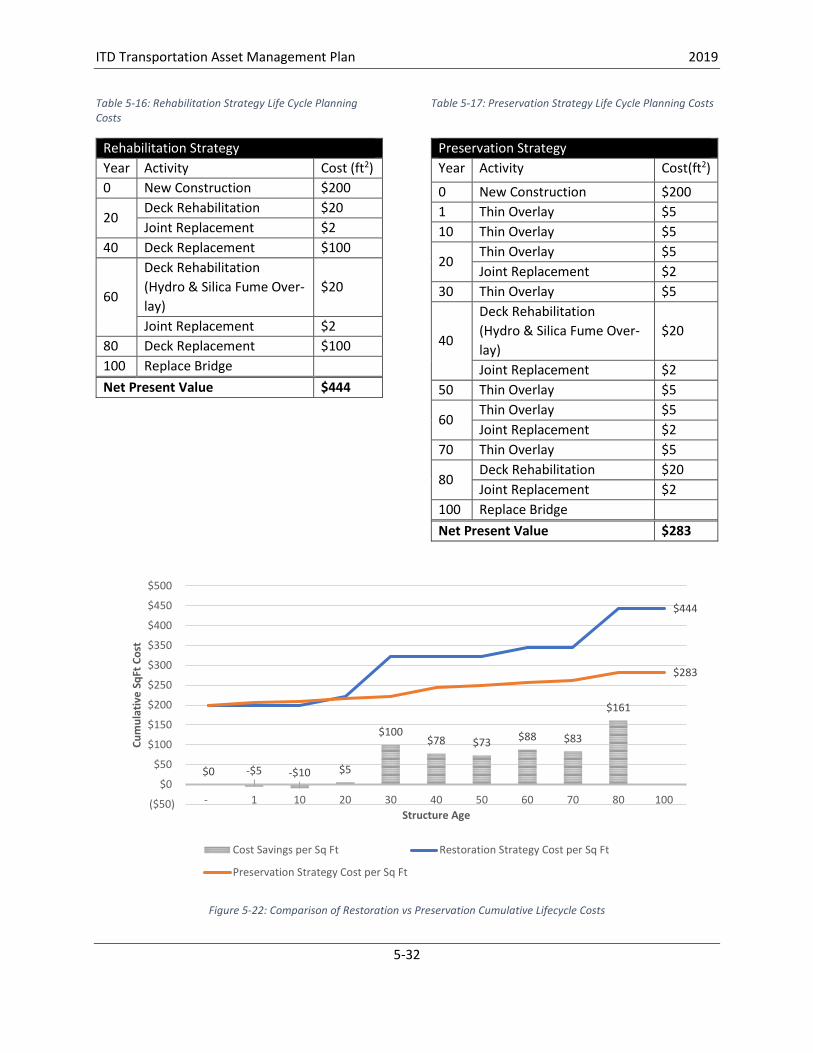
ITD Transportation Asset Management Plan 2019
5-32
Table 5-16: Rehabilitation Strategy Life Cycle Planning Costs
Rehabilitation Strategy Year Activity Cost (ft2) 0 New Construction $200
20 Deck Rehabilitation $20 Joint Replacement $2
40 Deck Replacement $100
60
Deck Rehabilitation (Hydro & Silica Fume Over-lay)
$20
Joint Replacement $2 80 Deck Replacement $100 100 Replace Bridge Net Present Value $444
Table 5-17: Preservation Strategy Life Cycle Planning Costs
Preservation Strategy Year Activity Cost(ft2)
0 New Construction $200 1 Thin Overlay $5 10 Thin Overlay $5
20 Thin Overlay $5 Joint Replacement $2
30 Thin Overlay $5
40
Deck Rehabilitation (Hydro & Silica Fume Over-lay)
$20
Joint Replacement $2 50 Thin Overlay $5
60 Thin Overlay $5 Joint Replacement $2
70 Thin Overlay $5
80 Deck Rehabilitation $20 Joint Replacement $2
100 Replace Bridge Net Present Value $283
Figure 5-22: Comparison of Restoration vs Preservation Cumulative Lifecycle Costs
$0 -$5 -$10 $5
$100$78 $73 $88 $83
$161
$444
$283
($50)
$0
$50
$100
$150
$200
$250
$300
$350
$400
$450
$500
- 1 10 20 30 40 50 60 70 80 100
Cum
ulat
ive
SqFt
Cos
t
Structure Age
Cost Savings per Sq Ft Restoration Strategy Cost per Sq Ft
Preservation Strategy Cost per Sq Ft

ITD Transportation Asset Management Plan 2019
5-33
Bridge Restoration Project selection for the Bridge Restoration Program centers on taking bridges that are in Poor condition and returning them to Good Condition. Project selection is primarily condition based, with additional emphasis on age, restriction on freight or truck traffic, susceptibility to extreme events e.g. earthquake or flood. Consistent with the multi-objective optimization process described earlier, other factors can also influence project selection such as route importance, traffic volume, and width/lane restrictions.
Figure 5-23: Example of Poor Condition Bridge Deck
Currently 80 percent of ITD’s bridge funding is devoted to this program. As described in Chapter 3, ITD is on a multi-year endeavor to increase the percentage of bridge deck area in “good” condition from 75 percent to 80 percent on the SHS. To achieve this 5 percent gain, a substantial investment is needed over several consecutive years to replace or rehabilitate poor condition bridges. The specific dollar amount invested fluctuates somewhat from year to year, but on average ITD is spending $60-65 million every year on this program to get rid of old, obsolete and poor condition bridges. Another way to look at the Bridge Restoration program at ITD is that with the yearly investment of $60-65 million, approximately 100,000 sq. ft. of bridge deck area is improved from poor condition to good condition.
It is important to note that ITD includes all costs of a project in the funding category listed in the Idaho Transportation Investment Program. This point is especially important in the Bridge Restoration program. Often Bridge Restoration projects, especially those replacing poor bridges with new ones include some portion of approach roadway work on either end of the bridge. While the Bridge Restoration program’s primary objective is to address deficiencies on poor condition bridges, many other non-bridge costs may be included in a given project in this program depending on specific project constraints and scope. For example, poor condition bridges that are being replaced within an Interstate System Interchange can be programed in the Bridge Restoration Program. The funding needed to address only bridge deficiencies
ITD Transportation Asset Management Plan 2019
5-34
may be far less than one-half the total project cost due to all the approach roadway work adjustments often needed in modernizing a freeway system interchange. ITD accounts for additional non-bridge costs by assigning a cost multiplier to certain Bridge Restoration projects it is considering undertaking.

ITD Transportation Asset Management Plan 2019
6-35
- Risk Management Process ITD has adopted an on-going process to identify, assess, and manage its ma-jor risks, including those that could af-fect its asset management objectives, strategies, and achievement of its tar-gets.
ITD adopted for this asset manage-ment risk analysis the Federal defini-tion of risk, which is the positive or negative effects of uncertainty upon agency objectives.
Any plan as long-term and ambitious as an asset management plan faces many uncertainties. The plan requires the forecasting of revenues, the pre-diction of pavement and bridge perfor-mance, assumptions about traffic growth and climate, and assumptions that economic and political priorities will remain stable. Major changes in revenues, political priorities, or agency policies could prevent any of the ob-jectives or targets in this plan from be-ing met.
This risk chapter acknowledges many risks that could affect the plan and de-scribes how ITD plans to manage those risks.
Identify Objectives and Risks In Chapter 1, ITD identified its asset management objectives and targets. The objectives are to:
1. Reduce Fatalities 2. Maintain the Pavement in Good or Fair Condition 3. Maintain the Bridges in Good or Fair Condition 4. Keep Highways Clear of Snow and Ice During Winter Storms 5. Hold Administration and Planning Expenditures Constant
Risk Analysis Requirements In Sec. 515.7 (c) of the final rule, FHWA says, “A State DOT shall establish a process for developing a risk management plan. This process shall, at a minimum, produce the following information:
(1) Identification of risks that can affect condition of NHS pavements and bridges and the performance of the NHS, in-cluding risks associated with current and future environmen-tal conditions, such as extreme weather events, climate change, seismic activity, and risks related to recurring dam-age and costs as identified through the evaluation of facili-ties repeated damaged by emergency events carried out un-der part 667 of this title. Examples of other risk categories include financial risks such as budget uncertainty; opera-tional risks such as asset failure; and strategic risks such as environmental compliance.
(2) An assessment of the identified risks in terms of the like-lihood of their occurrence and their impact and conse-quence if they do occur;
(3) An evaluation and prioritization of the identified risks;
(4) A mitigation plan for addressing the top priority risks;
(5) An approach for monitoring the top priority risks; and
(6) A summary of the evaluations of facilities repeatedly damaged by emergency events carried out under part 667 of this title that discusses, at a minimum, the results relating to the State’s NHS pavements and bridges.

ITD Transportation Asset Management Plan 2019
6-36
6. Complete Project Designs On Time 7. Hold Construction Cost at Award to Programmed Budget 8. Hold Final Construction Cost to Contract Award
The targets are to:
• Allow no more than four percent of Interstate pavements to be in poor condition • Keep 50 percent of Interstate pavements in good condition • Allow no more than eight percent of Non-Interstate NHS pavements to be in poor condition • Keep 50 percent of Non-Interstate NHS pavements in good condition • Allow no more than three percent of NHS bridges to be in poor condition • Keep at least 19 percent of NHS bridges in good condition
ITD already had adopted an Enterprise Risk Management (ERM) process. Senior executives met with all districts and divisions to identify risks that could affect the department’s major strategic objectives. Sub-sequent to the ERM assessment, a separate meeting was held to specifically identify risks to the asset management objectives, assess the risks, and identify mitigation strategies. The asset management risks and the mitigation to them will be managed to reduce their negative impacts and enhance their positive ones.
Identification and Assessment of Risks The risk management process focused upon the issues, events, or trends that could affect achievement of the asset management objectives. Senior agency leaders reviewed the agency’s objectives and then systematically considered different categories of risks that could impede those objectives. Risks were recorded as “if/then” statements such as, “If Federal funding decreases, then ITD may not be able to sustain its assets in a state of good repair.” Forty-one risk statements were captured as final risks after several others were discarded as redundant or irrelevant to asset management.
Each potential risk was recorded by the leadership and then assessed with the risk matrix seen in Figure 6-1. The risk exercise participants were led through an assessment of each risk by its likelihood and impact resulting in an overall risk rating. The risk matrix included standard definitions for the level of likelihood and impact. When the likelihood and impact were both considered, the risk rating could be identified. As seen in Figure 6-1, the risk rating is a function of likelihood times impact and ranges from insignificant to very significant.
Major Risks In the risk registers seen below, the most significant risks are highlighted in red. Among the most serious risks were issues such as uncertain Federal funding, changing Federal priorities, future changes in Idaho priorities that could diminish a focus upon managing assets, population growth that creates additional demand for congestion-relief projects. The major risks illustrate the uncertainty surrounding key plan assumptions. The plan assumes that revenues will remain predictable, that construction prices will not increase excessively, and that public policy will continue to prioritize the management of assets. Changes in those conditions could impede the achievement of the plan’s objectives and lead to failure to sustain the condition targets.

ITD Transportation Asset Management Plan 2019
6-37
Monitoring Approach ITD’s senior leadership will monitor these risks and keep abreast of changes to the risk ratings. ITD’s existing process includes senior executives monitoring the risks and reporting changes to them. The sen-ior staff can then take steps to address the risks if they arise.
Figure 6-1: Risk Matrix Used for the Asset Management Risk Assessment
Part 667 Assets 23 U.S.C. Part 667 carries out a provision of the Fixing America’s Surface Transportation Act (FAST Act). That section requires states to identify and evaluate roadway assets subject to repeated damage during emergencies. FHWA requires the asset management plan to acknowledge these assets and discuss them in the risk management plan, if such assets exist in the state. FHWA promulgated in the final asset man-agement rule a narrow approach to this section. States need to identify NHS assets that have been sub-stantially damaged two or more times during officially declared emergencies since Jan. 1, 1997. The plan does not require the States to identify repair or mitigation strategies for these assets. Instead, they are to be considered in the normal programming process, at the State’s discretion.
ITD Emergency Fund Coordinator performed an evaluation for all declared emergencies 1997- 2019 af-fecting NHS facilities in Idaho. No locations meeting the criteria of 23 U.S.C. Part 667 were identified. A completed listing of these events is provided.
Rare Unlikely Possible Likely Very Likely
For Recurring EventsLess than once in
5 yearsOnce in 5 years Once in 3 years Once per year
More than once per year
For Single Events Probability over 5 years
< 10%(Less than 1 in 10)
10% to 25%(Avg. of about 1 in
6)
25% to 40%(Avg. of about 1 in
3)
40% to 60%(Avg. of about 1 in
2)
> 60%(Avg. of about 4 in 5)
Very Significant Medium Medium High Very High Very High
Major Low Medium High High Very High
Moderate Low Medium Medium High High
Minor Low Low Low Medium Medium
Insignificant Low Low Low Low Medium
Impa
ct
Risk Matrix with Impact and Likelihood Definitions
Multiple deaths & injuries, substantial public and private cost, and/or Governor or Legislature "takes over" ITD (e.g., change in Director, disabling legislation). .
Multiple injuries, or a single death, substantial public or private cost and/or foils agency objectives.
Injury, property damage, increased agency cost and/or impedes agency objectives.
Moderate agency cost and impact to agency objectives.
Impact low and manageable with normal agency practices.
Likelihood

ITD Transportation Asset Management Plan 2019
6-38
Risk Registers The risk registers developed for this asset management plan are as follows. The tables summarize the risks that were identified and assessed. Risk responses are included for each. These risk registers will be incorporated and updated as part of ITD’s ongoing enterprise risk management program.
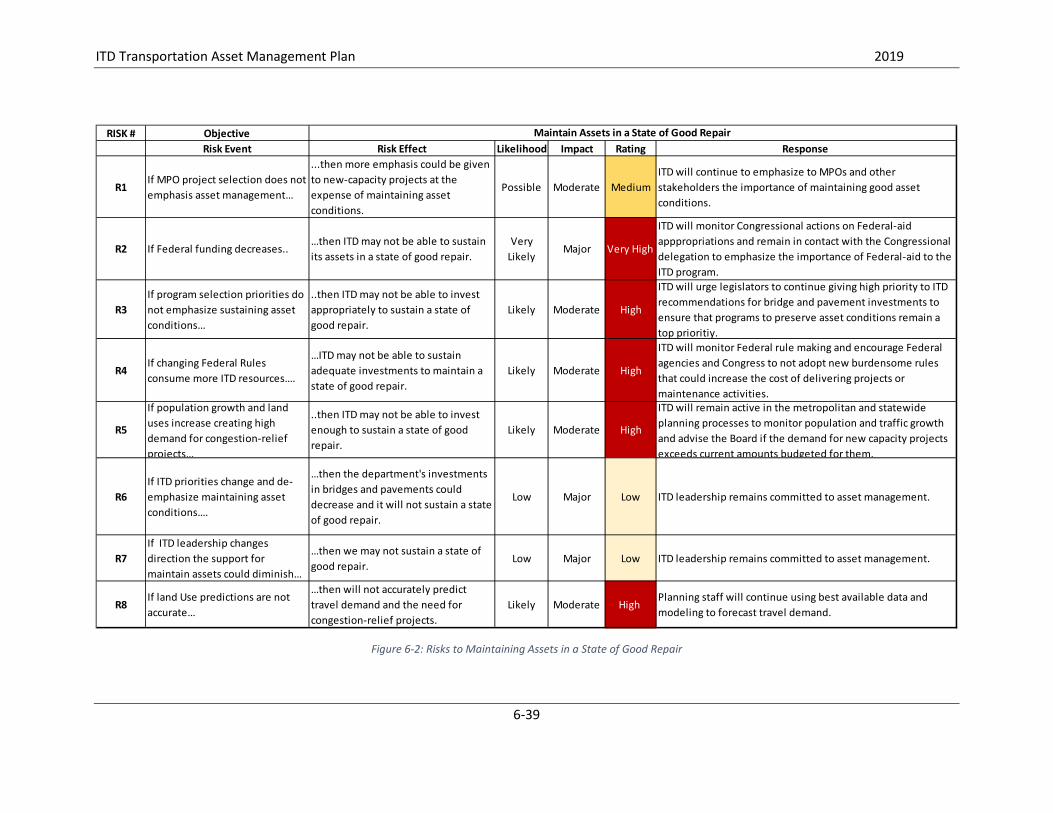
ITD Transportation Asset Management Plan 2019
6-39
Figure 6-2: Risks to Maintaining Assets in a State of Good Repair
RISK # ObjectiveRisk Event Risk Effect Likelihood Impact Rating Response
R1If MPO project selection does not emphasis asset management…
...then more emphasis could be given to new-capacity projects at the expense of maintaining asset conditions.
Possible Moderate MediumITD will continue to emphasize to MPOs and other stakeholders the importance of maintaining good asset conditions.
R2 If Federal funding decreases..…then ITD may not be able to sustain its assets in a state of good repair.
Very Likely
Major Very High
ITD will monitor Congressional actions on Federal-aid apppropriations and remain in contact with the Congressional delegation to emphasize the importance of Federal-aid to the ITD program.
R3If program selection priorities do not emphasize sustaining asset conditions…
..then ITD may not be able to invest appropriately to sustain a state of good repair.
Likely Moderate High
ITD will urge legislators to continue giving high priority to ITD recommendations for bridge and pavement investments to ensure that programs to preserve asset conditions remain a top prioritiy.
R4If changing Federal Rules consume more ITD resources….
…ITD may not be able to sustain adequate investments to maintain a state of good repair.
Likely Moderate High
ITD will monitor Federal rule making and encourage Federal agencies and Congress to not adopt new burdensome rules that could increase the cost of delivering projects or maintenance activities.
R5
If population growth and land uses increase creating high demand for congestion-relief projects…
..then ITD may not be able to invest enough to sustain a state of good repair.
Likely Moderate High
ITD will remain active in the metropolitan and statewide planning processes to monitor population and traffic growth and advise the Board if the demand for new capacity projects exceeds current amounts budgeted for them.
R6If ITD priorities change and de-emphasize maintaining asset conditions….
…then the department's investments in bridges and pavements could decrease and it will not sustain a state of good repair.
Low Major Low ITD leadership remains committed to asset management.
R7If ITD leadership changes direction the support for maintain assets could diminish…
…then we may not sustain a state of good repair.
Low Major Low ITD leadership remains committed to asset management.
R8If land Use predictions are not accurate…
…then will not accurately predict travel demand and the need for congestion-relief projects.
Likely Moderate High Planning staff will continue using best available data and modeling to forecast travel demand.
Maintain Assets in a State of Good Repair

ITD Transportation Asset Management Plan 2019
6-40
Figure 6-3: Risks Specific to Maintaining Pavements in a State of Good Repair
ObjectiveR9 Risk Event Risk Effect Likelihood Impact Rating Response
R10If the quality of recycled asphalt and other materials is not maintained to a high standard …..
…then we will not sustain our pavements in a state of good repair.
Possible Minor LowITD will remain diligent about materials testing and acceptance to ensure high-quality pavements.
R11If we over-rely on surface treatments …
… then we could have inaccurately high pavement-condition readings and lead to a false sense of confidence in the longevity or our pavements.
Possible Minor LowITD will remain committed to a well-balanced treatment program that applies the appropriate treatment based upon pavement conditions and funding availability.
R12If the pavement management system is improved…
…then we could have a significant opportunity to enhance our modeling of pavement conditions.
LikelyModerate/
MajorHigh
ITD will push ahead with acquiring a new pavement management system or improving the current one. A high-functioning pavement management system provides a significant opportunity to better manage pavements.
R13If we do not have adequate contractor availability…
…then we will face higher prices and inability to deliver projects where and when we need them.
Likely Minor Medium
ITD will monitor the number of contracts and bids, and advise the Board and agency leadership if a lack of competition could influence bid prices and leader to higher-than-expected prices.
R14
If ITD and the contractor community does not adapt to performance-based specifications….
… then we will not get the pavement quality that we need.
Likely Moderate HighITD will continue training staff and engaging with contractors to successfully implement performance specifications.
Maintain Pavements in a State of Good Repair

ITD Transportation Asset Management Plan 2019
6-41
Figure 6-4: Risks to Sustaining Adequate Investments for a State of Good Repair
Objective Risk Event Risk Effect Likelihood Impact Rating Response
R15If the donor/donee state financial balance is changed…
…then it could result in ITD receiving less Federal revenue.
PossibleVery
SignficantHigh
ITD will continue coordinating with Idaho's Congressional delegation to preserve Idaho's donee state status.
R16If there is Congressional uncertainty over the state of the Highway Trust Fund…
…then it could result in ITD receiving less Federal revenue.
Possible Moderate Medium
ITD will monitor Congressional actions on Federal-aid apppropriations and remain in contact with the Congressional delegation to emphasize the importance of Federal-aid to the ITD program.
R17If there continues to be changing vehicle mix and reduced fuel consumption…
…then State and Federal revenues could continue to decline.
Likely Minor MediumITD will monitor tax receipts and advise the Board if trends will result in revenues that fall below expectations.
R18If construction inflation increases signficantly….
…then our purchasing power will fall and we will not be able to sustain a state of good repair.
Rare Moderate LowITD will monitor bid prices for price increases that exceed those that are expected.
R19If labor costs increase or ITD experiences a shortage of skilled workers..
…then our costs will increase or we will not be able to achieve the performance we need.
Possible Moderate MediumITD will monitor bid prices for price increases that exceed those that are expected.
Sustain Adequate Funding for a State of Good Repair

ITD Transportation Asset Management Plan 2019
6-42
Figure 6-5: Risks Specific to Maintaining Structures in a State of Good Repair
ObjectiveRisk Event Risk Effect Likelihood Impact Rating Response
R20If we experience increasingly harsh winters and sustained salt use…
…then our bridges will sustain increased deterioration.
Possible Moderate MediumITD will contiue its bridge preservation efforts to reduce the impact of winter chemicals.
R21If we receive conistent funding at current levels…
…then we will not be able to repair or replace the wave of aging bridges that are coming.
Likely Moderate High
ITD will continue its bridge preservation and rehabilitatio efforts to maintain aging bridges and slow their deterioration rate. ITD also will monitor the bridge inventory closely and advise the Board of long-term investments needs to address our aging inventory.
R22If the traffic volumes and truck weights continue to increase…
…then our bridges will sustain increased deterioration.
Possible Major HighITD will monitor truck weights and advise the Board if excessive truck weights become a factor on bridge condition.
R23If contractor workmanship is not adequate…
…then we will not get the quality of construction that we need to sustain our bridges.
Possible Moderate MediumITD will maintain its diligence on contractor performance and material quality.
R24If we don't develop task order contracts for cyclic maintenance contracts…
..then it will be difficult to respond quickly to timely maintenance needs.
Possible Minor LowITD will explore the expansion of task order contracts to provide cyclic maintenance.
R25
If we don't develop a program to address our large structures that will need rehabilitation or replacement in the next decade…
…then our conditions will decline or we will have to divert all bridge funds to only a few structures for several years.
Very Likely Major Very HighITD will develop a multi-decade plan for when its high-cost large structures need to be rehabilitated or replaced and will attempt to fund a program to address them.
R26If we don't maintain an adequate number of bridge maintenance crews with proper skills…
…then we will not be able to complete needed maintenance and our conditions will deteriorate.
Likely Moderate HighITD will continue to staff and fund its bridge maintenance crews to keep pace with maintenance needs.
R27If we do not raise some of bridges with low vertical clearance…
..then bridge strikes will continue. Likely Minor MediumAs projects address bridges, ITD will ensure that adequate vertical clearances are addressed.
R28If we do not seismically retrofit our older structures…
…they will be vulnerable to seismic events.
Possible Moderate MediumITD will continue its seismic retrofit program to gradually address this need.
Maintain Structures in a State of Good Repair

ITD Transportation Asset Management Plan 2019
6-43
Figure 6-6: Risks to Having Skilled Staff to Sustain Assets
ObjectiveRisk Event Risk Effect Likelihood Impact Rating Response
R29If maintenance crews continue to be utilized for construction inspection…
…then we may not have enough crews for routine bridge and pavement maintenance.
Possible Minor LowITD will monitor mainteance needs and ensure that adequate hours are provided for maintenance functions.
R30If we continue to have many speciality functions that are filled by only one person..
…then we may have continued inefficiencies and delays when those staff leave or are not available.
Likely Minor MediumITD will try to use cross training where possible to address this issue.
R31If our staff does not develop the ability to use the new pavement management system….
…then we will not take full advantage of its capabilities.
Likely Minor MediumAs ITD improves its existing pavement management system or develops a new one, it will also provide training so staff can benefit from the full functionality of the system.
R32If we do not institute a knowledge transfer and succession planning effort…
…then we will lose institutional knowledge as our experienced staff retires.
Likely Minor MediumITD will try to use cross training where possible to address this issue.
Ensure ITD Has the Skilled Staff to Adequately Maintain Our Assets.
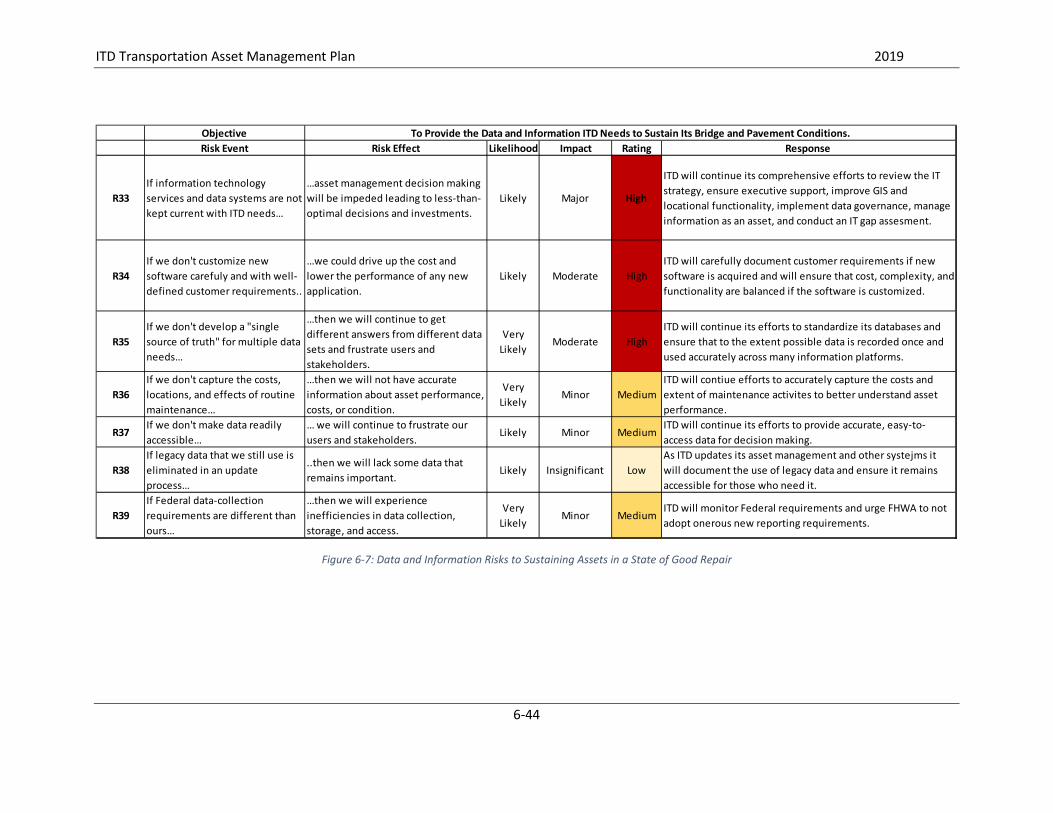
ITD Transportation Asset Management Plan 2019
6-44
Figure 6-7: Data and Information Risks to Sustaining Assets in a State of Good Repair
ObjectiveRisk Event Risk Effect Likelihood Impact Rating Response
R33If information technology services and data systems are not kept current with ITD needs…
…asset management decision making will be impeded leading to less-than-optimal decisions and investments.
Likely Major High
ITD will continue its comprehensive efforts to review the IT strategy, ensure executive support, improve GIS and locational functionality, implement data governance, manage information as an asset, and conduct an IT gap assesment.
R34If we don't customize new software carefuly and with well-defined customer requirements..
…we could drive up the cost and lower the performance of any new application.
Likely Moderate HighITD will carefully document customer requirements if new software is acquired and will ensure that cost, complexity, and functionality are balanced if the software is customized.
R35If we don't develop a "single source of truth" for multiple data needs…
…then we will continue to get different answers from different data sets and frustrate users and stakeholders.
Very Likely
Moderate HighITD will continue its efforts to standardize its databases and ensure that to the extent possible data is recorded once and used accurately across many information platforms.
R36If we don't capture the costs, locations, and effects of routine maintenance…
…then we will not have accurate information about asset performance, costs, or condition.
Very Likely
Minor MediumITD will contiue efforts to accurately capture the costs and extent of maintenance activites to better understand asset performance.
R37If we don't make data readily accessible…
… we will continue to frustrate our users and stakeholders.
Likely Minor MediumITD will continue its efforts to provide accurate, easy-to-access data for decision making.
R38If legacy data that we still use is eliminated in an update process…
..then we will lack some data that remains important.
Likely Insignificant LowAs ITD updates its asset management and other systejms it will document the use of legacy data and ensure it remains accessible for those who need it.
R39If Federal data-collection requirements are different than ours…
…then we will experience inefficiencies in data collection, storage, and access.
Very Likely
Minor MediumITD will monitor Federal requirements and urge FHWA to not adopt onerous new reporting requirements.
To Provide the Data and Information ITD Needs to Sustain Its Bridge and Pavement Conditions.

ITD Transportation Asset Management Plan 2019
6-45
Figure 6-8: Risks from External Threats That Could Affect Asset Conditions
ObjectiveRisk Event Risk Effect Likelihood Impact Rating Response
R40If we continue to experience periodic flooding…
…then we will have to respond to localized road closures and damage.
Likely Minor MediumITD will maintain its ability to respond to periodic flooding and reopen roads as quickly as possible.
R41If we don't manage redundant routes that needed for emergencies…
…we may not have adequate capacity if major routes are closed by emergencies.
Unlikely Moderate MediumITD will remain cogizant of which routes provide redundant access during emergencies and keep them in a state of good repair.
Protect Our Assets and Citizens from External Threats.

ITD Transportation Asset Management Plan 2019
7-1
- Financial Planning Process The Idaho Transportation Department (ITD) has a robust financial planning process to ensure that the state’s bridges and highways are properly maintained. This document describes the process ITD employs to identify available revenue sources and to pro-gram funds for maintaining the state’s transportation infrastructure assets. The process begins at the highest level with the identification of State, Federal, and Local resources available for the national highway system. The next step is to account for the expenditures nec-essary for department operations. The funding available for the Highway Fund-ing Plan (HFP) is calculated by subtract-ing the department operating costs from the total available revenue.
The HFP includes all funds available for the maintenance, operations and con-struction of the bridges and highways under ITD’s jurisdiction. There are many funding needs in the HFP in addi-tion to the infrastructure in the asset management plan. Examples of these funding needs include those pro-grammed for Transportation Alterna-tives, Recreational Trails, Railroad Crossings, and many local programs. These funds are subtracted from total available in the HFP to calculate the amount of funding available for the Transportation Asset Management Plan (TAMP). This section details the steps ITD employs to identify the fund-ing for the TAMP.
Financial Plan Requirements
FHWA is quite specific about financial plans. It defines them as a long-term plan spanning 10 years or longer, pre-senting a State DOT’s estimates of projected available fi-nancial resources and predicted expenditures in major as-set categories that can be used to achieve State DOT tar-gets for asset condition during the plan period, and high-lighting how resources are expected to be allocated based on asset strategies, needs, shortfalls, and agency policies.
The financial plan leads to investment strategies. Those are defined as a set of strategies that result from evaluat-ing various levels of funding to achieve State DOT targets for asset condition and system performance effectiveness at a minimum practicable cost while managing risks.
FHWA in Sec. 515.7 (6) (d) says the state shall establish a fi-nancial plan development process that identifies annual costs over a minimum of 10 years. The plan shall produce:
(1) The estimated cost of expected future work to im-plement investment strategies contained in the asset management plan, by State fiscal year and work type;
(2) The estimated funding levels that are expected to be reasonably available, by fiscal year, to address the costs of future work types. State DOTs may estimate the amount of available future funding using historical values where the future funding amount is uncertain;
(3) Identification of anticipated funding sources; and
(4) An estimate of the value of the agency’s NHS pave-ment and bridge assets and the needed investment on an annual basis to maintain the value of these assets.

ITD Transportation Asset Management Plan 2019
7-2
ITD Funding Sources ITD’s revenues come from many sources each of which are described below.
State Highway User Revenue Approximately half of the revenue generated for the maintenance and operation of the infrastructure in ITD’s jurisdiction is from state sources. This section includes a description of these sources.
Beginning Cash Balance
Known or projected operational cost savings and receipts above forecast can yield uncommitted cash balances at the end of each year. These cash balances are available in addition to forecasted revenue to support operational and program costs in subsequent year(s).
Highway Distribution Account (HDA)
The Highway Distribution Account includes state highway user revenue collected from motor fuels tax (gasoline and special fuels), motor vehicle registrations, and miscellaneous fees and permits. The SHA receives 57 percent of this revenue; the remaining amount is distributed to local highway jurisdictions and the Idaho State Police.
Ethanol Exemption
Seven percent of the motor fuel revenue is distributed to the State Highway account because of the elim-ination of the tax exemption for ethanol.
New User Revenue
During the 2015 Legislative session, the tax rate for motor fuels and registration fees for motor vehicles were raised. This additional revenue is reported independent of other revenue sources. Sixty percent of this revenue is directed to the SHA, the remainder is distributed to local highway jurisdictions.
State Highway Account (SHA) Miscellaneous Revenue
Certain registration, permit, and title fees identified in Idaho Code as well as miscellaneous receipts for sale of equipment, services, and supplies are also distributed to the SHA.
Estimates of state funds available for the HFP take into account projected revenues, the reservation of state matching funds for federal aid, and other operational needs not shown in the STIP.
The amount of state highway funding can be impacted by legislation passed in any given year. 2017 was an active year for the Idaho Legislature. The highlights include passage of House Bill 20 and removing the additional $75 fee for hybrid vehicles unless the vehicle is identified as a “plug-in” hybrid. House Bill 20 reduced annual transportation revenue to ITD by approximately $600,000.
Senate Bill 1043 allows agricultural vehicles to be moved without having to obtain an overlegal permit. This bill reduced annual transportation revenue by $54,000.
The estimated state funding for FY19 through FY25 available for highway capital construction averages above $200 million annually. This includes new highway user revenue and other funding generated by
ITD Transportation Asset Management Plan 2019
7-3
bills passed during the 2017 legislative session.
GARVEE Bond Proceeds
GARVEE (Grant Anticipation Revenue Vehicle) bonds are revenue bonds that pledge the full faith and credit of the state. Idaho Code allows no more than thirty percent of ITD’s federal apportionment to be used for GARVEE debt service. The department uses federal highway revenue to repay the bonds. Prior to FY17, the Idaho Legislature authorized the department to secure financing of $857 million of infrastruc-ture improvements in the GARVEE program. Projects funded by those pre-FY17 authorizations were closed out during FY16.
The 2017 Idaho Legislature authorized the issuance of up to $300 million in GARVEE bonds. These bonds will be used to fund highway projects
The estimated debt service on $300 million in additional bonds is approximately $24.0 million annually. In combination with the $56.7 million in existing debt service, the total annual debt service, including $300 million of additional bonds, would be approximately $80.7 million ($74.5 million federal funds and $6.2 million state matching funds).
Cigarette Tax Revenue for Debt Service
The 2015 Legislature passed legislation directing Cigarette Tax revenue to pay approximately $4.7 million per year of the GARVEE debt service.
Strategic Initiative Program Fund (SIPF)
The 2015 Legislature directed ITD to establish and maintain a Strategic Initiatives Program and Fund. The purpose is to fund projects proposed by the department’s six districts. The projects must compete for selection based on an analysis of their return on investment in prescribed categories.
In 2017, the Legislature passed Senate Bill 1206, which extended General Fund Surplus transfers by two years, directing them to the Strategic Initiatives Program fund and authorized a distribution of the fund with 60 percent to ITD and 40 percent to local highway jurisdictions administered by the Local Highway Technical Assistance Council (LHTAC).
The 2017 Legislature also passed House Bill 334, which added a category to the Strategic Initiatives Pro-gram Fund, relating to child pedestrian safety on the state and local systems.
The amount to be distributed after the end of FY17 is $27.7 million ($16.6 million to ITD and $11.1 million for local projects).
Transportation Expansion and Congestion Mitigation (TECM)
The 2017 Legislature also established the Transportation Expansion and Congestion Mitigation (TECM) Program and fund. The purpose of TECM is to fund projects that are chosen by the Idaho Transportation Board based on a project’s ability to improve traffic flow and mitigate traffic times and congestion. The TECM fund receives revenue from one percent of sales tax after local revenue sharing, and all remaining moneys following the distribution of the cigarette tax revenue.
ITD Transportation Asset Management Plan 2019
7-4
The forecasted TECM funding levels for FY19 through FY25 range from $16.9 million to $19.9 million an-nually.
Federal As is the case with other state transportation departments, ITD relies heavily on federal funding to main-tain its transportation infrastructure. These federal sources include:
• Excise taxes on gasoline and special fuels used to propel motor vehicles on public highways • Weight-based taxes on heavy vehicles registered for interstate commerce • Tax on the value of heavy commercial vehicle sales • Weight-based excise tax on tires exceeding 40 pounds
This revenue is directed to Idaho through Federal transportation legislation, federal project-specific dis-cretionary awards, or prior congressional earmark awards.
The current federal transportation authorization is the Fixing America’s Surface Transportation Act (FAST). It establishes funding over federal fiscal years 2016 through 2020. The MAP-21 transportation program structure continues under the FAST Act with one substantial change, the inclusion of a new Freight pro-gram and a few minor changes.
Funding estimates for the federal highway program are $302.2 million in FY18, $309.0 million in FY19, and $316.4 million in FY20 through FY24. These estimates are listed in year-of-expenditure dollars. ITD as-sumes that obligation authority will be equal to 100 percent of estimated apportionments. Funding fore-casts do not include year-end redistribution of obligational authority not used by other states.
Local FHWA and the Idaho Transportation Board reserve certain federal funds for use by local public agencies. Local public agencies must pay the match on these federal funds most often at Idaho’s sliding scale rate of 7.34 percent of the project cost. Local public agencies may also contribute funds in excess of the re-quired match on federal projects or choose to contribute to state-funded projects. These are termed Local Participating funds. Finally, there may be some costs on a local project which the FHWA cannot reimburse based upon a certain rules or regulation. These funds do not participate in the established match arrangement so are termed Local Non-Participating costs.
Idaho Transportation Department Expenditures Before ITD can dedicate funds to the Highway Funding Plan, it must dedicate a portion of the available funds to department operations.
Operations costs support programs outside those funded by the Highway Funding Plan, including Admin-istration, Capital Facilities, Aeronautics, Motor Vehicles, and Highway Operations. This section describes the department’s operating costs.

ITD Transportation Asset Management Plan 2019
7-5
Department Operations “Coming off the top” are expenditures for basic operations required to run the department, maintain roads, and provide people and equipment to manage the highway network.
Personnel
Costs for personnel who support Operations programs, including; full-time staff, temporary employees, overtime, shift-pay, and per diem for boards and commissions. These costs include employee salaries, employer benefit costs, and health insurance. Projections for annual increases in costs for salaries, ben-efits, and health insurance are reflected in the plan.
Operating Expenditures
Daily operating and seasonal costs are necessary to support delivery of Operations programs. Operating Expenditures cover a broad range of costs, including supplies, repair and maintenance, utilities, commu-nications, fuel, road maintenance materials (asphalt, plant-mix), winter operations materials (salt, brine, and sand), insurance, etc. Operating expenditures reflect projected inflation and volume increases ex-pected during the plan period.
Equipment
Acquisition cost of new and replacement equipment necessary for delivery of services in Operations pro-grams. These costs include; road equipment, computers and network equipment; specific use, laboratory, and shop equipment.
Capital Facilities
Costs needed for maintaining, designing, and building department facilities.
Trustee and Benefits
Funds passed-through to entities authorized to carry out specialized program activities eligible for funding under provisions of the granting agency. This financial analysis does not carry any Trustee and Benefits resources used by the department’s Operations programs.
Other Costs and Timing Adjustments Across Plan Years
Includes resources used for Operations not classified in the previous categories and addresses timing dif-ferences across plan years necessary to reconcile to available funding carried in each year of the current Highway Funding Plan.
Funding Available for Highway Program The Program Targets spreadsheet begins with funding targets from the Highway Funding Plan. Specifi-cally, it requires federal funds with match after takedown for indirect costs by year. It also requires state funds by appropriation by year. Idaho has a reduced sliding scale match rate for interstate work of 92.27 percent and for non-interstate work of 92.66 percent. The annual match rate for NHPP funds was ob-tained from the composite rate on programmed 2019 – 2025 projects.
ITD Transportation Asset Management Plan 2019
7-6
Funds available to the State Highway System are placed into Performance Programs, which address reha-bilitation and restoration of assets. Specifically, the TAMP is funded through the Pavement Preservation (Commerce), Restoration, Bridge Preservation, and Bridge Restoration Programs. Capacity projects some-times have a reconstruction component to existing lanes which are also funds available to the TAMP.
Since we recently began our FY 2019 – 2026 Program Update, the annual targets for these programs were used in the TAMP. Each spring, the Transportation Board reviews pavement and bridge condition to de-termine funding targets for Pavements vs. Bridges vs. Safety & Capacity. The targets for the final two years of the TAMP flat lines the previous $80 million for Safety & Capacity, $80 million for bridges, and the remaining funds for pavement. Actual Safety & Capacity projects were used to estimate its contribu-tion toward the TAMP.
Similarly, the projects programmed in FY 2019 – 2025 were used to estimate how much of these funds are used on the National Highway System, including interstate, as opposed to state highways. Annual ratios of NHS project costs vs. the whole were prepared and multiplied against the above targets to de-termine funding available to the TAMP on the National Highway System.
Funds not used for State Highway System State of Good Repair The HFP includes many programs that are not intended to address the “state of good repair” on the state highway system. These programs are described in this section.
Highway / MPO Planning
The purpose of the Metropolitan Planning Program is to fund planning for Idaho’s five metropolitan plan-ning organizations in order to establish a cooperative, continuous, and comprehensive framework for making transportation investment decisions and to carry out transportation planning activities through-out the State.
Transportation Alternatives
The purpose of the Transportation Alternatives Program (TAP) is to provide funding for programs and projects defined as transportation alternatives, including on and off-road pedestrian and bicycle facilities, infrastructure projects for improving non-driver access to public transportation and enhanced mobility, community improvement activities, and environmental mitigation; recreational trail program projects; safe routes to school projects; and projects for the planning, design, or construction of boulevards and other roadways largely in the right-of-way of former Interstate System routes or other divided highways.
Recreational Trails
Apportionments are transferred to the Department of Parks and Recreation for their administration of the Recreational trails program projects.
Surface Transportation - Local Programs
The purpose of the STP-Local Urban Program is to ensure that local federal-aid routes within urban areas (population 5,000 to 200,000) are in good condition and unrestricted. Projects within this program should preserve and improve the conditions of the local federal-aid route as well as encourage and promote the safe and efficient management, operation, and development of the transportation systems to serve the
ITD Transportation Asset Management Plan 2019
7-7
mobility needs of people and foster economic growth and development.
Local/Off system Bridge
The purpose of the Bridge Off-System Program ensures that local bridges off the federal aid system are in good condition and unrestricted.
Railroad Crossing
The purpose of the Rail-Highway Crossing Program is to enhance safety at Idaho’s public railroad-highway crossings, provide/encourage rail safety education, and fulfill federal rail reporting requirements.
Local Safety
The purpose of the Local Highway Safety Improvement Program (LHSIP) is to work towards the elimination of fatal and serious injury crashes on the local roadway system in Idaho. The Local Highway Technical Assistance Council (LHTAC), through an application process, selects highway safety improvement projects for submission into the Program in each ITD District. The selected projects are reviewed, verified and justified for compliance with funding regulations prior to inclusion into the Local Highway Safety Improve-ment Program (HSIP) portion of the Idaho Transportation Investment Program (ITIP).
Local Participating
Local public agencies may contribute funds in excess of the required match on federal projects or choose to contribute to state-funded projects. These are termed Local Participating funds.
Local Non-Participating
There may be some costs on a local project which the FHWA cannot or will not reimburse based upon a certain rules or regulation. These funds do not participate in the established match arrangement so are termed Local Non-Participating funds.
Local Match
Local funds required as the match for Federal funds on a local project.
GARVEE (Expansion)
The 2017 Idaho Legislature authorized the issuance of up to $300 million in GARVEE bonds. These bonds will be used to fund highway projects
GARVEE Bond Debt Service *
The estimated debt service on $300 million in additional bonds is approximately $24.0 million annually. In combination with the $56.7 million in existing debt service, the total annual debt service, including $300 million of additional bonds, would be approximately $80.7 million ($74.5 million federal funds and $6.2 million state matching funds).
SIPF – Local
In 2017, the Legislature extended General Fund Surplus transfers by two years, directing them to the Stra-tegic Initiatives Program fund and authorized a distribution of the fund with 60 percent to ITD and 40 percent to local highway jurisdictions administered by the Local Highway Technical Assistance Council

ITD Transportation Asset Management Plan 2019
7-8
(LHTAC).
SIPF - Child Pedestrian Safety
The 2017 Legislature also added a category to the Strategic Initiatives Program Fund relating to child pe-destrian safety on the state and local systems.
Funding Available for Transportation Asset Management The funds remaining after addressing the department’s operating needs and funding the programs not used for state highway system state of good repair are available for maintenance of the infrastructure included in the TAMP. This section describes the programs dedicated to these assets.
Pavement Preservation (Commerce)
The purpose of the Pavement Preservation Program is to employ a planned strategy of cost effective treatments to the surface of a structurally sound roadway that preserves the system, retards future dete-rioration, and maintains or improves the functional condition of the commerce route system without sub-stantially increasing structural capacity. Within this funding category, the specific work type allowed is preservation.
Pavement Preservation (Non-Commerce)
The purpose of the Pavement Preservation Program is to employ a planned strategy of cost effective treatments that preserves the non-commerce system and retards future deterioration. Within this fund-ing category, the specific work type allowed is preservation.
Pavement Restoration
The purpose of the Restoration Program is to fund pavement projects that are more extensive than pave-ment preventative maintenance. These structural enhancements are used to extend the service life of an existing pavement and/or improve its load carrying capacity or completely rebuild a pavement structure. Restoration of other assets and traffic operation projects are also placed in this program. Within this funding category all five work types (e.g., Maintenance, Initial Construction, Reconstruction, Rehabilita-tion, and Preservation) are allowed.
Bridge Preservation
The purpose of the Bridge Preservation Program is to ensure that Idaho’s state highway system bridge assets are in good repair and unrestricted. Within this funding category, the specific work type allowed is preservation.
Bridge Restoration
The purpose of the Bridge Restoration Program is to ensure that Idaho’s state highway system bridge assets are in good repair and unrestricted. Within this funding category all five work types (Initial Con-struction, Reconstruction, Rehabilitation, and Preservation) are allowed.
Safety & Capacity
The purpose of the Safety and Capacity (S&C) Program is to ensure that ITD’s state highway system is
ITD Transportation Asset Management Plan 2019
7-9
reliable and unrestricted, provides a means to invest in economic opportunities, and applies Idaho’s High-way Safety Improvement Program (HSIP) to advance the objectives and goals of ITD’s Strategic Plan. The Safety and Capacity program determines project prioritization to using funds from designated funding sources.

ITD Transportation Asset Management Plan 2019
7-10
The following tables show the expected revenues and expected expenditures. They form the “sources and uses” component of the asset man-agement financial plan. The first four tables show expected revenues, or the sources. The last three show the expenditures, or the uses.
Table 7-1 summarizes the expected state revenues and their sources for ITD from 2019-2028. As can be seen, the Highway Distribution Account, which contains state motor fuel taxes and fees, provides the largest source of ITD’s state revenue. In addition, as can be seen, some state funds are dedicated for specific programs, such as Transportation Expansion and Congestion Mitigation, and are not available for asset management purposes. These funds shown in Table 7-2 are those, which are allocated to ITD. Other state funds are distributed directly to local governments for transportation purposes.
All figures represent millions of dollars.
Table 7-1: Forecasted State Revenue Sources
date: 08-13-19 Highway - State FY2019 FY2020 FY2021 FY2022 FY2023 FY2024 FY2025 FY2026 FY2027 FY2028 10 Yr TotalAnticipated State Funding Beginning Cash Balance 11.8 -- -- -- -- -- -- -- -- -- 11.84
Highway Distribution Account (HDA)1 206.8 208.9 206.5 208.5 209.2 211.3 213.4 215.5 217.7 219.8 2,117.48 Ethanol Exemption1 17.7 18.0 17.6 17.7 17.8 18.0 18.2 18.3 18.5 18.7 180.51 New User Revenue1 64.9 67.0 67.4 67.8 68.7 69.4 70.1 70.8 71.5 72.2 690.0 State Highway Account Miscellaneous Revenue2 36.7 43.4 43.1 42.7 42.7 42.7 42.7 42.7 42.7 42.7 422.2 GARVEE Bond Proceeds * Authorized in 20173 125.0 100.0 75.0 -- -- -- -- -- -- -- 300.0 Transportation Expansion and Congestion Mitigation (TECM)4 16.9 16.8 17.6 18.4 19.2 19.9 19.9 19.9 19.9 19.9 188.6 Strategic Initiative Program Fund (SIPF)5 -- -- -- -- -- -- -- -- -- -- - Cigarette Tax Revenue for Debt Service6 4.7 4.7 4.7 4.7 4.7 3.6 3.3 3.1 2.9 2.7 39.1
Total State Highway Funding Sources $484.6 $458.7 $431.9 $359.8 $362.3 $364.9 $367.6 $370.4 $373.3 $376.1 $3,949.7
FY 2019 - 2028 Proposed ITD Ten Year Transportation PlanITD Funding & Use Summary ($ in Millions, rounded)
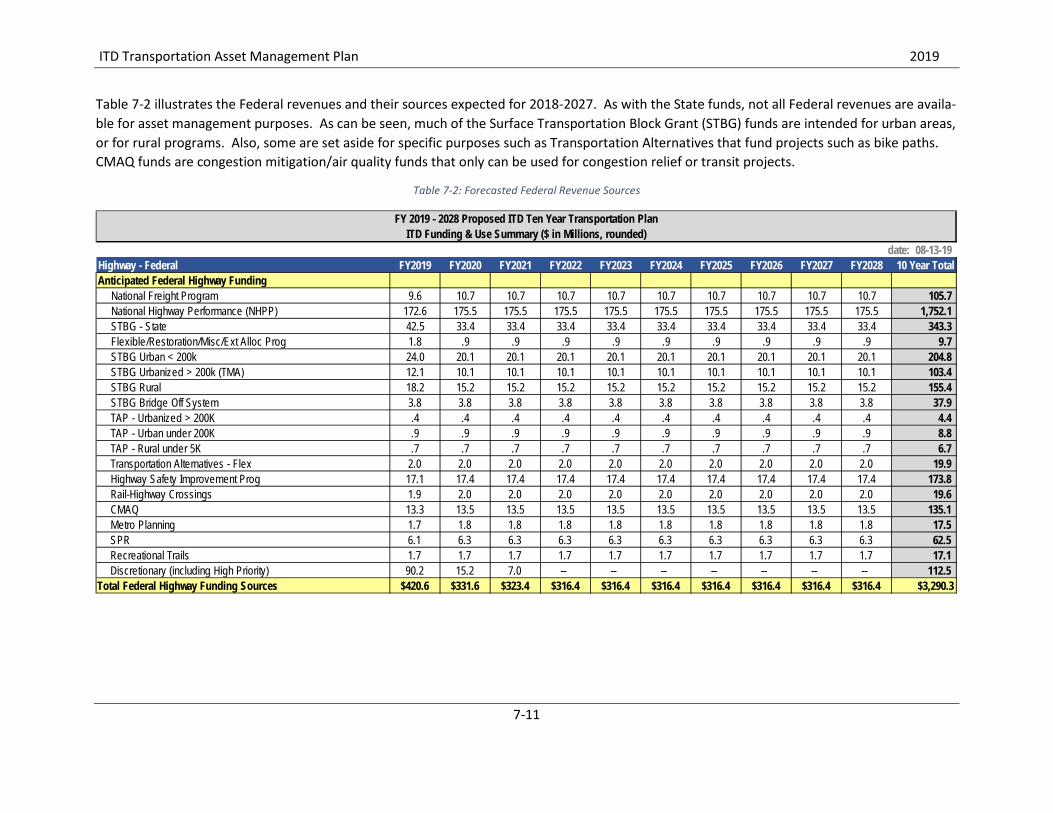
ITD Transportation Asset Management Plan 2019
7-11
Table 7-2 illustrates the Federal revenues and their sources expected for 2018-2027. As with the State funds, not all Federal revenues are availa-ble for asset management purposes. As can be seen, much of the Surface Transportation Block Grant (STBG) funds are intended for urban areas, or for rural programs. Also, some are set aside for specific purposes such as Transportation Alternatives that fund projects such as bike paths. CMAQ funds are congestion mitigation/air quality funds that only can be used for congestion relief or transit projects.
Table 7-2: Forecasted Federal Revenue Sources
date: 08-13-19 Highway - Federal FY2019 FY2020 FY2021 FY2022 FY2023 FY2024 FY2025 FY2026 FY2027 FY2028 10 Year TotalAnticipated Federal Highway Funding
National Freight Program 9.6 10.7 10.7 10.7 10.7 10.7 10.7 10.7 10.7 10.7 105.7 National Highway Performance (NHPP) 172.6 175.5 175.5 175.5 175.5 175.5 175.5 175.5 175.5 175.5 1,752.1 STBG - State 42.5 33.4 33.4 33.4 33.4 33.4 33.4 33.4 33.4 33.4 343.3 Flexible/Restoration/Misc/Ext Alloc Prog 1.8 .9 .9 .9 .9 .9 .9 .9 .9 .9 9.7 STBG Urban < 200k 24.0 20.1 20.1 20.1 20.1 20.1 20.1 20.1 20.1 20.1 204.8 STBG Urbanized > 200k (TMA) 12.1 10.1 10.1 10.1 10.1 10.1 10.1 10.1 10.1 10.1 103.4 STBG Rural 18.2 15.2 15.2 15.2 15.2 15.2 15.2 15.2 15.2 15.2 155.4 STBG Bridge Off System 3.8 3.8 3.8 3.8 3.8 3.8 3.8 3.8 3.8 3.8 37.9 TAP - Urbanized > 200K .4 .4 .4 .4 .4 .4 .4 .4 .4 .4 4.4 TAP - Urban under 200K .9 .9 .9 .9 .9 .9 .9 .9 .9 .9 8.8 TAP - Rural under 5K .7 .7 .7 .7 .7 .7 .7 .7 .7 .7 6.7 Transportation Alternatives - Flex 2.0 2.0 2.0 2.0 2.0 2.0 2.0 2.0 2.0 2.0 19.9 Highway Safety Improvement Prog 17.1 17.4 17.4 17.4 17.4 17.4 17.4 17.4 17.4 17.4 173.8 Rail-Highway Crossings 1.9 2.0 2.0 2.0 2.0 2.0 2.0 2.0 2.0 2.0 19.6 CMAQ 13.3 13.5 13.5 13.5 13.5 13.5 13.5 13.5 13.5 13.5 135.1 Metro Planning 1.7 1.8 1.8 1.8 1.8 1.8 1.8 1.8 1.8 1.8 17.5 SPR 6.1 6.3 6.3 6.3 6.3 6.3 6.3 6.3 6.3 6.3 62.5 Recreational Trails 1.7 1.7 1.7 1.7 1.7 1.7 1.7 1.7 1.7 1.7 17.1 Discretionary (including High Priority) 90.2 15.2 7.0 -- -- -- -- -- -- -- 112.5
Total Federal Highway Funding Sources $420.6 $331.6 $323.4 $316.4 $316.4 $316.4 $316.4 $316.4 $316.4 $316.4 $3,290.3
FY 2019 - 2028 Proposed ITD Ten Year Transportation PlanITD Funding & Use Summary ($ in Millions, rounded)

ITD Transportation Asset Management Plan 2019
7-12
Figure 7-3 includes the expected local funds for the 10-years of the plan. Local funds are provided as match to the Federal-aid funds used by local governments. These funds are seldom applied to ITD asset management projects. Usually, local match is provided only when a local government accesses Federal-aid funds for a local bridge, pavement, or capacity project off the state highway system.
At the bottom, Table 7-3 summarizes all of the expected revenues from State, Federal, and local sources. As can be seen at the far-right bottom row, a total of $7.3262 billion is expected to be available from all sources for the years 2019-2028.
Table 7-3: Forecasted Local Revenue Sources Plus Summary of All Sources
date: 08-13-19
Highway -Local FY2019 FY2020 FY2021 FY2022 FY2023 FY2024 FY2025 FY2026 FY2027 FY2028 10 Yr TotalAnticipated Local Highway Funding Local Participating 3.8 1.5 4.7 16.4 1.8 4.1 4.1 4.1 4.1 4.1 48.8 Local Non-Participating -- -- -- -- -- -- -- -- -- -- - Local Match 4.0 3.9 3.7 3.7 3.6 3.6 3.7 3.7 3.7 3.7 37.4 Total Local Funding Sources $7.7 $5.4 $8.3 $20.1 $5.4 $7.7 $7.9 $7.9 $7.9 $7.9 $86.2
Total Funding Sources $913.0 $795.7 $763.6 $696.3 $684.1 $689.0 $691.9 $694.7 $697.5 $700.4 $7,326.2
NOTES - Funding Sources
FY 2019 - 2028 Proposed ITD Ten Year Transportation PlanITD Funding & Use Summary ($ in Millions, rounded)
6. FY18 - FY23 Based on DFM Forecast (12-29-17). FY24 - FY28 based on a -7% growth rate.
2. FY18 - FY23 values based on Aug. 1, 2017 Forecast. FY24 - FY27 held constant at FY23 value
p y y g g g y p percent will be distributed to local projects administered by the Local Highway Technical Assistance Council (LHTAC). Value carried in this plan reflects ITD's sixty percent portion of Strategic Initiatives Program Fund monies, only.
1. FY18 - FY23 values based on Aug. 1, 2017 Forecast. FY24 - FY27 based on a +1% growth rate
3. 300 million in new GARVEE bonds to fund projects selected by the Idaho Transportation Board4.The 2017 Legislature also established the Transportation Expansion and Congestion Mitigation (TECM) Program and fund to improve traffic flow and mitigate traffic times and congestion. The TECM fund receives revenue from one percent of sales tax after local revenue sharing, and all remaining moneys following the distribution of the cigarette tax revenue.

ITD Transportation Asset Management Plan 2019
7-13
The following tables show expenditures. Table 7-4 shows operational costs that are expected to be incurred between 2019 and 2028. These funds “come off the top” before revenues are made available for asset management purposes. These represent the essential expenditures needed for basic functions such as paying salaries, operating snowplows, maintaining garages and rest areas, paying for highway lighting, and other core functions. Total operational costs equal an estimated $2.4810 billion for the 10 years.
Table 7-4: Department Operations Expenditures and Remaining Available Revenues
date: 08-13-19 Total Funding Sources $913.0 $795.7 $763.6 $696.3 $684.1 $689.0 $691.9 $694.7 $697.5 $700.4 7,326.2$
Department Operations FY2019 FY2020 FY2021 FY2022 FY2023 FY2024 FY2025 FY2026 FY2027 FY2028 10 Year TotalPersonnel 1 87.7 98.5 101.9 105.5 109.4 113.6 118.1 122.9 128.1 133.7 1,119.4 Operating Expenditures 93.4 97.5 98.5 99.5 97.4 98.4 99.4 100.4 101.4 102.4 988.1 Equipment 22.1 25.4 25.4 25.4 25.4 25.4 25.4 25.4 25.4 25.4 250.8 Capital Facilities 3.0 5.7 5.7 5.7 5.7 5.7 5.7 5.7 5.7 5.7 54.3 Trustee and Benefits -- -- -- -- -- -- -- -- -- -- - Other Costs and Timing Adjustments Across Plan Years 2 99.4 10.0 2.2 -5.3 -4.8 -5.5 -6.3 -5.7 -5.9 -9.7 68.5 Total Department Operations $305.6 $237.1 $233.7 $230.9 $233.1 $237.6 $242.2 $248.7 $254.7 $257.5 $2,481.0
NOTES - Department Operations
ITD Funding & Use Summary ($ in Millions, rounded)FY 2019 - 2028 Proposed ITD Ten Year Transportation Plan
1. Personnel costs for Operations programs, only. Personnel costs related to infrastructure assets are carried in Funding Available for Program. Adjusted for anticipated cost increases in employee salaries, 2. Costs not classified in other Operations categories and adjustments across plan years to reconcile available funding carried in each year of the current Highway Funding Plan.
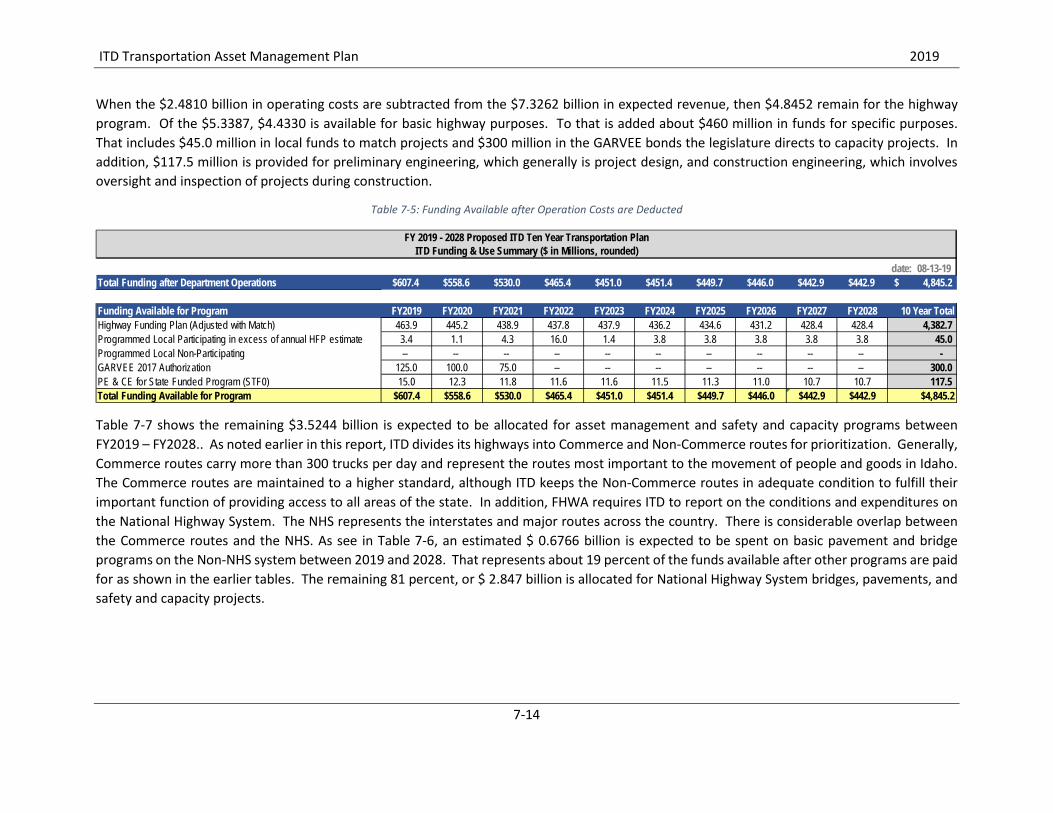
ITD Transportation Asset Management Plan 2019
7-14
When the $2.4810 billion in operating costs are subtracted from the $7.3262 billion in expected revenue, then $4.8452 remain for the highway program. Of the $5.3387, $4.4330 is available for basic highway purposes. To that is added about $460 million in funds for specific purposes. That includes $45.0 million in local funds to match projects and $300 million in the GARVEE bonds the legislature directs to capacity projects. In addition, $117.5 million is provided for preliminary engineering, which generally is project design, and construction engineering, which involves oversight and inspection of projects during construction.
Table 7-5: Funding Available after Operation Costs are Deducted
Table 7-7 shows the remaining $3.5244 billion is expected to be allocated for asset management and safety and capacity programs between FY2019 – FY2028.. As noted earlier in this report, ITD divides its highways into Commerce and Non-Commerce routes for prioritization. Generally, Commerce routes carry more than 300 trucks per day and represent the routes most important to the movement of people and goods in Idaho. The Commerce routes are maintained to a higher standard, although ITD keeps the Non-Commerce routes in adequate condition to fulfill their important function of providing access to all areas of the state. In addition, FHWA requires ITD to report on the conditions and expenditures on the National Highway System. The NHS represents the interstates and major routes across the country. There is considerable overlap between the Commerce routes and the NHS. As see in Table 7-6, an estimated $ 0.6766 billion is expected to be spent on basic pavement and bridge programs on the Non-NHS system between 2019 and 2028. That represents about 19 percent of the funds available after other programs are paid for as shown in the earlier tables. The remaining 81 percent, or $ 2.847 billion is allocated for National Highway System bridges, pavements, and safety and capacity projects.
date: 08-13-19 Total Funding after Department Operations $607.4 $558.6 $530.0 $465.4 $451.0 $451.4 $449.7 $446.0 $442.9 $442.9 4,845.2$
Funding Available for Program FY2019 FY2020 FY2021 FY2022 FY2023 FY2024 FY2025 FY2026 FY2027 FY2028 10 Year TotalHighway Funding Plan (Adjusted with Match) 463.9 445.2 438.9 437.8 437.9 436.2 434.6 431.2 428.4 428.4 4,382.7 Programmed Local Participating in excess of annual HFP estimate 3.4 1.1 4.3 16.0 1.4 3.8 3.8 3.8 3.8 3.8 45.0 Programmed Local Non-Participating -- -- -- -- -- -- -- -- -- -- - GARVEE 2017 Authorization 125.0 100.0 75.0 -- -- -- -- -- -- -- 300.0 PE & CE for State Funded Program (STF0) 15.0 12.3 11.8 11.6 11.6 11.5 11.3 11.0 10.7 10.7 117.5 Total Funding Available for Program $607.4 $558.6 $530.0 $465.4 $451.0 $451.4 $449.7 $446.0 $442.9 $442.9 $4,845.2
ITD Funding & Use Summary ($ in Millions, rounded)FY 2019 - 2028 Proposed ITD Ten Year Transportation Plan
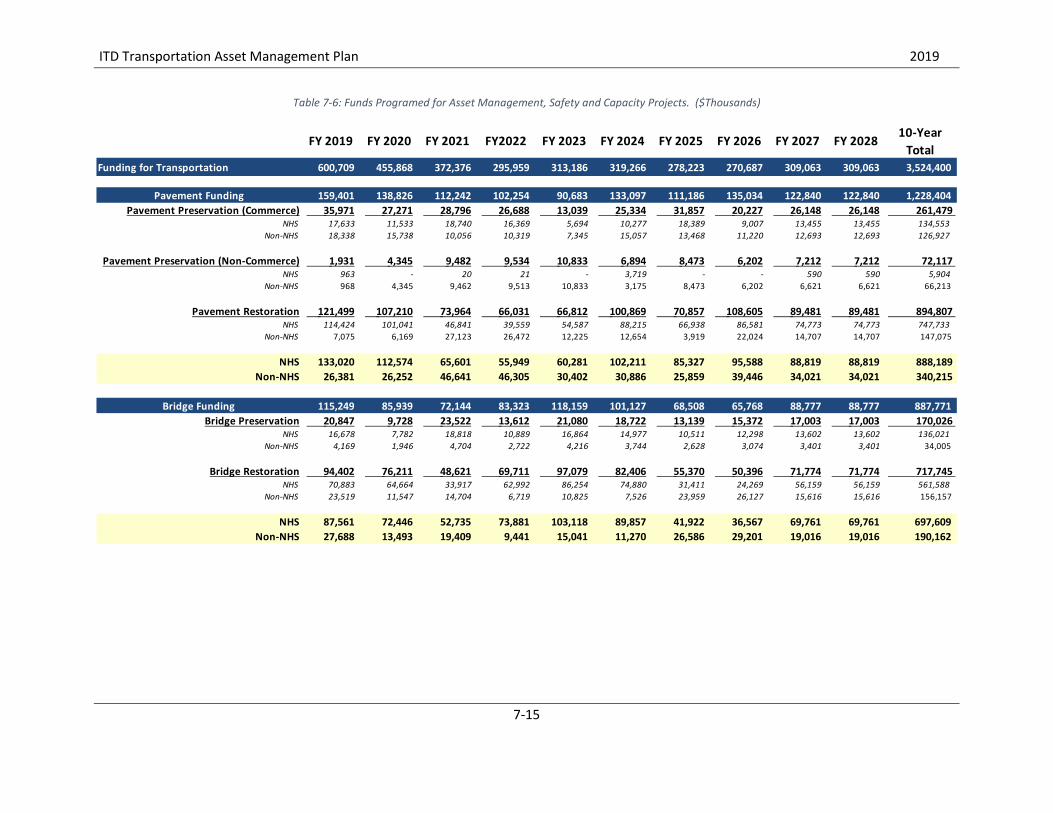
ITD Transportation Asset Management Plan 2019
7-15
Table 7-6: Funds Programed for Asset Management, Safety and Capacity Projects. ($Thousands)
FY 2019 FY 2020 FY 2021 FY2022 FY 2023 FY 2024 FY 2025 FY 2026 FY 2027 FY 2028 10-Year Total
Funding for Transportation 600,709 455,868 372,376 295,959 313,186 319,266 278,223 270,687 309,063 309,063 3,524,400
Pavement Funding 159,401 138,826 112,242 102,254 90,683 133,097 111,186 135,034 122,840 122,840 1,228,404 Pavement Preservation (Commerce) 35,971 27,271 28,796 26,688 13,039 25,334 31,857 20,227 26,148 26,148 261,479
NHS 17,633 11,533 18,740 16,369 5,694 10,277 18,389 9,007 13,455 13,455 134,553 Non-NHS 18,338 15,738 10,056 10,319 7,345 15,057 13,468 11,220 12,693 12,693 126,927
Pavement Preservation (Non-Commerce) 1,931 4,345 9,482 9,534 10,833 6,894 8,473 6,202 7,212 7,212 72,117 NHS 963 - 20 21 - 3,719 - - 590 590 5,904
Non-NHS 968 4,345 9,462 9,513 10,833 3,175 8,473 6,202 6,621 6,621 66,213
Pavement Restoration 121,499 107,210 73,964 66,031 66,812 100,869 70,857 108,605 89,481 89,481 894,807 NHS 114,424 101,041 46,841 39,559 54,587 88,215 66,938 86,581 74,773 74,773 747,733
Non-NHS 7,075 6,169 27,123 26,472 12,225 12,654 3,919 22,024 14,707 14,707 147,075
NHS 133,020 112,574 65,601 55,949 60,281 102,211 85,327 95,588 88,819 88,819 888,189 Non-NHS 26,381 26,252 46,641 46,305 30,402 30,886 25,859 39,446 34,021 34,021 340,215
Bridge Funding 115,249 85,939 72,144 83,323 118,159 101,127 68,508 65,768 88,777 88,777 887,771 Bridge Preservation 20,847 9,728 23,522 13,612 21,080 18,722 13,139 15,372 17,003 17,003 170,026
NHS 16,678 7,782 18,818 10,889 16,864 14,977 10,511 12,298 13,602 13,602 136,021 Non-NHS 4,169 1,946 4,704 2,722 4,216 3,744 2,628 3,074 3,401 3,401 34,005
Bridge Restoration 94,402 76,211 48,621 69,711 97,079 82,406 55,370 50,396 71,774 71,774 717,745 NHS 70,883 64,664 33,917 62,992 86,254 74,880 31,411 24,269 56,159 56,159 561,588
Non-NHS 23,519 11,547 14,704 6,719 10,825 7,526 23,959 26,127 15,616 15,616 156,157
NHS 87,561 72,446 52,735 73,881 103,118 89,857 41,922 36,567 69,761 69,761 697,609 Non-NHS 27,688 13,493 19,409 9,441 15,041 11,270 26,586 29,201 19,016 19,016 190,162
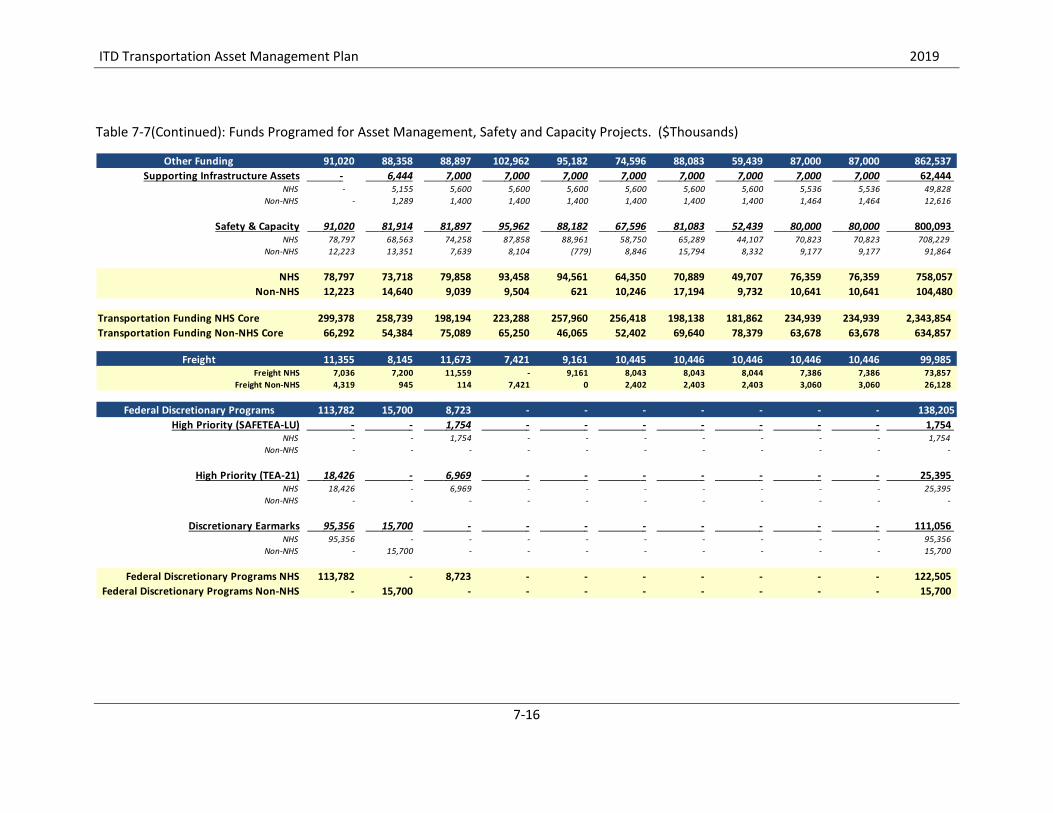
ITD Transportation Asset Management Plan 2019
7-16
Table 7-7(Continued): Funds Programed for Asset Management, Safety and Capacity Projects. ($Thousands)
Other Funding 91,020 88,358 88,897 102,962 95,182 74,596 88,083 59,439 87,000 87,000 862,537 Supporting Infrastructure Assets - 6,444 7,000 7,000 7,000 7,000 7,000 7,000 7,000 7,000 62,444
NHS - 5,155 5,600 5,600 5,600 5,600 5,600 5,600 5,536 5,536 49,828 Non-NHS - 1,289 1,400 1,400 1,400 1,400 1,400 1,400 1,464 1,464 12,616
Safety & Capacity 91,020 81,914 81,897 95,962 88,182 67,596 81,083 52,439 80,000 80,000 800,093 NHS 78,797 68,563 74,258 87,858 88,961 58,750 65,289 44,107 70,823 70,823 708,229
Non-NHS 12,223 13,351 7,639 8,104 (779) 8,846 15,794 8,332 9,177 9,177 91,864
NHS 78,797 73,718 79,858 93,458 94,561 64,350 70,889 49,707 76,359 76,359 758,057 Non-NHS 12,223 14,640 9,039 9,504 621 10,246 17,194 9,732 10,641 10,641 104,480
Transportation Funding NHS Core 299,378 258,739 198,194 223,288 257,960 256,418 198,138 181,862 234,939 234,939 2,343,854 Transportation Funding Non-NHS Core 66,292 54,384 75,089 65,250 46,065 52,402 69,640 78,379 63,678 63,678 634,857
Freight 11,355 8,145 11,673 7,421 9,161 10,445 10,446 10,446 10,446 10,446 99,985 Freight NHS 7,036 7,200 11,559 - 9,161 8,043 8,043 8,044 7,386 7,386 73,857
Freight Non-NHS 4,319 945 114 7,421 0 2,402 2,403 2,403 3,060 3,060 26,128
Federal Discretionary Programs 113,782 15,700 8,723 - - - - - - - 138,205 High Priority (SAFETEA-LU) - - 1,754 - - - - - - - 1,754
NHS - - 1,754 - - - - - - - 1,754 Non-NHS - - - - - - - - - - -
High Priority (TEA-21) 18,426 - 6,969 - - - - - - - 25,395 NHS 18,426 - 6,969 - - - - - - - 25,395
Non-NHS - - - - - - - - - - -
Discretionary Earmarks 95,356 15,700 - - - - - - - - 111,056 NHS 95,356 - - - - - - - - - 95,356
Non-NHS - 15,700 - - - - - - - - 15,700
Federal Discretionary Programs NHS 113,782 - 8,723 - - - - - - - 122,505 Federal Discretionary Programs Non-NHS - 15,700 - - - - - - - - 15,700

ITD Transportation Asset Management Plan 2019
7-17
Table 7-8(Continued): Funds Programed for Asset Management, Safety and Capacity Projects. ($Thousands)
Based on the information in Table 7-6 ITD distributes 34 percent of the transportation budget toward pavements, 25 percent on bridges, and the balance on other asset management programs. Of the 1.228 billion allocated for pavement, 72 percent is dedicated to NHS pavements. Within NHS pavements with 16 percent of the funding being for preservation and 84 percent is directed toward restoration. Bridge funding is allocated between NHS bridge preservation (19 percent) and NHS bridge restoration (81 percent). This is consistent with the bridge investment strategy discussed in Chapter 8.
The ITD STIP shows very broad classification categories for treatment types (i.e. Pavement Preservation and Pavement Restoration). Within these broad classification numerous work types are available to be programed. Within the ITD accounting system, individual projects are tagged as to what work type they represent. Table 7-9 presents the ITD programed projects by work type over the next 10-years.
GARVEE 2017 Legislative Authorization 109,902 118,900 78,697 - - - - - - - 307,499 NHS 109,902 118,900 78,697 - - - - - - - 307,499
Non-NHS - - - - - - - - - - -
NHS Total 530,098 384,839 297,173 223,288 267,121 264,461 206,181 189,906 242,325 242,325 2,847,715 Non -NHS Total 70,611 71,029 75,203 72,671 46,065 54,804 72,042 80,782 66,739 66,739 676,685
Total Funding for Transportation 600,709 455,868 372,376 295,959 313,186 319,266 278,223 270,687 309,063 309,063 3,524,400 Dollars in YOE ThousandsFY 2019 from Approved STIP at 8/8/2019FY 2020-2026 from Draft STIP at Public InvolvementFY 2027-2028 derived from the average of FY 2019 - 2026Estimates for short or under-programmed programsBridge Preservation and Supporting Infrastructure Assets derived from history

ITD Transportation Asset Management Plan 2019
7-18
Table 7-9: Funding Allocation by Work Type
Asset Work Type FY19 FY20 FY21 FY22 FY23 FY24 FY25 FY26 FY27 FY28 Pavement Initial Construction 295,816 155,642 149,060 75,839 85,511 45,538 35,517 25,222 89,033 89,033
Reconstruction 32,111 67,300 40,546 37,775 20,961 18,869 13,739 28,904 26,685 26,685 Rehabilitation 77,415 57,999 33,351 4,898 33,568 52,676 56,537 62,878 38,901 38,901 Preservation 14,773 7,580 9,547 12,774 1,027 13,996 3,791 3,716 6,892 6,892 Sub Total 420,115 288,521 232,504 131,286 141,067 131,079 109,584 120,720 161,512 161,512
Bridge Initial Construction 26,342 30,101 6,069 21,781 28,353 36,182 32,563 12,838 19,919 19,919
Replacement 40,188 38,900 23,358 41,212 65,030 57,886 19,487 24,269 31,826 31,826 Rehabilitation 11,164 12,514 10,202 0 0 8,043 8,043 8,044 5,949 5,949 Preservation 16,678 7,782 18,818 10,889 16,864 14,977 10,511 12,298 11,160 11,160 Sub Total 94,372 89,297 58,447 73,882 110,247 117,088 70,604 57,449 68,854 68,854
Other All 15,610 7,020 6,222 18,121 15,807 16,293 25,994 11,738 11,979 11,979 Total 530,097 762,656 588,124 428,457 518,435 512,627 386,370 368,076 242,345 242,325
Dollars in YOE Thousands FY 2019 from Approved STIP at 8/8/2019 FY 2020-2026 from Draft STIP at Public Involvement FY 2027-2028 derived from the average of FY 2019 - 2026 Bridge Preservation and Supporting Infrastructure Assets derived from history Initial Pavement Construction includes major widening (reconstruction confounded), turnbays, and new routes (confounds bridge initial construc-tion)

ITD Transportation Asset Management Plan 2019
7-19
Table 7-8 provides a high-level summary of all the preceding tables. Out of $7.215 billion, 32 percent goes to operations, $23 percent to non-asset management programs such as highway safety or local programs, 22 percent goes to maintaining the lower-volume routes off of the National Highway System, 4 percent is estimated to go for new capacity or safety programs, and 19 percent is expected to be available to main-tain the bridges, pavements and related assets on the National Highway System.
Table 7-10: Summary of Revenue and Expenditures
Total Revenue and Allocations (Billions) Percent of Total
Total Revenue $7.3262
Operations, Personnel, Equipment -2.481 34%
Safety, Local, and Other Non-Asset Management Purposes -$1.321 18%
Asset Management Purposes -3.524 48%
Asset Valuation Asset valuation is the assignment of monetary value to physical assets based upon their condition, cost to construct, age, obsolescence and other factors. The rationale for reporting asset valuation is to ensure that investments are adequate to ensure that the public’s investment in its highway network is main-tained. Highway networks generally represent a state’s largest capital investment. Investing adequately in them can ensure that future generations inherit a well-maintained system, and not a major liability that is in a state of disrepair and requires substantial investment to maintain.
ITD estimated the value of its assets for this asset management plan using the concept of Depreciated Replacement Cost. This is an accounting concept adopted in Australia and Great Britain. It seeks to esti-mate the value of highway assets “as is.” That is, what would it cost to replace them “in kind” to their current conditions?
This depreciation method differs from the historic cost method often used to estimate asset values. His-toric cost usually applies a fixed amount of deterioration to an asset based entirely on its age. For exam-ple, if a bridge is built for $1 million and is expected to provide a useful life of 50 years, its value is depre-ciated by two percent annually. At the end of 50 years, the bridge will have a “book value” of $0. Even if the bridge has been rehabilitated and is in good condition, it still will be carried on the books at a value of $0. By this logic, the Golden Gate Bridge and Brooklyn Bridge have no monetary value simply because of their age.
The historic cost method provides little value for asset management. If an asset is valued at $0 there is
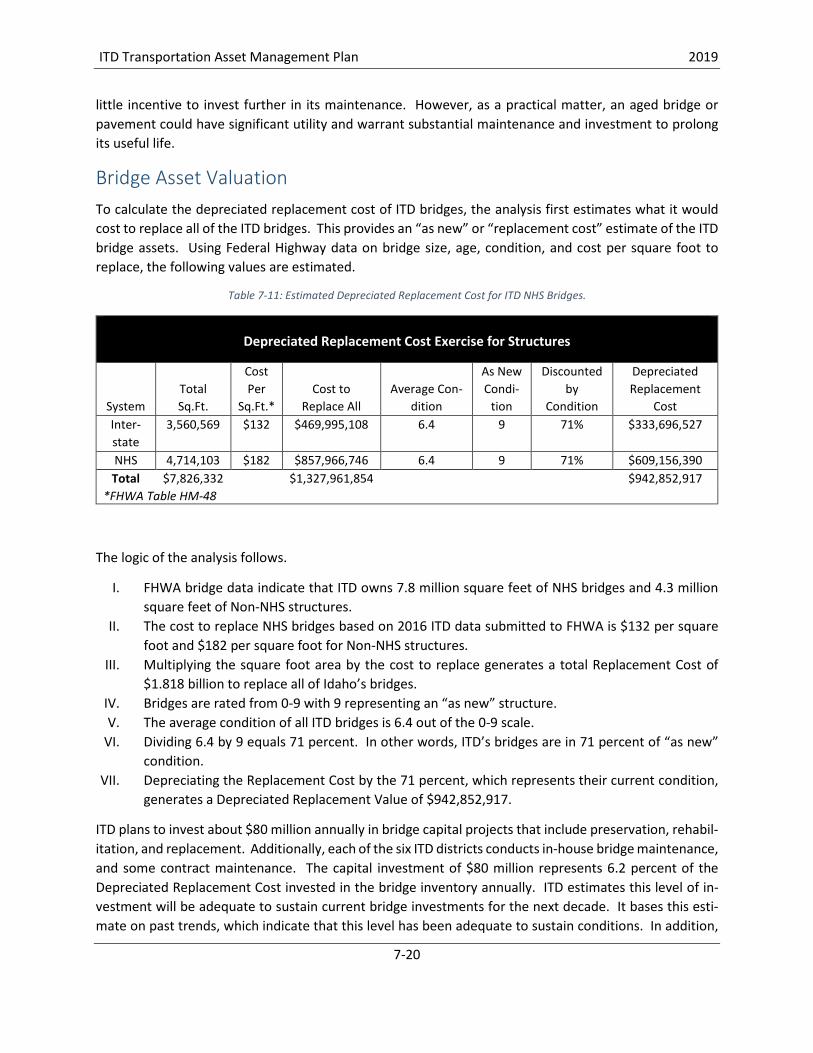
ITD Transportation Asset Management Plan 2019
7-20
little incentive to invest further in its maintenance. However, as a practical matter, an aged bridge or pavement could have significant utility and warrant substantial maintenance and investment to prolong its useful life.
Bridge Asset Valuation To calculate the depreciated replacement cost of ITD bridges, the analysis first estimates what it would cost to replace all of the ITD bridges. This provides an “as new” or “replacement cost” estimate of the ITD bridge assets. Using Federal Highway data on bridge size, age, condition, and cost per square foot to replace, the following values are estimated.
Table 7-11: Estimated Depreciated Replacement Cost for ITD NHS Bridges.
Depreciated Replacement Cost Exercise for Structures
System Total Sq.Ft.
Cost Per
Sq.Ft.* Cost to
Replace All Average Con-
dition
As New Condi-
tion
Discounted by
Condition
Depreciated Replacement
Cost Inter-state
3,560,569 $132 $469,995,108 6.4 9 71% $333,696,527
NHS 4,714,103 $182 $857,966,746 6.4 9 71% $609,156,390 Total $7,826,332 $1,327,961,854 $942,852,917
*FHWA Table HM-48
The logic of the analysis follows.
I. FHWA bridge data indicate that ITD owns 7.8 million square feet of NHS bridges and 4.3 million square feet of Non-NHS structures.
II. The cost to replace NHS bridges based on 2016 ITD data submitted to FHWA is $132 per square foot and $182 per square foot for Non-NHS structures.
III. Multiplying the square foot area by the cost to replace generates a total Replacement Cost of $1.818 billion to replace all of Idaho’s bridges.
IV. Bridges are rated from 0-9 with 9 representing an “as new” structure. V. The average condition of all ITD bridges is 6.4 out of the 0-9 scale.
VI. Dividing 6.4 by 9 equals 71 percent. In other words, ITD’s bridges are in 71 percent of “as new” condition.
VII. Depreciating the Replacement Cost by the 71 percent, which represents their current condition, generates a Depreciated Replacement Value of $942,852,917.
ITD plans to invest about $80 million annually in bridge capital projects that include preservation, rehabil-itation, and replacement. Additionally, each of the six ITD districts conducts in-house bridge maintenance, and some contract maintenance. The capital investment of $80 million represents 6.2 percent of the Depreciated Replacement Cost invested in the bridge inventory annually. ITD estimates this level of in-vestment will be adequate to sustain current bridge investments for the next decade. It bases this esti-mate on past trends, which indicate that this level has been adequate to sustain conditions. In addition,

ITD Transportation Asset Management Plan 2019
7-21
when projected over 10 years, $800 million will be invested in bridges, which represents 61 percent of the Depreciated Replacement Cost. Considering the relatively long-life of structures and slow annual deteri-oration, this investment appears adequate to sustain asset values for the next decade. However, beyond 10 years, more of the department’s large structure will surpass their fortieth year. A “wave” or “bubble” of higher bridge investment needs will occur over the next 20 years. These structures are likely to have a higher per square foot cost than the typical Idaho structure. ITD will begin planning for a long-term strat-egy to ensure that bridge conditions and asset values can be preserved in the decade following this asset management plan.
Additionally, the per square foot cost show in Table 7-11 does not include some “soft” costs of design, maintenance of traffic, or right of way. Some states estimate that an additional 25 percent is needed in addition to the base square foot costs. Therefore, estimate investment levels should consider these “soft cost” needs.
NHS Pavement Asset Valuation A similar logic was used to calculate a depreciated asset valuation for NHS pavements. This calculation is very conservative and does not include costs for right-of-way, lighting, safety elements or other costs such as design or inspection. It uses only a cost-per-lane mile estimate for pavement and multiplies it by lane miles.
Table 7-12: Depreciated Replacement Costs for ITD NHS Pavements
Depreciated Replacement Cost Exercise for NHS Pavements
System Lane Miles Cost to Replace
Per Lane Mile Pavement Replacement Cost
Percent Not Poor
Depreciated Replacement Cost
Interstate 2530 $1,200,000 $3,036000,000 99.50% $3,020,820,000
NHS 5,009 $625,000 $3,130,625,000 99.64% $3,119,354,750
Total 7,608 $6,166,625,000 $6,140,174,750
FHWA data indicate that Idaho has 2,530 lanes miles of Interstates and 5,009 lane miles of non-Interstate NHS for 7,608 lane miles. ITD has generated a planning level estimate combining unit costs for urban and rural Interstate highways of $1,200,000 per lane mile for pavement replacement. For NHS routes used a planning level cost of $625,000. As can be seen when the unit costs for pavement replacement are mul-tiplied by the lane miles it generates a replacement cost of $6,166,625,000 for the replacement cost of NHS pavements. Current conditions indicate that about 99.5 percent of Interstate pavements meet FHWA target and 99.64 percent of NHS pavements meet FHWA target. Using those values to discount condi-tions, an estimated depreciated replacement cost of $6,140,174,750 is calculated.
ITD estimates that its current investments will be adequate to sustain these asset values. This assumption is based upon the pavement modeling that indicates current investments will result in the department
ITD Transportation Asset Management Plan 2019
7-2
continuing to meet its pavement condition goals.

ITD Transportation Asset Management Plan 2019
8-1
- Investment Strategies ITD deploys a systematic process to develop and annually update its investment strategies.
ITD publishes the Idaho Trans-portation Investment Program (ITIP), which is like a STIP. Until recently it included a five-year estimate of revenues by revenue source and a detailed list of an-nual expenditures by program category. It also included a de-tailed projects list and a narrative explaining changes in program priorities based upon factors such as changing highway crash rates or changing asset condi-tions. In April of 2017, the ITD board extended the ITIP to a seven-year program.
The ITIP in many ways resembles the asset management financial plan that FHWA requires except that it addresses seven years and not 10. The common elements for both include:
• A multi-year estimate of revenues by revenue source;
• A year-by-year allocation of funds by program;
• A description of the board’s rationale for changing allocations caused by changing asset conditions or crash rates;
• Although risks and gaps are not described in those terms, the ITD narrative explains how ITD and its board allocate funds to meet the transportation needs of the state. The narrative describes the funding sources, the restrictions on each source, and how allocations of the available re-sources are made to optimize the state’s transportation performance. Table 8-1 includes the month-by-month processes that lead to approval of the ITIP and the agency’s STIP.
Investment Strategy Requirements
FHWA requires the asset management plan to include investment strategies, which it defines as a set of strategies that result from evaluating various levels of funding to achieve State DOT targets for asset condition and system performance effectiveness at a minimum practicable cost while managing risks.
Regulations also say that states must have an investment strategy process that describes how investment strategies are influenced by:
(1) Performance gap analysis
(2) Life-cycle planning for asset classes or asset sub-groups
(3) Risk management analysis; and
(4) Anticipated available funding and estimated cost of ex-pected future work types associated with various candidate strategies based on the financial plan.
An asset management plan shall discuss how the plan’s investment strategies collectively would make or support progress toward:
(1) Achieving and sustaining a desired state of good repair over the life cycle of the assets
(2) Improving or preserving the condition of the assets and the performance of the NHS relating to physical assets
(3) Achieving the State DOT targets for asset condition and per-formance of the NHS, and
(4) Achieving the national goals for safety, relief of congestion, movement of freight and preservation or asset conditions.

ITD Transportation Asset Management Plan 2019
8-2
Table 8-1: The ITIP Development Cycle
ITIP Development Calendar
January
ITD publishes estimates of available funding, program descriptions, program targets, and a call for projects to MPOs, the LHTAC, and ITD’s six districts. Districts are pro-vided in advance with ITD’s pavement-condition data and pavement management system analysis of their district conditions and recommended treatments and invest-ment levels. District Offices also continually collaborate with the headquarters bridge staff to assess bridge conditions and identify needed bridge treatments.
March/May The Idaho Transportation Board reviews condition targets, progress from the past year, reviews the agency’s performance dashboard and receives project requests. It then develops a draft ITIP.
June The transportation board reviews the draft ITIP and approves releasing it for public review and comment.
July The draft ITIP is provided for public review and comment.
August ITD staff develops a draft final ITIP incorporating the public comments.
September ITD submits its recommended ITIP to the board.
November The board approves submitting the State Transportation Improvement Program (STIP) to FHWA for approval, and the STIP incorporates the first four years of the ITIP.
December FHWA and the Federal Transit Administration approve the STIP.
Ongoing The ITD obtains input from citizens, elected officials, tribal governments, state and Federal agencies, MPOs, the LHTAC, and other interested parties.
ITD’s investment strategy process satisfies the Federal requirements, although the ITIP process predates the Federal requirements by many years. This section will examine each Federal requirement and how it is addressed.
Performance Gap Analysis
ITD staff and the Idaho Transportation Board review gaps in performance annually as part of the process for developing the ITIP, which includes the investment strategies. ITD regularly updates it performance dashboard and the transportation board reviews the results. The performance reports include reviews of trends such as bridge and pavement conditions and crash rates.

ITD Transportation Asset Management Plan 2019
8-3
The review also includes consideration of sub-network changes such as changes in conditions on the Com-merce Routes versus the Non-Commerce Routes, and changes in the six districts. The adoption of the Commerce and Non-Commerce division in 2015 was driven by ITD’s need to prioritize its scarce resources on the most highly travelled routes and make an investment tradeoff to avoid a gap in Commerce Route conditions. The Commerce Routes are those that have more than 300-trucks per day and move the most people and freight. Through prioritization, ITD made a risk-based decision to prevent a gap in system conditions from developing on the major routes. At the time the Commerce/Non-Commerce prioritiza-tion was made, the change was not driven by a response to the MAP-21 requirements to sustain condi-tions on the NHS. However, because the Commerce Routes include the NHS, the effect was to prioritize the NHS for investment.
One investment strategy is to priori-tize the Commerce Routes and main-tain them with more robust treat-ments while applying only thin treat-ments and conducting maintenance activities on the lower-volume Non-Commerce routes. For the commerce routes, 85 percent overall are in good or fair condition, which is above the target of 80 percent. For non-com-merce routes, 84.2 percent are good or fair, which is just below target. ITD further stratifies its pavement invest-ments by how it measures pavement performance. Pavements are ranked by three criteria, cracking, International Roughness Index (IRI), and rutting. The three distresses are measured and all pavements scored on a composite scale (0 to 5). ITD requires a higher condition on Interstates and arterials to be rated as “good”. Lower conditions on col-lectors can still be considered “good.”
As reported in the Chapter 2, ITD’s National Highway System and Interstate Highway System conditions are much better than the Federal minimums. Table 4-2, on page 4-2, summarizes the conditions com-pared to the federally allowable minimum levels. While the Federal maximum amount of poor Interstate pavement allowed is five percent, ITD has only 1.21 percent poor, and only 2.15 percent of the NHS is poor. Only 2.58 percent of NHS bridge deck area is poor compared to the allowable maximum of 10 percent.
The result of ITD’s investment strategy to prioritize treatments on the Commerce Routes has been to ensure that higher volumes routes such as those on the Interstates and NHS are maintained in a state of good repair and in much better condition than Federal minimums. This strategy has prevented any gap in Interstate conditions from occurring and will be instrumental in closing the small gap, which exist on the NHS.
Figure 8-1: Screenshot of the Bridge and Pavement Condition Measures on the ITD Performance Dashboard
ITD Transportation Asset Management Plan 2019
8-4
Life-Cycle Planning Influence
ITD’s allocation of funds to bridge and pavements are also influenced by life-cycle planning analysis. Chap-ter 5 described in detail ITD’s pavement management model. The model is run annually with updated pavement condition data. Model runs produce recommended statewide and district-by-district pavement programs based upon a mix of treatments to extend the life of pavements. The amounts needed to sus-tain pavements are the basis for the ITD staff’s recommended pavement program funding levels that are presented to the Transportation Board.
Once funds are allocated to the districts, the districts develop their pavement programs. They base their program upon both the pavement model recommendations as well as their field observations and the need to coordinate the timing of projects with other projects on their local networks. The pavement management staff re-run the pavement model based upon the districts’ projects to ensure that the pro-gram selected by the districts will meet the department’s pavement targets.
Bridges are selected based upon the engineering analysis of the headquarters and the districts who jointly develop a projects list. The bridge program includes a balanced mix of bridge replacement, rehabilitation, preservation, and maintenance based upon lifecycle principles. ITD extends the life of its structures as far as economically feasible through this mix of treatments.
Life-cycle considerations are also seen in the program allocations. Specific line items are included in the ITIP to fund both pavement and bridge pavement preservation as well as bridge and pavement restora-tion. These funding splits provide the districts revenues specifically dedicated to preservation, which they can use to extend the life of pavements and bridges. Additionally, district maintenance crews perform regular bridge and pavement maintenance, which also extends the life of the assets.
Risk Analysis
ITD strategies are also driven by the need to reduce threats to asset conditions and the performance of the highway system. The highest ranked risks in the risk register are reflected in the investments and strategies undertaken by the department. For example, one of the highest ranked risks is that if program-ming decisions are dictated by the Idaho Legislature and do not reflect asset management priorities than the department may not be able to sustain adequate asset investment levels. To respond to this risk, ITD identified the need to urge legislators to continuing giving high priority to ITD’s recommended investment levels for bridges and pavements.
Another highly ranked risk-mitigation strategy is to continue investing in bridge maintenance crews to ensure adequate maintenance of structures. An opportunity is the potential benefits if the department further improves its pavement management system, which it intends to do.
Several of the risks to asset conditions that were identified were ranked as low because the department is committed to asset management. For example, the risk of ITD de-emphasizing asset management was rated as low because of the widespread commitment to asset management in the department.
One long-term risk that was identified and which will be addressed is the need to develop a long-term plan for managing the department’s largest structures. Although these structures generally are in good condition now, they are aging and will require significant investment over the next two decades. To re-spond to the risk of declining conditions among the largest structures, ITD will develop a multi-decade

ITD Transportation Asset Management Plan 2019
8-5
plan for rehabilitating or replacing its largest structures.
The previously mentioned Commerce/Non-Commerce route bifurcation also is a risk-response strategy. It was adopted specifically to reduce the risk of declining asset conditions on the highest-volume routes. It also represents a higher risk tolerance for lower conditions on the lower volume Non-Commerce routes.
Funding Allocations Overall Tradeoff Analysis Strategy Over the years, there have been many forces guiding how ITD would allocate funding between bridge, pavement, and other initiatives. In recent years, this question has receive more analytical attention. ITD’s method of tradeoff analysis starts with modeling each of bridges and pavements at the system level. Us-ing the individual asset management systems multiple scenarios are run, each one representing a given funding level. The scenarios are set up to maximize system benefit at minimum cost. This analysis results in the creation of an optimal portfolio of projects for each funding scenario considered. ITD then captures the system condition, e.g. percent of pavement in adequate condition, associated with a modeled year and funding level. With these data points, ITD creates a two variable regression (linear model) equation that allows us to interpolate more precise funding levels.
The modeled consequences of various funding levels is illustrated below for pavements between 2021 and 2026. The y-axis is funding level for pavements in millions of dollars. The resulting contours represent the system condition state for a given year/funding level).
Figure 8-2: Performance Contours versus Funding Levels

ITD Transportation Asset Management Plan 2019
8-6
Reassessment of target performance levels occurs every few years. In 2019, ITD targets having 80% good pavements and 80% good bridges in the outer years. According to this example contour chart provided, we would need to maintain an annual funding level of about $180 million to arrive at 2026 with 80% good pavements. A similar chart is created for bridges. Putting the two together, a total desired funding level for pavement and bridges is obtained.
As is often the case, the desired funding level is larger than the funding level modeled to meet our target system condition states. In that case, projects are considered individually and removed from both the bridges and pavement programs until a balanced solution can be reached.
In January of 2019, ITD was selected as the first state to test the next generation performance measures developed by FHWA project “Development of Next Generation Pavement Performance Measures and As-set Management Methodologies to Support MAP-21 Performance Management Objectives”. This effort will assess the utility of several new performance metrics. These include the following:
Life-Cycle Measures:
• Remaining Service Interval (RSI) • Annualized Cost Per Lane-Mile (ACLM) • Cost Accrual Ratio (CAR)
Financial Measures:
• Asset Sustainability Index (ASI) • Asset Sustainability Ratio (ASR) • Asset Consumption Ratio (ACR) • Backlog Reduction Ratio (BRR)
These performance measures will provide an additional means for ITD to assess the effectiveness of budget allocations with respect to performance enhancement. As part of this work, a computer program will be developed which would allow ITD to:
• easily forecast outcomes compared to funding targets; • develop a spending plan with intermediate performance targets; • graphically compare all fiscal scenarios considered; • greatly enhance ITD’s ability to perform funding trade-off analysis.
The following investment strategies for both pavements and bridge are noted because they result from evaluating various levels of funding to achieve State DOT targets for asset condition and system perfor-mance effectiveness at a minimum practicable cost while managing risks.
Pavement Investments ITD retains as an investment strategy the prioritization of routes for pavement investment that are on the Commerce system and have average annual daily truck traffic in excess of 300-trucks per day. This risk-based strategy reflects the tradeoff ITD must make to balance its limited resources while also ensuring that conditions are maintained on the routes most important for freight movement, congestion relief,
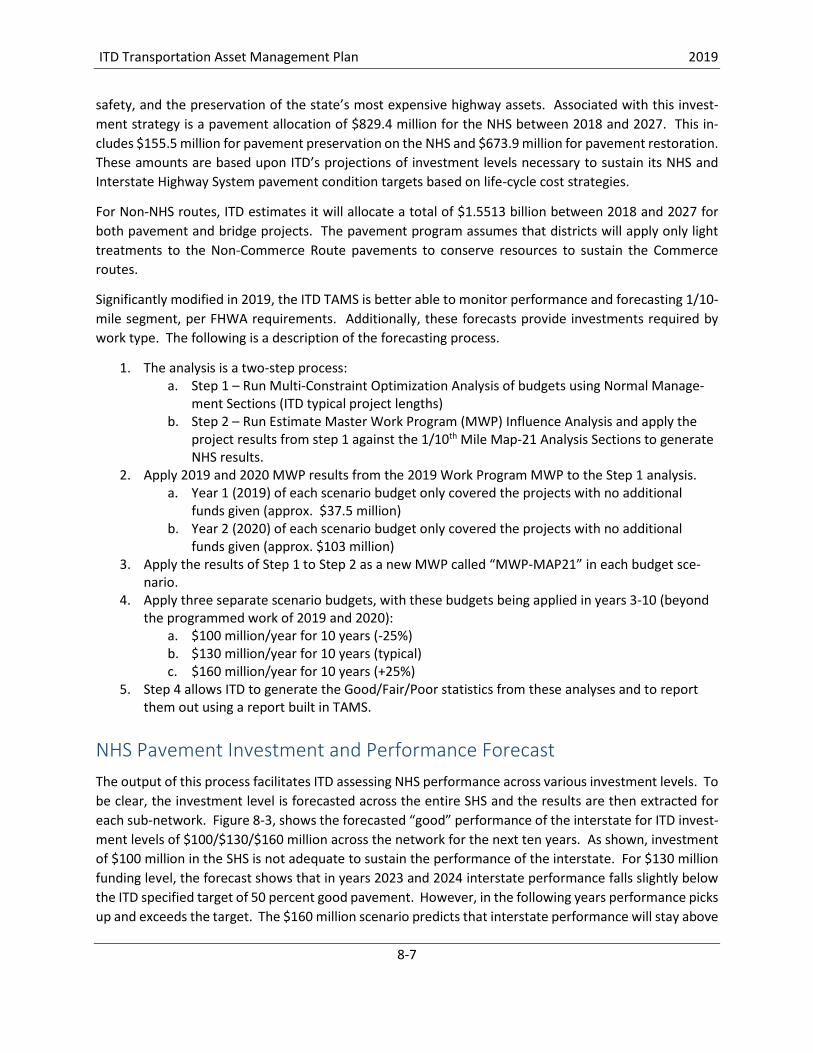
ITD Transportation Asset Management Plan 2019
8-7
safety, and the preservation of the state’s most expensive highway assets. Associated with this invest-ment strategy is a pavement allocation of $829.4 million for the NHS between 2018 and 2027. This in-cludes $155.5 million for pavement preservation on the NHS and $673.9 million for pavement restoration. These amounts are based upon ITD’s projections of investment levels necessary to sustain its NHS and Interstate Highway System pavement condition targets based on life-cycle cost strategies.
For Non-NHS routes, ITD estimates it will allocate a total of $1.5513 billion between 2018 and 2027 for both pavement and bridge projects. The pavement program assumes that districts will apply only light treatments to the Non-Commerce Route pavements to conserve resources to sustain the Commerce routes.
Significantly modified in 2019, the ITD TAMS is better able to monitor performance and forecasting 1/10-mile segment, per FHWA requirements. Additionally, these forecasts provide investments required by work type. The following is a description of the forecasting process.
1. The analysis is a two-step process: a. Step 1 – Run Multi-Constraint Optimization Analysis of budgets using Normal Manage-
ment Sections (ITD typical project lengths) b. Step 2 – Run Estimate Master Work Program (MWP) Influence Analysis and apply the
project results from step 1 against the 1/10th Mile Map-21 Analysis Sections to generate NHS results.
2. Apply 2019 and 2020 MWP results from the 2019 Work Program MWP to the Step 1 analysis. a. Year 1 (2019) of each scenario budget only covered the projects with no additional
funds given (approx. $37.5 million) b. Year 2 (2020) of each scenario budget only covered the projects with no additional
funds given (approx. $103 million) 3. Apply the results of Step 1 to Step 2 as a new MWP called “MWP-MAP21” in each budget sce-
nario. 4. Apply three separate scenario budgets, with these budgets being applied in years 3-10 (beyond
the programmed work of 2019 and 2020): a. $100 million/year for 10 years (-25%) b. $130 million/year for 10 years (typical) c. $160 million/year for 10 years (+25%)
5. Step 4 allows ITD to generate the Good/Fair/Poor statistics from these analyses and to report them out using a report built in TAMS.
NHS Pavement Investment and Performance Forecast The output of this process facilitates ITD assessing NHS performance across various investment levels. To be clear, the investment level is forecasted across the entire SHS and the results are then extracted for each sub-network. Figure 8-3, shows the forecasted “good” performance of the interstate for ITD invest-ment levels of $100/$130/$160 million across the network for the next ten years. As shown, investment of $100 million in the SHS is not adequate to sustain the performance of the interstate. For $130 million funding level, the forecast shows that in years 2023 and 2024 interstate performance falls slightly below the ITD specified target of 50 percent good pavement. However, in the following years performance picks up and exceeds the target. The $160 million scenario predicts that interstate performance will stay above
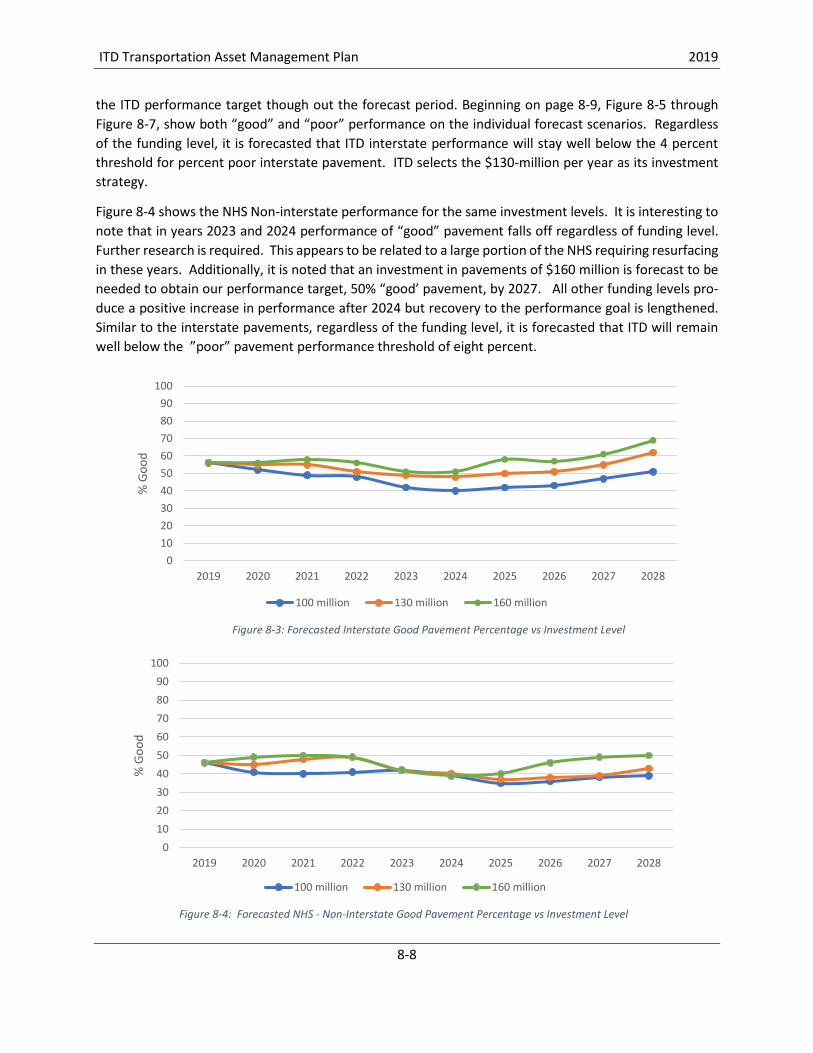
ITD Transportation Asset Management Plan 2019
8-8
the ITD performance target though out the forecast period. Beginning on page 8-9, Figure 8-5 through Figure 8-7, show both “good” and “poor” performance on the individual forecast scenarios. Regardless of the funding level, it is forecasted that ITD interstate performance will stay well below the 4 percent threshold for percent poor interstate pavement. ITD selects the $130-million per year as its investment strategy.
Figure 8-4 shows the NHS Non-interstate performance for the same investment levels. It is interesting to note that in years 2023 and 2024 performance of “good” pavement falls off regardless of funding level. Further research is required. This appears to be related to a large portion of the NHS requiring resurfacing in these years. Additionally, it is noted that an investment in pavements of $160 million is forecast to be needed to obtain our performance target, 50% “good’ pavement, by 2027. All other funding levels pro-duce a positive increase in performance after 2024 but recovery to the performance goal is lengthened. Similar to the interstate pavements, regardless of the funding level, it is forecasted that ITD will remain well below the ”poor” pavement performance threshold of eight percent.
0102030405060708090
100
2019 2020 2021 2022 2023 2024 2025 2026 2027 2028
% G
ood
100 million 130 million 160 million
Figure 8-4: Forecasted NHS - Non-Interstate Good Pavement Percentage vs Investment Level
0102030405060708090
100
2019 2020 2021 2022 2023 2024 2025 2026 2027 2028
% G
ood
100 million 130 million 160 million
Figure 8-3: Forecasted Interstate Good Pavement Percentage vs Investment Level

ITD Transportation Asset Management Plan 2019
8-9
Figure 8-5: Interstate Condition 10-year Forecast with $100-million Budget
Figure 8-6: Interstate Condition 10-year Forecast with $130-million Budget

ITD Transportation Asset Management Plan 2019
8-10
Figure 8-8: Non-Interstate NHS Condition 10-year Forecast with $100-million Budget
Figure 8-7: Interstate Condition 10-year Forecast with $160-million Budget

ITD Transportation Asset Management Plan 2019
8-11
Figure 8-10: Non-Interstate NHS Condition 10-year Forecast with $160-million Budget
Figure 8-9: Non-Interstate NHS Condition 10-year Forecast with $130-million Budget
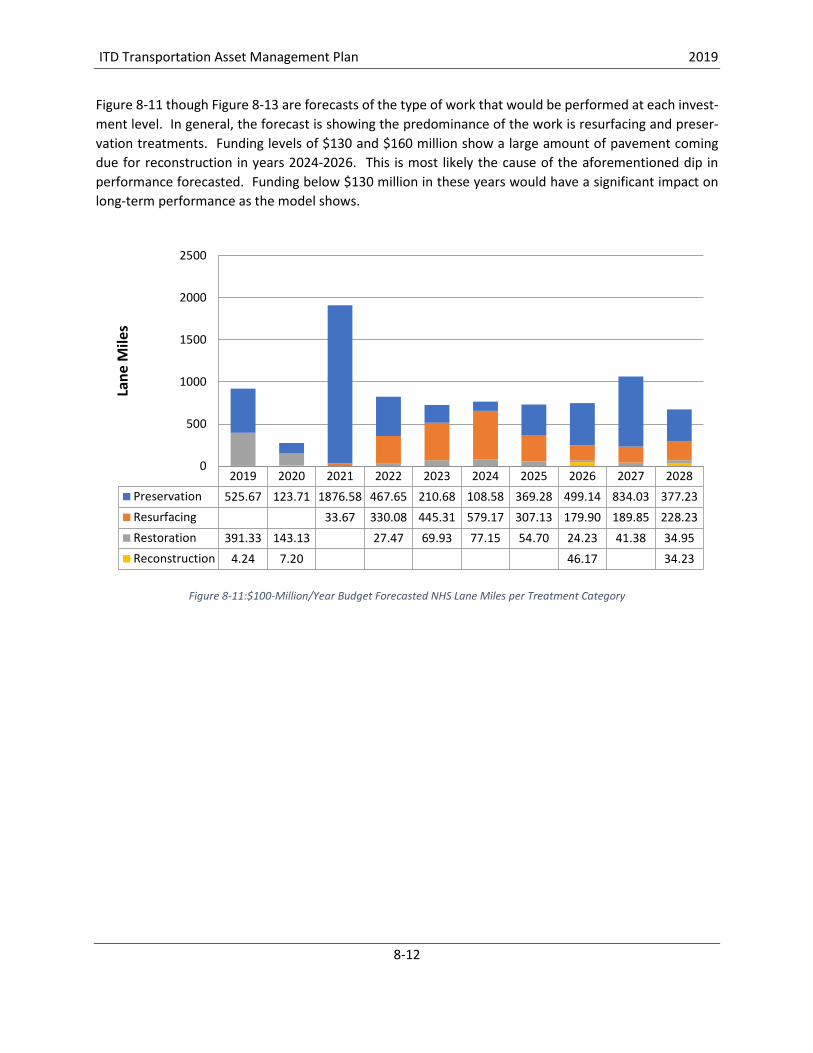
ITD Transportation Asset Management Plan 2019
8-12
Figure 8-11 though Figure 8-13 are forecasts of the type of work that would be performed at each invest-ment level. In general, the forecast is showing the predominance of the work is resurfacing and preser-vation treatments. Funding levels of $130 and $160 million show a large amount of pavement coming due for reconstruction in years 2024-2026. This is most likely the cause of the aforementioned dip in performance forecasted. Funding below $130 million in these years would have a significant impact on long-term performance as the model shows.
Figure 8-11:$100-Million/Year Budget Forecasted NHS Lane Miles per Treatment Category
2019 2020 2021 2022 2023 2024 2025 2026 2027 2028Preservation 525.67 123.71 1876.58 467.65 210.68 108.58 369.28 499.14 834.03 377.23Resurfacing 33.67 330.08 445.31 579.17 307.13 179.90 189.85 228.23Restoration 391.33 143.13 27.47 69.93 77.15 54.70 24.23 41.38 34.95Reconstruction 4.24 7.20 46.17 34.23
0
500
1000
1500
2000
2500
Lane
Mile
s
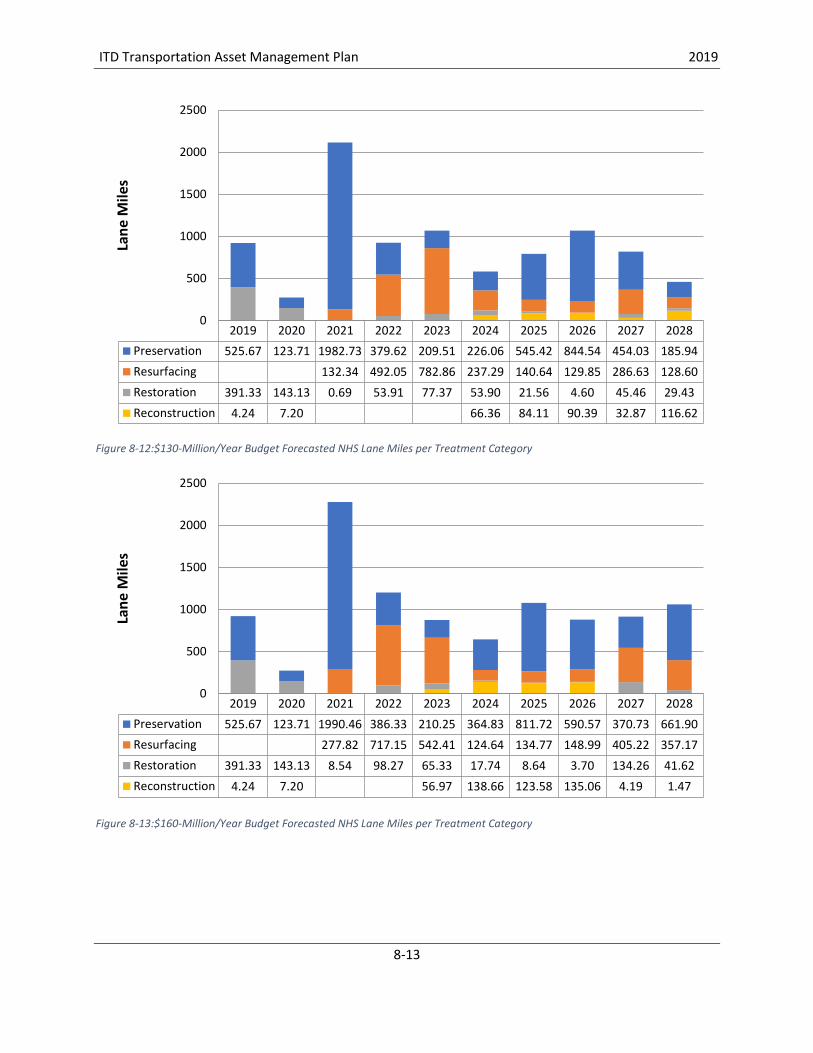
ITD Transportation Asset Management Plan 2019
8-13
Figure 8-12:$130-Million/Year Budget Forecasted NHS Lane Miles per Treatment Category
Figure 8-13:$160-Million/Year Budget Forecasted NHS Lane Miles per Treatment Category
2019 2020 2021 2022 2023 2024 2025 2026 2027 2028Preservation 525.67 123.71 1982.73 379.62 209.51 226.06 545.42 844.54 454.03 185.94Resurfacing 132.34 492.05 782.86 237.29 140.64 129.85 286.63 128.60Restoration 391.33 143.13 0.69 53.91 77.37 53.90 21.56 4.60 45.46 29.43Reconstruction 4.24 7.20 66.36 84.11 90.39 32.87 116.62
0
500
1000
1500
2000
2500La
ne M
iles
2019 2020 2021 2022 2023 2024 2025 2026 2027 2028Preservation 525.67 123.71 1990.46 386.33 210.25 364.83 811.72 590.57 370.73 661.90Resurfacing 277.82 717.15 542.41 124.64 134.77 148.99 405.22 357.17Restoration 391.33 143.13 8.54 98.27 65.33 17.74 8.64 3.70 134.26 41.62Reconstruction 4.24 7.20 56.97 138.66 123.58 135.06 4.19 1.47
0
500
1000
1500
2000
2500
Lane
Mile
s
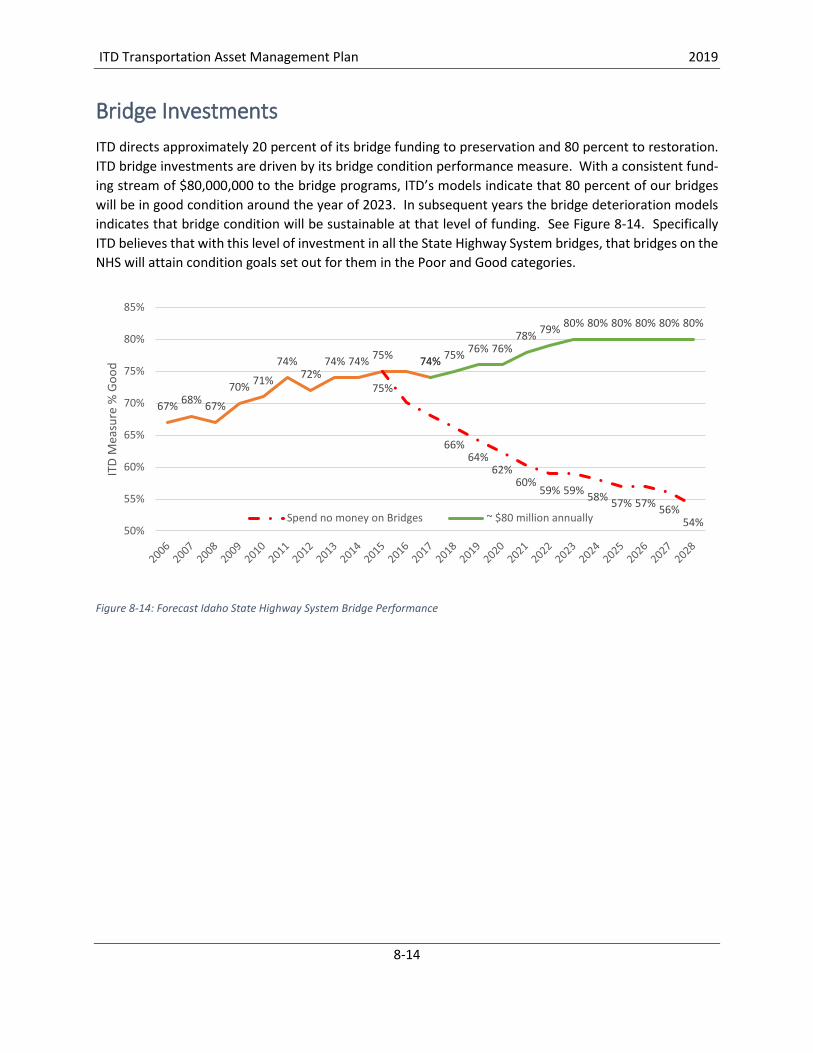
ITD Transportation Asset Management Plan 2019
8-14
Bridge Investments ITD directs approximately 20 percent of its bridge funding to preservation and 80 percent to restoration. ITD bridge investments are driven by its bridge condition performance measure. With a consistent fund-ing stream of $80,000,000 to the bridge programs, ITD’s models indicate that 80 percent of our bridges will be in good condition around the year of 2023. In subsequent years the bridge deterioration models indicates that bridge condition will be sustainable at that level of funding. See Figure 8-14. Specifically ITD believes that with this level of investment in all the State Highway System bridges, that bridges on the NHS will attain condition goals set out for them in the Poor and Good categories.
Figure 8-14: Forecast Idaho State Highway System Bridge Performance
67% 68% 67%
70% 71%
74%72%
74% 74% 75% 74%
75%
66%64%
62%60%
59% 59% 58% 57% 57% 56%54%
74% 75% 76% 76%78% 79% 80% 80% 80% 80% 80% 80%
50%
55%
60%
65%
70%
75%
80%
85%
ITD
Mea
sure
% G
ood
Spend no money on Bridges ~ $80 million annually
ITD Transportation Asset Management Plan 2019
Appendix A - Summary of Pavement As-sets
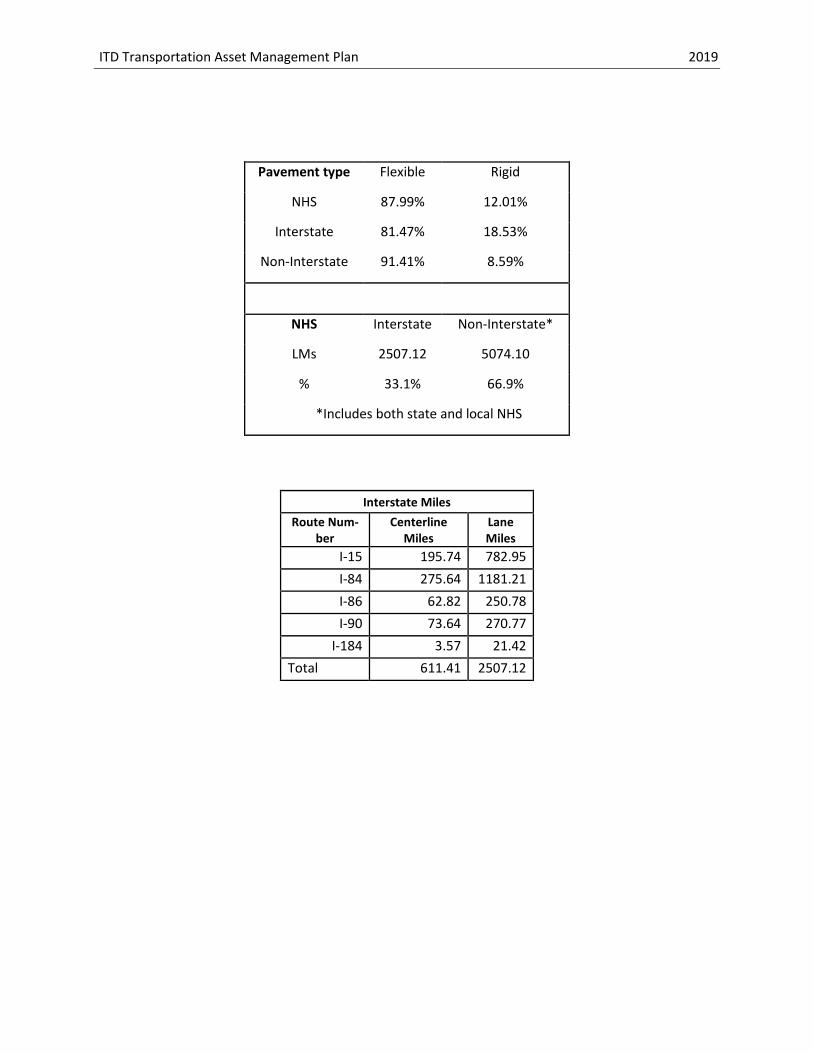
ITD Transportation Asset Management Plan 2019
Pavement type Flexible Rigid
NHS 87.99% 12.01%
Interstate 81.47% 18.53%
Non-Interstate 91.41% 8.59%
NHS Interstate Non-Interstate*
LMs 2507.12 5074.10
% 33.1% 66.9%
*Includes both state and local NHS
Interstate Miles Route Num-
ber Centerline
Miles Lane Miles
I-15 195.74 782.95
I-84 275.64 1181.21
I-86 62.82 250.78
I-90 73.64 270.77
I-184 3.57 21.42
Total 611.41 2507.12

ITD Transportation Asset Management Plan 2019
State Jurisdictional NHS Non-Interstate Miles Route Num-
ber Centerline Miles Lane Miles
I-15 B 20.10 54.60 I-84 B 10.35 38.94 *I-90 S 1.26 5.04 SH-128 2.22 4.44 SH-128 S 0.13 0.26 SH-19 12.01 37.15 SH-21 3.55 8.41 SH-33 5.07 15.87 SH-39 3.85 9.05 SH-41 7.97 17.84 SH-44 23.06 60.38 SH-45 18.28 44.35 **SH-51 3.55 10.40 SH-53 14.04 29.75 SH-55 127.43 287.65 SH-60 0.01 0.02 *SH-61 0.76 1.53 SH-67 8.95 35.80 SH-69 8.02 32.30 SH-8 1.79 6.79 *US-12 168.07 352.76 US-2 45.10 96.94 US-2 S 0.29 0.57 **US-20 307.31 770.37 US-20 B 3.42 13.68 US-20 S 0.40 1.19 US-26 101.70 241.47 US-30 89.47 267.49 *US-89 43.42 92.99 US-91 11.40 36.87 **US-93 332.09 693.81 US-93 B 7.83 31.31 US-93 S 1.02 2.03 US-95 521.95 1322.99 *US-95 B 1.76 2.95 *US-95 S 2.25 4.80 Total 1909.87 4632.79
* Route is non-commerce ** Portions are non-commerce All other routes are commerce
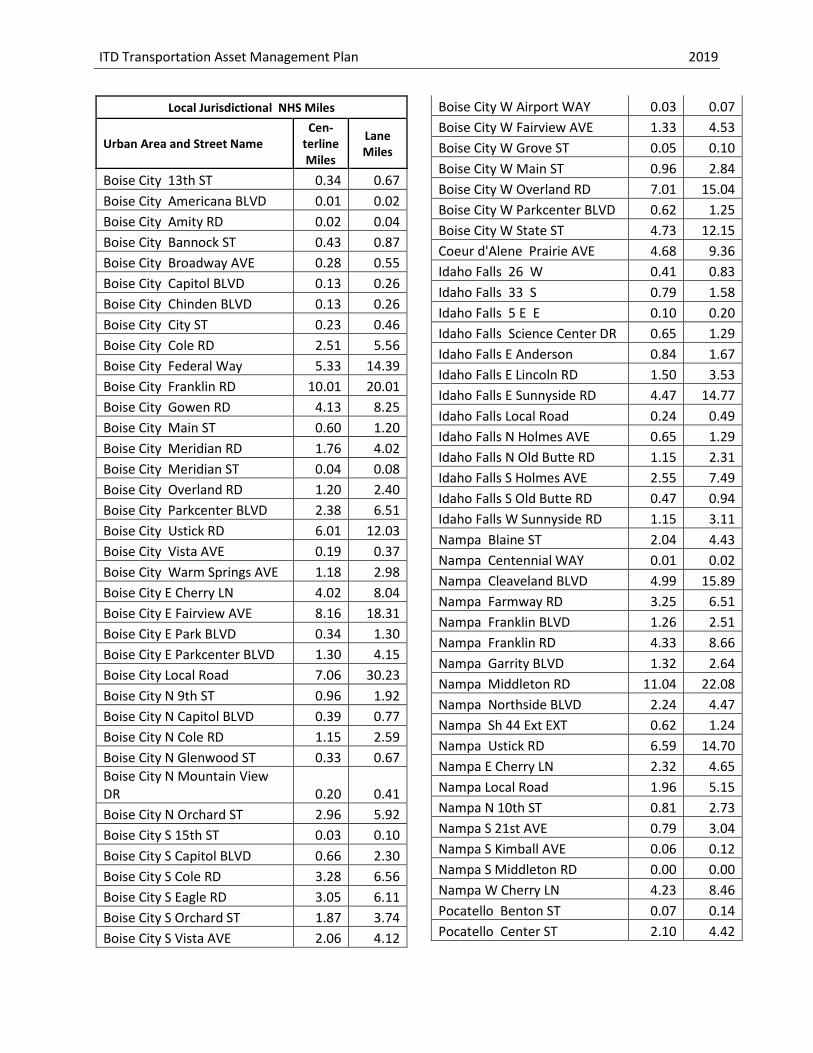
ITD Transportation Asset Management Plan 2019
Local Jurisdictional NHS Miles
Urban Area and Street Name Cen-
terline Miles
Lane Miles
Boise City 13th ST 0.34 0.67 Boise City Americana BLVD 0.01 0.02 Boise City Amity RD 0.02 0.04 Boise City Bannock ST 0.43 0.87 Boise City Broadway AVE 0.28 0.55 Boise City Capitol BLVD 0.13 0.26 Boise City Chinden BLVD 0.13 0.26 Boise City City ST 0.23 0.46 Boise City Cole RD 2.51 5.56 Boise City Federal Way 5.33 14.39 Boise City Franklin RD 10.01 20.01 Boise City Gowen RD 4.13 8.25 Boise City Main ST 0.60 1.20 Boise City Meridian RD 1.76 4.02 Boise City Meridian ST 0.04 0.08 Boise City Overland RD 1.20 2.40 Boise City Parkcenter BLVD 2.38 6.51 Boise City Ustick RD 6.01 12.03 Boise City Vista AVE 0.19 0.37 Boise City Warm Springs AVE 1.18 2.98 Boise City E Cherry LN 4.02 8.04 Boise City E Fairview AVE 8.16 18.31 Boise City E Park BLVD 0.34 1.30 Boise City E Parkcenter BLVD 1.30 4.15 Boise City Local Road 7.06 30.23 Boise City N 9th ST 0.96 1.92 Boise City N Capitol BLVD 0.39 0.77 Boise City N Cole RD 1.15 2.59 Boise City N Glenwood ST 0.33 0.67 Boise City N Mountain View DR 0.20 0.41 Boise City N Orchard ST 2.96 5.92 Boise City S 15th ST 0.03 0.10 Boise City S Capitol BLVD 0.66 2.30 Boise City S Cole RD 3.28 6.56 Boise City S Eagle RD 3.05 6.11 Boise City S Orchard ST 1.87 3.74 Boise City S Vista AVE 2.06 4.12
Boise City W Airport WAY 0.03 0.07 Boise City W Fairview AVE 1.33 4.53 Boise City W Grove ST 0.05 0.10 Boise City W Main ST 0.96 2.84 Boise City W Overland RD 7.01 15.04 Boise City W Parkcenter BLVD 0.62 1.25 Boise City W State ST 4.73 12.15 Coeur d'Alene Prairie AVE 4.68 9.36 Idaho Falls 26 W 0.41 0.83 Idaho Falls 33 S 0.79 1.58 Idaho Falls 5 E E 0.10 0.20 Idaho Falls Science Center DR 0.65 1.29 Idaho Falls E Anderson 0.84 1.67 Idaho Falls E Lincoln RD 1.50 3.53 Idaho Falls E Sunnyside RD 4.47 14.77 Idaho Falls Local Road 0.24 0.49 Idaho Falls N Holmes AVE 0.65 1.29 Idaho Falls N Old Butte RD 1.15 2.31 Idaho Falls S Holmes AVE 2.55 7.49 Idaho Falls S Old Butte RD 0.47 0.94 Idaho Falls W Sunnyside RD 1.15 3.11 Nampa Blaine ST 2.04 4.43 Nampa Centennial WAY 0.01 0.02 Nampa Cleaveland BLVD 4.99 15.89 Nampa Farmway RD 3.25 6.51 Nampa Franklin BLVD 1.26 2.51 Nampa Franklin RD 4.33 8.66 Nampa Garrity BLVD 1.32 2.64 Nampa Middleton RD 11.04 22.08 Nampa Northside BLVD 2.24 4.47 Nampa Sh 44 Ext EXT 0.62 1.24 Nampa Ustick RD 6.59 14.70 Nampa E Cherry LN 2.32 4.65 Nampa Local Road 1.96 5.15 Nampa N 10th ST 0.81 2.73 Nampa S 21st AVE 0.79 3.04 Nampa S Kimball AVE 0.06 0.12 Nampa S Middleton RD 0.00 0.00 Nampa W Cherry LN 4.23 8.46 Pocatello Benton ST 0.07 0.14 Pocatello Center ST 2.10 4.42

ITD Transportation Asset Management Plan 2019
Pocatello Clark ST 1.46 2.93 Pocatello Lewis ST 0.10 0.21 Pocatello Pocatello AVE 0.07 0.14 Pocatello Local Road 0.48 0.74 Pocatello S Union Pacific AVE 0.07 0.14 Pocatello W Center ST 0.03 0.05 Rural 26 W 0.09 0.18 Rural 65 S 0.34 0.68 Rural 65 S W 0.15 0.30 Rural Avalon ST 0.00 0.00 Rural Can Ada RD 1.91 3.83 Rural Farmway RD 1.28 2.55 Rural Franklin RD 2.33 4.66 Rural Garrity BLVD 1.10 2.19 Rural Mullan AVE 0.48 0.96 Rural Northside BLVD 2.01 4.02 Rural Prairie AVE 0.04 0.08 Rural Rexburg Connector 0.16 0.64 Rural Silver Valley RD 1.17 2.34 Rural Terror Gulch RD 0.10 0.21 Rural University BLVD 0.29 0.62 Rural University DR 0.55 1.10 Rural Ustick RD 5.21 10.43 Rural Yellowstone AVE 0.79 1.58 Rural E 400 N 0.13 0.25 Rural E Cherry LN 0.56 1.12 Rural Local Road 1.76 3.52 Rural N Salem RD 1.21 3.80 Rural S Bridge ST 0.11 0.23 Rural S Eagle RD 0.27 0.53 Rural S Middleton RD 0.01 0.01 Rural S Silver Valley RD 1.43 2.87 Rural S Yellowstone HWY 1.52 3.04 Rural W 65 S S 1.99 3.98 Small Urban 2nd ST 0.54 1.07 Small Urban 4th & 2nd Roundabout 0.08 0.16 Small Urban 4th ST 0.15 0.29 Small Urban Avalon ST 0.19 0.38 Small Urban Connector 0.00 0.01 Small Urban Prairie AVE 0.04 0.09 Small Urban University BLVD 0.11 0.23
Small Urban University DR 0.35 0.71 Small Urban Local Road 0.02 0.05 Small Urban N Salem RD 0.42 1.66 Small Urban S 2nd ST W 0.93 1.87 Total 191.17 441.31

ITD Transportation Asset Management Plan 2019
Appendix B - Summary of NHS Bridge As-sets

ITD Transportation Asset Management Plan 2019
Local NHS Bridges & Culverts (Length >20-feet)
BRKEY ROUTE MILE-POST FEATURES COUNTY LENGTH SQFT
12100 STP 6710;YORK RD 001.281 SNAKE RIVER Bonneville 812.007874 26552 12760 STP 7343;FAIRVIEW 047.500 BOISE RIVER Ada 382.0013123 14478 12765 STP 7343;FAIRVIEW 047.501 BOISE RIVER Ada 377.9986877 14440 12770 STP 7343;MAIN ST 077.741 BOISE RIVER SLOUGH Ada 26.00065617 4155 12775 STP 7343;MAIN ST 047.301 BOISE RIVER Ada 283.9993438 16614 14730 NORTHSIDE BLVD 018.366 UPRR;NAMPA RR.OVERPASS Canyon 430.1181102 31992 14735 NORTHSIDE BLVD 018.789 INDIAN CREEK Canyon 23.95013123 1930 19715 STP8213; MIDDLETON 002.482 CALDWELL HIGHLINE CANAL Canyon 23.99934383 1574 19721 STC 3750;MIDDLETON 005.617 FIFTEEN MILE CREEK Canyon 92.00131234 4885 19726 STC 3750;MIDDLETON 005.784 BOISE RIVER Canyon 432.9986877 22992 19735 SMA 8523;CHERRY LN 005.274 PHYLLIS CANAL Canyon 34.12073491 1632 19740 SMA 7343;CHERRY LN 007.797 TEN MILE CREEK Ada 22.99868766 929 19761 SMA 9183;TEN MILE 109.603 RIDENBAUGH CANAL Ada 33.99934383 2958 19763 STP 9183;TEN MILE 109.826 TASA DRIVE Ada 100 10920 19768 STP 9183;TEN MILE 110.061 FUTURE NORTH CROSSING Ada 100 11120 19836 SMA 7563;OVERLAND 003.033 RIDENBAUGH CANAL Ada 31.00065617 2372 19838 STP 7563;OVERLAND 008.202 RIDENBAUGH CANAL Ada 23.99934383 2004 21235 STP7046;LINCOLN RD 001.975 IDAHO CANAL Bonneville 75.1312336 6338 21240 STP 7220;STATE ST 023.810 FARMERS UNION CANAL Ada 48.99934383 4420 21250 STP 7073;COLE RD 001.187 RIDENBAUGH CANAL;COLE GS Ada 32.15223097 3834
21436 SMA7316;HOLMES AVE 002.340 IDAHO CANAL Bonneville 52.24081365 7171
21440 SMA7316;HOLMES AVE 003.163 IDAHO CANAL Bonneville 49.01574803 2940
21445 NHS 7553;CAPITOL 049.352 BOISE RIVER Ada 302.9986877 19150
21451 SMA7553;FEDERAL WY 050.292 RIDENBAUGH CANAL Ada 47.99868766 2554
21526 STP 7403;FRANKLIN 001.158 RIDENBAUGH CANAL Ada 33.99934383 2655 21595 NHS 7433;VISTA AVE 000.283 NEW YORK CANAL Ada 81.03674541 6205 21600 NHS 7433;VISTA AVE 009.650 RIDENBAUGH CANAL Ada 37.07349081 2942 21621 STP 7446;SUNNYSIDE 000.555 BUTTE ARM CANAL Bonneville 27.99868766 2822 21626 STP 7446;SUNNYSIDE 001.836 IDAHO CANAL Bonneville 35 3318 21631 STP 7446;SUNNYSIDE 003.549 SAND CREEK Bonneville 43.99934383 4770 21655 NHS 7183;9TH ST 001.008 BOISE RIVER Ada 311.0006562 19997
21670 SMA7553;FEDERAL WY 002.533 NEW YORK CANAL Ada 146.0006562 11359
21725 NHM 7683;GOWEN RD 005.291 UPRR;GOWEN ROAD BR. Ada 151.9028871 4894
21740 STP7713;FARMWAY RD 000.252 PHYLLIS CANAL Canyon 25.91863517 1347
21760 STP 7773;10TH AVE 049.770 CITY ST;UPRR;CALDWELL OP Canyon 959.9737533 61056 21765 STP 7773;10TH AVE 050.006 INDIAN CREEK Canyon 36.08923885 2884 21776 STP7933;FRANKLIN R 000.740 NOTUS CANAL Canyon 21.00065617 1533 21806 STP 7933;21ST AVE 000.321 INDIAN CREEK Canyon 51.00065617 4106 21815 STP 7983;USTICK RD 003.249 NOTUS CANAL Canyon 81.03674541 2325 21865 STP8393;FRANKLIN B 000.194 PHYLLIS CANAL Canyon 29.85564304 1977 21870 STP8393;FRANKLIN B 000.522 PHYLLIS CANAL Canyon 29.85564304 1977 21875 STP8393;FRANKLIN B 000.766 PHYLLIS CANAL Canyon 29.85564304 1977 21890 SMA 7563;OVERLAND 000.039 TEN MILE CREEK Ada 26.00065617 2262 25995 SMA 7403;FRANKLIN 004.378 TEN MILE CREEK Ada 45 4536 25998 STC 3856; FRANKLIN 007.224 FIVE MILE CREEK Ada 22.00131234 2244 26060 STP 8973;ORCHARD 003.296 SETTLERS CANAL 35/36 ST. Ada 204.0682415 14382 26071 SMA 7073; S. COLE 013.518 NEW YORK CANAL Ada 106.0006562 8533 26091 SMA 8963;EAGLE RD 035.393 RIDENBAUGH CANAL Ada 37.99868766 3344

ITD Transportation Asset Management Plan 2019
26096 SMA 7143;USTICK RD 104.903 FIVE MILE CREEK Ada 22.99868766 2013 26865 SMA8133;HWY 44 EXT 000.423 NOTUS CANAL Canyon 23.95013123 768 26945 SMA8513;ID CNTR RD 100.689 PHYLLIS CANAL Canyon 27.00131234 2722
26965 SMA 8213;MIDDLE-TON 004.135 ELIJA DRAIN Canyon 60.039 2412
27300 SMA 3757;NORTHSIDE 003.864 HIGH LINE CANAL Canyon 25.91863517 692 27320 SMA 3757;NORTHSIDE 003.873 FIFTEEN MILE CREEK Canyon 51.83727034 1383 27510 STC 3799;USTICK RD 100.045 PHYLLIS CANAL Canyon 45.93175853 1375 31145 STP8031;OLD BUTTE 000.937 LATERAL CANAL Bonneville 22.00131234 664 33985 STP7243;E PARK CTR 004.324 LOGGERS CREEK Ada 36.00065617 2124 33990 STP7243;E PARK CTR 004.344 BOISE RIVER Ada 458.9993438 34884 33995 STP7243;E PARK CTR 004.613 WALLING DITCH Ada 103.9993438 7904

ITD Transportation Asset Management Plan 2019
State NHS Bridges & Culverts (Length >20-feet)
BRKEY ROUTE MILE-POST FEATURES COUNTY LENGTH SQFT
10000 US 2 000.125 PEND OREILLE R;OLDTOWN B Bonner 1237.001 83869 10010 US 2 006.828 PRIEST RIVER Bonner 352.001 13094 10015 US 2 018.237 JOHNSON CREEK Bonner 143.999 5328 10027 US 2 025.534 BNSF RR (DOVER BRIDGE) Bonner 1218.999 93497 10030 US 2 069.980 UPRR;MOYIE SPRINGS OP Boundary 145 4959 10035 US 2 070.054 MOYIE R.GORGE;MOYIE BR. Boundary 1223 41582 10360 US 12 000.000 US 12;SNAKE RIVER Nez Perce 1424 68494 10375 US 12 001.940 CLEARWATER RIVER;BNRR Nez Perce 1352.001312 83824 10385 US 12 013.897 APRROACH RD;CATHOLIC CR. Nez Perce 131.89 5650 10390 US 12 014.960 CLWATER R.;NPRR;ARROW BR Nez Perce 1248.031 54662 10396 US 12 019.187 COTTONWOOD CREEK Nez Perce 91.00065617 4186 10405 US 12 034.907 BIG CANYON CREEK Nez Perce 120 5496 10426 US 12 066.746 CLEARWATER R.(KAMIAH BR) Lewis 672.0013123 32189 10458 US 12 104.995 GLADE CREEK Idaho 44 1584 10460 US 12 106.633 DEADMAN CREEK Idaho 84.97375328 2746 10466 US 12 109.946 BIMERICK CREEK Idaho 48 1632 10470 US 12 120.098 FISH CREEK Idaho 107.0013123 3274 10500 US 12 144.745 POST OFFICE CREEK Idaho 75 2400 10505 US 12 153.808 WAWAALAMNIME CREEK Idaho 80 2400 10510 US 12 159.394 IMNAMATNOON CREEK Idaho 94 2867 10515 US 12 169.681 CROOKED FK.CLEARWATER R. Idaho 290.026 9280 10590 I 86 WBL 000.000 I 84 WB-EB;SALT LAKE IC Cassia 229 7901 10600 I 86 EBL 000.010 I 84 WB-EB;SALT LAKE IC Cassia 229 7901 10615 I 86 EBL 006.430 FARM RD;MACHINE PASS GS Cassia 26.00065617 1248 10620 I 86 WBL 006.440 FARM RD;MACHINE PASS GS Cassia 23.99934383 1152 10635 I 86 EBL 013.777 COUNTY RD;OLD US 30N GS Cassia 107.9396325 4320 10640 I 86 WBL 013.778 COUNTY RD;OLD US 30N GS Cassia 107.9396325 4320 10645 I 86 EBL 014.320 RAFT RIVER Cassia 51.83727034 2080 10650 I 86 WBL 014.330 RAFT RIVER Cassia 51.83727034 2215 10655 I 86 EBL 014.797 YALE ROAD;RAFT RIVER IC Cassia 107.9396325 4320 10660 I 86 WBL 014.798 YALE ROAD;RAFT RIVER IC Cassia 107.9396325 4320 10665 I 86 WBL & EBL 018.840 CALLS ROAD GS Power 23.99934383 4944 10675 I 86 & RAMPS 020.789 LANES GULCH Power 26.903 4428 10680 I 86 EBL 022.440 FALL CREEK Power 102.0341207 4457 10685 I 86 WBL 022.450 FALL CREEK Power 102.0341207 4457 10695 I 86 EBL 025.340 DAIRY CANYON;FRONTAGE RD Power 118.11 5157 10700 I 86 WBL 025.350 DAIRY CANYON;FRONTAGE RD Power 118.11 5157 10705 I 86 EBL 026.490 ROCK CR;MASSACRE ROCK BR Power 178.15 7921 10710 I 86 WBL 026.491 ROCK CR;MASSACRE ROCK BR Power 168.963 6895 10735 I 86 WBL & EBL 031.983 CANNELL LN;MACHINE PASS Power 23.99934383 4464 10750 I 86 EBL 033.988 WARM CREEK ROAD GS Power 129.9212598 5668 10755 I 86 WBL 033.989 WARM CREEK ROAD GS Power 129.9212598 5668 10765 I 86 EBL 038.581 SUNBEAM ROAD GS Power 107.9396325 4320 10770 I 86 WBL 038.582 SUNBEAM ROAD GS Power 107.9396325 4320 10775 I 86 EBL 039.283 PRIVATE RD.;MACHINE PASS Power 23.99934383 1200 10780 I 86 WBL 039.284 PRIVATE RD.;MACHINE PASS Power 23.99934383 1200 10790 I 86 EBL 041.323 KOPP ROAD GS Power 23.99934383 1205 10795 I 86 WBL 041.324 KOPP ROAD GS Power 23.99934383 1205 10800 I 86 EBL 042.498 LEYSHON ROAD GS Power 23.99934383 1205 10805 I 86 WBL 042.499 LEYSHON ROAD GS Power 23.99934383 1205 10810 I 86 EBL 044.316 CO.RD.;SEAGULL BAY IC Power 111.8766404 4480 10815 I 86 WBL 044.317 CO.RD.;SEAGULL BAY IC Power 111.8766404 4480
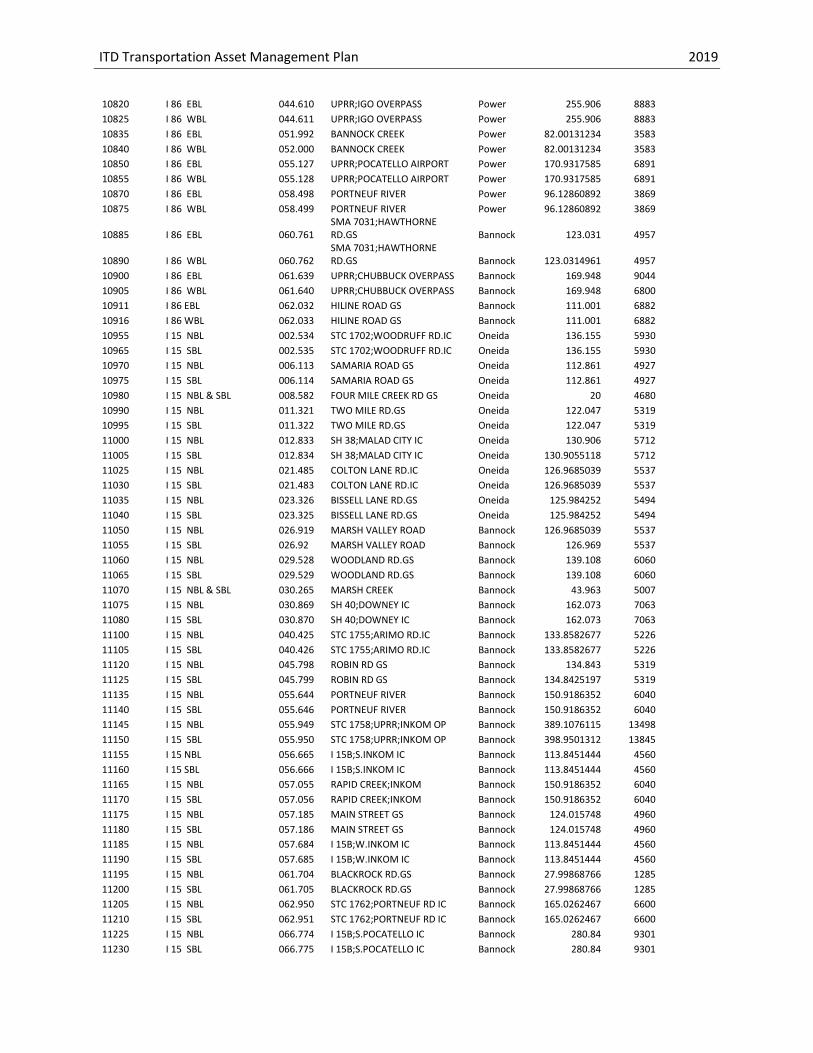
ITD Transportation Asset Management Plan 2019
10820 I 86 EBL 044.610 UPRR;IGO OVERPASS Power 255.906 8883 10825 I 86 WBL 044.611 UPRR;IGO OVERPASS Power 255.906 8883 10835 I 86 EBL 051.992 BANNOCK CREEK Power 82.00131234 3583 10840 I 86 WBL 052.000 BANNOCK CREEK Power 82.00131234 3583 10850 I 86 EBL 055.127 UPRR;POCATELLO AIRPORT Power 170.9317585 6891 10855 I 86 WBL 055.128 UPRR;POCATELLO AIRPORT Power 170.9317585 6891 10870 I 86 EBL 058.498 PORTNEUF RIVER Power 96.12860892 3869 10875 I 86 WBL 058.499 PORTNEUF RIVER Power 96.12860892 3869
10885 I 86 EBL 060.761 SMA 7031;HAWTHORNE RD.GS Bannock 123.031 4957
10890 I 86 WBL 060.762 SMA 7031;HAWTHORNE RD.GS Bannock 123.0314961 4957
10900 I 86 EBL 061.639 UPRR;CHUBBUCK OVERPASS Bannock 169.948 9044 10905 I 86 WBL 061.640 UPRR;CHUBBUCK OVERPASS Bannock 169.948 6800 10911 I 86 EBL 062.032 HILINE ROAD GS Bannock 111.001 6882 10916 I 86 WBL 062.033 HILINE ROAD GS Bannock 111.001 6882 10955 I 15 NBL 002.534 STC 1702;WOODRUFF RD.IC Oneida 136.155 5930 10965 I 15 SBL 002.535 STC 1702;WOODRUFF RD.IC Oneida 136.155 5930 10970 I 15 NBL 006.113 SAMARIA ROAD GS Oneida 112.861 4927 10975 I 15 SBL 006.114 SAMARIA ROAD GS Oneida 112.861 4927 10980 I 15 NBL & SBL 008.582 FOUR MILE CREEK RD GS Oneida 20 4680 10990 I 15 NBL 011.321 TWO MILE RD.GS Oneida 122.047 5319 10995 I 15 SBL 011.322 TWO MILE RD.GS Oneida 122.047 5319 11000 I 15 NBL 012.833 SH 38;MALAD CITY IC Oneida 130.906 5712 11005 I 15 SBL 012.834 SH 38;MALAD CITY IC Oneida 130.9055118 5712 11025 I 15 NBL 021.485 COLTON LANE RD.IC Oneida 126.9685039 5537 11030 I 15 SBL 021.483 COLTON LANE RD.IC Oneida 126.9685039 5537 11035 I 15 NBL 023.326 BISSELL LANE RD.GS Oneida 125.984252 5494 11040 I 15 SBL 023.325 BISSELL LANE RD.GS Oneida 125.984252 5494 11050 I 15 NBL 026.919 MARSH VALLEY ROAD Bannock 126.9685039 5537 11055 I 15 SBL 026.92 MARSH VALLEY ROAD Bannock 126.969 5537 11060 I 15 NBL 029.528 WOODLAND RD.GS Bannock 139.108 6060 11065 I 15 SBL 029.529 WOODLAND RD.GS Bannock 139.108 6060 11070 I 15 NBL & SBL 030.265 MARSH CREEK Bannock 43.963 5007 11075 I 15 NBL 030.869 SH 40;DOWNEY IC Bannock 162.073 7063 11080 I 15 SBL 030.870 SH 40;DOWNEY IC Bannock 162.073 7063 11100 I 15 NBL 040.425 STC 1755;ARIMO RD.IC Bannock 133.8582677 5226 11105 I 15 SBL 040.426 STC 1755;ARIMO RD.IC Bannock 133.8582677 5226 11120 I 15 NBL 045.798 ROBIN RD GS Bannock 134.843 5319 11125 I 15 SBL 045.799 ROBIN RD GS Bannock 134.8425197 5319 11135 I 15 NBL 055.644 PORTNEUF RIVER Bannock 150.9186352 6040 11140 I 15 SBL 055.646 PORTNEUF RIVER Bannock 150.9186352 6040 11145 I 15 NBL 055.949 STC 1758;UPRR;INKOM OP Bannock 389.1076115 13498 11150 I 15 SBL 055.950 STC 1758;UPRR;INKOM OP Bannock 398.9501312 13845 11155 I 15 NBL 056.665 I 15B;S.INKOM IC Bannock 113.8451444 4560 11160 I 15 SBL 056.666 I 15B;S.INKOM IC Bannock 113.8451444 4560 11165 I 15 NBL 057.055 RAPID CREEK;INKOM Bannock 150.9186352 6040 11170 I 15 SBL 057.056 RAPID CREEK;INKOM Bannock 150.9186352 6040 11175 I 15 NBL 057.185 MAIN STREET GS Bannock 124.015748 4960 11180 I 15 SBL 057.186 MAIN STREET GS Bannock 124.015748 4960 11185 I 15 NBL 057.684 I 15B;W.INKOM IC Bannock 113.8451444 4560 11190 I 15 SBL 057.685 I 15B;W.INKOM IC Bannock 113.8451444 4560 11195 I 15 NBL 061.704 BLACKROCK RD.GS Bannock 27.99868766 1285 11200 I 15 SBL 061.705 BLACKROCK RD.GS Bannock 27.99868766 1285 11205 I 15 NBL 062.950 STC 1762;PORTNEUF RD IC Bannock 165.0262467 6600 11210 I 15 SBL 062.951 STC 1762;PORTNEUF RD IC Bannock 165.0262467 6600 11225 I 15 NBL 066.774 I 15B;S.POCATELLO IC Bannock 280.84 9301 11230 I 15 SBL 066.775 I 15B;S.POCATELLO IC Bannock 280.84 9301

ITD Transportation Asset Management Plan 2019
11235 I 15 NBL 067.667 BARTON RD.GS Bannock 109.908 4334 11240 I 15 SBL 067.668 BARTON RD.GS Bannock 109.908 4334 11245 I 15 NBL 068.799 SMA 7461;E. TERRY ST Bannock 151.903 5989 11250 I 15 SBL 068.800 SMA 7461;E. TERRY ST Bannock 151.903 5989 11256 I 15 NBL 069.366 STP 7341; CENTER ST. IC. Bannock 137.9986877 8556 11261 I 15 SBL 069.367 STP 7341; CENTER ST. IC. Bannock 137.9986877 8556 11271 I 15 NBL 070.977 I 15B;POCATELLO CREEK IC Bannock 147.9986877 9028 11276 I 15 SBL 070.978 I 15B;POCATELLO CREEK IC Bannock 147.9986877 9028 11280 I 15 SBL 072.036 I 86 WB RAMP Bannock 215.8792651 8640 11285 I 15 SBL 072.183 I 86 EB RAMP Bannock 229.0026247 9160 11305 I 15 NBL 076.227 PRIVATE RD.;MACHINE PASS Bannock 23.99934383 1152 11310 I 15 SBL 076.226 PRIVATE RD.;MACHINE PASS Bannock 23.99934383 1152 11315 I 15 NBL 077.597 PRIVATE RD.;MACHINE PASS Bannock 23.99934383 1152 11320 I 15 SBL 077.598 PRIVATE RD.;MACHINE PASS Bannock 23.99934383 1152 11335 I 15 NBL 079.227 FORT HALL MAIN CANAL Bannock 111.8766404 4502 11340 I 15 SBL 079.228 FORT HALL MAIN CANAL Bannock 111.8766404 4480 11415 I 15 NBL 087.066 GIBSON CANAL Bingham 20.997 1012 11420 I 15 SBL 087.067 GIBSON CANAL Bingham 20.997 985 11440 I 15 SBL 088.763 I15B;UPRR;S.BLACKFOOT IC Bingham 392.06 13602 11445 I 15 NBL 088.764 I15B;UPRR;S.BLACKFOOT IC Bingham 392.06 13602 11450 I 15 NBL 090.341 BLACKFOOT RIVER Bingham 154.855643 6200 11455 I 15 SBL 090.342 BLACKFOOT RIVER Bingham 154.855643 6200 11465 I 15 NBL 092.259 W.BRIDGE ST.GS;UPRR OP Bingham 298.8845144 11960 11470 I 15 SBL 092.260 W.BRIDGE ST.GS;UPRR OP Bingham 257.874 10320 11475 I 15 NBL 092.515 US 26;WEST BLACKFOOT IC Bingham 157.152231 6280 11480 I 15 SBL 092.516 US 26;WEST BLACKFOOT IC Bingham 157.152231 6280 11486 I 15 NBL 094.349 SNAKE RIVER;BLACKFOOT BR Bingham 831.0006562 46785 11491 I 15 SBL 094.350 SNAKE RIVER;BLACKFOOT BR Bingham 831.003937 35982 11495 I 15 NBL 094.565 DANSKIN CANAL Bingham 89.89501312 3618 11500 I 15 SBL 094.566 DANSKIN CANAL Bingham 89.89501312 3618 11510 I 15 NBL 095.010 RIVERSIDE CANAL Bingham 32.00131234 1536 11515 I 15 SBL 095.011 RIVERSIDE CANAL Bingham 32.00131234 1536 11520 I 15 NBL 095.779 RIVERSIDE CANAL Bingham 25 1198 11525 I 15 SBL 095.780 RIVERSIDE CANAL Bingham 25 1198 11535 I 15 NBL 097.323 RIVERSIDE CANAL Bingham 37.07349081 1480 11540 I 15 SBL 097.324 RIVERSIDE CANAL Bingham 37.07349081 1480 11550 I 15 NBL 098.275 ABERDEEN SPRINGFIELD CNL Bingham 120.079 4848 11555 I 15 SBL 098.276 ABERDEEN SPRINGFIELD CNL Bingham 120.079 4848 11560 I 15 NBL 098.313 PEOPLES CANAL Bingham 80.052 3232 11565 I 15 SBL 098.314 PEOPLES CANAL Bingham 80.052 3232 11580 I 15 NBL 099.405 LAVA SIDE CANAL Bingham 21.001 1012 11585 I 15 SBL 099.406 LAVA SIDE CANAL Bingham 21.001 1012 11615 I 15 NBL 108.394 GREAT WESTERN CANAL Bingham 22.96587927 1109 11620 I 15 SBL 108.395 GREAT WESTERN CANAL Bingham 22.96587927 1109 11690 I 15 SBL 115.817 SIDEHILL CANAL Bonneville 32.00131234 1533 11695 I 15 NBL 115.818 SIDEHILL CANAL Bonneville 32.00131234 1533 11705 I 15 NBL 116.500 PORTER CANAL Bonneville 26.00065617 1245 11710 I 15 SBL 116.501 PORTER CANAL Bonneville 26.00065617 1245 11720 I 15 NBL 118.532 I 15B;BROADWAY ST.IC Bonneville 174.869 7000 11725 I 15 SBL 118.533 I 15B;BROADWAY ST.IC Bonneville 174.869 8365 11740 I 15 SBL 122.554 GREAT WESTERN CANAL Bonneville 80.052 3200 11745 I 15 NBL 122.555 GREAT WESTERN CANAL Bonneville 80.052 3200 11800 I 15 NBL 127.528 STC 6731;BASSETT RD.IC Bonneville 107.94 4320 11805 I 15 SBL 127.529 STC 6731;BASSETT RD.IC Bonneville 107.94 4320 11810 I 15 NBL 129.962 BUTTE MARKET LAKE CANAL Jefferson 41.995 1709 11815 I 15 SBL 129.963 BUTTE MARKET LAKE CANAL Jefferson 41.995 1709 11830 I 15 NBL 134.311 MARKET LAKE CANAL Jefferson 51.83727034 2116
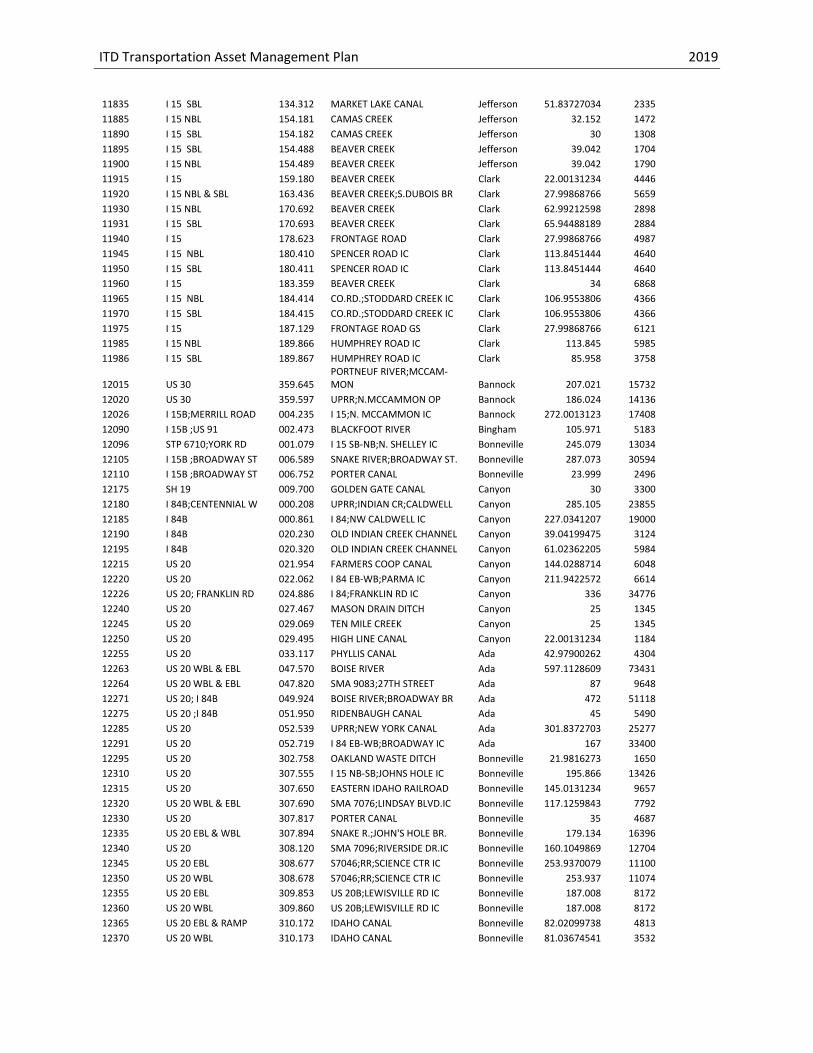
ITD Transportation Asset Management Plan 2019
11835 I 15 SBL 134.312 MARKET LAKE CANAL Jefferson 51.83727034 2335 11885 I 15 NBL 154.181 CAMAS CREEK Jefferson 32.152 1472 11890 I 15 SBL 154.182 CAMAS CREEK Jefferson 30 1308 11895 I 15 SBL 154.488 BEAVER CREEK Jefferson 39.042 1704 11900 I 15 NBL 154.489 BEAVER CREEK Jefferson 39.042 1790 11915 I 15 159.180 BEAVER CREEK Clark 22.00131234 4446 11920 I 15 NBL & SBL 163.436 BEAVER CREEK;S.DUBOIS BR Clark 27.99868766 5659 11930 I 15 NBL 170.692 BEAVER CREEK Clark 62.99212598 2898 11931 I 15 SBL 170.693 BEAVER CREEK Clark 65.94488189 2884 11940 I 15 178.623 FRONTAGE ROAD Clark 27.99868766 4987 11945 I 15 NBL 180.410 SPENCER ROAD IC Clark 113.8451444 4640 11950 I 15 SBL 180.411 SPENCER ROAD IC Clark 113.8451444 4640 11960 I 15 183.359 BEAVER CREEK Clark 34 6868 11965 I 15 NBL 184.414 CO.RD.;STODDARD CREEK IC Clark 106.9553806 4366 11970 I 15 SBL 184.415 CO.RD.;STODDARD CREEK IC Clark 106.9553806 4366 11975 I 15 187.129 FRONTAGE ROAD GS Clark 27.99868766 6121 11985 I 15 NBL 189.866 HUMPHREY ROAD IC Clark 113.845 5985 11986 I 15 SBL 189.867 HUMPHREY ROAD IC Clark 85.958 3758
12015 US 30 359.645 PORTNEUF RIVER;MCCAM-MON Bannock 207.021 15732
12020 US 30 359.597 UPRR;N.MCCAMMON OP Bannock 186.024 14136 12026 I 15B;MERRILL ROAD 004.235 I 15;N. MCCAMMON IC Bannock 272.0013123 17408 12090 I 15B ;US 91 002.473 BLACKFOOT RIVER Bingham 105.971 5183 12096 STP 6710;YORK RD 001.079 I 15 SB-NB;N. SHELLEY IC Bonneville 245.079 13034 12105 I 15B ;BROADWAY ST 006.589 SNAKE RIVER;BROADWAY ST. Bonneville 287.073 30594 12110 I 15B ;BROADWAY ST 006.752 PORTER CANAL Bonneville 23.999 2496 12175 SH 19 009.700 GOLDEN GATE CANAL Canyon 30 3300 12180 I 84B;CENTENNIAL W 000.208 UPRR;INDIAN CR;CALDWELL Canyon 285.105 23855 12185 I 84B 000.861 I 84;NW CALDWELL IC Canyon 227.0341207 19000 12190 I 84B 020.230 OLD INDIAN CREEK CHANNEL Canyon 39.04199475 3124 12195 I 84B 020.320 OLD INDIAN CREEK CHANNEL Canyon 61.02362205 5984 12215 US 20 021.954 FARMERS COOP CANAL Canyon 144.0288714 6048 12220 US 20 022.062 I 84 EB-WB;PARMA IC Canyon 211.9422572 6614 12226 US 20; FRANKLIN RD 024.886 I 84;FRANKLIN RD IC Canyon 336 34776 12240 US 20 027.467 MASON DRAIN DITCH Canyon 25 1345 12245 US 20 029.069 TEN MILE CREEK Canyon 25 1345 12250 US 20 029.495 HIGH LINE CANAL Canyon 22.00131234 1184 12255 US 20 033.117 PHYLLIS CANAL Ada 42.97900262 4304 12263 US 20 WBL & EBL 047.570 BOISE RIVER Ada 597.1128609 73431 12264 US 20 WBL & EBL 047.820 SMA 9083;27TH STREET Ada 87 9648 12271 US 20; I 84B 049.924 BOISE RIVER;BROADWAY BR Ada 472 51118 12275 US 20 ;I 84B 051.950 RIDENBAUGH CANAL Ada 45 5490 12285 US 20 052.539 UPRR;NEW YORK CANAL Ada 301.8372703 25277 12291 US 20 052.719 I 84 EB-WB;BROADWAY IC Ada 167 33400 12295 US 20 302.758 OAKLAND WASTE DITCH Bonneville 21.9816273 1650 12310 US 20 307.555 I 15 NB-SB;JOHNS HOLE IC Bonneville 195.866 13426 12315 US 20 307.650 EASTERN IDAHO RAILROAD Bonneville 145.0131234 9657 12320 US 20 WBL & EBL 307.690 SMA 7076;LINDSAY BLVD.IC Bonneville 117.1259843 7792 12330 US 20 307.817 PORTER CANAL Bonneville 35 4687 12335 US 20 EBL & WBL 307.894 SNAKE R.;JOHN'S HOLE BR. Bonneville 179.134 16396 12340 US 20 308.120 SMA 7096;RIVERSIDE DR.IC Bonneville 160.1049869 12704 12345 US 20 EBL 308.677 S7046;RR;SCIENCE CTR IC Bonneville 253.9370079 11100 12350 US 20 WBL 308.678 S7046;RR;SCIENCE CTR IC Bonneville 253.937 11074 12355 US 20 EBL 309.853 US 20B;LEWISVILLE RD IC Bonneville 187.008 8172 12360 US 20 WBL 309.860 US 20B;LEWISVILLE RD IC Bonneville 187.008 8172 12365 US 20 EBL & RAMP 310.172 IDAHO CANAL Bonneville 82.02099738 4813 12370 US 20 WBL 310.173 IDAHO CANAL Bonneville 81.03674541 3532

ITD Transportation Asset Management Plan 2019
12373 US 20 EBL 311.338 STC 6708; ST LEON RD IC Bonneville 111.0006562 4806 12374 US 20 WBL 311.339 STC 6708; ST LEON RD IC Bonneville 111.0006562 4806 12375 US 20 311.750 WILLOW CREEK Bonneville 22.00131234 4825 12380 US 20 312.479 ANDERSON CANAL Bonneville 23.99934383 2568 12383 US 20 EBL 313.462 STC 6706; HITT RD IC Bonneville 116.001 5023 12384 US 20 WBL 313.463 STC 6706; HITT RD IC Bonneville 116.001 5023 12385 US 20 WBL 313.959 RIRIE OUTLET CHANNEL Bonneville 57.999 2529 12390 US 20 EBL 313.960 RIRIE OUTLET CHANNEL Bonneville 57.999 2529 12395 US 20 314.200 SAGE CANAL Bonneville 21.00065617 2247 12400 US 20 EBL 315.226 SH 43;W BELT BRIDGE IC Bonneville 233.924 10226 12405 US 20 WBL 315.227 SH 43;W BELT BRIDGE IC Bonneville 234.9081365 10293 12413 US 20 EBL 317.899 COUNTY LINE ROAD IC Bonneville 126.0006562 5456 12414 US 20 WBL 317.893 COUNTY LINE ROAD IC Bonneville 126.0006562 5456 12420 US 20 320.060 GARFIELD UCON CANAL Jefferson 21.00065617 3148 12435 US 20 320.851 BURGESS CANAL Jefferson 91.864 8243 12440 US 20 EB-WB 321.320 SH 48;RIGBY GS Jefferson 146.982 13186 12455 US 20 EBL & WBL 322.837 PARKS LEWISVILLE CANAL Jefferson 31.00065617 4638 12465 US 20 EBL 323.565 SNAKE RIVER DRY BED CNL Jefferson 71.85 3146 12470 US 20 WBL 323.575 SNAKE RIVER DRY BED CNL Jefferson 71.85 3146 12480 US 20 EBL 325.019 MENAN CANAL Jefferson 43.96325459 1918 12485 US 20 WBL 325.020 MENAN CANAL Jefferson 43.96325459 1918 12487 US 20 EBL 325.572 MENAN-LORENZO RD IC Jefferson 102.0013123 4488 12489 US 20 WBL 325.574 MENAN-LORENZO RD IC Jefferson 102.0013123 4488 12495 US 20 EBL 326.200 SNAKE RIVER;LORENZO BR. Jefferson 639.108 28499 12500 US 20 WBL 326.201 SNAKE RIVER;LORENZO BR. Jefferson 642.06 28633 12515 US 20 EBL 328.067 TEXAS SLOUGH Madison 63.97637795 2797 12520 US 20 WBL 328.068 TEXAS SLOUGH Madison 63.97637795 2797 12530 US 20 EBL 331.923 STP 7726;S.REXBURG IC Madison 157.152 6861 12535 US 20 WBL 331.924 STP 7726;S.REXBURG IC Madison 157.152 6861 12550 US 20 EBL 333.420 SH 33;REXBURG IC Madison 157.152 6861 12555 US 20 WBL 333.421 SH 33;REXBURG IC Madison 157.152 6861 12560 US 20 WBL 334.349 S.FK.TETON RIVER Madison 179 7822 12565 US 20 EBL 334.350 S.FK.TETON RIVER Madison 179 7822 12585 US 20 WBL 339.405 N.FK.TETON RIVER Madison 101.05 4404 12590 US 20 EBL 339.406 N.FK.TETON RIVER Madison 101.05 4404 12600 US 20 EBL & WBL 344.245 SALEM UNION CANAL Fremont 27.99868766 3186 12605 US 20 344.503 2290 E Fremont 23.99934383 2729 12615 US 20 EBL & WBL 347.022 SALEM UNION CANAL Fremont 37.99868766 2774 12620 US 20 EBL & WBL 347.038 TWIN GROVES CANAL Fremont 28.99934383 4434 12625 US 20 EBL & WBL 347.349 FARMERS FRIEND CANAL Fremont 33.999 5195 12630 US 20 WBL & EBL 347.838 N.BR.FALL RIVER CANAL Fremont 22.00131234 3544 12645 US 20 WBL & EBL 350.701 S.FK.FALL RIVER CANAL Fremont 76.115 8702 12650 US 20 WBL 352.066 FALL RIVER CANAL Fremont 32.15223097 1398 12654 US 20 EBL 352.067 FALL RIVER CANAL Fremont 33.13648294 1429 12665 US 20 354.049 FALL RIVER Fremont 113.845 4788 12671 US 20 363.370 HENRY'S FK. SNAKE RIVER Fremont 457.999 34808 12676 US 20 379.144 HENRY'S FK. SNAKE RIVER Fremont 255 10532 12680 US 20 387.030 BUFFALO RIVER;PONDS BR. Fremont 180.118 10800 12685 US 20 392.764 HENRY'S FK. SNAKE RIVER Fremont 180.118 10800 12690 US 20 398.756 HENRY'S LAKE OUTLET Fremont 60.03937008 2754 12773 US 20 EBL 048.280 AMERICANA BLVD;15TH ST. Ada 540.0262467 30294 12774 US 20 WBL 048.380 AMERICANA BLVD;15TH ST. Ada 540.0262467 30294 13150 US 93 167.538 MILNER GOODING CANAL Lincoln 76.11548556 3002 13155 US 93 177.638 LITTLE WOOD RIVER Lincoln 54 2160 13160 US 93 182.816 JIMMY BYRNES SLOUGH Lincoln 34.33070866 1156 13165 US 93 198.270 SILVER CREEK Blaine 46.916 1880 13170 US 93 199.280 LITTLE WOOD RIVER Blaine 70.86614173 2840
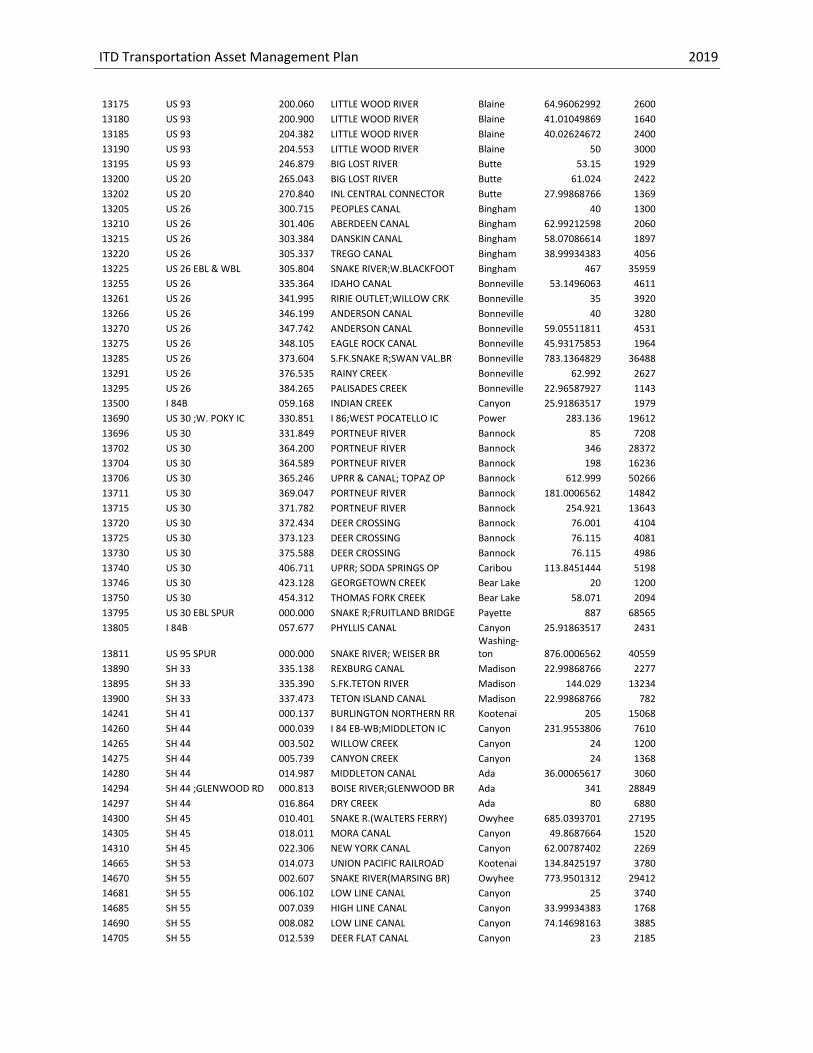
ITD Transportation Asset Management Plan 2019
13175 US 93 200.060 LITTLE WOOD RIVER Blaine 64.96062992 2600 13180 US 93 200.900 LITTLE WOOD RIVER Blaine 41.01049869 1640 13185 US 93 204.382 LITTLE WOOD RIVER Blaine 40.02624672 2400 13190 US 93 204.553 LITTLE WOOD RIVER Blaine 50 3000 13195 US 93 246.879 BIG LOST RIVER Butte 53.15 1929 13200 US 20 265.043 BIG LOST RIVER Butte 61.024 2422 13202 US 20 270.840 INL CENTRAL CONNECTOR Butte 27.99868766 1369 13205 US 26 300.715 PEOPLES CANAL Bingham 40 1300 13210 US 26 301.406 ABERDEEN CANAL Bingham 62.99212598 2060 13215 US 26 303.384 DANSKIN CANAL Bingham 58.07086614 1897 13220 US 26 305.337 TREGO CANAL Bingham 38.99934383 4056 13225 US 26 EBL & WBL 305.804 SNAKE RIVER;W.BLACKFOOT Bingham 467 35959 13255 US 26 335.364 IDAHO CANAL Bonneville 53.1496063 4611 13261 US 26 341.995 RIRIE OUTLET;WILLOW CRK Bonneville 35 3920 13266 US 26 346.199 ANDERSON CANAL Bonneville 40 3280 13270 US 26 347.742 ANDERSON CANAL Bonneville 59.05511811 4531 13275 US 26 348.105 EAGLE ROCK CANAL Bonneville 45.93175853 1964 13285 US 26 373.604 S.FK.SNAKE R;SWAN VAL.BR Bonneville 783.1364829 36488 13291 US 26 376.535 RAINY CREEK Bonneville 62.992 2627 13295 US 26 384.265 PALISADES CREEK Bonneville 22.96587927 1143 13500 I 84B 059.168 INDIAN CREEK Canyon 25.91863517 1979 13690 US 30 ;W. POKY IC 330.851 I 86;WEST POCATELLO IC Power 283.136 19612 13696 US 30 331.849 PORTNEUF RIVER Bannock 85 7208 13702 US 30 364.200 PORTNEUF RIVER Bannock 346 28372 13704 US 30 364.589 PORTNEUF RIVER Bannock 198 16236 13706 US 30 365.246 UPRR & CANAL; TOPAZ OP Bannock 612.999 50266 13711 US 30 369.047 PORTNEUF RIVER Bannock 181.0006562 14842 13715 US 30 371.782 PORTNEUF RIVER Bannock 254.921 13643 13720 US 30 372.434 DEER CROSSING Bannock 76.001 4104 13725 US 30 373.123 DEER CROSSING Bannock 76.115 4081 13730 US 30 375.588 DEER CROSSING Bannock 76.115 4986 13740 US 30 406.711 UPRR; SODA SPRINGS OP Caribou 113.8451444 5198 13746 US 30 423.128 GEORGETOWN CREEK Bear Lake 20 1200 13750 US 30 454.312 THOMAS FORK CREEK Bear Lake 58.071 2094 13795 US 30 EBL SPUR 000.000 SNAKE R;FRUITLAND BRIDGE Payette 887 68565 13805 I 84B 057.677 PHYLLIS CANAL Canyon 25.91863517 2431
13811 US 95 SPUR 000.000 SNAKE RIVER; WEISER BR Washing-ton 876.0006562 40559
13890 SH 33 335.138 REXBURG CANAL Madison 22.99868766 2277 13895 SH 33 335.390 S.FK.TETON RIVER Madison 144.029 13234 13900 SH 33 337.473 TETON ISLAND CANAL Madison 22.99868766 782 14241 SH 41 000.137 BURLINGTON NORTHERN RR Kootenai 205 15068 14260 SH 44 000.039 I 84 EB-WB;MIDDLETON IC Canyon 231.9553806 7610 14265 SH 44 003.502 WILLOW CREEK Canyon 24 1200 14275 SH 44 005.739 CANYON CREEK Canyon 24 1368 14280 SH 44 014.987 MIDDLETON CANAL Ada 36.00065617 3060 14294 SH 44 ;GLENWOOD RD 000.813 BOISE RIVER;GLENWOOD BR Ada 341 28849 14297 SH 44 016.864 DRY CREEK Ada 80 6880 14300 SH 45 010.401 SNAKE R.(WALTERS FERRY) Owyhee 685.0393701 27195 14305 SH 45 018.011 MORA CANAL Canyon 49.8687664 1520 14310 SH 45 022.306 NEW YORK CANAL Canyon 62.00787402 2269 14665 SH 53 014.073 UNION PACIFIC RAILROAD Kootenai 134.8425197 3780 14670 SH 55 002.607 SNAKE RIVER(MARSING BR) Owyhee 773.9501312 29412 14681 SH 55 006.102 LOW LINE CANAL Canyon 25 3740 14685 SH 55 007.039 HIGH LINE CANAL Canyon 33.99934383 1768 14690 SH 55 008.082 LOW LINE CANAL Canyon 74.14698163 3885 14705 SH 55 012.539 DEER FLAT CANAL Canyon 23 2185

ITD Transportation Asset Management Plan 2019
14710 SH 55 013.070 PHYLLIS CANAL Canyon 22.00131234 1140 14715 SH 55 014.056 WILSON DRAIN Canyon 47.90026247 2486 14720 SH 55 015.436 ELIJAH DRAIN Canyon 54.13385827 2797 14722 SH 55 016.369 UPRR Canyon 96.001 8630 14724 SH 55 016.465 INDIAN CREEK Canyon 257.999 21749 14729 SH 55 016.588 I 84;KARCHER IC Canyon 201.001 16382 14754 SH 55 045.763 FARMERS UNION CANAL Ada 28.871 4463 14756 SH 55 048.292 DRY CREEK Ada 62.99212598 5468 14760 SH 55 063.641 PAYETTE RIVER Boise 363.8451444 11830 14766 SH 55 064.199 POWER CANAL Boise 100.0656168 7400 14770 SH 55 065.895 UPRR;HORSESHOE BEND OP Boise 198.163 7920 14775 SH 55 065.996 PAYETTE RIVER Boise 375.984252 15040 14790 SH 55 078.762 S.FK.PAYETTE RIVER Boise 273.9501312 10439 14800 SH 55 081.740 N.FK.PAYETTE RIVER Boise 287.0734908 11480 14805 SH 55 099.809 UPRR;N.FK.PAYETTE RIVER Valley 411.0892388 11631 14810 SH 55 100.346 ROUND VALLEY CREEK Valley 37.07349081 1443 14815 SH 55 107.224 CLEAR CREEK Valley 33.99934383 1272 14820 SH 55 111.088 BIG CREEK Valley 53.1496063 1966 14826 SH 55 113.809 N. FK. PAYETTE RIVER Valley 391.0006562 24047 14831 SH 55 115.887 N. FK. PAYETTE RIVER Valley 250 13375 14841 SH 55 128.706 GOLD FORK RIVER Valley 153 7313 14851 SH 55 130.988 BOULDER CREEK Valley 57.08661417 2434 14865 SH 55 135.345 LAKE FORK CREEK Valley 95.14435696 4332 14871 SH 55 138.235 LAKE FORK CREEK CANAL Valley 32.15223097 896 14881 SH 55 145.001 N.FK.PAYETTE R;LARDO Valley 157.0013123 8478 14975 US 20 141.100 NO NAME CREEK Camas 22 836 14985 US 20 141.840 HOT CREEK Camas 22 836 14990 US 20 142.110 ARNOLD CREEK Camas 22 836 14995 US 20 143.768 CHIMNEY CR.;SHEEP CR. Camas 28 1064 15005 US 20 145.357 CORRAL CREEK Camas 33.13648294 1386 15015 US 20 147.407 THREE MILE CREEK Camas 31 1302 15045 US 20 152.034 W.FK.SOLDIER CREEK Camas 23.99934383 732 15050 US 20 152.378 SOLDIER CREEK Camas 23.99934383 732 15055 US 20 153.285 E.FK.SOLDIER CREEK Camas 23.99934383 732 15060 US 20 154.056 JOHNSON CREEK Camas 23.99934383 732 15065 US 20 155.596 KNOWLTON CREEK Camas 30 915 15071 US 20 176.038 BIG WOOD RIVER Blaine 274 12001 15090 US 20 183.947 GROVE CREEK Blaine 32 1056 15095 US 20 184.468 LOVING CREEK Blaine 24 1008 15100 US 20 187.147 SILVER CREEK Blaine 103.0183727 4120 15105 US 20 191.356 SILVER CREEK Blaine 63 2501 15109 US 20 195.106 DRY CREEK Blaine 56.1023622 1904 15120 SH 69 002.264 TEED LATERAL CANAL Ada 20 2580 15125 SH 69 003.225 KUNA CANAL Ada 21.00065617 2919 15130 SH 69 004.574 MASON CRK;FEEDER CANAL Ada 27.00131234 3429 15135 SH 69 006.270 RAWSON CANAL Ada 22.99868766 2024 15140 SH 69 008.070 RIDENBAUGH CANAL Ada 30 3540 15150 SH 69 009.239 TEN MILE CREEK Ada 21.001 3438 15156 SH 69 067.937 I 84;SH 69 MERIDIAN IC Ada 197 50984 15175 SH 55 041.775 BOISE RIVER;S.CHANNEL Ada 123.031 10578 15180 SH 55 042.537 BOISE RIVER;N.CHANNEL Ada 243.11 20898 15315 I 84 EBL 000.000 SNAKE RIVER;ONTARIO BR Payette 953 33069 15320 I 84 WBL 000.001 SNAKE RIVER;ONTARIO BR Payette 953.5 33199 15325 I 84 EBL 002.121 WHITLEY ROAD GS Payette 23.99934383 1150 15335 I 84 WBL 002.120 WHITLEY ROAD GS Payette 23.99934383 1150 15385 I 84 EBL 014.685 SE 9TH AVENUE GS Payette 24 1150 15390 I 84 WBL 014.687 SE 9TH AVENUE GS Payette 24 1150

ITD Transportation Asset Management Plan 2019
15415 I 84 EBL 016.958 'D' LINE CANAL Payette 27.99868766 1341 15420 I 84 WBL 016.948 'D' LINE CANAL Payette 28 1344 15430 I 84 WBL 017.777 SAND HOLLOW CREEK Canyon 22.99868766 1102 15435 I 84 EBL 017.761 SAND HOLLOW CREEK Canyon 22.99868766 1102 15450 I 84 EBL 022.746 PURPLE SAGE GS Canyon 107.9396325 4320 15455 I 84 WBL 022.745 PURPLE SAGE GS Canyon 107.9396325 4320 15465 I 84 EBL 025.076 NOTUS CANAL Canyon 22.99868766 989 15480 I 84 026.349 FARMERS SEBREE CANAL Canyon 48.88451444 5145 15490 I 84 ;US 20-26 026.661 BOISE RIVER;CALDWELL BR. Canyon 295.9317585 26551 15505 I 84 ;US 20-26 027.588 STP 7773;10TH AVE IC Canyon 249.015748 28436 15535 I 84 EBL 029.782 SMA 7923;LINDEN ROAD GS Canyon 125 4925 15540 I 84 WBL 029.792 SMA 7923;LINDEN ROAD GS Canyon 125 4925 15545 I 84 WBL 031.047 NOTUS CANAL Canyon 28.99934383 1102 15550 I 84 EBL 031.083 NOTUS CANAL Canyon 28.99934383 1102 15570 I 84 WBL 034.973 NORTHSIDE BLVD IC Canyon 149.934 6030 15575 I 84 EBL 034.975 NORTHSIDE BLVD IC Canyon 150 5910 15580 I 84 WBL 035.236 UPRR;EAST LATERAL CANAL Canyon 211.9422572 8459 15585 I 84 EBL 035.244 UPRR;EAST LATERAL CANAL Canyon 211.942 9243 15596 I 84 EBL 036.211 PHYLLIS CANAL Canyon 85 6545 15601 I 84 WBL 036.236 PHYLLIS CANAL Canyon 68.99934383 5313 15606 I 84 EBL 036.465 UPRR Canyon 113.9993438 8801 15611 I 84 WBL 036.463 UPRR Canyon 113.9993438 7433 15621 I 84 WBL & EBL 037.959 I 84B;GARRITY BLVD IC Canyon 131.001 17030 15650 I 84 043.791 TEN MILE CREEK Ada 23 5543 15680 I 84 EBL & WBL 046.768 RIDENBAUGH CANAL Ada 30 4338 15730 I 84 EBL 052.275 NEW YORK CANAL Ada 107.999 12701 15735 I 84 WBL 052.277 NEW YORK CANAL Ada 107.999 11470 15751 I 84 EBL 054.849 UPRR; GOWEN SPUR Ada 118 8638 15756 I 84 WBL 054.862 UPRR; GOWEN SPUR Ada 116 7563 15760 I 84 EBL 056.695 UPRR Ada 146.0006562 11505 15765 I 84 WBL 056.688 UPRR Ada 146.0006562 9928 15769 SH 21 003.130 BOISE RIVER Ada 1495.079 62342 15771 I 84 057.011 SH 21;GOWEN RD IC Ada 175 20475 15780 I 84 WBL 063.541 KUNA RD;BLACKS CREEK IC Ada 112.8608924 4520 15785 I 84 EBL 063.539 KUNA RD;BLACKS CREEK IC Ada 111.8766404 4480 15805 I 84 EBL 070.271 INDIAN CREEK Ada 26.00065617 1092 15810 I 84 WBL 070.269 INDIAN CREEK Ada 26.00065617 1144 15825 I 84 EBL 080.993 SQUAW CREEK Elmore 42.001 1764 15830 I 84 WBL 080.991 SQUAW CREEK Elmore 42.001 1848 15840 I 84 EBL 089.760 CANYON CREEK Elmore 36.00065617 1476 15845 I 84 WBL 089.761 CANYON CREEK Elmore 36.00065617 1476 15865 I 84 WBL 095.201 US 20;N.MOUNTAIN HOME IC Elmore 92.84776903 3813 15870 I 84 EBL 095.211 US 20;N.MOUNTAIN HOME IC Elmore 92.84776903 3813 15915 I 84 EBL 113.812 COLD SPRINGS RD.& CR.IC Elmore 191.9291339 8448 15920 I 84 WBL 113.817 COLD SPRINGS RD.& CR.IC Elmore 191.9291339 8371 15925 I 84 EBL 117.239 ALKALI CR;ALKALI CR GS Elmore 187.007874 8153 15930 I 84 WBL 117.238 ALKALI CR;ALKALI CR GS Elmore 187.007874 8153 15940 I 84 WBL 120.243 I 84B;BANNOCK IC Elmore 131.8897638 5755 15945 I 84 EBL 120.244 I 84B;BANNOCK IC Elmore 131.8897638 5755 15950 I 84 EBL 120.462 CANYON CR;GLENNS FERRY Elmore 73.99934383 3226 15955 I 84 WBL 120.461 CANYON CR;GLENNS FERRY Elmore 73.99934383 3226 15965 I 84 EBL 121.616 RD;RR;SNAKE R;W.SNAKE BR Elmore 1122.047 48919 15970 I 84 WBL 121.618 RD;RR;SNAKE R;W.SNAKE BR Elmore 1094.160105 47698 15980 I 84 EBL 128.012 SNAKE R;E.SNAKE RIVER BR Elmore 998.0314961 43513 15985 I 84 WBL 128.003 SNAKE R;E.SNAKE RIVER BR Elmore 998.0314961 43513 16015 I 84 EBL 140.061 UPRR;E.BLISS RAILROAD OP Gooding 245.0787402 13818 16020 I 84 WBL 140.075 UPRR;E.BLISS RAILROAD OP Gooding 245.0787402 13818
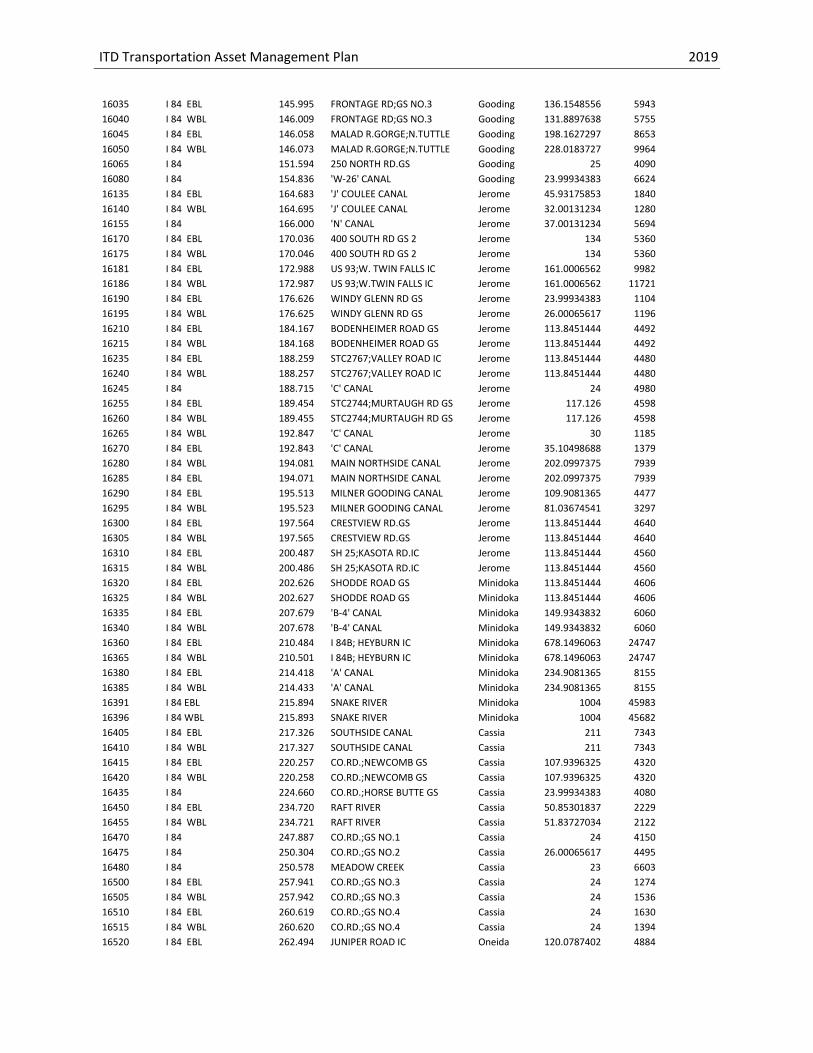
ITD Transportation Asset Management Plan 2019
16035 I 84 EBL 145.995 FRONTAGE RD;GS NO.3 Gooding 136.1548556 5943 16040 I 84 WBL 146.009 FRONTAGE RD;GS NO.3 Gooding 131.8897638 5755 16045 I 84 EBL 146.058 MALAD R.GORGE;N.TUTTLE Gooding 198.1627297 8653 16050 I 84 WBL 146.073 MALAD R.GORGE;N.TUTTLE Gooding 228.0183727 9964 16065 I 84 151.594 250 NORTH RD.GS Gooding 25 4090 16080 I 84 154.836 'W-26' CANAL Gooding 23.99934383 6624 16135 I 84 EBL 164.683 'J' COULEE CANAL Jerome 45.93175853 1840 16140 I 84 WBL 164.695 'J' COULEE CANAL Jerome 32.00131234 1280 16155 I 84 166.000 'N' CANAL Jerome 37.00131234 5694 16170 I 84 EBL 170.036 400 SOUTH RD GS 2 Jerome 134 5360 16175 I 84 WBL 170.046 400 SOUTH RD GS 2 Jerome 134 5360 16181 I 84 EBL 172.988 US 93;W. TWIN FALLS IC Jerome 161.0006562 9982 16186 I 84 WBL 172.987 US 93;W.TWIN FALLS IC Jerome 161.0006562 11721 16190 I 84 EBL 176.626 WINDY GLENN RD GS Jerome 23.99934383 1104 16195 I 84 WBL 176.625 WINDY GLENN RD GS Jerome 26.00065617 1196 16210 I 84 EBL 184.167 BODENHEIMER ROAD GS Jerome 113.8451444 4492 16215 I 84 WBL 184.168 BODENHEIMER ROAD GS Jerome 113.8451444 4492 16235 I 84 EBL 188.259 STC2767;VALLEY ROAD IC Jerome 113.8451444 4480 16240 I 84 WBL 188.257 STC2767;VALLEY ROAD IC Jerome 113.8451444 4480 16245 I 84 188.715 'C' CANAL Jerome 24 4980 16255 I 84 EBL 189.454 STC2744;MURTAUGH RD GS Jerome 117.126 4598 16260 I 84 WBL 189.455 STC2744;MURTAUGH RD GS Jerome 117.126 4598 16265 I 84 WBL 192.847 'C' CANAL Jerome 30 1185 16270 I 84 EBL 192.843 'C' CANAL Jerome 35.10498688 1379 16280 I 84 WBL 194.081 MAIN NORTHSIDE CANAL Jerome 202.0997375 7939 16285 I 84 EBL 194.071 MAIN NORTHSIDE CANAL Jerome 202.0997375 7939 16290 I 84 EBL 195.513 MILNER GOODING CANAL Jerome 109.9081365 4477 16295 I 84 WBL 195.523 MILNER GOODING CANAL Jerome 81.03674541 3297 16300 I 84 EBL 197.564 CRESTVIEW RD.GS Jerome 113.8451444 4640 16305 I 84 WBL 197.565 CRESTVIEW RD.GS Jerome 113.8451444 4640 16310 I 84 EBL 200.487 SH 25;KASOTA RD.IC Jerome 113.8451444 4560 16315 I 84 WBL 200.486 SH 25;KASOTA RD.IC Jerome 113.8451444 4560 16320 I 84 EBL 202.626 SHODDE ROAD GS Minidoka 113.8451444 4606 16325 I 84 WBL 202.627 SHODDE ROAD GS Minidoka 113.8451444 4606 16335 I 84 EBL 207.679 'B-4' CANAL Minidoka 149.9343832 6060 16340 I 84 WBL 207.678 'B-4' CANAL Minidoka 149.9343832 6060 16360 I 84 EBL 210.484 I 84B; HEYBURN IC Minidoka 678.1496063 24747 16365 I 84 WBL 210.501 I 84B; HEYBURN IC Minidoka 678.1496063 24747 16380 I 84 EBL 214.418 'A' CANAL Minidoka 234.9081365 8155 16385 I 84 WBL 214.433 'A' CANAL Minidoka 234.9081365 8155 16391 I 84 EBL 215.894 SNAKE RIVER Minidoka 1004 45983 16396 I 84 WBL 215.893 SNAKE RIVER Minidoka 1004 45682 16405 I 84 EBL 217.326 SOUTHSIDE CANAL Cassia 211 7343 16410 I 84 WBL 217.327 SOUTHSIDE CANAL Cassia 211 7343 16415 I 84 EBL 220.257 CO.RD.;NEWCOMB GS Cassia 107.9396325 4320 16420 I 84 WBL 220.258 CO.RD.;NEWCOMB GS Cassia 107.9396325 4320 16435 I 84 224.660 CO.RD.;HORSE BUTTE GS Cassia 23.99934383 4080 16450 I 84 EBL 234.720 RAFT RIVER Cassia 50.85301837 2229 16455 I 84 WBL 234.721 RAFT RIVER Cassia 51.83727034 2122 16470 I 84 247.887 CO.RD.;GS NO.1 Cassia 24 4150 16475 I 84 250.304 CO.RD.;GS NO.2 Cassia 26.00065617 4495 16480 I 84 250.578 MEADOW CREEK Cassia 23 6603 16500 I 84 EBL 257.941 CO.RD.;GS NO.3 Cassia 24 1274 16505 I 84 WBL 257.942 CO.RD.;GS NO.3 Cassia 24 1536 16510 I 84 EBL 260.619 CO.RD.;GS NO.4 Cassia 24 1630 16515 I 84 WBL 260.620 CO.RD.;GS NO.4 Cassia 24 1394 16520 I 84 EBL 262.494 JUNIPER ROAD IC Oneida 120.0787402 4884

ITD Transportation Asset Management Plan 2019
16525 I 84 WBL 262.495 JUNIPER ROAD IC Oneida 120.0787402 4884 16530 I 84 WBL 266.094 JUNIPER ROAD GS 5 Oneida 33.99934383 2142 16535 I 84 EBL 266.110 JUNIPER ROAD GS 5 Oneida 33.99934383 2006 16540 I 84 WBL 266.862 DRAIN Oneida 27.99868766 1232 16545 I 84 EBL 266.887 DRAIN Oneida 30.83989501 1364 16560 I 84 EBL 270.640 COUNTY ROAD GS 6 Oneida 27.99868766 1652 16565 I 84 WBL 270.650 COUNTY ROAD GS 6 Oneida 27.99868766 1708 16670 US 89 008.387 ST CHARLES CR.;S.BRANCH Bear Lake 29.856 1095 16676 US 89 008.762 ST CHARLES CREEK Bear Lake 87.00131234 5237 16685 US 89 019.837 OVID CREEK Bear Lake 32.001 957 16691 US 89 020.402 OVID CREEK Bear Lake 71.00065617 3124 16695 US 89 022.605 BEAR LAKE CANAL Bear Lake 163.0577428 7449 16700 US 89 023.335 BEAR RIVER Bear Lake 128.9370079 5895 16705 US 89 025.135 UPRR;12TH ST.;MONTPELIER Bear Lake 720.144 26136
16708 US 89 030.992 MONTPELIER CK;LOWER NRWS Bear Lake 32.00131234 2163
16709 US 89 031.175 MONTPELIER CK;UPPER NRWS Bear Lake 68.99934383 2719 16711 US 89 033.313 MONTPELIER CREEK Bear Lake 21.001 1529 16726 US 89 041.020 THOMAS FORK CREEK EAST Bear Lake 52.99868766 2120 16731 US 89 043.190 THOMAS FORK CREEK Bear Lake 78.084 3097 16735 I 90 WBL 000.000 SPOKANE RIVER Kootenai 465 20367 16740 I 90 EBL 000.001 SPOKANE RIVER Kootenai 465 25947 16745 I 90 EBL 002.067 S 8505;PLEASANT VIEW IC Kootenai 161.0892388 7020 16750 I 90 WBL 002.068 S 8505;PLEASANT VIEW IC Kootenai 161.0892388 7036 16760 I 90 EB-WB;RMP CD 004.460 BNRR;POST FALLS OP Kootenai 210 35805 16765 I 90 EBL 004.619 I 90B;POST FALLS IC Kootenai 171.0006562 7456 16770 I 90 WBL 004.620 I 90B;POST FALLS IC Kootenai 171.0006562 7473 16785 I 90 EBL 007.116 SH 41;SH 41 IC Kootenai 130 5304 16790 I 90 WBL 007.117 SH 41;SH 41 IC Kootenai 130 6032 16795 I 90 WBL 009.214 HUETTER ROAD GS Kootenai 113.8451444 4651 16800 I 90 EBL 009.215 HUETTER ROAD GS Kootenai 129.9212598 5304 16805 I 90 EBL 010.325 ATLAS ROAD GS Kootenai 96.12860892 3917 16810 I 90 WBL 010.326 ATLAS ROAD GS Kootenai 96.12860892 3917 16815 I 90 EBL 010.921 PEDESTRIAN/BIKE PATH Kootenai 130 5304 16820 I 90 WBL 010.922 PEDESTRIAN/BIKE PATH Kootenai 130 5304 16855 I 90 EBL 013.551 SMA 7335;FIFTEENTH ST.IC Kootenai 103.9993438 4160 16860 I 90 WBL 013.552 SMA 7335;FIFTEENTH ST.IC Kootenai 103.9993438 4160 16865 I 90 EBL 013.975 STC 7325;ELM AVE.GS Kootenai 141.0761155 5640 16870 I 90 WBL 013.976 STC 7325;ELM AVE.GS Kootenai 141.0761155 5640 16875 I 90 EBL 014.323 STC 7405;PENN.AVE.GS Kootenai 136.001 5440 16880 I 90 WBL 014.324 STC 7405;PENN.AVE.GS Kootenai 136.001 5440 16885 I 90 EBL 014.775 SMA 7445;SHERMAN AVE.IC Kootenai 53.99934383 2160 16890 I 90 WBL 014.776 SMA 7445;SHERMAN AVE.IC Kootenai 53.99934383 2160 16894 I 90 015.278 POTLATCH HILL RD. GS Kootenai 237.8608924 19921 16896 I 90 017.650 BENNETT BAY;SUNNYSIDE RD Kootenai 1729.986877 144974 16897 I 90 018.531 TIMOTHY LN;EVERGREEN GS Kootenai 210.9580052 17661 16901 I 90 019.919 BLUE CREEK BAY WEST GS Kootenai 133.9993438 11229 16910 I 90 WBL 020.281 CD'A LAKE;BLUE CREEK BAY Kootenai 1310 53710 16920 I 90 EBL 023.373 WOLF LODGE CREEK Kootenai 89.9 3600 16925 I 90 WBL 023.374 WOLF LODGE CREEK Kootenai 90 3600 16930 I 90 EBL & WBL 024.550 CEDAR CREEK Kootenai 25 2000 16950 I 90 EBL & WBL 025.530 CEDAR CREEK Kootenai 21 1680 16955 I 90 EBL & WBL 025.600 CEDAR CREEK Kootenai 21 1680 17000 I 90 EBL & WBL 031.930 FOURTH OF JULY CREEK Kootenai 22.00131234 3949 17030 I 90 EBL 039.872 COEUR D'ALENE RIVER Kootenai 509 17662 17035 I 90 WBL 039.873 COEUR D'ALENE RIVER Kootenai 509 17662 17040 I 90 EBL 040.073 LATOUR CREEK ROAD IC Kootenai 242.9002625 8456
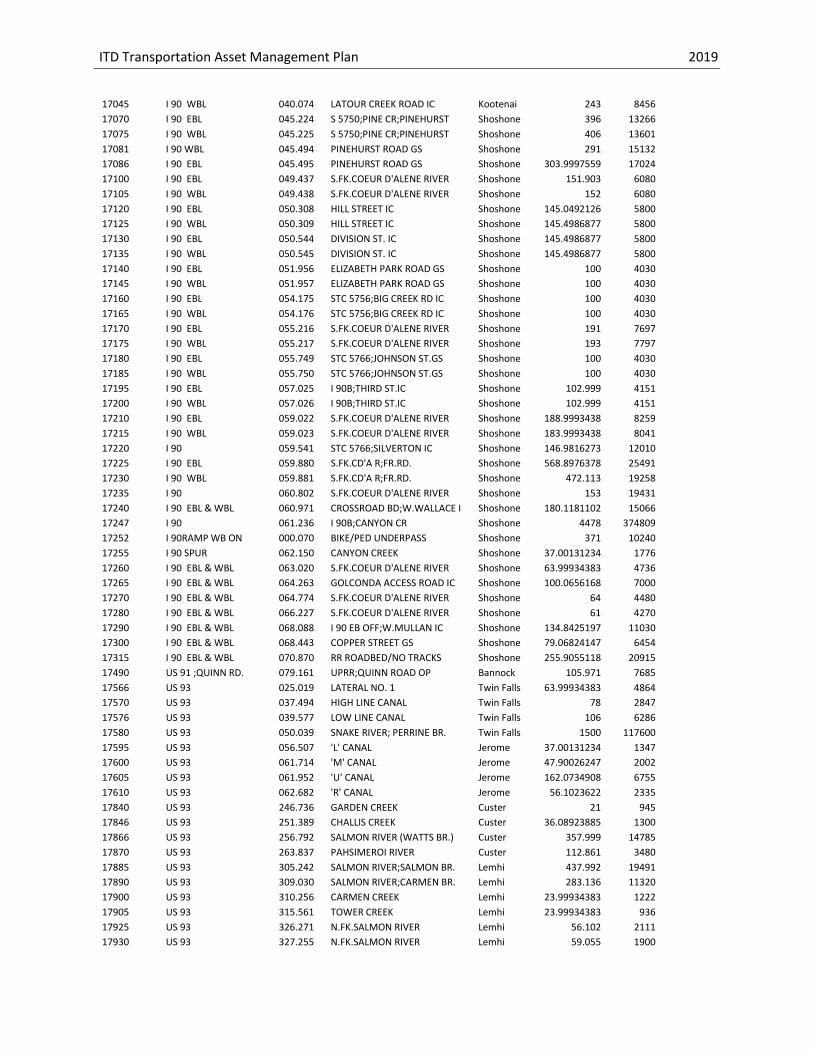
ITD Transportation Asset Management Plan 2019
17045 I 90 WBL 040.074 LATOUR CREEK ROAD IC Kootenai 243 8456 17070 I 90 EBL 045.224 S 5750;PINE CR;PINEHURST Shoshone 396 13266 17075 I 90 WBL 045.225 S 5750;PINE CR;PINEHURST Shoshone 406 13601 17081 I 90 WBL 045.494 PINEHURST ROAD GS Shoshone 291 15132 17086 I 90 EBL 045.495 PINEHURST ROAD GS Shoshone 303.9997559 17024 17100 I 90 EBL 049.437 S.FK.COEUR D'ALENE RIVER Shoshone 151.903 6080 17105 I 90 WBL 049.438 S.FK.COEUR D'ALENE RIVER Shoshone 152 6080 17120 I 90 EBL 050.308 HILL STREET IC Shoshone 145.0492126 5800 17125 I 90 WBL 050.309 HILL STREET IC Shoshone 145.4986877 5800 17130 I 90 EBL 050.544 DIVISION ST. IC Shoshone 145.4986877 5800 17135 I 90 WBL 050.545 DIVISION ST. IC Shoshone 145.4986877 5800 17140 I 90 EBL 051.956 ELIZABETH PARK ROAD GS Shoshone 100 4030 17145 I 90 WBL 051.957 ELIZABETH PARK ROAD GS Shoshone 100 4030 17160 I 90 EBL 054.175 STC 5756;BIG CREEK RD IC Shoshone 100 4030 17165 I 90 WBL 054.176 STC 5756;BIG CREEK RD IC Shoshone 100 4030 17170 I 90 EBL 055.216 S.FK.COEUR D'ALENE RIVER Shoshone 191 7697 17175 I 90 WBL 055.217 S.FK.COEUR D'ALENE RIVER Shoshone 193 7797 17180 I 90 EBL 055.749 STC 5766;JOHNSON ST.GS Shoshone 100 4030 17185 I 90 WBL 055.750 STC 5766;JOHNSON ST.GS Shoshone 100 4030 17195 I 90 EBL 057.025 I 90B;THIRD ST.IC Shoshone 102.999 4151 17200 I 90 WBL 057.026 I 90B;THIRD ST.IC Shoshone 102.999 4151 17210 I 90 EBL 059.022 S.FK.COEUR D'ALENE RIVER Shoshone 188.9993438 8259 17215 I 90 WBL 059.023 S.FK.COEUR D'ALENE RIVER Shoshone 183.9993438 8041 17220 I 90 059.541 STC 5766;SILVERTON IC Shoshone 146.9816273 12010 17225 I 90 EBL 059.880 S.FK.CD'A R;FR.RD. Shoshone 568.8976378 25491 17230 I 90 WBL 059.881 S.FK.CD'A R;FR.RD. Shoshone 472.113 19258 17235 I 90 060.802 S.FK.COEUR D'ALENE RIVER Shoshone 153 19431 17240 I 90 EBL & WBL 060.971 CROSSROAD BD;W.WALLACE I Shoshone 180.1181102 15066 17247 I 90 061.236 I 90B;CANYON CR Shoshone 4478 374809 17252 I 90RAMP WB ON 000.070 BIKE/PED UNDERPASS Shoshone 371 10240 17255 I 90 SPUR 062.150 CANYON CREEK Shoshone 37.00131234 1776 17260 I 90 EBL & WBL 063.020 S.FK.COEUR D'ALENE RIVER Shoshone 63.99934383 4736 17265 I 90 EBL & WBL 064.263 GOLCONDA ACCESS ROAD IC Shoshone 100.0656168 7000 17270 I 90 EBL & WBL 064.774 S.FK.COEUR D'ALENE RIVER Shoshone 64 4480 17280 I 90 EBL & WBL 066.227 S.FK.COEUR D'ALENE RIVER Shoshone 61 4270 17290 I 90 EBL & WBL 068.088 I 90 EB OFF;W.MULLAN IC Shoshone 134.8425197 11030 17300 I 90 EBL & WBL 068.443 COPPER STREET GS Shoshone 79.06824147 6454 17315 I 90 EBL & WBL 070.870 RR ROADBED/NO TRACKS Shoshone 255.9055118 20915 17490 US 91 ;QUINN RD. 079.161 UPRR;QUINN ROAD OP Bannock 105.971 7685 17566 US 93 025.019 LATERAL NO. 1 Twin Falls 63.99934383 4864 17570 US 93 037.494 HIGH LINE CANAL Twin Falls 78 2847 17576 US 93 039.577 LOW LINE CANAL Twin Falls 106 6286 17580 US 93 050.039 SNAKE RIVER; PERRINE BR. Twin Falls 1500 117600 17595 US 93 056.507 'L' CANAL Jerome 37.00131234 1347 17600 US 93 061.714 'M' CANAL Jerome 47.90026247 2002 17605 US 93 061.952 'U' CANAL Jerome 162.0734908 6755 17610 US 93 062.682 'R' CANAL Jerome 56.1023622 2335 17840 US 93 246.736 GARDEN CREEK Custer 21 945 17846 US 93 251.389 CHALLIS CREEK Custer 36.08923885 1300 17866 US 93 256.792 SALMON RIVER (WATTS BR.) Custer 357.999 14785 17870 US 93 263.837 PAHSIMEROI RIVER Custer 112.861 3480 17885 US 93 305.242 SALMON RIVER;SALMON BR. Lemhi 437.992 19491 17890 US 93 309.030 SALMON RIVER;CARMEN BR. Lemhi 283.136 11320 17900 US 93 310.256 CARMEN CREEK Lemhi 23.99934383 1222 17905 US 93 315.561 TOWER CREEK Lemhi 23.99934383 936 17925 US 93 326.271 N.FK.SALMON RIVER Lemhi 56.102 2111 17930 US 93 327.255 N.FK.SALMON RIVER Lemhi 59.055 1900

ITD Transportation Asset Management Plan 2019
17935 US 93 333.728 SHEEP CREEK Lemhi 22.00131234 1696 17950 US 93 083.950 ARCO CANAL Butte 26.001 1305 17955 US 93 085.433 SPRING CREEK Butte 32.152 1155 17965 US 93 089.112 BIG LOST RIVER Butte 63.976 2310 17995 US 93 098.706 BIG LOST RIVER Custer 64.961 2600 18010 US 93 156.558 WARM SPRING CREEK Custer 23 775 18031 US 93 160.026 SALMON RIVER;CHALLIS BR. Custer 306.102 12852 18040 US 95 026.773 'B' LINE CANAL Owyhee 23.99934383 816 18045 US 95 030.373 JUMP CREEK Owyhee 47.90026247 1906 18050 US 95 034.667 SNAKE RIVER;HOMEDALE BR. Owyhee 687.007874 28373 18055 US 95 038.650 GOLDEN GATE CANAL Canyon 22 1760 18060 US 95 042.713 RIVERSIDE CANAL Canyon 55.11811024 1986 18065 US 95 043.837 BOISE RIVER Canyon 424.8687664 13898 18071 US 95 045.052 SAND HOLLOW CREEK Canyon 124 5208 18076 US 95 045.205 US20;UPRR;US 20-95 IC Canyon 282 11844 18081 US 95 049.792 FARMERS COOP CANAL Canyon 20.99737533 2260 18095 US 95 060.819 I 84 EB-WB;US 95 IC Payette 315.945 18549 18110 US 95 066.184 PAYETTE RIVER Payette 483.9238845 40656
18121 US 95 081.014 ROBERTSON SLOUGH Washing-ton 46 1564
18126 US 95 081.516 WEISER RIVER Washing-ton 347 19189
18133 US 95 082.204 MONROE CREEK Washing-ton 42.97900262 2425
18134 US 95 082.648 GALLOWAY CANAL Washing-ton 26.001 2304
18141 US 95 088.325 MONROE CREEK Washing-ton 64.961 2581
18146 US 95 093.557 MANNS CREEK Washing-ton 96.001 3965
18150 US 95 103.591 SAGE CREEK Washing-ton 35.10498688 1264
18155 US 95 104.123 DRY CREEK Washing-ton 69.88188976 2527
18161 US 95 106.518 KEITHLY CREEK Washing-ton 104.003 4129
18165 US 95 112.550 PINE CREEK(CAMBRIDGE BR) Washing-ton 37.07349081 1336
18170 US 95 112.850 SPRING CREEK Washing-ton 23.99934383 1056
18175 US 95 113.597 RUSH CREEK Washing-ton 32.00131234 1174
18180 US 95 113.776 WEISER RIVER Washing-ton 160.1049869 5248
18200 US 95 129.700 M.FK.WEISER RIVER Adams 160.1049869 6368 18206 US 95 132.692 COTTONWOOD CREEK Adams 57 2120 18216 US 95 133.304 LESTER CREEK Adams 24 1051 18230 US 95 145.799 WEISER RIVER Adams 275.9186352 8556 18236 US 95 154.079 WEISER RIVER;TAMARACK BR Adams 62 2747 18241 US 95 157.456 MUD CREEK Adams 65 2880 18245 US 95 160.233 LITTLE SALMON RIVER Adams 53.1496063 1675 18250 US 95 161.593 W.FK.GOOSE CREEK Adams 44.94750656 1787 18255 US 95 162.651 E.FK.GOOSE CREEK Adams 64.96062992 2581 18260 US 95 171.914 LITTLE SALMON RIVER Idaho 167.9790026 6670 18265 US 95 174.111 LITTLE SALMON RIVER Adams 77.09973753 2195 18271 US 95 176.554 LITTLE SALMON RIVER Idaho 201 8804 18276 US 95 178.295 BOULDER CREEK Adams 115 4830 18281 US 95 180.003 FALL CREEK Adams 40 1640 18285 US 95 182.370 LITTLE SALMON RIVER Adams 219.9998779 7172 18295 US 95 185.402 LITTLE SALMON RIVER Idaho 202.0013123 6585 18300 US 95 186.056 LITTLE SALMON RIVER Idaho 202.001 6585
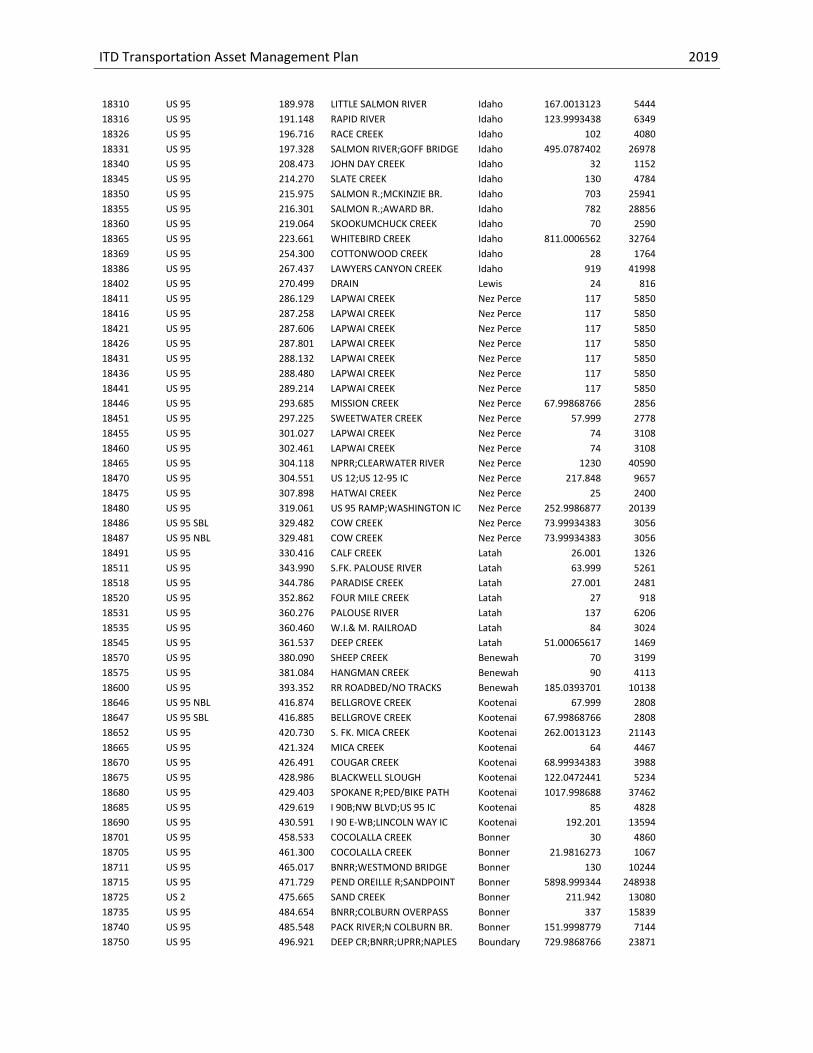
ITD Transportation Asset Management Plan 2019
18310 US 95 189.978 LITTLE SALMON RIVER Idaho 167.0013123 5444 18316 US 95 191.148 RAPID RIVER Idaho 123.9993438 6349 18326 US 95 196.716 RACE CREEK Idaho 102 4080 18331 US 95 197.328 SALMON RIVER;GOFF BRIDGE Idaho 495.0787402 26978 18340 US 95 208.473 JOHN DAY CREEK Idaho 32 1152 18345 US 95 214.270 SLATE CREEK Idaho 130 4784 18350 US 95 215.975 SALMON R.;MCKINZIE BR. Idaho 703 25941 18355 US 95 216.301 SALMON R.;AWARD BR. Idaho 782 28856 18360 US 95 219.064 SKOOKUMCHUCK CREEK Idaho 70 2590 18365 US 95 223.661 WHITEBIRD CREEK Idaho 811.0006562 32764 18369 US 95 254.300 COTTONWOOD CREEK Idaho 28 1764 18386 US 95 267.437 LAWYERS CANYON CREEK Idaho 919 41998 18402 US 95 270.499 DRAIN Lewis 24 816 18411 US 95 286.129 LAPWAI CREEK Nez Perce 117 5850 18416 US 95 287.258 LAPWAI CREEK Nez Perce 117 5850 18421 US 95 287.606 LAPWAI CREEK Nez Perce 117 5850 18426 US 95 287.801 LAPWAI CREEK Nez Perce 117 5850 18431 US 95 288.132 LAPWAI CREEK Nez Perce 117 5850 18436 US 95 288.480 LAPWAI CREEK Nez Perce 117 5850 18441 US 95 289.214 LAPWAI CREEK Nez Perce 117 5850 18446 US 95 293.685 MISSION CREEK Nez Perce 67.99868766 2856 18451 US 95 297.225 SWEETWATER CREEK Nez Perce 57.999 2778 18455 US 95 301.027 LAPWAI CREEK Nez Perce 74 3108 18460 US 95 302.461 LAPWAI CREEK Nez Perce 74 3108 18465 US 95 304.118 NPRR;CLEARWATER RIVER Nez Perce 1230 40590 18470 US 95 304.551 US 12;US 12-95 IC Nez Perce 217.848 9657 18475 US 95 307.898 HATWAI CREEK Nez Perce 25 2400 18480 US 95 319.061 US 95 RAMP;WASHINGTON IC Nez Perce 252.9986877 20139 18486 US 95 SBL 329.482 COW CREEK Nez Perce 73.99934383 3056 18487 US 95 NBL 329.481 COW CREEK Nez Perce 73.99934383 3056 18491 US 95 330.416 CALF CREEK Latah 26.001 1326 18511 US 95 343.990 S.FK. PALOUSE RIVER Latah 63.999 5261 18518 US 95 344.786 PARADISE CREEK Latah 27.001 2481 18520 US 95 352.862 FOUR MILE CREEK Latah 27 918 18531 US 95 360.276 PALOUSE RIVER Latah 137 6206 18535 US 95 360.460 W.I.& M. RAILROAD Latah 84 3024 18545 US 95 361.537 DEEP CREEK Latah 51.00065617 1469 18570 US 95 380.090 SHEEP CREEK Benewah 70 3199 18575 US 95 381.084 HANGMAN CREEK Benewah 90 4113 18600 US 95 393.352 RR ROADBED/NO TRACKS Benewah 185.0393701 10138 18646 US 95 NBL 416.874 BELLGROVE CREEK Kootenai 67.999 2808 18647 US 95 SBL 416.885 BELLGROVE CREEK Kootenai 67.99868766 2808 18652 US 95 420.730 S. FK. MICA CREEK Kootenai 262.0013123 21143 18665 US 95 421.324 MICA CREEK Kootenai 64 4467 18670 US 95 426.491 COUGAR CREEK Kootenai 68.99934383 3988 18675 US 95 428.986 BLACKWELL SLOUGH Kootenai 122.0472441 5234 18680 US 95 429.403 SPOKANE R;PED/BIKE PATH Kootenai 1017.998688 37462 18685 US 95 429.619 I 90B;NW BLVD;US 95 IC Kootenai 85 4828 18690 US 95 430.591 I 90 E-WB;LINCOLN WAY IC Kootenai 192.201 13594 18701 US 95 458.533 COCOLALLA CREEK Bonner 30 4860 18705 US 95 461.300 COCOLALLA CREEK Bonner 21.9816273 1067 18711 US 95 465.017 BNRR;WESTMOND BRIDGE Bonner 130 10244 18715 US 95 471.729 PEND OREILLE R;SANDPOINT Bonner 5898.999344 248938 18725 US 2 475.665 SAND CREEK Bonner 211.942 13080 18735 US 95 484.654 BNRR;COLBURN OVERPASS Bonner 337 15839 18740 US 95 485.548 PACK RIVER;N COLBURN BR. Bonner 151.9998779 7144 18750 US 95 496.921 DEEP CR;BNRR;UPRR;NAPLES Boundary 729.9868766 23871

ITD Transportation Asset Management Plan 2019
18755 US 95 497.343 TRAIL CREEK Boundary 22.99868766 1311 18765 US 95 507.257 BNRR;ARIZONA ST. Boundary 381.8897638 27810 18770 US 95 507.565 KOOTENAI R.&RR;BON FERRY Boundary 1379.92126 96462 18772 US 95 522.405 WILDLIFE UNDERPASS Boundary 23 2972 18773 US 95 522.883 WILDLIFE UNDERPASS Boundary 23 2972 18774 US 95 523.682 WILDLIFE UNDERPASS Boundary 28 4771 18791 US 95 532.315 ROUND PRAIRIE CREEK Boundary 53 2332 18794 US 95 537.474 UPRR;S. EASTPORT OP Boundary 122 5039 18796 US 95 537.686 MOYIE R;LOWER EASTPORT Boundary 282.001 11647 18801 US 95 538.473 MOYIE R; UPPER EASTPORT Boundary 250 16125 18946 I 184 EBL 000.190 I 84 WBL Ada 155 46857 18956 I 184B EBL & WBL 001.054 S7403;UPRR;FRANKLIN IC Ada 427.001 58926 18966 I 184B EBL & WBL 001.310 S7073;CANAL;COLE RD Ada 236.001 26904 18995 I 84B 003.427 SETTLERS CANAL Ada 44.99996948 9360 18996 I 184 EBL CONNECTR 003.560 US 20-26;BOISE RV SLOUGH Ada 622.0472441 34521 18997 I 184 WBL CONNECTR 003.561 US 20-26;BOISE RV SLOUGH Ada 715 39683
19710 SMA 8213;MIDDLE-TON 000.658 I 84;MIDDLETON RD.GS Canyon 344.16 11283
19766 STP 9183;TEN MILE 109.941 I 84; TEN MILE IC Ada 188.9993438 29805 20980 STP 7786;SALEM RD 001.520 US 20;SALEM RD IC Madison 268.045 14552 21321 STP8973;ORCHARD ST 000.133 I 84 EB-WB;ORCHARD ST IC Ada 205 26138 21325 STP7343;ORCHARD ST 003.089 I 184B;ORCHARD ST GS Ada 143.045 11025 21452 STP 7343;MAIN ST. 077.646 US 20-26 CHINDEN BLVD Ada 166.995 9185 21591 NHS 7433;VISTA AVE 000.012 I 84 EB-WB;VISTA IC Ada 182 35927 21614 I 15B;SUNNYSIDE RD 103.850 I 15;SUNNYSIDE RD IC Bonneville 327.001 31130 21616 I 15B;SUNNYSIDE RD 104.246 SIDEHILL CANAL Bonneville 63.99934383 6592 21618 I 15B;SUNNYSIDE RD 104.807 SNAKE RIVER Bonneville 737.0013123 73184
21661 OVERLAND/COLE ROAD 005.926 I 84;COLE/OVERLAND IC Ada 216.0006562 101974
21675 SMA7553;FEDERAL WY 052.078 US 20 26;FEDERAL WAY IC Ada 338.9107612 24679
21820 STP 7983;USTICK RD 003.285 I 84 EB-WB;USTICK RD GS Canyon 354.9868766 10118 21882 STP8393;FRANKLIN B 000.853 I 84;FRANKLIN BLVD IC Canyon 224.9998779 24863 26280 SH 55;EAGLE ROAD 036.319 I 84 EB-WB;EAGLE RD IC Ada 268 24013 33145 US 95 281.820 LAPWAI CREEK Lewis 22 792 33150 US 95 282.610 LAPWAI CREEK Lewis 37.99868766 1482 33155 US 95 282.750 LAPWAI CREEK Lewis 23.99934383 914 33160 US 95 283.135 E.FK. LAPWAI CREEK Lewis 50.9 1938 33165 US 95 285.789 ROCK CREEK Nez Perce 30.83989501 1150 33340 US 93 341.350 N. FORK SALMON RIVER Lemhi 22.96587927 741 33345 US 93 341.400 N. FORK SALMON RIVER Lemhi 23.95013123 773 33350 US 93 342.292 N. FORK SALMON RIVER Lemhi 23.95013123 773 33500 US 95 NBL 407.287 N.FK. ROCK CREEK Kootenai 346.0006562 18373 33505 US 95 SBL 407.286 N.FK. ROCK CREEK Kootenai 346.0006562 18373 33510 US 95 NBL 409.370 UPRR;BITTER ROAD Kootenai 219.9998779 9130 33515 US 95 SBL 409.379 UPRR;BITTER ROAD Kootenai 219.9998779 9130 33540 US 95 NBL 415.497 FIGHTING CREEK Kootenai 63.99934383 2643 33545 US 95 SBL 415.498 FIGHTING CREEK Kootenai 63.99934383 3398 33550 US 95 NBL 411.604 LAKE CREEK;NESS ROAD Kootenai 772 32038 33555 US 95 SBL 411.605 LAKE CREEK;NESS ROAD Kootenai 781 32412 33565 US 95 443.983 WILDLIFE CROSSING Kootenai 25 3130 33725 US 95 475.265 US 95;SH 200 IC Bonner 317.9986877 18730 33760 US 95 NBL 449.052 US 95/SH 54 IC Kootenai 192 8448 33765 US 95 SBL 449.050 US 95/SH 54 IC Kootenai 192 8448 34540 I 15 NBL 066.175 SMA 5697;SOUTH VALLEY RD Bannock 184 8464 34545 I 15 SBL 066.176 SMA 5697;SOUTH VALLEY RD Bannock 184 8464 34690 US 20 EBL 328.582 THORTON IC Madison 98 4361 34695 US 20 WBL 328.583 THORTON IC Madison 98 4361

ITD Transportation Asset Management Plan 2019

ITD Transportation Asset Management Plan 2019
Appendix C - Declared Emergency Events 1997-2019

ITD Transportation Asset Management Plan 2019
Idaho Flooding (DR-1177) Incident period: March 14, 1997 to June 30, 1997 Major Disaster Declaration declared on June 13, 1997
Idaho Wildfires (DR-1341) Incident period: July 27, 2000 to September 26, 2000 Major Disaster Declaration declared on September 01, 2000
Idaho Heavy Rains and Flooding (DR-1592) Incident period: May 06, 2005 to May 20, 2005 Major Disaster Declaration declared on July 06, 2005
Idaho Severe Storms and Flooding (DR-1630) Incident period: December 30, 2005 to January 04, 2006 Major Disaster Declaration declared on February 27, 2006
Idaho Flooding (DR-1781) Incident period: May 15, 2008 to June 09, 2008 Major Disaster Declaration declared on July 31, 2008
Idaho Severe Storms and Flooding (DR-1927) Incident period: June 02, 2010 to June 10, 2010 Major Disaster Declaration declared on July 27, 2010
Idaho Flooding, Landslides, and Mudslides (DR-1987) Incident period: March 31, 2011 to April 11, 2011 Major Disaster Declaration declared on May 20, 2011
Idaho Severe Storm and Straight-line Winds (DR-4246) Incident period: November 17, 2015 Major Disaster Declaration declared on December 23, 2015
Idaho Severe Winter Storms (DR-4252) Incident period: December 16, 2015 to December 27, 2015 Major Disaster Declaration declared on February 01, 2016
Idaho Severe Winter Storms and Flooding (DR-4310) Incident period: February 05, 2017 to February 27, 2017 Major Disaster Declaration declared on April 21, 2017
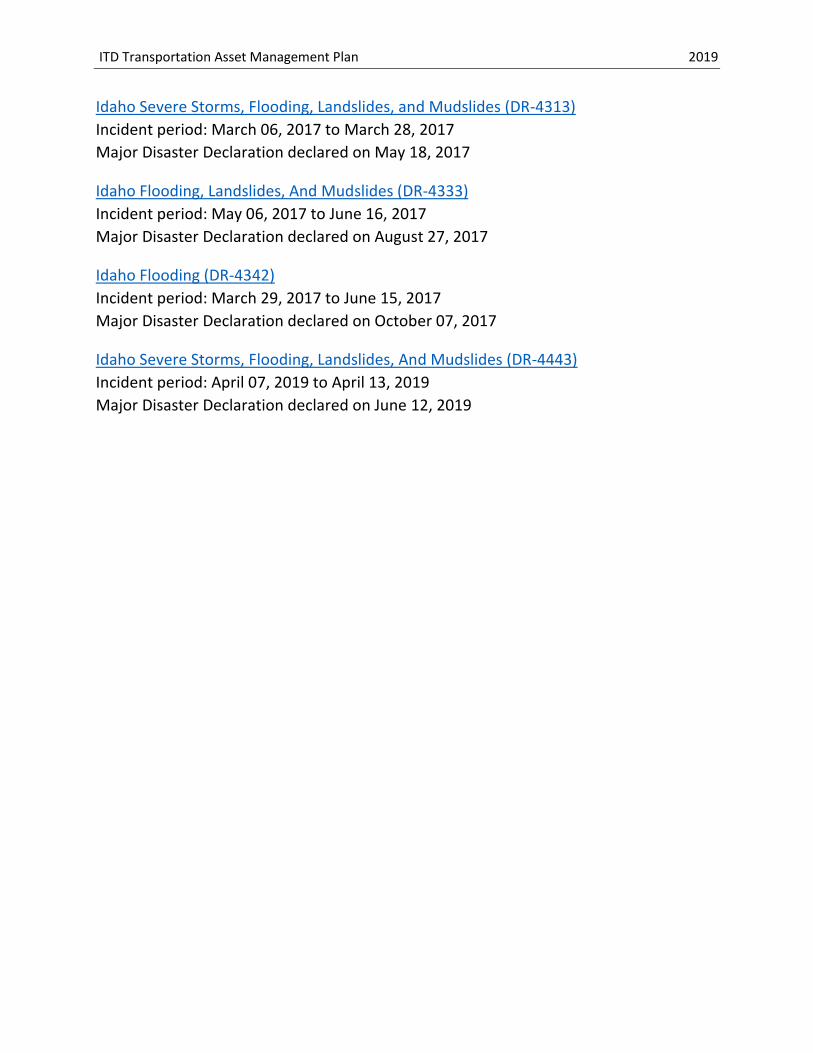
ITD Transportation Asset Management Plan 2019
Idaho Severe Storms, Flooding, Landslides, and Mudslides (DR-4313) Incident period: March 06, 2017 to March 28, 2017 Major Disaster Declaration declared on May 18, 2017
Idaho Flooding, Landslides, And Mudslides (DR-4333) Incident period: May 06, 2017 to June 16, 2017 Major Disaster Declaration declared on August 27, 2017
Idaho Flooding (DR-4342) Incident period: March 29, 2017 to June 15, 2017 Major Disaster Declaration declared on October 07, 2017
Idaho Severe Storms, Flooding, Landslides, And Mudslides (DR-4443) Incident period: April 07, 2019 to April 13, 2019 Major Disaster Declaration declared on June 12, 2019

ITD Transportation Asset Management Plan 2019