transition cow management report summary · the transition cow management report (tcmr) is a...
TRANSCRIPT
All trademarks are the property of Zoetis Inc., and its affiliates and/or its licensors. All other trademarks are the property of their respective owners. ©2013 Zoetis Inc. All rights reserved. GDR12094
TRANSITION COW MANAGEMENT REPORT SUMMARY
dairy wellness makes a difference™

TheTransitionCowManagementReport(TCMR)isamanagementtooltohelpyoubenchmarktheeffectivenessofyourtransitioncowprogramsandmonitorchangesfrommonthtomonth.Theemphasisisontheherd,nottheindividualcow.Thereportisfocusedonfourobjectivetestsofherdperformance:
• TransitionCowIndex®-Daily(TCI-D®)
• Firsttestfat%toprotein%ratio(FPR)
• Linearscoreatfirsttestdate
• Percentageoffreshcowssold/diedlessthan60daysinmilk(DIM)
ThesefourpartsoftheTCMRallowyoutoidentifythestrengthsandweaknessesofyourtransitionmanagementandhelpyoudecidewhetherchangesinmanagementareproducingtheresultsthatyouwant.
Transition Cow Index® and TCI-D® U.S. Patent #7866691 Wisconsin Alumni Research Foundation
-20
-15
-10
-5
0
5
10
15
T rans ition C ow Index® (T C I-D® ) by F res h Month
Jul-11 Aug-11 Sep-11 Oct-11 Nov-11 Dec-11 Jan-12 Feb-12 Mar-12 Apr-12 May-12 Jun-12
75th Pct.
50th Pct.
25th Pct.
A
F res h Month
*
E P ercent F P R >
C Number of C ows (actual number by month)
F res h Month
D T C I
1s t Lact C alving
2nd+ Lact C alving
T otal
Average T C I-D
P ercent W ith T C I-D
1s t Lact
2nd+ Lact
May-11 J un-11 J ul-11 Aug-11 S ep-11 Oct-11 Nov-11 Dec-11 J an-12 F eb-12 Mar-12 Apr-12 Annual
0
2
2
7.4
100%
0%
50%
Total
Average
Average
Avg#/Mo
2
3
5
1.7
80%
0%
20%
0
6
6
0.8
73%
0%
33%
0
4
4
-3.7
69%
0%
40%
1
6
7
-5.1
75%
0%
50%
3
4
7
-7.1
86%
50%
67%
0
5
5
-4.3
93%
50%
64%
2
12
14
-5
95%
40%
76%
3
8
11
-1
84%
20%
73%
8
1
9
-2.1
81%
23%
78%
4
5
9
0.2
79%
27%
64%
2
2
4
-0.7
88%
21%
43%
2
5
8
-4.7
85%
22%
55%
27
72
99
May-12 J un-12
4
5
9
-2.2
92%
10%
36%
0
14
14
-7.1
86%
0%
28%
* Averages for the last month include cows that have calved since the 1st day of the current month.
Goal is <40% of cows (1st or 2+ Lact) with a first test fat/protein ratio >1.4
*
Cow Populations - TCI-D - Fat/Protein Ratio Using 3 Month Averages
0.8
1.0
1.2
1.4
1.6
1.8
2.0
2.2
2.4
Jul-11 Aug-11 Sep-11 Oct-11 Nov-11 Dec-11 Jan-12 Feb-12 Mar-12 Apr-12 May-12 Jun-12
R atio of F irs t T es t F at% to P rotein% (F P R )B 75th Pct.
50th Pct.
25th Pct.by F res h Month
F res h Month 1st Lact 2nd+ Lact
*
8/31/2012 04:39 P M © 2012 Coo perative Resources International
-D
1.4
Transition Cow Index-Daily by fresh month• TCI-Dcomparesyourherd’sfreshcowperformancetoanindustrystandardandallowsforamonth-to-monthcomparisonfor14months.TCI-Disalsoafreshcowhealthmonitor.Herdswithhealthycowsbefore,duringandaftercalvingwillhavehigherTCI-Dvaluesthanherdswithproblemsintheseareas.
• TheTCI-Dgraph(BlockA)providesthe25th,50thand75thpercentilerangebymonthofcalving.Lookforchangesintrendsforboththe25thand75thpercentiles.
• Cowsaregroupedineithertwo-orthree-monthrollingaveragesinmediumandsmallherds.
• Asmallerrange(shorterbar)betweenthe25thand75thpercentilemeansthatTCI-Dvaluesaremoreconsistentamongthemajorityofcowscalvingduringaparticularmonth.
Ratio of first test fat% to protein%TheFPRgraph(BlockB)showstheratiobetweenaveragetestdayfat%andprotein%brokenoutbylactationgroup.Thegraphispresentedshowingthe25th,50thand75thpercentile.Valuesabovethebenchmarkof1.4areconsideredhighandmaypointtoketosisinfreshcows.
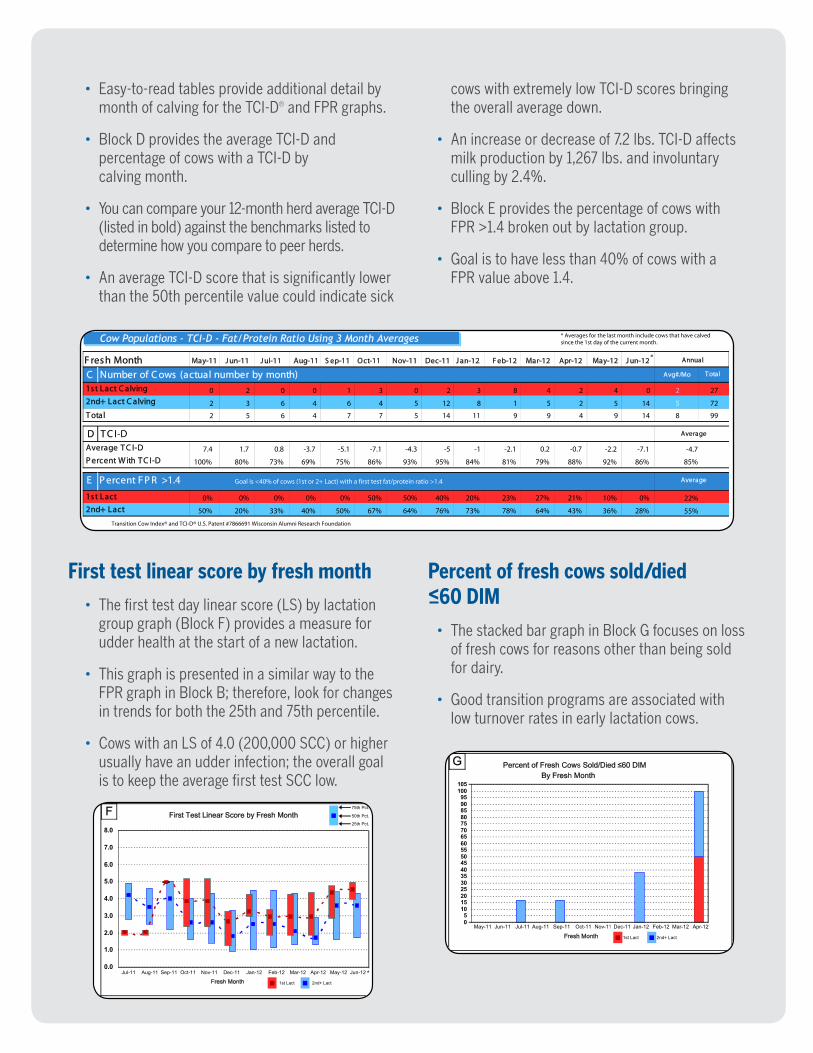
First test linear score by fresh month
• Thefirsttestdaylinearscore(LS)bylactationgroupgraph(BlockF)providesameasureforudderhealthatthestartofanewlactation.
• ThisgraphispresentedinasimilarwaytotheFPRgraphinBlockB;therefore,lookforchangesintrendsforboththe25thand75thpercentile.
• CowswithanLSof4.0(200,000SCC)orhigherusuallyhaveanudderinfection;theoverallgoalistokeeptheaveragefirsttestSCClow.
Percent of fresh cows sold/died <60 DIM
• ThestackedbargraphinBlockGfocusesonlossoffreshcowsforreasonsotherthanbeingsoldfordairy.
• Goodtransitionprogramsareassociatedwithlowturnoverratesinearlylactationcows.
Transition Cow Index® and TCI-D® U.S. Patent #7866691 Wisconsin Alumni Research Foundation
-20
-15
-10
-5
0
5
10
15
T rans ition C ow Index® (T C I-D® ) by F res h Month
Jul-11 Aug-11 Sep-11 Oct-11 Nov-11 Dec-11 Jan-12 Feb-12 Mar-12 Apr-12 May-12 Jun-12
75th Pct.
50th Pct.
25th Pct.
A
F res h Month
*
E P ercent F P R >
C Number of C ows (actual number by month)
F res h Month
D T C I
1s t Lact C alving
2nd+ Lact C alving
T otal
Average T C I-D
P ercent W ith T C I-D
1s t Lact
2nd+ Lact
May-11 J un-11 J ul-11 Aug-11 S ep-11 Oct-11 Nov-11 Dec-11 J an-12 F eb-12 Mar-12 Apr-12 Annual
0
2
2
7.4
100%
0%
50%
Total
Average
Average
Avg#/Mo
2
3
5
1.7
80%
0%
20%
0
6
6
0.8
73%
0%
33%
0
4
4
-3.7
69%
0%
40%
1
6
7
-5.1
75%
0%
50%
3
4
7
-7.1
86%
50%
67%
0
5
5
-4.3
93%
50%
64%
2
12
14
-5
95%
40%
76%
3
8
11
-1
84%
20%
73%
8
1
9
-2.1
81%
23%
78%
4
5
9
0.2
79%
27%
64%
2
2
4
-0.7
88%
21%
43%
2
5
8
-4.7
85%
22%
55%
27
72
99
May-12 J un-12
4
5
9
-2.2
92%
10%
36%
0
14
14
-7.1
86%
0%
28%
* Averages for the last month include cows that have calved since the 1st day of the current month.
Goal is <40% of cows (1st or 2+ Lact) with a first test fat/protein ratio >1.4
*
Cow Populations - TCI-D - Fat/Protein Ratio Using 3 Month Averages
0.8
1.0
1.2
1.4
1.6
1.8
2.0
2.2
2.4
Jul-11 Aug-11 Sep-11 Oct-11 Nov-11 Dec-11 Jan-12 Feb-12 Mar-12 Apr-12 May-12 Jun-12
R atio of F irs t T es t F at% to P rotein% (F P R )B 75th Pct.
50th Pct.
25th Pct.by F res h Month
F res h Month 1st Lact 2nd+ Lact
*
8/31/2012 04:39 P M © 2012 Coo perative Resources International
-D
1.4
H New Infections and Dry Cures
I Number of Sold or Died Events ≤ 06 DIM (actual number by month)
1st Lact New Infections2nd+ Lact New InfectionsDry Cures
1st Lact Sold1st Lact Died2nd+ Lact Sold2nd+ Lact Died
0%
0%50%
0
0
0
0
Total Pct
Average
0%
33%50%
0
0
0
0
0%
0%0%
0
0
1
0
0%
33%0%
0
0
0
0
100%
0%25%
0
0
1
0
33%
0%67%
0
0
0
0
0%
0%50%
0
0
0
0
50%
33%60%
0
0
0
0
67%
40%100%
0
0
2
1
38%
0%100%
0
0
0
0
50%
0%50%
0
0
0
0
100%
100%0%
0
1
1
0
0%4%9%
0
1
5
1
56%18%47%
2%
Sold & Died: Died:8% 2%** These numbers may increase because cows fresh in the last two months have not yet reached 60 DIM. The total cows and percentages are calculated only for cows that calved 2 to 14 months ago and are now >60 DIM.1
11
**
**
**
**
**
**
**
**
Fresh Month May-11 Jun-11 Jul-11 Aug-11 Sep-11 Oct-11 Nov-11 Dec-11 Jan-12 Feb-12 Mar-12 Apr-12 AnnualMay-12 Jun-12
* Averages for the last month include cows that have calved since the first day of the current month.
75%
20%25%
0
0
0
0
0%
17%40%
0
0
1
0
*
Data in Block I do not include animals sold for dairy
Industry benchmarks: ≥ 80th percentile is ≤ 4%; average is 8%; ≤ 20th percentile is ≥ 11 J Turnover Rate ≤ 60 DIM
Infections & Cures, Sold or Died and Turnover ≤60 DIM Using 3 Month Averages
0.0
1.0
2.0
3.0
4.0
5.0
6.0
7.0
8.0
Jul-11 Aug-11 Sep-11 Oct-11 Nov-11 Dec-11 Jan-12 Feb-12 Mar-12 Apr-12 May-12 Jun-12
First Test Linear Score by Fresh MonthF 75th Pct.
50th Pct.
25th Pct.
Fresh Month 1st Lact 2nd+ Lact
*05
101520253035404550556065707580859095
100105
May-11 Jun-11 Jul-11 Aug-11 Sep-11 Oct-11 Nov-11 Dec-11 Jan-12 Feb-12 Mar-12 Apr-12
Percent of Fresh Cows Sold/Died ≤60 DIM GBy Fresh Month
Fresh Month 1st Lact 2nd+ Lact
8/31/2012 04:39 PM © 2012 Cooperative Resources International
• Easy-to-readtablesprovideadditionaldetailbymonthofcalvingfortheTCI-D®andFPRgraphs.
• BlockDprovidestheaverageTCI-DandpercentageofcowswithaTCI-Dbycalvingmonth.
• Youcancompareyour12-monthherdaverageTCI-D(listedinbold)againstthebenchmarkslistedtodeterminehowyoucomparetopeerherds.
• AnaverageTCI-Dscorethatissignificantlylowerthanthe50thpercentilevaluecouldindicatesick
cowswithextremelylowTCI-Dscoresbringingtheoverallaveragedown.
• Anincreaseordecreaseof7.2lbs.TCI-Daffectsmilkproductionby1,267lbs.andinvoluntarycullingby2.4%.
• BlockEprovidesthepercentageofcowswithFPR>1.4brokenoutbylactationgroup.
• Goalistohavelessthan40%ofcowswithaFPRvalueabove1.4.
H New Infections and Dry Cures
I Number of Sold or Died Events ≤ 06 DIM (actual number by month)
1st Lact New Infections2nd+ Lact New InfectionsDry Cures
1st Lact Sold1st Lact Died2nd+ Lact Sold2nd+ Lact Died
0%
0%50%
0
0
0
0
Total Pct
Average
0%
33%50%
0
0
0
0
0%
0%0%
0
0
1
0
0%
33%0%
0
0
0
0
100%
0%25%
0
0
1
0
33%
0%67%
0
0
0
0
0%
0%50%
0
0
0
0
50%
33%60%
0
0
0
0
67%
40%100%
0
0
2
1
38%
0%100%
0
0
0
0
50%
0%50%
0
0
0
0
100%
100%0%
0
1
1
0
0%4%9%
0
1
5
1
56%18%47%
2%
Sold & Died: Died:8% 2%** These numbers may increase because cows fresh in the last two months have not yet reached 60 DIM. The total cows and percentages are calculated only for cows that calved 2 to 14 months ago and are now >60 DIM.1
11
**
**
**
**
**
**
**
**
Fresh Month May-11 Jun-11 Jul-11 Aug-11 Sep-11 Oct-11 Nov-11 Dec-11 Jan-12 Feb-12 Mar-12 Apr-12 AnnualMay-12 Jun-12
* Averages for the last month include cows that have calved since the first day of the current month.
75%
20%25%
0
0
0
0
0%
17%40%
0
0
1
0
*
Data in Block I do not include animals sold for dairy
Industry benchmarks: ≥ 80th percentile is ≤ 4%; average is 8%; ≤ 20th percentile is ≥ 11 J Turnover Rate ≤ 60 DIM
Infections & Cures, Sold or Died and Turnover ≤60 DIM Using 3 Month Averages
0.0
1.0
2.0
3.0
4.0
5.0
6.0
7.0
8.0
Jul-11 Aug-11 Sep-11 Oct-11 Nov-11 Dec-11 Jan-12 Feb-12 Mar-12 Apr-12 May-12 Jun-12
First Test Linear Score by Fresh MonthF 75th Pct.
50th Pct.
25th Pct.
Fresh Month 1st Lact 2nd+ Lact
*05
101520253035404550556065707580859095
100105
May-11 Jun-11 Jul-11 Aug-11 Sep-11 Oct-11 Nov-11 Dec-11 Jan-12 Feb-12 Mar-12 Apr-12
Percent of Fresh Cows Sold/Died ≤60 DIM GBy Fresh Month
Fresh Month 1st Lact 2nd+ Lact
8/31/2012 04:39 PM © 2012 Cooperative Resources International
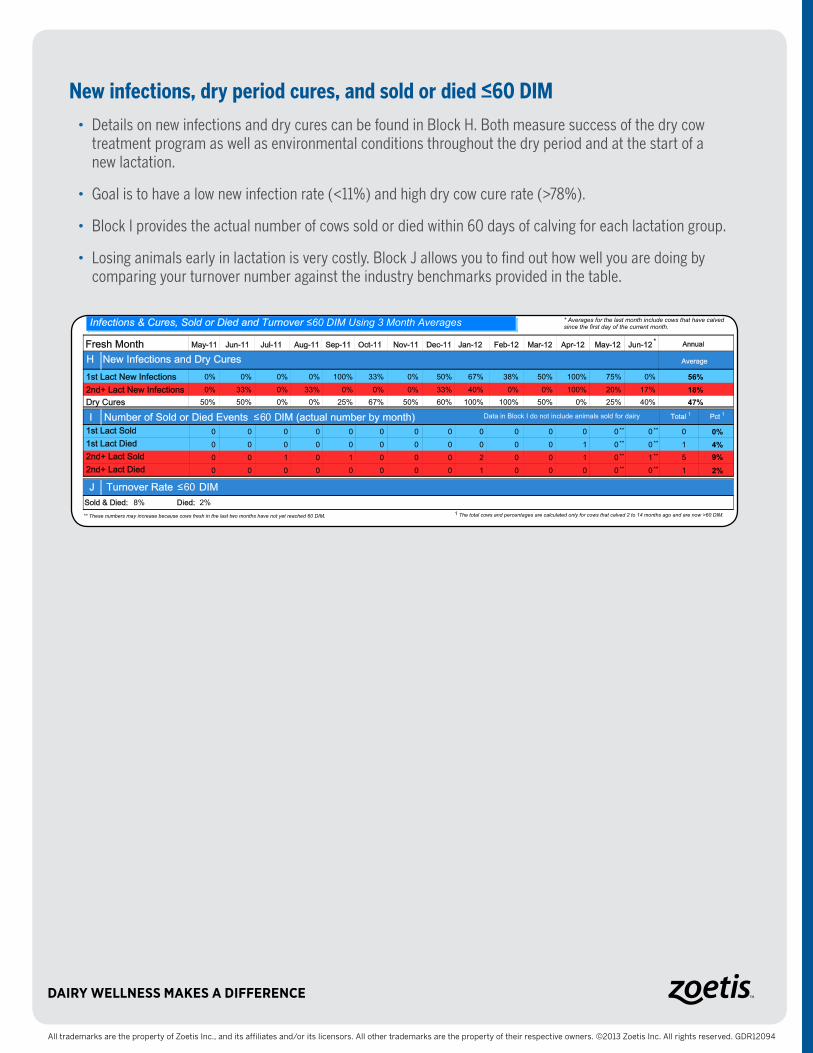
New infections, dry period cures, and sold or died <60 DIM
• DetailsonnewinfectionsanddrycurescanbefoundinBlockH.Bothmeasuresuccessofthedrycowtreatmentprogramaswellasenvironmentalconditionsthroughoutthedryperiodandatthestartofanewlactation.
• Goalistohavealownewinfectionrate(<11%)andhighdrycowcurerate(>78%).
• BlockIprovidestheactualnumberofcowssoldordiedwithin60daysofcalvingforeachlactationgroup.
• Losinganimalsearlyinlactationisverycostly.BlockJallowsyoutofindouthowwellyouaredoingbycomparingyourturnovernumberagainsttheindustrybenchmarksprovidedinthetable.
All trademarks are the property of Zoetis Inc., and its affiliates and/or its licensors. All other trademarks are the property of their respective owners. ©2013 Zoetis Inc. All rights reserved. GDR12094