transformer insulating oil characteristic changes observed using accelerated degradation in...
TRANSCRIPT
M. Kohtoh et al.: Transformer Insulating Oil Characteristic Changes Observed Using Accelerated Degradation
1070-9878/10/$25.00 © 2010 IEEE
808
Transformer Insulating Oil Characteristic Changes Observed Using Accelerated Degradation in Consideration
of Field Transformer Conditions
Masanori Kohtoh, Genyo Ueta, Shigemitsu Okabe Tokyo Electric Power Company
4-1, Egasaki-cho, Tsurumi-ku, Yokohama, Kanagawa, 230-8510, Japan
and Tsuyoshi Amimoto Mitsubishi Electric Corporation
651, Tenwa, Ako-city, Hyogo, 678-0256, Japan
ABSTRACT To ensure soundness of highly aged transformers in their operations, it is important to identify how aging influences insulating oil in these transformers. The characteristics of insulating oil are roughly classified into electrical, physical, and chemical characteristics. In the past research on insulating oil in transformers, some of the characteristics showed a downward trend with increasing age. Among the electrical characteristics, the volume resistivity and the dielectric loss tangent showed a downward trend with increasing age, which is likely to reflect degradation that accompanies aging. The analysis of insulating oil components found some components that increased with age, which may contribute to degrading electrical characteristics of insulating oil. This study on field transformers gave results obtained through comparison of different samples in relation to the number of years in which they were in the field. Detailed evaluation of aging requires study on aging patterns using the same samples. In this paper, heat-accelerated degradation test was conducted on the same samples, and the patterns of changes in characteristics were studied. In addition, the influences of interactions between characteristics and water and between characteristics and pressboard were examined. The study using accelerated degradation test was conducted on one brand of mineral oil (α1). The obtained characteristics were the breakdown voltage, volume resistivity, interfacial tension, total acid value, and water content, i.e., electrical characteristics and characteristics considered to be correlated with electrical characteristics were extracted. As a result of examination, characteristic deterioration was evident for the water content, breakdown voltage, volume resistivity, total acid value, and interfacial tension in descending order of deterioration. The characteristics showed evident deterioration in the initial stage of accelerated degradation test and, thereafter, showed a saturation tendency with increasing age.
Index Terms — Field transformer, insulating oil, aging, accelerated degradation, electrical characteristic, water content.
1 INTRODUCTION
MANY studies have been conducted on how the degradation of insulating oil and paper progress in highly aged transformers [1, 2]. A hydrocarbon, the main component of insulating oil, is oxidized to an alcohol, which is further oxidized to aldehyde-ketone, carboxylic acid, organic acid, and ester. As for insulating paper, the average polymerization degree drops as the degradation progresses and the mechanical strength drops accordingly. The
decrease of the average polymerization degree is known to be temperature-dependent and greatly influenced by the operating temperature and operating time of a transformer. It is generally considered that the life of a transformer is determined by the mechanical strength of insulating paper wrapped around the coil and lasts until it can no longer stand the electromagnetic mechanical force generated at the time of external short-circuiting of the transformer. However, transformers used at substations are operated under a relatively low load and therefore the life of an insulator may be prolonged, making it necessary to consider the influence of degradation of insulating oil. Manuscript received on 10 September 2009, in final form 25 February 2010.
IEEE Transactions on Dielectrics and Electrical Insulation Vol. 17, No. 3; June 2010
809
Insulating oil commonly used in transformers is mineral oil or synthetic oil made from mineral oil and alkyl benzene. Although there are test items required for transformer insulating oil such as the density, kinematic viscosity, pour point, flash point, total acid value, oxidative stability, water content, breakdown voltage, dielectric loss tangent, and volume resistivity, no different test items are used for different types of insulating oil. The acceptance values for insulating oil are stricter for the one to be used for high-voltage high-capacity transformers. Mineral oil, manufactured by purifying crude oil, contains trace quantities of sulfur and nitrogen compounds in addition to the main component, hydrocarbon. Synthetic oil, on the other hand, is chemically synthesized and therefore contains no sulfur or nitrogen compound. It is appropriate to use mineral oil to obtain degradation characteristics of field transformer oil and it is effective to conduct addition test using synthetic oil to study the influence of only a specific component.
Insulating oil brands used in transformers satisfy the criteria defined in the specification but contain components that vary slightly depending on the brand and the manufacturing date of the transformer. In this paper, accelerated degradation test was conducted on the same samples in order to clarify the characteristics that vary according to the aging of the insulating oil. The insulating oil used in the test was one brand of mineral oil (α1). In this test, the changes in the characteristics of the insulating oil (breakdown characteristic, volume resistivity, interfacial tension, total acid value, and water content) were observed, and their trends were evaluated.
In the usage environment of transformers, various characteristics of insulating oil and diverse factors are considered to influence each other. In the latter half of this paper, experiment-based study was conducted in order to evaluate the interactions with the water content and pressboard insulating material.
2 METHOD OF ACCELERATED DEGRADATION TEST ON INSULATING OIL
In the past, the authors examined through experiments how aging influences electrical characteristics of insulating oil in transformers used in the field [3, 4]. How the characteristics of insulating oil deteriorate with increasing age was identified through accelerated degradation test conducted on commercial insulating oil. For the test, a temperture, air, and copper catalyst which mainly influence the degradation of the field transformer insulating oil were set as a parameter to take the field transformer condition into consideration. Table 1 lists the specifications of field transformer oil used in this study. The accelerated test was conducted using α1, mineral oil mainly used in 66 kV-class transformers.
The accelerated test on oil samples was conducted in a heating tank shown in Figure 1. The heating tank was sealed with double O-rings on the flange face to minimize the entry of water and air to the inside. The heating tank was also equipped with three-valved pipes on the flange face to allow addition of water and various components and sampling of oil at all times.
The accelerated test on oil samples was conducted under the conditions summarized in Table 2. The procedure of the accelerated test is as follows:
(1) Put a de-aired oil sample and a polished copper catalyst in the heating tank.
(2) Seal dry air in the space of the heating tank at an atmospheric pressure.
(3) Heat the heating tank in an oven kept at 120 °C for a specified length of time.
(4) After heating for a specified length of time, take out the heating tank from the oven and let it cool down to room temperature.
(5) Collect and test the oil sample according to the test items listed in Table 3.
Accelerated degradation by heating was conducted on the assumption that the remaining life was reduced by one-half every time the temperature rose by 7 °C [10]. Since the reference temperature of insulating oil is 60 °C, the heating to 120 °C is roughly equivalent to an acceleration by a factor of 380 (60/7=8.57, 28.57=380). Based on this assumption, accelerated degradation for one day was considered to be equivalent to aging for one year in the field.
Test item Characteristic of α1 Density at 15 °C (kg/L) 0.846 Kinetic viscosity at 40 °C (mm2/s) 6.01 Kinetic viscosity at 100 °C (mm2/s) 1.88 Pour point (°C) -37.5 Flash point (°C) 148 Total acid value (mgKOH/g) 0.00 Corrosivity (140 °C, 19h) Noncorrosive Breakdown voltage (kV) 70 or higher Volume resistivity at 80 °C (TΩm) 8.2×10²
Table 1. Initial characteristic value of insulating oil.
(a) Tank appearance (b) Interior Figure 1. Heating tank.
Table 2. Accelerated test conditions. Item Condition
Oil type and volume α1 brand (new oil), 4 l Oil sample Pretreatment
condition Perform de-airing to adjust the water content to 10 ppm or less
Copper catalyst Polished hard-drawn copper wire 1 mm in diameter
Space and volume above the oil level
Dry air of 1.6 l, sealed at atmospheric pressure
Heating temperature 120 °C
Heating conditions
Number of days of heating (Equivalent number of years of natural aging)
10 days (10 years) 30 days (30 years) 50 days (50 years)
M. Kohtoh et al.: Transformer Insulating Oil Characteristic Changes Observed Using Accelerated Degradation 810
3 RESULTS OF ACCELERATED DEGRADATION TEST ON INSULATING OIL
Accelerated degradation test was conducted on mineral oil (α1). The obtained characteristics of the insulating oil were water content, total acid value, interfacial tension, breakdown voltage, and volume resistivity. Table 4 summarizes the acceptance values of these characteristics. The test results for the breakdown voltage were obtained by repeating the test five times and averaging the breakdown voltage values taken in the second to fifth tests. For the volume resistivity, the one-minute values obtained at a temperature of 80 °C with an applied voltage of 250 kV were adopted.
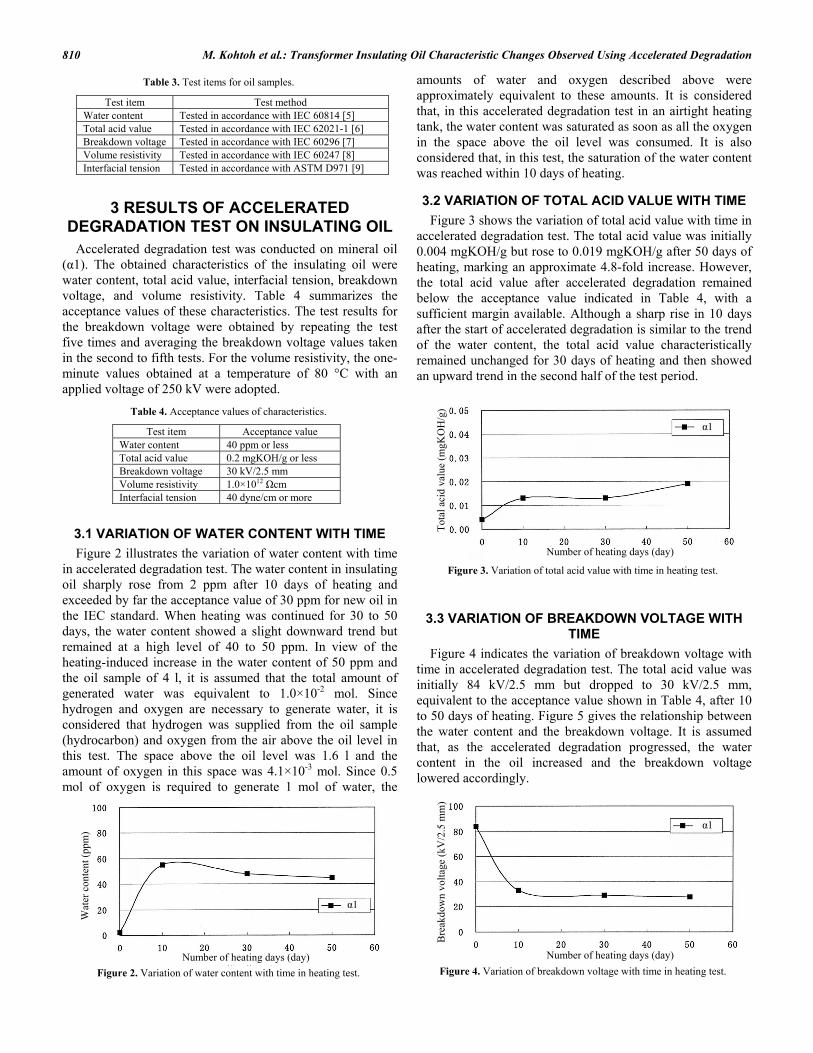
3.1 VARIATION OF WATER CONTENT WITH TIME Figure 2 illustrates the variation of water content with time
in accelerated degradation test. The water content in insulating oil sharply rose from 2 ppm after 10 days of heating and exceeded by far the acceptance value of 30 ppm for new oil in the IEC standard. When heating was continued for 30 to 50 days, the water content showed a slight downward trend but remained at a high level of 40 to 50 ppm. In view of the heating-induced increase in the water content of 50 ppm and the oil sample of 4 l, it is assumed that the total amount of generated water was equivalent to 1.0×10⁻² mol. Since hydrogen and oxygen are necessary to generate water, it is considered that hydrogen was supplied from the oil sample (hydrocarbon) and oxygen from the air above the oil level in this test. The space above the oil level was 1.6 l and the amount of oxygen in this space was 4.1×10⁻³ mol. Since 0.5 mol of oxygen is required to generate 1 mol of water, the
amounts of water and oxygen described above were approximately equivalent to these amounts. It is considered that, in this accelerated degradation test in an airtight heating tank, the water content was saturated as soon as all the oxygen in the space above the oil level was consumed. It is also considered that, in this test, the saturation of the water content was reached within 10 days of heating.
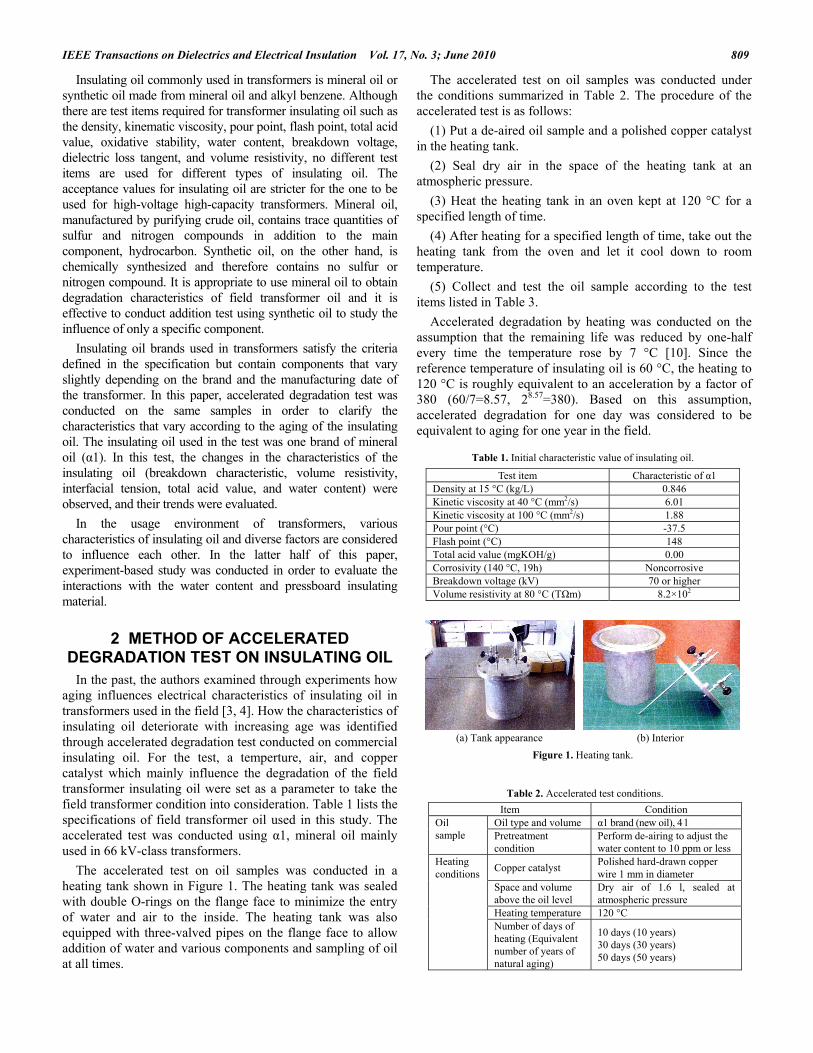
3.2 VARIATION OF TOTAL ACID VALUE WITH TIME Figure 3 shows the variation of total acid value with time in
accelerated degradation test. The total acid value was initially 0.004 mgKOH/g but rose to 0.019 mgKOH/g after 50 days of heating, marking an approximate 4.8-fold increase. However, the total acid value after accelerated degradation remained below the acceptance value indicated in Table 4, with a sufficient margin available. Although a sharp rise in 10 days after the start of accelerated degradation is similar to the trend of the water content, the total acid value characteristically remained unchanged for 30 days of heating and then showed an upward trend in the second half of the test period.
3.3 VARIATION OF BREAKDOWN VOLTAGE WITH TIME
Figure 4 indicates the variation of breakdown voltage with time in accelerated degradation test. The total acid value was initially 84 kV/2.5 mm but dropped to 30 kV/2.5 mm, equivalent to the acceptance value shown in Table 4, after 10 to 50 days of heating. Figure 5 gives the relationship between the water content and the breakdown voltage. It is assumed that, as the accelerated degradation progressed, the water content in the oil increased and the breakdown voltage lowered accordingly.
Table 3. Test items for oil samples.
Test item Test method Water content Tested in accordance with IEC 60814 [5] Total acid value Tested in accordance with IEC 62021-1 [6] Breakdown voltage Tested in accordance with IEC 60296 [7] Volume resistivity Tested in accordance with IEC 60247 [8] Interfacial tension Tested in accordance with ASTM D971 [9]
Test item Acceptance value Water content 40 ppm or less Total acid value 0.2 mgKOH/g or less Breakdown voltage 30 kV/2.5 mm Volume resistivity 1.0×10¹² Ωcm Interfacial tension 40 dyne/cm or more
Table 4. Acceptance values of characteristics.
Figure 2. Variation of water content with time in heating test.
Figure 3. Variation of total acid value with time in heating test.
α1
Number of heating days (day)
Wat
er c
onte
nt (p
pm)
α1
Number of heating days (day)
Tota
l aci
d va
lue
(mgK
OH
/g)
α1
Number of heating days (day)
Bre
akdo
wn
volta
ge (k
V/2
.5 m
m)
Figure 4. Variation of breakdown voltage with time in heating test.

IEEE Transactions on Dielectrics and Electrical Insulation Vol. 17, No. 3; June 2010
811
3.4 VARIATION OF VOLUME RESISTIVITY WITH TIME
Figure 6 shows the variation of volume resistivity (80 °C, one-minute value) with time in accelerated degradation test. The volume resistivity was initially 8.2×10¹⁴ Ωcm but dropped to 1.0×10¹³ Ωcm after 10 to 50 days of heating. The volume resistivity showed significant changes for 10 days of heating and showed a saturation tendency thereafter. This value is significantly lower than the acceptance value for new oil indicated in Table 4.
3.5 VARIATION OF INTERFACIAL TENSION WITH TIME
Figure 7 exhibits the variation of interfacial tension with time in accelerated degradation test. The interfacial tension was initially 49.3 dyne/cm but dropped to a value equivalent to 40 dyne/cm after 10 to 50 days of heating. This is equivalent to the acceptance value in Table 4. The interfacial tension showed a large change for 10 days of heating and then showed a saturation tendency thereafter, in the same way as for other characteristics.
3.6 RELATIONSHIP BETWEEN ACCEPTANCE VALUES OF VARIOUS CHARACTERISTICS
Table 5 displays the margins of acceptance values of various characteristics of an oil sample (α1) after heating test. In Table 5, risks are used as an index and can be expressed by equations (1) and (2) below.
- If the acceptance value is expressed as an upper limit (a measurement must be equal to or less than this value): Risk (%) = Measured value / Acceptance value × 100 (1)
- If the acceptance value is expressed as a lower limit (a measurement must be equal to or more than this value): Risk (%) = Acceptance value / Measured value × 100 (2)
For both of these types, a larger risk value represents a
higher risk. A value exceeding 100 means that a acceptance value listed in Table 4 is exceeded. The relationship between risks after 10, 30, and 50 days of heating is: Water Content > Breakdown Voltage > Volume Resistivity > Total Acid Value. The water content and breakdown voltage are indexes for which acceptance values for new oil tend to be exceeded due to an influence from aging.
4 INFLUENCE EVALUATION ON INTERACTION WITH WATER
Water in insulating oil is known to have a significant influence on the breakdown characteristics. In field transformers, various components and water in insulating oil coexist and are considered to interact with each other. Since ionic components are readily soluble in water, an increase in ionic components may lower the volume resistivity in the presence of water. It is necessary to evaluate the influence of
Number of heating days (day)
α1
Volu
me
resi
stiv
ity (Ω
cm, 8
0 °C
)
Figure 5. Relationship between water content and breakdown voltage inheating test.
α1
Water content (ppm)
Bre
akdo
wn
volta
ge (k
V/2
.5 m
m)
α1
Number of heating days (day)
Inte
rfac
ial t
ensi
on (d
yne/
cm)
Figure 7. Variation of interfacial tension with time in heating test.
After 10 days of heating After 30 days of heating After 50 days of heating Test item Measured value Risk (%) Measured value Risk (%) Measured value Risk (%) Total acid value 0.013 6.5 0.013 6.5 0.019 9.5 Water content 55 140 48 120 45 110 Breakdown voltage 33 91 29 100 28 110 Volume resistivity 6.8×10¹² 15 6.4×10¹² 16 5.7×10¹² 18
Table 5. Risks of exceeding the acceptance values of various characteristics.
Figure 6. Variation of volume resistivity with time in heating test.
M. Kohtoh et al.: Transformer Insulating Oil Characteristic Changes Observed Using Accelerated Degradation 812
interaction with water on the electrical characteristics of insulating oil.
This section describes examining the water-dependence of various characteristics of new α1 oil in order to identify the influences of the water in insulating oil on the breakdown voltage and volume resistivity.
4.1 TEST METHOD As the initial characteristics, new oil was studied to identify
the influences of water on various characteristics (total acid value, breakdown voltage, and volume resistivity) at this point. The type of new oil was the α1 oil used in Sections 2 and 3. The water content of oil samples was adjusted so that samples of nine different concentrations from 5 ppm to 60 ppm could be obtained. 60 ppm is close to the saturated water content of the α1 oil. The adjustment method was as follows:
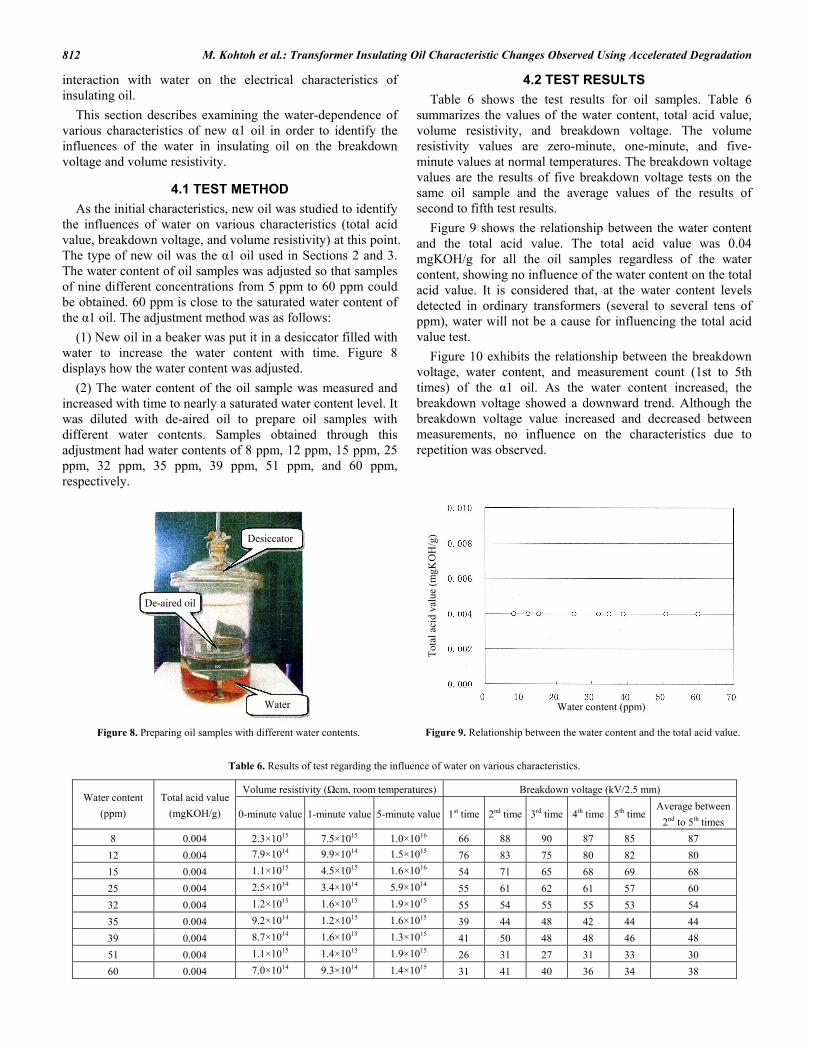
(1) New oil in a beaker was put it in a desiccator filled with water to increase the water content with time. Figure 8 displays how the water content was adjusted.
(2) The water content of the oil sample was measured and increased with time to nearly a saturated water content level. It was diluted with de-aired oil to prepare oil samples with different water contents. Samples obtained through this adjustment had water contents of 8 ppm, 12 ppm, 15 ppm, 25 ppm, 32 ppm, 35 ppm, 39 ppm, 51 ppm, and 60 ppm, respectively.
4.2 TEST RESULTS Table 6 shows the test results for oil samples. Table 6
summarizes the values of the water content, total acid value, volume resistivity, and breakdown voltage. The volume resistivity values are zero-minute, one-minute, and five-minute values at normal temperatures. The breakdown voltage values are the results of five breakdown voltage tests on the same oil sample and the average values of the results of second to fifth test results.
Figure 9 shows the relationship between the water content and the total acid value. The total acid value was 0.04 mgKOH/g for all the oil samples regardless of the water content, showing no influence of the water content on the total acid value. It is considered that, at the water content levels detected in ordinary transformers (several to several tens of ppm), water will not be a cause for influencing the total acid value test.
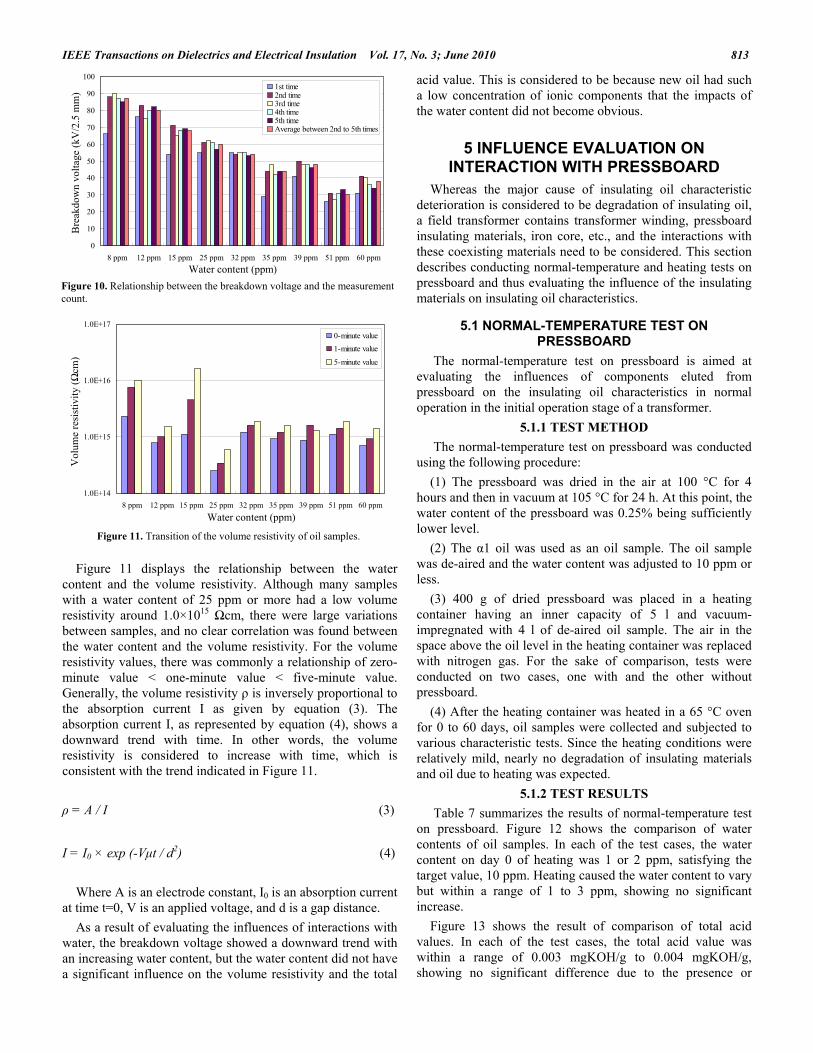
Figure 10 exhibits the relationship between the breakdown voltage, water content, and measurement count (1st to 5th times) of the α1 oil. As the water content increased, the breakdown voltage showed a downward trend. Although the breakdown voltage value increased and decreased between measurements, no influence on the characteristics due to repetition was observed.
Figure 8. Preparing oil samples with different water contents.
Desiccator
De-aired oil
Water
Volume resistivity (Ωcm, room temperatures) Breakdown voltage (kV/2.5 mm) Water content
(ppm) Total acid value
(mgKOH/g) 0-minute value 1-minute value 5-minute value 1st time 2nd time 3rd time 4th time 5th time Average between
2nd to 5th times 8 0.004 2.3×10¹⁵ 7.5×10¹⁵ 1.0×10¹⁶ 66 88 90 87 85 87
12 0.004 7.9×10¹⁴ 9.9×10¹⁴ 1.5×10¹⁵ 76 83 75 80 82 80 15 0.004 1.1×10¹⁵ 4.5×10¹⁵ 1.6×10¹⁶ 54 71 65 68 69 68 25 0.004 2.5×10¹⁴ 3.4×10¹⁴ 5.9×10¹⁴ 55 61 62 61 57 60 32 0.004 1.2×10¹⁵ 1.6×10¹⁵ 1.9×10¹⁵ 55 54 55 55 53 54 35 0.004 9.2×10¹⁴ 1.2×10¹⁵ 1.6×10¹⁵ 39 44 48 42 44 44 39 0.004 8.7×10¹⁴ 1.6×10¹⁵ 1.3×10¹⁵ 41 50 48 48 46 48 51 0.004 1.1×10¹⁵ 1.4×10¹⁵ 1.9×10¹⁵ 26 31 27 31 33 30 60 0.004 7.0×10¹⁴ 9.3×10¹⁴ 1.4×10¹⁵ 31 41 40 36 34 38
Table 6. Results of test regarding the influence of water on various characteristics.
Figure 9. Relationship between the water content and the total acid value.
Water content (ppm)
Tot
al a
cid
valu
e (m
gKO
H/g
)
IEEE Transactions on Dielectrics and Electrical Insulation Vol. 17, No. 3; June 2010
813
Figure 11 displays the relationship between the water
content and the volume resistivity. Although many samples with a water content of 25 ppm or more had a low volume resistivity around 1.0×10¹⁵ Ωcm, there were large variations between samples, and no clear correlation was found between the water content and the volume resistivity. For the volume resistivity values, there was commonly a relationship of zero-minute value < one-minute value < five-minute value. Generally, the volume resistivity ρ is inversely proportional to the absorption current I as given by equation (3). The absorption current I, as represented by equation (4), shows a downward trend with time. In other words, the volume resistivity is considered to increase with time, which is consistent with the trend indicated in Figure 11.
ρ = A / I (3)
I = I0 × exp (-Vμt / d2) (4)
Where A is an electrode constant, I0 is an absorption current
at time t=0, V is an applied voltage, and d is a gap distance. As a result of evaluating the influences of interactions with
water, the breakdown voltage showed a downward trend with an increasing water content, but the water content did not have a significant influence on the volume resistivity and the total
acid value. This is considered to be because new oil had such a low concentration of ionic components that the impacts of the water content did not become obvious.
5 INFLUENCE EVALUATION ON INTERACTION WITH PRESSBOARD
Whereas the major cause of insulating oil characteristic deterioration is considered to be degradation of insulating oil, a field transformer contains transformer winding, pressboard insulating materials, iron core, etc., and the interactions with these coexisting materials need to be considered. This section describes conducting normal-temperature and heating tests on pressboard and thus evaluating the influence of the insulating materials on insulating oil characteristics.
5.1 NORMAL-TEMPERATURE TEST ON PRESSBOARD
The normal-temperature test on pressboard is aimed at evaluating the influences of components eluted from pressboard on the insulating oil characteristics in normal operation in the initial operation stage of a transformer.
5.1.1 TEST METHOD The normal-temperature test on pressboard was conducted
using the following procedure: (1) The pressboard was dried in the air at 100 °C for 4
hours and then in vacuum at 105 °C for 24 h. At this point, the water content of the pressboard was 0.25% being sufficiently lower level.
(2) The α1 oil was used as an oil sample. The oil sample was de-aired and the water content was adjusted to 10 ppm or less.
(3) 400 g of dried pressboard was placed in a heating container having an inner capacity of 5 l and vacuum-impregnated with 4 l of de-aired oil sample. The air in the space above the oil level in the heating container was replaced with nitrogen gas. For the sake of comparison, tests were conducted on two cases, one with and the other without pressboard.
(4) After the heating container was heated in a 65 °C oven for 0 to 60 days, oil samples were collected and subjected to various characteristic tests. Since the heating conditions were relatively mild, nearly no degradation of insulating materials and oil due to heating was expected.
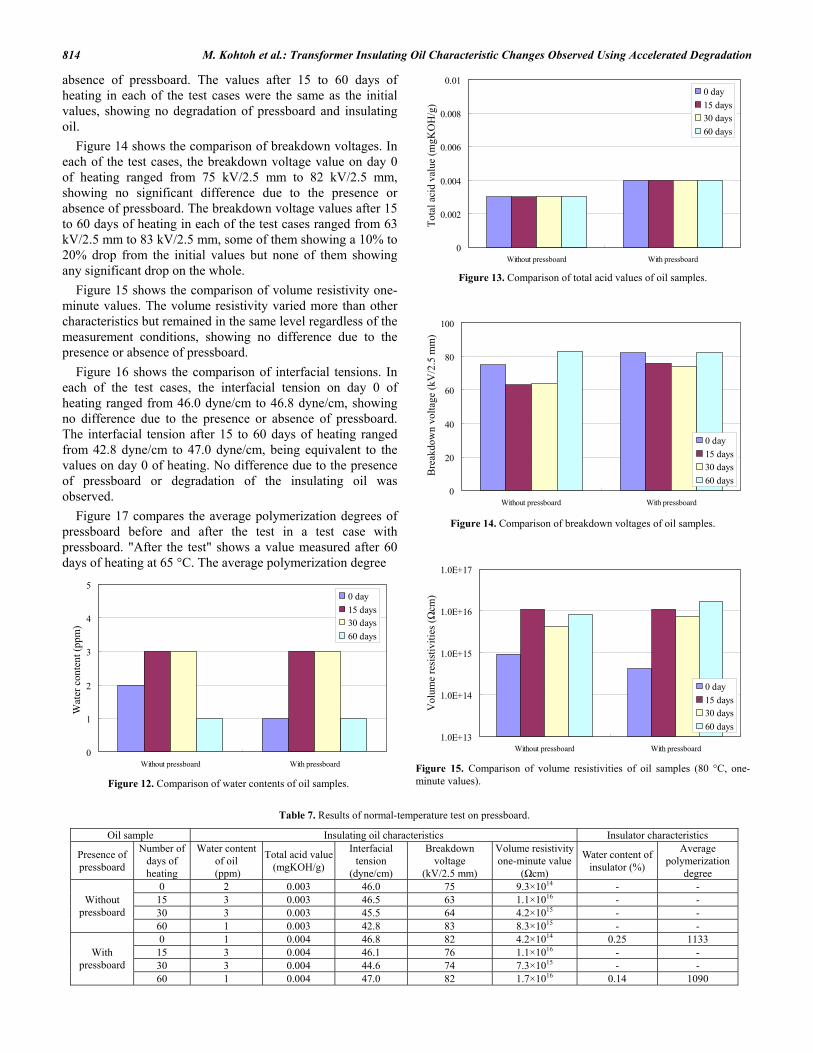
5.1.2 TEST RESULTS Table 7 summarizes the results of normal-temperature test
on pressboard. Figure 12 shows the comparison of water contents of oil samples. In each of the test cases, the water content on day 0 of heating was 1 or 2 ppm, satisfying the target value, 10 ppm. Heating caused the water content to vary but within a range of 1 to 3 ppm, showing no significant increase.
Figure 13 shows the result of comparison of total acid values. In each of the test cases, the total acid value was within a range of 0.003 mgKOH/g to 0.004 mgKOH/g, showing no significant difference due to the presence or
1.0E+14
1.0E+15
1.0E+16
1.0E+17
8 ppm 12 ppm 15 ppm 25 ppm 32 ppm 35 ppm 39 ppm 51 ppm 60 ppm
0-minute value1-minute value
5-minute value
Water content (ppm)
Vol
ume
resi
stiv
ity (Ω
cm)
Figure 10. Relationship between the breakdown voltage and the measurement count.
0
10
20
30
40
50
60
70
80
90
100
8 ppm 12 ppm 15 ppm 25 ppm 32 ppm 35 ppm 39 ppm 51 ppm 60 ppm
1st time2nd time3rd time4th time5th timeAverage between 2nd to 5th times
Water content (ppm)
Bre
akdo
wn
volta
ge (k
V/2
.5 m
m)
Figure 11. Transition of the volume resistivity of oil samples.
M. Kohtoh et al.: Transformer Insulating Oil Characteristic Changes Observed Using Accelerated Degradation 814
absence of pressboard. The values after 15 to 60 days of heating in each of the test cases were the same as the initial values, showing no degradation of pressboard and insulating oil.
Figure 14 shows the comparison of breakdown voltages. In each of the test cases, the breakdown voltage value on day 0 of heating ranged from 75 kV/2.5 mm to 82 kV/2.5 mm, showing no significant difference due to the presence or absence of pressboard. The breakdown voltage values after 15 to 60 days of heating in each of the test cases ranged from 63 kV/2.5 mm to 83 kV/2.5 mm, some of them showing a 10% to 20% drop from the initial values but none of them showing any significant drop on the whole.
Figure 15 shows the comparison of volume resistivity one-minute values. The volume resistivity varied more than other characteristics but remained in the same level regardless of the measurement conditions, showing no difference due to the presence or absence of pressboard.
Figure 16 shows the comparison of interfacial tensions. In each of the test cases, the interfacial tension on day 0 of heating ranged from 46.0 dyne/cm to 46.8 dyne/cm, showing no difference due to the presence or absence of pressboard. The interfacial tension after 15 to 60 days of heating ranged from 42.8 dyne/cm to 47.0 dyne/cm, being equivalent to the values on day 0 of heating. No difference due to the presence of pressboard or degradation of the insulating oil was observed.
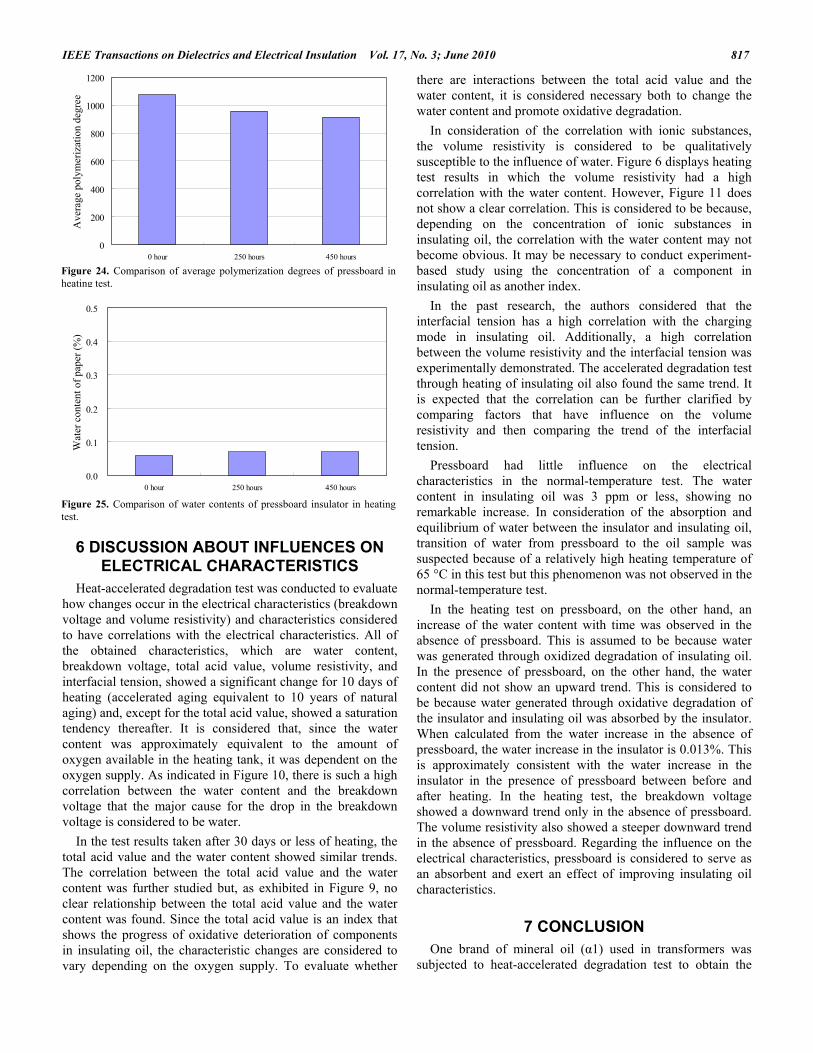
Figure 17 compares the average polymerization degrees of pressboard before and after the test in a test case with pressboard. "After the test" shows a value measured after 60 days of heating at 65 °C. The average polymerization degree
0
20
40
60
80
100
Without pressboard With pressboard
0 day15 days30 days60 days
Bre
akdo
wn
volta
ge (k
V/2
.5 m
m)
Oil sample Insulating oil characteristics Insulator characteristics
Presence of pressboard
Number of days of heating
Water content of oil
(ppm)
Total acid value (mgKOH/g)
Interfacial tension
(dyne/cm)
Breakdown voltage
(kV/2.5 mm)
Volume resistivity one-minute value
(Ωcm)
Water content of insulator (%)
Average polymerization
degree 0 2 0.003 46.0 75 9.3×10¹⁴ - -
15 3 0.003 46.5 63 1.1×10¹⁶ - - 30 3 0.003 45.5 64 4.2×10¹⁵ - -
Without pressboard
60 1 0.003 42.8 83 8.3×10¹⁵ - - 0 1 0.004 46.8 82 4.2×10¹⁴ 0.25 1133
15 3 0.004 46.1 76 1.1×10¹⁶ - - 30 3 0.004 44.6 74 7.3×10¹⁵ - -
With pressboard
60 1 0.004 47.0 82 1.7×10¹⁶ 0.14 1090
Table 7. Results of normal-temperature test on pressboard.
Figure 12. Comparison of water contents of oil samples.
Figure 13. Comparison of total acid values of oil samples.
Figure 15. Comparison of volume resistivities of oil samples (80 °C, one-minute values).
Figure 14. Comparison of breakdown voltages of oil samples.
0
0.002
0.004
0.006
0.008
0.01
Without pressboard With pressboard
0 day15 days30 days60 days
Tota
l aci
d va
lue
(mgK
OH
/g)
0
1
2
3
4
5
Without pressboard With pressboard
0 day15 days30 days60 days
Wat
er c
onte
nt (p
pm)
1.0E+13
1.0E+14
1.0E+15
1.0E+16
1.0E+17
Without pressboard With pressboard
0 day15 days30 days60 days
Vol
ume
resi
stiv
ities
(Ωcm
)
IEEE Transactions on Dielectrics and Electrical Insulation Vol. 17, No. 3; June 2010
815
after the test was 1090, a little lower value than the value before the test, 1133. Assuming that the average polymerization degree of new pressboard is about 1000 to 1100, it is concluded that there was no significant difference before and after the test.
Figure 18 compares the insulator water contents in the test case with pressboard. As in Figure 17, "After the test" shows a value measured after 60 days of heating. Although the insulator water content after the test was 0.14%, a little lower than the value before the test, 0.25%, it is concluded that there was no significant difference between them.
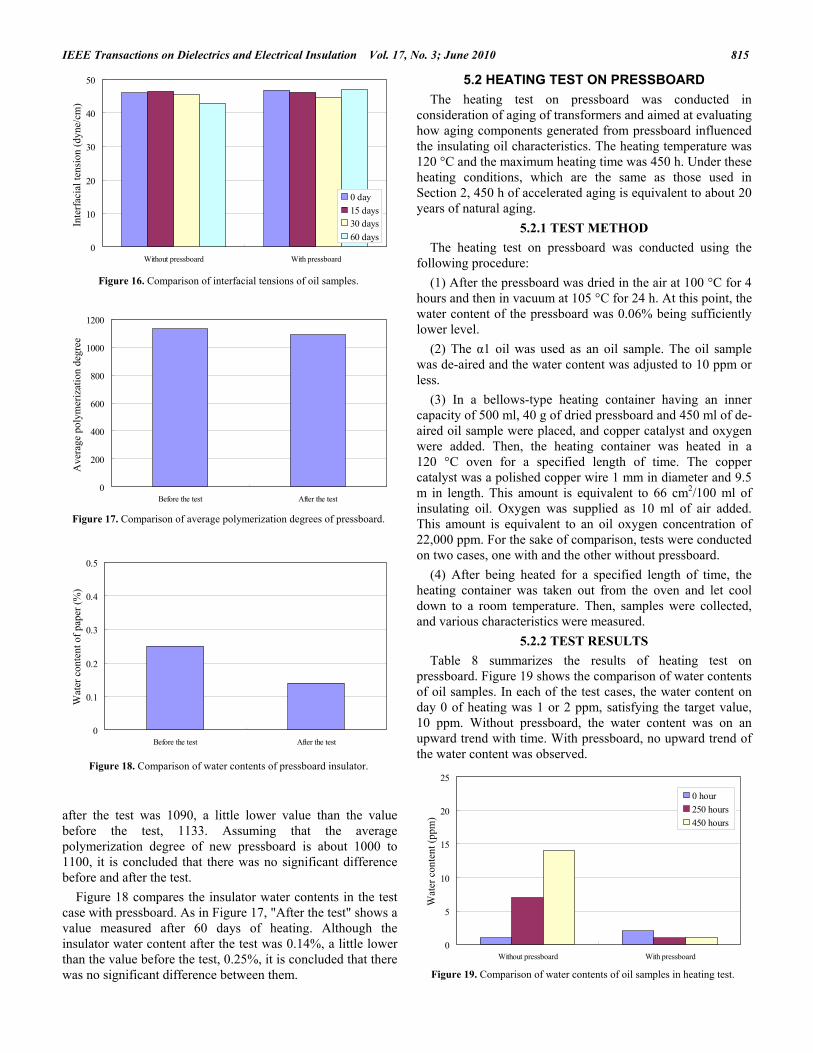
5.2 HEATING TEST ON PRESSBOARD The heating test on pressboard was conducted in
consideration of aging of transformers and aimed at evaluating how aging components generated from pressboard influenced the insulating oil characteristics. The heating temperature was 120 °C and the maximum heating time was 450 h. Under these heating conditions, which are the same as those used in Section 2, 450 h of accelerated aging is equivalent to about 20 years of natural aging.
5.2.1 TEST METHOD The heating test on pressboard was conducted using the
following procedure: (1) After the pressboard was dried in the air at 100 °C for 4
hours and then in vacuum at 105 °C for 24 h. At this point, the water content of the pressboard was 0.06% being sufficiently lower level.
(2) The α1 oil was used as an oil sample. The oil sample was de-aired and the water content was adjusted to 10 ppm or less.
(3) In a bellows-type heating container having an inner capacity of 500 ml, 40 g of dried pressboard and 450 ml of de-aired oil sample were placed, and copper catalyst and oxygen were added. Then, the heating container was heated in a 120 °C oven for a specified length of time. The copper catalyst was a polished copper wire 1 mm in diameter and 9.5 m in length. This amount is equivalent to 66 cm2/100 ml of insulating oil. Oxygen was supplied as 10 ml of air added. This amount is equivalent to an oil oxygen concentration of 22,000 ppm. For the sake of comparison, tests were conducted on two cases, one with and the other without pressboard.
(4) After being heated for a specified length of time, the heating container was taken out from the oven and let cool down to a room temperature. Then, samples were collected, and various characteristics were measured.
5.2.2 TEST RESULTS Table 8 summarizes the results of heating test on
pressboard. Figure 19 shows the comparison of water contents of oil samples. In each of the test cases, the water content on day 0 of heating was 1 or 2 ppm, satisfying the target value, 10 ppm. Without pressboard, the water content was on an upward trend with time. With pressboard, no upward trend of the water content was observed.
0
200
400
600
800
1000
1200
Before the test After the test
Ave
rage
pol
ymer
izat
ion
degr
ee
0
10
20
30
40
50
Without pressboard With pressboard
0 day15 days30 days60 days
Inte
rfac
ial t
ensi
on (d
yne/
cm)
0
0.1
0.2
0.3
0.4
0.5
Before the test After the test
Wat
er c
onte
nt o
f pap
er (%
)
0
5
10
15
20
25
Without pressboard With pressboard
0 hour250 hours450 hours
Wat
er c
onte
nt (p
pm)
Figure 17. Comparison of average polymerization degrees of pressboard.
Figure 18. Comparison of water contents of pressboard insulator.
Figure 16. Comparison of interfacial tensions of oil samples.
Figure 19. Comparison of water contents of oil samples in heating test.
M. Kohtoh et al.: Transformer Insulating Oil Characteristic Changes Observed Using Accelerated Degradation 816
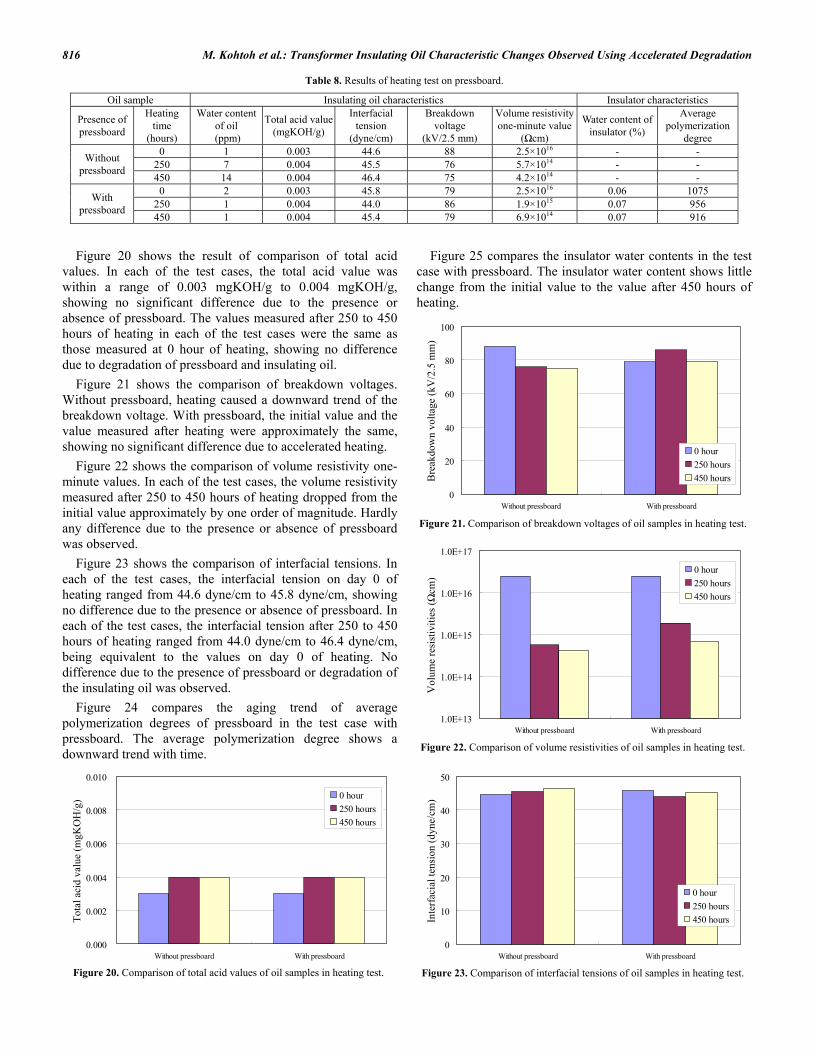
Figure 20 shows the result of comparison of total acid
values. In each of the test cases, the total acid value was within a range of 0.003 mgKOH/g to 0.004 mgKOH/g, showing no significant difference due to the presence or absence of pressboard. The values measured after 250 to 450 hours of heating in each of the test cases were the same as those measured at 0 hour of heating, showing no difference due to degradation of pressboard and insulating oil.
Figure 21 shows the comparison of breakdown voltages. Without pressboard, heating caused a downward trend of the breakdown voltage. With pressboard, the initial value and the value measured after heating were approximately the same, showing no significant difference due to accelerated heating.
Figure 22 shows the comparison of volume resistivity one-minute values. In each of the test cases, the volume resistivity measured after 250 to 450 hours of heating dropped from the initial value approximately by one order of magnitude. Hardly any difference due to the presence or absence of pressboard was observed.
Figure 23 shows the comparison of interfacial tensions. In each of the test cases, the interfacial tension on day 0 of heating ranged from 44.6 dyne/cm to 45.8 dyne/cm, showing no difference due to the presence or absence of pressboard. In each of the test cases, the interfacial tension after 250 to 450 hours of heating ranged from 44.0 dyne/cm to 46.4 dyne/cm, being equivalent to the values on day 0 of heating. No difference due to the presence of pressboard or degradation of the insulating oil was observed.
Figure 24 compares the aging trend of average polymerization degrees of pressboard in the test case with pressboard. The average polymerization degree shows a downward trend with time.
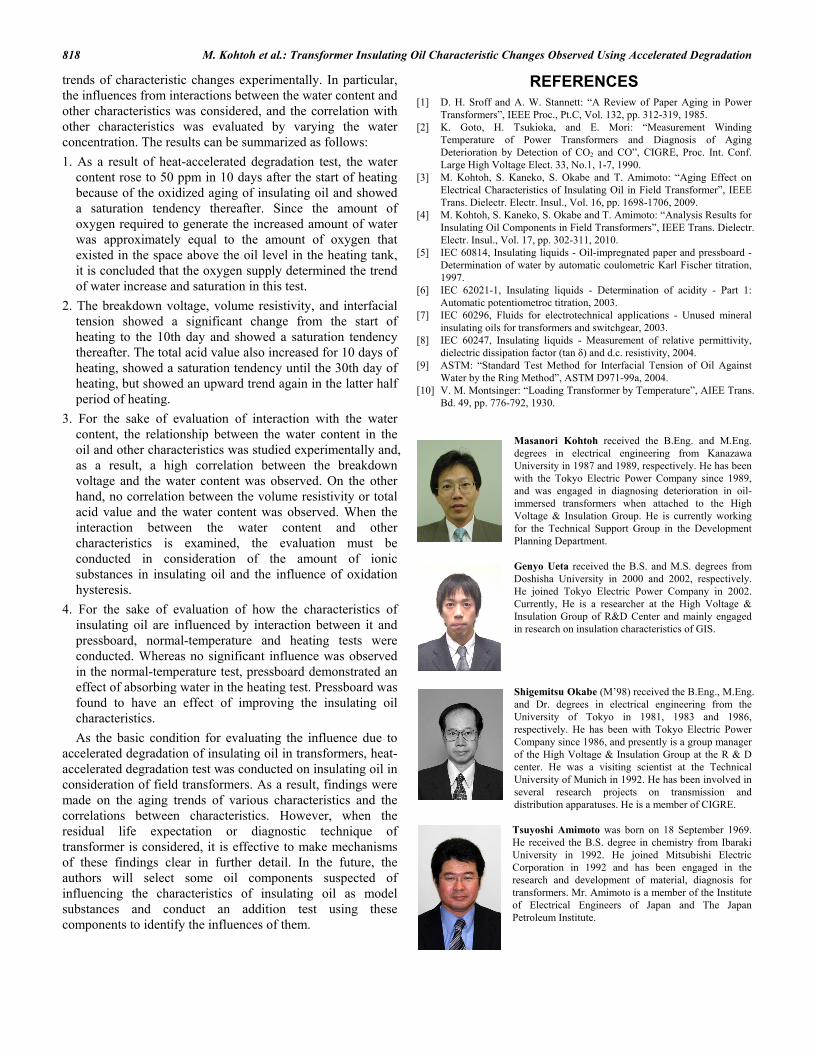
Figure 25 compares the insulator water contents in the test
case with pressboard. The insulator water content shows little change from the initial value to the value after 450 hours of heating.
0
10
20
30
40
50
Without pressboard With pressboard
0 hour250 hours450 hoursIn
terf
acia
l ten
sion
(dyn
e/cm
)
0
20
40
60
80
100
Without pressboard With pressboard
0 hour250 hours450 hoursB
reak
dow
n vo
ltage
(kV
/2.5
mm
)
0.000
0.002
0.004
0.006
0.008
0.010
Without pressboard With pressboard
0 hour250 hours450 hours
Tota
l aci
d va
lue
(mgK
OH
/g)
1.0E+13
1.0E+14
1.0E+15
1.0E+16
1.0E+17
Without pressboard With pressboard
0 hour250 hours450 hours
Vol
ume
resi
stiv
ities
(Ωcm
)
Oil sample Insulating oil characteristics Insulator characteristics
Presence of pressboard
Heating time
(hours)
Water content of oil
(ppm)
Total acid value (mgKOH/g)
Interfacial tension
(dyne/cm)
Breakdown voltage
(kV/2.5 mm)
Volume resistivity one-minute value
(Ωcm)
Water content of insulator (%)
Average polymerization
degree 0 1 0.003 44.6 88 2.5×10¹⁶ - -
250 7 0.004 45.5 76 5.7×10¹⁴ - - Without pressboard
450 14 0.004 46.4 75 4.2×10¹⁴ - - 0 2 0.003 45.8 79 2.5×10¹⁶ 0.06 1075
250 1 0.004 44.0 86 1.9×10¹⁵ 0.07 956 With pressboard
450 1 0.004 45.4 79 6.9×10¹⁴ 0.07 916
Table 8. Results of heating test on pressboard.
Figure 21. Comparison of breakdown voltages of oil samples in heating test.
Figure 20. Comparison of total acid values of oil samples in heating test.
Figure 22. Comparison of volume resistivities of oil samples in heating test.
Figure 23. Comparison of interfacial tensions of oil samples in heating test.
IEEE Transactions on Dielectrics and Electrical Insulation Vol. 17, No. 3; June 2010
817
6 DISCUSSION ABOUT INFLUENCES ON ELECTRICAL CHARACTERISTICS
Heat-accelerated degradation test was conducted to evaluate how changes occur in the electrical characteristics (breakdown voltage and volume resistivity) and characteristics considered to have correlations with the electrical characteristics. All of the obtained characteristics, which are water content, breakdown voltage, total acid value, volume resistivity, and interfacial tension, showed a significant change for 10 days of heating (accelerated aging equivalent to 10 years of natural aging) and, except for the total acid value, showed a saturation tendency thereafter. It is considered that, since the water content was approximately equivalent to the amount of oxygen available in the heating tank, it was dependent on the oxygen supply. As indicated in Figure 10, there is such a high correlation between the water content and the breakdown voltage that the major cause for the drop in the breakdown voltage is considered to be water.
In the test results taken after 30 days or less of heating, the total acid value and the water content showed similar trends. The correlation between the total acid value and the water content was further studied but, as exhibited in Figure 9, no clear relationship between the total acid value and the water content was found. Since the total acid value is an index that shows the progress of oxidative deterioration of components in insulating oil, the characteristic changes are considered to vary depending on the oxygen supply. To evaluate whether
there are interactions between the total acid value and the water content, it is considered necessary both to change the water content and promote oxidative degradation.
In consideration of the correlation with ionic substances, the volume resistivity is considered to be qualitatively susceptible to the influence of water. Figure 6 displays heating test results in which the volume resistivity had a high correlation with the water content. However, Figure 11 does not show a clear correlation. This is considered to be because, depending on the concentration of ionic substances in insulating oil, the correlation with the water content may not become obvious. It may be necessary to conduct experiment-based study using the concentration of a component in insulating oil as another index.
In the past research, the authors considered that the interfacial tension has a high correlation with the charging mode in insulating oil. Additionally, a high correlation between the volume resistivity and the interfacial tension was experimentally demonstrated. The accelerated degradation test through heating of insulating oil also found the same trend. It is expected that the correlation can be further clarified by comparing factors that have influence on the volume resistivity and then comparing the trend of the interfacial tension.
Pressboard had little influence on the electrical characteristics in the normal-temperature test. The water content in insulating oil was 3 ppm or less, showing no remarkable increase. In consideration of the absorption and equilibrium of water between the insulator and insulating oil, transition of water from pressboard to the oil sample was suspected because of a relatively high heating temperature of 65 °C in this test but this phenomenon was not observed in the normal-temperature test.
In the heating test on pressboard, on the other hand, an increase of the water content with time was observed in the absence of pressboard. This is assumed to be because water was generated through oxidized degradation of insulating oil. In the presence of pressboard, on the other hand, the water content did not show an upward trend. This is considered to be because water generated through oxidative degradation of the insulator and insulating oil was absorbed by the insulator. When calculated from the water increase in the absence of pressboard, the water increase in the insulator is 0.013%. This is approximately consistent with the water increase in the insulator in the presence of pressboard between before and after heating. In the heating test, the breakdown voltage showed a downward trend only in the absence of pressboard. The volume resistivity also showed a steeper downward trend in the absence of pressboard. Regarding the influence on the electrical characteristics, pressboard is considered to serve as an absorbent and exert an effect of improving insulating oil characteristics.
7 CONCLUSION One brand of mineral oil (α1) used in transformers was
subjected to heat-accelerated degradation test to obtain the
0
200
400
600
800
1000
1200
0 hour 250 hours 450 hours
Ave
rage
pol
ymer
izat
ion
degr
ee
0.0
0.1
0.2
0.3
0.4
0.5
0 hour 250 hours 450 hours
Wat
er c
onte
nt o
f pap
er (%
)
Figure 25. Comparison of water contents of pressboard insulator in heatingtest.
Figure 24. Comparison of average polymerization degrees of pressboard inheating test.
M. Kohtoh et al.: Transformer Insulating Oil Characteristic Changes Observed Using Accelerated Degradation 818
trends of characteristic changes experimentally. In particular, the influences from interactions between the water content and other characteristics was considered, and the correlation with other characteristics was evaluated by varying the water concentration. The results can be summarized as follows: 1. As a result of heat-accelerated degradation test, the water
content rose to 50 ppm in 10 days after the start of heating because of the oxidized aging of insulating oil and showed a saturation tendency thereafter. Since the amount of oxygen required to generate the increased amount of water was approximately equal to the amount of oxygen that existed in the space above the oil level in the heating tank, it is concluded that the oxygen supply determined the trend of water increase and saturation in this test.
2. The breakdown voltage, volume resistivity, and interfacial tension showed a significant change from the start of heating to the 10th day and showed a saturation tendency thereafter. The total acid value also increased for 10 days of heating, showed a saturation tendency until the 30th day of heating, but showed an upward trend again in the latter half period of heating.
3. For the sake of evaluation of interaction with the water content, the relationship between the water content in the oil and other characteristics was studied experimentally and, as a result, a high correlation between the breakdown voltage and the water content was observed. On the other hand, no correlation between the volume resistivity or total acid value and the water content was observed. When the interaction between the water content and other characteristics is examined, the evaluation must be conducted in consideration of the amount of ionic substances in insulating oil and the influence of oxidation hysteresis.
4. For the sake of evaluation of how the characteristics of insulating oil are influenced by interaction between it and pressboard, normal-temperature and heating tests were conducted. Whereas no significant influence was observed in the normal-temperature test, pressboard demonstrated an effect of absorbing water in the heating test. Pressboard was found to have an effect of improving the insulating oil characteristics. As the basic condition for evaluating the influence due to
accelerated degradation of insulating oil in transformers, heat-accelerated degradation test was conducted on insulating oil in consideration of field transformers. As a result, findings were made on the aging trends of various characteristics and the correlations between characteristics. However, when the residual life expectation or diagnostic technique of transformer is considered, it is effective to make mechanisms of these findings clear in further detail. In the future, the authors will select some oil components suspected of influencing the characteristics of insulating oil as model substances and conduct an addition test using these components to identify the influences of them.
REFERENCES [1] D. H. Sroff and A. W. Stannett: “A Review of Paper Aging in Power
Transformers”, IEEE Proc., Pt.C, Vol. 132, pp. 312-319, 1985. [2] K. Goto, H. Tsukioka, and E. Mori: “Measurement Winding
Temperature of Power Transformers and Diagnosis of Aging Deterioration by Detection of CO2 and CO”, CIGRE, Proc. Int. Conf. Large High Voltage Elect. 33, No.1, 1-7, 1990.
[3] M. Kohtoh, S. Kaneko, S. Okabe and T. Amimoto: “Aging Effect on Electrical Characteristics of Insulating Oil in Field Transformer”, IEEE Trans. Dielectr. Electr. Insul., Vol. 16, pp. 1698-1706, 2009.
[4] M. Kohtoh, S. Kaneko, S. Okabe and T. Amimoto: “Analysis Results for Insulating Oil Components in Field Transformers”, IEEE Trans. Dielectr. Electr. Insul., Vol. 17, pp. 302-311, 2010.
[5] IEC 60814, Insulating liquids - Oil-impregnated paper and pressboard - Determination of water by automatic coulometric Karl Fischer titration, 1997.
[6] IEC 62021-1, Insulating liquids - Determination of acidity - Part 1: Automatic potentiometroc titration, 2003.
[7] IEC 60296, Fluids for electrotechnical applications - Unused mineral insulating oils for transformers and switchgear, 2003.
[8] IEC 60247, Insulating liquids - Measurement of relative permittivity, dielectric dissipation factor (tan δ) and d.c. resistivity, 2004.
[9] ASTM: “Standard Test Method for Interfacial Tension of Oil Against Water by the Ring Method”, ASTM D971-99a, 2004.
[10] V. M. Montsinger: “Loading Transformer by Temperature”, AIEE Trans. Bd. 49, pp. 776-792, 1930.
Masanori Kohtoh received the B.Eng. and M.Eng. degrees in electrical engineering from Kanazawa University in 1987 and 1989, respectively. He has been with the Tokyo Electric Power Company since 1989, and was engaged in diagnosing deterioration in oil-immersed transformers when attached to the High Voltage & Insulation Group. He is currently working for the Technical Support Group in the Development Planning Department.
Genyo Ueta received the B.S. and M.S. degrees from Doshisha University in 2000 and 2002, respectively. He joined Tokyo Electric Power Company in 2002. Currently, He is a researcher at the High Voltage & Insulation Group of R&D Center and mainly engaged in research on insulation characteristics of GIS.
Shigemitsu Okabe (M’98) received the B.Eng., M.Eng. and Dr. degrees in electrical engineering from the University of Tokyo in 1981, 1983 and 1986, respectively. He has been with Tokyo Electric Power Company since 1986, and presently is a group manager of the High Voltage & Insulation Group at the R & D center. He was a visiting scientist at the Technical University of Munich in 1992. He has been involved in several research projects on transmission and distribution apparatuses. He is a member of CIGRE.
Tsuyoshi Amimoto was born on 18 September 1969. He received the B.S. degree in chemistry from Ibaraki University in 1992. He joined Mitsubishi Electric Corporation in 1992 and has been engaged in the research and development of material, diagnosis for transformers. Mr. Amimoto is a member of the Institute of Electrical Engineers of Japan and The Japan Petroleum Institute.