train your best today usac
TRANSCRIPT
Will Kirousis | @willkirousis | [email protected]
Train Your Best!
Self-monitoring led training adjustments to create peak
performance
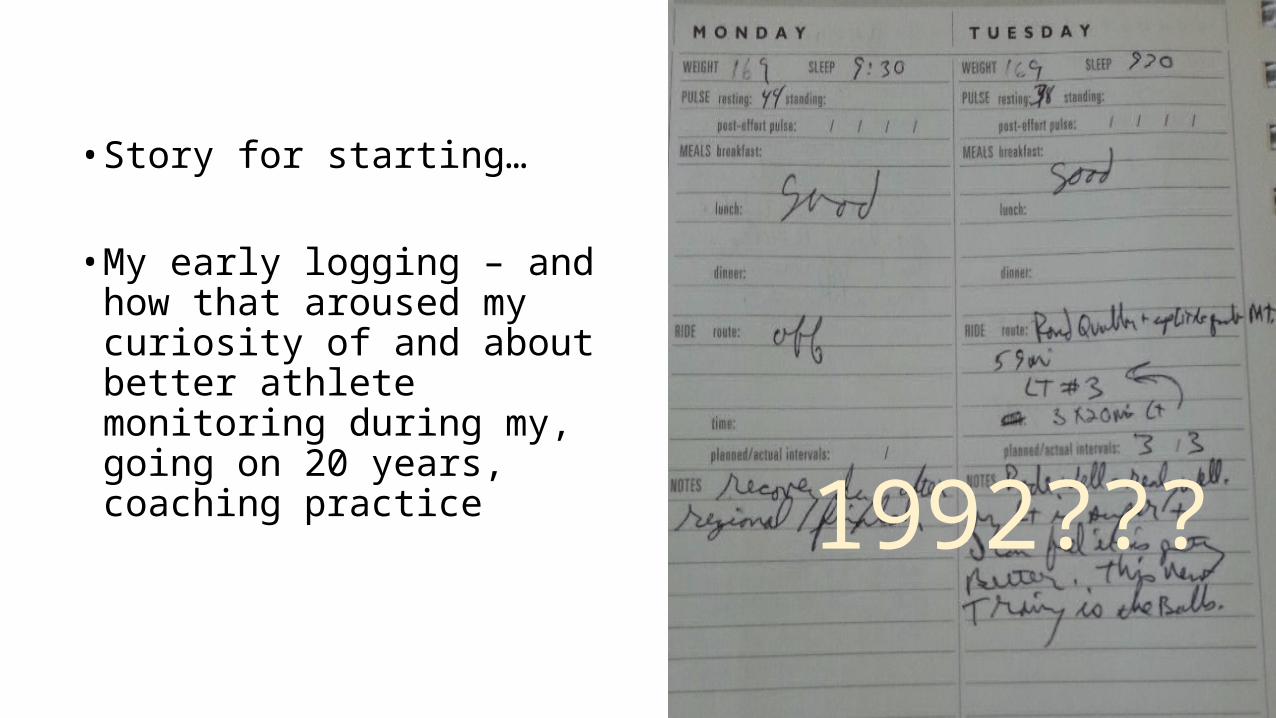
• Story for starting…
• My early logging – and how that aroused my curiosity of and about better athlete monitoring during my, going on 20 years, coaching practice
1992???
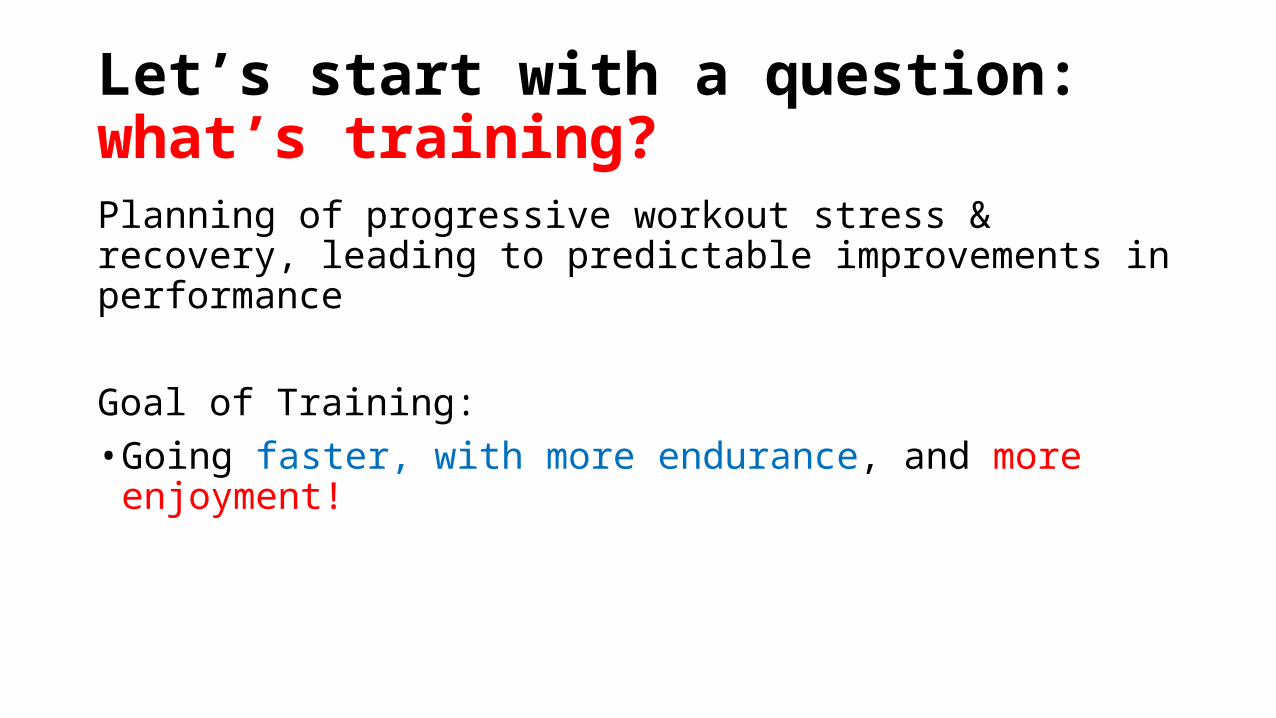
Let’s start with a question: what’s training?Planning of progressive workout stress & recovery, leading to predictable improvements in performance
Goal of Training:• Going faster, with more endurance, and more enjoyment!
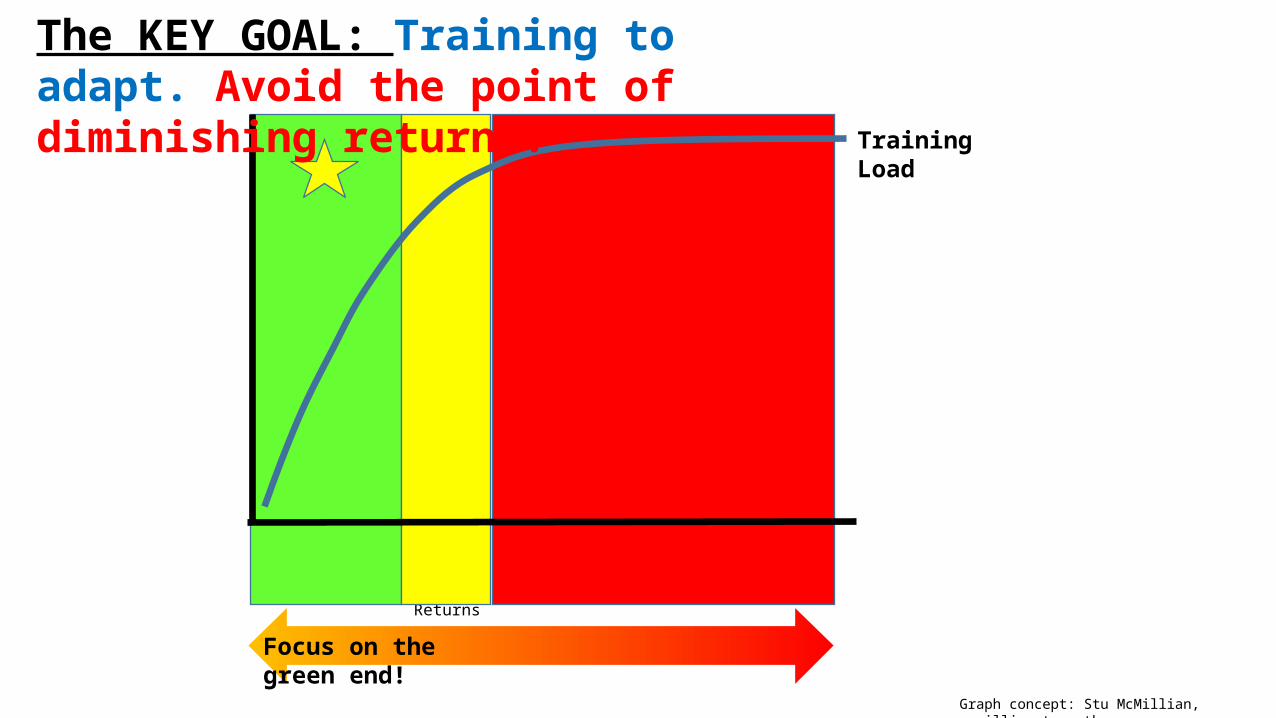
Peak Rate of Return: Stay HERE!
Point of Diminishing
Returns
Plateau – Avoid This Area
Training Load
The KEY GOAL: Training to adapt. Avoid the point of diminishing returns!
Focus on the green end!
Graph concept: Stu McMillian, mcmillianstrength.com
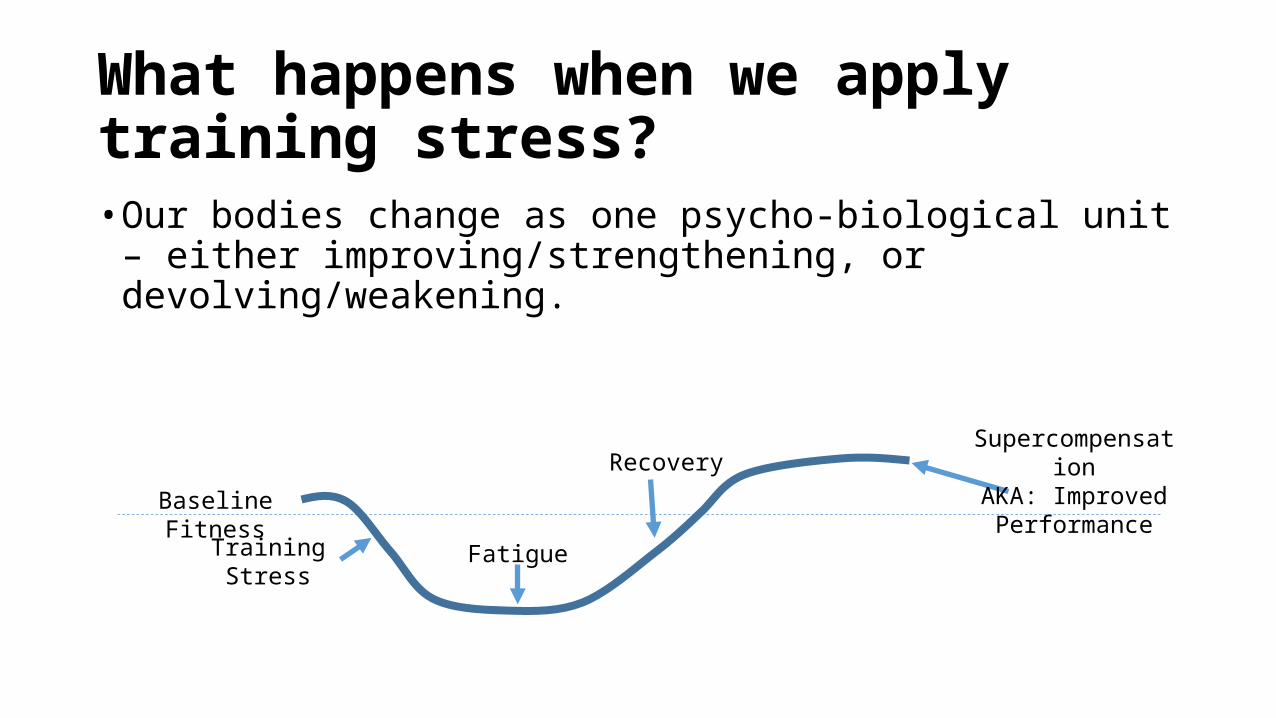
What happens when we apply training stress? • Our bodies change as one psycho-biological unit – either
improving/strengthening, or devolving/weakening.
Baseline Fitness
Training Stress
RecoverySupercompensation
AKA: Improved Performance
Fatigue
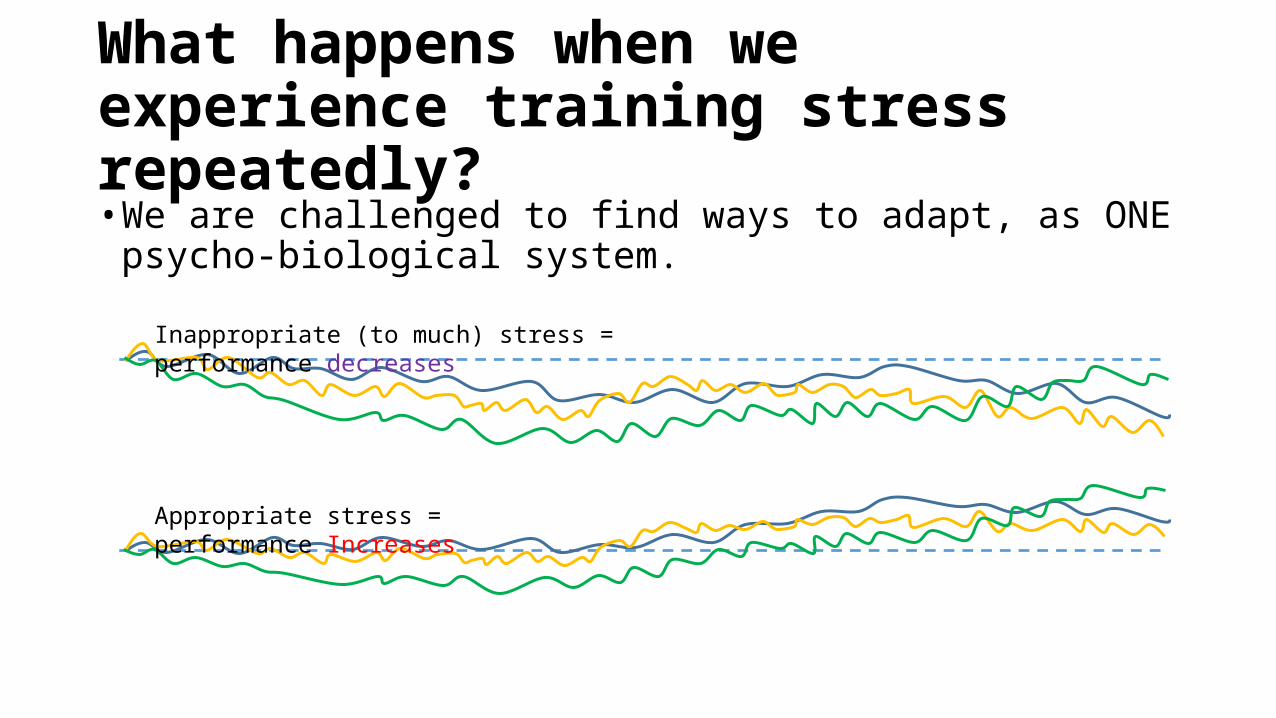
What happens when we experience training stress repeatedly?• We are challenged to find ways to adapt, as ONE psycho-biological
system.
Inappropriate (to much) stress = performance decreases
Appropriate stress = performance Increases
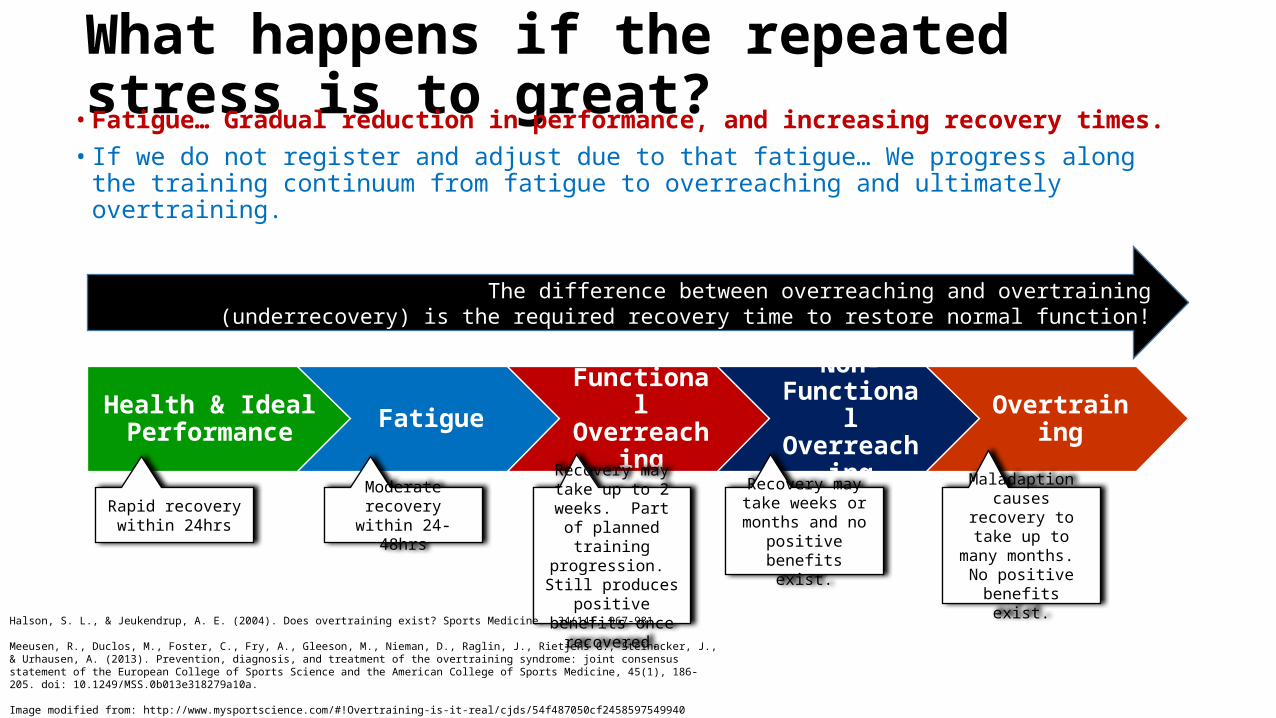
Health & Ideal Performance Fatigue Functional
Overreaching
Non-Functional
OverreachingOvertraining
Rapid recovery within 24hrs
Moderate recovery within 24-48hrs
Recovery may take up to 2 weeks. Part of planned training progression. Still produces positive
benefits once recovered.
Recovery may take weeks or months and no positive benefits exist.
Maladaption causes recovery to take up
to many months. No positive benefits
exist.
The difference between overreaching and overtraining (underrecovery) is the required recovery time to restore normal function!
What happens if the repeated stress is to great?• Fatigue… Gradual reduction in performance, and increasing recovery times.• If we do not register and adjust due to that fatigue… We progress along the
training continuum from fatigue to overreaching and ultimately overtraining.
Halson, S. L., & Jeukendrup, A. E. (2004). Does overtraining exist? Sports Medicine. 34(14), 967-981.
Meeusen, R., Duclos, M., Foster, C., Fry, A., Gleeson, M., Nieman, D., Raglin, J., Rietjens G., Steinacker, J., & Urhausen, A. (2013). Prevention, diagnosis, and treatment of the overtraining syndrome: joint consensus statement of the European College of Sports Science and the American College of Sports Medicine, 45(1), 186-205. doi: 10.1249/MSS.0b013e318279a10a.
Image modified from: http://www.mysportscience.com/#!Overtraining-is-it-real/cjds/54f487050cf2458597549940
How do I enjoy training, perform my best and prevent myself from going down the overtraining (under-recovery) continuum?
• Monitoring and adjusting!• Collecting psychological and physiologic data about yourself/your
athletes and assessing over time how that data relates to vigor and performance!• This can be scientifically valid, and effective – yet simple and easy to
implement!• Monitoring is a tool to assess readiness to train and athletic progress.
Like training, monitoring should beathlete not coach, centered.• Focus on measures that fit YOUR athlete/s are sustainable and wont create burnout
“How’d your workout go today?” “I don’t know, let me check…”
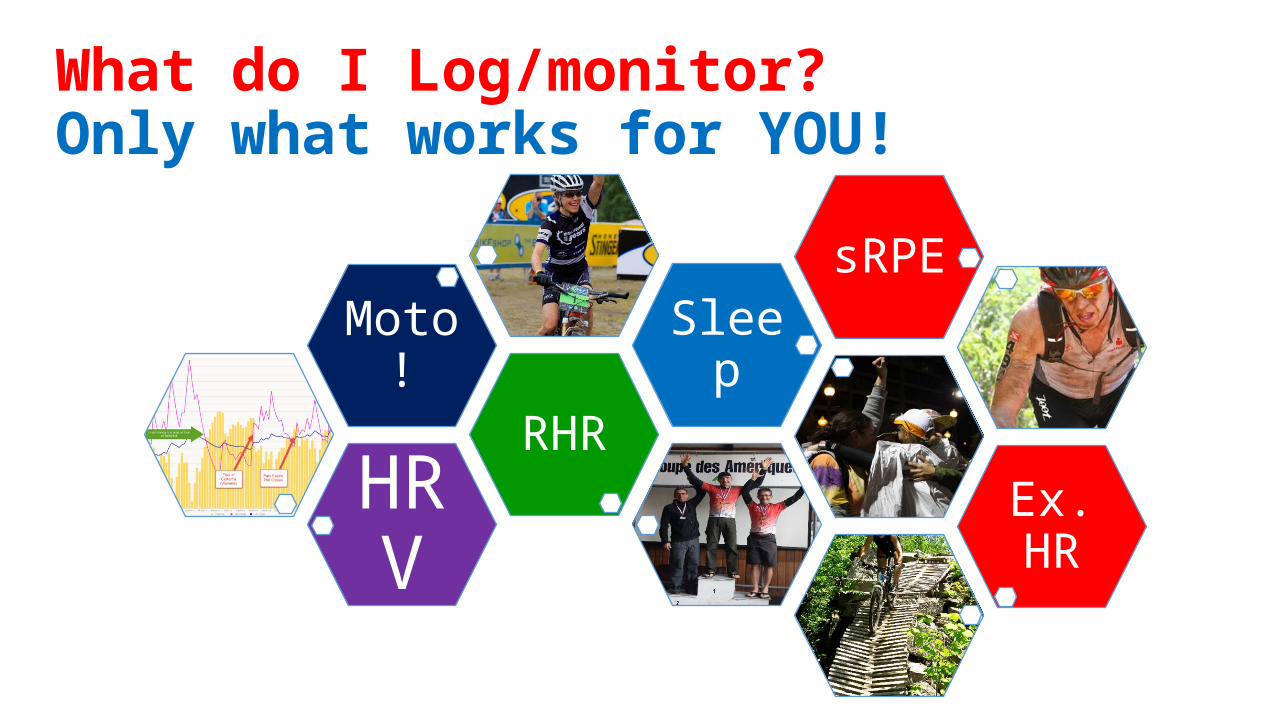
What do I Log/monitor?Only what works for YOU!
HRVRHR
Moto! Sleep
sRPE
Ex. HR
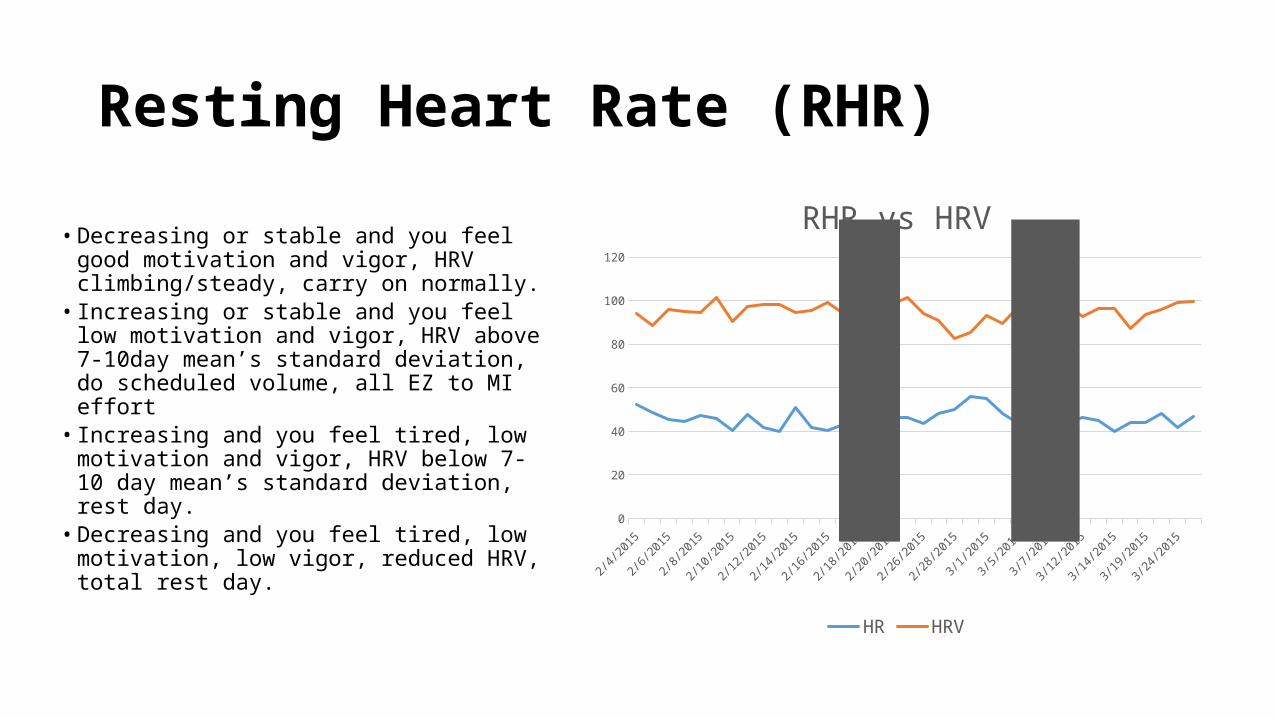
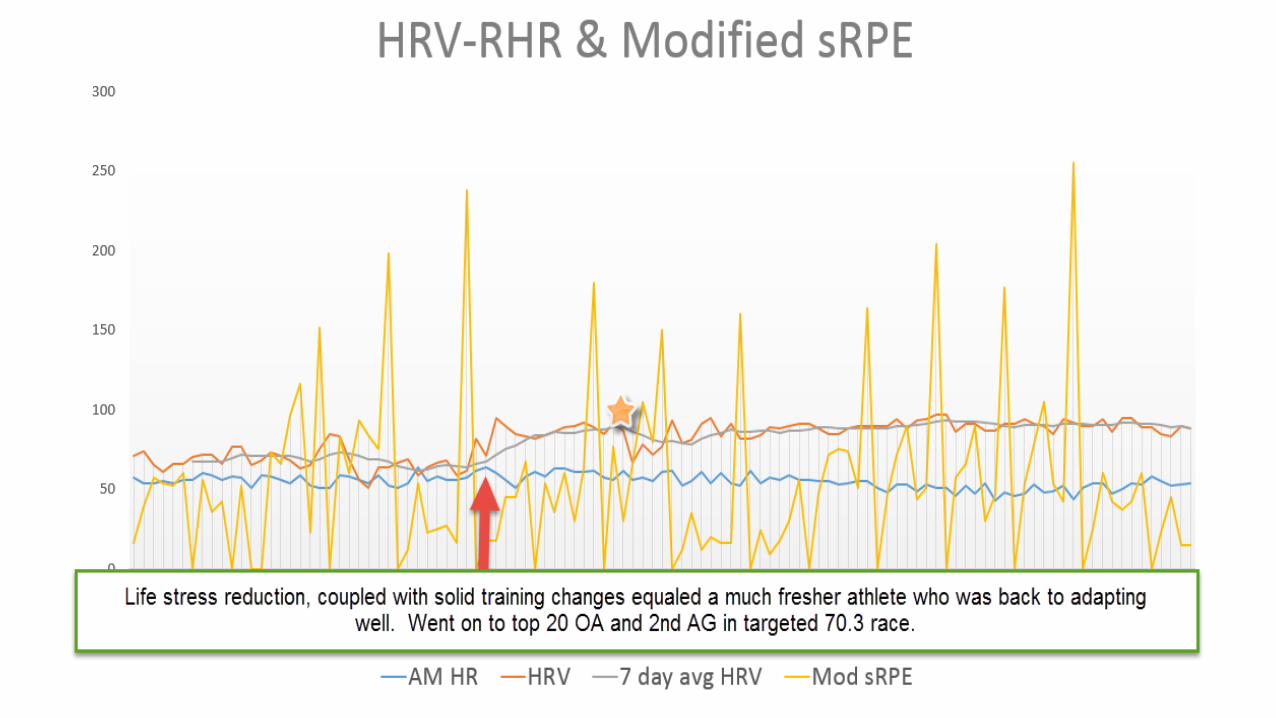
Resting Heart Rate (RHR)
• Decreasing or stable and you feel good motivation and vigor, HRV climbing/steady, carry on normally.
• Increasing or stable and you feel low motivation and vigor, HRV above 7-10day mean’s standard deviation, do scheduled volume, all EZ to MI effort
• Increasing and you feel tired, low motivation and vigor, HRV below 7-10 day mean’s standard deviation, rest day.
• Decreasing and you feel tired, low motivation, low vigor, reduced HRV, total rest day. 2/4
/2015
2/6/2
015
2/8/2
015
2/10/2
015
2/12/2
015
2/14/2
015
2/16/2
015
2/18/2
015
2/20/2
015
2/22/2
015
2/24/2
015
2/26/2
015
2/28/2
015
3/2/2
015
3/4/2
015
3/6/2
015
3/8/2
015
3/10/2
015
3/12/2
015
3/14/2
015
3/16/2
015
3/18/2
015
3/20/2
015
3/22/2
015
3/24/2
015
3/26/2
0150
20
40
60
80
100
120
RHR vs HRV
HR HRV
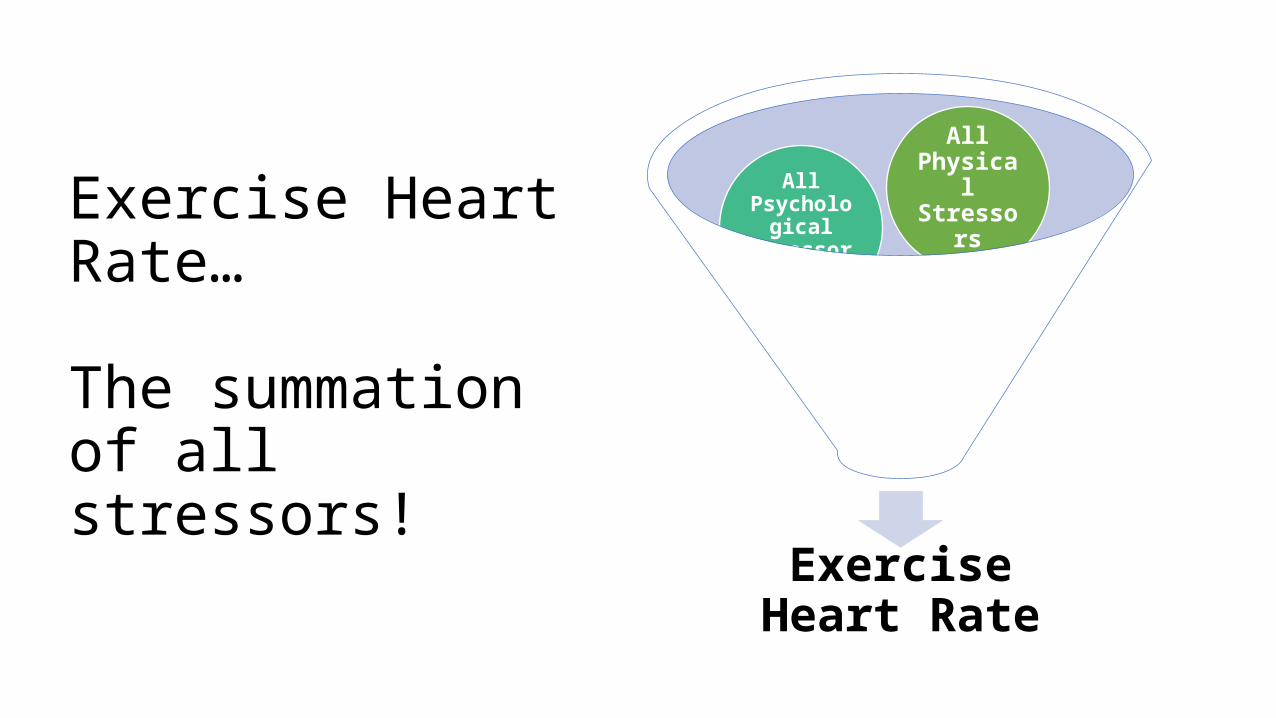
Exercise Heart Rate…
The summation of all stressors!
Exercise Heart Rate
The Decision
to do Work
All Psychological Stressors
All Physical Stressors
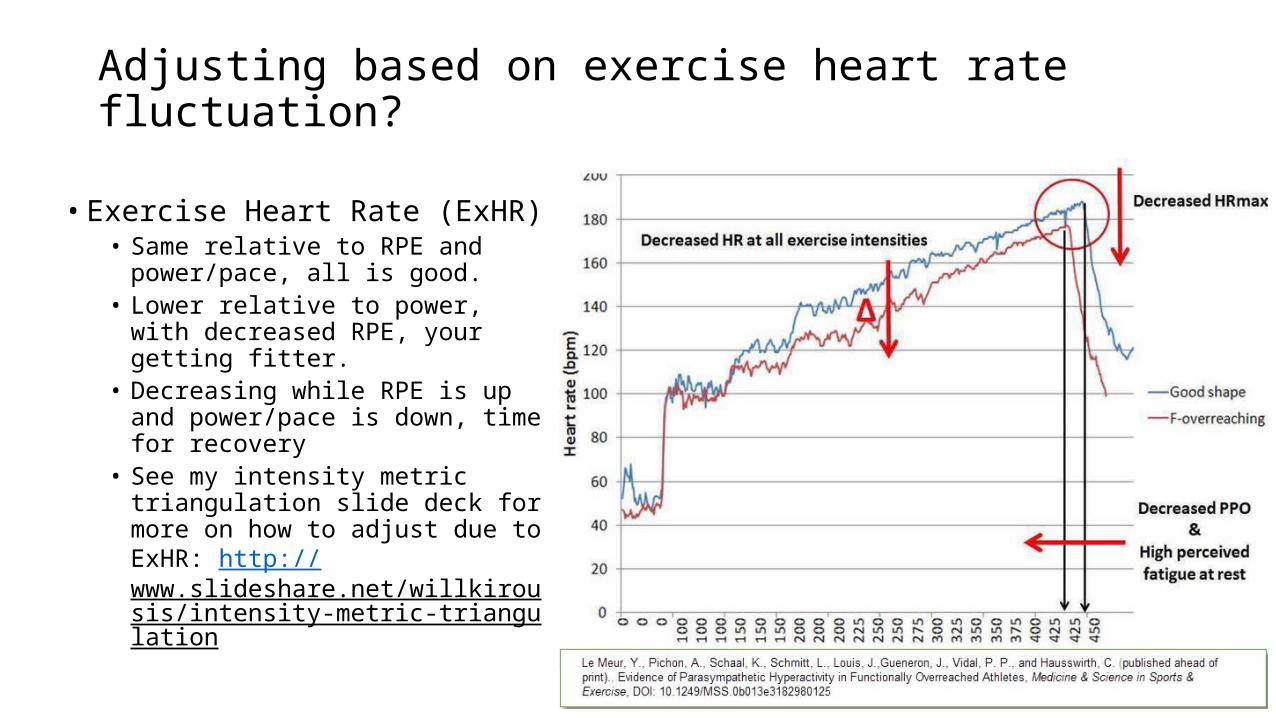
Adjusting based on exercise heart rate fluctuation?
• Exercise Heart Rate (ExHR)• Same relative to RPE and
power/pace, all is good.• Lower relative to power, with
decreased RPE, your getting fitter.• Decreasing while RPE is up and
power/pace is down, time for recovery
• See my intensity metric triangulation slide deck for more on how to adjust due to ExHR: http://www.slideshare.net/willkirousis/intensity-metric-triangulation
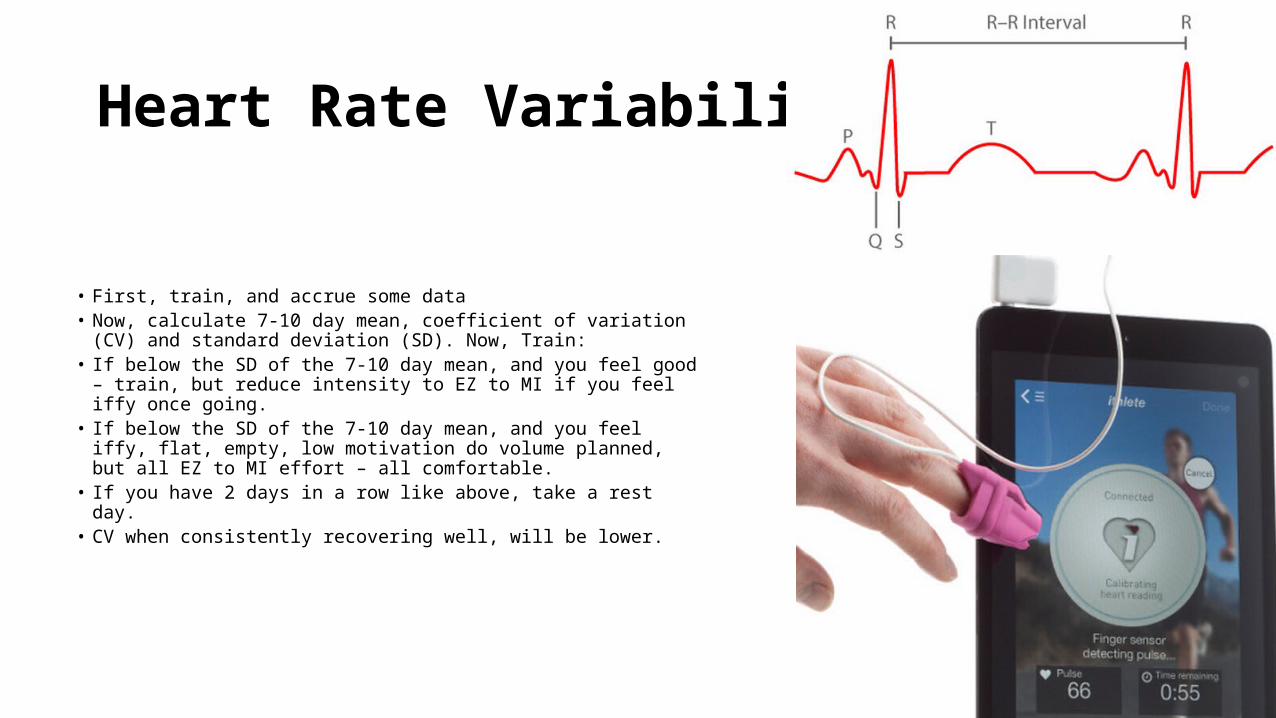
Heart Rate Variability (HRV)
• First, train, and accrue some data• Now, calculate 7-10 day mean, coefficient of variation (CV) and
standard deviation (SD). Now, Train: • If below the SD of the 7-10 day mean, and you feel good – train,
but reduce intensity to EZ to MI if you feel iffy once going.• If below the SD of the 7-10 day mean, and you feel iffy, flat, empty,
low motivation do volume planned, but all EZ to MI effort – all comfortable.
• If you have 2 days in a row like above, take a rest day. • CV when consistently recovering well, will be lower.
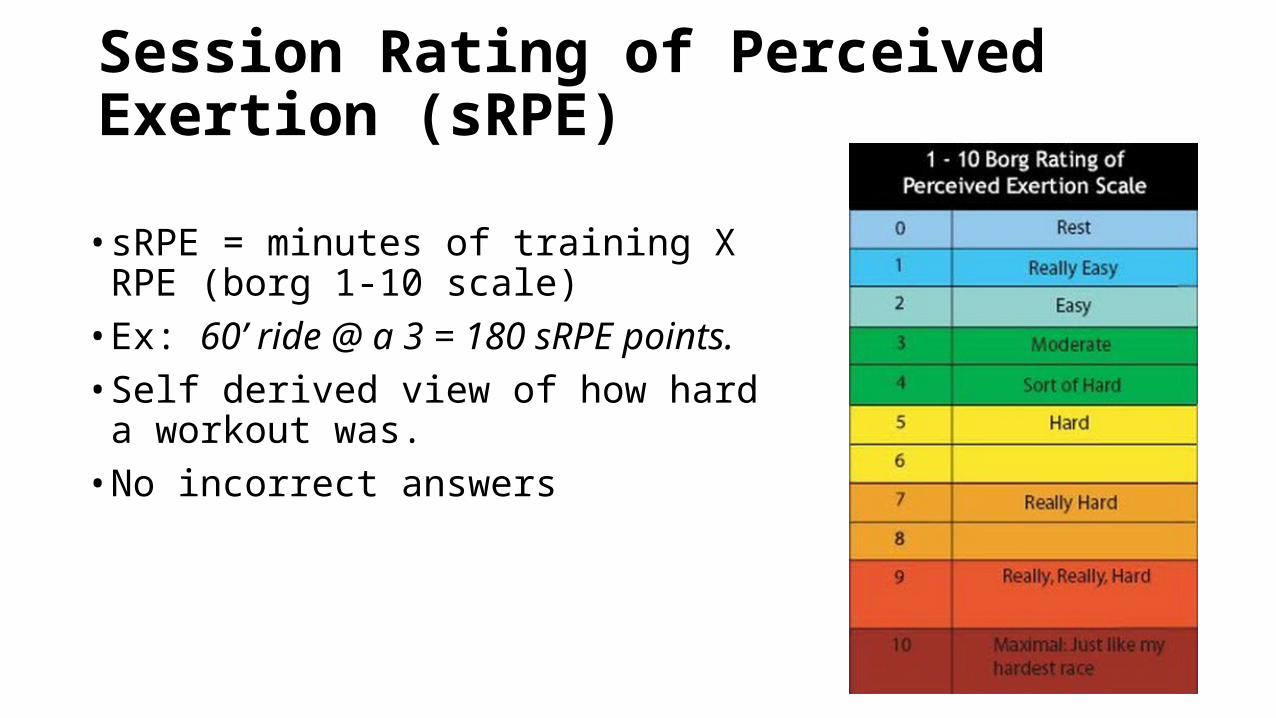
Session Rating of Perceived Exertion (sRPE)
• sRPE = minutes of training X RPE (borg 1-10 scale)• Ex: 60’ ride @ a 3 = 180 sRPE points.• Self derived view of how hard a workout was.• No incorrect answers
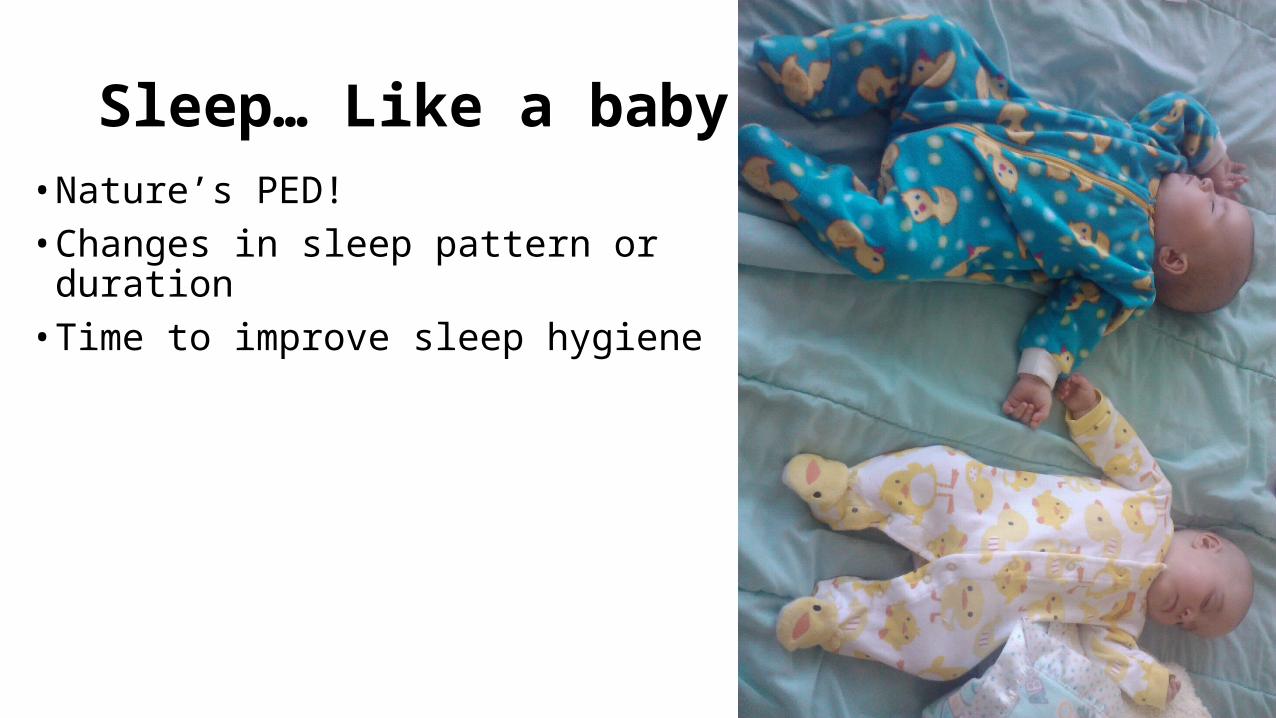
Sleep… Like a baby!• Nature’s PED!• Changes in sleep pattern or duration• Time to improve sleep hygiene
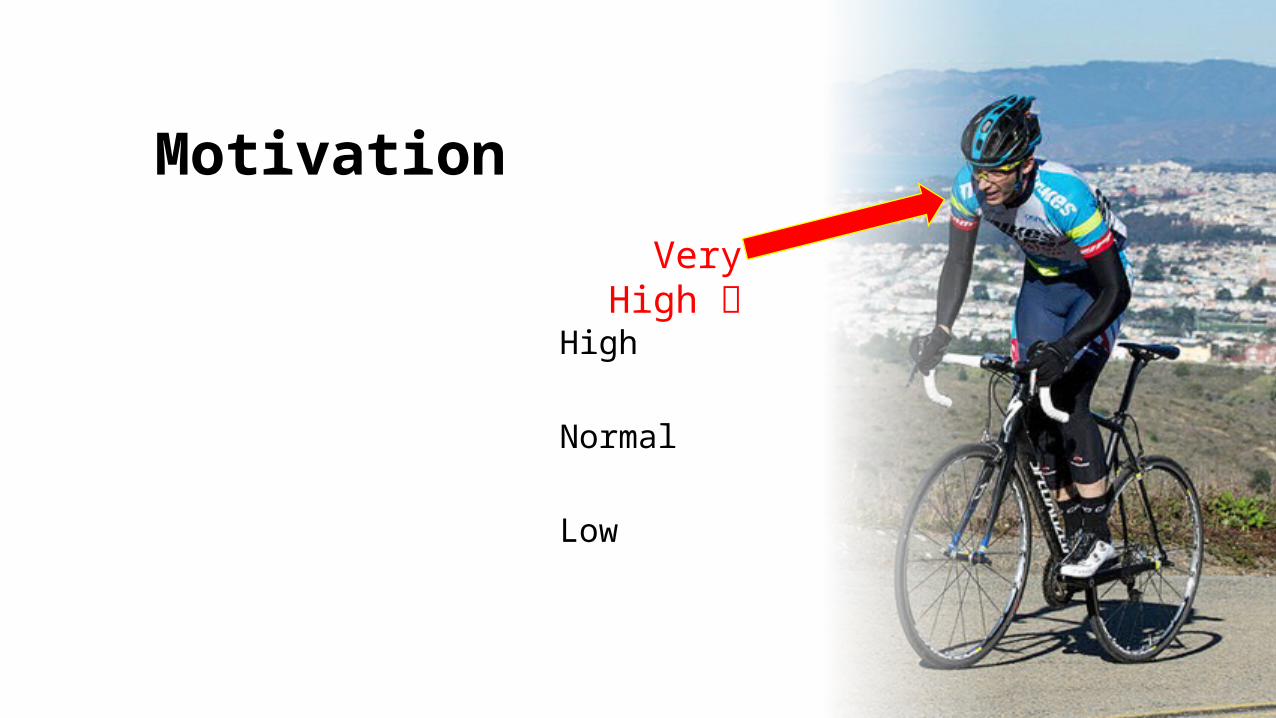
Motivation
High
Normal
Low
Very High
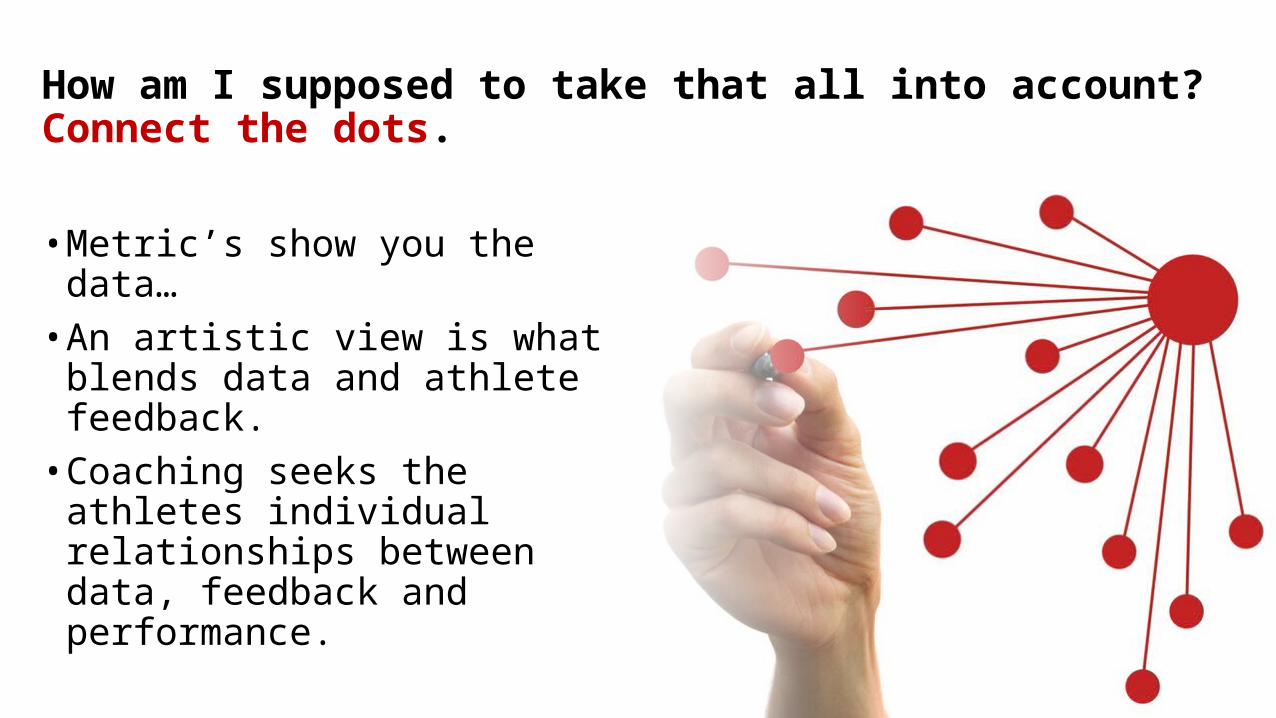
How am I supposed to take that all into account?Connect the dots.
• Metric’s show you the data…• An artistic view is what blends data
and athlete feedback.• Coaching seeks the athletes individual
relationships between data, feedback and performance.
For 2 days you see:• decreasing HRV (below your
standard deviation)• Increasing (5-8bpm) resting heart
rate• 1hr less sleep per night• Motivation ok on day one, lower
day 2.
Reduce load
For 1 or more days you see:• Stable HRV • Stable resting heart rate• Sleep normal• Motivation normal• Recent exercise heart rate normal
Train Normally
For 1 day you see:• Significantly decreased HRV (below your standard deviation)• 5+bpm elevation in resting HR• Sleep normal• Motivation ok, not great.• Most recent exercise heart rate 2-5bpm low relative to effort
and power/pace.
Modify workout to EZ for planned duration.If you feel iffy once started – not improving – pull the plug early and go home.If numbers repeated the next day, rest. Time to
AdjustWith cautious optimism
“Aren’t I training to little?”• Your looking for Goldilocks Porridge…• Only train enough to get the positive adaptations you
want/need.• This allows energy for growth.• It facilitates a positive, high motivation level towards
sport• You enjoy sport more, and get better!
Training just enough for Nadine =3rd AG ITU Cross Tri Worlds
1st AG Exterra Worlds2nd OA Woman Calgary Marathon
2nd Canadian mountain running championships
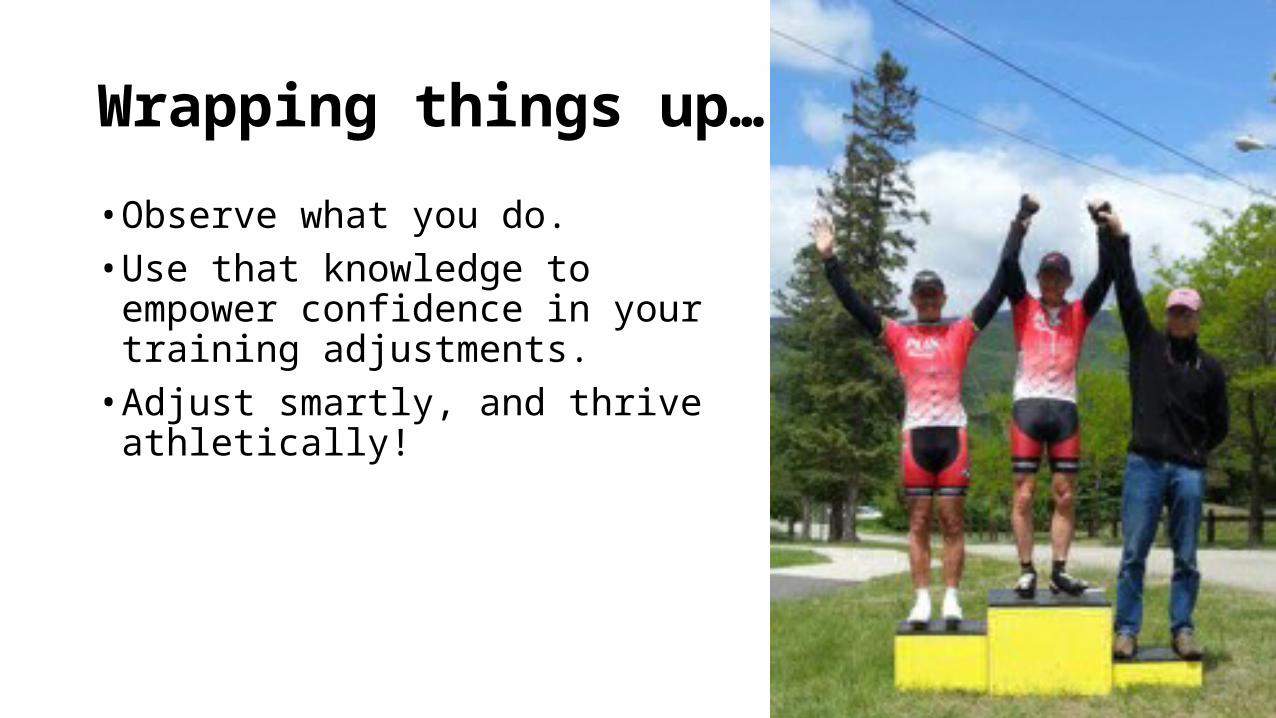
Wrapping things up…
• Observe what you do.• Use that knowledge to empower
confidence in your training adjustments.• Adjust smartly, and thrive athletically!

Questions?Will Kirousis
www.tri-hard.com
We Wish YOU An Awesome Season!