trade performance comparative advantage andfaculty.washington.edu/jwh/kowalski_2011.pdf ·...
TRANSCRIPT

Please cite this paper as:
Kowalski, P. (2011), “Comparative Advantage and TradePerformance: Policy Implications”, OECD Trade PolicyPapers, No. 121, OECD Publishing.http://dx.doi.org/10.1787/5kg3vwb8g0hl-en
OECD Trade Policy Papers No. 121
Comparative Advantage andTrade Performance
POLICY IMPLICATIONS
Przemyslaw Kowalski
JEL Classification: F11, F14, F16, F17

OECD TRADE POLICY WORKING PAPERS
The OECD Trade Policy Working Paper series is designed to make available to a wide
readership selected studies by OECD staff or by outside consultants.
This document has been declassified on the responsibility of the Working Party of the
Trade Committee under the OECD reference number TAD/TC/WP(2010)38/FINAL.
Comments on the series are welcome and should be sent to [email protected].
OECD TRADE POLICY WORKING PAPERS
are published on www.oecd.org/trade
© OECD 2011
Applications for permission to reproduce or translate all or part of this material should be made to: OECD Publishing, [email protected] or by fax 33 1 45 24 99 30

OECD TRADE POLICY WORKING PAPER NO. 121 © OECD 2011
Abstract
COMPARATIVE ADVANTAGE AND TRADE PERFORMANCE:
POLICY IMPLICATIONS
Przemyslaw Kowalski
Trade Policy Analyst, Development Division, OECD
This paper builds on recent generalisations of theory and empirics of comparative
advantage and establishes the relative importance of different sources of comparative
advantage in explaining trade, with particular focus on policy and institutional factors.
The broad policy and institutional areas posited as determinants of comparative advantage
in this paper include: physical capital, human capital (distinguishing between secondary,
tertiary education and average years of schooling), financial development, energy supply,
business climate, labour market institutions as well as import tariff policy. The empirical
investigation is performed for bilateral trade of 55 OECD and selected emerging market
(SEM) economies and 44 manufacturing sectors covering the entirety of merchandise
trade. Our results show that comparative advantage remains an important determinant of
trade and that it has changed over time, including as a result of changing policies and
institutions. The policy and institutional areas shown to be important determinants of
comparative advantage include physical and human capital accumulation (especially
secondary and tertiary education), financial development, the business climate, as well as
a number of aspects of labour market institutions. The results suggest also that
comparative advantage has been — and is likely to be in the future — relatively more
important for North-South and South-South trade. Overall, the results underscore the
importance of a comprehensive approach to designing economic development policies,
which should seek consistency between trade and other policy objectives.
JEL Classification: F11, F14, F16, F17.

COMPARATIVE ADVANTAGE AND TRADE PERFORMANCE: POLICY IMPLICATIONS – 3
OECD TRADE POLICY WORKING PAPER NO. 121 © OECD 2011
Table of contents
Executive Summary ......................................................................................................................... 4
1. Introduction ........................................................................................................................... 7
2. Sources of comparative advantage ........................................................................................ 8
3. Empirical methodology ......................................................................................................... 9
The empirical model.................................................................................................................. 9 Measurement of comparative advantage ................................................................................. 10 Factor intensities and factor endowments ............................................................................... 12 Human capital intensity and education policy ........................................................................ 12 Dependence on external credit and availability of credit ........................................................ 13 Energy intensity and energy supply ........................................................................................ 14 Input concentration and business climate ................................................................................ 15 Sales volatility and labour market rigidity .............................................................................. 15 Imported intermediate inputs and import tariff policy ............................................................ 16
4. Results ................................................................................................................................. 17
What have been the main sources of comparative advantage in the last decade? ................... 18 Has comparative advantage become less or more relevant for the trade
of OECD and non-OECD countries? ...................................................................................... 25
5. Conclusions ......................................................................................................................... 27
6. Variable definitions and data sources .................................................................................. 28
Distance and geography .......................................................................................................... 28 Factor intensities and factor endowments ............................................................................... 28 Human capital intensity and education policy ........................................................................ 29 Dependence on external credit and availability of credit ........................................................ 29 Energy intensity and energy supply ........................................................................................ 29 Input concentration and business climate ................................................................................ 29 Sales volatility and labour market rigidity .............................................................................. 29 Imported intermediate inputs and import tariff policy ............................................................ 30 Country coverage .................................................................................................................... 30
Annex tables and figures ................................................................................................................ 33

4 – COMPARATIVE ADVANTAGE AND TRADE PERFORMANCE: POLICY IMPLICATIONS
OECD TRADE POLICY WORKING PAPER NO. 121 © OECD 2011
Executive Summary1
For close to two centuries now the comparative advantage hypothesis has been used
as one of the principal explanations of international trade and, through gains from trade,
as one of the most potent explanations of higher incomes and income growth rates of
open economies. Nevertheless, the increasing mobility across border of factors of
production, ideas, technology, goods and services that characterised recent decades of
world commerce and resulted in significant changes in trade shares and specialisation
patterns (e.g. OECD, 2009a and Kowalski and Cavazos Cepeda, 2011) challenged policy
makers and analysts alike to explain better how the concept of comparative advantage
might relate to these changes and what policy insights it actually offers.
This paper builds on recent generalisations of theory and empirics of comparative
advantage as well as on numerous insights from the literature on various sources of
comparative advantage and attempts to quantitatively assess their relative importance for
bilateral trade flows at the industry level, with particular focus on policy and institutional
factors. In this respect, the study offers the most extensive coverage of geographical,
policy and institutional sources of comparative advantage in the existing literature.
The theory of comparative advantage indicates that specialisation according to
comparative advantage is a precondition for reaping gains from trade. Any substantive
interference with this process, even if it entails government support to sectors in which a
country may have ‗natural‘ comparative advantage, can reduce these gains or even render
them negative. To reflect this, the empirical work presented in this paper tries to get as
close as it is possible to capturing the ―natural‖ comparative advantage. That is, we
account for policies that do not target any particular sectors but rather reflect broad public
choices or seek to enhance general resource endowments, even though they may
indirectly favour some of the sectors. These broad policies are a potential source of
comparative advantage and thus of welfare gains from trade. Given the lack of conclusive
evidence on viability of targeted industrial policies in sustainably influencing
comparative advantage we exclude these policies as ones potentially hindering or
reducing the gains from trade.
1. This paper has been prepared by Przemyslaw Kowalski (e-mail: [email protected] )
under the supervision of Michael Plummer. This work is a part of the OECD project on The Effects
of Globalisation: Openness and Changing patterns of Comparative Advantage. The paper has
greatly benefited from consultations on empirical methodology with Patricia Sourdin and Ricardo
Cavazos, form statistical assistance of Clarisse Legendre and from help with identification and
collection of policy and sector dependence data by Ricardo Cavazos, Isabel Hofmann,
Anna Jankowska, Monika Sztajerowska and Zhang Bin. The paper has also benefited from
numerous comments on earlier drafts received at the OECD Enhanced Engagement Economies
Working Meeting on the project, the OECD Global Forum on Globalisation, Comparative
Advantage and Trade Policy Trade in Chengdu, China and a number of internal OECD seminars.
All the remaining errors and erroneous interpretations are the sole responsibility of the author.

COMPARATIVE ADVANTAGE AND TRADE PERFORMANCE: POLICY IMPLICATIONS – 5
OECD TRADE POLICY WORKING PAPER NO. 121 © OECD 2011
The paper focuses on the interactions between country and industry characteristics,
such as, for example, interactions of policies with specific needs of particular sectors of
the economy, that together form the basis for comparative advantage. The broad policy
and institutional areas posited as determinants of comparative advantage in this paper
include: physical capital accumulation, human capital accumulation (distinguishing
between secondary, tertiary education and average years of schooling), financial
development, energy supply, business climate, labour market institutions as well as
import tariff policy.2
The empirical investigation is performed on a group of 55 OECD and selected
emerging market (SEM) economies and 44 manufacturing sectors covering the entirety of
merchandise trade.3
Is comparative advantage still relevant today?
Overall, the results show that comparative advantage remains an important
determinant of trade. For example, capital-to-labour ratios are at least equally as
important in explaining industry patterns of trade as is geographical distance. The cross-
country differences in secondary and tertiary education provide approximately half of the
explanatory power as compared to distance, while the indicator of average years of
schooling has twice as large explanatory power as the distance variable. Other important
sources of comparative advantage include the availability of credit and primary energy
supply while regulatory quality and labour market rigidity tend to influence trade patterns
less significantly.
The comparative advantage theory emphasises the relative differences in productivity
between countries as the reason for international trade and hence for gains from trade.
The larger the differences in underlying sources of comparative advantage across
countries, the larger the gains from trade. Comparing jointly across the OECD and SEM
groupings we find that cross-country differences, and thus the potential for gains from
comparative advantage-driven trade, decreased for such sources of comparative
advantage as: physical capital, average years of schooling, tertiary education, primary
energy supply, availability of credit; while they increased for secondary education and
regulatory quality.
The OECD grouping considered alone has become more homogenous as far as many
comparative advantage sources are concerned, implying that the potential for comparative
advantage-driven North-North trade may have diminished. The non-OECD grouping, in
addition to being generally more heterogeneous, displayed no clear tendency for cross-
country differences to diminish over time, indicating a persistently high potential for
comparative advantage-driven South-South trade. The widening differences between
OECD and non-OECD for physical capital, availability of credit or regulatory quality
suggest an increasing potential for comparative advantage trade in North-South trade.
However, differences between OECD and non-OECD have narrowed for human capital
2. Though the paper attempts to follow best practices in the recent literature as far as measurement of
policies is concerned the choice of indicators and their interpretation might be contentious. The
readers are thus encouraged to consult the discussion of the choice of indicators and the associated
caveats in Section 3 of the paper.
3. Services trade has not been included due to data limitations but the general results on the importance
of comparative advantage for trade patterns are expected to hold for the services sectors as well.

6 – COMPARATIVE ADVANTAGE AND TRADE PERFORMANCE: POLICY IMPLICATIONS
OECD TRADE POLICY WORKING PAPER NO. 121 © OECD 2011
indicators. Overall these results suggest that comparative advantage has been — and is
likely to be in the future — relatively more important for North-South and South-South
trade than for North-North trade.
To what extent can governments influence comparative advantage?
Our results show that comparative advantage remains an important determinant of
trade and that it has changed over time, including as a result of changing policies and
institutions.
For example, the high explanatory power of physical or human capital revealed by
our results underscores the significance of policies that influenced the pace and quality of
physical and human capital accumulation. Similarly availability of credit has been found
to boost exports more in sectors with higher dependence on external financing. An
increase in primary energy supply-to-GDP ratio has been found to boost exports in
relatively energy-intensive sectors.
Taken together, our results underscore the importance of a comprehensive approach
to designing economic development policies, which should seek consistency between
trade and other policy objectives. Governments should avoid actively affecting trade
patterns in general but such actions may be particularly counterproductive if they are
inconsistent with country‘s resource base and other policies in place.
Thus, when seeking to maintain or develop competitiveness in a certain area—for
instance capital-intensive sectors—this is best achieved through drawing on best practices
and developing effective broad policies that facilitate capital accumulation. In case where
a country succeeds in increasing its endowment of capital, relative to other countries and
other factors of production, this is likely to result in the re-orientation of its exports
toward capital-intensive sectors. Importantly, a broad-based approach involves a lower
risk of reducing welfare gains from such specialisation, compared to policies involving
direct support to capital-intensive sectors, though we certainly cannot exclude the
possibility that the overall costs of such an approach exceed the benefits.
Moreover, the finding that comparative advantage has been evolving together with
policies and institutions does not imply that countries should try to actively influence it.
Instead, our results confirm that it is the differences between countries, including
differences in policy settings and policy performance, that create relative differences in
productivity and give rise to trade and gains from trade. Some of these differences in
policy settings may reflect different stages of economic development but some may also
reflect strategic policy choices such as, for instance, investment in human rather than
physical capital. This does not mean that countries should not try to catch up with their
best performing peers if they wish so but it emphasises that trade yields benefits even at
the early stages of such a catching-up process. More than anything, this implies that trade
openness and comparative advantage-driven specialisation is not a constraint to the
economic development process but rather its catalyst.
COMPARATIVE ADVANTAGE AND TRADE PERFORMANCE: POLICY IMPLICATIONS – 7
OECD TRADE POLICY WORKING PAPER NO. 121 © OECD 2011
1. Introduction
For close to two centuries now the comparative advantage hypothesis has been
suggested as one of the principal explanations of international trade and, indeed, as one of
the most potent explanations of higher incomes and income growth rates of open
economies.4 The main contribution of the comparative advantage hypothesis, introduced
first by David Ricardo in 1817, is that it is not the absolute differences in countries‘
abilities to produce certain goods and services that are at the heart of international trade
but rather the relative differences (e.g. Deardorff, 2011). Thus, a country that is more
efficient in producing a good than any another country may still find it profitable to
import that good and export other goods in which it is even more productive. Moreover,
countries can enhance their welfare by focusing their production on activities in which
they are relatively more efficient and exchanging their products for goods produced
relatively more efficiently in other countries (i.e. by trading in line with comparative
advantage).
As such, the concept of comparative advantage had a strong influence on economic
policy making in the post-WWII era, most notably the trade liberalisation initiatives
under the auspices of the GATT and the WTO, regional integration initiatives as well as
unilateral trade reforms, all of which placed emphasis on removing remaining trade
barriers and facilitating trade-related structural adjustment, so that countries can benefit
from comparative advantage-driven trade. But questions are being increasingly asked
about the extent to which comparative advantage is still relevant in explaining trade
flows. It has been argued that comparative advantage, with its focus on domestically-
based resources, is no longer appropriate in a world of integrated markets and fast-
changing information technology. Indeed, the increasing mobility across borders of
various factors of production, ideas, technology, goods and services, as well as the
significant actual changes in world trade patterns (e.g. OECD, 2009a and Kowalski and
Cavazos Cepeda, 2011) contrast with the traditionally static approach offered by the
comparative advantage-based trade models. To what extent are then the significant
changes in trade patterns observed in recent decades, such as for example the emergence
of China or India, related to the principle of comparative advantage?
There are also controversies surrounding policy implications of the theory of
comparative advantage. On the one hand, the theory indicates that an interference with
comparative advantage, even if it entails government support to sectors in which a
country may have ‗natural‘ comparative advantage, can reduce gains from trade or even
render them negative (Deardorff, 2011). On the other hand, as pointed out by Rodrik
(2009) even broad policies, not focused on any particular sector (e.g. education or capital
market policies), may influence conditions for development of certain activities more
than for others. What is then the ‗natural‘ comparative advantage? Can governments
influence comparative advantage in a fashion that is sustainable and beneficial for the
country and its trading partners?5
4. According to the concept of comparative advantage productive resources of an open economy are
directed towards sectors with the highest productivity, thereby raising aggregate productivity and
income levels. There is strong empirical evidence that open economies enjoy higher level of
incomes. Evidence on impact of trade on long-run rate of productivity growth is less conclusive (see
e.g. Nordas et al., 2006).
5. See, for example, Lin and Chang (2009) for a recent synopsis of the debate.

8 – COMPARATIVE ADVANTAGE AND TRADE PERFORMANCE: POLICY IMPLICATIONS
OECD TRADE POLICY WORKING PAPER NO. 121 © OECD 2011
This paper makes the first necessary step to answer some of these fundamental
questions. It does so by: (i) estimating the extent to which comparative advantage may
determine trade flows today as well as how this may have changed over time;
(ii) establishing the relative importance of different sources of comparative advantage in
explaining trade, with particular focus on policy and institutional factors; and
(iii) drawing policy conclusions.
2. Sources of comparative advantage
What then might determine the relative differences in countries‘ abilities to produce
certain goods and services? Some answers, but not all, can be found in the classical
theory of comparative advantage. In his original formulation of the hypothesis in 1817
David Ricardo posited that comparative advantage has its source in differences in relative
labour productivities and that a country will have a comparative advantage in the product
which it can produce at a lower opportunity cost relative to another country. In Ricardo‘s
famous example involving England and Portugal and cloth and wine England had
comparative advantage in production of cloth because its opportunity cost of focusing on
production of cloth was lower than the opportunity cost of focusing on production of
wine. This was so even though England may have been more efficient in producing wine
in absolute terms, i.e. using less units of labour per unit of wine. This classical example
focusing on relative productivity differences did not explain where they may be coming
from but already hinted at the heterogeneity of sources of comparative advantage, some
of which may be more persistent (e.g. Portugal‘s advantage in production of wine related
to its geographical location) as well as ones that may be more prone to change over time
(e.g. England‘s 19th century advantage in production of cloth).
The so called Hecksher-Ohlin-Samuelson (HOS) theory of comparative advantage
built on Ricardo‘s general formulation and provided an explanation as to why opportunity
costs of production may differ across countries. According to this theory, comparative
advantage depends on differences in relative factor endowments (land, labour and capital)
and production processes of different goods which use these factors in different
proportions. The great impact of this theory was related to the possibility of
accommodating various combinations of factors of production such as, for example, land,
capital, skilled and unskilled labour, and to the richness of policy insights it generated.
The implications of this theory of comparative advantage have been recently taken up in
an OECD study of changes in trade patterns and endowments (Stone et al., 2011).
Importantly, the HOS theory emphasised the interaction between product and country
characteristics that together form the basis for comparative advantage. This interaction
mechanism has been actively explored in recent years in the literature on institutional and
policy determinants of comparative advantage.
Indeed, recent generalisations of comparative advantage, referred to by Helpman
(2010) as ‗new sources of comparative advantage‘, focus strongly on the interaction of
policies and regulatory frameworks with specific needs of particular sectors of the
economy. For example, building on the seminal paper on the importance of financial
institutions for development by Rajan and Zingales (1998), Beck (2003) and Manova
(2008) showed that countries with better financial development export more in sectors
that tend to rely more on external financing. Countries with better rule of law have been
shown to export relatively more in sectors that have: lower levels of input concentration
(Levchenko, 2007); lower shares of customised inputs (Nunn, 2007); or have higher
levels of job task complexity (Costinot, 2009). Cunat and Melitz (2007) demonstrated

COMPARATIVE ADVANTAGE AND TRADE PERFORMANCE: POLICY IMPLICATIONS – 9
OECD TRADE POLICY WORKING PAPER NO. 121 © OECD 2011
that flexible labour market policies promote exports in industries characterised by higher
volatility of demand.
This paper builds on recent generalisations of theory and empirics of comparative
advantage (e.g. Costinot, 2009; and Chor, 2010) as well as on numerous insights from the
literature on specific sources of comparative advantage to quantitatively assess their
relative importance for bilateral trade patterns at the industry level, with particular focus
on policy and institutional factors. In this respect, the study offers the most extensive
coverage of geographical, policy and institutional sources of comparative advantage in
the existing literature. The policy and institutional areas posited as sources of comparative
advantage in this paper include physical and human capital endowments (distinguishing
between secondary, tertiary education and average years of schooling), financial
development, energy supply, doing business climate, a number of aspects of functioning
of labour markets as well as import tariff policy. To assure global coverage and to make
intra-OECD and extra-OECD comparisons the exercise is performed on a group of 55
OECD and selected emerging market (SEM) economies. In addition to providing insights
on relative importance of different sources of comparative advantage in general, the
approach allows cross-country assessment of differences in country characteristics and of
potential impact on trade flows of future changes in these characteristics across the
OECD and SEM economies.
3. Empirical methodology
The empirical model
The empirical methodology employed in this paper is based on Chor (2010) who
extends the aggregate Eaton-Kortum model of trade (Eaton and Kortum, 2002) to account
for industry trade flows. In Chor (2010) the non-random component of productivity level
of firms operating in a given industry is determined by the interaction between country
and industry characteristics. He motivates this approach in the following way: ―industries
vary in the factors and institutional conditions that they need for production, and
countries differ in their ability to provide for these industry-specific requirements.‖ The
interaction approach draws on classical trade theories as well as on the recent body of
empirical literature dealing with individual institutional sources of comparative
advantage. For instance, Romalis (2004) interacted country-level measures of factor
abundance with industry-level measures of factor intensities, as posited by the Hecksher-
Ohlin-Samuelson theory. Braun (2003), Beck (2003) and Manova (2008) interacted
country measures of credit availability with industry measures of dependence on external
financing. Levchenko (2007) interacted a measure of input concentration with indicators
measuring the quality of the rule of law. Nunn (2007) and Costinot (2009) conducted
similar analyses of the rule of law using, respectively, measures of share of customised
inputs and of job task complexity. Cunat and Melitz (2007) interacted a measure of labour
market flexibility with a measure of industry sales volatility.
Modifying Chor‘s notation to facilitate exposition the empirical model of bilateral
exports at the industry level can be defined as follows:
(1)

10 – COMPARATIVE ADVANTAGE AND TRADE PERFORMANCE: POLICY IMPLICATIONS
OECD TRADE POLICY WORKING PAPER NO. 121 © OECD 2011
where are exports of industry k from country i to country j in year t. and
are, respectively, exporter fixed effects and importer-product-year fixed effects. The
former type of fixed effects allow us to capture all unobserved exporter characteristics
that are not interacted with any industry characteristics (such as the size of exporter‘s
GDP, its GDP per capita or exchange rate). The latter type of fixed effect terms account
for all unobserved importer-product-year characteristics and in particular for any
unobserved demand or, indeed, comparative advantage factors specific to a particular
importer (e.g. the fact that a certain importer is an exceptionally significant demander of a
specific commodity). With such a specification of fixed effects the variation in bilateral
exports at industry level is left to be explained by relative differences in exporters‘
abilities to produce certain goods which stem from interactions of exporter‘s i
characteristics with characteristics of industry k, as well bilateral factors such as distance
, common language ), common border ), colonial relationship
), which offer a natural benchmark for comparison of impacts for the policy
and institutional variables.
The endowment, policy and institutional interaction terms are presented in the second
line of equation (1) with signifying the interaction of physical (or human)
capital-to-labour ratios in exporter i in year t with physical (or human) capital-intensity of
sector k. The interactive terms signify interaction between the indictor of n-
th institution or policy for exporter i in year t with an indicator of dependence of sector k
on institution or policy n. One example of such an interaction from the existing literature
would be an interaction of the World Bank index of labour market flexibility with an
industry-level indicator of sales demand volatility as in Cunat and Melitz (2007).
Equation (1) embeds several earlier empirical specifications of determinants of
exports proposed by the literature (e.g. the gravity model of trade) and allows including
as many country and industry interactions as one is capable of measuring and handling
econometrically. The approach decomposes determinants of trade flows and allows
capturing how well the conditions in country i provide for the production needs of
industry k. Consequently, estimation of parameters of equation (1) allows assessing the
relative importance of various sources of comparative advantage in the sample. For
instance, it allows determining whether differences in physical capital-to-labour ratios
across the sample have been more important in determining the industry pattern of trade
flows as compared to differences in financial development. In addition, the estimated
parameters can be interpreted in the context of cross-country variation in country
characteristics to shed light on trade implications of any potential future changes in these
country characteristics on a ceteris paribus basis (e.g. trade effects of aligning a given
country‘s policy with an average or with the level of best performing peers).
Measurement of comparative advantage
A number of structural and, more recently, institutional and policy sources of
comparative advantage have been identified in the literature. This section briefly
summarises this literature as it relates to the sources of comparative advantage accounted
for in the empirical exercise and justifies the data choices made.6
6. Section 6 of the paper can be consulted for more details on variable definitions and data sources.

COMPARATIVE ADVANTAGE AND TRADE PERFORMANCE: POLICY IMPLICATIONS – 11
OECD TRADE POLICY WORKING PAPER NO. 121 © OECD 2011
The theory of comparative advantage indicates that specialisation according to
comparative advantage is a precondition for reaping gains from trade. Any substantive
interference with this process, even if it entails government support to sectors in which a
country may have ‗natural‘ comparative advantage, can reduce these gains or even render
them negative. To reflect this, the empirical work presented in this paper tries to get as
close as it is possible to capturing the ‗natural‘ comparative advantage. That is, we
account for policies that do not target any particular sectors but rather reflect broad public
choices or seek to enhance general resource endowments, even though they may
indirectly favour some of the sectors. These broad policies are a potential source of
comparative advantage and thus of welfare gains from trade. For example, capital
accumulation can be encouraged by well developed financial markets and this can create
favourable conditions for development of a competitive capital-intensive activity, but
financial market reforms are not principally designed to favour any particular industry.
Similarly, a good education system may boost the endowment of human capital thus
favouring human-capital intensive activities, but good education policy does not directly
favour production of any particular good or service.
Given the lack of conclusive evidence on viability of targeted industrial policies in
sustainably influencing comparative advantage we exclude these policies as ones
potentially hindering or reducing the gains from trade (Box 1).
Box 1. The debate on targeted industrial policy
As discussed in more detail in Kowalski and Bottini (2011), the industrial policy, or infant industry, arguments posit that because of dynamic considerations, externalities, or large fixed costs, an economically viable industry would not be established by private agents in the absence of some form of help or a subsidy from government. Thus, with a targeted support the government can and should correct these negative externalities.
Yet, this proposition proved extremely controversial. The Washington Consensus of the early 1980s has led to promotion of structural adjustment programmes which promoted the power of markets over states in resource allocation and dismantling of policy regimes which were designed to promote industrial policy (Barnes et al., 2003). Some research inquiries that revisited this concept in the light of unprecedented performance of some Asian economies concluded that targeted industrial policies had been a failure and that the only viable role Asian governments had played was to promote economy-wide initiatives to correct market failures (World Bank, 1993).
However, this negative conclusion has also been questioned (e.g. Lall, 1994; Rodrik, 1994; Stilglitz, 1996). In a recent survey Rodrik (2009) takes stock of the industrial policy debate and argues that there is a strong theoretical case for it based on correcting market imperfections. Rodrik argues that the case against it does not address the central premise of the need or government‟s ability to help an industry become viable in certain circumstances, but rather rests on practical difficulties with its implementation. Firstly, governments may be incapable of correctly identifying the „winners‟ and, secondly, industrial policy may trigger unwanted rent-seeking behaviour. These potential problems have been identified as particularly dangerous for developing countries which would like to emulate the benefits obtained from industrial policy by some Asian economies but which do not have as capable bureaucracies and the political ability to withdraw stimulating measures at the right time (Pack, 2000).
Many cases of industrial policy have been documented in the literature. A positive account of South Africa‟s Motor Industry Development Programme has been given by Barnes et al. (2003). Chang in Lin and Chang (2009) described
the four decades long protection of the Japanese car industry by high tariffs, direct and indirect subsidies and restrictions on foreign direct investment before it became competitive in the world markets. Nokia group was cross-subsidised by its sister companies before it started making profits (Lin and Chang, 2009). Korean state owned firm POSCO benefited from import substitution-type of policies and the Brazilian aircraft company Embraer was established and developed into a global competitor through state ownership and export subsidies (Rodrik, 2009).
However, a significant scepticism persists about whether such specific examples constitute a case for a general recommendation of targeted industrial policy. Overall, currently, the debate on industrial policy remains “hung up on the question should we or should we not?” (Rodrik, 2009)
Source: Kowalski and Bottini (2011).

12 – COMPARATIVE ADVANTAGE AND TRADE PERFORMANCE: POLICY IMPLICATIONS
OECD TRADE POLICY WORKING PAPER NO. 121 © OECD 2011
Factor intensities and factor endowments
Differences in relative factor endowments have been proposed as a source of
comparative advantage in the Hecksher-Ohlin-Samuelson model of international trade.7 A
number of hypotheses identified within this framework find support in numerous
empirical studies showing that countries tend to export products whose production
requires a relatively intensive use of the factor of production in which they are relatively
well endowed. Thus, for instance, a capital-abundant country would tend to export
capital-intensive products and import labour-intensive products. Debaere (2003), Romalis
(2004), Chor (2010) and Stone et al. (2011) are some of the studies that demonstrate that
countries‘ relative endowments are informative of their pattern of trade.
The empirical model of trade developed in this paper follows this literature by
accounting for exporters‘ physical capital-to-labour ratios which are interacted with
capital intensities measured at the industry level. Given the lack of readily available
comprehensive time-series data on capital stocks for the 55 OECD and SEM economies
considered in our study physical capital stocks series have been constructed according to
the perpetual inventory method as where is gross fixed capital
formation in year t and is the depreciation rate.8 The Global Trade Analysis Project
(GTAP) database values of physical capital stock in 2004 for each country have been
taken as reference values while the data on gross fixed capital formation have been taken
from the World Bank’s World Development Indicators (WDI) database. Data on sectoral
factor intensities come from the GTAP database and are defined as respective shares of
individual endowments (skilled labour, unskilled labour and capital) in industry‘s total
purchases of primary factors of production. These factor intensities are presented in
Annex Figures 1-3.
Human capital intensity and education policy
In addition to physical capital the current study controls for human capital as a source
of comparative advantage. The importance of human capital accumulation in economic
performance has been studied by many economists. Lucas (1988) argued that human
capital accumulation is the ―engine of growth‖ citing the notable differences in
productivity of human capital relative to the smaller differences in productivity of
physical capital across countries. Romer (1990) and Barro (1991) carried out cross-
sectional studies and found empirical support for the positive relationship between human
capital accumulation and economic growth. Recently, Barro and Lee (2010) created a
new dataset of stocks of human capital based on educational attainment and found that
length of schooling has a significant effect on output as well as income at the country
level, particularly for secondary and tertiary levels of education. Some recent studies
dealing with the impact of human capital accumulation on trade performance include
Spiros and Riezman (2007), Manova (2008) and Spiros et al. (2009). 9
7. The implications and empirical verification of this strain of trade theory are addressed in the third
instalment of the ―Openness and effects of globalisation: Openness and Changing Patterns of
Comparative Advantage project‖ (see TAD/TC/WP(2010)14/FINAL).
8. Results of these estimations are available upon request.
9. Spiros and Riezman (2007) show that the skill level properties of human capital distributions
directly impact both the terms of trade as well as the effects of trade on inequality. Spiros et al.
(2009) confirm the welfare enhancing impact of education policies in switching terms of trade and

COMPARATIVE ADVANTAGE AND TRADE PERFORMANCE: POLICY IMPLICATIONS – 13
OECD TRADE POLICY WORKING PAPER NO. 121 © OECD 2011
The current exercise calculates the stocks and ratios of available human capital using
the Barro and Lee (2010) data on percentages of population that have completed
secondary and tertiary schooling combined with the WDI data on labour force as well as
the Barro and Lee (2010) data on average years of study. To control for human capital as
a source of comparative advantage in the presented empirical trade model these indicators
of human capital are interacted with the skilled labour-intensity calculated at the level of
manufacturing sector and defined as a share of skilled labour in industry‘s total purchases
of primary factors of production. The distinction between tertiary and secondary
education in Barro and Lee (2010) data allows a more nuanced analysis of relevance of
education policy for trade outcomes in the discussion of results.
Dependence on external credit and availability of credit
Financial development has been established as a pre-condition for economic
development. A seminal paper by Rajan and Zingales (1998) established that industrial
sectors that are relatively more in need of external finance develop faster in countries
with more developed financial markets. Beck (2003) and Manova (2008) built on this
idea and demonstrated that financial development translates into a comparative advantage
in industries that use more external finance. Beck (2003) demonstrated this effect using
data for 36 industries and 56 countries. Manova (2008) showed how such an effect may
arise in a theoretical trade model with heterogeneous firms where larger, more productive
firms have an advantage in obtaining external finance. She also found empirical evidence
for this effect using data on bilateral exports for 107 countries and 27 industries during
the period 1985-1995. More recently Chor (2010) confirmed the importance of credit
constraints as determinant of international trade patterns using a sample of 83 countries
and 20 industries and data for 1990.
This paper follows the approach initiated by Rajan and Zingales (1998) and adopted
by Beck (2003), Manova (2008) and Chor (2010) to measure external capital dependence
of a given industrial sector as the fraction of total capital expenditure not financed with
cash flow from operations. The specific indicator of external capital dependence comes
from Braun (2003) and is based on data for all publically traded US-based companies
from Compustat‘s annual industrial files. One modification that was performed for the
purposes of the current paper is matching the 3-digit ISIC categories used by Braun
(2003) with the GTAP sectoral classification.10
Following Manova (2008) and Chor
(2010) credit availability is measured as the WDI ratio of domestic credit to private sector
to GDP, an indicator that has the best country and time coverage as far as our sample is
concerned. This indicator of credit availability refers to financial resources provided to
the private sector, such as through loans, purchases of nonequity securities, and trade
credits and other accounts receivable, that establish a claim for repayment. For some
countries these claims include credit to public enterprises.
While the choice of the indicator of dependence on external capital follows recent
literature (e.g. Manova, 2008) and reflects the better availability of financial data for the
US companies, it is possible that the US data may not be representative. One argument
allowing countries to ‗move up the value chain‘. Manova (2008) measured the influence of human
capital on trade patterns using data on the average number of years of schooling.
10 The matching is approximate as the GTAP classification is less aggregate as compared to the 3-digit
ISIC. Hence, a number of GTAP sectors, particularly in the agro-food segment, are assumed to have
the same degree of dependence on external capital (see Annex Figure 5).

14 – COMPARATIVE ADVANTAGE AND TRADE PERFORMANCE: POLICY IMPLICATIONS
OECD TRADE POLICY WORKING PAPER NO. 121 © OECD 2011
for using the US data is, as Manova (2009) argues, that the United States is characterised
by one of the most advanced and sophisticated financial systems and that this makes it
reasonable that the US indicators reflect firms‘ true demand for external capital. Using
the US data is also convenient because it eliminates the potential for the measure of
dependence on external finance to be endogenously determined by country‘s level of
financial development or credit availability. However, the fact remains that the US
indicators of dependence on external capital might not be representative of other
countries, for example, those where government financing plays an important role. These
caveats need to be born in mind when interpreting the results.
Energy intensity and energy supply
Producing goods and services requires the use of energy inputs, which tend to be
scarce and often need to be imported. The shares of primary energy inputs in firms‘ costs
vary across industries; naturally they tend to be large in sectors that produce processed
energy products (e.g. Petroleum and coal products industry) but they are also large in
some heavy industry sectors such as Ferrous metals and Chemical, rubber and plastic
products or Minerals industries (see Annex Figure 4.) High reliance on energy inputs in
these sectors means that they are vulnerable to energy price hikes as well as external
supply-related pressures (i.e. reduction of supply leading to an increase in prices), in
particular in the case of energy-importing countries. Differences in sectoral energy
dependence as well as country characteristics in terms of primary energy supply policy
can thus be an important source of comparative advantage.
After an extensive research on available energy policy indictors we chose to measure
the extent of energy supply using the International Energy Agency (IEA) total primary
energy supply (TPES) statistic scaled by the value of GDP. The IEA TPES measures total
energy supply from a number of energy sources as found in their natural state, accounting
for their calorific content of various energy commodities and converting it into a common
unit of account (tonnes of oil equivalent). It equals production plus imports minus exports
minus international marine bunkers plus or minus stock changes. The TPES-GDP ratios
are calculated by dividing each country‘s annual TPES by each country‘s annual GDP
expressed in constant 2000 prices and converted to US dollars using PPP for the year
2000.
The definition of TPES statistic refers to energy supply but in fact the statistic
unavoidably reflects also demand factors, for example, through inclusion of energy
imports. In fact, the TPES-to-GDP ratio is one of the most commonly used measures of
energy intensity of economies, used extensively by the IEA, WB and general energy
economics literature. An additional caveat is that, the measure can reflect a host of
environmental and energy price policies, where countries with stricter energy use regimes
or better technologies can record relatively lower TPES ratios. In light of these caveats,
the interpretation of results based on this measure of energy supply should be approached
carefully. We propose to interpret TPES-to-GDP ratio not as a strict measure of country
relative natural endowment in energy sources but rather as a measure of general
availability or affordability of energy in a given exporting economy. The proposed
interaction term measuring sectoral dependence on energy is the ratio of total energy
costs to the value of output in the given sector calculated from the input-output data
available in the version 7 of the GTAP database.

COMPARATIVE ADVANTAGE AND TRADE PERFORMANCE: POLICY IMPLICATIONS – 15
OECD TRADE POLICY WORKING PAPER NO. 121 © OECD 2011
Input concentration and business climate
The business climate‘s impact on economic growth and development has been the
subject of a variety of recent studies many of which attempted to measure the impacts of
various doing business indicators on aggregate trade performance. Only a few studies
addressed the question of how the business climate can influence specialisation and
structure of trade. Levchenko (2007) proposed that institutional quality can be a source of
comparative advantage and analysed its impact on trade using a model that captures
differences in institutional quality through a framework of incomplete contracts. The
study proposed to proxy the industry-level dependence on institutional quality with a
measure of input concentration as a proxy for product complexity and found that
institutional aspects can significantly influence trade flows. Costinot (2009) identified the
impact of institutional quality on the productivity of various sectors by taking into
account different levels of job task complexity associated with production of different
goods and found that especially in complex industries good institutions can be a
complementary source of comparative advantage. Nunn (2007) analysed the impact of
contract enforcement on exports in the context of industry differences in relation-
specificity as proxied by shares of customized inputs. He found that good contract
enforcement is especially important for the export performance of relationship-specific
sectors and that this has a crucial impact on the pattern of trade: ―contract enforcement
explains more of the global pattern of trade than countries‘ endowments of physical
capital and skilled labour combined‖ (Nunn, 2007, p.594). All of the above studies used
inter alia the rule of law indicator from World Bank’s Governance Indicators database as
a proxy for institutional quality.
The current paper follows this literature and attempts to measure the extent of
comparative advantage stemming from interactions of regulatory quality, as measured by
country-level indicators of regulatory quality, rule of law and control of corruption, with
product complexity, as measured by an industry-level indicator of intermediate input
dispersion. The former three indicators are the components of the World Bank’s
Governance Indicators database that seem the most appropriate for measuring the quality
of enforcement of commercial contracts.11
The choice of the sector-dependence indicator
follows Levchenko (2007) and Chor (2010) who proposed to measure the product
complexity with the Herfindhal index of intermediate inputs dispersion. The index is
calculated for the United States12
based on input-output information from the version 7 of
the GTAP database. The specific hypothesis is the one posited in the literature that the
higher the intermediate input dispersion in a given industry (and thus the higher the
complexity of products) the more important the quality of the legal framework for export
performance.
Sales volatility and labour market rigidity
Cunat and Melitz (2007) proposed that differences across countries in labour market
characteristics determine how firms adjust to idiosyncratic shocks and that they interact
with sector-specific differences in demand volatility to generate a new source of
comparative advantage. Specifically, they found that countries with more flexible labour
11
The other three governance indicators included in this database are voice and accountability, political
stability and government effectiveness.
12 It is a common approach in the related literature to take the US as a benchmark.

16 – COMPARATIVE ADVANTAGE AND TRADE PERFORMANCE: POLICY IMPLICATIONS
OECD TRADE POLICY WORKING PAPER NO. 121 © OECD 2011
markets tend to specialise in sectors with higher volatility of demand. This paper follows
this hypothesis and includes interactions of selected indicators of labour market
regulation measured at the exporter level with an indicator of sectoral demand volatility.
There are a number of sources of information on labour market institutions including
the subcategory of World Bank Doing Business Database on Employing Workers or the
OECD Indicators of Employment Protection. However, country and time-coverage
considerations as well as the extent of the covered detail and time variation in the data13
led us to adopt indicators of regulation of labour markets developed by Botero (2004).
This dataset covers legal rules in 85 countries in year 1997 and encompasses three types
of laws: employment laws; collective relations; and social security laws, from which we
retain the first two on the basis of more direct relevance of these laws for adjustment to
economic shocks. Employment laws govern the individual employment contract.
Collective or industrial relations laws regulate the bargaining, adoption, and enforcement
of collective agreements, the organisation of trade unions, and the industrial action by
workers and employers. As proposed by Cunat and Melitz (2007) these regulations may
impose rigidities and prevent markets from adjusting to economic shocks by raising the
cost for firms to hire workers and the cost of adjusting employment levels. For example,
laws that raise the cost of employment adjustment, in particular those related to
employment protection tend to reduce the inflow into unemployment, make firms more
careful about hiring employees, and reduce the flow out of unemployment.
The following measures of labour regulation from Botero, et al. (2004) are used in
our study. Alternative contracts measures the existence and cost of alternatives to the
standard employment contract. Cost of increasing hours worked measures the cost of
increasing the number of hours worked. Cost of firing workers measures the cost of firing
20% of the firm‘s workers. Dismissal Procedures measures worker protection granted by
law or mandatory collective agreements against dismissal. Labour Union Power measures
the statutory protection and power of unions as the average of seven indicator variables
indicating the presence of absence of various unionization rights and obligations.
Collective Disputes measures the protection of workers during collective disputes as the
average of eight more detailed indicator variables measuring presence or laws protecting
industrial action. All of these indicators are constructed so that a higher indicator marks
more rigid regulations. The adopted measure of sector-level sales volatility comes from
Braun (2003) who estimated sales volatility using data for all publically traded US-based
companies from Compustat‘s annual industrial files.14
Its variation across sectors
according to the GTAP industry classification can be consulted in Annex Figure 7.
Imported intermediate inputs and import tariff policy
The final source of comparative advantage investigated in this paper concerns tariff
protection and its impact on imports of intermediate inputs. Miroudot et al. (2009)
estimate that trade in intermediate inputs represents respectively 56% and 73% of overall
trade flows in goods and services and takes place mostly among developed countries.
13. The OECD data are only available for the OECD countries and a small number of non-member
countries in 2008. The Employing Workers segment of the WB Doing Business data is more
aggregated as compared to Botero et al. (2004) and covers only the period 2004-2010.
14. The same data source has been used by Manova (2008). One modification that had to be performed
for the purposes of the current paper was to match the 3-digit ISIC categories used by Braun (2003)
with the GTAP sectoral classification. See also footnote 9.

COMPARATIVE ADVANTAGE AND TRADE PERFORMANCE: POLICY IMPLICATIONS – 17
OECD TRADE POLICY WORKING PAPER NO. 121 © OECD 2011
They also find that in comparison to trade in final goods, imports of intermediates are
more sensitive to trade costs. It is also a fact that industries differ with respect to ratios of
values of imported intermediate inputs to the value of production with Petroleum and
coal products as well as Electronic equipment industries recording the highest shares
(Annex Figure 8). It is thus proposed that the general level of tariff protection may
constitute a source of comparative advantage with less protected economies having an
advantage in sectors with high shares of imported intermediate inputs.
To account for such a possibility the level of average applied tariffs (from the UN
TRAINS database) imposed by a given exporter is interacted with industry dependence
on imported intermediate inputs. The latter is defined as the ratio of the value of imported
intermediate inputs to the value of output in a given industry and calculated on the basis
of the input-output data available from version 7 of the GTAP database. It is worth
emphasising that the direct effects of import tariffs faced by exporters in destination
markets are accounted for implicitly by the importer-product-year fixed effects ( ) and
thus should not bias other estimates. The import tariff variable used explicitly in our
empirical model captures any impact a restrictive import regime may have on relative
costs of production across sectors in the country that imposes the tariff. Thus, the
estimated coefficients on tariff interaction terms should not be interpreted as measuring
the impact of trade protection on trade in general but rather as measuring the extent to
which high tariffs on imported intermediate inputs affect sectoral trade patterns.
4. Results
Data described in the previous section have been collected for 55 OECD and SEM
economies for the period 1990-2009 but the coverage of policy and institutional
determinants of comparative advantage is sometimes patchy. The choices of indicators
described above already internalise some of the data availability constraints, with some of
the proposed measures chosen on the basis of their time and country-coverage. In
addition, 1995 and 2005 were selected as the years with the most consistent coverage of
policies that also offer a comparison over a sensibly long time period. Thus, the empirical
model is estimated separately as two cross sections for years 1995 and 2005 and jointly as
a panel consisting of observations for 1995 and 2005 (i.e. including cross-sectional as
well as time-series data). The existing empirical literature on institutional determinants of
comparative advantage is based on cross-sectional estimations or on panels with short
time spans so the addition of the time dimension in the current approach can be seen as an
improvement.15
Instead of estimating the log-log version of model (1) we use the conditional Poisson
fixed effects estimator with robust standard errors. This procedure uses the value of
exports as the dependent variable and thus enables inclusion of observations for which
bilateral trade is zero16
, while at the same time yielding β coefficients that can be
15 Cunat and Melitz (2007) estimate a cross section for 1996; Chor (2010) estimates a cross-section for
1990, Manova (2008) estimates a panel covering the 1985-1995 but has less extensive coverage of
different institutional comparative advantage determinants.
16 Santo-Silva and Tenreyro (2006) highlight the importance of accounting for zero trade flows as well
as addressing the form of heteroskedasticitiy inherent in the log-linearization of the multiplicative
form of the gravity equation. This form of heteroskedasticity induces biases in the OLS estimator –
thus rendering the resulting estimates unreliable for policy analysis. The Monte Carlo simulation
results obtained in their paper show that the Poisson pseudo maximum likelihood estimator provides

18 – COMPARATIVE ADVANTAGE AND TRADE PERFORMANCE: POLICY IMPLICATIONS
OECD TRADE POLICY WORKING PAPER NO. 121 © OECD 2011
interpreted as elasticities (e.g. Dennis and Shepherd, 2007). The results of estimations for
1995, 2005 and the 1995-2005 panel are reported in, respectively, Annex Tables 1-3. The
significance of different sources of comparative advantage is established by estimating
individual models involving all fixed effects and distance and geography variables and a
specific institutional or policy variable (or a set of variables) (columns 2-8 in Annex
Tables 1-3) as well as by estimating joint models with all policy and distance and
geography variables included in the same estimation (column 17 in Annex Tables 1-3).17
What have been the main sources of comparative advantage in the last decade?
In most cases the present study confirms the main results from the recent literature on
the importance of individual sources of comparative advantage (see Section 3). In
addition, it contributes to this literature by offering comparisons of their relative
importance within one consistent framework. The contribution that is the closest to the
current one in terms of coverage of policy and institutional areas is Chor (2010). Chor‘s
(2010) results for 1990 can be used to compare the importance of relative factor
endowments, financial development, legal system and employment flexibility but the
study does not cover the energy supply or import tariffs and its treatment of human
capital and labour market rigidity is less detailed as compared to the current study.
To facilitate the interpretation of results and to establish which of the posited source
of comparative advantage are more important in determining exports, we calculate
standardised coefficients that capture the impact on exports of one standard deviation
change in a given explanatory variable, relative to the impact of one standard deviation
decrease in the logarithm of distance (Figure 1).18
As such, the standardised coefficients
combine the information on estimated elasticities presented in Annex Tables 1-3 with the
information on the extent of variation in explanatory variables in the underlying dataset.
They can be interpreted as measures of relative importance of different explanatory
variables in explaining export outcomes. To establish a benchmark, and taking France as
an example, a one standard deviation decrease in the distance variable, equivalent to
decreasing the distance between France and Slovakia to France and Switzerland19
(i.e. by
62%) results in boosting exports by, on average, 53%.
consistent estimates of the parameters of the gravity equation, while simultaneously ridding the
model of the induced bias. In addition, since the model is estimated with the dependent variable in
levels, rather than in logs, the problem of omitting zero trade is circumvented.
17 Some of the individual policy indicators are highly correlated with each other (e.g. the Governance
Indicators) and cannot be included in the same regression because of the risk of multicollinearity. In
such a case only one variable concerning this policy area is included. E.g. regulatory quality and
rule of law interactions are included separately in regressions (6-9) and only regulatory quality is
included in the joint regression (column 17).
18 The choice of a comparator is not important for assessing relative impacts of other variables but
comparisons with distance are interesting in themselves given the past rivalry between the neo-
classical trade theory based on comparative advantage and the new trade theory based on increasing
returns and integrating trade costs. Distance is also a natural comparator because of the highly
significant and stable results it yield across various model specifications (see Annex Tables 1-3).
19 Switzerland is France‘s closest trading partner in our dataset. The measure of distance used in the
current paper is the population-weighted distance statistic from the CEPII Distances database. This
is the distance between two countries based on bilateral distances between the biggest cities of those
two countries, those inter-city distances being weighted by the share of the city in the overall
country‘s population.

COMPARATIVE ADVANTAGE AND TRADE PERFORMANCE: POLICY IMPLICATIONS – 19
OECD TRADE POLICY WORKING PAPER NO. 121 © OECD 2011
It is important to keep in mind that in the considered model the variation in
interaction terms is driven by both the variation in country characteristics (e.g. cross-
country variation in years of schooling) as well as the variation in sector characteristics
(e.g. cross-industry variation skilled labour-intensity). As can be consulted in Annex
Figures 9-24, standard deviations in these interaction terms calculated across all exporter-
importer-industry observations are typically larger than standard deviations in policy
indicators calculated across exporters. Figure 2 accounts for this by presenting the
estimated average impacts on exports of one standard deviation change in a given policy
indicator calculated across exporters in 2005.
In general, estimations that consider policy and institutional factors one by one
(individual models) yield results that are more ‗attractive‘ in terms of statistical
significance, as compared to estimations that account for all factors at the same time
(joint models). This is not entirely surprising since some policy indicators are correlated
with each other resulting in various degrees of multicollinearity and problems with
attributing variation in the dependent variable to variation in specific independent
variables, which in turn is reflected in sign changes and reduction in statistical
significance of estimated coefficients. Hence, in what follows the discussion of results
considers both these types of estimates.
Factor intensities and factor endowments
The coefficients on interaction terms involving physical capital-to-labour ratios and
capital intensities are either close to or larger than one (Figure 1) indicating that
endowments of physical capital are at least equally as important in explaining industry
patterns of trade as is geographical distance. The estimated ceteris paribus percentage
impacts on exports of one standard deviation change in the capital-to-labour ratio are,
depending on model specification, between 15 and 33% (Figure 2), suggesting a
relatively large effect.
To give an example, one standard deviation increase in capital-to-labour ratio is
equivalent to increasing the 2005 capital-to-labour ratio of Brazil to that of the Czech
Republic or, equivalently, the one of the Czech Republic to that of Switzerland (Annex
Figure 9). These are important changes indicating a considerable degree of variation in
capital-to-labour ratios across countries in our sample. Importantly, the so called BRIIC
countries (Brazil, Russia, India, Indonesia and China) record still some of the lowest
capital-to-labour ratios in 2005 in the sample despite relative high investment rates in
recent years. The importance of capital-to-labour ratios revealed by our estimations, the
relatively low positioning of the BRIIC countries in the capital-to-labour ratio ranking at
the end of the 2000s, and the high rates of income growth in recent decades combine to
suggest that important changes in trade structures, such as an expansion of these
countries‘ shares in exports of capital-intensive products, are likely to continue. This
stresses the significance of policies that influence the pace and quality of physical capital
accumulation.

20 – COMPARATIVE ADVANTAGE AND TRADE PERFORMANCE: POLICY IMPLICATIONS
OECD TRADE POLICY WORKING PAPER NO. 121 © OECD 2011
Figure 1. Standardised coefficients on policy and institutional determinants of comparative advantage
Impact on exports relative to the impact of one standard deviation increase in the log of distance
Panel A. Individual policy models (corresponding to columns 2-16 in Annex Tables 1-3)
-1.5 -1.0 -0.5 0.0 0.5 1.0 1.5 2.0 2.5
log(distance)
(K/L)*capital intensity
log(secondary schooling) * skilled-labour intensity
log(tertiary schooling) * skilled-labour intensity
log(years of schooling) * skilled-labour intensity
log(energy supply) * energy intensity
financial development * dependence on external finance
regulatory quality * input dispersion
rule of law * input dispersion
control of corruption * input dispersion
protection to standard employment contract * volatility
cost of increasing the number of hours * volatility
cost of firing labor force * volatility
statutory power and protection of unions * volatility
protection during collective disputes * volatility
log (average applied tariff) * imported inputs share
2005 model 1995 model 1995-2005 model
Panel B. Joint policy model (corresponding to column 17 in Annex Tables 1-3)
-1.5 -1.0 -0.5 0.0 0.5 1.0 1.5 2.0 2.5
log(distance)
(K/L)*capital intensity
log(secondary schooling) * skilled-labour intensity
log(tertiary schooling) * skilled-labour intensity
log(years of schooling) * skilled-labour intensity
log(energy supply) * energy intensity
financial development * dependence on external finance
regulatory quality * input dispersion
rule of law * input dispersion
control of corruption * input dispersion
protection to standard employment contract * volatility
cost of increasing the number of hours * volatility
cost of firing labor force * volatility
protection against dismissal * volatility
statutory power and protection of unions * volatility
protection during collective disputes * volatility
log (average applied tariff) * imported inputs share
2005 model 1995 model 1995-2005 model
Note: only results statistically significant at 10% and stricter levels are reported.

COMPARATIVE ADVANTAGE AND TRADE PERFORMANCE: POLICY IMPLICATIONS – 21
OECD TRADE POLICY WORKING PAPER NO. 121 © OECD 2011
Figure 2. Average impacts of exports of one standard deviation change in policy indicator
Average % change in exports
Panel A. Individual policy models (corresponding to columns 2-16 in Annex Tables 1-3)
-40 -20 0 20 40 60 80 100
log(distance)
(K/L)*capital intensity
log(secondary schooling) * skilled-labour intensity
log(tertiary schooling) * skilled-labour intensity
log(years of schooling) * skilled-labour intensity
log(energy supply) * energy intensity
financial development * dependence on external finance
regulatory quality * input dispersion
rule of law * input dispersion
control of corruption * input dispersion
protection to standard employment contract * volatility
cost of increasing the number of hours * volatility
cost of firing labor force * volatility
statutory power and protection of unions * volatility
protection during collective disputes * volatility
log (average applied tariff) * imported inputs share
2005 model 1995 model 1995-2005 model
Panel B. Joint policy model (corresponding to column 17 in Annex Tables 1-3)
-20 0 20 40 60 80 100 120
log(distance)
(K/L)*capital intensity
log(secondary schooling) * skilled-labour intensity
log(tertiary schooling) * skilled-labour intensity
log(years of schooling) * skilled-labour intensity
log(energy supply) * energy intensity
financial development * dependence on external finance
regulatory quality * input dispersion
rule of law * input dispersion
control of corruption * input dispersion
protection to standard employment contract * volatility
cost of increasing the number of hours * volatility
cost of firing labor force * volatility
protection against dismissal * volatility
statutory power and protection of unions * volatility
protection during collective disputes * volatility
log (average applied tariff) * imported inputs share
2005 model 1995 model 1995-2005 model

22 – COMPARATIVE ADVANTAGE AND TRADE PERFORMANCE: POLICY IMPLICATIONS
OECD TRADE POLICY WORKING PAPER NO. 121 © OECD 2011
Human capital intensity and education policy
Estimated coefficients on stocks of available human capital and ratios of average
years of schooling interacted with skilled labour-intensity reveal some of the most
statistically significant and robust results. Standardised coefficients are around 0.4 and
0.3 for the stock of labour force with secondary and tertiary schooling, respectively, and
about 1.5 for the average years of schooling variable. These coefficients indicate that the
first two variables have a smaller power in terms of explaining variation in observed
industry-level bilateral trade flows as compared to distance, while the variable indicating
average years of schooling has twice as large explanatory power as the distance.
Standardised coefficients pertaining to the interaction of average years of schooling
with skilled-labour intensity suggest that the length of schooling is one of the most
important variable explaining industry patterns of trade flows (Figure 1). One standard
deviation increase in years of schooling would on average result in about 14-17%
increase in exports (Figure 2). This would be approximately equivalent to raising the
average years of schooling in China or Brazil (the two countries that are close to the
average level less one standard deviation—7 .6 and 7.2 years respectively) to the level of
the United Kingdom or Italy (9.2 and 9.1 years respectively) or, equivalently, to raising
the average number of years of schooling in the United Kingdom or Italy to the level of
Germany or the United States (11.2 and 12.1 years respectively).
Similarly to capital-to-labour ratios, the relatively low positioning of the BRIIC and
other SEM economies in rankings of human capital indicators at the end of 2000s as well
as the significant increases in recent decades suggest that important changes in trade
structures, such as the expansion of these economies‘ shares in exports of human capital
and technology-intensive products, associated with formation of human capital are likely
to continue. This stresses the importance of policy environment that is conducive to
human capital accumulation.
Interestingly, results for the impact of secondary and tertiary education indicate that
the two types of education have different impacts on trade patterns. First, it is important
to note that in contrast to average number of years of schooling, both these interaction
terms capture the combined effect of the level of education as well as the size of the
labour force (e.g. country with a smaller labour force will have a lower stock of labour
force with secondary or tertiary education) and skilled labour-intensity of the sector.
Nevertheless, standardised coefficients on secondary schooling interactions are higher
than those on tertiary schooling in all model specifications. This indicates that cross-
country differences in secondary schooling are a more important explanation of industry
trade flows. Moreover, there is more variation across countries in secondary schooling
(Annex Figure 10) as compared to tertiary schooling (Annex Figure 11). Interestingly,
and in contrast to tertiary schooling, the differences have grown among OECD countries,
while they have narrowed among non-OECD countries (see Table 1 and Section 4). The
gap between average OECD and average non-OECD score has also narrowed more
quickly for secondary schooling than for tertiary schooling. Overall, our results suggest
that differences in secondary schooling had a stronger influence on trade patterns in the
past and that there is more potential for changes in secondary schooling policies to shape
trade flows in the future and that they should be in the centre of attention of policy
makers.

COMPARATIVE ADVANTAGE AND TRADE PERFORMANCE: POLICY IMPLICATIONS – 23
OECD TRADE POLICY WORKING PAPER NO. 121 © OECD 2011
Dependence on external credit and credit availability
Credit availability proves to be another important source of comparative advantage,
though the estimated impacts are smaller as compared to physical and human capital
endowments. Coefficients are correctly signed and yield statistically significant results in
all specifications of the model. The standardised coefficients for this variable are just
below 0.20, i.e. of the size comparable to those pertaining to tertiary schooling (Figure 1).
Nevertheless, cross-country variation in credit availability is relatively large and, as
Figure 2 reveals, there is a relatively large potential for this source of comparative
advantage to shape trade patterns in the future, especially as far as emerging economies
are concerned (Table 1). It can be inferred that a one standard deviation change in the
credit availability indicator would result in a 4% to 11% average increase in exports. Such
a change is equivalent to increasing the 2005 ratio of domestic credit to private sector to
GDP from the level observed in the Czech Republic (average less standard deviation) to
the level observed in Italy or France (about average) or, equivalently, from the level
observed in Italy or France to the level of Spain or Portugal (average plus one standard
deviation).
Interestingly, the highest scores of credit availability in 2005 and in 1995 were
recorded for some of the countries‘ most severely affected by the dramatic tightening of
credit in the early stages of the 2008-2009 and the 1997-1998 financial crises. For
example, the two highest indicators of credit availability in 2005 are recorded for the
United States and Iceland while Malaysia and Thailand were amongst the highest ranked
countries in 1995 (Annex Figure 14).This does not necessarily undermine our result that
credit availability boosts exports more in sectors with higher dependence on external
financing but rather points to the fact that credit squeezes similar to the ones observed
during the 1997-1998 and 2008-2009 crises may have important implications for patterns
of trade. In fact our results suggest an interesting and testable hypothesis that exports of
external finance-dependent sectors could have been hit particularly hard in countries
experiencing the toughest credit conditions in the aftermath of the recent crisis.
Energy intensity and energy supply
An in increase in energy supply is estimated to boost exports in relatively energy-
intensive sectors though estimated impacts are somewhat smaller as compared to factor
endowments or credit availability. Coefficients are correctly signed and highly significant
in all model specifications. A one standard deviation increase in energy supply indicator
could result in about 4 to 7% increase in exports, on average. Such an increase would be
equivalent to increasing energy supply from the ratio observed in Israel in 2005 (average
minus one standard deviation) to the level of Sweden (average) or equivalently from the
level of Sweden to the level of Canada or Estonia (Annex Figure 13).
This means that availability and affordability of energy can be an important
determinant of export performance, a finding that that should certainly be deliberated
together with environmental considerations associated with higher energy intensity.
Input concentration and doing business climate
The results on the impact of regulatory quality, the rule of law or the control of
corruption on exports of industries with relatively high dispersion of intermediate inputs
are mixed. The results are insignificant or incorrectly signed in models estimated as a
cross-section for 1995 and as a 1995-2005 panel. The 2005 cross section yields expected
signs and highly statistically significant point estimates with respect to these regulatory

24 – COMPARATIVE ADVANTAGE AND TRADE PERFORMANCE: POLICY IMPLICATIONS
OECD TRADE POLICY WORKING PAPER NO. 121 © OECD 2011
indicators. The higher significance of 2005 results could be explained by the fact that data
on intermediate input concentration come from the GTAP database benchmarked to 2004,
thus yielding a potentially more relevant correspondence between the sector
characteristics, doing business indicators and observed trade flows. The 2005 estimates
would indicate a very strong influence of this type of regulatory characteristics on
industry trade patterns, with sectors characterised by higher dispersion of intermediate
inputs exporting significantly more in countries with better regulations.
The standardised coefficients suggest that the importance of this source of
comparative advantage can be compared to the impact of average years of schooling or
indeed capital-to-labour ratios. The potential for future changes in trade patterns driven
by changes in regulatory quality across countries would be equally as high. Our estimates
indicate that, for example, moving up the 2005 regulatory quality in China (about average
regulatory quality less one standard deviation) to the level of regulatory quality in Poland
(about average) would bring about 80 to 103% average increase in Chinese exports.
Equivalently, moving up the regulatory quality in Poland to the level observed in
Denmark or the Netherlands (average plus one standard deviation) would be estimated to
boost Polish exports on average by the same proportion.
Sales volatility and labour market rigidity
Some of the results pertaining to the impact on exports related to differences in labour
market rigidities are statistically insignificant or counterintuitive. For example,
estimations performed jointly for all policy areas do not yield significant results which
may be related to the correlation of labour market indicators with other variables. The
individual estimations yield correctly signed and consistently statistically significant
results on protection to standard employment contract, cost of increasing the number of
hours worked and statutory power and protection of unions having significantly negative
effect on exports in industries characterised by relatively high levels of sales volatility.
For example, one standard deviation increase in the indicator measuring protection of a
standard employment contract would result in 3% decrease in exports. Such a change
would be an equivalent of aligning regulations on protection of standard contract in
Slovakia (average minus one standard deviation) to that in Hungary (approximately
average) or of aligning protection of standard contract in Hungary with that of Finland
(average plus one standard deviation). A one standard deviation increase in the indicator
measuring cost of increasing the number of hours worked would result in 5% decrease in
exports. This would be equivalent to increase the 2005 costs of increasing extra hours
from those observed in the United Kingdom to those observed in Indonesia.
Imported intermediate inputs and import tariff policy
Results for the impact of import tariffs on exports of industries dependent on
imported intermediate inputs do not yield robust results. While the individual model
considering this policy area yields a relatively large and statistically significant negative
impact for 1995, this result in not confirmed by the 2005 cross-sectional estimation or the
1995-2005 panel estimations. Neither is a statistically significant impact found when all
policy areas are considered jointly. This leads us to conclude that import tariffs could not
be established as an important source of comparative dis(advantage) given the adopted
methodology. This result needs to be qualified to the extent that the presented approach
explicitly accounts only for the impact of import tariffs on the pattern of exports of the
tariff-imposing country while it does not directly measure the impact of import tariffs on
the pattern of imports. This latter impact is accounted for implicitly in the importer-

COMPARATIVE ADVANTAGE AND TRADE PERFORMANCE: POLICY IMPLICATIONS – 25
OECD TRADE POLICY WORKING PAPER NO. 121 © OECD 2011
product-year fixed effects in equation (1). Thus, this result should not be interpreted as a
lack of evidence of a negative effect of tariff protection on trade flows in general but
rather as a lack of evidence of a significant impact of tariffs on imported intermediate
inputs on trade patterns.
Has comparative advantage become less or more relevant for the trade of
OECD and non-OECD countries?
The comparative advantage theory emphasises the relative differences between
countries as the reason for international trade and, indeed, for gains from trade. The
greater the differences in underlying sources of comparative advantage across countries,
the larger the gains from trade. It is thus interesting to ask whether the countries in our
sample have become more or less similar to each other during the last decade. Were this
to be the case, the potential for gains from comparative advantage trade would have
diminished. It is also interesting to investigate the evolution of these differences within
and between the OECD and SEM groupings as an indication of changes in the potential
for comparative advantage-driven gains from North-North, North-South and South-South
trade.
Table 1 summarizes different basic measures of variation in indicators of sources of
comparative advantage investigated in this paper and presents some simple estimates of
their convergence in time. Coefficients of variation, presented in Table 1, Panel A,
suggest for example that a typical deviation from the average capital-to-labour ratio
across the 55 countries has fallen from 64% to 58% of the mean. The results of
conditional convergence regressions presented in the right-hand pane of Table 1, Panel A,
shed more light on the speed and nature of changes in cross-country variation in these
indicators. 20
Comparing jointly across the OECD and SEM groupings for 1995 and 2005, we find
that cross-country differences, and thus the potential for gains from comparative
advantage-driven trade, decreased for physical capital, average years of schooling,
tertiary education, primary energy supply, availability of credit. While this means that
countries have become more similar as far as these factors are concerned and this reduced
the potential for comparative advantage-driven trade, it also means that best performers in
1995 may have seen their comparative advantage erode in industries that use these
resources relatively intensely. The conditional convergence regressions indicate that the
so-called β-convergence, whereby worst performers improve their scores relatively
quicker, has been an important part of this process and that it has been particularly fast for
availability of credit, average years of schooling and primary energy supply.
At the same time there is no major change in cross-country variation for secondary
education and, indeed, cross-country variation increases for regulatory quality, rule of
law, control of corruption as well as import tariffs. This means that the potential for
comparative advantage trade associated with these areas has actually increased. Thus, we
can conclude, certain sources of comparative advantage have been eroded as countries
have become more similar to each other, while others have actually expanded.
20. These estimations are based on a standard β-convergence regression: lnIt,i-lnIt-1,i=α+ βlnIt-1,i+εt
where It,i is the value of indicator I (e.g. capital/labour ratio or average years of schooling) in period
t in country i. negative estimate β indicates convergence and the size of the coefficient indicates the
speed of convergence.
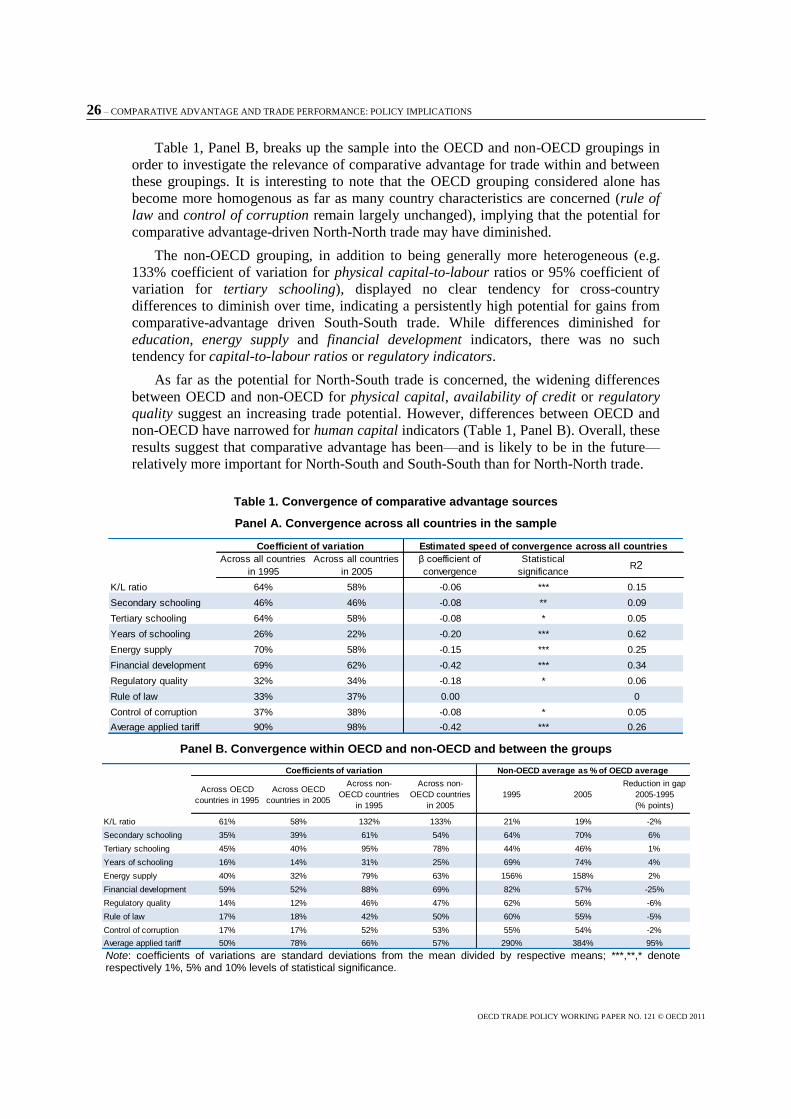
26 – COMPARATIVE ADVANTAGE AND TRADE PERFORMANCE: POLICY IMPLICATIONS
OECD TRADE POLICY WORKING PAPER NO. 121 © OECD 2011
Table 1, Panel B, breaks up the sample into the OECD and non-OECD groupings in
order to investigate the relevance of comparative advantage for trade within and between
these groupings. It is interesting to note that the OECD grouping considered alone has
become more homogenous as far as many country characteristics are concerned (rule of
law and control of corruption remain largely unchanged), implying that the potential for
comparative advantage-driven North-North trade may have diminished.
The non-OECD grouping, in addition to being generally more heterogeneous (e.g.
133% coefficient of variation for physical capital-to-labour ratios or 95% coefficient of
variation for tertiary schooling), displayed no clear tendency for cross-country
differences to diminish over time, indicating a persistently high potential for gains from
comparative-advantage driven South-South trade. While differences diminished for
education, energy supply and financial development indicators, there was no such
tendency for capital-to-labour ratios or regulatory indicators.
As far as the potential for North-South trade is concerned, the widening differences
between OECD and non-OECD for physical capital, availability of credit or regulatory
quality suggest an increasing trade potential. However, differences between OECD and
non-OECD have narrowed for human capital indicators (Table 1, Panel B). Overall, these
results suggest that comparative advantage has been—and is likely to be in the future—
relatively more important for North-South and South-South than for North-North trade.
Table 1. Convergence of comparative advantage sources
Panel A. Convergence across all countries in the sample
Across all countries
in 1995
Across all countries
in 2005
β coefficient of
convergence
Statistical
significanceR2
K/L ratio 64% 58% -0.06 *** 0.15
Secondary schooling 46% 46% -0.08 ** 0.09
Tertiary schooling 64% 58% -0.08 * 0.05
Years of schooling 26% 22% -0.20 *** 0.62
Energy supply 70% 58% -0.15 *** 0.25
Financial development 69% 62% -0.42 *** 0.34
Regulatory quality 32% 34% -0.18 * 0.06
Rule of law 33% 37% 0.00 0
Control of corruption 37% 38% -0.08 * 0.05
Average applied tariff 90% 98% -0.42 *** 0.26
Coefficient of variation Estimated speed of convergence across all countries
Panel B. Convergence within OECD and non-OECD and between the groups
Across OECD
countries in 1995
Across OECD
countries in 2005
Across non-
OECD countries
in 1995
Across non-
OECD countries
in 2005
1995 2005
Reduction in gap
2005-1995
(% points)
K/L ratio 61% 58% 132% 133% 21% 19% -2%
Secondary schooling 35% 39% 61% 54% 64% 70% 6%
Tertiary schooling 45% 40% 95% 78% 44% 46% 1%
Years of schooling 16% 14% 31% 25% 69% 74% 4%
Energy supply 40% 32% 79% 63% 156% 158% 2%
Financial development 59% 52% 88% 69% 82% 57% -25%
Regulatory quality 14% 12% 46% 47% 62% 56% -6%
Rule of law 17% 18% 42% 50% 60% 55% -5%
Control of corruption 17% 17% 52% 53% 55% 54% -2%
Average applied tariff 50% 78% 66% 57% 290% 384% 95%
Coefficients of variation Non-OECD average as % of OECD average
Note: coefficients of variations are standard deviations from the mean divided by respective means; ***,**,* denote respectively 1%, 5% and 10% levels of statistical significance.

COMPARATIVE ADVANTAGE AND TRADE PERFORMANCE: POLICY IMPLICATIONS – 27
OECD TRADE POLICY WORKING PAPER NO. 121 © OECD 2011
5. Conclusions
This paper builds on recent contributions to theory and empirics of comparative
advantage and presents a quantitative assessment of relative importance of various
sources of comparative advantage for bilateral trade flows of 55 OECD and SEM
economies, with particular focus on policy and institutional factors. It follows the recent
literature in emphasising the interaction between product and country characteristics, such
as, for example, the interaction of policies and institutions with specific needs of sectors
of the economy, that together form the basis for comparative advantage. In this respect,
the paper offers the most extensive coverage of policy and institutional and geographical
sources of comparative advantage in the existing literature. The policy and institutional
areas posited as determinants of comparative advantage in this paper include physical
capital accumulation, human capital accumulation (distinguishing between secondary,
tertiary education and average years of schooling), financial development, energy supply,
the business climate, a number of aspects of functioning of labour markets as well as
import tariff policy.
Overall, the results show that comparative advantage remains an important
determinant of trade. For example, capital-to-labour ratios are at least equally as
important in explaining industry patterns of trade as is geographical distance. The cross-
country differences in secondary and tertiary education provide approximately half of the
explanatory power as compared to distance, while the indicator of average years of
schooling has twice as large explanatory power as the distance variable. Other important
sources of comparative advantage include the availability of credit and primary energy
supply while regulatory quality and labour market rigidity tend to influence trade patterns
less significantly.
The comparative advantage theory emphasises the relative differences in productivity
between countries as the reason for international trade and hence for gains from trade.
The larger the differences in underlying sources of comparative advantage across
countries, the larger the gains from trade. Comparing jointly across the OECD and SEM
groupings we find that cross-country differences, and thus the potential for gains from
comparative advantage-driven trade, decreased for such sources of comparative
advantage as: physical capital, average years of schooling, tertiary education, primary
energy supply, availability of credit; while they increased for secondary education and
regulatory quality.
The OECD grouping considered alone has become more homogenous as far as many
comparative advantage sources are concerned, implying that the potential for comparative
advantage-driven North-North trade may have diminished. The non-OECD grouping, in
addition to being generally more heterogeneous, displayed no clear tendency for cross-
country differences to diminish over time, indicating a persistently high potential for
comparative advantage-driven South-South trade. The widening differences between
OECD and non-OECD for physical capital, availability of credit or regulatory quality
suggest an increasing potential for comparative advantage trade in North-South trade.
However, differences between OECD and non-OECD have narrowed for human capital
indicators. Overall these results suggest that comparative advantage has been—and is
likely to be in the future—relatively more important for North-South and South-South
trade than for North-North trade.
Our results show that comparative advantage remains an important determinant of
trade and that it has changed over time, including as a result of changing policies and

28 – COMPARATIVE ADVANTAGE AND TRADE PERFORMANCE: POLICY IMPLICATIONS
OECD TRADE POLICY WORKING PAPER NO. 121 © OECD 2011
institutions. For example, the high explanatory power of physical or human capital
revealed by our results underscores the significance of policies that influenced the pace
and quality of physical and human capital accumulation. Similarly availability of credit
has been found to boost exports more in sectors with higher dependence on external
financing. An increase in primary energy supply-to-GDP ratio has been found to boost
exports in relatively energy-intensive sectors.
Taken together, our results underscore the importance of a comprehensive approach
to designing economic development policies which should seek consistency between
trade and other policy objectives. Governments should avoid actively affecting trade
patterns in general but such actions may be particularly counterproductive if they are
inconsistent with country‘s resource base and other policies in place.
Thus, when seeking to maintain or develop competitiveness in a certain area—for
instance capital-intensive sectors—this is best achieved through drawing on best practices
and developing effective broad policies that facilitate capital accumulation. In case where
a country succeeds in increasing its endowment of capital, relative to other countries and
other factors of production, this is likely to result in the re-orientation of its exports
toward capital-intensive sectors. Importantly, a broad-based approach involves a lower
risk of reducing welfare gains from such specialisation, compared to policies involving
direct support to capital-intensive sectors, though we certainly cannot exclude the
possibility that the overall costs of such an approach exceed the benefits.
Moreover, the finding that comparative advantage has been evolving together with
policies and institutions does not imply that countries should try to actively influence it.
Instead, our results confirm that it is the differences between countries, including
differences in policy settings and policy performance, that create relative differences in
productivity and give rise to trade and gains from trade. Some of these differences in
policy settings may reflect different stages of economic development but some may also
reflect strategic policy choices such as investment in human rather than physical capital.
This does not mean that countries should not try to catch up with their best performing
peers if they wish so but it emphasises that trade yields benefits even at the early stages of
such a catching-up process. More than anything, this implies that trade openness and
comparative advantage-driven specialisation is not a constraint to the economic
development process but rather its catalyst.
6. Variable definitions and data sources
Distance and geography
Distances and Gravity datasets provided by the Centre d'études prospectives et
d'informations internationales (CEPII).
Factor intensities and factor endowments
Industry characteristic: physical capital-intensity calculated as a share of capital in
industry‘s total purchases of primary factors of production the GTAP version 7 database;
averaged across all countries.
Country characteristic: exporters‘ physical capital-to-labour ratio using capital stocks
series constructed according to the perpetual inventory method combining the GTAP

COMPARATIVE ADVANTAGE AND TRADE PERFORMANCE: POLICY IMPLICATIONS – 29
OECD TRADE POLICY WORKING PAPER NO. 121 © OECD 2011
version 7 database values of stock of physical capital in 2004 (the reference values) with
gross fixed capital formation data from the World Bank‘s WDI database.
Human capital intensity and education policy
Industry characteristic: skilled labour-intensity calculated as a share of skilled labour
in industry‘s total purchases of primary factors of production the GTAP version 7
database, averaged across all countries.
Country characteristic: stocks of labour force with completed secondary and tertiary
schooling calculated using Barro and Lee (2010) data on percentages of population that
have completed secondary and tertiary schooling combined with the WDI data on labour
force. For average years of schooling, Barro and Lee (2010) data on average years of
study.
Dependence on external credit and availability of credit
Industry characteristic: external capital dependence of a given industrial sector
measured as the fraction of total capital expenditure not financed with cash flow from
operations; from Braun (2003); based on data for all publically traded US-based
companies from Compustat‘s annual industrial files; (approximately) concorded by the
author from the 3-digit ISIC categories used by Braun (2003) to the GTAP sectoral
classification.
Country characteristic: the WDI ratio of domestic credit to private sector to GDP
covering financial resources provided to the private sector, such as through loans,
purchases of nonequity securities, and trade credits and other accounts receivable, that
establish a claim for repayment. For some countries these claims include credit to public
enterprises.
Energy intensity and energy supply
Industry characteristic: share of primary energy inputs in firms‘ costs in the given
industry; from version 7 of the GTAP database; average across all countries.
Country characteristic: International Energy Agency (IEA) total primary energy
supply (TPES) statistics scaled by the value of GDP in 2000 prices and converted to US
dollars using PPP for the year 2000.
Input concentration and business climate
Industry characteristic: Herfindhal index of intermediate inputs dispersion calculated
for the United States; based on input-output data from the GTAP version 7 database.
Country characteristic: regulatory quality, rule of law and control of corruption
indicators from the WB Governance Indicators database.
Sales volatility and labour market rigidity
Industry characteristic: sales volatility estimated using data for all publically traded
US-based companies from Compustat‘s annual industrial files; from Braun (2003).
Country characteristic: measures of labour regulation from Botero, et al. (2004);
Alternative contracts measures the existence and cost of alternatives to the standard
employment contract; Cost of increasing hours worked measures the cost of increasing

30 – COMPARATIVE ADVANTAGE AND TRADE PERFORMANCE: POLICY IMPLICATIONS
OECD TRADE POLICY WORKING PAPER NO. 121 © OECD 2011
the number of hours worked; Cost of firing workers measures the cost of firing 20% of
the firm‘s workers; Dismissal Procedures measures worker protection granted by law or
mandatory collective agreements against dismissal; Labour Union Power measures the
statutory protection and power of unions as the average of seven indicator variables
indicating the presence of absence of various unionization rights and obligations;
Collective Disputes measures the protection of workers during collective disputes as the
average of eight more detailed indicator variables measuring presence or laws protecting
industrial action.
Imported intermediate inputs and import tariff policy
Industry characteristic: the ratio of value of imported intermediate inputs to the value
of output in a given industry; based on input-output data from the GTAP version 7
database; averaged across all countries.
Country characteristic: average applied tariffs from the UN TRAINS database
accessed through the World Integrated Trade Solution (WITS) database.
Country coverage
Countries covered: Argentina; Australia; Austria; Belgium; Brazil; Canada;
Switzerland; Chile; China; Chinese Taipei; Czech Republic; Germany; Denmark; Egypt;
Spain; Estonia; Finland; France; United Kingdom; Greece; Hong Kong, China; Hungary;
Indonesia; India; Ireland; Iceland; Israel; Italy; Japan; Kazakhstan; Korea; Luxembourg;
Morocco; Mexico; Malaysia; Nigeria; Netherlands; Norway; New Zealand; Poland;
Portugal; Russian Federation; Saudi Arabia; Singapore; Slovak Republic; Slovenia;
Sweden; Thailand; Tunisia; Turkey; Ukraine; United States; Venezuela; Vietnam; South
Africa.
Please note that the country coverage in specific regressions depends on data
availability and may be less extensive than the one above.

COMPARATIVE ADVANTAGE AND TRADE PERFORMANCE: POLICY IMPLICATIONS – 31
OECD TRADE POLICY WORKING PAPER NO. 121 © OECD 2011
References
Barnes, J., R. Kaplinsky and M. Morris (2003), ―Industrial Policy In developing Economies:
developing Dynamic Comparative Advantage in the South African Automobile Sector, TIPS
Forum 2003, Development Policy Research Unit, School of Economics, University of Cape
Town.
Barro, R. J. (1991), ―Economic Growth in a Cross-Section of Countries,‖ Quarterly Journal of
Economics 106 407–43.
Barro, R. J. and J.W. Lee (2010), A New Data Set of Education Attainment in the World, 1950-
2010. NBER Working Paper, No. 15902.
Beck, T. (2003), ―Financial Dependence and International Trade‖, Review of International
Economics, 11, pp. 296-316.
Botero, J. C., et al. (2004), ―The regulation of labour.‖ Quarterly Journal of Economics,
November, pp. 1339-1382.
Braun, M. (2003), ―Financial Contractability and Asset Hardness, unpublished, mimeo University
of California, Los Angeles.
Chor, D. (2010), ―Unpacking Sources of Comparative Advantage: A Quantitative Approach‖,
Journal of International Economics, Vol. 82 (2010) 152-167.
Costinot, A. (2009), ―An Elementary Theory of Comparative Advantage‖, National Bureau of
Economic Research, Inc, NBER Working Papers: 14645.
Costinot, A. (2009), ―On the origins of comparative advantage‖, Journal of International
Economics, 77, pp. 255-264.
Cunat, A. and M. J. Melitz (2007), ―Volatility, Labor Market Flexibility, and the Pattern of
Comparative Advantage‖ National Bureau of Economic Research, Inc, NBER Working Papers:
13062.
Deardorff, A. (2011), ―Comparative Advantage: Theory behind Measurement‖ in Globalisation,
Comparative Advantage and the Changing Dynamics of Trade, OECD Publishing.
Debaere, P. (2003), Relative Factor Abundance and Trade, Journal of Political Economy 111, 589-
610.
Dennis, A. and B. Shepherd (2007), Trade Costs, Barriers to Entry and Export Diversification in
Developing Countries, Policy Research Working Paper, no. 4368, The World Bank.
Helpman, E. (2010), ―Labor Market Frictions as a Source of Comparative Advantage, with
Implications for Unemployment and Inequality‖, NBER Working Paper No. 15764.
Levchenko, A., A. (2007), Institutional Quality and International Trade, in: Review of Economic
Studies, 74, pp. 791-819.
Lin, J. and H-J. Chang (2009), DPR Debate: Should Industrial Policy in Developing Countries
Conform to Comparative Advantage or Defy It? A Debate between Justin Lin and Ha-Joon
Chang, Development Policy Review, September 2009, v. 27, Issue. 5, pp. 483-502.

32 – COMPARATIVE ADVANTAGE AND TRADE PERFORMANCE: POLICY IMPLICATIONS
OECD TRADE POLICY WORKING PAPER NO. 121 © OECD 2011
Lucas, R. E. JR. (1988), ―On the Mechanics of Economic Development,‖ Journal Monetary
Economics, 22 3–42.
Manova, K. (2008), ―Credit Constraints, Equity Market Liberalizations and International Trade,‖
Journal of International Economics 76, pp.33-47.
Miroudot, S., R. Lanz and A. Ragoussis (2009), "Trade in Intermediate Goods and Services,"
OECD Trade Policy Working Papers, No. 93, OECD Publishing.
Nordas, H., S. Miroudot and P. Kowalski (2006), ―Dynamic Gains from Trade‖, OECD Trade
Policy Working Papers, No. 43, OECD Publishing.
Nunn, N. (2007), ―Relationship-Specificity, Incomplete Contracts and the Pattern of Trade‖,
Quarterly Journal of Economics, 122: 569-600.
OECD (2009a), Globalisation and Emerging Economies: Brazil, Russia, India, Indonesia, China
and South Africa, OECD Publishing.
Kowalski, P. and Cavazos Cepeda R. H. (2011), ―Production, Consumption and Trade
Developments in the Era of Globalisation,‖ in Globalisation, Comparative Advantage and the
Changing Dynamics of Trade, OECD Publishing.
Kowalski, P. and N. Bottini (2011), ―Comparative Advantage and Export Specialisation Mobility‖
in Globalisation, Comparative Advantage and the Changing Dynamics of Trade, OECD
Publishing.
Stone, S., R. Cavazos Cepeda and A. Jankowska (2011), ―The Role of Factor Content in Trade:
Have Changes in Factor Endowments Been Reflected in Trade Patterns and on Relative
Wages?‖, OECD Trade Policy Working Papers, No. 109, OECD Publishing.
Pack, H. (2000), ―Industrial Policy: Growth Elixir or Poison‖, The World Bank Research
Observer, Vol. 15, No. 1, pp 47-67
Rajan, R. and L. Zingales (1998), ―Financial Dependence and Growth‖, American Economic
Review, 88: 559-586.
Ricardo, D. (1817), On the Principles of Political Economy and Taxation, J. Murray, London.
Rodrik, D. (1994), King Kong Meets Godzilla: The World Bank and The East Asian Miracle,
CEPR Discussion Papers, No. 944.
Rodrik, D. (2009), Normalizing Industrial Policy, Working Paper No. 3, Commission on Growth
and Development, The World Bank, Washington, D.C.
Romalis, J. (2004), ―Factor Proportions and the Structure of Commodity Trade, The American
Economic Review 94, 67-97.
Romer, P. (1990), ―Human Capital and Growth: Theory and Evidence,‖ Carnegie Rochester
Conference Series on Public Policy 32 251–86.
Santos-Silva, J.M.C. and S. Tenreyro (2006), ―The Log of Gravity,‖ Review of Economics and
Statistics 88(4): 641-658.
Spiros, B., R. Kneller and R. Riezman (2009), Optimal Education Policies and Comparative
Advantage. Research Paper 2009/02.Leverhulme Center.
Spiros, B., and R. Riezman (2007), Trade and the distribution of human capital. Journal of
International Economics, Volume 73, Issue 2, November 2007, Pages 421-433.
Stiglitz, J. E. (1996), Some Lessons from the East Asian Miracle, The World Bank Research
Observer, Vol. 11, No. 2 (August 1996)
World Bank (1993), The East Asian Miracle, Oxford University Press, New York.

COMPARATIVE ADVANTAGE AND TRADE PERFORMANCE: POLICY IMPLICATIONS – 33
OECD TRADE POLICY WORKING PAPER NO. 121 © OECD 2011
ANNEX TABLES AND FIGURES

34 – COMPARATIVE ADVANTAGE AND TRADE PERFORMANCE: POLICY IMPLICATIONS
OECD TRADE POLICY WORKING PAPER NO. 121 © OECD 2011
Annex Table 1. Conditional Poisson fixed effects regression model of industry trade flows for year 1995
(dependent variable: value of exports)
(1) (2) (3) (4) (5) (6) (7) (8) (9) (10) (11) (12) (13) (14) (15) (16) (17)
Distance and geography
log(distance) -0.780*** -0.789*** -0.793*** -0.790*** -0.791*** -0.815*** -0.789*** -0.789*** -0.789*** -0.835*** -0.833*** -0.838*** -0.834*** -0.836*** -0.835*** -0.828*** -0.867***
(0.03) (0.03) (0.03) (0.03) (0.03) (0.03) (0.03) (0.03) (0.03) (0.03) (0.03) (0.04) (0.03) (0.03) (0.03) (0.03) (0.03)
border 0.542*** 0.545*** 0.545*** 0.547*** 0.545*** 0.513*** 0.545*** 0.545*** 0.545*** 0.522*** 0.523*** 0.517*** 0.523*** 0.521*** 0.523*** 0.571*** 0.525***
(0.06) (0.06) (0.06) (0.06) (0.06) (0.07) (0.06) (0.06) (0.06) (0.07) (0.07) (0.07) (0.07) (0.07) (0.07) (0.07) (0.07)
common official language 0.401*** 0.365*** 0.355*** 0.357*** 0.372*** 0.362*** 0.365*** 0.364*** 0.365*** 0.290*** 0.288*** 0.291*** 0.290*** 0.286*** 0.296*** 0.362*** 0.332***
(0.06) (0.06) (0.06) (0.06) (0.06) (0.06) (0.06) (0.06) (0.06) (0.06) (0.06) (0.06) (0.06) (0.06) (0.06) (0.06) (0.07)
colony -0.239** -0.234* -0.229* -0.225* -0.237* -0.114 -0.234* -0.234* -0.235* -0.126 -0.125 -0.128 -0.125 -0.124 -0.128 -0.265** -0.117
Hecksher-Ohlin (0.09) (0.10) (0.09) (0.09) (0.10) (0.09) (0.10) (0.10) (0.10) (0.10) (0.09) (0.10) (0.09) (0.09) (0.10) (0.09) (0.09)
(K/L)*capital intensity 1.139*** 0.990*** 0.876*** 1.271*** 0.774*** 1.128*** 1.189*** 1.164*** 1.148*** 1.156*** 1.178*** 1.142*** 1.155*** 1.148*** 0.628* 0.659**
(0.23) (0.21) (0.21) (0.23) (0.22) (0.23) (0.23) (0.23) (0.23) (0.23) (0.23) (0.24) (0.23) (0.23) (0.25) (0.25)
Policy and instiutions
Human capital
log(secondary schooling) * skilled-labour intensity 0.013*** 0.010***
(0.00) (0.00)
log(tertiary schooling) * skilled-labour intensity 0.021*** 0.009
(0.01) (0.01)
log(years of schooling) * skilled-labour intensity 13.292***
Energy (1.76)
log(energy supply) * energy intensity 3.335*** 3.080***
Financial development (0.49) (0.48)
financial development * dependence on external finance 0.023*** 0.023***
Doing business climate (0.00) (0.00)
regulatory quality * input concentration -0.014 -0.024
(0.02) (0.03)
rule of law * input concentration 0.038
(0.02)
control of corruption * input concentration 0.020
Labour market institutions (0.02)
Protection of labour and employment laws
protection to standard employment contract * volatility -0.120 0.150
(0.14) (0.10)
cost of increasing the number of hours * volatility -0.142
(0.07)
cost of firing labor force * volatility 0.379**
(0.14)
protection against dismissal * volatility -0.121
Protection of collective relations laws (0.13)
statutory power and protection of unions * volatility -0.139* -0.226**
(0.06) (0.07)
protection during collective disputes * volatility 0.344**
Import tariff policy (0.11)
log (average applied tariff) * imported inputs share -3.451*** -1.154
(0.50) (0.72)
Exporter fixed effects yes yes yes yes yes yes yes yes yes yes yes yes yes yes yes yes yes
Importer-industry fixed effects yes yes yes yes yes yes yes yes yes yes yes yes yes yes yes yes yes
Number of observations 117 936 107 162 107 162 107 162 107 162 105 019 107 162 107 162 107 162 96 321 96 321 96 321 96 321 96 321 96 321 100 509 91 832
Note: robust standard errors by importer-product group, ***, ** and * denote statistical significance at 1%, 5% and 10% levels respectively, brackets contain standard errors.

COMPARATIVE ADVANTAGE AND TRADE PERFORMANCE: POLICY IMPLICATIONS – 35
OECD TRADE POLICY WORKING PAPER NO. 121 © OECD 2011
Annex Table 2. Conditional Poisson fixed effects regression model of industry trade flows for year 2005
(dependent variable: value of exports)
(1) (2) (3) (4) (5) (6) (7) (8) (9) (10) (11) (12) (13) (14) (15) (16) (17)
Distance and geography
log(distance) -0.852*** -0.861*** -0.865*** -0.863*** -0.862*** -0.873*** -0.861*** -0.861*** -0.861*** -0.881*** -0.880*** -0.885*** -0.883*** -0.882*** -0.882*** -0.865*** -0.884***
(0.04) (0.04) (0.03) (0.03) (0.04) (0.03) (0.03) (0.04) (0.03) (0.04) (0.03) (0.04) (0.04) (0.04) (0.04) (0.03) (0.03)
border 0.395*** 0.401*** 0.401*** 0.400*** 0.402*** 0.399*** 0.401*** 0.400*** 0.401*** 0.413*** 0.415*** 0.409*** 0.411*** 0.412*** 0.413*** 0.443*** 0.445***
(0.08) (0.07) (0.07) (0.07) (0.07) (0.07) (0.07) (0.07) (0.07) (0.07) (0.07) (0.07) (0.07) (0.07) (0.07) (0.07) (0.07)
common official language 0.242** 0.171** 0.170** 0.175** 0.174** 0.154* 0.167* 0.167** 0.166* 0.119 0.118 0.117 0.122 0.116 0.122 0.159* 0.123
(0.07) (0.07) (0.07) (0.07) (0.07) (0.07) (0.06) (0.06) (0.06) (0.07) (0.07) (0.07) (0.07) (0.07) (0.07) (0.08) (0.08)
colony -0.101 -0.065 -0.059 -0.060 -0.068 0.045 -0.064 -0.065 -0.065 0.053 0.053 0.055 0.053 0.056 0.052 -0.066 0.052
Hecksher-Ohlin (0.08) (0.08) (0.08) (0.08) (0.08) (0.08) (0.08) (0.08) (0.08) (0.08) (0.08) (0.08) (0.08) (0.08) (0.08) (0.08) (0.08)
(K/L)*capital intensity 0.492* 0.490* 0.465* 0.718** 0.324 0.784*** 0.772*** 0.806*** 0.478* 0.492* 0.556* 0.489* 0.492* 0.480* 0.658** 0.648**
(0.23) (0.21) (0.21) (0.23) (0.22) (0.21) (0.21) (0.21) (0.24) (0.23) (0.22) (0.24) (0.23) (0.24) (0.24) (0.23)
Policy and instiutions
Human capital
log(secondary schooling) * skilled-labour intensity 0.014*** 0.015***
(0.00) (0.00)
log(tertiary schooling) * skilled-labour intensity 0.029*** 0.017*
(0.01) (0.01)
log(years of schooling) * skilled-labour intensity 14.908***
Energy (2.26)
log(energy supply) * energy intensity 2.453*** 1.821***
Financial development (0.40) (0.35)
financial development * dependence on external finance 0.009*** 0.007***
Doing business climate (0.00) (0.00)
regulatory quality * input concentration 0.070** 0.091***
(0.02) (0.03)
rule of law * input concentration 0.058**
(0.02)
control of corruption * input concentration 0.061***
Labour market institutions (0.02)
Protection of labour and employment laws
protection to standard employment contract * volatility -0.252** -0.086
(0.10) (0.08)
cost of increasing the number of hours * volatility -0.192**
(0.07)
cost of firing labor force * volatility 0.837***
(0.12)
protection against dismissal * volatility 0.109
Protection of collective relations laws (0.07)
statutory power and protection of unions * volatility -0.280*** -0.261***
(0.07) (0.07)
protection during collective disputes * volatility 0.071
Import tariff policy (0.09)
log (average applied tariff) * imported inputs share 1.204* -0.427
(0.49) (0.49)
Exporter fixed effects yes yes yes yes yes yes yes yes yes yes yes yes yes yes yes yes yes
Importer-industry fixed effects yes yes yes yes yes yes yes yes yes yes yes yes yes yes yes yes yes
Number of observations 124 470 113 096 113 096 113 096 113 096 108 573 113 096 113 096 113 096 101 740 101 740 101 740 101 740 101 740 101 740 105 989 94 630
Note: robust standard errors by importer-product group, ***, ** and * denote statistical significance at 1%, 5% and 10% levels respectively, brackets contain standard errors.

36 – COMPARATIVE ADVANTAGE AND TRADE PERFORMANCE: POLICY IMPLICATIONS
OECD TRADE POLICY WORKING PAPER NO. 121 © OECD 2011
Annex Table 3. Conditional Poisson fixed effects regression model of industry trade flows for two-year panel 1995-2005
(dependent variable: value of exports)
(1) (2) (3) (4) (5) (6) (7) (8) (9) (10) (11) (12) (13) (14) (15) (16) (17)
Distance and geography
log(distance) -0.821*** -0.830*** -0.833*** -0.832*** -0.831*** -0.842*** -0.830*** -0.830*** -0.831*** -0.855*** -0.853*** -0.859*** -0.856*** -0.856*** -0.855*** -0.843*** -0.863***
(0.03) (0.03) (0.03) (0.03) (0.03) (0.03) (0.03) (0.03) (0.03) (0.03) (0.03) (0.03) (0.03) (0.03) (0.03) (0.03) (0.03)
border 0.446*** 0.452*** 0.454*** 0.452*** 0.452*** 0.446*** 0.451*** 0.451*** 0.451*** 0.459*** 0.461*** 0.454*** 0.458*** 0.458*** 0.459*** 0.491*** 0.485***
(0.06) (0.05) (0.05) (0.05) (0.05) (0.05) (0.05) (0.05) (0.05) (0.05) (0.05) (0.05) (0.05) (0.05) (0.05) (0.05) (0.05)
common official language 0.277*** 0.218*** 0.211*** 0.215*** 0.222*** 0.206*** 0.220*** 0.218*** 0.220*** 0.157** 0.156** 0.156** 0.159** 0.154** 0.161** 0.199** 0.172**
(0.06) (0.05) (0.05) (0.05) (0.05) (0.06) (0.05) (0.05) (0.05) (0.06) (0.06) (0.05) (0.06) (0.06) (0.06) (0.06) (0.07)
colony -0.146* -0.120 -0.116 -0.116 -0.124* -0.012 -0.123* -0.120 -0.121* -0.003 -0.002 -0.003 -0.003 -0.000 -0.004 -0.127* -0.008
Hecksher-Ohlin (0.06) (0.06) (0.06) (0.06) (0.06) (0.06) (0.06) (0.06) (0.06) (0.06) (0.06) (0.06) (0.06) (0.06) (0.06) (0.06) (0.06)
(K/L)*capital intensity 0.862*** 0.807*** 0.804*** 1.028*** 0.681*** 0.839*** 0.874*** 0.759*** 0.866*** 0.874*** 0.914*** 0.870*** 0.875*** 0.867*** 0.785*** 0.718***
(0.14) (0.13) (0.13) (0.14) (0.13) (0.14) (0.13) (0.15) (0.14) (0.14) (0.14) (0.14) (0.14) (0.14) (0.14) (0.14)
Policy and instiutions
Human capital
log(secondary schooling) * skilled-labour intensity 0.010*** 0.009***
(0.00) (0.00)
log(tertiary schooling) * skilled-labour intensity 0.028*** 0.026***
(0.00) (0.00)
log(years of schooling) * skilled-labour intensity 13.172***
Energy (1.28)
log(energy supply) * energy intensity 2.851*** 2.623***
Financial development (0.35) (0.35)
financial development * dependence on external finance 0.010*** 0.008***
Doing business climate (0.00) (0.00)
regulatory quality * input concentration -0.010* -0.010*
(0.00) (0.00)
rule of law * input concentration 0.004
(0.01)
control of corruption * input concentration -0.011**
Labour market institutions (0.00)
Protection of labour and employment laws
protection to standard employment contract * volatility -0.207* -0.030
(0.08) (0.06)
cost of increasing the number of hours * volatility -0.176***
(0.05)
cost of firing labor force * volatility 0.665***
(0.09)
protection against dismissal * volatility 0.028
Protection of collective relations laws (0.06)
statutory power and protection of unions * volatility -0.231*** -0.196***
(0.05) (0.05)
protection during collective disputes * volatility 0.170*
Import tariff policy (0.07)
log (average applied tariff) * imported inputs share -0.093 -0.067
(0.42) (0.48)
Exporter fixed effects yes yes yes yes yes yes yes yes yes yes yes yes yes yes yes yes yes
Importer-industry-year fixed effects yes yes yes yes yes yes yes yes yes yes yes yes yes yes yes yes yes
Number of observations 242 406 220 258 220 258 220 258 220 258 213 592 220 258 220 258 220 258 198 061 198 061 198 061 198 061 198 061 198 061 206 498 186 462 Note: robust standard errors by importer-product-year group, ***, ** and * denote statistical significance at 1%, 5% and 10% levels respectively, brackets contain standard errors.
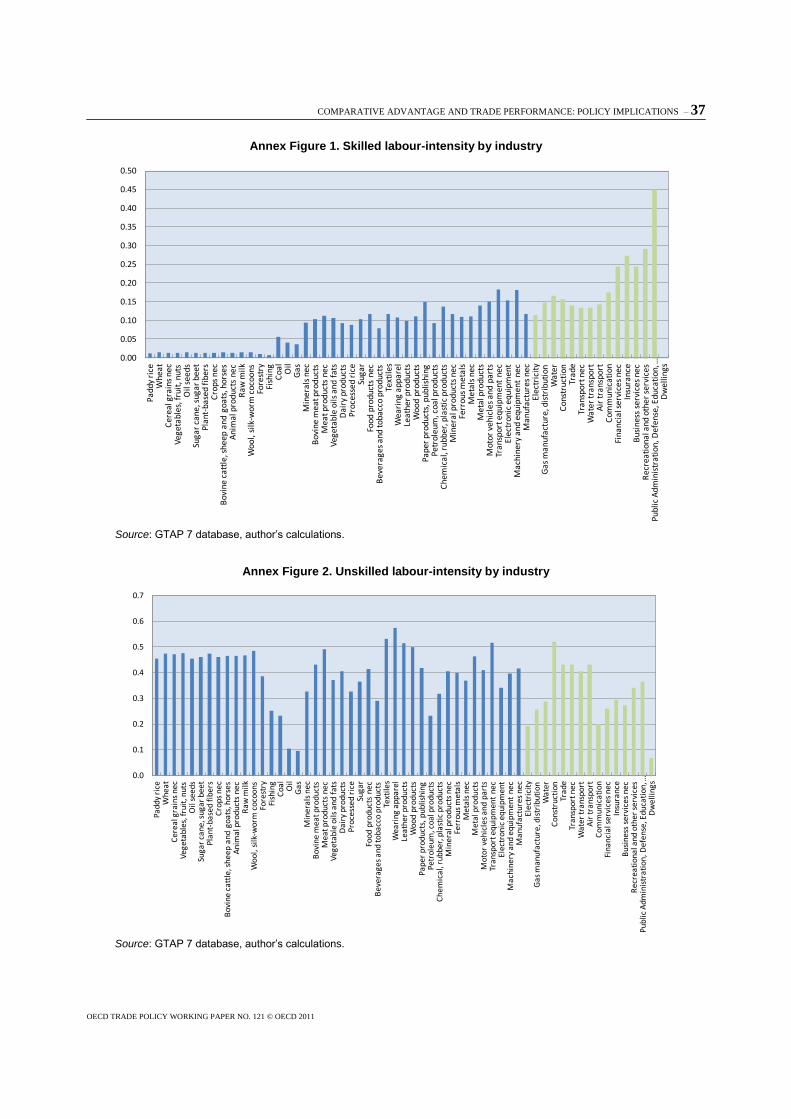
COMPARATIVE ADVANTAGE AND TRADE PERFORMANCE: POLICY IMPLICATIONS – 37
OECD TRADE POLICY WORKING PAPER NO. 121 © OECD 2011
Annex Figure 1. Skilled labour-intensity by industry
0.00
0.05
0.10
0.15
0.20
0.25
0.30
0.35
0.40
0.45
0.50
Padd
y ri
ceW
heat
Cer
eal g
rain
s ne
cVe
geta
bles
, fru
it, n
uts
Oil
seed
sSu
gar
cane
, sug
ar b
eet
Plan
t-ba
sed
fibe
rsC
rops
nec
Bov
ine
catt
le, s
heep
and
goa
ts, h
orse
sA
nim
al p
rodu
cts
nec
Raw
milk
Woo
l, si
lk-w
orm
coc
oons
Fore
stry
Fish
ing
Coa
lO
ilG
asM
iner
als
nec
Bov
ine
mea
t pr
oduc
tsM
eat p
rodu
cts
nec
Vege
tabl
e oi
ls a
nd f
ats
Dai
ry p
rodu
cts
Proc
esse
d ri
ceSu
gar
Food
pro
duct
s ne
cB
ever
ages
and
toba
cco
prod
ucts
Text
iles
Wea
ring
app
arel
Leat
her
prod
ucts
Woo
d pr
oduc
tsPa
per
prod
ucts
, pub
lishi
ngPe
trol
eum
, coa
l pro
duct
sC
hem
ical
, rub
ber,
pla
stic
pro
duct
sM
iner
al p
rodu
cts
nec
Ferr
ous
met
als
Met
als
nec
Met
al p
rodu
cts
Mot
or v
ehic
les
and
part
sTr
ansp
ort e
quip
men
t ne
cEl
ectr
onic
equ
ipm
ent
Mac
hine
ry a
nd e
quip
men
t ne
cM
anuf
actu
res
nec
Elec
tric
ity
Gas
man
ufac
ture
, dis
trib
utio
nW
ater
Con
stru
ctio
nTr
ade
Tran
spor
t nec
Wat
er tr
ansp
ort
Air
tran
spor
tC
omm
unic
atio
nFi
nanc
ial s
ervi
ces
nec
Insu
ranc
eB
usin
ess
serv
ices
nec
Rec
reat
iona
l and
oth
er s
ervi
ces
Publ
ic A
dmin
istr
atio
n, D
efen
se, E
duca
tion
, …D
wel
lings
Source: GTAP 7 database, author‟s calculations.
Annex Figure 2. Unskilled labour-intensity by industry
0.0
0.1
0.2
0.3
0.4
0.5
0.6
0.7
Pad
dy
rice
Wh
eat
Cer
eal g
rain
s n
ecV
eget
able
s, fr
uit
, nu
tsO
il se
ed
sSu
ga
r ca
ne
, su
ga
r b
ee
tP
lan
t-b
ase
d f
ibe
rsC
rop
s n
ec
Bo
vin
e c
att
le, s
he
ep
an
d g
oa
ts, h
ors
es
An
ima
l pro
du
cts
ne
cR
aw
mil
kW
oo
l, s
ilk-
wo
rm c
oco
on
sFo
rest
ryFi
shin
gC
oal
Oil
Ga
sM
ine
rals
ne
cB
ovi
ne
me
at
pro
du
cts
Mea
t p
rod
uct
s n
ecV
eget
able
oils
an
d f
ats
Dai
ry p
rod
uct
sP
roce
sse
d r
ice
Suga
rFo
od
pro
du
cts
nec
Bev
erag
es a
nd
to
bac
co p
rod
uct
sTe
xtile
sW
ea
rin
g a
pp
are
lLe
ath
er
pro
du
cts
Wo
od
pro
du
cts
Pape
r pr
oduc
ts, p
ublis
hing
Petr
oleu
m, c
oal p
rodu
cts
Che
mic
al, r
ubbe
r, p
last
ic p
rodu
cts
Min
era
l pro
du
cts
ne
cFe
rro
us
me
tals
Met
als
nec
Me
tal p
rod
uct
sM
oto
r ve
hic
les
an
d p
art
sTr
ansp
ort
eq
uip
men
t n
ecEl
ectr
on
ic e
qu
ipm
ent
Ma
chin
ery
an
d e
qu
ipm
en
t n
ec
Ma
nu
fact
ure
s n
ec
Elec
tric
ity
Gas
man
ufac
ture
, dis
trib
utio
nW
ater
Co
nst
ruct
ion
Trad
eTr
an
spo
rt n
ec
Wat
er tr
ansp
ort
Air
tra
nsp
ort
Co
mm
un
icat
ion
Fin
anci
al s
ervi
ces
nec
Insu
ran
ceB
usi
nes
s se
rvic
es n
ecR
ecre
ati
on
al a
nd
oth
er s
ervi
ces
Pu
blic
Ad
min
istr
atio
n, D
efen
se, E
du
cati
on
, …D
wel
lings
Source: GTAP 7 database, author‟s calculations.

38 – COMPARATIVE ADVANTAGE AND TRADE PERFORMANCE: POLICY IMPLICATIONS
OECD TRADE POLICY WORKING PAPER NO. 121 © OECD 2011
Annex Figure 3. Capital-intensity by industry
0.0
0.1
0.2
0.3
0.4
0.5
0.6
0.7
0.8
0.9
1.0
Padd
y ri
ceW
hea
tC
erea
l gra
ins
nec
Veg
etab
les,
frui
t, n
uts
Oil
see
dsSu
ga
r ca
ne
, su
ga
r b
ee
tP
lan
t-b
ase
d f
ibe
rsC
rop
s n
ec
Bo
vin
e c
att
le, s
he
ep
an
d g
oa
ts, h
ors
es
An
imal
pro
du
cts
nec
Raw
mil
kW
oo
l, s
ilk-
wo
rm c
oco
on
sFo
rest
ryFi
shin
gC
oal
Oil
Ga
sM
ine
rals
ne
cB
ovi
ne
me
at
pro
du
cts
Mea
t pro
duct
s ne
cVe
get
able
oils
and
fat
sD
airy
pro
duct
sP
roce
sse
d r
ice
Suga
rFo
od p
rodu
cts
nec
Bev
erag
es a
nd to
bacc
o pr
oduc
tsTe
xtile
sW
eari
ng
app
arel
Leat
her
pro
du
cts
Wo
od
pro
du
cts
Pape
r pr
oduc
ts, p
ublis
hing
Petr
oleu
m, c
oal p
rodu
cts
Che
mic
al, r
ubbe
r, p
last
ic p
rodu
cts
Min
era
l pro
du
cts
ne
cFe
rro
us
me
tals
Met
als
nec
Me
tal p
rod
uct
sM
oto
r ve
hic
les
an
d p
art
sTr
ansp
ort e
qui
pmen
t ne
cEl
ectr
onic
eq
uipm
ent
Ma
chin
ery
an
d e
qu
ipm
en
t n
ec
Ma
nu
fact
ure
s n
ec
Elec
tric
ity
Gas
man
ufac
ture
, dis
trib
utio
nW
ater
Co
nst
ruct
ion
Trad
eTr
ansp
ort
nec
Wat
er tr
ansp
ort
Air
tra
nsp
ort
Com
mun
icat
ion
Fina
ncia
l ser
vice
s ne
cIn
sura
nce
Bus
ines
s se
rvic
es n
ecR
ecre
ati
onal
and
oth
er s
ervi
ces
Publ
ic A
dmin
istr
atio
n, D
efen
se, E
duca
tion
, …D
wel
lings
Source: GTAP 7 database, author‟s calculations.
Annex Figure 4. Energy intensity by industry
0.0
0.1
0.2
0.3
0.4
0.5
0.6
0.7
0.8
Padd
y ri
ceW
heat
Cer
eal g
rain
s ne
cVe
geta
bles
, fru
it, n
uts
Oil
seed
sSu
gar
can
e, s
uga
r b
eet
Pla
nt-
bas
ed f
iber
sC
rop
s n
ecB
ovi
ne
catt
le, s
hee
p a
nd
go
ats,
ho
rses
Ani
mal
pro
duct
s ne
cR
aw m
ilk
Woo
l, si
lk-w
orm
coc
oons
Fore
stry
Fish
ing
Coa
lO
ilG
asM
iner
als
nec
Bo
vin
e m
eat
pro
du
cts
Mea
t pro
duct
s ne
cVe
geta
ble
oils
and
fat
sD
airy
pro
duct
sP
roce
ssed
ric
eSu
gar
Food
pro
duct
s ne
cB
ever
ages
and
toba
cco
prod
ucts
Text
iles
Wea
ring
app
arel
Leat
her
prod
ucts
Woo
d pr
oduc
tsPa
per
prod
ucts
, pub
lishi
ngPe
trol
eum
, coa
l pro
duct
sC
hem
ical
, rub
ber,
pla
stic
pro
duct
sM
iner
al p
rod
uct
s n
ecFe
rro
us
met
als
Met
als
nec
Met
al p
rod
uct
sM
oto
r ve
hic
les
and
par
tsTr
ansp
ort e
qui
pmen
t ne
cEl
ectr
onic
eq
uipm
ent
Mac
hin
ery
and
eq
uip
men
t n
ecM
anu
fact
ure
s n
ecEl
ectr
icit
yG
as m
anuf
actu
re, d
istr
ibut
ion
Wat
erC
onst
ruct
ion
Trad
eTr
ansp
ort n
ecW
ater
tran
spor
tA
ir tr
ansp
ort
Com
mun
icat
ion
Fina
ncia
l ser
vice
s ne
cIn
sura
nce
Bus
ines
s se
rvic
es n
ecR
ecre
atio
nal a
nd o
ther
ser
vice
sPu
blic
Adm
inis
trat
ion,
Def
ense
, Edu
cati
on, …
Dw
ellin
gs
Source: GTAP 7 database, author’s calculations.

COMPARATIVE ADVANTAGE AND TRADE PERFORMANCE: POLICY IMPLICATIONS – 39
OECD TRADE POLICY WORKING PAPER NO. 121 © OECD 2011
Annex Figure 5. External finance dependence by sector
-0.4
-0.2
0.0
0.2
0.4
0.6
0.8
1.0
Padd
y ri
ce
Wh
ea
t
Cer
eal g
rain
s n
ec
Ve
ge
tab
les,
fru
it, n
uts
Oil
see
ds
Suga
r ca
ne, s
ugar
bee
t
Plan
t-ba
sed
fibe
rs
Cro
ps n
ec
Bov
ine
catt
le, s
hee
p an
d go
ats,
hor
ses
Ani
mal
pro
duct
s ne
c
Raw
milk
Woo
l, si
lk-w
orm
coc
oons
Fore
stry
Fish
ing
Co
al
Oil
Gas
Min
eral
s ne
c
Bov
ine
mea
t pro
duct
s
Mea
t pro
duct
s ne
c
Veg
etab
le o
ils a
nd f
ats
Dai
ry p
rod
uct
s
Proc
esse
d r
ice
Suga
r
Foo
d p
rod
uct
s n
ec
Bev
erag
es a
nd
to
bac
co p
rod
uct
s
Text
iles
Wea
ring
app
arel
Leat
her
prod
ucts
Woo
d pr
oduc
ts
Pape
r pr
oduc
ts, p
ublis
hing
Pe
tro
leu
m, c
oa
l pro
du
cts
Ch
emic
al, r
ub
ber
, pla
stic
pro
du
cts
Min
eral
pro
duct
s ne
c
Ferr
ous
met
als
Met
als
nec
Met
al p
rodu
cts
Mot
or v
ehic
les
and
part
s
Tra
nsp
ort
eq
uip
me
nt
ne
c
Ele
ctro
nic
eq
uip
me
nt
Mac
hine
ry a
nd e
quip
men
t ne
c
Man
ufac
ture
s ne
c
Elec
tric
ity
Ga
s m
an
ufa
ctu
re, d
istr
ibu
tio
n
Source: Braun (2003), author‟s calculations.
Annex Figure 6: Intermediate input dispersion by sector
0.60
0.65
0.70
0.75
0.80
0.85
0.90
0.95
Padd
y ri
ce
Wh
ea
t
Ce
rea
l gra
ins
ne
c
Veg
etab
les,
fru
it, n
uts
Oil
se
ed
s
Suga
r ca
ne, s
ugar
bee
t
Plan
t-ba
sed
fibe
rs
Cro
ps n
ec
Bov
ine
catt
le, s
heep
and
goa
ts, h
orse
s
Ani
mal
pro
duct
s ne
c
Raw
milk
Woo
l, si
lk-w
orm
coc
oons
Fore
stry
Fish
ing
Co
al
Oil
Gas
Min
eral
s ne
c
Bov
ine
mea
t pro
duct
s
Mea
t pro
duct
s ne
c
Veg
etab
le o
ils a
nd f
ats
Dai
ry p
rod
uct
s
Proc
esse
d r
ice
Suga
r
Foo
d p
rod
uct
s n
ec
Be
vera
ge
s a
nd
to
ba
cco
pro
du
cts
Text
iles
Wea
ring
app
arel
Leat
her
prod
ucts
Woo
d pr
oduc
ts
Pape
r pr
oduc
ts, p
ublis
hing
Pet
role
um
, co
al p
rod
uct
s
Ch
em
ica
l, r
ub
be
r, p
last
ic p
rod
uct
s
Min
eral
pro
duct
s ne
c
Ferr
ous
met
als
Met
als
nec
Met
al p
rodu
cts
Mot
or v
ehic
les
and
part
s
Tra
nsp
ort
eq
uip
me
nt
ne
c
Elec
tro
nic
eq
uip
men
t
Mac
hine
ry a
nd e
qui
pmen
t ne
c
Man
ufac
ture
s ne
c
Ele
ctri
city
Ga
s m
an
ufa
ctu
re, d
istr
ibu
tio
n
Source: GTAP 7 database, author‟s calculations.

40 – COMPARATIVE ADVANTAGE AND TRADE PERFORMANCE: POLICY IMPLICATIONS
OECD TRADE POLICY WORKING PAPER NO. 121 © OECD 2011
Annex Figure 7. Sales volatility by sector
0
1
2
3
4
5
6
7
Padd
y ri
ce
Wh
eat
Cer
eal g
rain
s n
ec
Ve
ge
tab
les,
fru
it, n
uts
Oil
se
ed
s
Suga
r ca
ne, s
ugar
bee
t
Plan
t-ba
sed
fibe
rs
Cro
ps n
ec
Bov
ine
catt
le, s
hee
p an
d go
ats,
hor
ses
Ani
mal
pro
duct
s ne
c
Raw
milk
Woo
l, si
lk-w
orm
coc
oons
Fore
stry
Fish
ing
Co
al
Oil
Gas
Min
eral
s ne
c
Bov
ine
mea
t pro
duct
s
Mea
t pro
duct
s ne
c
Vege
tabl
e oi
ls a
nd f
ats
Dai
ry p
rod
uct
s
Proc
esse
d r
ice
Sug
ar
Foo
d p
rod
uct
s n
ec
Bev
erag
es a
nd
to
bac
co p
rod
uct
s
Text
iles
Wea
ring
app
arel
Lea
ther
pro
duct
s
Woo
d pr
oduc
ts
Pape
r pr
oduc
ts, p
ublis
hing
Pet
role
um
, co
al p
rod
uct
s
Ch
em
ica
l, r
ub
be
r, p
last
ic p
rod
uct
s
Min
eral
pro
duct
s ne
c
Ferr
ous
met
als
Met
als
nec
Met
al p
rodu
cts
Mot
or v
ehic
les
and
part
s
Tra
nsp
ort
eq
uip
me
nt
ne
c
Elec
tro
nic
eq
uip
men
t
Mac
hine
ry a
nd e
quip
men
t ne
c
Man
ufac
ture
s ne
c
Ele
ctri
city
Ga
s m
an
ufa
ctu
re, d
istr
ibu
tio
n
Source: Braun (2003), author‟s calculations.
Annex Figure 8. Imported intermediates share by industry
0.0
0.1
0.2
0.3
0.4
0.5
0.6
Padd
y ri
ce
Whe
at
Ce
rea
l gra
ins
ne
c
Veg
etab
les,
fru
it, n
uts
Oil
se
ed
s
Suga
r ca
ne, s
ugar
bee
t
Pla
nt-
bas
ed fi
ber
s
Cro
ps n
ec
Bov
ine
catt
le, s
heep
and
goa
ts, h
orse
s
Ani
mal
pro
duct
s ne
c
Raw
milk
Woo
l, si
lk-w
orm
coc
oons
Fore
stry
Fish
ing
Coa
l
Oil
Ga
s
Min
eral
s n
ec
Bov
ine
mea
t pro
duct
s
Mea
t pro
du
cts
nec
Ve
ge
tab
le o
ils a
nd
fa
ts
Dai
ry p
rodu
cts
Proc
esse
d r
ice
Suga
r
Food
pro
duct
s ne
c
Bev
erag
es a
nd to
bacc
o pr
oduc
ts
Text
iles
Wea
ring
app
arel
Leat
her
prod
ucts
Wo
od
pro
du
cts
Pap
er p
rod
uct
s, p
ub
lish
ing
Pe
tro
leu
m, c
oa
l pro
du
cts
Che
mic
al, r
ubbe
r, p
last
ic p
rodu
cts
Min
eral
pro
duct
s ne
c
Ferr
ous
met
als
Me
tals
ne
c
Met
al p
rodu
cts
Mot
or v
ehic
les
and
part
s
Tran
spor
t eq
uipm
ent
nec
Elec
tro
nic
eq
uip
men
t
Mac
hine
ry a
nd e
qui
pmen
t ne
c
Man
ufa
ctu
res
nec
Ele
ctri
city
Gas
man
ufa
ctu
re, d
istr
ibu
tio
n
Source: GTAP 7 database, author‟s calculations.

COMPARATIVE ADVANTAGE AND TRADE PERFORMANCE: POLICY IMPLICATIONS – 41
OECD TRADE POLICY WORKING PAPER NO. 121 © OECD 2011
Annex Figure 9. Hecksher-Ohlin sources of comparative advantage: variation across exporters and industries
1995
3
3.5
4
4.5
5
5.5
6
CH
NIN
DV
NM
IDN
RU
SU
KR
EGY
MA
RK
AZ
AR
GC
HL
BR
ASV
KV
ENTU
RES
TTU
NM
YSTH
AP
OL
MEX
ZAF
CZE
PR
TK
OR
HU
NSV
NN
ZLH
KG
GR
CC
AN
USA ES
PA
US
SGP
GB
RD
NK
BEL
SWE
ITA
IRL
JPN
FRA
DEU
NLD
AU
TFI
NC
HE
NO
RLU
X
log(K/L)*capital intensity
exporter average
average
average - sd across exporter
average + sd across exporter
average - sd across exporter-product
average + sd across exporter-product
2005
3.0
3.5
4.0
4.5
5.0
5.5
6.0
6.5
VN
MIN
DID
NC
HN
UK
REG
YR
US
MA
RK
AZ
BR
AA
RG
TUN
THA
CH
LV
ENM
YSTU
RP
OL
SVK
ZAF
EST
MEX
CZE
HU
NP
RT
KO
RSV
NN
ZLG
RC
HK
GSG
PC
AN
ESP
AU
SG
BR
USA
SWE
NLD ITA
BEL IR
LD
EUFR
AD
NK
FIN
AU
TJP
NC
HE
NO
RLU
X
log(K/L)*capital intensity
exporter average
average
average - sd across exporter
average + sd across exporter
average - sd across exporter-product
average + sd across exporter-product
Note: See variable definitions and sources in the main text of the paper.

42 – COMPARATIVE ADVANTAGE AND TRADE PERFORMANCE: POLICY IMPLICATIONS
OECD TRADE POLICY WORKING PAPER NO. 121 © OECD 2011
Annex Figure 10. Labour force with secondary schooling and skilled labour-intensity: variation across exporters and industries
1995
1
11
21
31
41
51
61
71
IND
VEN
MA
RV
NM
PR
TTH
ASG
PTU
RTU
NB
RA
PO
LSA
USV
N ISL
IDN
MEX FIN
NZL
EGY
ESP
LUX
ISR
DN
KA
RG
IRL
ITA
SVK
ZAF
NO
RC
HL
MYS
GR
CH
KG
BEL
CA
NFR
AK
AZ
EST
HU
ND
EU JPN
CH
EN
LDR
US
AU
TA
US
USA
CH
NU
KR
SWE
CZE
KO
RG
BR
log(lab force with secondary schooling) * skilled-labour intensity
exporter average
average
average - sd across exporter
average + sd across exporter
average - sd across exporter-product
average + sd across exporter-product
2005
1
11
21
31
41
51
61
71
81
91
101
IND
VEN
MA
RP
OL
THA
PR
TV
NM
SGP
TUN
ISL
NZL
SVN
FIN
TUR
ESP
ISR
DN
KID
NM
EXZA
FSA
UEG
YLU
XB
RA
GR
CIR
LA
RG
SVK
CH
LB
ELH
KG
CA
NIT
AJP
NC
HE
KA
ZM
YS EST
NLD
AU
TA
US
FRA
NO
RK
OR
UK
RR
US
HU
NSW
EG
BR
CH
ND
EUU
SA CZE
log(lab force with secondary schooling) * skilled-labour intensity
exporter average
average
average - sd across exporter
average + sd across exporter
average - sd across exporter-product
average + sd across exporter-product
Note: See variable definitions and sources in the main text of the paper

COMPARATIVE ADVANTAGE AND TRADE PERFORMANCE: POLICY IMPLICATIONS – 43
OECD TRADE POLICY WORKING PAPER NO. 121 © OECD 2011
Annex Figure 11. Labour force with tertiary scholling and skilled labour-intensity: variation across exporters and industries
1995
0
5
10
15
20
25
30
35
40
ZAF
VN
MID
NEG
YTU
NC
HN
VEN IN
DM
YSP
RT
MA
RB
RA
ITA
SVN
SGP
AR
GSV
KC
ZETH
AA
UT
SAU
HK
GTU
RP
OL
LUX
ISL
MEX
KA
ZFR
AN
OR
HU
NES
PC
HL
DN
KFI
NR
US
GB
RES
TC
HE
DEU IR
LK
OR
NLD
SWE
GR
CB
EL ISR
CA
NA
US
NZL
JPN
UK
RU
SA
log(lab force with tertiary schooling) * skilled-labour intensity
exporter average
average
average - sd across exporter
average + sd across exporter
average - sd across exporter-product
average + sd across exporter-product
2005
0
5
10
15
20
25
30
35
ZAF
IDN
VN
MA
RG
PR
TIN
DV
ENM
YSTU
NB
RA
MA
RTU
RC
HN
SVK
CZE
EGY
HK
GSV
NIT
ASA
ULU
XP
OL
RU
SA
UT
THA
CH
LK
AZ
FRA
SGP
CH
ED
NK
HU
NN
OR
ISL
MEX FIN
EST
DEU
GB
RN
LDSW
EES
PIR
LK
OR
BEL ISR
GR
CC
AN
USA
AU
SN
ZLU
KR
JPN
log(lab force with tertiary schooling) * skilled-labour intensity
exporter average
average
average - sd across exporter
average + sd across exporter
average - sd across exporter-product
average + sd across exporter-product
Note: See variable definitions and sources in the main text of the paper.

44 – COMPARATIVE ADVANTAGE AND TRADE PERFORMANCE: POLICY IMPLICATIONS
OECD TRADE POLICY WORKING PAPER NO. 121 © OECD 2011
Annex Figure 12. Average years of schooling and skilled labour-intensity: variation across exporters and industries
1995
0.05
0.10
0.15
0.20
0.25
0.30
0.35
MA
RIN
DV
NM
IDN
EGY
TUN
BR
ATU
RV
ENTH
ASA
UC
HN
PR
TM
EXSG
PIT
AES
PZA
FSV
NM
YSG
BR
AU
TFR
AA
RG
GR
CC
HL
KA
ZFI
N ISL
RU
SP
OL
DEU
LUX
HK
GC
HE
DN
KB
EL EST
UK
RH
UN
NLD JPN
KO
RIR
LC
AN
SWE
ISR
NO
RSV
KC
ZEA
US
NZL
USA
log(av years of schooling) * skilled-labour intensity
exporter average
average
average - sd across exporter
average + sd across exporter
average - sd across exporter-product
average + sd across exporter-product
2005
0.05
0.10
0.15
0.20
0.25
0.30
0.35
MA
RIN
DID
NV
NM
VEN
TUR
TUN
EGY
THA
BR
AP
RT
CH
NSA
UZA
FM
EXSG
PSV
NA
RG
ITA
GB
RA
UT
RU
SC
HE
MYS
PO
LC
HL
ESP
FIN
LUX
HK
GD
NK
FRA
GR
CIS
LK
AZ
BEL
NLD
UK
RSV
KC
AN
IRL
JPN
ISR
KO
RH
UN
SWE
EST
DEU
AU
SU
SAN
OR
NZL
CZE
log(av years of schooling) * skilled-labour intensity
exporter average
average
average - sd across exporter
average + sd across exporter
average - sd across exporter-product
average + sd across exporter-product
Note: See variable definitions and sources in the main text of the paper.
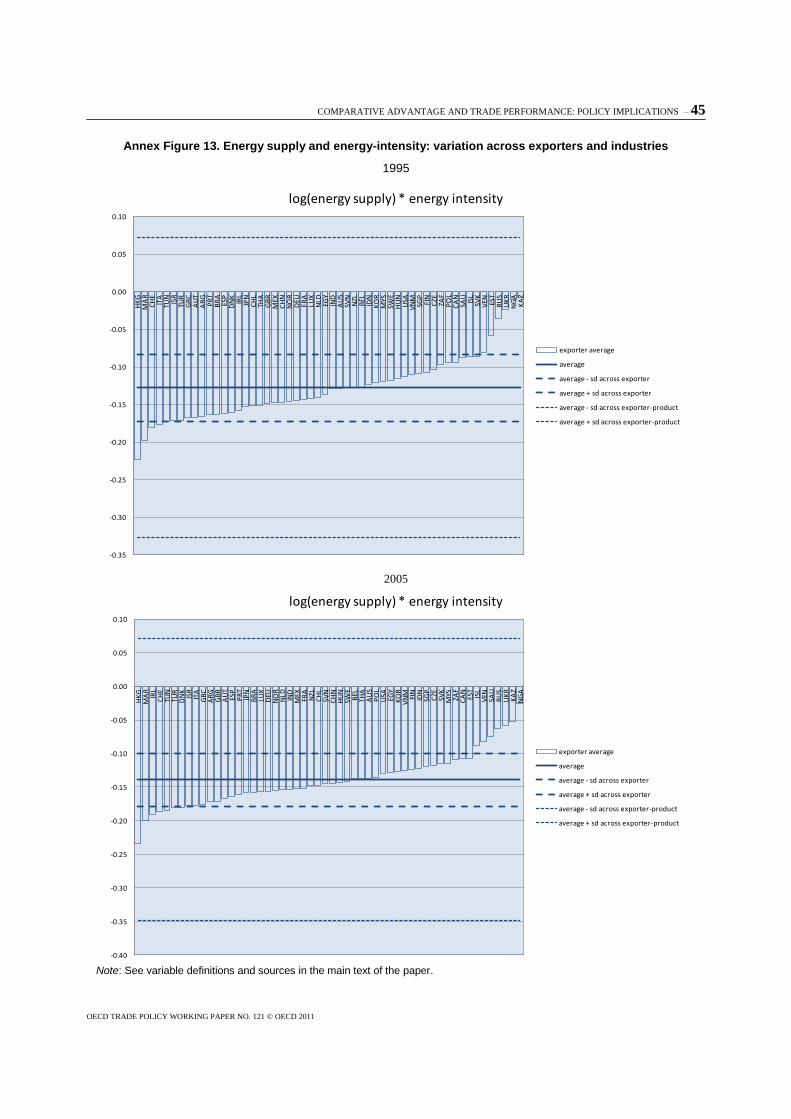
COMPARATIVE ADVANTAGE AND TRADE PERFORMANCE: POLICY IMPLICATIONS – 45
OECD TRADE POLICY WORKING PAPER NO. 121 © OECD 2011
Annex Figure 13. Energy supply and energy-intensity: variation across exporters and industries
1995
-0.35
-0.30
-0.25
-0.20
-0.15
-0.10
-0.05
0.00
0.05
0.10
HK
GM
AR
CH
EIT
ATU
NIS
RTU
RG
RC
AU
TA
RG
PR
TB
RA
ESP
DN
KIR
LJP
NC
HL
THA
GB
RM
EXC
HN
NO
RD
EUFR
ALU
XN
LDEG
YIN
DA
US
SVN
NZL
BEL
IDN
KO
RM
YSSW
EH
UN
USA
VN
MSG
PFI
NC
ZEZA
FP
OL
CA
NSA
UIS
LSV
KV
EN EST
RU
SU
KR
NG
AK
AZ
log(energy supply) * energy intensity
exporter average
average
average - sd across exporter
average + sd across exporter
average - sd across exporter-product
average + sd across exporter-product
2005
-0.40
-0.35
-0.30
-0.25
-0.20
-0.15
-0.10
-0.05
0.00
0.05
0.10
HK
GM
AR
IRL
CH
ETU
NTU
RD
NK
ISR
ITA
GR
CA
RG
GB
RA
UT
ESP
PR
TJP
NB
RA
LUX
DEU
NO
RN
LD IND
MEX
FRA
NZL
CH
LSV
NC
HN
HU
NSW
EB
ELTH
AA
US
PO
LU
SAEG
YK
OR
VN
M FIN
IDN
SGP
CZE
SVK
MYS
ZAF
CA
NES
TIS
LV
ENSA
UR
US
UK
RK
AZ
NG
A
log(energy supply) * energy intensity
exporter average
average
average - sd across exporter
average + sd across exporter
average - sd across exporter-product
average + sd across exporter-product
Note: See variable definitions and sources in the main text of the paper.
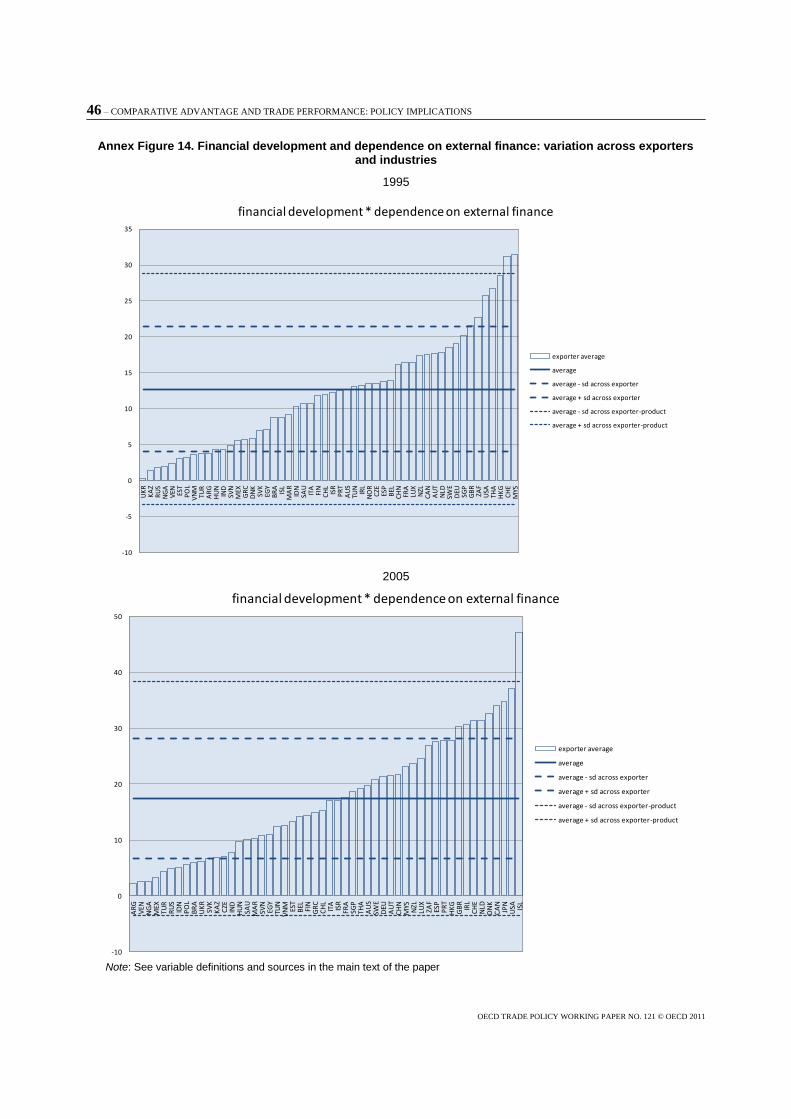
46 – COMPARATIVE ADVANTAGE AND TRADE PERFORMANCE: POLICY IMPLICATIONS
OECD TRADE POLICY WORKING PAPER NO. 121 © OECD 2011
Annex Figure 14. Financial development and dependence on external finance: variation across exporters and industries
1995
-10
-5
0
5
10
15
20
25
30
35
UK
RK
AZ
RU
SN
GA
VEN ES
TP
OL
VN
MTU
RA
RG
HU
NIN
DSV
NM
EXG
RC
DN
KSV
KEG
YB
RA
ISL
MA
RID
NSA
UIT
AFI
NC
HL
ISR
PR
TA
US
TUN
IRL
NO
RC
ZEES
PB
ELC
HN
FRA
LUX
NZL
CA
NA
UT
NLD
SWE
DEU
SGP
GB
RZA
FU
SATH
AH
KG
CH
EM
YS
financial development * dependence on external finance
exporter average
average
average - sd across exporter
average + sd across exporter
average - sd across exporter-product
average + sd across exporter-product
2005
-10
0
10
20
30
40
50
AR
GV
ENN
GA
MEX
TUR
RU
SID
NP
OL
BR
AU
KR
SVK
KA
ZC
ZEIN
DH
UN
SAU
MA
RSV
NEG
YTU
NV
NM
EST
BEL FIN
GR
CC
HL
ITA
ISR
FRA
SGP
THA
AU
SSW
ED
EUA
UT
CH
NM
YSN
ZLLU
XZA
FES
PP
RT
HK
GG
BR
IRL
CH
EN
LDD
NK
CA
NJP
NU
SA ISL
financial development * dependence on external finance
exporter average
average
average - sd across exporter
average + sd across exporter
average - sd across exporter-product
average + sd across exporter-product
Note: See variable definitions and sources in the main text of the paper

COMPARATIVE ADVANTAGE AND TRADE PERFORMANCE: POLICY IMPLICATIONS – 47
OECD TRADE POLICY WORKING PAPER NO. 121 © OECD 2011
Annex Figure 15. Regulatory quality and input concentration: variation across exporters and industries
1995
0
10
20
30
40
50
60
70
80
90
NG
AU
KR
KA
ZR
US
SAU
VN
MV
EN IND
ZAF
CH
NM
AR
EGY
BR
AID
N ISL
SVK
THA
KO
RJP
NTU
RTU
NP
OL
ITA
MEX
HU
NM
YSG
RC
FRA
AR
GSV
NES
PC
AN
BEL
CZE ISR
AU
SP
RT
DEU
NO
RC
HE
SWE
FIN
AU
TD
NK
LUX
IRL
USA
CH
LN
LD EST
GB
RH
KG
NZL
SGP
regulatory quality * input concentration
dispusXpar_bc1
average
average - sd across exporter
average + sd across exporter
average - sd across exporter-product
average + sd across exporter-product
2005
0
10
20
30
40
50
60
70
80
90
VEN
NG
AA
RG
VN
MID
NEG
YK
AZ
MA
RR
US
UK
RC
HN
IND
TUN
SAU
BR
ATU
RM
EXTH
AZA
FM
YSP
OL
KO
RSV
NG
RC
ISR
ITA
CZE
FRA
HU
NSV
KJP
NES
PP
RT
BEL ES
TC
HL
DEU
CH
EN
OR
SWE
USA
AU
TC
AN
GB
RA
US
IRL
ISL
NZL
DN
KN
LD FIN
LUX
HK
GSG
P
regulatory quality * input concentration
exporter average
average
average - sd across exporter
average + sd across exporter
average - sd across exporter-product
average + sd across exporter-product
Note: See variable definitions and sources in the main text of the paper.

48 – COMPARATIVE ADVANTAGE AND TRADE PERFORMANCE: POLICY IMPLICATIONS
OECD TRADE POLICY WORKING PAPER NO. 121 © OECD 2011
Annex Figure 16. Rule of law and input concentration: variation across exporters and industries
1995
0
10
20
30
40
50
60
70
80
90
NG
AK
AZ
RU
SV
ENV
NM
UK
RM
EXID
NC
HN
BR
ATU
NTU
REG
YA
RG
MA
RZA
FSV
KIN
DSA
UES
TP
OL
THA
KO
RM
YSSV
NC
ZEH
UN
ITA
GR
CH
KG
PR
TC
HL
ISR
ESP
JPN
BEL
FRA
LUX
IRL
USA IS
LSG
PC
AN
DEU
GB
RN
LDA
US
SWE
AU
TD
NK
FIN
NZL
CH
EN
OR
rule of law * input concentration
dispusXpar_bc2
average
average - sd across exporter
average + sd across exporter
average - sd across exporter-product
average + sd across exporter-product
2005
0
10
20
30
40
50
60
70
80
90
NG
AV
ENR
US
IDN
KA
ZU
KR
AR
GM
EXB
RA
CH
NV
NM
MA
REG
YTU
RTH
ASA
UZA
FIN
DTU
NP
OL
SVK
ITA
MYS
GR
CH
UN
ISR
CZE
SVN
EST
KO
RES
PP
RT
CH
LJP
NFR
AB
ELH
KG
IRL
USA
GB
RD
EUN
LDA
US
CA
NSG
PSW
EA
UT
NZL
LUX
NO
RC
HE
FIN
DN
KIS
L
rule of law * input concentration
exporter average
average
average - sd across exporter
average + sd across exporter
average - sd across exporter-product
average + sd across exporter-product
Note: See variable definitions and sources in the main text of the paper.

COMPARATIVE ADVANTAGE AND TRADE PERFORMANCE: POLICY IMPLICATIONS – 49
OECD TRADE POLICY WORKING PAPER NO. 121 © OECD 2011
Annex Figure 17. Control of corruption and input concentration: variation across exporters and industries
1995
0
10
20
30
40
50
60
70
80
90
NG
AK
AZ
RU
SV
ENU
KR
SAU
VN
MID
NIN
DTH
AM
EXB
RA
AR
GTU
NC
HN
EST
TUR
EGY
MA
RG
RC
SVK
ITA
KO
RP
OL
MYS
CZE
ZAF
HU
NES
PSV
NJP
NC
HL
BEL
FRA
HK
GIS
RP
RT
USA
AU
SIS
LIR
LLU
XA
UT
DEU
CH
EG
BR
CA
NN
LDSG
PSW
EN
OR
NZL
DN
KFI
N
control of corruption * input concentration
dispusXpar_bc3
average
average - sd across exporter
average + sd across exporter
average - sd across exporter-product
average + sd across exporter-product
2005
0
10
20
30
40
50
60
70
80
90
NG
AV
EN KA
ZID
NV
NM
RU
SC
HN
UK
REG
YA
RG
MEX
IND
BR
AM
AR
THA
SAU
TUR
TUN
PO
LIT
AM
YSG
RC
CZE
SVK
KO
RZA
FH
UN
ISR
EST
SVN
PR
TJP
NES
PC
HL
BEL
FRA
IRL
USA
HK
GLU
XC
AN
DEU
AU
SG
BR
AU
TN
OR
NLD
SWE
CH
ESG
PD
NK
NZL FIN ISL
control of corruption * input concentration
exporter average
average
average - sd across exporter
average + sd across exporter
average - sd across exporter-product
average + sd across exporter-product
Note: See variable definitions and sources in the main text of the paper.

50 – COMPARATIVE ADVANTAGE AND TRADE PERFORMANCE: POLICY IMPLICATIONS
OECD TRADE POLICY WORKING PAPER NO. 121 © OECD 2011
Annex Figure 18. Protection to standard employment contract and sales volatility: variation across exporters and industries
1995 and 2005
-0.2
0.0
0.2
0.4
0.6
0.8
1.0
1.2
1.4
1.6
CZE
IND
NG
ASV
KJP
NA
US
AU
TC
AN
CH
EC
HN
DN
KG
BR
IRL
ISR
MA
RM
YSN
LDN
OR
NZL
PO
LSG
PU
SA ZAF
HU
NK
AZ
VN
MFR
ASV
NTH
AC
HL
ITA
SWE
AR
GB
ELD
EUTU
RU
KR
FIN
RU
STU
NES
PG
RC
IDN
PR
TB
RA
VEN
MEX
protection to standard employment contract * volatility
volXpar_index_altern12_lp
average
average - sd across exporter
average + sd across exporter
average - sd across exporter-product
average + sd across exporter-product
Note: See variable definitions and sources in the main text of the paper
Annex Figure 19. Cost of increasing the number of hours and sales volatility: variation across exporters and industries
1995 and 2005
-0.4
-0.2
0.0
0.2
0.4
0.6
0.8
1.0
1.2
1.4
1.6
GB
RN
ZLV
NM
THA
MA
RIR
LM
YSA
RG
IND
CH
LJP
NIS
RM
EXZA
FSG
PB
RA
USA
TUR
NG
AC
HN
CA
NA
US
HU
NG
RC
IDN
UK
RA
UT
BEL
CH
EC
ZED
EUD
NK
ESP
FIN
FRA
ITA
KA
ZN
LDN
OR
PO
LP
RT
RU
SSV
KSV
NSW
ETU
NV
EN
cost of increasing the number of hours * volatility
volXpar_cost_overtimen_a_lp
average
average - sd across exporter
average + sd across exporter
average - sd across exporter-product
average + sd across exporter-product
Note: See variable definitions and sources in the main text of the paper.

COMPARATIVE ADVANTAGE AND TRADE PERFORMANCE: POLICY IMPLICATIONS – 51
OECD TRADE POLICY WORKING PAPER NO. 121 © OECD 2011
Annex Figure 20. Cost of firing labour force and sales volatility: variation across exporters and industries
1995 and 2005
-0.2
0.0
0.2
0.4
0.6
0.8
1.0
1.2
NZL
NG
AC
AN
USA JPN
MA
RB
ELC
HE
MYS
AU
TIS
RA
RG
HU
NES
PTU
RM
EXFR
AIT
AD
EUP
OL
GB
RD
NK
ZAF
NO
RSW
EA
US
FIN
SVN
IRL
GR
CU
KR
CH
NSG
PK
AZ
BR
AR
US
PR
TV
NM
IND
THA
SVK
CZE
VEN
TUN
IDN
NLD
CH
L
cost of firing labour force * volatility
volXpar_firing_cost_3years_n_lp
average
average - sd across exporter
average + sd across exporter
average - sd across exporter-product
average + sd across exporter-product
Note: See variable definitions and sources in the main text of the paper.
Annex Figure 21. Protection against dismissal and sales volatility: variation across exporters and industries
1995 and 2005
-0.2
0.0
0.2
0.4
0.6
0.8
1.0
1.2
JPN
MYS
SGP
VEN
AU
SB
ELC
HE
GB
RN
ZLU
SA ZAF
AR
GA
UT
CA
NC
HL
DN
KG
RC
HU
NIR
LIS
RN
GA
THA
TUR
CH
NC
ZE ITA
MA
RB
RA
DEU FIN
PO
LSV
KES
PID
NN
LDN
OR
PR
TSV
NSW
ETU
NFR
AIN
DK
AZ
MEX
RU
SU
KR
VN
M
protection against dismissal * volatility
volXpar_index_dism2_lp
average
average - sd across exporter
average + sd across exporter
average - sd across exporter-product
average + sd across exporter-product
Note: See variable definitions and sources in the main text of the paper.

52 – COMPARATIVE ADVANTAGE AND TRADE PERFORMANCE: POLICY IMPLICATIONS
OECD TRADE POLICY WORKING PAPER NO. 121 © OECD 2011
Annex Figure 22. Statutory power and protection of unions and sales volatility: variation across exporters and industries
1995 and 2005
-0.2
0.0
0.2
0.4
0.6
0.8
1.0
1.2
GB
RM
YSN
ZLC
AN
IND
MA
RSG
PU
SAA
US
CH
NID
NIS
RN
GA
CH
EB
RA
THA
VN
MA
UT
BEL
CH
LC
ZE FIN
GR
CIR
LIT
AN
LDSV
NTU
NA
RG
KA
ZM
EXR
US
SVK
TUR
UK
RV
ENSW
EFR
AD
EUD
NK
ESP
HU
NJP
NN
OR
PO
LP
RT
ZAF
statutory power and protection of unions * volatility
volXpar_index_col_barg13_up
average
average - sd across exporter
average + sd across exporter
average - sd across exporter-product
average + sd across exporter-product
Note: See variable definitions and sources in the main text of the paper.
Annex Figure 23. Protection during collective disputes and sales volatility: variation across exporters and industries
1995 and 2005
-0.2
0.0
0.2
0.4
0.6
0.8
1.0
1.2
DN
KN
GA
FIN
CA
NC
ZEA
UT
CH
LIS
RSV
KTH
ATU
NB
RA
CH
NG
BR
MYS
TUR
USA ZA
FB
ELP
OL
AU
SES
PSW
EC
HE
DEU
HU
NID
NIR
LN
LD NZL
VEN
GR
CJP
NSG
PSV
NA
RG
MEX
NO
RP
RT
RU
SU
KR
VN
MIN
DFR
AK
AZ
ITA
MA
R
protection during collective disputes * volatility
volXpar_index_col_disp13_up
average
average - sd across exporter
average + sd across exporter
average - sd across exporter-product
average + sd across exporter-product
Note: See variable definitions and sources in the main text of the paper.

COMPARATIVE ADVANTAGE AND TRADE PERFORMANCE: POLICY IMPLICATIONS – 53
OECD TRADE POLICY WORKING PAPER NO. 121 © OECD 2011
Annex Figure 24. Imported intermediate inputs and import tariff policy: variation across exporters and industries
1995
-0.4
-0.3
-0.2
-0.1
0.0
0.1
0.2
0.3
0.4
0.5
EST
JPN
AU
TB
ELD
EUD
NK
ESP
FIN
FRA
GB
RG
RC
IRL
ITA
LUX
NLD PR
TSW
EU
SA ISL
ISR
CZE
NZL
UK
RA
US
NO
RSV
KP
OL
KO
RTU
RC
AN
MYS
HU
NC
HL
KA
ZR
US
SVN
SAU
MEX
AR
GV
ENB
RA
IDN
VN
MZA
FTH
AN
GA
EGY
CH
NTU
NIN
DM
AR
log (average applied tariff) * imported inputs share
true_imintm_shareXlip_par_savahs
average
average - sd across exporter
average + sd across exporter
average - sd across exporter-product
average + sd across exporter-product
2005
-0.10
-0.05
0.00
0.05
0.10
0.15
0.20
0.25
0.30
0.35
NO
RA
UT
BEL
CZE
DEU
DN
KES
PES
TFI
NFR
AG
BR
GR
CH
UN
IRL
ITA
LUX
NLD
PO
LP
RT
SVK
SVN
SWE
ISR
TUR
JPN
KA
ZU
SA ISL
CA
NN
ZLSA
UA
US
CH
LU
KR
IDN
MYS
ZAF
KO
RM
EXC
HN
RU
SA
RG
THA
NG
AB
RA
VEN
VN
MTU
NIN
DEG
YM
AR
log (average applied tariff) * imported inputs share
exporter average
average
average - sd across exporter
average + sd across exporter
average - sd across exporter-product
average + sd across exporter-product
Note: See variable definitions and sources in the main text of the paper.