tracking of a dynamic graph using a signal theory approach
TRANSCRIPT
Tracking of a dynamic graph using a signal theory approach :application to the study of a bike sharing systemRonan HAMON1,2, Pierre BORGNAT1, Patrick FLANDRIN1, Céline ROBARDET2
1Laboratoire de Physique de l’ENS de Lyon (UMR CNRS 5672)46, allée d’Italie 69364 Lyon cedex 07, France
2LIRIS, INSA de Lyon (UMR 5205) Bâtiment Blaise Pascal20, Avenue Albert Einstein 69621 Villeurbanne cedex, France
[email protected], [email protected]@ens-lyon.fr, [email protected]
This work is supported by the programs ARC 5 and ARC 6 of the region Rhône-Alpes
Abstract – Dynamic graphs are useful objects to describe a network which evolves over time. We propose a signal theory approachto analyze them which consists of transforming the graph at each time step into a collection of signals and analyze these signalsusing spectral decomposition. An inverse transformation is also proposed and makes it possible to reduce the dimension of thegraph and select the most significant edges. The method is applied on a real dynamic graph based on data about the bike sharingsystem Vélo’v in Lyon. The analysis of signals representing the graph highlights the weekly cycle of rentals and the inversetransformation enables us to obtain sparser graphs.
1 Introduction
Many networks, whether physical, biological or social, can be described by graphs which become dynamic if a timeevolution is added. These graphs are difficult to study because there exist only a few tools to describe these objects. Theaim here is to propose a new method to visualize synthetically time evolution of dynamic graphs. The originality of thismethod is to adopt a signal theory approach by computing frequency analysis on signals representing the graphs. Thetransformation in a collection of signals is computed using multidimensional scaling then specific frequency patternsof these series are linked to graph properties. Performing the transformation for each time step enables us to monitorthe evolution of the frequency patterns and hence of the structure of the graph.
The interest of having a collection of signals which describe exactly the graph is that it enables to reduce easily thedimension of the graph by retaining only a few signals in the representation. The construction of approximated graphsfrom the original graph highlights graph properties such as communities structure.
An example of complex networks with a time evolution is the Vélo’v system [1]. Many big cities in the worldpropose a bike sharing system in which bikes are made available at any time for short trips. In Lyon, the Vélo’vprogram has been deployed since May 2005 and consists of 350 stations spread over all the agglomeration in whichbikes can be hired or returned back. Thanks to a partnership with the operator JCDecaux and the “Grand Lyon”City Hall, anonymized data for the year 2011 were made available to us. Data consists of the records of trips, eachdocumented with its starting date and departure station, its ending date and destination station and specific tags.
The study of such system has numerous goals as for instance viability of the system, its integration in the transporta-tion scheme of the city or the social behaviors linked to the bike use. The system Vélo’v has been intensively studiedin [3] for the period from May 2005 to December 2007. We propose in section 3 a dynamic graph approach of thissystem using the transformation into a collection of signals described in section 2.
1
2 Transformation from a graph to a collection of signals
2.1 Description of the method
Notations Let G = V, E a simple undirected and unweighted graph where V is the set of vertices (or nodes) of size#V = n and E is the set of edges (or links) of size #E = m. We note (Aij)i,j!1,..,n its adjacency matrix.
Principle Shimada et al. [6] proposed a method to transform a graph into a collection of signals with n points indexedby the vertices of the graph by using classical multidimensional scaling (CMDS). The interest of this transformation isbased on the fact that if n signals enable us to reconstruct exactly the original graph, it is also possible to reduce therepresentation retaining only a small number of signals.
This transformation consists of applying CMDS on a matrix distance between vertices of a graph, noted ! =(!)i,j!1,..,n and defined for i, j ! V by
!ij =
!"
#
0 if i = j1 if aij = 1 and i "= jw > 1 if aij = 0 and i "= j
with w > 1. Following [6], we choose w = 1.1.Multidimensional scaling (MDS) [2] is a set of mathematical techniques used to represent measurements of similarity
(or dissimilarity) among pairs of objects as distances between points in a multidimensional space whose dimension islow. Classical MDS is a particular case of metric MDS where the dissimilarities are assumed to be Euclidean distances.The matrix X of coordinates can be computed analytically. Starting with the distance matrix !, we first compute adouble centering of the matrix whose terms are squared : B = #1
2J!(2)J with J = In # 1
n1n1Tn where In is the
identity matrix and 1n1Tn an n$ n matrix of ones.
The CMDS solution is given by X = Q+"12+ with "+ a diagonal matrix whose terms are the eigenvalues of the
matrix B sorted in an increasing order and Q+ is the matrix of the corresponding eigenvectors. The obtained signalsare the components (or columns) of the matrix X and the j-th signal is noted X(j). These signals are indexed by thevertices of the graph.
Relabeling of a graph Shimada et al. [6] show that ring lattices are transformed to periodic time series : eachcomponent is a cosine whose frequency depends on the number of the components. More generally, it can be relevantto describe signals using spectral analysis and hence link frequency features with graph properties. Nevertheless thespectral analysis is closely related to the indexation of signals and so to the numbering of the graph. It becomesnecessary to find a good numbering of vertices in order to have good spectral properties. We propose a method basedon the fact that we want to avoid brutal variations of signals. That means that it is necessary to have close numberingbetween neighbor vertices, which are defined closer in the distance matrix than unlinked vertices. This problem can berelated to another graph labeling problem called cyclic bandwidth sum problem [5]. We proposed a heuristic to find agood labeling [4] which is not the subject of this submission.
Inverse transformation The reconstruction of a graph from a collection of signals is trivial if all components areretained according to the principle of the CMDS : the distance matrix D between points in the Euclidean space is equalto the distance matrix ! and so a thresholding enables us to reconstruct the graph.
If less components are retained, the distances between points are neither equal to 1 nor to w but have a distributionwhose width depends on the number of retained components. These distributions can be used to select the mostsignificant links, considering that if an edge is related to a smaller distance than another edge, then it is more significant.This leads us to set a threshold on the distances under which one supposes that there is a significant edge and over whichno edge is put. As the real distance between vertices is known, the distributions of distances between linked verticesand between unlinked vertices can be separated and it is possible to know in which interval the distributions overlap.
2
For a given ratio r of retained components over all components, the threshold is chosen so that the selected edges donot belong to the interval where the distributions overlap.
Analysis of signals Let us consider a collection of K signals indexed by n vertices. Several features can be computedto describe the components. We note S(k, f) = |FX(k)(f)|2 which is estimated, for positive frequencies, on n
2 + 1bins, %k ! {1, · · · ,K}, F being the Fourier transform. We then compute the following features :
1. Energy of components : %k ! {1, · · · ,K}, Ek = &X(k)&22. Energy of frequencies : %f ! {1, · · · , n2 + 1}, S̄(f) =
$Kk=1 S(k, f)
3. Mean frequency by components : %k ! {1, · · · ,K}, f̂k =!n
2 +1
f=1 fS(k,f)!n
2 +1
f=1 S(k,f)
These indicators can be linked to graph properties as it will be illustrated in section 2.2.
Extension to dynamic graphs Spectral analysis of signals derived from a transformation of a graph enables us tohighlight relations between feature patterns and graph properties. This approach can be extended to dynamic graphs :temporal tracking of these features shows the evolution of the global structure of the graph. Considering that at eachtime step a dynamic graph is a static graph, the extension to dynamic graphs consists of the application of the methoddescribed previously on the derived static graph. The features described for static graphs can be visualized over timeand hence help to track the structure of the dynamic graph.
2.2 Illustration
Description of the studied graph We apply the method to a graph with communities i.e, with groups of verticesmore linked between them than with other vertices, at different scales. At a small scale, 16 communities are visible,then progressively the communities merge to form 8 communities, then 4 communities and finally at a large scale 2communities. Figure 3a shows a colored representation of the graph.
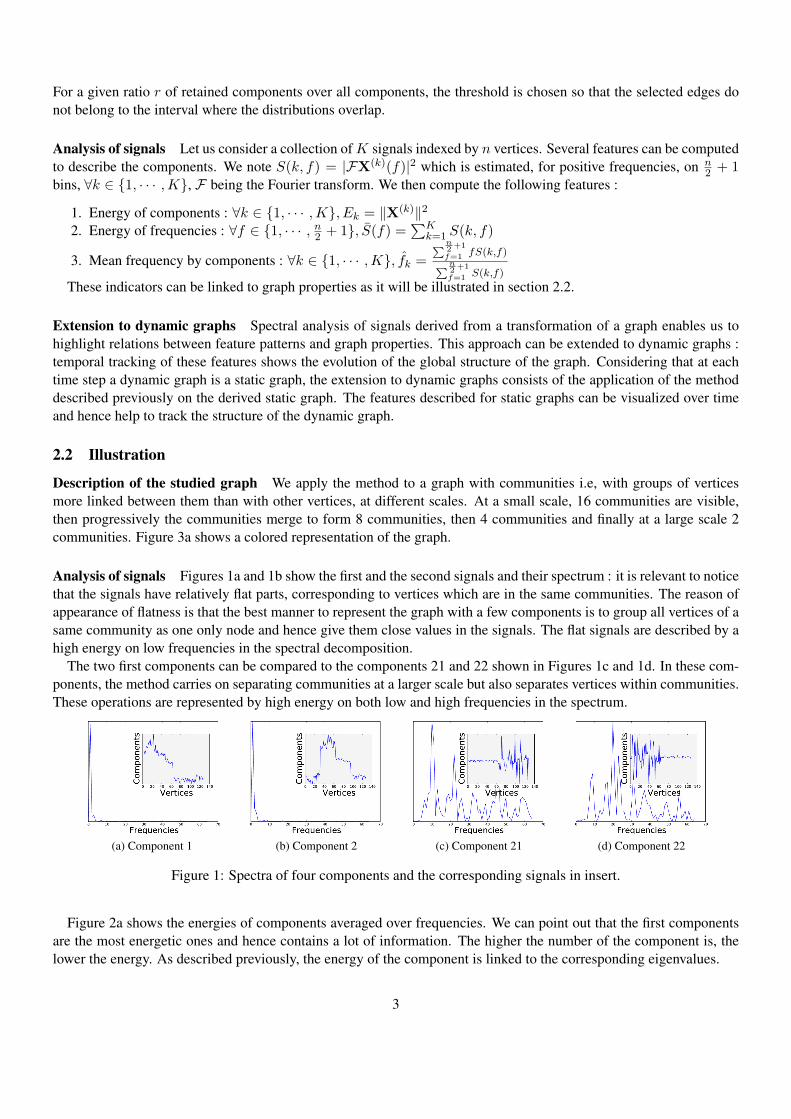
Analysis of signals Figures 1a and 1b show the first and the second signals and their spectrum : it is relevant to noticethat the signals have relatively flat parts, corresponding to vertices which are in the same communities. The reason ofappearance of flatness is that the best manner to represent the graph with a few components is to group all vertices of asame community as one only node and hence give them close values in the signals. The flat signals are described by ahigh energy on low frequencies in the spectral decomposition.
The two first components can be compared to the components 21 and 22 shown in Figures 1c and 1d. In these com-ponents, the method carries on separating communities at a larger scale but also separates vertices within communities.These operations are represented by high energy on both low and high frequencies in the spectrum.
(a) Component 1 (b) Component 2 (c) Component 21 (d) Component 22
Figure 1: Spectra of four components and the corresponding signals in insert.
Figure 2a shows the energies of components averaged over frequencies. We can point out that the first componentsare the most energetic ones and hence contains a lot of information. The higher the number of the component is, thelower the energy. As described previously, the energy of the component is linked to the corresponding eigenvalues.
3

Figure 2b shows the energies of frequencies averaged over components. As we noticed previously looking at the firsttwo components, we can remark that the energy of low frequencies is much higher than the energy of high frequencies.
This remark can be exhibited more clearly by displaying the energy with respect to both frequencies and componentsin Figure 2c : the energy is concentrated on low frequencies for the first components.
(a) Energy of components (b) Energy of frequencies (c) Energy with respect to components andfrequencies. The color is coded from darkblue (low values) to dark red (high value)
Figure 2: Energy with respect to components and frequencies
Inverse transformation from signals to graph Following the method described previously, we can construct ap-proximated graphs where the retained edges are the most significant. Figure 3a shows the original graph, and Figures3b, 3c and 3d show different reconstructions of the graph using different values of the ratio r of number of retainedcomponents over total number of components.
(a) Original graph. m =516
(b) r = 0.1. m = 448 (c) r = 0.16. m = 452 (d) r = 0.2. m = 421
Figure 3: Original graph and reconstructed graphs using different values of ratio r between number of retained com-ponents and total number of components. The color indicates the community of nodes at the smaller scale and theproximity between colors shows the proximity between communities.
It is relevant to note that the value of the ratio r enables us to highlight the different levels of communities. With a lowvalue of r, the most significant edges consist of the edges inside communities. The vertices inside a same communityhave indeed a strong relation between them. If the ratio r increases, edges between communities are discovered.
3 Application to the Vélo’v graph
3.1 Construction of the Vélo’v graph
Anonymized data for the year 2011 were made available to us by the operator JCDecaux and the “Grand Lyon” CityHall . Data consists of the records of trips, each documented with its starting date and departure station, its ending dateand destination station and specific tags. Using these trips, we built a dynamic graph of the system Vélo’v for the year2011: for each time step of 1 hour, a static graph is generated where the vertices are the stations which have an activityand an edge between two stations denotes that a bike has been hired in one of the two stations and been taken back inthe other one.
4

3.2 Analysis of the graph
We focus for the analysis on seven consecutive days from Monday 9th May, 2011 to Sunday 16th May. These daysare a typical working week without public holiday nor school holidays. The transformation described in section 2 isperformed on the dynamic graph built using the Vélo’v data.
Energy of components Figure 4a shows the energy of components over time. We can easily notice the presence of aweekly cycle with the five working days and the week-end where the energy is lower. This graph can be related to thenumber of rentals as shown in figure 5a where the number of rentals per hour has been computed for the same week. Itis strongly related to the number of edges 5b at each time step which has the same behavior over time, with presenceof peak in the morning, at noon and in the evening which are likewise visible with high energy in the first componentsat the same hours.
(a) Energy of components over time
(b) Energy of frequencies averaged over all components over time (c) Mean frequency of components over time
Figure 4: Analysis of the Vélo’v graph. The color is coded from dark blue (low value) to dark red (high value). Thesolid line represents midnight while the dashed line represents noon.
(a) Number of rentals per hour for theweek from May 9, 2013 to May 16,2013.
(b) Number of edges in the Vélo’v graphper hour for the week from May 9, 2013to May 16, 2013.
Figure 5: The solid line represents midnight while the dashed line represents noon.
The analysis of the energy of frequencies over all components and the mean frequency of components is less obvious.It shows nonetheless that exists a structure of the graph, less dependent to the number of rentals. The presence of highfrequencies in the first few components indicates the presence of structures inside the graph.
5

Reconstruction of the Vélo’v graph Following the method of reconstruction described in the previous section, wecan build an approximation at each time step of the Vélo’v graph. We focus for this study on the day of May 9, 2013.
Figures 6a and 6c show the Vélo’v graph at 7am and 7pm while 6b and 6d show the reconstructed graph at the samehours using r = 0.53.
(a) Original Vélo’v graph at 7am : n =291, m = 950
(b) Reconstructed Vélo’v graph at 7am :n = 291, m = 312
(c) Original Vélo’v graph at 7pm : n =312, m = 1916
(d) Reconstructed Vélo’v graph at 7pm :n = 312, m = 352
Figure 6: Visualization of the Vélo’v at different times. The color of vertices represents the degree, from white (lowdegree) to dark red (high degree).
We can see that the reconstructed graphs have less edges than the original graphs. It enables us to highlight moreclearly the structure of the network as for instance the local hubs. Indeed in the original graph at 7am the station withthe highest degree is near the railway station "Part-Dieu" which is a major business center. Its dominance hides otherstations. In the reconstructed graph it is possible to avoid this effect and in some way to "normalize" the graph to catchalso minor hubs.
References
[1] Grand lyon - Vélo’V. http://www.velov.grandlyon.com/.[2] I. Borg and P. Groenen. Modern multidimensional scaling: Theory and applications. Springer, 2005.[3] P. Borgnat, P. Abry, P. Flandrin, C. Robardet, J.-B. Rouquier, and E. Fleury. Shared bicycles in a city: a signal
processing and data analysis perspective. Advances in Complex Systems, 14(03):415–438, June 2011.[4] R. Hamon, P. Borgnat, P. Flandrin, and C. Robardet. Relabeling nodes according to their neighbourhood -
http://perso.ens-lyon.fr/ronan.hamon/files/relabeling.pdf. Technical report, 2013.[5] H. Jianxiu. Cyclic bandwidth sum of graphs. Applied Mathematics-A Journal of Chinese Universities,
16(2):115–121, 2001.[6] Y. Shimada, T. Ikeguchi, and T. Shigehara. From networks to time series. Phys. Rev. Lett., 109(15):158701, Oct.
2012.
6