towards community environmental … · university for their supportive roles. my sincere gratitude...
TRANSCRIPT
TOWARDS COMMUNITY ENVIRONMENTAL EDUCATION
USING CURRENT INSTITUTIONAL RESOURCES, GIS AND
REMOTE SENSING, AND LOCAL KNOWLEDGE: A CASE
OF THE NANDI HILLS AND NANDI FORESTS, WESTERN
KENYA
By
Julius Gordon Tanui
Submitted in the fulfillment of the requirements for the degree of
Philosophae Doctor Educationis
in the Faculty of Education
at the Nelson Mandela Metropolitan University
Port Elizabeth
South Africa
PROMOTER: Prof. Paul Webb
December 2011
i
DECLARATION BY CANDIDATE
I, Julius Gordon Tanui, hereby declare that the work in this thesis is my own original work and
all sources used or referred to have been documented and recognized. I further declare that this
thesis has not been previously submitted in full or partial fulfillment of the requirements for an
equivalent or higher qualification at any other recognized education institution.
JULIUS GORDON TANUI DATE
ii
ACKNOWLEDGEMENTS
First and foremost, I wish to thank God for the graces he bestowed on me while undertaking this
study: the gift of life, strength and intellectual capabilities to realize this dream and the benefit it
will confer on the communities at stake.
My unreserved appreciation and gratitude goes to my supervisor, Professor Paul Webb, for his
invaluable inspiration, insight, criticisms, encouragement, patience, guidance, scholarly and
constructive comments throughout this study. I was touched by the moral support extended to me
by his entire family; his wife Pamela Webb, Granny Teresa Zimmerman, daughter Angela Webb
and granddaughter Keryn Gathorn-Gillham
I am indebted to Prof. Eric Mibey and Prof. Derrick Swarts, the Vice-Chancellors of Moi
University and Nelson Mandela Metropolitan University respectively. Prof. Thokozile Mayekiso
Deputy Vice-Chancellor Research and Engagement of NNMU and Prof. Bob Wishitemi, Deputy
Vice-Chancellor Research and Extension, Dr. James Sang Chief Administrative Officer Moi
University for their supportive roles.
My sincere gratitude goes to the following: Prof. M.M Botha for her initial approval of my study
and formal introduction to my research promoter, Prof. Peter Barasa, Dean School of Education
Moi University for his support during the extension of study leave to enable me complete my
work, Dr. I. N. Kimengi, former Dean, School of Education Moi University for his role in
encouraging me to go for this study, Dr. Jonah Kindiki, Head of Department, Educational
Management & Policy Studies Moi University also for his encouragement and support, Mr.
iii
Philip Barmase, Principal Administrative Officer for his role in facilitating for requirements for
my study leave and Ms. Carol Poisat, NMMU, for her administrative work and co-ordination.
I cannot forget to appreciate Prof David K. Some for his professional advice and counsel during
my study, Prof. D.K.Serem, Principal Narok University Campus for offering to critique my work
at the very early stage, Dr. Samson Ayugi, Dept. of Geomatics Kenya Polytechnic University
and Dr. Douglas Musiega, Dept. of Geomatics Jomo Kenyatta University of Agriculture &
Technology for their role in critiquing the Cartographic and Map section of my work.
My appreciation also goes to Kenya Forest Service especially the Director, Mr. David Mbugua,
Ms. Sarah Kahuri, Assistant Director in charge of Forest Information Systems and Mrs. Seroney,
Zonal Manager-Nandi County. I owe a lot to the following Kenya Institute of Surveying and
Mapping (KISM) Staff: Wilson K. Ngetich, Raymond Kiprono Ng‟eno, Richard K. Towett and
Faith Jeruto for their input in the field of Remote Sensing, data capture, map reproduction and
scaling using Geo-ICT Technology so as to make this work more comprehensible and
presentable, the secretaries and librarians for their supportive role; Dr Marina Ward, Ms. Ndileka
Jacobs of NMMU, Dr. Tirong Tanui and Mrs. Lydia Ruto of Moi University deserve a special
mention. The collaborative roles my research assistants, Mr. Tom Odero Ombogo and Mr.
Martin Luther King Okore, played can also not go unappreciated.
It is with immense gratitude that I thank the Lt. Dr. Philip K. Kosgey formerly of Kenyatta
University for his inspiration and mentorship as a young scholar, Dr. Richard Sigei for his
motivation and collaboration, Dr. Catherine Jematia Kiprop, my colleague and Alumni of Nelson
Mandela Metropolitan University for her recommendation and introduction to NMMU, my
colleagues at the Department of Education Management and Policy Planning, School of

iv
Education Moi University Mr. Samuel Maritim, Mr Wambua Kyalo Dr. Tom Ndege and Mr.
Zack Kosgey to mention but a few for their invaluable support during my study.
Special thanks go to Dr. Nico Jooste, Director Office for International Education Nelson
Mandela Metropolitan University, Mrs. Terry-Ann Jones; Manager Study Abroad at Home-
NMMU, Mrs. Beverly Sanderson Manager International Students Finance-NMMU, Ms Natasha
September, Postgraduate Student Administrator-NMMU, Mr. Paul Geswindt, Director Alumni
Relations-NMMU, Mr. Ridaa Salie- Manager Faculty Administration-NMMU for their support,
good wishes and assistance in one way or another that facilitated my study.
I wish to thank my entire extended family and friends for providing a loving environment; My
late father James Kiptanui Arap Rono for instilling in me a sense of responsibility and love for
studies, my mother Rachel Rono for her moral and spiritual support, all my siblings and my
father -in –law Philip Arap Chepkwony for his steadfast encouragement. The support I received
from Mr. Mahendra Gordonbhai Patel, Hon. Justice Francis Tuiyott, Mr. Elvis Langat and Mr.
Mathew Cheruiyot cannot go unmentioned.
I owe my deepest gratitude to my wife, Josephine Cherotich Tanui for helping me get through
the taxing times by providing the much needed emotional support, camaraderie and care. I
cannot forget to mention my children: Cathleen Chebet, Celine Chepkoech, Joshua Gordons
Kipkorir (Jnr.) and Carynn Cherop for their endurance and understanding throughout the study.
v
DEDICATIONS
This thesis is dedicated to:
My dearest caring wife Josephine;
My three little angels Cathleen, Celine and Carynn; and
My beloved son Joshua Gordons Jnr.
vi
ABSTRACT
The Nandi Hills and Nandi Forests in Nandi County, Kenya are major water catchments for Lake
Victoria. However, these resources have faced significant decline and degradation in recent
times, thereby impacting the hydrological quality and quantity in the Lake Victoria Basin. This
study was informed by the observed degradation of the Nandi Hills and Nandi Forests,
epitomized by the receding forest cover, drying up of previously permanent streams, instances of
mudslides and rock falls, and downstream flooding. The study therefore sought to interrogate the
current institutional environmental and educational arrangements and practices which are
pertinent to the sustainable management of the Nandi Hills Forests, the perceptions and
understandings of the local population in terms of forest resources and land use, and the
information that can be provided by GIS and Remote Sensing data, in order to produce a
heuristic for planning community environmental education in the Nandi County. To achieve this,
a mixed methodological design which incorporated both qualitative and quantitative data was
embraced. The mixed method approaches used in this study were the concurrent triangulation
and nested/embedded designs. A four-tier analysis was carried out once all the data had been
coded and grouped. The analysis covered three categories of the population in the study area;
namely the households, institutions and community groups, and analysis of Landsat images for
change detection. The study reveals that there are several state and non-state institutions that are
involved in the management of the Nandi Hills Forests and that their efforts have seen an
improvement in the perceptions of the local population in terms of the importance of
environmental management of the forests. Analysis of the Landsat images has revealed receding
natural forest cover. The contribution of informal, local and indigenous knowledge to sustainable
management of the Nandi Hills Forest was notable (85% of the population attribute their
knowledge on forests and forestry to informal knowledge sources). These results informed the
development of a heuristic to enable the adoption of strategies using readily accessible, though
loosely applicable, information for problem solving in developing and implementing community
environmental education practices for effective forest management and conservation practices
that are responsive to the needs of the Nandi Forest community.
vii
ACRONYMS
ACM - Adaptive Co-Management
CAAC - Catchment Area Advisory Committees
CBNRM - Community-Based Natural Resource Management
CBO - Community Based Organization
CBS - Central Bureau of Statistics
CEE - Community Environmental Education
CF - Community Forestry
CFM - Community Forest Management
CIFM - Community Involvement in Forest Management
CIFOR - Centre for International Forestry Research
CMS - Catchment Management Strategies
CPF - Collaborative Partnership on Forests
DDC - District Development Committees
DEO - District Environment Officers
DFRD - District Focus for Rural Development
EMCA - Environment Management and Co-ordination Act
FAO - Food and Agriculture Organization
FGD - Focus Group Discussion
GFRA - Global Forest Resources Assessment
GIS - Geographic Information System
IEE - International Environment Education
viii
IFF - Intergovernmental Forum on Forests
IPF - Intergovernmental Panel on Forests
ITTO - International Tropical Timber Organization
IUCN - World Conservation Union
KEFRI - Kenya Forestry Research Institute
KFS - Kenya Forest Service
KNPC - Kenya National Population Census
KWS - Kenya Wildlife Service
MaSL - Metres above Sea Level
MDG - Millennium Development Goals
MEMR - Ministry of Environment and Mineral Resources
NDDP - National and District Development Plans
NEMA - National Environment Management Authority
NGO - Non Governmental Organization
NMK - National Museums of Kenya
NTZA - Nyayo Tea Zone Authority
NWFP - Non-Wood Forest Products
ODI - Overseas Development Institute
PFM - Participatory Forest Management
PNG - Papua New Guinea
PPCSC - Permanent Presidential Commission on Soil Conservation
PRA - Participatory Rural Appraisal
RDA - Regional Development Authorities

ix
RRA - Rapid Rural Appraisal
RS - Remote Sensing
SFM - Sustainable Forest Management
UN - United Nations
UNCED - United Nations Conference on Environment and Development
UNDP - United Nations Development Programme
UNEP - United Nations Environment Programme
UNESCO - United Nations Educational, Scientific and Cultural Organization
UNFF - United Nations Forum on Forests
WCS - World Conference on Science
WRMA - Water Resources Management Authority
WRUA - Water Resource User Associations
WWF - World Wide Fund for Nature
x
TABLE OF CONTENTS
DECLARATION BY CANDIDATE ............................................................................................................ i
ACKNOWLEDGEMENTS .......................................................................................................................... ii
DEDICATIONS ............................................................................................................................................ v
ABSTRACT ................................................................................................................................................. vi
ACRONYMS .............................................................................................................................................. vii
TABLE OF CONTENTS .............................................................................................................................. x
LIST OF FIGURES .................................................................................................................................. xvii
LIST OF TABLES ...................................................................................................................................... xx
CHAPTER ONE ........................................................................................................................................... 1
INTRODUCTION AND OVERVIEW ........................................................................................................ 1
1. INTRODUCTION ................................................................................................................................ 1
2. PROBLEM STATEMENT ................................................................................................................... 3
3. OBJECTIVES OF THE STUDY .......................................................................................................... 4
4. RESEARCH QUESTION..................................................................................................................... 5
5. SIGNIFICANCE OF THE STUDY ..................................................................................................... 6
6. DEMARCATION OF THE RESEARCH ............................................................................................ 7
7. RESEARCH DESIGN AND METHODOLOGY ................................................................................ 8
7.1. Location of the design ................................................................................................................... 9
7.2. Methodology ................................................................................................................................. 9
7.3. Sample and setting ........................................................................................................................ 9
7.4. Research instruments .................................................................................................................. 10
7.4.1. Questionnaire ...................................................................................................................... 11
7.4.2. Oral interview guide ........................................................................................................... 11
7.4.3. Mechanical device............................................................................................................... 11
7.4.4. Observation checklist .......................................................................................................... 11
7.4.5. Data collection and analysis ............................................................................................... 12
7.4.6. Validity and reliability ........................................................................................................ 12
8. OUTLINE OF THE STUDY .............................................................................................................. 12
CHAPTER TWO ........................................................................................................................................ 15
ENVIRONMENTAL EDUCATION AND THE MANAGEMENT OF FORESTS IN KENYA ............. 15
1. INTRODUCTION .............................................................................................................................. 15
2. FORMAL ENVIRONMENTAL EDUCATION ................................................................................ 16
3. INDIGENOUS KNOWLEDGE ......................................................................................................... 19
4. INSTITUTIONAL EDUCATIONAL ARRANGEMENTS IN FOREST MANAGEMENT ............ 27
xi
4.1. Management and planning institutions in forest management in Kenya .................................... 30
4.1.1. National Environment Management Authority ................................................................... 30
4.1.2. Regional development authorities ....................................................................................... 32
4.1.3. Memoranda of Understanding between government institutions ....................................... 34
4.1.4. Nyayo Tea Zones Development Corporation ...................................................................... 35
4.1.5. Permanent Presidential Commission on Soil Conversation ............................................... 36
4.1.6. District Focus for Rural Development ................................................................................ 37
4.1.7. Water Resource Management Authority ............................................................................. 37
4.1.8. Kenya Forest Research Institute ......................................................................................... 38
4.2. Substantive policies .................................................................................................................... 39
4.2.1. The Kenya Forest Act, 2005 ................................................................................................ 40
4.2.2. The Kenya Water Act, 2002 ................................................................................................ 41
4.2.3. The Environmental Management and Co-Ordination Act, 1999 ........................................ 42
4.2.4. The National Water Policy, 1999 ........................................................................................ 43
4.2.5. Kenya Forest Policy, 1994 .................................................................................................. 43
4.2.6. Chief’s Authority Act, Cap. 128 of 1970 (revised 1988) ..................................................... 44
5. CHAPTER SUMMARY..................................................................................................................... 45
CHAPTER THREE .................................................................................................................................... 46
STATUS OF FORESTS AS WATERSHEDS AND CONCEPTS IN FOREST MANAGEMENT ......... 46
1. INTRODUCTION .............................................................................................................................. 46
2. EXTENT AND STATUS OF FORESTS ........................................................................................... 46
2.1. Global forest outlook .................................................................................................................. 48
2.2. Africa forest outlook ................................................................................................................... 49
2.3. Forest status in Kenya ................................................................................................................. 49
3. EFFECTS OF DEFORESTATION ON WATERSHEDS ................................................................. 54
3.1. Cloud forests and precipitation phenomenon .............................................................................. 56
3.2. Catchment area dynamics ........................................................................................................... 57
4. COMMUNITY FOREST MANAGEMENT ...................................................................................... 60
4.1. Successful community forestry in Mexico .................................................................................. 66
4.2. Challenges to effective community ownership in Papua New Guinea ....................................... 68
5. SUSTAINABLE FOREST MANAGEMENT ................................................................................... 69
5.1. Thematic elements of sustainable forest management ................................................................ 72
6. CONCEPTUAL FRAMEWORK FOR SUSTAINABLE WATER CATCHMENT AREA
MANAGEMENT ............................................................................................................................... 76
6.1. Drivers of SWCAM .................................................................................................................... 78
xii
6.1.1. Sustainable forest management .......................................................................................... 78
6.1.2. Community environmental education ................................................................................. 79
6.1.3. GIS & Remote sensing ........................................................................................................ 79
6.1.4. Community forest management ........................................................................................... 79
6.2. Indicators of SFM ....................................................................................................................... 79
7. CHAPTER SUMMARY..................................................................................................................... 80
CHAPTER FOUR ....................................................................................................................................... 81
SPATIAL TEMPORAL VARIATIONS IN LAND USE AND ITS IMPLICATIONS ON FOREST
ECOSYSTEMS........................................................................................................................................... 81
1. INTRODUCTION .............................................................................................................................. 81
2. GIS, REMOTE SENSING AND SPATIAL TEMPORAL CHANGES ............................................ 81
3. LAND USE CHANGE ....................................................................................................................... 86
3.1. Forest resources .......................................................................................................................... 88
3.2. Land use and land cover.............................................................................................................. 89
3.3. Sources and effects of change ..................................................................................................... 90
3.4. Predicting change ........................................................................................................................ 91
3.5. Digital change detection.............................................................................................................. 93
3.6. Data acquisition and pre-processing ........................................................................................... 93
3.7. Image enhancement .................................................................................................................... 94
3.8. Principal components analysis .................................................................................................... 94
3.9. Spectral vegetation indices.......................................................................................................... 95
3.10. Image classification................................................................................................................. 95
3.11. Accuracy assessment ............................................................................................................... 97
4. CHANGE DETECTION METHODS ................................................................................................ 97
4.1. Image differencing ...................................................................................................................... 98
4.2. Vegetation index differencing ..................................................................................................... 98
4.3. Principal components analysis (PCA) ......................................................................................... 99
4.4. Post-classification comparison .................................................................................................... 99
5. GLOBAL TRENDS ............................................................................................................................ 99
6. CONDITIONS AND TRENDS IN KENYA .................................................................................... 101
6.1. Land use change and spatial temporal variations in Kenya ...................................................... 102
6.2. Land use change and forest resources ....................................................................................... 104
6.3. Land use and forest depletion in Kenya .................................................................................... 105
6.4. The case of Nandi County, Nandi Forests ................................................................................ 106
7. CHAPTER SUMMARY................................................................................................................... 107
xiii
CHAPTER FIVE ...................................................................................................................................... 108
AREA OF STUDY ................................................................................................................................... 108
1. INTRODUCTION ............................................................................................................................ 108
2. PHYSICAL ASPECTS ..................................................................................................................... 108
2.1. Location and extent ................................................................................................................... 108
2.1.1. Nandi North Forest ........................................................................................................... 108
2.1.2. Nandi South Forest ........................................................................................................... 109
2.1.3. Nandi Hills ........................................................................................................................ 109
2.2. Topography and drainage.......................................................................................................... 113
2.2.1. Nandi North Forest ........................................................................................................... 113
2.2.2. Nandi South Forest ........................................................................................................... 113
2.2.3. Nandi Hills ........................................................................................................................ 113
2.3. Geology and soils ...................................................................................................................... 113
2.3.1. Nandi North Forest ........................................................................................................... 113
2.3.2. Nandi South Forest ........................................................................................................... 114
2.3.3. Nandi Hills ........................................................................................................................ 114
2.4. Climate ...................................................................................................................................... 114
2.4.1. Nandi North Forest ........................................................................................................... 114
2.4.2. Nandi South Forest: .......................................................................................................... 115
2.4.3. Nandi Hills ........................................................................................................................ 115
3. ECOLOGICAL ASPECTS ............................................................................................................... 115
3.1. Vegetation ................................................................................................................................. 115
3.1.1. Nandi North Forest ........................................................................................................... 115
3.1.2. Nandi South Forest ........................................................................................................... 116
3.1.3. Nandi Hills ........................................................................................................................ 116
3.2. Wildlife ..................................................................................................................................... 116
3.2.1. Nandi North Forest ........................................................................................................... 116
3.2.2. Nandi South forest ............................................................................................................. 116
4. ECONOMIC SITUATION ............................................................................................................... 117
5. SOCIAL ASPECTS .......................................................................................................................... 118
5.1. Population density ..................................................................................................................... 118
5.2. Population composition............................................................................................................. 119
6. CHAPTER SUMMARY................................................................................................................... 119
CHAPTER SIX ......................................................................................................................................... 120
RESEARCH DESIGN AND METHODOLOGY .................................................................................... 120
xiv
1. INTRODUCTION ............................................................................................................................ 120
2. RESEARCH PARADIGMS ............................................................................................................. 121
2.1. Positivism .................................................................................................................................. 123
2.2. Post-positivism .......................................................................................................................... 124
2.3. Intepretivism/Constructivism .................................................................................................... 124
2.4. Advocacy/Participatory ............................................................................................................. 125
2.5. Pragmatism ............................................................................................................................... 126
3. RESEARCH DESIGN ...................................................................................................................... 126
3.1. Typologies of mixed methods research .................................................................................... 128
3.2. Design approaches in this study ................................................................................................ 130
4. SAMPLE AND SETTING ............................................................................................................... 131
4.1. Population, sample frame and sampling units........................................................................... 133
4.2. Sampling Techniques ................................................................................................................ 133
4.2.1. Stratified random sampling ............................................................................................... 134
4.2.2. Convenience sampling ...................................................................................................... 135
4.2.3. Quota sampling ................................................................................................................. 135
4.2.4. Judgemental sampling ....................................................................................................... 135
4.3. Sample size determination ........................................................................................................ 136
4.4. Nature and sources of data ........................................................................................................ 138
5. DATA COLLECTION AND DATA COLLECTION INSTRUMENTS ......................................... 139
5.1. Rapid rural appraisal ................................................................................................................. 139
5.2. Non-participant observation ...................................................................................................... 140
5.3. Oral interview schedule ............................................................................................................ 140
5.4. Questionnaires ........................................................................................................................... 141
5.5. Mechanical devices ................................................................................................................... 141
5.6. Remote sensing and GIS ........................................................................................................... 141
5.7. Review of documented information .......................................................................................... 143
6. DATA ANALYSIS .......................................................................................................................... 144
7. ETHICAL CONSIDERATIONS ...................................................................................................... 145
8. VALIDITY, RELIABILITY AND TRIANGULATION ................................................................. 145
9. METHODOLOGICAL CONSTRAINTS ........................................................................................ 147
10. CHAPTER SUMMARY................................................................................................................... 148
CHAPTER SEVEN .................................................................................................................................. 149
RESULTS ................................................................................................................................................. 149
1. INTRODUCTION ............................................................................................................................ 149
xv
2. INSTITUTIONS WHICH CONTRIBUTE TO THE MANAGEMENT OF THE NANDI HILLS
FORESTS ......................................................................................................................................... 149
2.1. International organizations ........................................................................................................ 152
2.2. Government of Kenya ............................................................................................................... 153
2.3. Non-governmental/community-based organisations (NGOs and CBOs) ................................. 155
3. LAND USE IN THE NANDI HILLS DISTRICT OF KENYA ....................................................... 156
3.1. Remote sensing and GIS ........................................................................................................... 156
3.2. Ground truthing and verification ............................................................................................... 167
3.2.1. Forests ............................................................................................................................... 167
3.2.2. Soil .................................................................................................................................... 169
3.2.3. Water ................................................................................................................................. 171
4. THE NANDI DISTRICT COMMUNITY .................................................................................... 172
4.1. Land Ownership ........................................................................................................................ 172
4.2. Land Use Practices .................................................................................................................... 173
4.3. Perceptions of forest use ........................................................................................................... 174
4.4. Perceptions of the current status of the Nandi Hills Forests and their potential ....................... 175
4.5. Sources of community knowledge ............................................................................................ 176
4.5.1. Informal sources of knowledge ......................................................................................... 177
4.5.2. Formal sources of knowledge ........................................................................................... 178
4.5.3. Integration of formal knowledge and informal knowledge sources .................................. 179
5. CHAPTER SUMMARY................................................................................................................... 181
CHAPTER EIGHT ................................................................................................................................... 182
DISCUSSION ........................................................................................................................................... 182
1. INTRODUCTION ............................................................................................................................ 182
2. ENVIRONMENTAL EDUCATION AND CONSERVATION IN AND AROUND THE NANDI
FORESTS ......................................................................................................................................... 182
2.1. Formal education and management practices ........................................................................... 183
2.1.1. International organisations ............................................................................................... 184
2.1.2. Government of Kenya ........................................................................................................ 184
2.1.3. NGOs and CBOs ............................................................................................................... 185
2.2. Informal environmental education ............................................................................................ 186
2.3. Integration of formal knowledge and indigenous knowledge systems ..................................... 189
3. EXTENT OF SPATIOTEMPORAL VARIATION IN LAND USE IN THE NANDI DISTRICT
AND THE IMPACT OF THE CHANGES ...................................................................................... 191
3.1. Spatiotemporal variation ........................................................................................................... 191
xvi
3.2. Impacts of land use change ....................................................................................................... 193
3.2.1. Land ownership ................................................................................................................. 194
3.2.2. Land use practices ............................................................................................................ 194
3.2.3. Biodiversity loss ................................................................................................................ 195
3.2.4. Forest cover ...................................................................................................................... 197
3.2.5. Soil resources .................................................................................................................... 198
3.2.6. Hydrology ......................................................................................................................... 199
4. COMMUNITY PERCEPTIONS ON UTILIZATION OF FOREST RESOURCES ....................... 200
4.1. Perceptions on forests‟ significance .......................................................................................... 200
4.2. Perception of the forest status ................................................................................................... 201
5. INTEGRATED COMMUNITY ENVIRONMENTAL EDUCATION HEURISTIC FOR
SUSTAINABLE FOREST MANAGEMENT ................................................................................. 203
6. CHAPTER SUMMARY................................................................................................................... 205
CHAPTER NINE ...................................................................................................................................... 206
CONCLUSION AND RECOMMENDATIONS ...................................................................................... 206
1. INTRODUCTION ............................................................................................................................ 206
2. MAIN FINDINGS ............................................................................................................................ 206
3. LIMITATIONS OF THE STUDY ................................................................................................... 209
4. SUGGESTIONS FOR FURTHER RESEARCH ............................................................................. 209
5. CONCLUSION ................................................................................................................................. 211
REFERENCES ......................................................................................................................................... 213
APPENDICES .......................................................................................................................................... 257
Appendix A: Promoter‟s letter .................................................................................................................. 257
Appendix B: Letter to the respondents ..................................................................................................... 258
Appendix C: Qualitative household questionnaire ................................................................................... 259
Appendix D: Quantitative household questionnaire ................................................................................. 263
Appendix E: Key informant interview schedule ....................................................................................... 268
Appendix F: Observation checklist on forest utilization........................................................................... 271
Appendix G: Focus group discussion guide ............................................................................................. 273
Appendix H: List of FGD participants in Chemomi Location, Nandi Hills Division .............................. 275
Appendix I: List of FGD participants in Chepkong‟ony Location, Kaptumo Division ............................ 276
Appendix J: Research authorisation letter ................................................................................................ 277
Appendix K: Research clearance permit ................................................................................................... 278
Appendix L: Classified image of Nandi Forests in 1990 .......................................................................... 279
Appendix M: Classified Image of Nandi Forests in 2000......................................................................... 280
Appendix N: Classified Image of Nandi Forests in 2010 ......................................................................... 281
xvii
LIST OF FIGURES
Figure 3.1
The distribution of forests in Kenya (Source Kenya Forest Service, 2010) 51
Figure 3.2
Nandi Forests in the Context of Mau Forest Complex (Source: Kenya Forest Service, 2010) 53
Figure 3.3
Conceptual Framework for SWCAM 77
Figure 5.1
The study area in Africa’s context 110
Figure 5.2
Nandi Hills and Nandi Forests in Kenya’s Context 111
Figure 5.3
Nandi Hills and Nandi Forests in the local context 112
Figure 6.1
Generalization of population characteristics from a sample
(Remler & Van Ryzin, 2011, p.145) 132
Figure 6.2
Household sample distribution for qualitative data in Nandi County 136
Figure 6.3
Household sample distribution for quantitative data in Nandi County 138
Figure 6.4
xviii
Change detection framework for mapping land use 143
Figure 7.1
Knowledge of existing institutions that contribute to the management of the Nandi Hills water
catchment area (n = 882) 150
Figure 7.2
Processed Landsat image of the study area (1994) 158
Figure 7.3
Processed Landsat image of the study area (1999) 159
Figure 7.4
Processed Landsat image of the study area (2003) 160
Figure 7.5
Processed Landsat image of the study area (2008) 161
Figure 7.6
The extent of spatiotemporal variation in the study area from 1994 to 2008 163
Figure 7.7
Forest cover class changes 164
Figure 7.8
Shrubs cover class changes 164
Figure 7.9
Tea cover class changes 165
Figure 7.10
Grassland cover class changes 166
Figure 7.11
xix
Forest change 1994 and 2008 166
Figure 7.12
Pictorial representation of drivers of land use change in Nandi Hills ecosystem 169
Figure 7.13
A highly turbid stream due to erosion in adjacent farmlands 172
Figure 7.14
Land use practices in Nandi County 173
Figure 7.15
Comparison of the participants’ beliefs of their source of information on the significance of
forests (n = 882) 177
Figure 8.1:
An integrated community environmental education heuristic for sustainable forest
management 204
xx
LIST OF TABLES
Table 6.1
Basic beliefs of alternative inquiry paradigms 123
Table 6.2
Mixed methods design typology (Creswell et al., 2003, p. 224) 129
Table 6.3
Sampling procedures 132
Table 7.1:
Institutions involved in the management and conservation of Nandi Forests 151
Table 7.2
Roles of international organizations in the management of Nandi Forests 152
Table 7.3
Government ministries involved in the management of the Nandi Forest catchment 154
Table 7.4
Roles of the NGO’s and CBO’s in the management of Nandi Forest catchment area 155
Table 7.5
Representation of the spatiotemporal variation in land use between 1994 and 2008 162
Table 7.6
Land ownership by size 173

xxi
Table 7.7
Scenarios of existing integration of formal and informal knowledge sources on forest
significance amongst a sample of key informants (n=18) 180
Chapter One: Introduction and Overview
1
CHAPTER ONE
INTRODUCTION AND OVERVIEW
1. INTRODUCTION
Forests serve diverse ecological functions and provide numerous environmental and
socio-economic benefits to society (Food and Agriculture Organization [FAO], 2009). Despite
the importance of trees and forest resources to human existence and economic development,
current trends show that forest fragmentation, degradation, inadequate regeneration, and
mismanagement are threatening the supply of vital ecosystem services and provisions (Temu &
Ogweno, 2007). Studies conducted by the Food and Agriculture Organization (FAO) show that,
in the year 2005, forests covered 3.9 billion hectares (about 30% of the world's total land area),
housed over 80% of the world‟s biodiversity and supported over 1.2 billion people (FAO, 2006).
Forest loss is caused by a complex set of social and economic pressures and it remains a
main feature and concern, contributing to losses of biological diversity and degradation of water
catchment and subsequent impairment of livelihoods (Alvarez, 2007). Among the major factors
contributing to forest degradation are conversion of forests to farmland and poor forest
management, including inappropriate logging, forest fires, and increased harvesting of wood
fuels and other forest products for household use (World Resources Institute, 2000; Glenday,
2006).
The impact of large forest destruction on water has been of great concern among
scientists, environmentalists, policy makers, and the general public. FAO (2009) asserts that
Chapter One: Introduction and Overview
2
history and modern studies have shown that misuse of forest resources has caused adverse
watershed condition and that activities, development, and utilization in forested areas inevitably
destroy forest canopies and disturb forest floors. Temu and Kiwia (2008), in their research
purport that these actions may affect water quantity through their impacts on transpiration and
canopy interception losses, infiltration rate, water holding capacity, and overland flow velocity,
the loss of soil-binding effects from the root systems, the increase in overland flow, and the
accelerated decomposition of organic matter. Kenya‟s closed canopy forests are estimated to
cover 1.24 million hectares, which is just about 2% of the country‟s land area. Recent estimates,
based on remote sensing, indicate that Kenya‟s forest cover stands at a critical 1.7 per cent
(United Nations Environment Programme [UNEP], 2001). This is against, the minimum
international recommended forest cover of 10 %. Despite the low closed canopy forest cover, the
Nation‟s forests are important natural assets for their economic, environmental, social and
cultural values.
The past several decades have seen increasing awareness of the explosive growth in
environmental problems throughout the world, and environmental education has emerged as a
vital tool in achieving environmental sustainability (Pandey, 2005). Furthermore, almost all of
the principal recent blueprints for coping with the World‟s pervasive environmental predicament
have stressed the value of environmental education (Tomar, 2007). Forest management has
become more complex as there are now multiple objectives to attain, multiple criteria and
constraints to address, and a number of modern technological advances such as Geographical
Information Systems (GIS) and Remote Sensing to consider (Warnecke et al., 2002).
Chapter One: Introduction and Overview
3
2. PROBLEM STATEMENT
The Lake Victoria catchment area has continued to degenerate over the years with its
resultant state not only being a national concern but a source of international disquiet due to the
alarming environmental degradation indicators from the wider Lake Victoria Basin. At the 6th
World General Assembly in 1994, the Water Sector Reforms in Kenya Paper underscored the
fact that the problem facing our water resources are climate variability and environmental
degradation. The paper indicated that both climate variability and environmental degradation
have resulted in catchment degradation, drying up of rivers, receding of lake levels, heavy
siltation in our dams and pans meant for both hydropower generation and water supplies,
degradation of water quality, increased water use conflicts due to competition of the little
available water resources, damaged roads, railway lines, bridges, buildings, farmlands, water
intakes and people displaced due to flash floods. Causes which have accelerated environmental
degradation in Africa lie in a chain of events and population pressures compel African societies
to deplete natural resources to meet their immediate needs for survival (Otiende et al., 1991).
In the Kenyan context, the rising human population in the Nandi Hills forests (a major
water catchment area for Lake Victoria) has incrementally changed the structure and
characteristics of the downstream hydrological balance (Mwiturubani, 2010). Such changes
jeopardize the ability of the Lake Victoria watershed to meet growing societal needs, as well as
the capacity to support the large variety of terrestrial and aquatic life forms (Mwakubo & Obare,
2009). The Nandi Hills fall within the upper Lake Victoria North Catchment Area (Government
of Kenya, 2002) and is one of the sources of rivers and streams for the Lake Victoria Basin.
However, continual encroachment of humans into the Nandi North and South Forests,
unsustainable timber exploitation, shifting cultivation, urban expansion, and other human
Chapter One: Introduction and Overview
4
activities, are posing increasing threats to this ecosystem. As in many developing countries in the
tropical and subtropical regions, Nandi County has lost substantial portions of its forest cover
due to conversion of forested land into agricultural land in order to feed local populations (Singh
(1991). These findings suggest that one of the main challenge for the Nandi Hills forests may be
the human population residing within it and its environs. The population of Nandi Hills has been
increasing rapidly and by the year 2009 the population had increased to 752,965 people (Kenya
National Bureau of Statistics [KNBS], 2010) in comparison to what it was forty years earlier in
1969, namely about 209,068 people.
Sound forest management practices, backed by updated forest legislation and policy, and
strong institutional arrangements are necessary in order to ameliorate and turn around the
degradation of the Nandi forests (Governments of Kenya, 2003). Recognition of this issue and
the fact that environmental education has been recognised as a vital tool in achieving
environmental sustainability, have motivated this study. The study focuses on the development
of a synergistic heuristic approach to the management of available resources, which could lead
towards environmental education for sustainable management of the Lake Victoria water
catchment areas.
3. OBJECTIVES OF THE STUDY
The purpose of this study is to provide an insight into the current institutional
environmental and educational arrangements and practices which are pertinent to the sustainable
management of the Nandi Hills Forests, the perceptions and understandings of the local
population in terms of forest resources and land use, and the information that can be provided by
Chapter One: Introduction and Overview
5
GIS and Remote Sensing data, in order to produce a heuristic for planning community
environmental education in the region. More specifically, the study sought to:
Find out which formal and informal environmental education practices are in place that
may influence the management and conservation of the Nandi Hills Forests;
Map the spatial temporal variations in land use in the forest and the forest catchment area
by using current GIS, Remote Sensing data, and observations in order to provide an
overall understanding of the physical situation in the Nandi Hills;
Profile the local community members‟ perceptions and understandings of land use
utilization practices in the forests and surrounding areas in the Nandi County; and
Integrate the findings into a potentially viable Community Environmental Education
heuristic (experience-based technique for problem solving and speeding up the process of
finding a satisfactory solution) for the sustainable management of Lake Victoria‟s water
catchment areas.
4. RESEARCH QUESTION
It is against the introductory background and problem statement that this research is
framed. It seeks to explore a heuristic which will assist planners design and implement
community environmental education that takes into account existing possibilities for
environmental education as well as the understandings and perceptions of local populations. In
doing so, the principal research question is presented as:
Chapter One: Introduction and Overview
6
Can the current institutional educational arrangements, available GIS and remote
sensing data, and the knowledge and perceptions of the local community in terms of
forest resources be combined to provide a heuristic which could contribute to the
planning of interventions aimed at community environmental education to support
the sustainable management of the Nandi Hills forests?
The sub-questions that need to be answered in order to answer the principle question are:
What are the formal and informal environmental education and management
practices that exist which could be meaningfully integrated into the heuristic?
What is the extent of spatiotemporal variability in land use in the forests and their
catchment areas?
What knowledge and perceptions do the local community members have in terms of
the current utilization practices in the forest resources of Nandi Hills and Nandi
Forests?
5. SIGNIFICANCE OF THE STUDY
Irregular rainfall patterns in the catchment area, and frequent flooding of the lower river
valleys, reflect the challenges facing the remains of the tropical rainforest which once extended
all the way from the Congo Basin (Enger et al., 1992). The vital role Nandi Forests plays in this
system cannot be overemphasized and prevention of their further destruction is crucial for the
sustainability of the ecosystem and livelihoods in the surrounding areas (Birdlife International,
2011). These observations, and more specifically rock falls, receding forest cover and drying up
Chapter One: Introduction and Overview
7
of previously permanent streams, among other environmental degradation in the Nandi Hills
Forest, have motivated this study.
As it is widely agreed that environmental education is the most effective means that
society possesses for confronting the challenges of environmental degradation (Palmer, 1998),
this study is an attempt to provide the necessary impetus both for the local community, the
government and non-governmental institutions to understand and become involved in an
integrated manner in the conservation of what remains on this ecosystem. It is an attempt to
synergize the data on the reality of spatiotemporal variation with perceptions of the local
community and those of formal environmental education and current role players, to produce a
heuristic for the conservation and management of the Nandi Hills catchment area that is likely to
be effective.
6. DEMARCATION OF THE RESEARCH
Demarcating a study enables the research to be focused and manageable. This study
focuses on exploring the opportunities that exist and which can be developed in the area of
community environmental education towards sustainable management of the Nandi Hills. As
such, the focus is on the Nandi Hills and Nandi Forest, the governmental and non-governmental
organizations that operate may have an influence on the ecosystem, spatiotemporal mapping of
the characteristics of the area, and the perceptions and understandings of the local population
living in the area. The study examines existing practices in community forest management and
existing formal and traditional approaches to land use in order to develop an integrated
community driven heuristic for the sustainable management and conservation of the resources of
the Nandi Hills Forests.
Chapter One: Introduction and Overview
8
7. RESEARCH DESIGN AND METHODOLOGY
A research design is the advance planning of the means and methods to be adopted for
collecting the relevant data and their analysis in line with the objective of the research and the
availability of staff, time and money (Kothari, 2009). It is also the arrangement of conditions for
collecting and analyzing data in a manner that aims to combine relevance to research purpose
with the economy of procedure (Claire et al., 1962).
Research is located within philosophical ideas which are often concealed and need to be
identified as they influence the mode of inquiry (Creswell, 2009). The underpinning
philosophical ideas which determine the type of problems that should be investigated and the
way in which they should be investigated are termed paradigms (Babbie & Mouton, 2008). The
term paradigm means a theoretical model that is universally accepted at a particular moment and
which provides the framework in which one situates one‟s research (Mouton, 2001).
This study embraced a mixed methodological design which incorporated both qualitative
and quantitative approaches. The mixed methodological approaches used in this study were the
concurrent triangulation and nested/embedded designs. The methods were used concurrently and
the mixing of qualitative and quantitative occurred during the analysis and interpretation of the
data. The approach was to observe, describe and record dimensions of land use and land cover
changes among households, community group and forest management institutions in the study
area. The embedded design was applicable in the acquisition and interpretation of satellite data
for spatiotemporal variability and change detection procedure. This allowed for correlation of
quantitative data with qualitative data to explain land use and land cover changes over a time
scale of 20 years. Co-relational and triangulation designs were also used to help gauge
community perception about land use, forests and water resources. A four-tier analysis covering
Chapter One: Introduction and Overview
9
the four categories of the population in the study area; namely the households, institutions,
community groups, and analysis of Landsat images for change detection was carried out once all
the data had been coded and grouped. Descriptive statistics related to the identified variables
were calculated using Microsoft Excel and SPSS Computer Packages.
7.1. Location of the design
The design of this study is located in the „describe‟ quadrant of Cronje‟s (2011)
elaboration of Burrel and Morgan‟s (1979) model of research paradigms (see chapter six). This
location implies that the researcher asks the question „What are the elements of …. ?‟, in order to
answer „How should they be combined or related?‟ (Cronje, 2011).
7.2. Methodology
A mixed method approach using both qualitative and quantitative methodologies was
used in order to add value and diverse perspectives to the study. The data were generated
concurrently and both the qualitative and quantitative methods were used for the analysis and
interpretation of the data.
7.3. Sample and setting
The study was conducted in the Nandi County (formerly, greater Nandi District in the
Rift Valley Province) of Kenya. The specific study sites were the locations of forest resources
and water catchment areas with rivers that drain into the Lake Victoria. The area was selected
because of its strategic location as a catchment area for a trans-boundary natural resource, Lake
Victoria, the main source of water for the Nile communities in Sub-Saharan Africa. Households
in the area, the District Forest Officer for South Nandi and Nandi North Districts, the Kenya
Wildlife Service (KWS) Officers for this region, members of the provincial administration and
Chapter One: Introduction and Overview
10
other line ministries like Ministry of Environment and Mineral Resources (MEMR) officers and
other stakeholders were targeted for sampling. Time series satellite imagery, recent LANDSAT
and RASTER imagery, existing maps, reports, etc. were sampled based on availability.
The local community population sampled was the true households according to the 2009
population census (KNBS, 2010). The sample unit for data generation was the household, which
was chosen for this study as the lowest identifiable social institution within which production and
consumption activities take place. The choice of this sampling unit was predicated on the
premise that forest management and utilization is directly related to the household size and need
for forest resources. Convenience sampling (American Statistical Association [ASA], 2003) was
employed as data were collected from people who were easy to access, those who volunteered to
be questioned and those who attended the Participatory Rural Appraisal (PRA) sessions.
Judgmental sampling was used in the selection of respondents for the PRA sessions and
interviews based on their proximity to the forest areas within Nandi Hills (within a radius of 50
kilometres). Community members were invited to PRA sessions through the provincial
administration offices and self-selection took place as not everyone who received the information
chose to come to the meetings. A form of quota sampling also took place as only community
members who were 18 years of age or older were selected. The rationale for the choice of this
approach was premised on the need to engage those who could meaningfully contribute to the
study and the need to economize on time and cost of collecting information.
7.4. Research instruments
In order to answer the research questions, data were collected by use of a questionnaire, an
oral interview schedule guide, mechanical devices and an observation checklist.
Chapter One: Introduction and Overview
11
7.4.1. Questionnaire
With the help of the Provincial Administration and opinion leaders within the
community, the principal access roads in the villages were identified and used as transects.
Research assistants used the established transects to navigate as they administered the
questionnaires to the heads of the families, as the major decision makers within the households.
7.4.2. Oral interview guide
Open-ended and semi-structured interview schedule guides were used to obtain
information from the line ministries‟ officers and the civil society personnel with interests in
forest management in Nandi Hills‟ area. Interviews were held as face to face interpersonal
interaction allowed for richer data to be generated and enabled the researcher to focus on aspects
that are identified during the process as being important to the study (Kerlinger, 1973).
7.4.3. Mechanical device
A digital camera was used to capture real-time data on land use, the extent of visible
degradation and the other relevant data related to this study. A hand held GPS was used during
ground truthing for the collection of ground control points for map analysis. This was done
through the collection of waypoints and routes/tracking.
7.4.4. Observation checklist
An observation checklist was used to document the extent of land degradation in the study
site. Aspects of degradation informed the objective that looked at land use change and its impacts
on sustainable environmental management.
Chapter One: Introduction and Overview
12
7.4.5. Data collection and analysis
The data collection approaches used included Rapid Rural Appraisal, direct observation,
questionnaire administration, oral interviews, examination of Forest inventory maps, satellite
data and the review of already documented information. Satellite images were classified based
on general natural spectral pixilation (unsupervised classification) and different classes generated
to show spatial temporal variation over time. This provided the basis for documenting land use
changes in the study site.
7.4.6. Validity and reliability
In an attempt to ensure valid and reliable data, the questionnaires were pretested by a
small number of community members drawn from five divisions (Kabiyet, Tinderet, Kaptumo,
Aldai and Kapsabet Divisions) in the study area such that two respondents were interviewed per
division. This was done to ensure that tools tested what they are intended to (validity) and that
they consistently measured the variables in the study (reliability). Pre-testing was done to test for
difficulty in understanding the questions and the respondents were encouraged to ask any
questions about items they are not clear about. Unclear items were reviewed, reconstructed and
adjustments made to the final questionnaire. Any important corrections, clarifications,
suggestions and omissions highlighted during the pre-testing exercises were used to improve the
final instrument.
8. OUTLINE OF THE STUDY
The study has been divided into nine chapters such that chapter one is basically an
introduction encompassing the statement of the problem, objectives and significance of the
study, summary outline of the methodology, and definition of terms. Chapter two elucidates
Chapter One: Introduction and Overview
13
literature and works previously done on institutional options for environmental education in
forest management and in particular reviews literature on formal environmental education,
indigenous knowledge, institutions and policy implications in forest management.
Chapter three explicates on status of forests as watersheds and concepts in forest
management in Kenya and beyond. This is undertaken with some key aspects reviewed chapter
two on awareness and education being interwoven with dimensions of forest management. In
particular, it brings out works done on the extent and status of forests, effects of deforestation on
watersheds, community and sustainable forest management. It concludes by highlighting a
conceptual framework for sustainable water catchment area management.
The fourth chapter reviews literature on spatial temporal variations in land use and its
implications on forest ecosystems and in particular; land use change, change detection methods,
application of GIS and remote sensing in environmental management, condition and trends in
land use in Kenya. It concludes by bringing to light the land use changes and spatial temporal
variations in Kenya.
Chapter five brings to the fore the setting of the study area. It casts the study area in light
of the African, Kenyan and local context and further elaborates on the key characteristics of the
site. These include the physical, ecological and socioeconomic setups of the study area.
The sixth chapter is dedicated to underscoring the research design and methodology
employed in the study. In particular, it focuses on relevant research paradigms the research
design embraces in the study, the sample and setting of the study, the data collection instruments
and the data analysis criteria. The chapter goes further to elucidate the ethical considerations in
the research, points out the dynamics of validity, reliability and triangulation pertinent in the
Chapter One: Introduction and Overview
14
study and concludes by acknowledging the methodological constraints that characterized the
study.
Chapter seven presents the results of the study, encompassing: the institutions which
contribute to the management of the Nandi Hills forests, and the land use in the Nandi Hills
district as revealed by GIS, remote sensing and ground truthing. It goes further to present
interview data, which provided information on issues of land ownership, land size occupied by
households, as well as householders‟ perceptions of forest use, their current status and their
potential, and the sources of their knowledge.
Chapter eight discusses the findings of the study by drawing attention to the research
questions by attempting to answer them. It begins by discussing on environmental education and
conservation in and around the Nandi Forests, then expounds on the findings on the extent of
spatiotemporal variation in land use in the Nandi County and the impact of the changes.
Perceptions of the community on forests and forest resources are also discussed in this chapter
and the chapter ends by drawing up an integrated community environmental education heuristic
for sustainable forest management. The ninth chapter wraps up by drawing attention to the main
findings of the study, the fundamental conclusion to the study, outlining the limitations of the
study and making recommendations for further study.
Chapter Two: Environmental Education
15
CHAPTER TWO
ENVIRONMENTAL EDUCATION AND THE MANAGEMENT OF
FORESTS IN KENYA
1. INTRODUCTION
This chapter emphasizes the contribution environmental education has made in terms of
the sustainable management of forests in Kenya and highlights the pivotal role of various
institutions in the propagation of environmental education and forest management. While some
note that environmental education is as old as the existence of humankind (Waswa, Otor &
Mugendi, 2006), the notion of environmental education has rapidly evolved since Carson (1962),
through her well-known title „Silent Spring‟, which drew the attention of the world towards the
chemical poisoning of the environment. In 1969 the Journal of Environmental Education was
first published, and in 1972 the first United Nations Conference on the Environment (UNCED)
was held in Stockholm, which led to the establishment of UNEP in Nairobi, and the UNESCO-
UNEP International Environment Education Programme (IEEP) was put into action at the United
Nations Educational, Scientific and Cultural Organization (UNESCO) Secretariat in Paris,
France in 1975 (Waswa et al., 2006). The IEEP became relevant both in school and out of
school, encompassing all levels of education and directed towards the general public, in
particular the ordinary citizen, with a view to educating the populace as to the simple steps that
might be taken within individual means to manage and control the environment (Tomar, 2007).
Chapter Two: Environmental Education
16
2. FORMAL ENVIRONMENTAL EDUCATION
Pandey (2005) suggests that the past several decades have seen increasing awareness of
the explosive growth in environmental problems throughout the world. One indicator of this
awareness has been the proliferation of new journals devoted to environment and conservation.
For example, at least six journals aimed specifically at teachers of environmental studies now
exist, viz. the Journal of Environmental Education which was first published in 1969 in
Washington DC; the Environmental Education Report & Newsletter, first published in 1973 in
Hanover, New Hampshire; Connect (first edition 1976) in Guilford, England; and Environmental
Education Information (first print in 1981) in Manchester, England.
Environmental offerings at undergraduate schools and at some professional schools have
expanded enormously in the USA and the National Environment Education Act (USA) provides
for substation support for Environmental Education in local primary and secondary school
systems and at the tertiary level (Disinger & Roth, 1992). However, graduate environmental
programs are said to be faltering for lack of sufficient federation funding (National
Environmental Advisory Council, 2005). Outside of developed countries the status of
Environmental Education is far from desirable (Knamiller, 1983). Relatively little formal
Environmental Education has permeated developing countries despite considerable efforts in
recent decades by UNESCO, UNEP and the World Conservation Union (IUCN) (Tomar, 2007).
This is not surprising, considering that economic conditions in many developing countries are
often not only dismal but also worsening year by year; for example, gross national product per
capital has been declining continually for many years in 90 or more developing countries (World
Bank, 2004). With the overall educational infrastructure grossly inadequate in much of the Third
Chapter Two: Environmental Education
17
World, resources to institute appropriate environmental education are, for the most part, simply
not available, even when this education is recognized as a desirable innovation.
All of the principal recent blueprints for coping with the World‟s pervasive
environmental predicament have stressed the value of environmental education. Palmer (1998, p.
78) has urged that “environmental education should be included in and should run throughout the
other disciplines of the formal education curriculum at all levels – to foster a sense of
responsibility for the state of that environment and to teach students how to monitor, protect, and
improve it.”
The IUCN, in partnership with UNEP and the World Wide Fund for Nature, has also
stressed that “governments, through central and local education authorities, should review the
present state of Environmental Education (including social education) and should make part of
all courses at primary and secondary, and many at tertiary level” (Pandey, 2005, p. 23). He
reflects the views of the World Resource Institute the IUCN and UNEP when he states that “at
the national level, ecological literacy belongs alongside other basic skills. National curricula on
biodiversity should emphasize biodiversity‟s contributions to community health and welfare, as
well as to ecosystems, and should tie ecological, economic, and social themes together” (Pandey,
2005, p. 23).
The United Nations Conference on Environment and Development [UNCED] (1992,
section 36.1), agrees, writing that “education is critical for achieving environmental and ethnical
awareness, values and attitudes, skills, and behaviour consistent with sustainable development
and for effective public participation in decision making” and a distinguished group of 22
Chapter Two: Environmental Education
18
university presidents from 13 developing countries pledged to have their institutions play
educational leadership roles in the necessary quest for a sustained future (Pandey, 2005).
According to Matiru (1999), there is need for forums where government officials and
community representatives can discuss their expectations of increased community participation.
She further points out that presently, a number of NGOs, CBOs and voluntary organizations are
making good strides in enlightening the common citizen on laws and their rights in Kenya and
this upsurge of environmental lobby groups has resulted in more awareness of the local citizens
on environmental issues that affect them and the community at large
The latest front in the area of environmental education and education in general is the
growth of Information and Communication Technologies (ICTs). This has had significant direct
and indirect impacts on forestry and has been central in accelerating the pace of globalization
(Edoho, 1997). The Internet and mobile communications have created unprecedented
opportunities for those who were traditionally outside the global information loop, including
small and medium-sized enterprises. ICTs have increased labour productivity, reduced costs and
increased returns. Online stores provide marketing opportunities for wood product and service
suppliers. ICTs have also fostered institutional change in forestry (Hetemaki & Nilsson, 2005).
The increased ease of information sharing and global networking diminishes the power of
vertically structured organizations and fosters the development of small organizations. ICTs have
helped to promote transparency and accountability on an unprecedented scale, as very little
information can be kept away from public access and scrutiny. ICTs have also facilitated
awareness-raising about forest-related issues such as deforestation, biodiversity loss, forest fires
and the marginalization of indigenous communities (Hetemaki & Nilsson, 2005; Nyrud &
Devine, 2005).
Chapter Two: Environmental Education
19
3. INDIGENOUS KNOWLEDGE
Traditional knowledge is defined as “a cumulative body of knowledge, practice and
belief, handed down through generations by cultural transmission and evolving by adaptive
processes, about the relationships of living beings (including humans) with one another and with
their forest environment” (Berkes, 1999, p. 9). Such knowledge, which developed long before
the advent of formal forest science, is the mainstay of many forestry practices (Bicker et al.,
2004). The UN Conference on Environment and Development in 1992 catalysed interest in the
contribution of indigenous knowledge to a better understanding of sustainable development and
the UNCED highlighted the urgent need for developing mechanisms to protect the earth's
biological diversity through local knowledge (UNCED, 1992). Many of the documents signed at
UNCED reflected the need to conserve the knowledge of the environment that is being lost in
communities. Similarly, the World Conference on Science (Budapest, 1999) recommended that
scientific and traditional knowledge be integrated in interdisciplinary projects dealing with links
between culture, environment and development in areas such as the conservation of biological
diversity, management of natural resources, understanding of natural hazards and mitigation of
their impact.
People with a long history of intimate contact with natural ecosystems, such as tropical
forests, are typically very knowledgeable about the uses of native species. This knowledge, and
the species themselves, may be used in new ways to support the improvement of farming systems
in and around a conservation area, for the benefit of local communities. All too frequently,
western science and indigenous knowledge are represented as two different, competing knowledge
systems, characterized by a binary divide, a divide arguably evolving out of the epistemological
foundations of the two knowledge systems. Hence, they may be treated as discrete entities,
Chapter Two: Environmental Education
20
separable from each other in space, which of course, if the case, preclude dialogue and learning
between them (Mohan & Stokke, 2000). Although a number of observers have suggested that this
divide may indeed be false or, at least, not as marked as might be supposed (Bell, 1979; Chambers,
1979; Bebbington, 1993; Briggs et al., 1999; Leach & Fairhead, 2000), the binary notion still
persists. Western science is seen to be open, systematic and objective, dependent very much on
being a detached centre of rationality and intelligence, whereas indigenous knowledge is seen to be
closed, parochial, irrational, primitive and emotional (Howes, 1979; Howes & Chambers, 1979;
Warren, 1991; Agrawal, 1995; Mitchell, 1995; Ellen & Harris, 2000; Herbert, 2000).
Consequently, whereas western knowledge systems are part of the whole notion of
modernity, indigenous knowledge is part of a residual, traditional and backward way of life, a view
that may be reinforced by the concentration of work on indigenous knowledge on people in low-
and middle-income countries. For Indigenous peoples and local communities, concern over the
preservation and maintenance of traditional knowledge is not only motivated by the desire to
conserve 'biodiversity' as an end in itself, but also by the desire to live on their ancestral lands, to
preserve their traditional livelihoods, to safeguard local food security and, to the extent possible,
exercise local economic, cultural and political autonomy (Langton, 2003).
Traditional ways of gleaning forest products for human use need not conflict with
conservation aims if they are sustainable. To achieve this, the impact must be considered of each
form of exploitation on the potential yields of other forms, and on biodiversity and ecosystem
structure in general (World Conservation Union [IUCN], 1993, 1994). Project designs should
provide for research and management planning to balance the demands of each kind of
production, while also putting in place measures needed for monitoring and enforcement. These
Chapter Two: Environmental Education
21
reasons provide a basis for including indigenous knowledge and informal environmental
education in this study and, as such, issues of gains and drawbacks of indigenous knowledge are
discussed below.
Development professionals consider indigenous knowledge as an invaluable and under-
utilized knowledge reservoir, which presents developing countries with a powerful asset
(Richards, 1995). In the past few decades, traditional environmental management knowledge
practices have been the focus of attention. A post-modernist paradigm supports this paradigm
since it calls for the decentralisation of views on social reality in order to create a more inclusive
science (Blaikie, 1995; Richards, 1995). The significance of indigenous knowledge and
practices has been witnessed as:
• A pool for advocacy: Indigenous peoples‟ groups have risen from local levels to become
effective actors and advocates at the global level through coalitions presenting a unified
front and delivering consistent messages in international meetings and processes. Their
organized efforts have led to progress in recognizing and restoring the rights of
indigenous peoples to forest land. The adoption in 2007 of the United Nations
Declaration on the Rights of Indigenous Peoples, although non-binding, was a milestone
(FAO, 2009.).
• Natural Resource Management Systems: The development of traditional knowledge
systems, covering all aspects of life, including management of the natural environment,
has been a matter of survival to the local communities who generated these systems
(United Nations Forum on Forests [UNFF], 2004).
Chapter Two: Environmental Education
22
• Sources of Innovation: Africa is endowed with rich and highly diverse biological
resources. These resources provide a wide range of natural products such as those derived
from bio-prospecting, intermediate products (e.g. natural dyes, colourants, oils,
biochemical compounds, medicinal and food extracts, etc.) and final products (e.g.
timber, handicrafts, nuts, fruits, perfumes, medicines, etc.). Many of these products are
collected for subsistence use. Some of them have served as an important source of
innovation for the pharmaceutical, biotechnology, cosmetic and agrochemical industries.
Over the years, the World Health Assembly has adopted a number of resolutions drawing
attention to the fact that most of the populations in various developing countries around
the world depend on traditional medicine for primary health care, that the work force
represented by practitioners of traditional medicine is a potentially important resource for
the delivery of health care and that medicinal and food plants are of great importance to
the health of individuals and communities (Ngassa, 2003).
• Survival Mechanisms: „Traditional medicine‟ refers to ways of protecting and restoring
health that existed before the arrival of modern medicine. As the term implies, these
approaches to health belong to the traditions of each country, and have been handed
down from generation to generation. Traditional systems in general have had to meet the
needs of the local communities for many centuries, e.g. in relation to health needs.
Humans throughout the ages have relied on plants as the source of food, clothing
construction materials, cosmetics and medicines (Cichoke, 2001).
African traditional knowledge may be unique to a given African community, culture or
society, and may possibly be seen to contrast with the knowledge generated within the modern
learning system (Langton, 2003). Langton‟s assertion continues to point out that there are
Chapter Two: Environmental Education
23
instances where traditional knowledge is used at the local level by communities in Africa as the
basis for decision-making pertaining to food security, human and animal health, education,
natural resource management, and other vital activities. Traditional knowledge provides
alternatives to modern science, especially in health care. For example, South Asian Ayurveda
and Chinese indigenous medicine are increasingly practiced throughout the world, and the use of
plant-based pharmaceuticals is growing rapidly. There is growing acceptance that in order to
improve the livelihoods of poor marginalized indigenous communities, it is essential to
understand their traditional knowledge – their values, perceptions and knowledge of their local
ecological conditions (Asia Forest Network, 2008).
Similarly, while advances in modern science and technology have had significant impacts
on the forest sector these technologies remain inaccessible to many in Africa and there is a
continued dependence on indigenous or traditional knowledge in managing forests and other
natural resources (Parrotta & Agnoletti, 2007). Langton and Ma Rhea (2003), assert that,
traditional methods of irrigation and crop production, and maintenance of seed stock and
cultivars, have maintained food and grazing resources, and traditional water management
systems have been critical to societies across all ecosystems.
Indigenous knowledge is of growing interest to forest science as it is increasingly
recognized that indigenous resource-management systems can help to improve the framework
for sustainable forest management (Borrini & Buchan, 1997). Low-input traditional land-use
practices are particularly attractive in the context of declining energy supplies and increasing
impacts of climate change (UNEP, 2007).
Chapter Two: Environmental Education
24
The oral and rural nature of traditional knowledge has made it largely invisible to the
development community and to modern science and, where recognized, indigenous knowledge
has often been dismissed as unsystematic (Hubbard, 2001). As a consequence, it has not been
captured and stored in a systematic way, with the implicit danger it may become extinct. This
brings in a crucial aspect of documentation of indigenous knowledge. The documentation of
traditional and Indigenous knowledge is fundamental to the capacity of traditional knowledge
holders to promote, protect and facilitate the proper use of their knowledge. Accurate
documentation also enables nations and other interested parties to enter into agreements and
contracts with traditional knowledge holders that will strengthen the capacity of these
communities to develop economically sustainable livelihoods (World Bank, 1998).
However, to assume that „development‟ in some way perished in the late 1980s/early
1990s, as suggested by some on the neoliberal right and the cultural left, may be premature, with
writers such as Hart (2001) suggesting that, by the end of the 1990s, „development‟ had returned,
if indeed it ever went away. This not only involved redefining development in the context of
social capital and social development, for example, but also the deployment of indigenous
knowledge as part of the armoury of some mainstream development agencies (Eyzaguirre, 2001;
World Bank, 1998). Central to this process has been the increasing institutionalization of
indigenous knowledge through conferences, development plans and a broad, sometimes
grudging, acceptance by the development community of its assumed inherent value as part of a
shift in addressing the direct concerns of the poor (Hubbard, 2001; Shepherd, 2001; Warren,
1991, 1992; World Bank, 2000). It may even have reached the status of „a new populist rhetoric‟
(Agrawal, 1995, p. 415). Without doubt, there is a conviction in many quarters of the need to tap
into the stock of indigenous knowledge if appropriate planning and land management strategies
Chapter Two: Environmental Education
25
are to be developed in a sustainable way (Chokor & Odemerho, 1994; De Boef et al., 1993;
Okali et al., 1994). Such conviction has contributed to this institutionalization, despite the
apparent difficulty that, whilst indigenous knowledge seems to reject western science‟s claims to
universality and spatial transferability, at the same time its institutionalization casts it as an
object that can be made essential, archived and, indeed, itself transferred.
The importance of the literature in these fields cannot be underestimated; the issue of
sound documentation lies at the heart of the problem. That problem can be described as the
urgent need to recognise, protect and maintain the knowledge, innovations and practices of
Indigenous peoples and local communities relevant to the capacity of a community to undertake
conservation and sustainable use of biodiversity (Langton & Ma Rhea, 2003). The threats to
traditional knowledge and practices include not only those that threaten subsistence and
traditional lifestyles, such as large-scale economic and commercial developments (e.g.
militarisation, agro-industrial cropping and forestry, etc.) and associated population removals,
land dispossession and urbanisation of subject populations, but also bio piracy, misappropriation
and unauthorised commercialisation of traditional knowledge, practices and resources. A
community cannot build its capacity to mobilise its knowledge if there is no recognition that it is
owned by them. African studies concerning indigenous environmental management practices
stress the role of different techniques in risk avoidance and effective resource use. It is, however,
recognised that this system of knowledge and practices is threatened by socioeconomic and
historical pressures (Richards, 1995).
With the social, economic, political and institutional change, indigenous knowledge
provides opportunities but also faces challenges according to FAO (2009). These challenges
include:
Chapter Two: Environmental Education
26
• Domination, marginalization and assimilation: Despite increasing recognition of their
rights, indigenous people are systematically marginalized in many countries, including by
narrowly focused development programmes. As vast tracts of forests that sustained
indigenous communities are converted to other uses, forest-based livelihoods and the
associated knowledge are soon lost;
• Selective appropriation: Realization of the economic potential of traditional knowledge
(particularly in the rapidly expanding pharmaceuticals and health and beauty care
markets) has led to systematic efforts to identify and commercialize it – taking the
knowledge out of its social and cultural context and raising issues of intellectual property
rights and fair compensation for knowledge holders; and
• Rediscovery: Increasing emphasis on protecting the rights, cultures and technologies of
indigenous communities can create a favourable environment for the natural evolution of
traditional knowledge. Developments in the international policy arena, such as the
passage of the UN Declaration on the Rights of Indigenous Peoples, specifically
recognize the need to respect traditional knowledge and practices.
Indigenous knowledge and community-based innovation are dynamic. Options for action
include creating incentives to improve the capacity of formal research organizations to work with
local and indigenous people and encouraging collaboration in conservation (International
Assessment of Agricultural Knowledge, Science and Technology for Development [IAASTD],
2008).
Chapter Two: Environmental Education
27
4. INSTITUTIONAL EDUCATIONAL ARRANGEMENTS IN FOREST
MANAGEMENT
According to FAO (2009), institutions are key factors in sustainable resource
management and societal adaptation to social, economic and environmental changes. As in other
sectors, the overall trend in forestry is towards a pluralistic institutional environment, attributable
to two divergent trends: globalization and localization. Increased cross-border movement of
capital, labour, technology and goods resulting from globalization has necessitated adaptation by
existing institutions and the establishment of new ones. At the same time, local communities
have become more involved in resource management through decentralization and devolution of
responsibilities. Matiru (1999) believes that substantial efforts are required to revamp the
institutional framework to strengthen the science and technology base of forestry in Africa;
otherwise, major breakthroughs are likely to bypass the African forest sector or at best will
benefit only a small segment of the population.
Government forestry agencies remain the dominant force in the sector and more than
80% of global forests are under public jurisdiction (FAO, 2006). Government forestry
departments are often among the oldest of the civil services and many originally focused on
enforcing regulations, with the main objective of protecting and managing the forests to supply
forest products and generate revenue for government (Hamilton & King, 1983). They
traditionally integrated multiple functions from wood production to processing and trade as well
as forestry research, education, training and extension. Challenges of reduced public expenditure,
mounting expectations of different stakeholders and increasing conflicts over the use of forest
resources are stirring public agencies to rethink their management objectives, functions and
structures (FAO, 2008). The evolution in focus can be loosely described as moving from policing
Chapter Two: Environmental Education
28
the forests to managing them to facilitating management by others (Nair, 2004). In some cases,
reform has been superficial; for example, limited to changes in ministerial responsibility (in
particular shifting between agriculture and environment ministries) or to structural but not
functional change (World Bank, 2001). Many public agencies are unable to develop the human
resources needed in order to manage forest resources in an increasingly complex environment
(Nair, 2004; Temu, 2004), and many lack sufficient capacity for long-term strategic planning or
open sharing of information, with a tendency to be reactive to short-term pressures and concerns
(often mirroring the larger public administration).
On the other hand, increasing awareness and concern about social and environmental
issues imply an increasing role for civil society organizations in forestry. Campbell (personal
communication, 2008) believes that a shift towards institutional and economic complexity should
mirror more effectively the ecological and cultural diversity of forests and peoples. Such
complexity is needed in order to help forests fulfil their integrating role in a dispersed,
diversified and distributive forest economy and civil-society actors inject much-needed disorder
into intentionally neat power equations.
Civil society‟s demand for transparency and good governance is bringing about
fundamental changes in Africa as postulated by the FAO (2008). Although decentralization of
authority and participatory approaches to resource management are finding wider acceptance,
conflicts undermine social and economic development in a number of countries (Nair & Dykstra,
1998). Nevertheless, community involvement in natural resource management has a long history
in Africa, and policy and legal changes in recent years have helped to accelerate devolution
(White & Martin, 2002).
Chapter Two: Environmental Education
29
In Kenya initial concern on environmental policy formulation was voiced in the 1965
Sessional Paper No. 10 on African Nationalism and its Application to Planning in Kenya, which
recognised that it order to effectively conserve the environment, education and legislation was
important (Government of Kenya, 1965). Otiende et al. (1991) concur that the Sessional Paper
No. 10 of 1965, having pointed out the need to conserve the environment, was a step in the right
direction. He however continues to assert that the well-being of future generations would depend
on the adoption and implementation of policies which were expected to ensure the conservation
of natural resources and create enjoyable physical environment. This formed the foundation for
latter legislative and educational initiatives by the government and non-state actors to enhance
forest management.
According to the Kenya Forestry Master Plan (1994), some of the services provided by
forests include: - fuel wood, charcoal, construction materials, timber, curving wood, hives,
weapons, tools and domestic implements, grazing and fodder, medicine, honey, foods, animal
products, ropes, mats, bags, baskets and pots, minerals, water, habitation, cultivation, ritual and
ceremony, leisure and holiday, and research. The findings of an empirical study in Kenyan,
Ugandan, and Tanzanian Lake Victoria watershed by Obare, Mwakubo and Birungi (2006),
provide evidence of important linkages between incidences of households‟ vulnerabilities,
livelihoods, and institutions in the use and management of wetlands in the Lake Victoria
watershed, and that the dynamism associated with these facets can be characterized as general
and location specific in effects and outputs. It would be necessary hence to highlight on the
relevant institutions and substantive policies that have impacted on forest management in Kenya.
Chapter Two: Environmental Education
30
4.1. Management and planning institutions in forest management in Kenya
Kenyan forests have suffered immense impacts not because of lack of institutions but
more because of implementation gaps and institutional weaknesses. Because governments own
or control three-quarters of all global forest resources, some 3 billion hectares, and regulate
private and community-owned forest management, their responsibility in addressing illegal
operations in the forest sector is crucial (White & Martin, 2002). This sub-section highlights on
the institutions involved in the management and conservation of forests in Kenya.
4.1.1. National Environment Management Authority
The authority was created by the Environment Management and Co-ordination Act of
1999, as the oversight body for environmental management and co-ordination matters
(Government of Kenya, 2000), and its mandate including:
i) Co-ordinate the various environmental management activities being undertaken by the
lead agencies and promote the integration of environmental considerations into
development policies, plans, programmes and projects with a view to ensuring the
proper management and rational utilization of environmental resources on a sustainable
yield basis for the improvement of the quality of human life in Kenya;
ii) Take stock of the natural resources in Kenya and their utilization and conservation;
iii) Establish and review in consultation with the relevant lead agencies, land use
guidelines;
iv) Examine land use patterns to determine their impact on the quality and quantity of
natural resources;
Chapter Two: Environmental Education
31
v) Carry out surveys which will assist in the proper management and conservation of the
environment;
vi) Advise the government on legislative and other measures for the management of the
environment or the implementation of relevant international conventions, treaties and
agreements in the field of environment, as the case may be;
vii) Advise the government on regional and international environmental conventions,
treaties and agreements to which Kenya should be a party and follow up the
implementation of such of such agreements where Kenya is party;
viii) Undertake and co-ordinate research, investigation and surveys in the field of
environment and collect, collate and disseminate information about the findings of such
research, investigation or survey;
ix) Mobilize and monitor the use of financial and human resources for environmental
management;
x) Identify projects and programs or types of projects and programs, plans and policies for
which environmental audit or environmental monitoring must be conducted under this
Act;
xi) Initiate and evolve procedures and safeguards for the prevention of accidents which
may cause environmental degradation and evolve remedial measures where accidents
occur;
xii) Monitor and assess activities, including activities being carried out by relevant lead
agencies, in order to ensure that the environment is not degraded by such activities,
environmental management objectives are adhered to and adequate early warning on
impending environmental emergency is given;
Chapter Two: Environmental Education
32
xiii) Undertake, in co-operation with relevant lead agencies, programmes intended to
enhance environmental education and public awareness about the need for sound
environmental management as well as for enlisting public support and encouraging the
effort made by other entities in that regard;
xiv) Publish and disseminate manuals, codes or guidelines relating to environmental
management and prevention and abatement of environmental degradation;
xv) Render advice and technical support, where possible, to entities engaged in natural
resource management and environmental protection so as to enable them to carry out
their responsibilities satisfactorily;
xvi) Prepare and issue an annual report on the state of the environment in Kenya and in this
regard may direct any lead agency to prepare and submit to it a report on the state of the
sector of the environment under the administration of that lead agency;
xvii) Perform such other functions as the Government may assign to the Authority or as are
incidental or conducive to the excise by the Authority of any or all of the functions
provided under this Act.
Although having been institutionalized, the National Environment Management
Authority (NEMA) still has to grapple with issues of self-interests, political interference and
inadequate legitimate authority to undertake environmental management.
4.1.2. Regional development authorities
The management planning for the country‟s river basins is vested in Regional
Development Authorities (Matiru, 1999). To date there are six Regional Development
Authorities constituted by Acts of Parliament i.e. Tana and Athi Rivers Development Authority
(Cap. 443); Lake Basin Development Authority (Cap. 442); Kerio Valley Development
Chapter Two: Environmental Education
33
Authority (Cap. 441); Ewaso Ng‟iro South River Basin Development Authority (Cap. 447);
Ewaso Ng‟iro North River Basin Development Authority (Cap. 448); and the Coast
Development Authority (Cap. 449).
According to the statutes, the functions of the regional development authorities include
rendering assistance to operational agencies in their application for funds and causing the
construction of any works necessary for protection and utilization of the water and soils of the
area. The activities of River Basin Development Authorities, especially those concerning the
construction of hydro-electric dams and irrigation projects along the rivers have implication
especially for riverine forests. Coupled with land use changes upstream and the degradation of
catchment areas, these projects result in altered volume and regularity of water flow and siltation
levels which affect both riverine forests and the ecology at the river mouth which in turn affects
the flora and fauna, for example, Mangrove forests and marine life.
Riverine forests, supported by underground water seepage, are found in localized areas
such as Dodori and Boni forests, with some patches along Turkwell River, Athi/Galana and the
Tana rivers covering less than 1% of Kenya‟s total forest estate. Riverine forests owe their
dynamism, structure and composition to river processes and the water regime (Nkako, 1999).
The Turkwell Gorge Hydro-electric dam, managed by the Kerio-valley Development Authority
along the Turkwell River in Turkana has also had an impact on the riverine forests due to
changes in the water flow and flooding levels.
Chapter Two: Environmental Education
34
4.1.3. Memoranda of Understanding between government institutions
In Kenya various government institutions and departments have signed Memoranda of
Understanding (MoU) in an effort to reduce conflicts arising from overlapping mandates for the
management of natural resources (Matiru, 1999). Government institutions that have entered into
MoUs include the Forest Department (FD), the Kenya Wildlife Service (KWS), National
Museums of Kenya (NMK), the Fisheries Department (FD), the Nyayo Tea Zone Authority
(NTZA) and specific local Authorities.
The objectives of the Memorandum of Understanding between the Kenya Wildlife
Service and the Forestry Department, for example, signed on 5th December, 1991 are to:
i) Conserve forest biodiversity by preserving select examples of different forest types, areas
of endemic or threatened species of flora and fauna, and areas important for the
maintenance of genetic diversity;
ii) Maintain the functioning of ecological processes: regulation of water flow, soil
conservation and the nutrient cycle;
iii) Exploit economically and sustainably the potential of forest products, tourism and
recreation;
iv) Provide a basis for conservation education, extension and research;
v) Protect and preserve selected sites and areas of special interest;
vi) Minimize threat to human life and damage to tree plantations, agricultural crops and
livestock by wildlife; and
vii) Generate revenue to be re-invested in forest conservation and management.
Chapter Two: Environmental Education
35
4.1.4. Nyayo Tea Zones Development Corporation
The Nyayo Tea Zones Development Corporation (NTZDC) was established through a
Legal Notice, No. 285 of 1986 under the State Corporations Act (Government of Kenya, 1986).
Its main objectives are to:
i) Protect indigenous forests currently threatened by human encroachment and over
exploitation thereby contributing towards global environmental and biodiversity
conservation;
ii) Provide alternative source of earnings through employment in intensively managed
Nyayo Tea and fuel wood plantations; and
iii) Develop rural infrastructure through the construction and maintenance of roads, bridges,
leaf buying centres, tea factories (where currently none exist), staff houses, telephone
communication, electricity and water supplies.
The Nyayo Tea Zones are established in gazetted Forest Reserves. Mapping of the zones
is currently in process. Out of approximately 6,154 ha of forested areas which were cleared for
the tea zones, an estimated 4,000 ha are currently under tea. Areas that were cleared in Nyayo
Tea Zones but found to be unsuitable for tea cultivation are currently being put under fuel wood
plantations (Nandi, Kakamega Forest, Kaptagat/Kiptaberr) especially planting of the two species
of eucalyptus, Eucalyptus saligna and Eucalyptus grandis. These plantations are being
maintained with local communities through a non-resident shamba system whereby young trees
are intercropped with vegetables and other food crops.
Chapter Two: Environmental Education
36
4.1.5. Permanent Presidential Commission on Soil Conversation
The Permanent Presidential Commission on Soil Conservation (PPCSC) was established
in 1981 as a Department in the Cabinet Office of the Office of the President. The PPCSC has the
task of co-ordinating all agencies involved in soil conservation activities (Government of Kenya,
1981). Its terms of reference include to:
i) Review the present legislation on soil conservation, afforestation and flood control and to
advise on their adequacy and effectiveness;
ii) Advise in consultation with other relevant agencies on areas that should be declared
„Protection Catchment Areas‟ and to recommend on the measures to be taken to
regulate the management of such protected areas;
iii) Advise on the measures to be taken to protect water courses with a view to preventing
river siltation;
iv) Submit specific recommendations at every stage after deliberating on specific items; and
v) Continually evaluate the performance of government agencies charged with the
responsibility of implementing soil conservation, afforestation and flood control
programmes and advise on the adequacy or otherwise of government machinery for
planning and implementation of programmes in this area.
PPCSA published a survey report in October 1999 entitled „Reconnaissance Survey of
Forest Blocks in the West and East of the Rift Valley‟. The report outlines the status of forests in
the selected areas with emphasis on indigenous forests and associated threats. The report also
gives recommendations for enhanced management of the forests, including income generating
activities towards self-sustenance (Government of Kenya, 1999).
Chapter Two: Environmental Education
37
4.1.6. District Focus for Rural Development
The District Focus for Rural Development (DFRD) came into effect in 1983 and the main
objective of this strategy was the adoption of a bottom-up approach to planning, whereby
districts are given autonomy in setting their priorities (Government of Kenya, 1983). This
strategy is unlike the previous top-down approach where ministry headquarters set district
development agenda. At the district level, co-ordination is carried out through various
Development Committees, from District Development Committees (DDC) to Sub-Location
Development Committees. Members of the DDCs include District Commissioners (as
Chairpersons), District Development Officers (as Secretaries), Department Heads of all
Ministries, Members of Parliament, ruling party‟s District Chairpersons, Chairpersons of Local
Authorities, Clerks to Local Authorities, Chairpersons of Divisional Development Committees
and representatives of development-related parastatals, NGOs and self-help groups.
Environmental management under this structure has been facilitated by the establishment of the
District Environment Officers (DEO) in 1989 and District Environment Protection Officers in
1993 (United Nations Development Programme, 1999).
One of the implications of the DFRD structure to forest management is that the DDC, as
the main development planning body at the district level, reviews and approves development
plans and can make requests to the relevant ministry for the excision of forest land in response to
pressure from the residents. For example, the Kilifi DDC had requested for the excision of
Arabuko Sokoke Forest for settlement of squatters in the district.
4.1.7. Water Resource Management Authority
The Water Resource Management Authority (WRMA) is a state corporation under the
Ministry of Water and Irrigation established under the Water Act 2002 and charged with being
Chapter Two: Environmental Education
38
the lead agency in water resources management (Government of Kenya, 2002). The Water Act
2002 stipulates the duties of WRMA to include;
i) Water apportionment and allocation,
ii) Catchment protection and conservation,
iii) Water resource assessments and conservation,
iv) Delineation of catchment areas,
v) Gazetting water protected areas,
vi) Protection of wetlands,
vii) Gazetting water schemes to be state and community owned,
viii) Establishing Catchment Management Strategies (CMS)
ix) Collecting water use and effluent discharges.
In order for WRMA to undertake its stipulated responsibilities, the Act provides for
decentralized and stakeholder involvement. This will be implemented through regional offices of
the Authority based on drainage basins (catchment areas) assisted by Catchment Area Advisory
Committees (CAACs). At the grassroots level, stakeholder engagement will be through Water
Resource User Associations (WRUAs).
4.1.8. Kenya Forest Research Institute
The Kenya Forestry Research Institute was established in 1986 under the Science and
Technology Act (Chapter 250) to carry out research in forestry and allied natural resources. The
institute has a role to play in influencing polices on forest resource management. Since 1998, the
Institute has continued to restructure its research programme by:
Chapter Two: Environmental Education
39
Consolidating 17 discipline-oriented divisions into six programmes as contained in
Kenya Forests Master Plan;
Adopting multidisciplinary research approach;
Focusing on problem oriented research;
Decentralizing research activities to facilitate improved interaction and linkages with
the local users;
Improving facilities in six centres in representative ecological zones of the country;
Adopting focused capacity building;
Developing beneficial partnerships;
Decentralising dissemination of research findings and seed distribution;
Reducing staff from 1600 in 1998 to 990 in 2008 without compromising the
performance of the Institute. This has resulted in increase of funds for research and
maintenance of facilities.
4.2. Substantive policies
Although there have been strides since 1965 to formulate and legislate policies and laws
to sustainably manage Kenya‟s forests, just as other developing countries it tends to have an
overabundance of regulation (World Bank, 2004). Regulatory proliferation is usually an
indicator of weak policy framework which does not adequately address the long-term vision for
the forestry sector (Eboe, 2002). This multiplies the risk of legal inconsistencies, contradictions
and overlapping jurisdictions and complicates the understanding of the regulatory regime
affecting the sector. All this in turn allows for more discretionary decisions and, therefore,
increased opportunities for corruption (FAO, 2005).
Chapter Two: Environmental Education
40
Certain policies, legislations and bylaws are seen to be directly impacting on forests and
generally water catchment areas in Kenya. However, it is worth noting that it is only the Forest
Act has direct bearing on the issue of additions and excision of gazette forests. The other policies
and legislations described in this sub-section may affect forests or partially forested land in
general. Some of them having been revised and amended over time to address the ever-changing
environmental, social and economic needs of the society. Enumerated as follows, these policies
and legislations address from specific to a wide range of forest-related spheres.
4.2.1. The Kenya Forest Act, 2005
The Kenya Forest Act (Government of Kenya, 2005) which was accented to by the
President of the Republic of Kenya in November 2005 provides for the establishment,
development and sustainable management, including conservation and rational utilization of
forest resources for the socio-economic development of the country. This Act and its provisions
thereof are geared towards the sustainable management and conservation of the country‟s forest
resources through the Kenya Forest Service (KFS). The Act has been revised in several
occasions for purposes of making it more relevant in the management and conservation of forests
in Kenya. A highly conspicuous dimension in the 2005 Act is the greater recognition of
stakeholder participation in decision-making on issues affecting forests. Section 45 of The Act
provides for the registration of Community Forests Associations (CFAs) for purposes of
participating in the conservation and management of a state forest or local authority forest
(Government of Kenya, 2005, p.38)
Chapter Two: Environmental Education
41
4.2.2. The Kenya Water Act, 2002
The Kenya Water Act was passed as An Act of Parliament to provide for the
management, conservation, use and control of water resources and for the acquisition and
regulation of rights to use water; to provide for the regulation and management of water supply
and sewerage services …and for related purposes (Government of Kenya, 2002). After being
passed by parliament and consequently enacted in 2003, this act provides for the decentralization
of powers from the national to the regional and local level; the separation of water resources
management from water service provision as well as the institutional separation of policy,
regulatory, asset holding and operational functions. The Act divests the Minister in charge water
affairs of regulatory functions over the management of water resources. This becomes the
mandate of a new institution, the Water Resources Management Authority (the Authority),
established in section 7 of the Act. The Authority is responsible, among other things, for the
allocation of water resources through a permit system. The framework for the exercise of the
water resources allocation function comprises the development of national and regional water
resource management strategies which are intended to outline the principles, objectives and
procedures for the management of water resources. The Water Act 2002 has introduced
comprehensive and, in many instances, radical, changes to the legal framework for the
management of the water sector in Kenya. These reforms revolve around the following four
themes: the separation of the management of water resources from the provision of water
services; the separation of policy making from day to day administration and regulation;
decentralization of functions to lower level state organs; and the involvement of non-government
entities in the management of water resources and in the provision of water services (Mumma,
2005). This was a move in the right direction and geared towards a more professional and an
Chapter Two: Environmental Education
42
institution-specific approach which would enhance appropriate and a more localized and
customized procedures in water catchment management and conservation.
4.2.3. The Environmental Management and Co-Ordination Act, 1999
This Act received presidential assent on 6th
January, 2000 and commenced on 14th
January, 2000, which was a great milestone achievement in promoting sustainable forest
management in the country. The act provides legal, institutional frameworks and procedures for
management of the environment as well as modalities for conflict resolution (Government of
Kenya, 2000). The act provided an avenue for the harmonization of about 77 existing sectoral
statutes, which address the various aspects of the environment. This has presented improved
legal and administrative coordination of the diverse sectoral initiatives in order to improve the
national capacity for the management of the environment. This is in view of the fact that the
environment constitutes the foundation of national economic, social, cultural and spiritual
advancement.
The general principles of the act include:
The entitlement of every person in Kenya to a clean and healthy environment;
Everyone in Kenya having the duty to ensure a safe, clean and healthy environment;
The entitlement to a clean and healthy environment includes the access by any person in
Kenya to the various public elements or segments of the environment for recreational,
educational, health, spiritual and cultural purposes; and
If a person alleges that the entitlement to clean and healthy environment has been, is
being or is likely to be contravened in relation to him, then without prejudice to any other
Chapter Two: Environmental Education
43
action with respect to the same matter which is lawfully available, that person may apply
to the high court for redress.
4.2.4. The National Water Policy, 1999
Kenya‟s first National Water Policy was passed by Parliament in April 1999. The main
objective of this water policy is the supply and distribution of water resources throughout the
country in a sustainable, rational and economical way. This policy has implications for the
forestry sector in its objective with regard to environmental protection. It recognizes the fact that
increased human activities, especially in water catchment areas has resulted in the reduction and
deterioration of forest cover area and constitutes a threat to the country‟s water resources. The
policy proposes to address these issues through the protection of water catchments, river basin
management and practices that take into account the role forests and soil conservation measures
play in conservation of water resources. Furthermore, it states that water catchments need to be
identified and delineated, and water catchment preservation and protection programmes
instituted in collaboration with the relevant Ministry in charge of forests (Government of Kenya,
1999).
4.2.5. Kenya Forest Policy, 1994
The Policy received Cabinet approval in 1994 and replaced the one effected by Sessional
Paper No. 1 of 1968. The policy aims to provide continuous guidelines to Kenyans on
sustainable management of forests and potential forest land. It takes into cognizance existing
policies relating to land-use, wildlife, environment, agriculture, energy, industry, regional
development, among others. The need to conserve soil, water, biodiversity, and other forest
Chapter Two: Environmental Education
44
resources on gazetted forests, other protected forest lands, on farms and in arid and semi-arid
lands, are also discussed in the policy.
The policy seeks to separate the management of forest plantations from that of indigenous
forests. It advocates for commercialized forest management to monitor and guide the forestry
activities of the public, private and farm-forestry sub-sector. The Forest Policy addresses
research, as it is an essential component of forestry development. The Kenya Forestry Research
Institute (KEFRI) is listed as the principal institution mandated to conduct forestry research.
Ecotourism is also addressed as one of the factors that could have negative effects on the
ecosystem if not well planned. The policy calls for the harmonization of traditional forms of
forestry management and ecotourism.
4.2.6. Chief’s Authority Act, Cap. 128 of 1970 (revised 1988)
This Act empowers Chiefs to enforce various environmental conservation provisions
within the limits of their jurisdiction, including control of the use of tree resources on private
land. Their powers relevant to forest management include (Government of Kenya, 1988):
prohibiting the destruction of vegetation
regulating the cutting of timber and prohibiting the wasteful destruction of trees
control of grass fires
ordering the execution of work or services for the conservation of natural resources
Empowering the Minister to remove member(s) of a tribal community who have land
reserved for them, if they unlawfully occupy or cultivate any land other than the
reserved land.
Chapter Two: Environmental Education
45
The Chief‟s Authority Act is one of the principal statutes through which the Provincial
Administration implements government policies and development priorities. This Act has been
criticized because of the broad powers it confers which can be abused.
Pandey (2005) asserts that one of the most formidable and ever more interactive
challenges facing human today is coexisting with the other living creatures on earth. Meeting this
challenge will require appropriate education, both formal and informal. Everyone who is
responsible for education policy or entrusted to carry it out should be made aware of the legally
binding agreement entered into by their government regarding environmental education, the
current status of environment in both developed and developing countries, the authoritative
encouragement and guidance offered by major environmental organizations and others and the
conceptual basis upon which all Environmental Education must rest if it is to achieve its
purposes.
5. CHAPTER SUMMARY
This chapter focused on formal and informal environmental education and indigenous
knowledge and practices in Kenya. It also highlighted the institutional educational arrangements
in forest management with an emphasis on substantive policies and planning institutions in forest
management in Kenya. These issues are presented in order to provide a framework for reviewing
the current situation in the Nandi Hills region of western Kenya and to contribute to the
development of a heuristic which considers all stakeholders to guide future attempts to introduce
environmental education in the region.
Chapter Three: Concepts and Status of Forests
46
CHAPTER THREE
STATUS OF FORESTS AS WATERSHEDS AND CONCEPTS IN FOREST
MANAGEMENT
1. INTRODUCTION
This chapter focuses on appreciating the status and importance of forests both globally
and in Kenya. It appraises existing concepts and theories on forest management and the
emerging trends in conservation, including climate change which poses a major challenge to
forests. There is now clear evidence that climate change is occurring in regions where forest-
based communities and forest ecosystems are vulnerable (Intergovernmental Panel on Climate
Change [IPCC], 2007; Juday et al., 2004) and that its impact on the supportive and regulative
processes of forests and on how people use forest resources are difficult to predict. The best
response to the uncertainty climate change presents is to maintain or increase the functioning and
resilience of all forests as a matter of urgency; a challenge which provides opportunities for
increased cooperation with forest stakeholders at national and international levels (FAO, 2009).
2. EXTENT AND STATUS OF FORESTS
The Global Forest Resources Assessment 2005 (FAO, 2006) emphasized that forest area
provides the first indication of the relative importance of forests in a country or region. Forest
area is relatively easy to measure, and this variable has therefore been selected as one of the 48
indicators for monitoring progress towards the Millennium Development Goals agreed by the
United Nations (particularly Goal 7 – Ensuring environmental sustainability). The structure and
Chapter Three: Concepts and Status of Forests
47
composition of forests are increasingly influenced by global phenomena such as the presence of
introduced species, climate change, and anthropogenic alterations of biogeochemical cycles
(Dale et al., 2001; Honnay et al., 2002; Newman, 1995; Simberloff, 2000; Vitousek et al., 1997).
Major transformations of forest ecosystems have occurred or are underway, in many cases
resulting in substantial losses of timber values or commercial extinction of valuable tree species,
along with a reduction in native biodiversity (Hoekstra et al., 2005; Laurance, 1999; Liebhold et
al., 1995; Simberloff, 2000). In addition to global influences, forests are also being shaped by
regional and local forces.
Forests provide an array of economic resources, and different harvesting techniques are
prone to achieve manifold yields from the same environment. The incredibly robust management
techniques are those which shun open-access utilization of resources, through tenure and
usufruct mechanisms allowing for long-term and exclusive access by individuals or communities
(Caldecott et al., 1994). They continue to elaborate that where such techniques have been
embraced, the necessity for exterior intervention may be reduced to technical counsel and
monitoring, to guarantee sustainable harvests. Barring such harvesting may lead to economic loss
to the local people and trigger their antagonism. Alternatives in such a case may comprise
traditional utilization of segments inside conservation areas, buffer zones bordering them, or
community lands in a different place, which may all be accessible for particular types of
persistent exploitation by locals. Moreover, forests often experience the cumulative and often
fragmentary impacts of development stresses such as road-building, oil and gas development,
urban and suburban encroachment, and agriculture (Forman, 2000; Schneider et al. 2003;
Trombulak & Frissell 2000; World Resources Institute, 2000). This combination of disturbance
and developmental pressures can reduce biodiversity and diminish the capacity of forests to
Chapter Three: Concepts and Status of Forests
48
continue providing ecological goods and services of the same quantity and quality in perpetuity
(Costanza et al., 2000; Toman & Ashton 1996). In response to these concerns, many ecologists
have argued that resource managers should focus on maintaining ecological resilience, defined
here as the capacity of natural systems to absorb disturbances without undergoing change to a
fundamentally different state (e.g., Holling, 1973; Holling, 1986; Peterson et al., 1998).
Whenever a resource is exploited, several different interests are put into conflict. Two
major ones are economic interests and environmental interests. Economic factors are easy to
measure. The cost of exploitation and financial return for this expenditure are the primary issues.
The environmental viewpoint is often difficult to put into monetary terms and must often rely on
ethical and biological arguments to temper the economic arguments. Modern forest management
practices in many parts of the world involve a compromise between these two points of view
(Enger et al., 1992).
2.1. Global forest outlook
Data on the status of and trends in area of forest are crucial to decisions related to forest
and land-use policies and resource allocations, but they need to be combined with information on
the health and vitality of forests and their socio-economic and environmental functions and
values. The GFRA 2005 (FAO, 2006), further points out that forests cover 30% of the total land
area with the total forest area in 2005 being just under 4 billion hectares (ha), corresponding to
an average of 0.62 ha per capita. However, the area of forest is unevenly distributed. For
example, 64 countries with a combined population of 2 billion have less than 0.1 ha of forest per
capita. The ten most forest-rich countries account for two-thirds of total forest area. Seven
countries or areas have no forest at all, and an additional 57 have forest on less than 10% of their
total land area.
Chapter Three: Concepts and Status of Forests
49
2.2. Africa forest outlook
Africa accounts for just about 16.1% of the global forest cover which is around 0.64
million ha. Although the tropics boast of the largest area under forest, they are faced with the
largest rate of deforestation (FAO, 2009). Forest loss caused by a complex set of social and
economic pressures is a concern, contributing to losses of biological diversity, degradation of
forests, and have contributed significantly to global warming (Glenday, 2006; Haili, 2007).
Among the major factors contributing to forest degradation are conversion of forests to farmland
and poor forest management, including inappropriate logging, forest fires, and increased
harvesting of wood fuels and other forest products for household use (Glenday, 2006; World
Rainforest Movement [WRM], 2006).
Progress towards sustainable forest management in Africa appears to have been limited
during the last 15 years despite some indications that the net loss of forest area has decreased and
that the area of forest designated for conservation of biological diversity has increased minimally
and the continued, rapid loss of forest area (the largest of any region during this 15-year period)
is particularly disconcerting (FAO, 2006).
2.3. Forest status in Kenya
In Kenya, gazetted forests represent less than 2.5% of the total land area. The country has
about 37.6 million ha of natural woody vegetation outside forests, consisting of 24.8 million ha
of bush land, 10.8 million ha of wooded grassland and 2.1 million ha of woodland. A further
9.54 million ha of woody vegetation is found on farmland and in settlements (Kenya Forestry
Department, 2001). Kenya‟s closed canopy forests are estimated to cover 1.24 million hectares.
This is just about two per cent of the country‟s land area and these are largely confined to the
wetter, cooler parts of the country. According to Ogweno and Oduori (2001), these forests can be
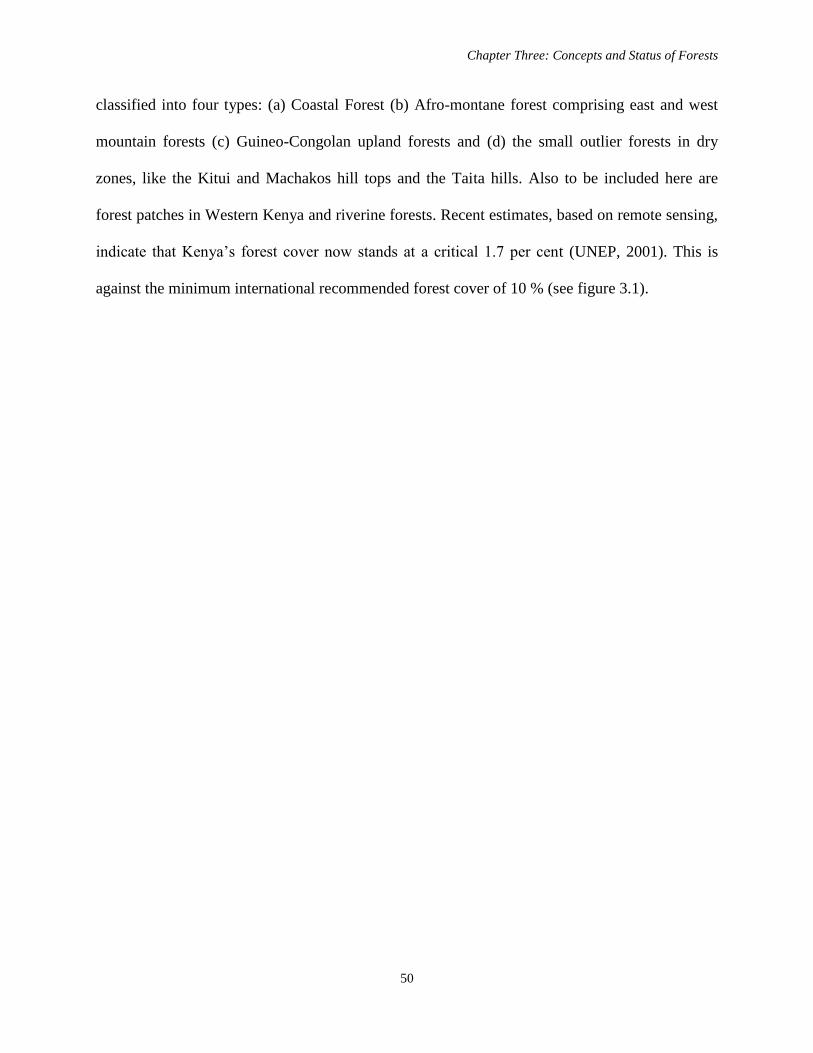
Chapter Three: Concepts and Status of Forests
50
classified into four types: (a) Coastal Forest (b) Afro-montane forest comprising east and west
mountain forests (c) Guineo-Congolan upland forests and (d) the small outlier forests in dry
zones, like the Kitui and Machakos hill tops and the Taita hills. Also to be included here are
forest patches in Western Kenya and riverine forests. Recent estimates, based on remote sensing,
indicate that Kenya‟s forest cover now stands at a critical 1.7 per cent (UNEP, 2001). This is
against the minimum international recommended forest cover of 10 % (see figure 3.1).
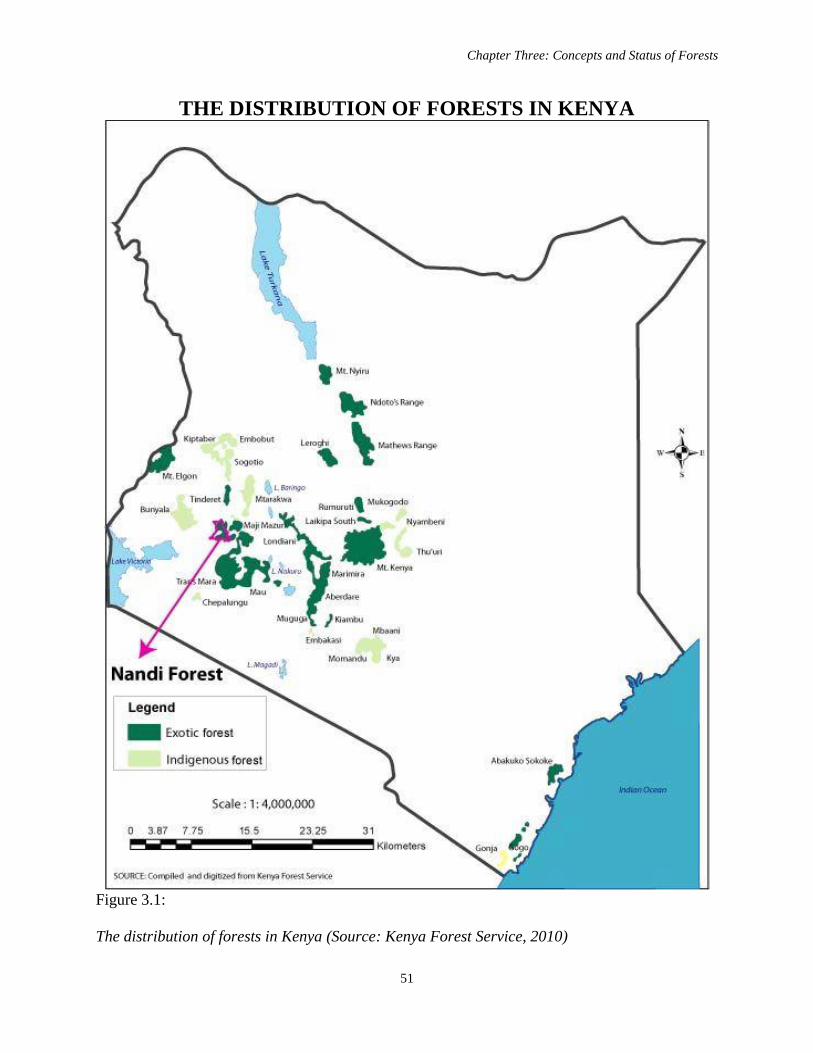
Chapter Three: Concepts and Status of Forests
51
THE DISTRIBUTION OF FORESTS IN KENYA
Figure 3.1:
The distribution of forests in Kenya (Source: Kenya Forest Service, 2010)
Chapter Three: Concepts and Status of Forests
52
Despite the fact that the amount of closed canopy forest cover in Kenya is low, the
nation‟s forests are important natural assets for their economic, environmental, social and
cultural values. Forestry and wood processing industries are estimated to provide direct
employment to 35,000 people (Gathaara, 1999). Forests are therefore an integral part of national
development. Although forest products and services in Kenya are estimated to contribute about
€90 million to the economy, and although the forest sector employs 50,000 people directly and
another 30,000 indirectly, the forests nevertheless tend to be undervalued (Emerton & Karanja,
2001) and accordingly they are often poorly managed.
The Mau forest provides sustenance to more than 150,000 families that live in and within
2 kilometres of its boundary. Each year, these families utilize forest resources such as fuel wood,
building materials, food, vegetables, honey, fodder, and other non-timber forests products. The
Mau Water Tower represents the upper catchment of all but one of the main rivers west of the
Rift Valley, which are the source of over 60% of the water flowing into Lake Victoria (see figure
3.2 below).
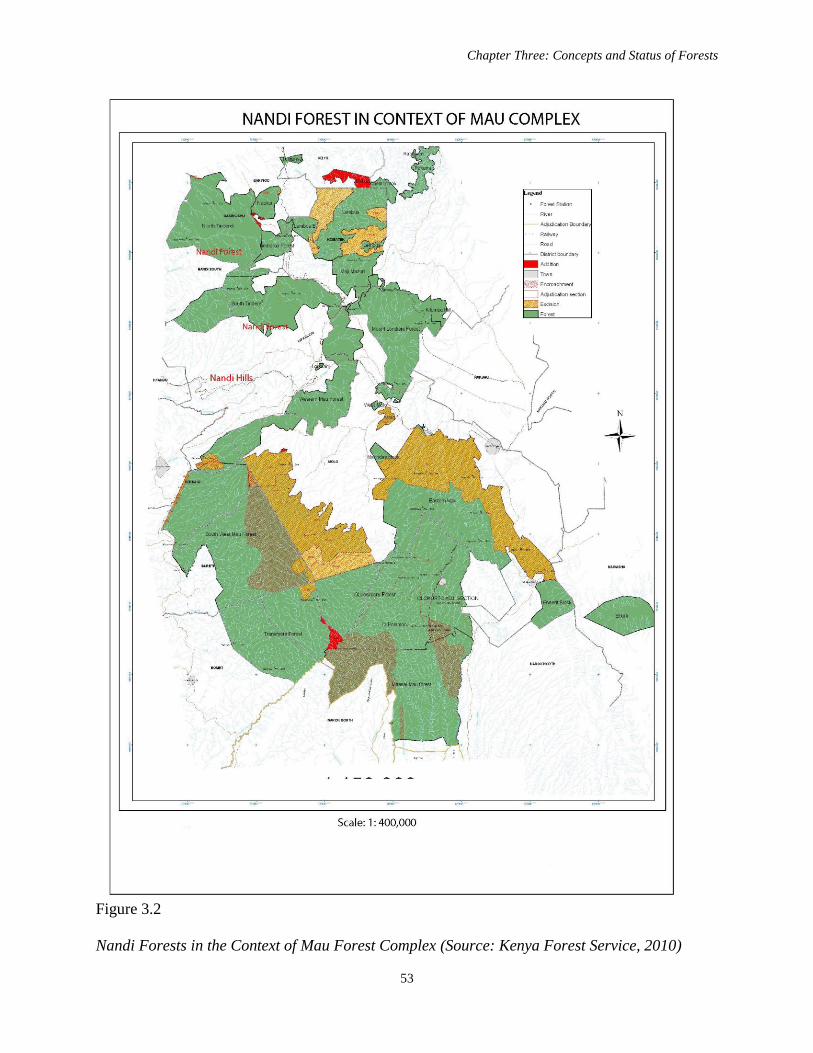
Chapter Three: Concepts and Status of Forests
53
Figure 3.2
Nandi Forests in the Context of Mau Forest Complex (Source: Kenya Forest Service, 2010)
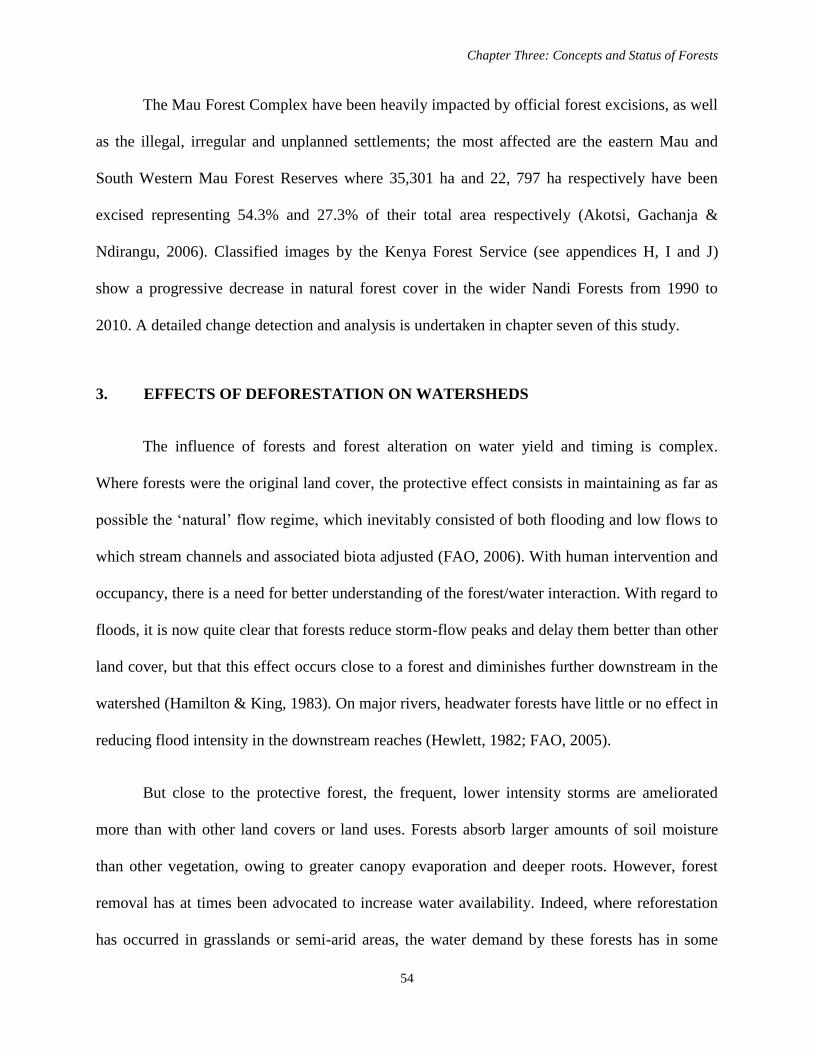
Chapter Three: Concepts and Status of Forests
54
The Mau Forest Complex have been heavily impacted by official forest excisions, as well
as the illegal, irregular and unplanned settlements; the most affected are the eastern Mau and
South Western Mau Forest Reserves where 35,301 ha and 22, 797 ha respectively have been
excised representing 54.3% and 27.3% of their total area respectively (Akotsi, Gachanja &
Ndirangu, 2006). Classified images by the Kenya Forest Service (see appendices H, I and J)
show a progressive decrease in natural forest cover in the wider Nandi Forests from 1990 to
2010. A detailed change detection and analysis is undertaken in chapter seven of this study.
3. EFFECTS OF DEFORESTATION ON WATERSHEDS
The influence of forests and forest alteration on water yield and timing is complex.
Where forests were the original land cover, the protective effect consists in maintaining as far as
possible the „natural‟ flow regime, which inevitably consisted of both flooding and low flows to
which stream channels and associated biota adjusted (FAO, 2006). With human intervention and
occupancy, there is a need for better understanding of the forest/water interaction. With regard to
floods, it is now quite clear that forests reduce storm-flow peaks and delay them better than other
land cover, but that this effect occurs close to a forest and diminishes further downstream in the
watershed (Hamilton & King, 1983). On major rivers, headwater forests have little or no effect in
reducing flood intensity in the downstream reaches (Hewlett, 1982; FAO, 2005).
But close to the protective forest, the frequent, lower intensity storms are ameliorated
more than with other land covers or land uses. Forests absorb larger amounts of soil moisture
than other vegetation, owing to greater canopy evaporation and deeper roots. However, forest
removal has at times been advocated to increase water availability. Indeed, where reforestation
has occurred in grasslands or semi-arid areas, the water demand by these forests has in some
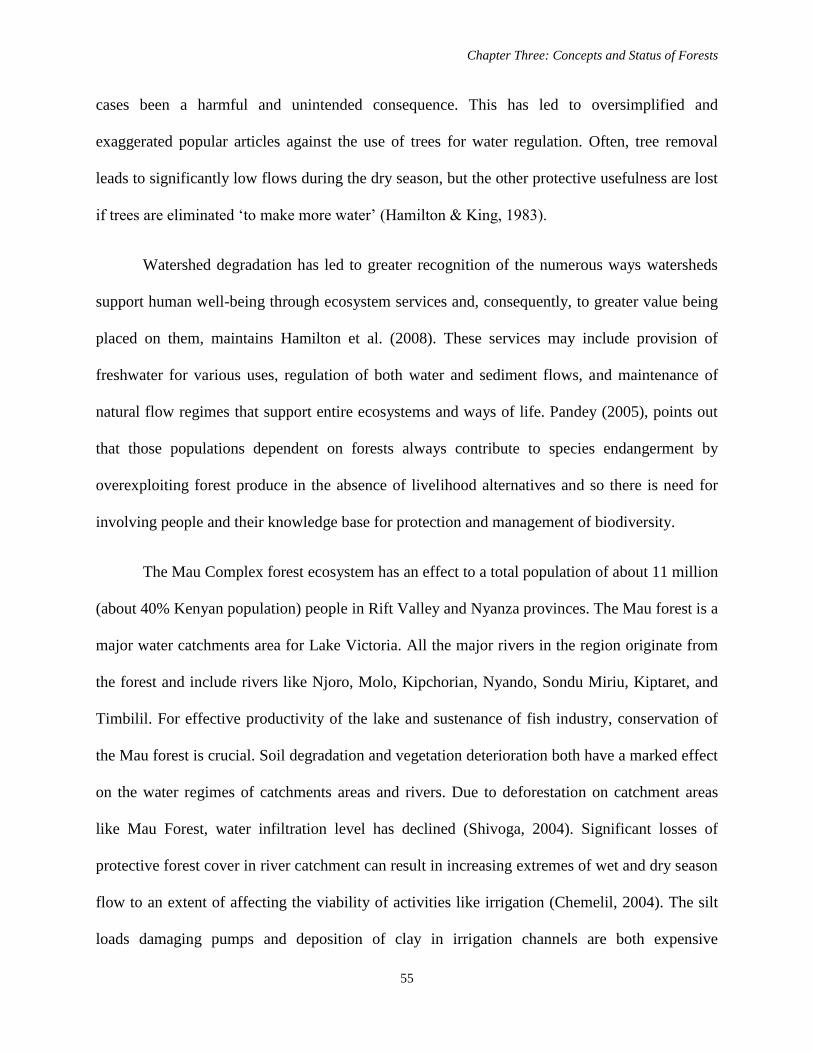
Chapter Three: Concepts and Status of Forests
55
cases been a harmful and unintended consequence. This has led to oversimplified and
exaggerated popular articles against the use of trees for water regulation. Often, tree removal
leads to significantly low flows during the dry season, but the other protective usefulness are lost
if trees are eliminated „to make more water‟ (Hamilton & King, 1983).
Watershed degradation has led to greater recognition of the numerous ways watersheds
support human well-being through ecosystem services and, consequently, to greater value being
placed on them, maintains Hamilton et al. (2008). These services may include provision of
freshwater for various uses, regulation of both water and sediment flows, and maintenance of
natural flow regimes that support entire ecosystems and ways of life. Pandey (2005), points out
that those populations dependent on forests always contribute to species endangerment by
overexploiting forest produce in the absence of livelihood alternatives and so there is need for
involving people and their knowledge base for protection and management of biodiversity.
The Mau Complex forest ecosystem has an effect to a total population of about 11 million
(about 40% Kenyan population) people in Rift Valley and Nyanza provinces. The Mau forest is a
major water catchments area for Lake Victoria. All the major rivers in the region originate from
the forest and include rivers like Njoro, Molo, Kipchorian, Nyando, Sondu Miriu, Kiptaret, and
Timbilil. For effective productivity of the lake and sustenance of fish industry, conservation of
the Mau forest is crucial. Soil degradation and vegetation deterioration both have a marked effect
on the water regimes of catchments areas and rivers. Due to deforestation on catchment areas
like Mau Forest, water infiltration level has declined (Shivoga, 2004). Significant losses of
protective forest cover in river catchment can result in increasing extremes of wet and dry season
flow to an extent of affecting the viability of activities like irrigation (Chemelil, 2004). The silt
loads damaging pumps and deposition of clay in irrigation channels are both expensive
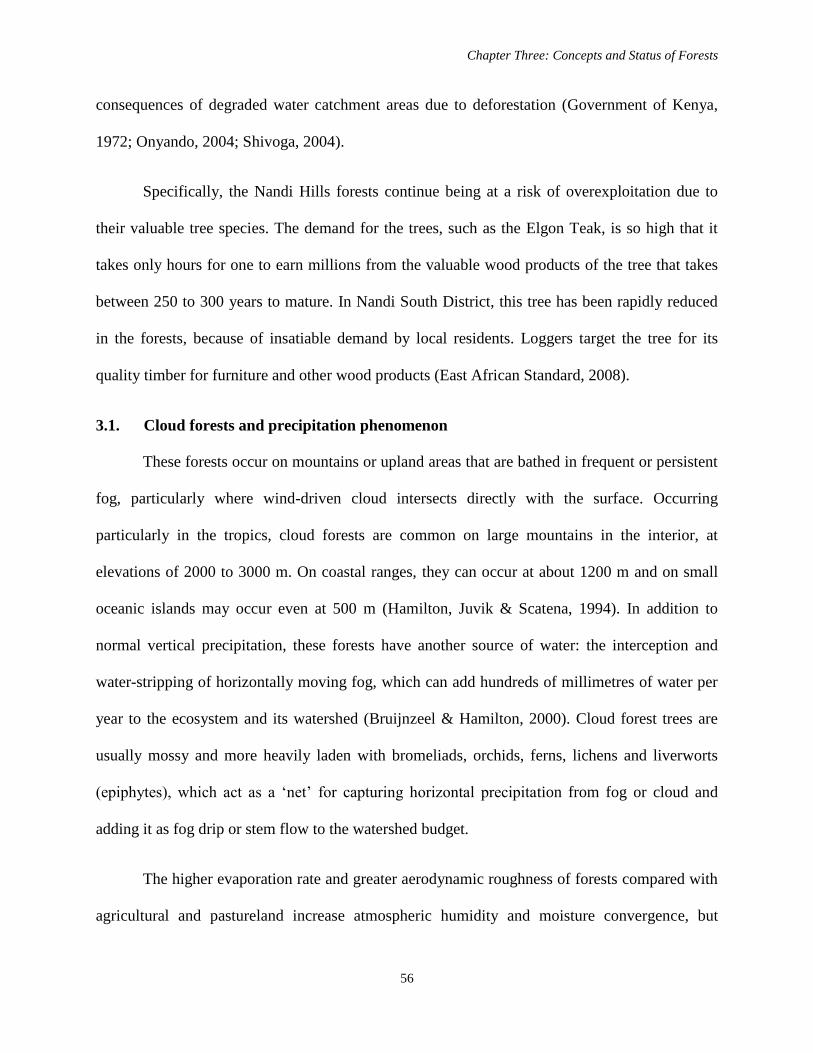
Chapter Three: Concepts and Status of Forests
56
consequences of degraded water catchment areas due to deforestation (Government of Kenya,
1972; Onyando, 2004; Shivoga, 2004).
Specifically, the Nandi Hills forests continue being at a risk of overexploitation due to
their valuable tree species. The demand for the trees, such as the Elgon Teak, is so high that it
takes only hours for one to earn millions from the valuable wood products of the tree that takes
between 250 to 300 years to mature. In Nandi South District, this tree has been rapidly reduced
in the forests, because of insatiable demand by local residents. Loggers target the tree for its
quality timber for furniture and other wood products (East African Standard, 2008).
3.1. Cloud forests and precipitation phenomenon
These forests occur on mountains or upland areas that are bathed in frequent or persistent
fog, particularly where wind-driven cloud intersects directly with the surface. Occurring
particularly in the tropics, cloud forests are common on large mountains in the interior, at
elevations of 2000 to 3000 m. On coastal ranges, they can occur at about 1200 m and on small
oceanic islands may occur even at 500 m (Hamilton, Juvik & Scatena, 1994). In addition to
normal vertical precipitation, these forests have another source of water: the interception and
water-stripping of horizontally moving fog, which can add hundreds of millimetres of water per
year to the ecosystem and its watershed (Bruijnzeel & Hamilton, 2000). Cloud forest trees are
usually mossy and more heavily laden with bromeliads, orchids, ferns, lichens and liverworts
(epiphytes), which act as a „net‟ for capturing horizontal precipitation from fog or cloud and
adding it as fog drip or stem flow to the watershed budget.
The higher evaporation rate and greater aerodynamic roughness of forests compared with
agricultural and pastureland increase atmospheric humidity and moisture convergence, but
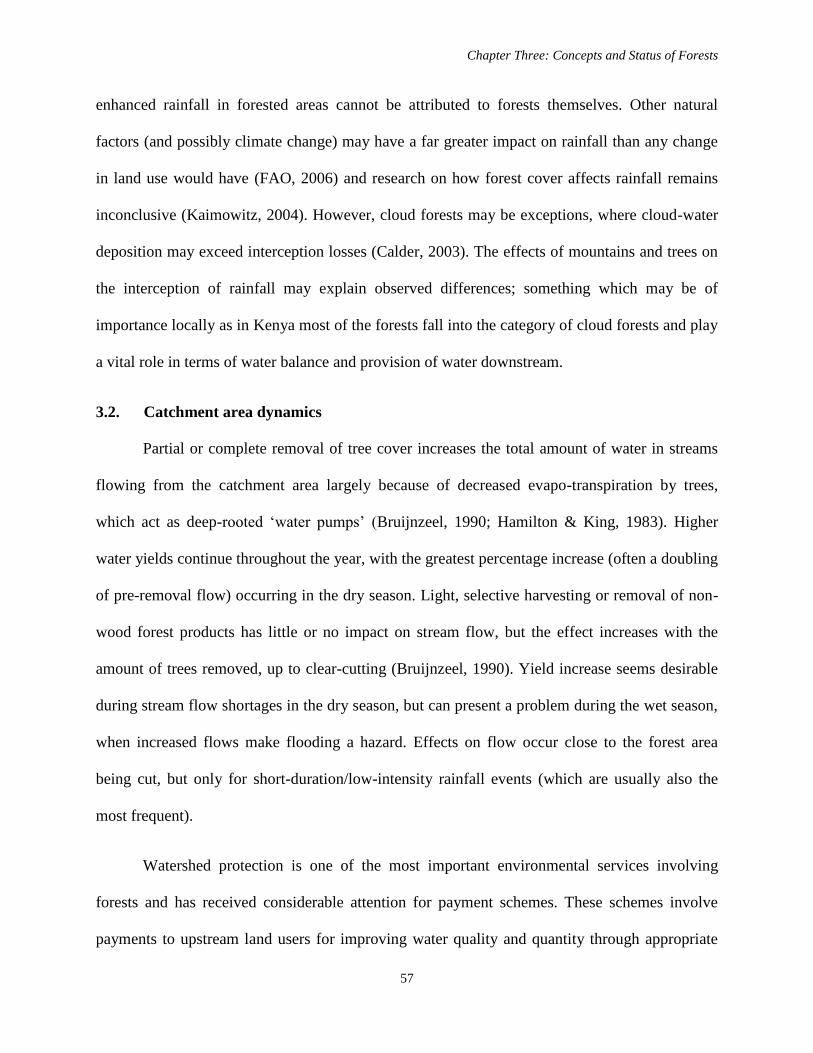
Chapter Three: Concepts and Status of Forests
57
enhanced rainfall in forested areas cannot be attributed to forests themselves. Other natural
factors (and possibly climate change) may have a far greater impact on rainfall than any change
in land use would have (FAO, 2006) and research on how forest cover affects rainfall remains
inconclusive (Kaimowitz, 2004). However, cloud forests may be exceptions, where cloud-water
deposition may exceed interception losses (Calder, 2003). The effects of mountains and trees on
the interception of rainfall may explain observed differences; something which may be of
importance locally as in Kenya most of the forests fall into the category of cloud forests and play
a vital role in terms of water balance and provision of water downstream.
3.2. Catchment area dynamics
Partial or complete removal of tree cover increases the total amount of water in streams
flowing from the catchment area largely because of decreased evapo-transpiration by trees,
which act as deep-rooted „water pumps‟ (Bruijnzeel, 1990; Hamilton & King, 1983). Higher
water yields continue throughout the year, with the greatest percentage increase (often a doubling
of pre-removal flow) occurring in the dry season. Light, selective harvesting or removal of non-
wood forest products has little or no impact on stream flow, but the effect increases with the
amount of trees removed, up to clear-cutting (Bruijnzeel, 1990). Yield increase seems desirable
during stream flow shortages in the dry season, but can present a problem during the wet season,
when increased flows make flooding a hazard. Effects on flow occur close to the forest area
being cut, but only for short-duration/low-intensity rainfall events (which are usually also the
most frequent).
Watershed protection is one of the most important environmental services involving
forests and has received considerable attention for payment schemes. These schemes involve
payments to upstream land users for improving water quality and quantity through appropriate
Chapter Three: Concepts and Status of Forests
58
land-use practices. Such arrangements tend to be most effective in small watersheds, where
service providers and beneficiaries are able to interact and the information flow is relatively
smooth. At larger scales, more complex arrangements become necessary. In most cases, the
payments are from utility companies to land users. Since water is indispensable and tangible,
users are generally willing to pay for improving the quality, quantity and regularity of its supply.
Moreover, it is easy geographically to identify the providers and beneficiaries of the service
(FAO, 2009).
Hewlett (1982) reviewed the evidence from watershed research worldwide and reported
that no cause and effect was demonstrated between forest cutting in the headwaters and floods in
the lower basin. No conflicting information has been published since, more than 20 years later. A
publication by FAO and the Centre for International Forestry Research (Food and Agricultural
Organization & Centre for International Forestry Research, 2005) asserts that: Although forests
can play a certain role in delaying and reducing peak floodwater flows at local levels, scientific
evidence clearly indicates that forests cannot stop catastrophic large-scale floods, commonly
caused by severe meteorological events. This in no way diminishes the need for proper
management and conservation of upland forests. But it does point toward the critical need for
integrated approaches in river-basin management that look beyond simplistic forest-based
„solutions‟. There are many very good reasons for rehabilitating watersheds, including reducing
soil loss, keeping sediment out of streams, maintaining agricultural production and increasing
forest wildlife habitat, but achieving substantial flood reduction is not one of them (Hamilton &
Pearce, 1987).
In some cases, changes in land use have an impact on the hydrological regime of a river
basin; for instance, forest clearing has a direct impact on the infiltration rate and recharge of
Chapter Three: Concepts and Status of Forests
59
aquifers. In many other cases, however, the relation between land use and the hydrological
regime is not so clear. For example, the impact of wetland protection on flow regimes is still
subject to debate; some research suggests that wetland protection increases peak flows and
reduces base flows, while other research indicates increased water storage capacity, leading to
reduced peak flow (Bullock, 1992).
Research shows that land use affects the infiltration of water into the soil, and any change
in land use that compacts soil or diminishes its porosity will increase runoff and peak flow
during rainfall events, and will possibly also increase flooding (Kaimowitz, 2004). These
findings hold for only small areas, however, at large scales the extent, intensity and distribution
of storm events are likely to have much larger impacts on runoff than land-use changes have.
Since most of the freshwater used by humans originates from precipitation in upper
watersheds, the impacts of global climate change have become a major issue in mountain
research. According to Uhlenbrook, Wenninger and Lorentz (2005), such impacts depend on
rainfall changes and on land-use practices. For instance, a slight increase in event-precipitation is
likely to have a much larger impact on runoff and flood discharge when inappropriate watershed
management practices are applied. Land-use changes are changing watershed landscape patterns,
ecosystem function and climate dynamics; they affect biodiversity and hydrology and the
transport of latent heat, carbon dioxide, nutrients and pollutants. Although global change is
largely driven by nature, humans have become a significant environmental force with vast
implications for watershed systems. Humans are not only subject to environmental change, but
also constitute one of the main driving forces behind that change (Huber, Bugmann & Reasoner,
2005).
Chapter Three: Concepts and Status of Forests
60
The Nandi Hills forests have continued to experience encroachment due to settlements of
landless residents and expansion of agricultural activities. There is also uncontrolled logging of
trees for timber production and charcoal burning. There is also human encroachment in the
wetlands, negatively affecting the biodiversity of the ecosystem (Government of Kenya, 2001b).
The rapid population growth over the years has also played a role in endangering the catchment
area the more.
4. COMMUNITY FOREST MANAGEMENT
Since the early 1970s, when a fairly narrowly circumscribed set of activities consisting of
woodlots for fuel and „social forestry‟ in India (Overseas Development Institute, 2005), there
have come a wide range of activities variously called Community Forestry (CF), Adaptive Co-
Management (ACM), Community-Based Natural Resource Management (CBNRM), Community
Involvement in Forest Management (CIFM) and Participatory Forest Management (PFM).
Community resources usually vary in type and or size depending on the laws and policies of
different countries. However, the concept of community participation in resource management
and conservation has been identified as a key pillar in the sustainability of the world‟s natural
resources. For many, community management mitigates the „tragedy‟ of free-for-all exploitation
and inefficiencies or injustices of top-down conservation. Expected conservation and social
benefits include sustainable supply of ecosystem goods and services; community empowerment;
poverty reduction; and more penetrating, relevant, efficient, and just forms of resource
governance than top-down, centralized governance (Agrawal 2005; Ribot 1999).
According to Richard Gauld (2000, p. 224), “introduction of community forest
management in the developing world might be the greatest revolution since the start of scientific
Chapter Three: Concepts and Status of Forests
61
forestry, at least relative to centralized state control.” Moss et al. (2005), further asserts that the
inclusion of communities in the management of state owned or formerly state owned forest
resources has become increasingly common in the last 25 years. Many countries have now
developed, or are in the process of developing changes to national policies and legislation that
institutionalize Participatory Forest Management (PFM). According to Andy et al. (2002),
indigenous and other communities are increasingly acknowledged for being important stewards
of the global forest estates. This relatively new development provides a historic opportunity for
sustainable forest conservation and economic development of some of the world‟s poorest
regions.
Since the late 1980s, some governments of major forested countries have begun to
reconsider and reform forest ownership policies. These transitions are driven by three primary
considerations. First, governments are increasingly aware that official forest tenure systems in
many countries discriminate against the rights and claims of indigenous people and other local
communities. Although the data are incomplete, it is estimated that some 60 million highly
forest-dependent indigenous forest people live in the rain forests of Latin America, West Africa
and South East Asia (World Bank, 2001). An additional 400 million to 500 million people are
estimated to be directly dependent on forest resources for their livelihoods. Around the world,
indigenous people have legitimate claims to more forest areas than governments currently
acknowledge. In South and Southeast Asia alone, several hundred million people live on land
classified as public forest.
International conventions and national political movements are driving governments to
recognize the traditional ownership claims of indigenous peoples and recognize legal ownership
and land use rights held by them and other local communities (Colchester, 2001). This growing
Chapter Three: Concepts and Status of Forests
62
recognition of rights for indigenous and other local communities is not simply an issue of justice.
There is also an increasing convergence of economic development and environmental protection
agendas. Without secure rights, indigenous and other local community groups lack long-term
financial incentives for converting their forest resources into economically productive assets for
their own development (Worah, 2002). There is growing evidence that local community-based
entities are as good, and often better, managers of forests than federal, regional and local
governments. In addition, biologists and protected area specialists are beginning to change
perspectives on human interactions with nature, acknowledging that the traditional management
practices of indigenous peoples can be positive for biodiversity conservation and ecosystem
maintenance. This positive outcome is best gained by devolving control of forest land to
communities (Lori, & Susanna, 1997). A recent review by Wunder, (2001), of property rights
and deforestation in Ecuador, for example, found that community ownership often provides a
disincentive to forest conversion.
A third reason for this transition, as per White and Martin, (2002), is the growing
recognition that governments and public forest management agencies often have not been good
stewards of public forests. While many countries have proven that public ownership can be
effective in protecting and managing forests, others have not developed the governance
structures and management capacities necessary to ensure effectiveness. While exploitation is a
legitimate use of public forests, in many places forests have been abused to finance political
elites and curry political favours. The findings from a number of recent studies on illegal logging
and corruption are staggering; illegal logging on public forest lands is estimated to cost forest
country governments at least $10 billion to $15 billion a year, an amount greater than total World
Chapter Three: Concepts and Status of Forests
63
Bank lending to client countries and greater than total annual development assistance in public
education and health.
To ensure the existence of humankind and the sustainable utilization of the earth‟s
resources, deliberate action needs to be channelled towards the conservation of the vital support
systems of the entire Earth ecosystems. Forests in this case form quite a crucial part of this wider
arrangement that if man does not deliberately conserve and sustainably manage them, he risks
being plunged into an irreversible predicament. Miller (2001) asserts that about 50–80% of in the
moisture and air above tropical forests come from trees via transpiration. If large areas of these
forests are cleared, average annual precipitation drops and the region‟s climate gets hotter and
drier. This process can eventually convert a diverse tropical forest into sparse grassland or even a
desert.
In his article, Tragedy of the Commons, Hardin (1968), describes the dilemma in which
multiple individuals acting independently in their own self-interest can ultimately destroy a
shared limited resource even where it is clear that it is not in anyone's long term interest for this
to happen. Hardin asks for a strict management of global common goods via increased
government involvement and/or international regulation bodies. In direct counter to Hardin‟s
„Tragedy of the Commons‟ thesis (Hardin 1968), which blames common property (systems of
communal resources ownership) for the overuse of common-pool resources by rational self-
interested individuals at the expense of the common good, common-pool resources scholars
blame open access or „res nullis’ – absence of any property rights defining the users and rules
(Feeny et al., 1990). Common-pool resources are „„goods that can be kept from potential users
only at great cost or with difficulty, but that are extractable in consumption and can disappear,‟‟
whereas commons are resources that involve some level of joint access or ownership (McKean,
Chapter Three: Concepts and Status of Forests
64
2000, p. 28). These scholars often prescribe local institutions to regulate resource use and curb
free-riding behaviour under common property regimes – „„property-rights arrangements in which
a group of resource users share rights and duties towards a resource‟‟ (McKean, 2000, p. 28).
These rights arrangements often embrace „design principles‟, which are lists of conditions,
deemed to improve institutional success (Ostrom, 1990). Following this argument, forests and
forest resources should be used at rates below their sustainable yields or overload limits by
reducing population, regulating access or both. However it is difficult to determine the
sustainable yield of a forest, partly because yields vary with weather, climate and unpredictable
biological factors, and because getting such data is expensive (Miller, 2001).
Relationships between community-based property rights and environmental services that
benefit the general public are drawing new attention. Governments‟ traditional approach to
conservation has been the creation of official protected areas, either by delineating an area of
existing public property or by using the right of eminent domain to expropriate land. Not only
has this approach often abused legitimate community rights, but it has often led to mixed results,
largely because governments often lack the incentives, resources and political will needed to
protect and sustainably manage natural resources that are public property. At the same time,
valuable public services provided by the private forests of indigenous and other communities
have often been taken for granted by the wider public that benefits (Andy et al., 2002)
In as much as community natural resources management (CNRM) was introduced and
emphasized in Africa by the early 1990s (FAO, 1999a), it has not met its targeted objectives.
CNRM follows the compelling theoretical notion that empowering communities to use their
knowledge and resources to solve local environmental problems can make resource governance
more penetrating, relevant, efficient, equitable, and lasting than at least centralized regimes
Chapter Three: Concepts and Status of Forests
65
(Ribot 1999; Agrawal 2005). However, disaffection with failures of centralized conservation
may have allowed an uncritical embrace of „„participation‟‟ (Cook & Kothari 2001). For
instance, “conservation is often simplistically assumed to always be the shared local goal”
(McCay, 2002, p.3 71), and local goals are assumed to be consistent with broader goals.
Increasingly, studies now indicate that expected conservation and social goals are rarely realized
(e.g., Campbell et al., 2001; Kellert et al., 2000). In fact, growing evidence of failure has sparked
a backlash against CNRM in Uganda, Ghana, Indonesia, and Nicaragua (Ribot, 2002).
Regulation of land-use practices alone has not ensured continued provision of services. It
places a disproportionate share of the conservation costs on upstream land users without giving
them corresponding access to benefits. For example, States often claim ownership of forested
areas and protect watersheds through policies that exclude local populations from resources on
which they have traditionally relied. This may lead local people to engage in what have suddenly
become illegal practices, or to occupy more marginal land areas (Blaikie & Muldavin, 2004;
Tomich, Thomas & van Noordwijk, 2004).
Market-based arrangements are a way for upstream land users to recover the costs of
maintaining forest cover, and a way of funding other land management practices to protect
watershed services. They are also advocated for landscape approaches to conservation, which
require the creation of incentives for conservation on privately held land. Market-based
approaches in which payments are contingent on achieving desired outcomes can lead to more
efficient resource allocation and more cost effective solutions. However, there are a number of
scientific and institutional challenges to their implementation, the transaction costs of which may
make these approaches impractical. Among the challenges is that of demonstrating and
quantifying the actual benefits to those who are asked to pay for them. This requires an
Chapter Three: Concepts and Status of Forests
66
understanding of complex ecosystem processes, over time in specific places, the identification of
effective management actions to maintain these, and reasonable assurance that buyers will have
access to benefits in the future. Finding the most efficient and effective approaches also requires
the capacity to learn and adjust to new information (Hamilton et al., 2008)
4.1. Successful community forestry in Mexico
Molnar & White (2001) have emphasized that: Mexico is one of the few countries in the
world where the vast majority of forests are privately owned by indigenous and other
communities. Even so, there are important barriers to effective community forestry stemming
from inadequate policies, technical support and markets. There are approximately 8,000
communities who own 44 million hectares of forest or an average of 5,000 hectares per
community. The legal status of these lands derives from the creation of ejidos as land reform
blocks transferred to producers from large landowners after the Revolution, recognition of
traditional claims of indigenous groups to ancestral territories, or lands to which they fled after
conquest. Many of the social systems governing these communities predate the Spanish conquest
although they have been strongly modified by cultural contact. A constitutional amendment
proposed in early 2001 attempts to regulate indigenous self-governance rights, including land
and forest use, but this amendment has been criticized as not ratifying basic principles of
indigenous rights.
Despite official community ownership, until 1986 government unilaterally granted access
to commercial value community forests to private concessionaires and then to parastatals, giving
communities little voice over management decisions and transferring limited benefits from
logging. This approach, combined with historical agricultural and forest policies biased in favour
of large private industry and urban dwellers, created a situation whereby indigenous and ejido
Chapter Three: Concepts and Status of Forests
67
communities remain among the poorest people in Mexico and community-based forest industries
account for less than 18% of the registered national forest industry capacity. The 1986 Forest
Law and subsequent modifications in 1992 and 1997 suspended the concessions system and
increased opportunities for communities to direct their own forest enterprises, including
extraction, provision of services and processing, as long as they prepared legal management
plans for their forests. Less than a quarter of all communities and ejidos have active management
plans, related to the cost of preparing such plans and encouraging illegal logging. The poor
quality of original territorial surveys of community boundaries leaves many inter-community
conflicts over boundaries and encourages substantial investment of community funds to police
their lands and advance their claims in court.
Despite these limitations, some 500 communities and ejidos have developed quite
successful integrated forest enterprises, generating local employment and technical expertise and
providing an alternative to labour migration and deforestation. Some communities hold strong
cultural values that lead them to invest profits in social services and infrastructure and
conservation of biodiversity rich areas. The forest sector has an enormous potential to provide
economic, environmental and social services, with opportunities in timber and non-timber forest
products and small-scale tourism, but the sector has yet to receive equal treatment as agriculture
or keeping cattle. These findings suggest that the role of social forestry in Mexico as a
development strategy that addresses poverty alleviation, economic development and
environmental protection is worth consideration.
Chapter Three: Concepts and Status of Forests
68
4.2. Challenges to effective community ownership in Papua New Guinea
Papua New Guinea (PNG) contains the largest intact tropical rainforest wilderness in the
Asia Pacific region and the third largest on the planet. Some 90 to 97% of its forests are owned
by some 8,000 traditionally autonomous tribal groups (Government of the Papua New Guinea,
2006). Despite state-recognized local community ownership, government and industry continue
to wield tremendous influence, often taking advantage of limited community capacities to defend
local interests against outside entrepreneurs. Almost half the country‟s accessible forests are
already committed to industrial logging and over 30 proposed timber projects threaten the rest.
Some community leaders participate in corrupt deals that advance their own interests at the
expense of their communities (Barry, 2002). Rapid deforestation, widespread corruption and
illegal logging have led to a moratorium on all new logging concessions in PNG and new support
for community-based forestry management initiatives (Government of the Papua New Guinea,
2006).
Recent experiences in Africa have revealed similar challenges imposed on local
communities by the state in implementing community-based forestry management. Although
Uganda and Tanzania now legally recognize community ownership, as in most other countries
that have enacted similar reforms, Okoth (2001) maintains that there is no legal guidance on the
principles and rules for formally recognizing and governing these areas. Tanzania has gone
farthest, in devolving formal registration of Village Land Forest Reserves to local communities
with or without the explicit support of the central forestry administration.
Relationships between community-based property rights and environmental services that
benefit the general public are drawing new attention. Governments‟ traditional approach to
conservation has been the creation of official protected areas either by delineating an area of
Chapter Three: Concepts and Status of Forests
69
existing public property or by using the right of eminent domain to expropriate land (Burnham,
2000). Not only has this approach often abused legitimate community rights, but it has often led
to mixed results, largely because governments often lack the incentives, resources and political
will needed to protect and sustainably manage natural resources that are public property. At the
same time, valuable public services provided by the private forests of indigenous and other
communities have often been taken for granted by the wider public that benefits. At the same
time it is still widely believed by political and economic elites in many nations that local
communities should not or will not use their forest assets for economic development.
White and Martin (2002), further affirm that official efforts on national levels, therefore,
to protect and maintain publicly valuable environmental services often have not been harmonized
with local communities‟ rights and incentives to manage their private property. Nor do these
strategies acknowledge the role of indigenous peoples as a living repository of cultural norms
and technical knowledge that shapes the biodiversity of ecosystems, which can be an important
element in biodiversity conservation and in carrying out ex situ conservation.
5. SUSTAINABLE FOREST MANAGEMENT
The term „sustainable forest management‟ can be traced to the non-binding „Forest
Principles‟ and Chapter 11 of Agenda 21, which were prominent outputs of the United Nations
Conference on Environment and Development (UNCED, 1992). Sustainable Forest Management
(SFM) represents a new paradigm for forestry (Peng, 2000). Although sustainable forest
management (SFM) is now widely accepted as the overriding objective for forest policy and
practice, it is not easily defined (Shvidenko et al., 2005). However, recent studies clearly
distinguish the terms „sustainable development‟ and „sustainability‟ (Dovers & Handmer, 1993).
Chapter Three: Concepts and Status of Forests
70
Brundtland‟s commission report on sustainable development refers it as „the development which
meets the needs of the present without compromising the ability of future generations to meet
their own needs‟. Contrarily, sustainability refers to the „the ability of a human, natural, or mixed
system to withstand or adapt to endogenous or exogenous change indefinitely‟ (Dovers &
Handmer, 1993). Further, sustainability in ecological terms implies that essential life-support
systems be maintained over time without degrading their quality (Alberti, 1996).
In the case of forest ecosystems, maintaining integrity in terms of its structure, function,
composition and ecological processes, along with the environmental service the forests provide,
is of particular significance. To achieve sustainability as well as sustainable development
strategies (Brundtland, 1987), a resource inventory along with factors underlying resource
degradation at various levels are needed. Generally, the health and wellbeing of the people and
the forest ecosystem together determine the progress of management practices towards the
sustainability (Dovers & Norton, 1994; Maser, 1994; Verma et al., 2000). Hence, the guiding
objective of the Forest Principles in SFM is to contribute to the management, conservation and
sustainable development of all types of forests and to provide for their multiple and
complementary functions and uses. Principle 2b (UNCED, 1992) specifically states, “Forest
resources and forest lands should be sustainably managed to meet the social, economic,
ecological, cultural and spiritual needs of present and future generations.”
The concept of sustainable forest management has continued to evolve since 1992
through international forest policy dialogue within the Intergovernmental Panel on Forests (IPF),
the Intergovernmental Forum on Forests (IFF) and the United Nations Forum on Forests (UNFF)
and through a large number of country-led and eco-regional initiatives aimed at translating the
Chapter Three: Concepts and Status of Forests
71
concept into practice. These include the development of criteria for and indicators of sustainable
forest management supported by international organizations including FAO, the International
Tropical Timber Organization (ITTO), the United Nations Environment Programme (UNEP) and
other members of the Collaborative Partnership on Forests (CPF). Sustainable forest
management is also the main theme of the FAO Strategic Plan for Forestry, whose mission is “to
enhance human well-being through support to member countries in the sustainable management
of the world‟s trees and forests.” (FAO, 1999b, p. 1)
Understanding and quantification of dynamics associated with forest loss and the factors
that influence these dynamics provides the basis for the sustainable use of forest resources and
the conservation of their environmental values (Geist & Lambin, 2001). Of particular importance
is that at periodic intervals the forests are subjected to large-scale natural and anthropogenic
disturbances, whose relationship and interaction with environmental variability and change is
imperfectly understood (Fleming et al., 2000; Li, 2000). Operationalizing sustainability in terms
of identifying strategies that reduce forest loss is considered of prime significance in tropical
regions. Social and economic benefits from sustainable use of biodiversity can provide powerful
incentives to conserve it, provided that two conditions are fulfilled (IUCN, 1993). Firstly, the
people most likely to have a direct impact on the biodiversity concerned should receive what
they perceive as a fair share of the benefits from the use. Secondly, there should be a clear
connection between the benefits obtained from using the resources and conservation of them.
This will often involve:
• Respecting and promoting traditions of local communities that are compatible with
conservation of biodiversity;
Chapter Three: Concepts and Status of Forests
72
• Providing economic, institutional, biological and other technical assistance on request;
• Developing community-level education programmes on the uniqueness of local
biodiversity;
• Cooperating with rural communities to develop sustainable use projects that demonstrate
the value of maintaining local biodiversity; and
• Assisting in the development of markets, and promoting access to those markets on
favourable terms, for the products of sustainable management of biodiversity.
Despite, or perhaps because of, the long maturing process of the sustainable forest
management concept, it is difficult to define explicitly what sustainable forest management is.
However, several recent international meetings have suggested that there are seven thematic
elements in sustainable forest management (FAO, 2006).
5.1. Thematic elements of sustainable forest management
To be able to apply the concept of sustainable forest management as clearly and as simply
as possible, it is necessary to describe it in terms of guiding principles, criteria and corresponding
indicators (Vermaet al., 2000). For example, an overview by the Food and Agriculture
Organization of such initiatives (Lanly, 1995) shows a consensus on the characterization of
sustainable forest management through seven criteria. The seven thematic elements of
sustainable forest management are as described below and are based on the nine ongoing
regional/international processes on criteria and indicators for sustainable forest management and
have been acknowledged by FAO member countries and the UNFF.
Chapter Three: Concepts and Status of Forests
73
i) Extent of forest resources
The theme expresses an overall desire to have adequate forest cover and stocking,
including trees outside forests, to support the social, economic and environmental dimensions of
forestry. For example, the existence and extent of specific forest types are important as a basis
for conservation efforts. The theme encompasses ambitions to reduce deforestation and to restore
and rehabilitate degraded forest landscapes. It also includes the important function of forests and
trees outside forests to store carbon and thereby contribute to moderating the global climate.
ii) Biological diversity
The theme concerns the conservation and management of biological diversity at
ecosystem (landscape), species and genetic levels. Such conservation, including the protection of
areas with fragile ecosystems, ensures that diversity of life is maintained, and provides
opportunities to develop new products in the future, including medicines. Genetic improvement
is also a means of increasing forest productivity, for example to ensure high wood production
levels in intensively managed forests.
iii) Forest health and vitality
Forests need to be managed so that the risks and impacts of unwanted disturbances are
minimized, including wildfires, airborne pollution, storm felling, invasive species, pests, diseases
and insects. Such disturbances may impact social and economic as well as environmental
dimensions of forestry.
iv) Productive functions of forest resources
Forests and trees outside forests provide a wide range of wood and non-wood forest
products. This theme expresses the ambition to maintain an ample and valuable supply of
Chapter Three: Concepts and Status of Forests
74
primary forest products, while at the same time ensuring that production and harvesting are
sustainable and do not compromise the management options of future generations.
v) Protective functions of forest resources
The theme addresses the role of forests and trees outside forests in moderating soil,
hydrological and aquatic systems, maintaining clean water (including healthy fish populations)
and reducing the risks and impacts of floods, avalanches, erosion and drought. Protective
functions of forest resources also contribute to ecosystem conservation efforts and have strong
cross-sectoral aspects, because the benefits to agriculture and rural livelihoods are high.
vi) Socio-economic functions
The theme covers the contributions of forest resources to the overall economy, for
example through employment, values generated through processing and marketing of forest
products, and energy, trade and investment in the forest sector. It also addresses the important
forest function of hosting and protecting sites and landscapes of high cultural, spiritual or
recreational value, and thus includes aspects of land tenure, indigenous and community
management systems, and traditional knowledge.
vii) Legal, policy and institutional framework
The theme includes the legal, policy and institutional arrangements necessary to support
the above six themes, including participatory decision-making, governance and law enforcement,
and monitoring and assessment of progress. It also involves broader societal aspects, including
fair and equitable use of forest resources, scientific research and education, infrastructure
arrangements to support the forest sector, transfer of technology, capacity-building, and public
information and communication.
Chapter Three: Concepts and Status of Forests
75
The complexity of sustainable forest management makes the extent of its achievement not
to be a definitive one (FAO, 2006). However, there are many good signs and positive trends, but
many negative trends remain. While intensive forest plantation and conservation efforts are on
the rise, primary forests continue to become degraded or converted to agriculture at alarming
rates in some regions. As the analyses of the thematic areas above illustrate, the answer to
sustainable forest management also depends on the scale and perspective applied.
Implementation of sustainable forest management, which addresses the economic, social
and environmental functions of forests, is an important approach to ensuring a balance between
the objectives of production and conservation. Traditional methods for assessing the above
criteria and associated changes and impacts on forest ecosystems have typically treated the
socioeconomic and ecological effects independently (Dale et al., 1993). To understand
deforestation process in general and factors affecting sustainable forest management practices,
data on physical changes of forest cover have to be linked with socioeconomic data and
candidate driving forces that govern these changes (Geist & Lambin et al., 2001; Moran, 1993).
Maintaining critical ecosystem functions is a key pillar of sustainable forest management.
„Close-to-nature silviculture‟ and the „ecosystems approach‟ are essentially variants of
sustainable forest management, giving greater emphasis to environmental services.
While the concept of sustainable forest management is accepted as the framework for
managing forests in most countries, its implementation differs considerably among them.
Barriers to its adoption are relatively few where institutions are well developed and society is
able to meet the higher costs, as is the case in many developed countries. However, in low-
income situations, sustainable forest management faces far more constraints, reflecting limited
ability and willingness to pay for the additional costs involved in adhering to the social and
Chapter Three: Concepts and Status of Forests
76
environmental criteria. Consequently, in the tropics, the proportion of forests that are sustainably
managed remains very low (ITTO, 2006).
6. CONCEPTUAL FRAMEWORK FOR SUSTAINABLE WATER CATCHMENT
AREA MANAGEMENT
Sustainable Water Catchment Area Management (SWCAM) is a multi-faceted concept
incorporating several paradigms, which when consolidated can result into an effective medium
for making available water catchment resources without compromising future abundance of
these resources. This study therefore attempts to link the diverse facets of Environmental
Education, Community Forest Management (CFM), GIS and Remote Sensing to Sustainable
Forest Management (SFM) as the key driver of SWCAM (Figure3.3)
With reference to the study area of this research, the Nandi Hills and Nandi Forest, SFM
comes in as a pivotal element for driving the wheel of SWCAM. SFM can be viewed as a system
which aims at satisfying the needs of society for various forest goods and services through the
application of forestry, environmental management, ecological, social, economic and business
principles and methods in the wise utilization, renewal and development of forest resources
without significant degradation of the inherent capacity of the forests to provide goods and
services on an uninterrupted basis (Revilla et al., 1999).
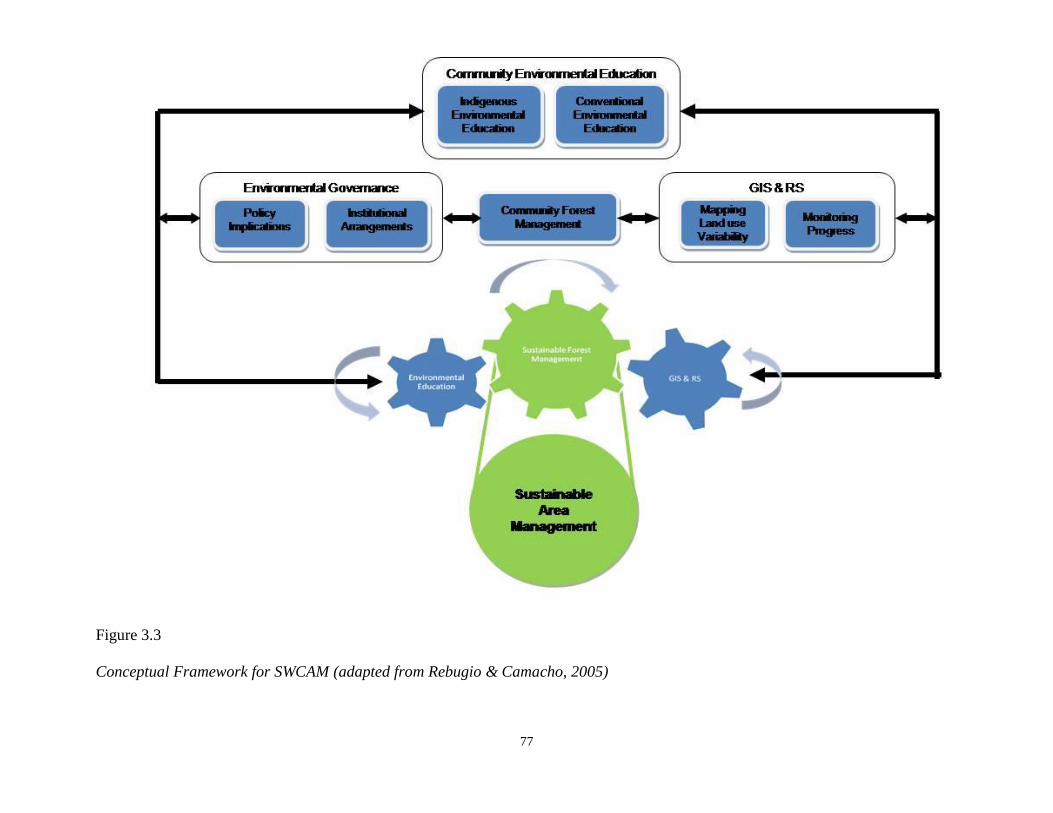
Chapter Three: Concepts and Status of Forests
77
Figure 3.3
Conceptual Framework for SWCAM (adapted from Rebugio & Camacho, 2005)
Chapter Three: Concepts and Status of Forests
78
6.1. Drivers of SWCAM
As illustrated Fig. 3.3, this study considers integrated water catchment area management
anchored on SFM for the study area. SFM then becomes a key „wheel‟ driven by Community
Environmental Education (CEE), GIS & RS. In the event that CEE, GIS & RS are actualized
CFM will be immensely dependent on them (CEE, GIS & RS).
6.1.1. Sustainable forest management
Research in natural forests now focuses more on integrating environmental, social and
economic objectives according to the principles of sustainable forest management. A number of
national, regional and international initiatives focus on the development of criteria and indicators
for measuring progress towards sustainable forest management, outlining the nature of
technology to be adopted. Implementation of sustainable forest management requires substantial
strengthening of the science and technology base. To this end, much research focuses on
ecosystem structure and functioning, the spatial and temporal linkages among ecosystem
components and processes, and their relation to the immediate and larger social and economic
context. However, implementation of such research remains a challenge (Centre for International
Forestry Research, 2004), especially in developing countries.
Albeit the implementation challenges of research, especially in developing countries, this
study brings in GIS & RS as a technology base. This technology shall immensely support and be
supported by CEE in the achievement of the environmental, social and economic objectives of
SFM and ultimately the attainment of SWCAM.
Chapter Three: Concepts and Status of Forests
79
6.1.2. Community environmental education
Community Environmental Education should be achievable through the exploitation of
both the indigenous and conventional environmental education approaches available and which
is considered to be „workable‟ by the local community. Involving the community relies on their
ability to interact with basic technologies involving GIS & RS and also get better equipped with
tools for CFM (Foody, 2001).
6.1.3. GIS & Remote sensing
The use of these technologies in SFM is an approach which involves assimilation of GIS
techniques by incorporating spatial (thematic maps) and non-spatial (attribute defined) data for
effective utilization and management of forest resources. They also allow the conceptualization
of an integrated approach to create a forest information database and RS utilities to arrive at an
effective management model for forest officers and other concerned users and planners. In this
case, GIS & RS play a major role in making available information to be disseminated through
CEE.
6.1.4. Community forest management
CFM is viewed in this framework as being both dependent on and depended upon by
CEE, GIS & RS in the wider concept of SFM. Strategies to be adopted in CFM is disseminated
to the local community through CEE, while GIS & RS are tools that illustratively reveal or map
the spatial-temporal variations in land use that would be key in SFM.
6.2. Indicators of SFM
The effective implementation of SFM should address the economic, social and
environmental functions of forests; hence it is an important approach to ensuring a balance
Chapter Three: Concepts and Status of Forests
80
between the objectives of production and conservation. Maintaining critical ecosystem functions
is a key pillar of SFM since by this; the forests can be able to make economic sense to the local
community without putting their availability to future generations in jeopardy.
7. CHAPTER SUMMARY
The chapter highlights the status and importance of forests both globally and in Kenya. It
elaborates on various concepts and theories on forest management and the emerging trends in
conservation, including climate change which poses a major challenge to forests. The
prominence this chapter gives to the community, when it comes to effective management of
forests as vital reservoirs of sustainability, illustrates the need for foresight in dealing with
forests and forest resources. A conceptual framework that attempts to elaborate the inter-linkages
between community environmental education, and GIS and Remote sensing in enhancing
sustainable forest management CFM is also presented.
Chapter Four: Spatial Temporal Variations
81
CHAPTER FOUR
SPATIAL TEMPORAL VARIATIONS IN LAND USE AND ITS
IMPLICATIONS ON FOREST ECOSYSTEMS
1. INTRODUCTION
The term 'temporal' in spatial analysis has ubiquitous latent meanings, each of which
requires a diverse approach for the provision of a supporting analysis. Lately, work in spatio-
temporal information is about versioning transaction (Halls, 1995). Some researchers use GIS in
search of an understanding of item relationships across time, past, present and future; and their
focus is how real-world attributes interact in space and time (Fisher & Unwin, 2005). Others
have tried to formalize a conjecture of spatio-temporal thinking working from a theoretical
construct (Claramunt et al., 1997; Hermosilla, 1994; Qian et al., 1997), while Worboys (1998)
and Miller and Halls (1996, 1995) use a predicament directed approach. It is important that
anyone who is involved in attempting to develop and environmental education programme
towards sustainable management beau fait with such techniques and the data that are generated
and are readily available from such approaches. As such these GIS, Remote Sensing, land use
change, global trends and conditions, and trends in Kenya, are discussed in this chapter.
2. GIS, REMOTE SENSING AND SPATIAL TEMPORAL CHANGES
Geographic Information System (GIS) is computer-based software, hardware and systems
designed to allow users to assemble, administer, scrutinize and envisage spatially referenced data
and associated qualities (Cowen, 1998). It may be the most significant technology manager of
Chapter Four: Spatial Temporal Variations
82
resources to have been acquired in recent times (Franklin, 1994). A blend of GIS and Remote
Sensing methods enhances the pace at which immense amounts of spatial and temporal data are
analysed and broken down for faster and informed making of decisions.
Vogt et al. (1997), asserts that the extensive use of Geographic Information System (GIS)
and Remote Sensing mechanics has permitted researchers and managers to take a wider view of
ecological processes and patterns. The techniques of remote-sensing have been applied
successfully for forest monitoring and mapping and have made it possible to cover great areas
consistently and cheaply (Coppin et al., 2004). The ever varying composition and structure of
landscape can be easily substantiated by using GIS together with remotely sensed data. When
these tools for spatial information are put together with statistical models, planners and managers
have a means for investigating the impacts of different management practices on trend and
process (Vogt et al., 1997).
Latest technologies in the remote sensing field address procedural challenges such as the
parameter structure, height, density and make-up of forests. Airborne radiance detection and
changes using lasers can evince highly precise approximations of tree cover and also height; it
can even evaluate the outline of individual trees. Ranging Space-borne radar has brilliant ways to
arrive at approximates of biomass and stand volume and can go through clouds, defeating some
of the demerits of ocular satellite sensors. Latest spectral sensing systems can compute a wide
selection of land and vegetation distinctiveness, making it probable to evaluate a range of forest
features – helping to improve mapping of forest cover, pests and diseases (Hestira et al., 2008).
GIS offers a tool for bringing together distinct themes of information and showing the
physical, social and biological dimensions to describe and map ecosystems. Fresh progress in
Chapter Four: Spatial Temporal Variations
83
GIS technology comprises of the capability to amass and manage bulky data sets and to execute
spatial and statistical analyses. GIS can provide contribution to both stationary and dynamic
ecological models. For instance, a fixed replica may be used to make erosion approximations
based on soil category and topography characteristics, whereas a complex GIS model could be
used to symbolize a spatial landscape at varying time durations (Stow, 1993).
At the global stage, GIS and global navigation satellite systems gives forest managers
increasingly defined information on the character and the situation of forest resources, which can
be processed rapidly. Fresh modelling and image software linking GIS and remote sensing
provides high-class digital models of future forest landscapes to depict changes that might be as
a result of natural mechanisms, such as climate variations, or human involvement, such as
thinning, planting, and harvesting. Such creations make possible the engagement of communities
in forest resource management and decision making (Sheppard & Meitner, 2005). Baltzer et al.
(2007) point out that, further than forest management functions, remote sensing methods have
the potential to provide data to the scientific society about forest conditions, central to the
comprehension of sustainable land use.
Remotely sensed data is normally stored in a database and can be analysed using GIS
developed for the collection, storage, and analysis of substances and events when geographic
position is an imperative characteristic, or is vital to the analysis (Turker, 2000). GIS is a strong
system with all-around ability, such as analysis of spatial attributes, visualization, and
management of spatial databases, which assists managers make adept decisions about resources
and the running of these resource entities and equips researchers with great mechanized tools for
responding to these questions (Baltzer et al., 2007). These tools make it much simple to evaluate
and analyse data for unique studies and reporting and new modes of analysis that were not
Chapter Four: Spatial Temporal Variations
84
feasible previously are now achievable (Stow, 1993; Schreier & Dech, 2005). The software can
rapidly search throughout map information, excavating for features with definite attributes or
inspecting spatial interactions among objects and can, by design, swiftly answer specified
questions. GIS technology maintains almost all new innovations, including vehicle global
navigation systems, support systems for decisions, dynamics of ecosystems, together with
production systems for maps and charts (Aranoff, 1989).
A remote sensing instrument records responses which are premised on many attributes of
the ground, including artificial and natural cover. An expert uses the aspect of shadow, site, tone,
texture, pattern and association to attain land cover information (Ryerson & Rencz, 1999).
However, remotely sensed images by a range of sensors flown aboard various platforms at
varying heights over the terrain and at different moments of the year does not lead to an easy
grouping system, and it is believed that no sole classification can be utilized with all forms of
imagery. To date, the most triumphant attempt in mounting a general categorization scheme
well-suited for remote sensing data has been prepared by Anderson et al. (1972) and is also
known as United States Geological Survey (USGS) classification design. Other contemporary
classification schemes presented for use with remotely sensed data are chiefly adjustment of the
above classification system (Mesev, 2007). Since the commencement of the first remote sensing
satellite in 1972, terrestrial variations studies were carried out on diverse levels for diverse
spatial data users.
Change evaluation is the practice of spotting out discrepancies in the nature of an object
or event by studying it at different moments (Singh, 1989). Detection of Change is an important
process in managing resources and development of urban areas since it offers a quantitative
study of the distribution of spatial structures and the population in interest. The following are
Chapter Four: Spatial Temporal Variations
85
aspects of detecting change which are vital in natural resources monitoring (Macleod &
Congation, 1998):
Detecting if change has happened
Identification of the nature of change
Measuring the extent of change
Assessing the nature and pattern of the change
The base-point of using remote sensing information for detecting change is that land
cover leads to changes in values of radiance that can be remotely sensed (Turker, 2000).
Methods of performing change detection with satellite data have become ubiquitous as a result of
increased flexibility in manipulating data and the increasing power of computers and a large
range of digital change detection methods have been developed over the last few decades. Singh
(1989) summarizes eleven different change detection formulas that were found to be stored in the
literature by the year 1995. These include:
Temporal change delineation.
Post classification and delta comparisons.
Multidimensional feature space analysis.
Composite scrutiny.
Differencing of images.
Linear data transformation.
Vector change analysis.
Regression of imagery.
Temporal biomass index
Chapter Four: Spatial Temporal Variations
86
Subtraction of background
Rationing of images
In some cases, land cover change may result to socio-economic and environmental
impacts (Bradley & Mustard, 2005). Hence data on spatial temporal changes are of significance
to planners in investigating the results of land use variations on any particular area. Such data are
of benefit in administration of resources and to agencies that prepare and assess land use trends
in modelling and forecasting future changes.
A number of studies have shown that LANDSAT Mapper has been sufficient for general
synoptic coverage of huge areas, which decreases the need for costly and intense land surface
surveys carried out for confirmation of data (Lulla, 1983). Satellite imagery can also offer more
regular data collection than aerial photographs which, however, may present more geometrically
precise maps (Paulsson, 1992).
3. LAND USE CHANGE
The rate, extent and spatial attainment of human conversion and change of the earth‟s
land surface can be exceptional (Lambin et al., 2001), however, some regions around the world
are presently undergoing speedy, wide-raging alterations in land cover (Coppin et al., 2004; Mas,
2004). Land cover adjustment has been known as a vital driver of universal environmental
change (Petit, 2001). According to Foody (2001), change in land cover is a chief component of
global change with a superior effect than that of climate change. Causes of such fluxes are
natural as well as anthropogenic or a combination of the two. Escalating land use changes at the
price of rapid rates of deforestation in the tropics are leading to drastic alterations in the
chemical, physical, and biological distinctiveness of ecosystems in the tropics. Land use changes
Chapter Four: Spatial Temporal Variations
87
lessen the magnitude of natural habitats for instance forests and their structural assortments
resulting in manifold ecological impacts. The ecological impacts of large scale forest decrease
include loss of biodiversity (Shukla, 1990), soil conditions degradation (Buschbacher, Hull &
Serano, 1988) and balance changes of greenhouse gases within the biosphere, which may in turn
accelerate climate change (Dale et al., 2001).
As a result of increasing appreciation of the impacts of global land cover change, the
presence of timely and consistent Land Use Land Cover (LULC) information is becoming much
significant than ever in sustaining decision making mechanisms at different levels, both within
and across countries (Foley et al., 2005). Increasing global environmental change and an added
prominence on sustainable development (Bradley & Mustard, 2005; Leitao & Ahren, 2002)
suggest that spatial data will play a principal role in altering existing environmental patterns
through relevant policy formulation and implementation. Jansen and Gregorio (2002) submit that
land cover data form a central base for a number of applications; including rangeland and forest
monitoring, figures for investment and planning, conservation of biodiversity, desertification
monitoring and climate change assessment.
Although spatial data are significant in the process of managing resources and decision
making, there is still no widespread land cover information at global and local scales (Chandra,
2005). The situation is graver in developing countries where there is inadequacy and
unavailability of data due to the time consuming and costly nature of processing these data
(Richard & Haack, 1996). This has been as a result of infrastructural limitations, civil and
military instability; inexistence of trained manpower, equipment or finance to collect information
in the right way; or fast changes in the resource foundation not detectable by conventional data
collection methods (Defries & Townshend, 1999). However, with extensive application of data
Chapter Four: Spatial Temporal Variations
88
on land cover, the availability of data is being assisted by improving technologies in geographic
information systems and remote sensing.
3.1. Forest resources
The Global Forest Resources Assessment (GFRA) 2005 stresses that forest area
represents the first indication of the virtual importance of forests in a nation or region (FAO,
2006), while an approximation of forest area alteration over time provides an indication of the
need for land other uses, and may provide pointers to possible major environmental instability in
forest ecosystems. Forest area is comparatively easy to measure, and this variable has been
selected as one of the 48 pointers for monitoring progress in realization of the Millennium
Development Goals provided by the United Nations (Goal 7 – Enhancing environmental
sustainability). Information on the status of and patterns in area of forest are essential to
decisions related to land-use and forest policies and allocations, the health and potency of forests
and their socio-economic and ecological values and functions.
Watershed dilapidation has led to a larger recognition of the abundant ways in which
watersheds support human welfare through ecosystem provisioning and, consequently, to greater
worth being placed on them (Hamilton et al., 2008). These services can include provision of
freshwater for a range of uses, regulation of sediment and water flows, and preservation of
natural flow systems that support complete ecosystems. Pandey (2005) notes that those
populations depending on forests constantly contribute to species destruction by overexploiting
forest generations in the absence of alternative livelihood options and that it is essential to
involve local populations and work from their knowledge base towards conservation and
management of biodiversity.
Chapter Four: Spatial Temporal Variations
89
3.2. Land use and land cover
Land use and land cover are routinely used interchangeably in many change detection
studies (Seto et al., 2002). Land use is used to refer to the human utilization of the land, or the
instant actions modifying land cover (Bradley & Mustard, 2005; Meyer & Turner, 1992). Land
use can consist of mixed land covers; and it is conceptual model constituting a merger of social,
cultural, economic and strategy factors which have diminutive physical magnitude with the
respect to reflectance asset, and hence has restricted relationship to remote sensing (Rogan &
Treitz, 2004). Again, land cover refers to the vegetation type that exemplify a particular place, or
the real distribution of vegetation, deserts, ice and other material features of the land, including
those created by human actions (Meyer & Turner, 1992). According to Jansen and Cihlar (2001),
land cover is made up of the biophysical features of the terrestrial environment, characteristically
based on a categorization system consisting of distinct classes and formulated for a precise
purpose. Land use however refers to the mode in which these biophysical assets are used and the
intent with which particular lands cover was formed.
Ecosystems are continuously transforming; leading to adjustments in the surface
constituent of vegetation cover and substantive spatial progress of a vegetation bodies over time
(Coppin et al., 2004). In addition, land cover changes are frequently conceived as plain and
permanent conversion from one form to another (Mertens & Lambin, 2000). Dissimilarity has
however been made between land cover alteration and land cover adjustment; with the former
referring to the entire replacement of land cover with another and the latter signifying the more
understated changes that affect the makeup of land cover without changing its general
classification (Coppin, 2004; Meyer & Turner, 1992). Land cover modification is more rampant
than land cover conversion and both can be human induced or of ordinary origin.
Chapter Four: Spatial Temporal Variations
90
3.3. Sources and effects of change
The pace of change can either be remarkable as exemplified by fire; or on going, such as
biomass amassing (Coppin et al., 2004). Correspondingly, land cover changes are usually viewed
as non-constant in space, leading to compound landscape mosaics and mixtures of cover modes
(Mertens & Lambin, 2000). Land cover changes are so pervasive that, when collected globally,
they extensively affect key structures of the Earth systems (Lambin et al., 2001; Lambin et al.,
2003). Land cover has a large influence on many crucial environmental processes and as a result
any transformation in it can have marked effect on the environment at home to global scales.
Anxiety about LULC change came up on research agenda on global environmental alteration
several decades ago with the realization that land processes persuades climate. In the 1970s it
was largely renowned that land cover change modifies facade albedo and thus causing surface-
atmosphere vigor exchange; while in the 1980s, terrestrial ecosystems as sinks of carbon were
highlighted (Lambin et al., 2001).
It is broadly recognized today that land cover transformation causes soil erosion and
amplifies surface run off and flooding, climate change and carbon dioxide concentration
(Lambin et al., 2003). Land cover variation contributes radically to earth-atmosphere exchanges
and loss in biodiversity, it is a foremost factor in sustainable development and human reactions
to global change, and its measurement is essential for incorporated modelling and measurement
of environmental problems in general (Turner et al., 2004). Land cover changes have, for
example, important influences on water and climatic systems that impact notably on global
biogeochemical movements (Boyd, 2002) and biodiversity loss (Mas, 2004). LULC changes also
establish, in part the susceptibility of places and people to economic, climatic or socio-political
perturbations (Lambin et al., 2003).
Chapter Four: Spatial Temporal Variations
91
The current emphasis on sustainable development provides the impetus for monitoring
and assessing the process of change in land cover. Existing data play an important function at
regional and global level in the designing and implementation of policies (Turner et al., 2004).
These policies are aimed at realizing sustainable resource utilization, reverting depressing
environmental conditions, conserving biodiversity and endangered species and promoting
biological continuity threatened by growing human population and rising of human activities.
However, land cover change is still feebly documented at present (Meyer & Turner, 1992) but
since the International Geosphere-Biosphere Program identified it as the heart of the field of
study, it has claimed wider attention from a range of scholars internationally (Xu et al., 2002).
3.4. Predicting change
In order to comprehend and predict the change procedure, one needs to observe and
characterize spatial trends of LULC transformations (Petit, 2001). While the study of land cover
modification is inclusive of description and classification of land changes, observance of change,
and mechanism of motivating forces, the definitive goal of scientists is to construct models that
can be used to predict changes and their effects (Xu et al., 2002). As noted before, an assortment
of methods of LULC study have been generated and applied, such as remote sensing, GIS, and
statistical schemes (Xu et al., 2000).
Traditionally LULC analysis has been anchored on aerial photography and ground
surveys (Mas, 2004; Richard & Haack 1996). These methods are often complicated, time
consuming and pricey. Nevertheless, due to their high resolution, and ease of access, aerial
photographs remain an important tool in surveying and mapping of resources (Arnberg &
Sebego, 2002). Field studies on the other hand permit the observation and description of the
course of land cover even though they are not satisfactory in amassing and analysing spatial-
Chapter Four: Spatial Temporal Variations
92
temporal trends of LULC at a summative stage (Petit et al., 2001). According to Defries and
Townshend (1999), assessment of land cover data from ground cover sources have demonstrated
substantial divergences. This is a situation where diverse datasets of the same place show
different geographical phenomena at the same position in space. The inconsistencies result from
differing definitions and categorization of cover types, conflicting interpretation of land cover
designations, perplexity between natural and human modified vegetation, and the actual
incongruity about the geographical coverage of types of land cover (Defries & Townsend, 1999).
Furthermore, field studies alone cannot make available predictions of future trends of
change. As a result, remote sensing became a key method in LULC monitoring (Cobly &
Keating, 1998; Collins & Woodcock, 1996; Petit et al., 2001). Since the launching of the first
1972 satellite (Richard, 1996; Defries & Townshend, 1999), remote sensing through space borne
technologies has been providing critical data for the analysis of regional and global terrestrial
cover (Petit et al., 2001). Remote sensing has also provided a substitute method of land cover
change detection with the benefit of capabilities of great regional to global coverage, elevated
spatial and temporal resolution and ease in access (Jansen & Gregorio, 2003). As analysed by
Defries and Townshend (1999), space borne data offer the basis for geographically referenced
world land cover categorization that is reliable, replicable over time, and potentially more
dependable than ground sources. The use of satellite data for mapping land cover at a great scale
commenced with African regional studies (Turker, 2000) and in southern parts America
(Townshend et al., 1987) and became a primary source for both inert depictions of land cover
and recognition of land cover change.
As natural and human made landscapes are complex and in a state of unrest, it is
imperative that these changes are documented and comprehended (Coppin et al., 2004). Remote
Chapter Four: Spatial Temporal Variations
93
sensing and field methods have been used in the study of LULC, and in a wider sense, for the
quest of both biophysical and anthropogenic features. Remote sensing has also become more
valuable due to ability to cover extensive areas, high spatial and temporal resolution and
inexpensive accessibility of remote sensing information (Collins & Woodcock, 1996).
3.5. Digital change detection
Digital change detection pertains to the systematic stages from acquiring images to pre-
processing, then classification and finally, change detection. Conventionally, this type of remote
sensing started in the early 1960s with feeble analysis of wide-spectral scanner data and digitized
aerial images (Lillesand et al., 2004), and since the introduction of Landsat-1 in 1972, image
processing has seen remarkable growth to date. The whole development from acquiring data to
the final obtaining of the intended information involves assorted steps and every juncture is
important as it can have considerable impacts on the ultimate results. Successful carrying out of
change detection analysis using the technology of remote sensing requires careful determination
of the sensor, environmental attributes and image processing modes (Lu et al., 2003); and a
malfunctioning to understand the effects of these parameters can lead to erroneous results.
3.6. Data acquisition and pre-processing
Data should be acquired from a sensor that obtains data at roughly the same time of day,
and on centennial dates. Same date images eradicate diurnal angle of the sun effects while
centennial dates images reduces the influence of cyclic sun-angle and phonological
dissimilarities (Jensen, 2005). Unprocessed digital images frequently have some arithmetical
distortions due to variations in the attitude, altitude, atmospheric refraction, earth curvature,
relief displacement, and nonlinearities in the brush off of a sensor (Lillesand et al., 2004). These
discrepancies should be corrected to make certain the accuracy of the eventual results.
Chapter Four: Spatial Temporal Variations
94
Atmosphere impacts on the radiance received by the sensor by dispersion, refracting,
absorbing light; and modification for these effects, as well as for sensor additions and offsets,
lack of solar radiance and solar zenith angles are important. These must be inputted in the in
radiometric rectifications procedure that are used to translate satellite document digital counts to
ground transmissions (Chavez, 1996). Using multi-date image satellite datasets calls for
obtaining sensors at different times are analogous in terms of radiometric distinctiveness (Mas,
2004). Adaptation of digital figures and surface reflectance is a prerequisite for any quantitative
analysis of wide-temporal images; and some methods like Dark Object Subtraction (DOS),
comparative calibration and second imitation of the satellite indicator in the solar spectrum have
been developed for atmospheric moderation (Lillesand et al., 2004).
3.7. Image enhancement
The main target of image enhancement is promoting visual multi-pretability of an image
by ever-increasing the obvious distinction between materials in the panorama (Lillesand et al.,
2004). This makes certain that features emerge clear and increases the capacity to make out
diverse features. Different methods are used in image enhancement with the inclusion of
principal mechanism analysis methods, for example Kauth-Thomas models and vegetation index
(Jensen, 2005; Lillesand et al., 2004).
3.8. Principal components analysis
Principal apparatus analysis is a method that converts the inventive remotely sensed data
into substantially diminutive and easier to understand set of inconsistent variables that
correspond to most of the information existing in the original data (Jensen, 2005). Major
components analysis is as a result a data compression method which allows outmoded data to be
compacted into fewer bundles. It is a straight transformation which coordinates multivariate data
Chapter Four: Spatial Temporal Variations
95
by converting and /or revolving the axes of the original characteristic space, so that the data can
be shown without correlation in new space aspects (Lasaponara, 2006).
3.9. Spectral vegetation indices
These are extensive, radiometric scales that show comparative abundance and bustle of
green vegetation (Jensen, 2005). These indices are used to create eventual images by
mathematically bringing together Digital Numbers (DN) ideals of unlike bands; and usually use
the converse relationship between the red and the almost-infrared associated reflectance with the
vigorous green vegetation. SVIs utilize the acknowledged attribute shape of the green spectrum
by putting together the low reflectance in the noticeable element of the spectrum with the
elevated reflectance in the partially infrared (Rendeaux et al., 1996). These vegetation indices
operate by complementary strong chlorophyll pigment incorporation in the red in opposition to
the high reflectivity of plant substances in the NIR (Elvidge & Chen, 1995).
The indices have been classified into two components; orthogonal and ratio based indices
(Lawrence & Ripple, 1998). In Ratio based vegetation index, there is Simple Ratio (SR),
Normalized Difference Vegetation Index (NDVI), and other modified editions of NDVI intended
to address its fragility to factors such as soil changes and atmospheric patterns (Lawrence &
Ripple, 1998). Orthogonal vegetation indices depend on being linear in the spectral space
through which bare soils of varying brightness shall lie, together with the Kauth-Thomas model
being the most used.
3.10. Image classification
Wide-spectral image classification is the practice of organizing out pixels to limited
numbers or classes based on the information file attributes. The core objective of image
Chapter Four: Spatial Temporal Variations
96
categorization procedures is to classify all the values of pixels in an image into terrestrial cover
groupings or themes (Lillesand et al., 2004). The goal of image pixel cataloguing is premised on
the fact that diverse features have varying reflectance. The sorting process pertains to pattern
acknowledgment in the image, with spectral trend considered as more proficient scientifically,
though temporal and spatial trend recognitions can be utilized too.
Supervised and unsupervised categorization models are the most extensively used
classification models. Supervised and unsupervised algorithms normally use hard classification
logic to produce a category map that is made up of hard distinct classes (Jensen, 2005). Before
sorting is carried out, the specific goal classes needs to be identified. This calls for the use of a
scheme made up of taxonomically correct descriptions of groups of information organized
according to logical criterion (Jensen, 2005). Homogeneous classification systems have been
developed and used by different researchers to aid in classify land cover classes. The main
function of standardization of arrangement schemes is to ensure standardization, and
compatibility of different research works with soaring degree of precision.
Supervised classification constantly requires a preceding knowledge of the study area to
make certain selection of the training points. According to Jensen (2005), when using a
supervised groupings, the identity and position of some of the land cover types are identified
through a combination of interpretation of aerial photographs, field work, map analysis and
individual experience. Sites for training spectral distinctiveness are used in preparing the
algorithms for the land cover mapping of the image.
Chapter Four: Spatial Temporal Variations
97
3.11. Accuracy assessment
The need for testing accuracy of spatial data from remote sensing methods and used in
GIS investigation has been renowned as a critical component of countless projects (Congation &
Green, 1993). Congation and Green (1991) emphasise that if the output of remote sensing data is
to be used in decision-making process, then significant quantities of its values must be known.
The most widespread accuracy measurement of elements includes general accuracy, producer‟s
precision, user‟s exactness and kappa equation (Lu et al., 2003).
One of the most universal methods of expressing categorization precision is the
preparation of a classification fault milieu (Lillesand et al., 2004). A fault matrix is an assortment
of numbers set in columns and rows that express the number of trial units assigned to a
scrupulous category in one classification comparative to some of sample units assigned to a
given category in another organization (Congation & Green, 1991). The fault matrices relate, on
a category by category foundation, the relationship between acknowledged reference data and
the corresponding results of the mechanized classification. The matrix is able to recognize
exclusion and commission errors in the categorization as well as the producer‟s and the user‟s
precision.
4. CHANGE DETECTION METHODS
Digital adjustment detection involves the quantification of temporal events from multi-
date imagery that is commonly acquired by satellite multi-spectral sensors and detectors (Coppin
et al., 2004). In general, change detection pertains to the appliance of multi-temporal data
information to substantially analyse the temporal impacts of the events (Lu et al., 2003).
Chapter Four: Spatial Temporal Variations
98
Preceding literature has revealed that image variation, major component analysis and
classification relations are the most widespread methods used for terrestrial change detection.
Change detection modes have been classified generally into image geometric, alteration and
classification. The algebra class includes differencing of images, image waning, image rotating,
plant life index differencing, transformation vector analysis and backdrop subtraction. These
methods involve calculation of two or more images of about similar radiometric characteristics;
where subtraction led to both positive and negative standards in areas of change and absolute
values in areas of no little variation (Green et al., 1998)
4.1. Image differencing
In this technique, spatially referenced images obtained at varying times are subtracted to
create a lasting image which stands for the change between dates (Mas, 2004). This would lead
to datasets with values representing change area and nil without change (Coppin et al., 2004).
Making use of an 8-bit image, the prospective range of differences vary from - 255 to 255. In the
algebra change detection class, image differencing is commonly practiced. Noticeable red band
image differencing has proven to be appropriate for change detection in harsh environments, but
it is not apparent this is true in environments such as wet tropical regions.
4.2. Vegetation index differencing
This technique involves eliminating parts of images which have been transformed to the
various vegetation indices for varying dates in the study. The foremost benefit of vegetation
index differencing is that differences in the spectra provide indicators of physical effects (Lu et
al., 2003).
Chapter Four: Spatial Temporal Variations
99
4.3. Principal components analysis (PCA)
PCA comprises of two referenced images to form a new multiband image consisting of
bands from date to date (Lillesand et al., 2004). The chief advantage of these variations is to
enhance data absoluteness and insisting diverse information in the derived mechanisms. Later, a
PCA based on variance matrices or a homogeneous PCA based on examination of connection
matrices can then be conducted.
4.4. Post-classification comparison
Post-categorization analysis is common of these techniques and it comprises of
autonomously produced spectral results from various ends of time intervals, followed by a
segment by segment relation to detect land cover change (Coppin et al., 2004). Besides, the
arithmetic which is applied on the categorized images to establish those pixels with a variation
between the two dates, figures can be brought together to convey the exact nature of terrestrial
changes between two satellite images (Lillesand et al., 2004). An advantage of these techniques
lies in the fact that the images are disjointedly classified hence minimizes the problem of
radiometric labelling between dates. However, the precision of post categorization assessment
depends on the accurateness of original image classification. Improper classification and
registration errors that may exist in the unique images are composite and the results realized
using post categorization relations are regularly judged as inadequate (Coppin et al., 2004).
5. GLOBAL TRENDS
Land cover change is probably the most exceptional form of global change in
environment since it occurs at temporal and spatial scales directly applicable to our daily
survival. The changes in land use, particularly when joined with climate change and variability,
Chapter Four: Spatial Temporal Variations
100
could impact on ecosystems and natural resources in complex ways. Over an extended period,
almost 1.1 million km2 of woodland and forest and 5.4 million km
2 of pasture and grassland have
been transformed to other utilities in the recent centuries. According to Foley et al. (2005),
during this duration, cropland has expanded by 10 million km2. Humans have transformed
massive parcels of the Earth‟s surface: 10 to 15% presently is conquered by urban-industrial and
agriculture areas (Vitouseket al., 1997).
Climate inconsistencies have transformed land use practices in different parts of the
world, highlighting differences in societal susceptibility and pliability. Research on land use and
climate change requires the development of new models connecting the geophysics of climate
with the socioeconomic drivers of land use (IPCC, 2007). Given a scientific understanding of
the progression of land use change, the impacts of different land use decisions, and how they will
be convoluted by a changing climate and increasing climate variability becomes an area of
concern for research (IPCC, 2000). This research element should provide the scientific
foundation for land use decision-making and projections of future land use, as well as substantial
benefits beyond climate change evaluation and alleviation by supporting a wide collection of
issues significant to public users of this information.
Changing land use patterns or transformations, motivated by a multiplicity of socio-
economic causes, often lead to land cover changes that affects biodiversity, global temperatures,
greenhouse gases accumulation and emissions, water budgets and other bio-geophysiochemical
processes (Meyer & Turner, 1994). Other than anthropogenic factors, natural phenomena also
affect or alter land cover. Natural events such as weather and climatic fluctuations, epitomized in
flooding, wild fires and ecosystem changes, may also pioneer adjustments on land cover
(Honnay et al., 2002). Globally, however, land cover is altered primarily via anthropogenic uses
Chapter Four: Spatial Temporal Variations
101
such as: suburban construction and development, agriculture and livestock raising, forest
resources harvesting and management. There are also subsidiary impacts on land cover from
other human activities such as forest and lakes damaged by acid rain from fossil fuel combustion
and crops near cities damaged by tropospheric ozone as a result of automobile exhaust (Meyer,
1995).
Ground methods of land cover and land use mapping are often not financially feasible,
time consuming, and labour demanding, with results in them rarely being done with maps and
soon become obsolete (Foley et al., 2005). Monitoring changes and time series analysis are
difficult when using conventional methods of surveying (Olorunfemi, 1983). However, as noted
previously, satellite remote sensing techniques have been developed which have proved to be of
great significance in the preparation of accurate land cover and land use measures for
monitoring at any selected temporal scale, and these techniques have become the most cost- and
time-effective basis for acquiring data worldwide (Seto et al., 2002).
6. CONDITIONS AND TRENDS IN KENYA
The area of land in Kenya is about 582,646 km2 with roughly 80% being semi-arid and
arid lands. These areas receive less than 700 mm of rain each year. The country is further
ramified into agro-climatic zones by the use of a humidity indicator (Sombroek et al., 1982).
This index utilized is rainfall done annually expressed as a percentage of possible evaporation.
Some areas with less than 50% index have a high agricultural prospective and are classified into
three zones. These are about 12% of Kenya‟s terrestrial area. Partially-humid to dry regions have
humidity index of less than fifty per cent. These are grouped into zones of 1 to 4. They are
Chapter Four: Spatial Temporal Variations
102
commonly known as savannah lands and are about 88% of the land area of Kenya (de Leeuw et
al., 1991).
Approximately eighty percent of Kenya‟s (about 40 million) population is therefore
saturated in only ten per cent of the land that is moderate and high-productive agricultural land
surface (Rutten, 1992). Kenya‟s economy is mainly agricultural driven and over 70% of Kenyans
are involved in some subsistence and/or profit-making agricultural practices. Hence, a good
amount of the country‟s land is being used for agricultural activity relative to other countries.
The quantity and quality of land at hand for rain-based agriculture is quite low. And the
allocation of land between land owners is highly tampered with (Emerton et al., 2001).
Land shortage in Kenya can be accredited to, i) constraints in climate, ii) soaring gini-
coefficient levels, and iii) insufficiency of non-agricultural alternatives for the populace and task
force. The reaction of the agricultural segment has been expected: growth into the arid and semi-
arid regions (ASAL) where there is low population pressure. Draining and irrigation of the not
many wetlands in these insignificant areas have to some extend been the major coordinating
actions resulting to the development of agriculture into these ASALs. Major results of this
reaction include expansion, irrigation of arid and semi-arid lands, and drainage of wetlands,
agriculture along deltas and riverbanks, and transformation of forest into farmland.
6.1. Land use change and spatial temporal variations in Kenya
In Kenya, land has varied meanings according to diverse people: To pastoralists and
farmers, land is property to be owned and a basis of livelihood and accessing it is a major
concern (Orodho, 1997). The influential deem land as a marketable item from which to make
profits via market conjecture mechanisms (Ojang‟ & Ogendo, 1973). Often, administrators and
Chapter Four: Spatial Temporal Variations
103
politicians view land as a valuable entity whose boundaries echo a social, political and cultural
identity (Ntsebeza, 2005). To agencies involved in development, land offers goods and services
needed for people's wellbeing and opulence. These views roughly decode into different, and
habitually competing, land needs in Kenya. No sole definition can sufficiently reflect the
differing perceptions.
Natural resources vary in quantity and quality across time. The chief land-cover types
within Kenya are savannahs, forests, wetlands, saline and fresh water bodies, deserts and
grasslands. These are utilized for pastoralism, agriculture, mining, communications, nature
reserves, water catchments, rural and urban settlements, recreation tourism and industry. Others
include fishing, cultural sites, energy and forestry (Sombroek et al., 1982). Of the overall land
cover, approximately two per cent is under native and exotic forests. Almost twelve per cent of
the land has high rainfall maintaining the production of coffee, tea, pyrethrum, floriculture and
horticulture, and subsistence crops such as wheat, maize, potatoes, dairy farming and pulses. The
arid and semi-arid area covering approximately thirty two per cent of rainfall and supports varied
livestock and crop rearing. Irrigated agriculture of flowers has in the latest past come up as a
chief type of land use besides agro-pastoralism. Above fifty per cent of the overall land cover is
arid or semi-arid with tremendously low and unreliable rainfall. Extensive use is made of land
for widespread nomadic systems and livestock production (Sombroek et al., 1982).
Some portions of the country have restricted mineral capacity. Others have been
preserved for industrialization and urbanization. Saline and fresh water bodies sustain the fishing
industry. Deplorably, they are also utilized for waste sites for industrial and urban waste. Rivers
are the main source of electric power upstream while the junior parts of the key rivers have made
irrigated agriculture possible. The unreserved grasslands and savannahs are home to wildlife
Chapter Four: Spatial Temporal Variations
104
conservation and livestock production, but have become a major focus for advancement in dry-
land farming (Government of Kenya / UNEP, 1997).
6.2. Land use change and forest resources
The areas under forests in Kenya are about 2.3 million hectares of which 1.60 million
hectares are gazetted. The non-gazetted land area which is about 0.76 million hectares is ramified
into about three hundred units of forests. Forty percent of the units lie on about 100 hectares. The
tight canopy of native and alien forest species lies on approximately 1.20 million hectares;
plantations stretch to about 0.16 million hectares (Government of Kenya, 1999a). Congested
canopy forests without the gazetted forest reserves extends to about 0.18 million hectares. The
Kenyan government has anticipated a further 0.5 million hectares through gazettement and
afforestation.
The cover of Kenyan forests has differed across space and time. In 1897 the only
officially recognised forest area was the „Wood Strip of the Akamba‟ that extends about 2 miles
on every side of the railway line in Uganda. The strip was founded on the umbrella of the
„Akamba Forests and Woods Regulations‟. By 1932, forty-two different forests had been
allocated as government areas of forests which went up to about 1.05 million hectares later in
1940 (IUCN, 1998). During the time of independence documented forests were about 1.8 million
hectares that represents 3.5% of the overall area of land. A survey done aerially in the year 2000
evinces that these group of forests have reduced considerably (Kenya Forest Working
Group/East African Wildlife Society, 2001). A number of native and exotic forests exist in the
highlands of Central Kenya where there is high rainfall, fertile soils and limited human
settlements. In the arid and semi-arid regions (ASALs), forests exist in isolated mountain ranges
and in thin bands adjacent to rivers.
Chapter Four: Spatial Temporal Variations
105
6.3. Land use and forest depletion in Kenya
In spite of the fact that many Kenyans have become responsive to the aesthetic,
environmental, and commercial worth of forests, thick-canopy forests have been degraded
(Government of Kenya, 1999a). By the year 1981, a total forest record showed a number of
documented and non-documented areas in threat of expurgation. Over a period of about 20 years
forested areas have been reduced by 16%.The directory of endangered forests includes the
Karura and Ngong Forests. Earlier forest degrading was the result of an effort by the government
to make room for agriculture and also to create homes for the landless. A decrease in the pace of
depletion of forests in the mid and early 1970s from about 18% to approximately 6% per year
was the result of local efforts conservation efforts complemented by those of the global
community (Matiru, 1999).
Clearing of forests has been an ecologically and spatially distinguished process changing
across time and reflected the comparative power and the capability of various groups to find
access into Kenya‟s forest resources (Emerton & Karanja, (2001). Between the years 1990 and
1995, the cover of forests changed by 17%, mainly as a result of the settlement of landless
people. Systematic analyses also show that a number of blocks of forests were illegally acquired
by the then land owners (Akotsi et al., 2006). Recently the decrease of forests through removal,
pressures in population and change in climate is approximately at about to 5,000 hectares
annually, while depletion through forest excisions and fires is estimated at almost 15,000
hectares each year (Government of Kenya, 1999a).
Chapter Four: Spatial Temporal Variations
106
6.4. The case of Nandi County, Nandi Forests
Land cover change detection and its variations are required so as to comprehend global
change in environment. Of deep interests are the impacts of rain forest in the tropics
ramifications which changes due to the extent and strength. The growth in ramification is related
either to human or natural sources (Geist & Lambin, 2001). Both biodiversity influences are
immensely important in the tropics (Gaston & Blackburn, 2000). The activities of the East
African BIOTA are presently concentrating on the Nandi Forest and its fragments (Kohler,
2004). Retrieval of information about land cover change and therefore forest ramification and
disturbance is conducted for the larger area of Nandi Forest and connected areas of forests. Here,
the findings from satellite data form a chief contribution of processing spatial-information for
registering man-made influences on these forests through time. The various ecological and/or
biological subprojects of East African BIOTA allow investigation of local variations in
ecosystems and biodiversity in relation to global environmental change (Kohler, 2004).
The forests of the Nandi District are on an escarpment of between 200m and 300m in
elevation. Recently, there has been a continuous debate on whether such islands of forests would
have become a wider area of forest if not they have been owned and managed by the Guinean
Congo rain forest (Kokwaro, 1988). These forests exist in one of the earth‟s most populated rural
settings (Blackett, 1994) with an average population density of 600 per km2on land which is
vigorously used for home-based agriculture. The forest reserves play a significant role in
providing for their basic needs of local people such as building material and firewood (Kokwaro,
1988). An increase in illegal and legal activities since colonial times in the early 20th century to
date have led to forest depletion and have resulted in only relatively small patches of compact
Chapter Four: Spatial Temporal Variations
107
forests are remaining, with the much tampered with Nandi Forest deemed to have decreased to
only about 120 km² by the year 1980 (Kokwaro, 1988).
7. CHAPTER SUMMARY
This chapter highlighted on the spatial temporal changes in land use in a couple of
aspects including land use and land use change, and approaches in estimation of land use change.
GIS and Remote Sensing mechanism have also been reviewed and a situational assessment of the
Nandi Hills Forests has also been highlighted on; based on previously undertaken studies. The
next chapter continues to elaborate on the study area.
Chapter Five: Area of Study
108
CHAPTER FIVE
AREA OF STUDY
1. INTRODUCTION
This chapter presents the area of study. It covers aspects of the physical, ecological,
economic and the social aspects of the Nandi Hills Forests, and draws attention to details of the
locality in which the research was done.
2. PHYSICAL ASPECTS
This subsection discusses the location, extent, topography, drainage, geology, soils and
climatic characteristics of the study area, namely the Nandi Hills, Nandi North and Nandi South
Forests.
2.1. Location and extent
2.1.1. Nandi North Forest
The Nandi North forest is located within Nandi North District of the western parts of the
Rift Valley Province of Kenya. This forest lies on the edge of the Nandi escarpment about 5 km
East of the Kakamega Forest. It stretches for more than 30 km from North to South and is no
more than 5 km wide for most of its length. The forest is centred on coordinates: 00 20‟N and 35
0
0‟ E with an approximate area of 10,500 Ha (BirdLife International, 2011).
Chapter Five: Area of Study
109
2.1.2. Nandi South Forest
The Nandi South forest falls within the Nandi South District which was carved out of the
greater Nandi in 2003. This area is a mid-elevation forest lying just west of Kapsabet town and
south of the main Kapsabet-Kaimosi road. South Nandi was once continuous with Kakamega
forest and the two forests are still no more than a few kilometres apart at their closest points. The
South Nandi Forest has an average area of 18000 ha and is centred on coordinates 00 8‟ S and
350 0‟ E (Nature Kenya, 2009).
2.1.3. Nandi Hills
Nandi Hills is a highland area of lush green rolling hills at the edge of the Great Rift
Valley in the former Rift Valley Province of Kenya and is part of the once extensive Nandi
South Forest.
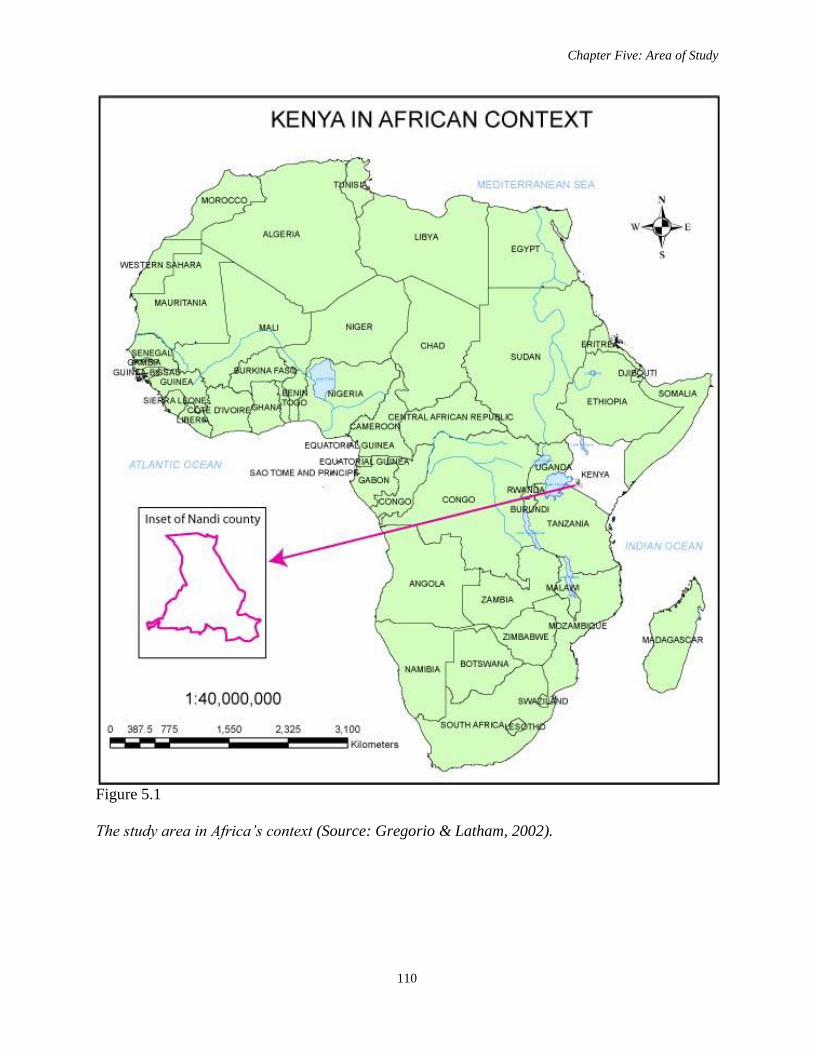
Chapter Five: Area of Study
110
Figure 5.1
The study area in Africa’s context (Source: Gregorio & Latham, 2002).
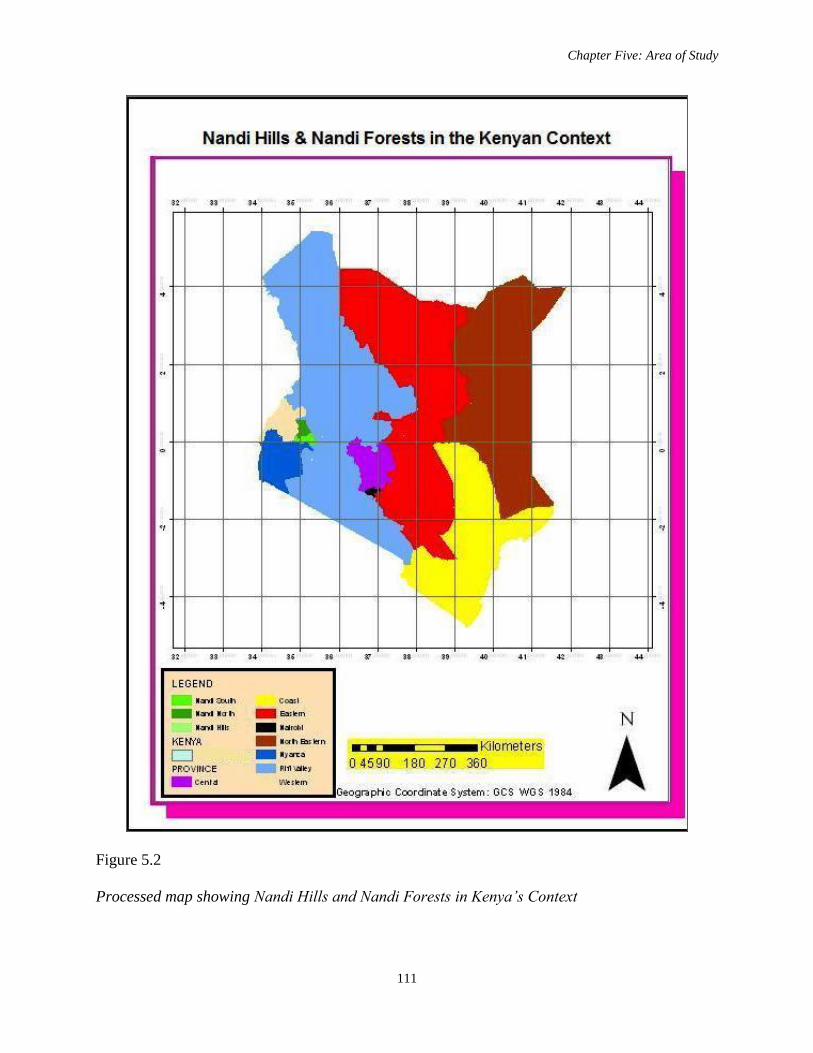
Chapter Five: Area of Study
111
Figure 5.2
Processed map showing Nandi Hills and Nandi Forests in Kenya’s Context
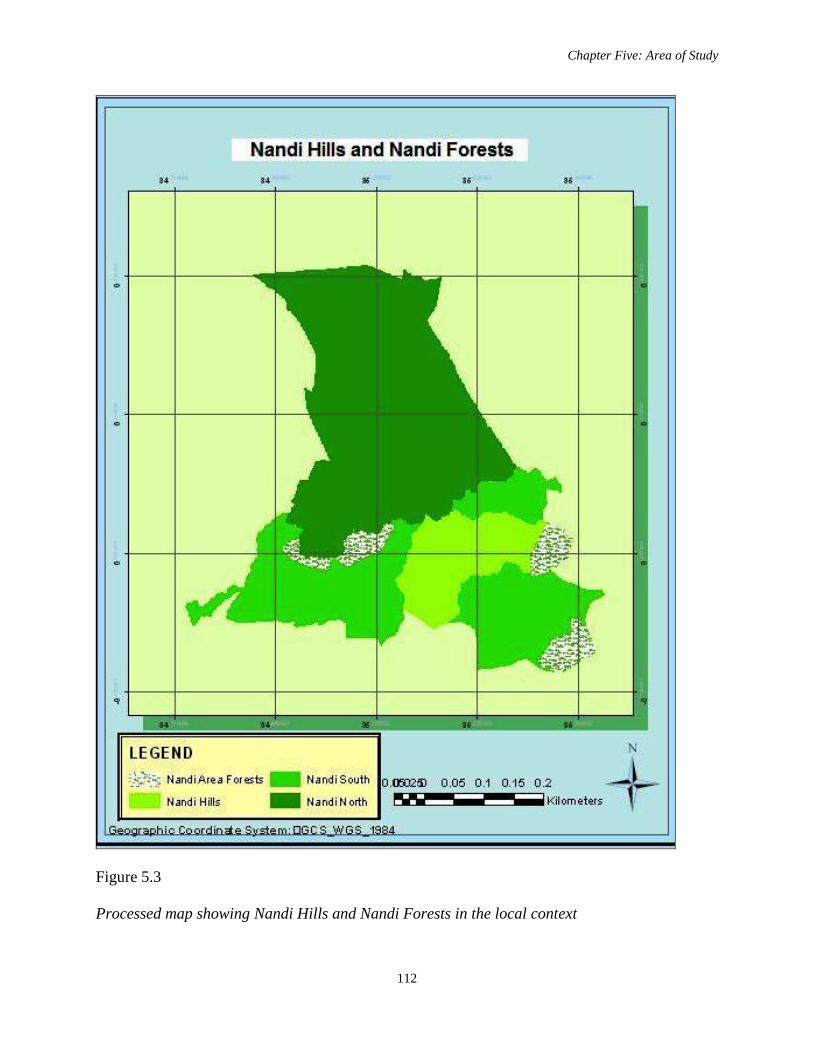
Chapter Five: Area of Study
112
Figure 5.3
Processed map showing Nandi Hills and Nandi Forests in the local context
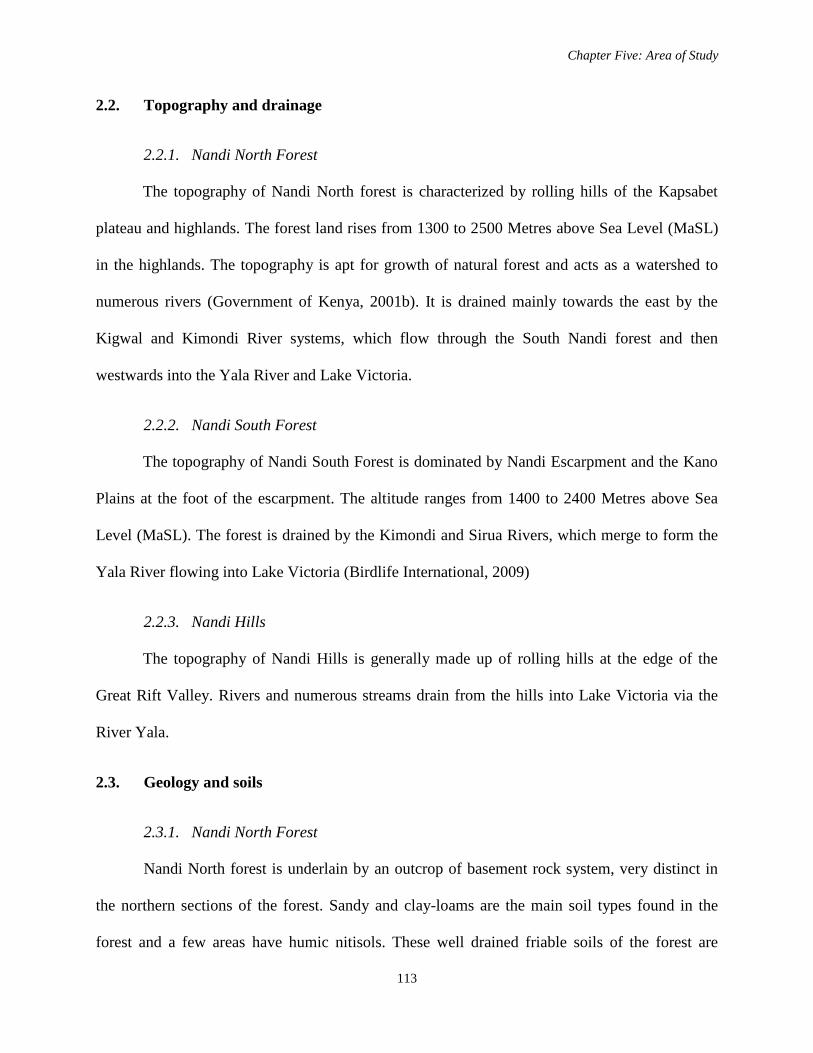
Chapter Five: Area of Study
113
2.2. Topography and drainage
2.2.1. Nandi North Forest
The topography of Nandi North forest is characterized by rolling hills of the Kapsabet
plateau and highlands. The forest land rises from 1300 to 2500 Metres above Sea Level (MaSL)
in the highlands. The topography is apt for growth of natural forest and acts as a watershed to
numerous rivers (Government of Kenya, 2001b). It is drained mainly towards the east by the
Kigwal and Kimondi River systems, which flow through the South Nandi forest and then
westwards into the Yala River and Lake Victoria.
2.2.2. Nandi South Forest
The topography of Nandi South Forest is dominated by Nandi Escarpment and the Kano
Plains at the foot of the escarpment. The altitude ranges from 1400 to 2400 Metres above Sea
Level (MaSL). The forest is drained by the Kimondi and Sirua Rivers, which merge to form the
Yala River flowing into Lake Victoria (Birdlife International, 2009)
2.2.3. Nandi Hills
The topography of Nandi Hills is generally made up of rolling hills at the edge of the
Great Rift Valley. Rivers and numerous streams drain from the hills into Lake Victoria via the
River Yala.
2.3. Geology and soils
2.3.1. Nandi North Forest
Nandi North forest is underlain by an outcrop of basement rock system, very distinct in
the northern sections of the forest. Sandy and clay-loams are the main soil types found in the
forest and a few areas have humic nitisols. These well drained friable soils of the forest are
Chapter Five: Area of Study
114
derived from undifferentiated basement system rocks and are moderately fertile and are generally
suitable for production of various crops. Other regions like Ngecheck are rocky (Government of
Kenya, 2001b)
2.3.2. Nandi South Forest
Nandi South Forest‟s landscape is gently undulating and underlain by granitic and
basement complex rocks, which weather to give deep, well-drained, moderately fertile soils
characterized by traces of rugged hills with shallow fragile soils the soils that are generally clay
loam (Government of Kenya, 2001b)
2.3.3. Nandi Hills
The Nandi Hills is characterized by volcanic rocks that have given the soils in the area a
volcanic soils signature. These volcanic soils are well drained and are very fertile thus good for
agriculture. This has been the reason for clearance of forest cover to create more land for
agriculture.
2.4. Climate
2.4.1. Nandi North Forest
The Nandi North Forest has a cool and moderately wet climate. It receives a mean
rainfall of an average of 1500mm per year. The rainfall is bimodal with dry spells experienced
between December and March. The distribution of rainfall is affected by topography and the
south-westerly winds from Lake Victoria. The temperature within and around the forest ranges
from between 18-250C
Chapter Five: Area of Study
115
2.4.2. Nandi South Forest:
The Nandi South Forest on the other hand receives higher precipitation which varies
between 1,600-1,900 mm per year and is dependent on altitude. The month of March marks the
onset of rains which continues to November with no clear cut distinction between the long and
short rains. The area experiences average temperature range of 18-250C.
2.4.3. Nandi Hills
The Nandi Hills section of the study area has a cool and wet climate that is highly
influenced by the hilly terrain. There are two rainy seasons during the equinoxes and the
temperatures vary between 180C and 24
0C.
3. ECOLOGICAL ASPECTS
This subsection gives an overview of the ecological situation in the Nandi Hills and
Nandi Forest. It covers vegetation and wildlife and their relationship to forest resource
utilization.
3.1. Vegetation
3.1.1. Nandi North Forest
The vegetation of Nandi North Forest, though sometimes classified as tropical rainforest,
is less floristically diverse than that of Kakamega Forest because of higher altitude.
Biogeographically, it occupies a transitional position between the lowland forests of the Zaire
basin and western Kenya and the afro-montane forests of the Kenya Highlands. The dominant
tree species in the forest include Solanum mauritanium, Neobotonia macrocalyx, Diospyros
abyssinica, Croton macrostachyus, Syzgium guineense and Celtis Africana (Bennun & Njoroge,
2001)
Chapter Five: Area of Study
116
3.1.2. Nandi South Forest
The vegetation of South Nandi is a mix between the lowland forests of West and Central
Africa (the easternmost outlier of which is Kakamega) and the montane forests of the Central
Kenya Highlands. It is actually a transitional zone. Biogeographically, South Nandi is often
considered an eastern extension of Kakamega. However, it is higher in altitude than Kakamega
and floristically less diverse. Common trees include Tabernae montanastapfiana, Macaranga
kilimandscharica, Croton megalocarpus, Croton macrostachyus, Drypete sgerrardii, Celtis
africana, Prunus africana, Neoboutonia macrocalyx and Albizia gummifera.
3.1.3. Nandi Hills
The vegetation of the Nandi Hills, although highly depleted, has a close resemblance to
that of Nandi South area.
3.2. Wildlife
3.2.1. Nandi North Forest
North Nandi Forest is an unusual and important forest. It contains many bird species that
have very limited ranges in Kenya: a number occur only here and in Kakamega (Birdlife
International, 2009). The forest remains a relatively narrow strip, under severe pressure from
illegal timber extraction, charcoal burning, forest grazing of livestock, and unsustainable removal
of forest products (firewood, honey and medicinal plants).
3.2.2. Nandi South forest
The South Nandi Forest has antelopes that are hunted heavily in the eastern sector, where
the surrounding human population is lowest. Monkeys and other small forms of wildlife can also
be found within the forest. Birds are also trapped seasonally, particularly Coturnix delegorguei in
Chapter Five: Area of Study
117
the grasslands (Bennun & Njoroge, 2001). Honey gathering, seemingly a sustainable activity,
also constitutes a conservation threat.
4. ECONOMIC SITUATION
This subsection presents the major economic activities, the major land uses and forest
resources utilization for socioeconomic development. The major economic activities in the study
area are dairy and agriculture. In the Nandi South Forest, agriculture accounts for over 90% of
household sustenance system, with 54% of the household income being derived from agriculture
(FAO, 2000). The case of Nandi North Forest Catchments agriculture, principally crop and dairy
activities drive the economy (Government of Kenya, 2001a). The key food varieties are maize,
Irish potatoes, sorghum and millet, while tea, coffee and pyrethrum are the cash earners. Most of
these crops are grown under mixed farming conditions. In the Nandi hills, the high altitude
influences the rainfall patterns and provides adequate rainfall for farming and agriculture which
is the economic base of the people. Besides agriculture, there is horticulture which also brings in
the economic empowerment to the people. Cattle-raising is practiced to a large extent here. The
economic potential of the area is immense and it has not been fully exploited (Government of
Kenya, 2001b).
Poverty in the study area afflicts about 50% of the population; residents in the Nandi
Hills and Nandi Forest water catchment areas (Government of Kenya, 2003). Under-utilization
and inequitable distribution of resources, high cost of farm inputs, poor and inadequate education
and unemployment have been identified as the major causes of poverty in the study area. As a
consequence, the poor have been driven to encroaching into the forested areas and even to settle
on steep slopes of more than 550, a figure that is 10
0 more than what is recommended by the
Chapter Five: Area of Study
118
Ministry of Agriculture (Government of Kenya, 2001b). This has detrimentally affected land use
especially in relation to cultivation on steep slopes and forest cover depletion through
encroachment.
The study area is of great economic importance at the local as well as at the national level
especially in agriculture and forestry (Government of Kenya, 2003). Non timber products from
the forest such as wild honey, fruits, medicinal plants and edible animals support livelihood
systems of the local population. However, with increasing population and increasing human
needs, the harvesting of forest resources is now unsustainable (Mathu, 2007). The forest trees are
now being cleared to create more land for agriculture, grazing and illegal timber harvesting,
especially of the Elgon Teak tree species (Adhola et al., 2009).
5. SOCIAL ASPECTS
This subsection focuses on the population dynamics of the Nandi Hills and Nandi Forests
and attempts to link forest resource utilization with issues of population.
5.1. Population density
According to the Central Bureau of Statistics (2003), the projected population density is
285 persons per square kilometre in areas with the greatest potential for agriculture, 276 persons
per square kilometre in medium to high potential areas, and lower potential areas have a
population density of 162 persons per square kilometre. A dense and rapidly growing human
population in the Nandi Hills and the surrounds of the Nandi Forests has resulted in increased
pressure on land (Bennun & Njoroge, 2001). Several large excisions have taken place and human
settlement has moved past the pegs marking the forest boundaries (Adhola et al., 2009).
Chapter Five: Area of Study
119
5.2. Population composition
The population of Nandi County stands at 752,965 people, the sex ratio is 1:1 with a
population growth rate of 2.9% annually and the bulk of the population (68%) is youthful (0-25
years) (Government of Kenya, 2005; KNBS, 2010)
6. CHAPTER SUMMARY
This chapter clarifies and outlines the setting of the study in the African, Kenyan and
local contexts. Further to this it presents characteristics of the study area, which include:
physical, ecological and socio-economic characteristics of the area of study. These
characteristics later on in the study provide an overview in which to frame the findings of the
research in chapter seven and the subsequent discussions on these findings in chapter eight.
Chapter Six: Research Design and Methodology
120
CHAPTER SIX
RESEARCH DESIGN AND METHODOLOGY
1. INTRODUCTION
Research, which is defined by Singh and Bajpai (2007) as the systematic and objective
recording and analysis of controlled observations that may lead to generalizations, principles or
theories, resulting in prediction and possibly ultimate control of events, requires a precise
methodological framework. This framework should clearly exemplify the design and
methodological procedures that the research embraced. Kothari (2009) states that a research
design is the advance planning of the methods to be adopted for collecting the relevant data and
the techniques to be used in their analysis in line with the objective of the study, as well as the
availability of staff, time and money. According to Claire et al. (1962), a research design is the
arrangement of conditions for collecting and analysing data in a manner that aims to combine
relevance with the economy of procedure. On the other hand, decisions regarding what, where,
when, how much and what means a problem is solved constitutes a research methodology.
Bogdan and Tailor (1975) hold that in terms of the social sciences methodology refers to the
process, principles and procedures by which we approach problems and seek answers. It is a way
to systematically solve the research problem.
This chapter reviews different research paradigms, discusses the design of the research,
the nature and source of data, and describes the population, sampling methods, data collection
Chapter Six: Research Design and Methodology
121
instruments and procedures, the tools of data analysis and their presentation. It also considers the
validity and reliability of the data as well as the methodological constraints of the research.
2. RESEARCH PARADIGMS
Paradigms refer to the shared set of postulations on the way we perceive the world. A
paradigm describes the world to us and assists us to envisage its behaviours (Barker, 1992).
Senge (1990, p. 8) refers to paradigms as mental models and in particular depicts them as
“...deeply ingrained assumptions and generalizations that influence how people see the world and
behave.”
Guba and Lincoln (1994) prefer a more benign sense of paradigm, depicting it as a
person‟s best perception concerning the world founded on the answer to metaphysical questions.
In this sense, a paradigm portends a set of beliefs concerned with first principles. Denzin (1994,
p. 107) on his part, fronts a highly integrative view that:
“A paradigm may be viewed as a set of basic beliefs (or metaphysics) that deals
with ultimates or first principles. It represents a worldview that defines, for its
holder, the nature of the “world,” the individual‟s place in it, and the range of
possible relationships to that world and its parts, as, for example, cosmologies
and theologies do. The beliefs are basic in the sense that they must be accepted
simply on faith (however well argued); there is no way to establish their ultimate
truthfulness.”
Inquiry paradigms are normally the foundation of research since they define for inquirers
what it is that they are about and what falls within and outside the legitimate inquiry (Guba &
Chapter Six: Research Design and Methodology
122
Lincoln, 1994). Different modes of investigations permit us to comprehend diverse phenomena
and for diverse reasons (Deetz, 1996). Researchers (e.g. Cavaye, 1996; Creswell, 2009) believe
that the appropriateness of a methodology depends on what one attempts to achieve, rather than a
dedication to a certain paradigm. That is, the methodology embraced ought to be in line with the
particular phenomenon of concern. Different situations may well need the employment of
different methodologies. By giving attention to the phenomenon under investigation, rather than
the methodology per se, makes the selection of appropriate methodologies by researchers for
their enquiries easier (Falconer & Mackay, 1999).
Research paradigms cannot be discussed without pointing out certain philosophical
dispositions which fall at the centre of worldview discussions: ontology (theory of reality,
existence and being), epistemology (theory of knowledge) and methodology (research strategy or
strategy of inquiry) (Denzin & Lincoln, 2005; Guba & Lincoln, 1994; Mautner, 2005). A review
of literature on research methodology reveals four major paradigms relevant to this study. These
are positivism (Denzin & Lincoln 2005), post-positivism, intepretivism (Guba & Lincoln, 1994)
and participatory paradigms (Lincoln & Guba, 2000), as indicated in Table 6.1. However, they
need not be considered to be independent of one another and research may take place to varying
degrees within different paradigms in what Creswell and Plano (2007) describe as a pragmatic
paradigm.
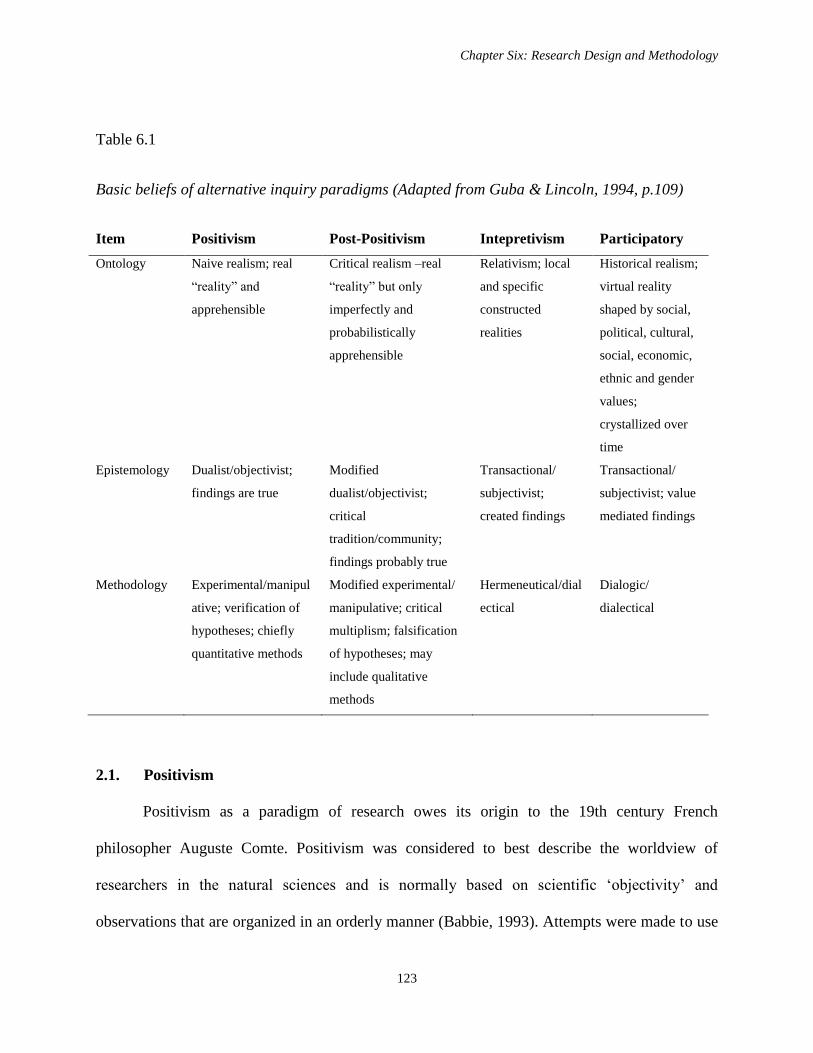
Chapter Six: Research Design and Methodology
123
Table 6.1
Basic beliefs of alternative inquiry paradigms (Adapted from Guba & Lincoln, 1994, p.109)
Item Positivism Post-Positivism Intepretivism Participatory
Ontology Naive realism; real
“reality” and
apprehensible
Critical realism –real
“reality” but only
imperfectly and
probabilistically
apprehensible
Relativism; local
and specific
constructed
realities
Historical realism;
virtual reality
shaped by social,
political, cultural,
social, economic,
ethnic and gender
values;
crystallized over
time
Epistemology Dualist/objectivist;
findings are true
Modified
dualist/objectivist;
critical
tradition/community;
findings probably true
Transactional/
subjectivist;
created findings
Transactional/
subjectivist; value
mediated findings
Methodology Experimental/manipul
ative; verification of
hypotheses; chiefly
quantitative methods
Modified experimental/
manipulative; critical
multiplism; falsification
of hypotheses; may
include qualitative
methods
Hermeneutical/dial
ectical
Dialogic/
dialectical
2.1. Positivism
Positivism as a paradigm of research owes its origin to the 19th century French
philosopher Auguste Comte. Positivism was considered to best describe the worldview of
researchers in the natural sciences and is normally based on scientific „objectivity‟ and
observations that are organized in an orderly manner (Babbie, 1993). Attempts were made to use
Chapter Six: Research Design and Methodology
124
these methods when investigating social occurrences (Smith, 1993) and assertions were made
that social certainty is independent of people and can be investigated objectively by making use
of valid and reliable data. Knowledge and truth are issues of correspondence in the positivism
paradigm in that they relate to an exterior referent truth (Smith, 1993). This correspondence
presumption of truth confers the origin of truth in reality; hence, a statement is confirmed to be
true if it concurs with an independently existing reality and is false if it does not (Kim, 2003).
However, there have been many issues the supposition of positivism that utter truth exists.
2.2. Post-positivism
Post-Positivism as a paradigm was embraced in the 19th
century and was a reaction in
opposition to the supposition that utter truth exists, particularly in relation to findings regarding
humans (Creswell, 2009). Post-positivism is a departure from positivism since it rejects the
fundamental principles of positivism (Trochim, 2000). The post-positivists normally take a
scientific approach to research (Creswell, 2007) but believe that the researcher and the object of
inquiry are not wholly separate or inseparable (Reyes, 2002). However it is a deterministic
philosophy since it presupposes that effect possibly is a consequence of cause. Its traditional
scientific orientation requires that problems are divided into sub-themes (reductionism) and that
the resultant distinct components are tested, for instance by use of hypotheses and research
questions. Prominence is also laid on the researcher‟s objectivity and the identification of bias
(Creswell, 2009).
2.3. Intepretivism/Constructivism
This paradigm postulates that in as much as society is orderly and controlled, it does not
achieve a tangible form but rather a product of inter-subjective encounter. In this case, the
researcher‟s aim is to comprehend the process through which shared reality is made, upheld and
Chapter Six: Research Design and Methodology
125
transformed (Smith & Dainty, 1991). However implications of post-positivist world-view for
qualitative inquiry have given rise to distinct characteristics unique to itself. Interpretive
researchers insist that there ought to be candidness to the understanding of people whom
researchers study and reservation in the way researchers employ and hold their comprehension of
those being studied (Giorgi, 1997; Husen, 1999; van Manen, 1998). This paradigm advocates for
the understanding of the subjective patterns on meanings that are constructed by individuals.
Nevertheless, the nature of interpretative research findings (due to contextual and subjective
characteristics) is often a significant impediment for researchers who attempt to generalize the
results to different environments; what is true in one circumstance may possibly not be true in
another (Kim, 2003).
2.4. Advocacy/Participatory
This paradigm developed out of a concern that other paradigms do not touch on social
justice concerns, particularly in view of marginalized or disenfranchised individuals in society
(Abbott 2002). Researchers also believe that research is highly political and that it has the
potential of effect change in society (Huchzermeyer & Karam, 2006). Participatory investigation
and putting together an action agenda is hence the emphasis of this paradigm (Creswell, 2007).
The purview of partnership with participants ranges from the design of questionnaires to data
collection and analysis. Heron and Reason (1997) further assert that specific social issues
(domination, oppression, inequity) normally play a pivotal role in framing research questions.
Hence the inquest does not only include the aspiration to empower persons but also to make sure
that they are not further discriminated against (Majale, 2008). These attributes portend advocacy
research as a paradigm that can embrace both the qualitative and quantitative approaches
(Creswell, 2009).
Chapter Six: Research Design and Methodology
126
2.5. Pragmatism
Researchers who hold this worldview pay keen attention to the outcomes of the research,
which include: the actions, situations, and consequences of inquiry (Creswell, 2007). There is
usually an intricate relationship between design approach and the underlying paradigm stance
(Creswell, 2003). For instance a quantitative approach entails maintaining positivist paradigm
beliefs while a qualitative approach entails maintaining beliefs linked to an interpretive or
constructivist paradigm position. Nevertheless, these relationships are, by no means rigid
(Bryman, 2004). The pragmatic paradigm postulates by and large that the approach to research is
that of integration of data collection methods and data analysis procedures in the course of the
research (Creswell, 2003). The integrated approach embraced by this paradigm is applicable to
this study due to the intricacy of investigations embraced. This paradigm allows for the use of
multiple methods of data collection to best answer research questions and employs both
quantitative and qualitative data collection and analysis criteria (Creswell, 2007).
3. RESEARCH DESIGN
The logical argument by Singh and Bojpai (2007) that research design is a choice of an
investigator about the components of his project in line with the objectives of the study is very
interesting. They maintain that a research design entails mandatory choices made by the
researcher as a road map and a set of strategies for collecting evidences, analyzing them and
reporting the findings. Mertens (1998) on the other hand cites a research design as the plan and
structure of investigation used to obtain evidence to answer research questions. Mertens further
asserts that a research design describes the procedures for conducting the study, including when,
from whom, and under what conditions the data would be obtained. It (the research design)
provides the most valid and accurate steps to obtain answers possible to research questions.
Chapter Six: Research Design and Methodology
127
Research design is therefore intentioned to abridge the ambiguity of research evidence as much
as possible (Chalmers, 1976). This is because in many cases we can always find evidence
consistent with almost any theory. In spite of the relativity of these descriptions about what a
research design entails and for the purposes of this study, it can be insinuated with certainty that
research design depicts the plan, strategy and structure of investigation conceptualized to obtain
answers to research questions on the basis of which this study is advanced. Divergent as these
descriptions about research design are, there is some consensus that multiple methods are pivotal
to achieving a superior purview of events under investigation (Denzin & Lincoln, 1994).
Research designs with inspiration from an array of paradigms allow a more in-depth
understanding of possible outcomes and have the potential provide a variety sources and kinds of
information (Fraser, 1996).
In social sciences, there is a new school of thought championed by Hall and Howard
(2008) and in tow with other mixed methodologists, that cogent consideration of design
typologies is central in making research design choices and working in an all-inclusive structure.
There are three recognizable design considerations when formulating a research design. The first
design consideration considers „weight‟ (Creswell, 2003; Creswell & Clark, 2007) and priority of
each of the approaches employed in the study (Morgan, 1998), determining whether the
quantitative or qualitative aspects are of equal importance or if predominance is placed over one
or the other. The second design consideration explores the identification of stages in which the
qualitative or quantitative approaches are integrated. In some instances, two approaches to design
are applied: component design and an integrated design (Caracelli & Greene, 1997). The
component design by default allows the quantitative and qualitative methods to remain detached
through data collection and analysis while integration takes place during interpretation and
Chapter Six: Research Design and Methodology
128
inference. On the contrary, the integrated design permits for the incorporation and conflating
throughout the research process. Other methodologist like Teddlie and Tashakkori (2006) offer a
design model known as mixed-strands matrix that builds on Caracelli and Greene‟s (1997)
thoughts to incorporate other forms of design. The mixed strand matrix approach offers
additional pragmatic approaches that allow for the use of both qualitative and quantitative
strands chronologically. The third and last design consideration aims at „sequence decision‟
(Morse, 1991) and „the aspect of timing decision‟ as proposed by Creswell and Plano Clerk
(2007) which respond to and order the chronology of stages in which quantitative and qualitative
methods are utilized.
3.1. Typologies of mixed methods research
Mixed methodological designs are principally for „better understanding‟ (Cook, 1986;
Greene et al., 1989); mixed methods purposes of complementarity (more
complete/comprehensively), triangulation (stronger validity or credibility and less known bias),
initiation (insightfully, fresh perspectives, creative concepts and meanings) and understanding
with greater consciousness and greater diversity of values, perspectives, and positions. The
methodological designs for mixed methods include:
Triangulation design whereby different methods are used concurrently, with equal
priority, to assess same phenomena towards convergence and increased validity.
Nested or embedded design attributed to Doyle et al. (2009), which provides for the use
of two sets of data that play complementary roles to each other, either way. Nested or
embedded designs are either embedded experimental or embedded correlational designs.

Chapter Six: Research Design and Methodology
129
Sequential explanatory design which embodies two phases: the initial phase that uses
quantitative approach and the final phase that use qualitative approach (Creswell et al.,
2003)
Sequential exploratory design which embraces the use of a qualitative approach in the
initial phase and the final phase that use quantitative methodological approach.
Sequential transformative design that also uses two phases but the differences with the
other sequential design typologies is that both qualitative and quantitative methodologies
are either equal or dominant.
A summary of these mixed method research typologies are contained in the Table 6.2 adapted
from Creswell et al., 2003.
Table 6.2
Mixed methods design typology (Creswell et al., 2003, p. 224)
Creswell et al. (2003)
Stage of
Integration Implementation Priority / Status
Sequential designs
*Sequential explanatory
Interpretation
QUANqual
Usually QUAN,
can be QUAL or
equal
*Sequential exploratory
Interpretation
QUALquan
Usually QUAL,
can be QUAN or
equal
*Sequential
transformative
Interpretation
QUALQUAN
QUAN QUAL
Either dominant or
both equal
Concurrent designs
*Triangulation
Interpretation or
analysis
QUAL + QUAN
Equal
*Nested/ Embedded Analysis
qual within QUAN Either dominant
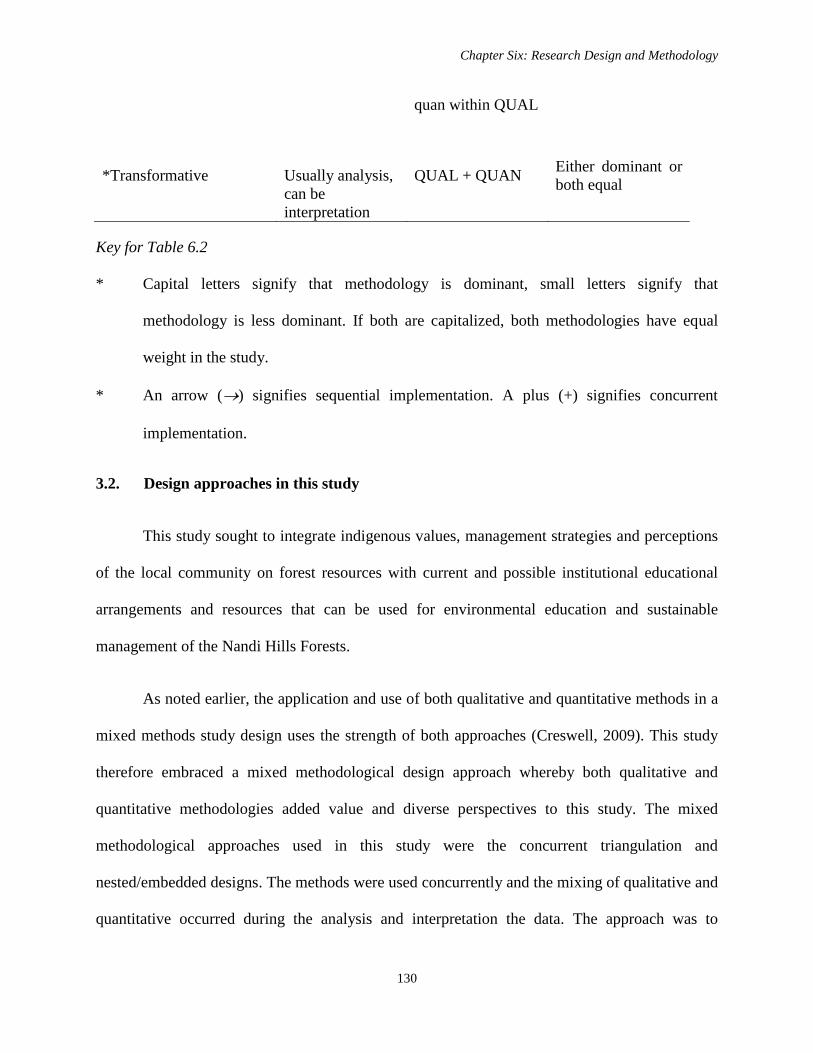
Chapter Six: Research Design and Methodology
130
quan within QUAL
*Transformative
Usually analysis,
can be
interpretation
QUAL + QUAN Either dominant or
both equal
Key for Table 6.2
* Capital letters signify that methodology is dominant, small letters signify that
methodology is less dominant. If both are capitalized, both methodologies have equal
weight in the study.
* An arrow () signifies sequential implementation. A plus (+) signifies concurrent
implementation.
3.2. Design approaches in this study
This study sought to integrate indigenous values, management strategies and perceptions
of the local community on forest resources with current and possible institutional educational
arrangements and resources that can be used for environmental education and sustainable
management of the Nandi Hills Forests.
As noted earlier, the application and use of both qualitative and quantitative methods in a
mixed methods study design uses the strength of both approaches (Creswell, 2009). This study
therefore embraced a mixed methodological design approach whereby both qualitative and
quantitative methodologies added value and diverse perspectives to this study. The mixed
methodological approaches used in this study were the concurrent triangulation and
nested/embedded designs. The methods were used concurrently and the mixing of qualitative and
quantitative occurred during the analysis and interpretation the data. The approach was to
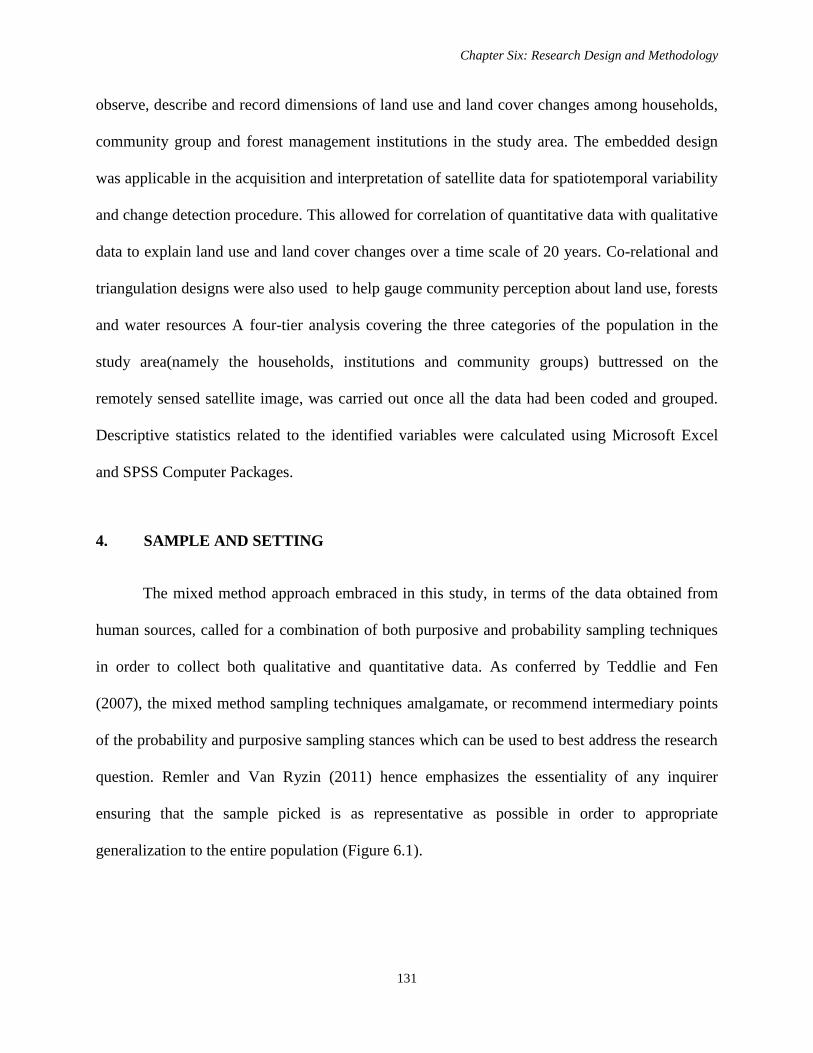
Chapter Six: Research Design and Methodology
131
observe, describe and record dimensions of land use and land cover changes among households,
community group and forest management institutions in the study area. The embedded design
was applicable in the acquisition and interpretation of satellite data for spatiotemporal variability
and change detection procedure. This allowed for correlation of quantitative data with qualitative
data to explain land use and land cover changes over a time scale of 20 years. Co-relational and
triangulation designs were also used to help gauge community perception about land use, forests
and water resources A four-tier analysis covering the three categories of the population in the
study area(namely the households, institutions and community groups) buttressed on the
remotely sensed satellite image, was carried out once all the data had been coded and grouped.
Descriptive statistics related to the identified variables were calculated using Microsoft Excel
and SPSS Computer Packages.
4. SAMPLE AND SETTING
The mixed method approach embraced in this study, in terms of the data obtained from
human sources, called for a combination of both purposive and probability sampling techniques
in order to collect both qualitative and quantitative data. As conferred by Teddlie and Fen
(2007), the mixed method sampling techniques amalgamate, or recommend intermediary points
of the probability and purposive sampling stances which can be used to best address the research
question. Remler and Van Ryzin (2011) hence emphasizes the essentiality of any inquirer
ensuring that the sample picked is as representative as possible in order to appropriate
generalization to the entire population (Figure 6.1).
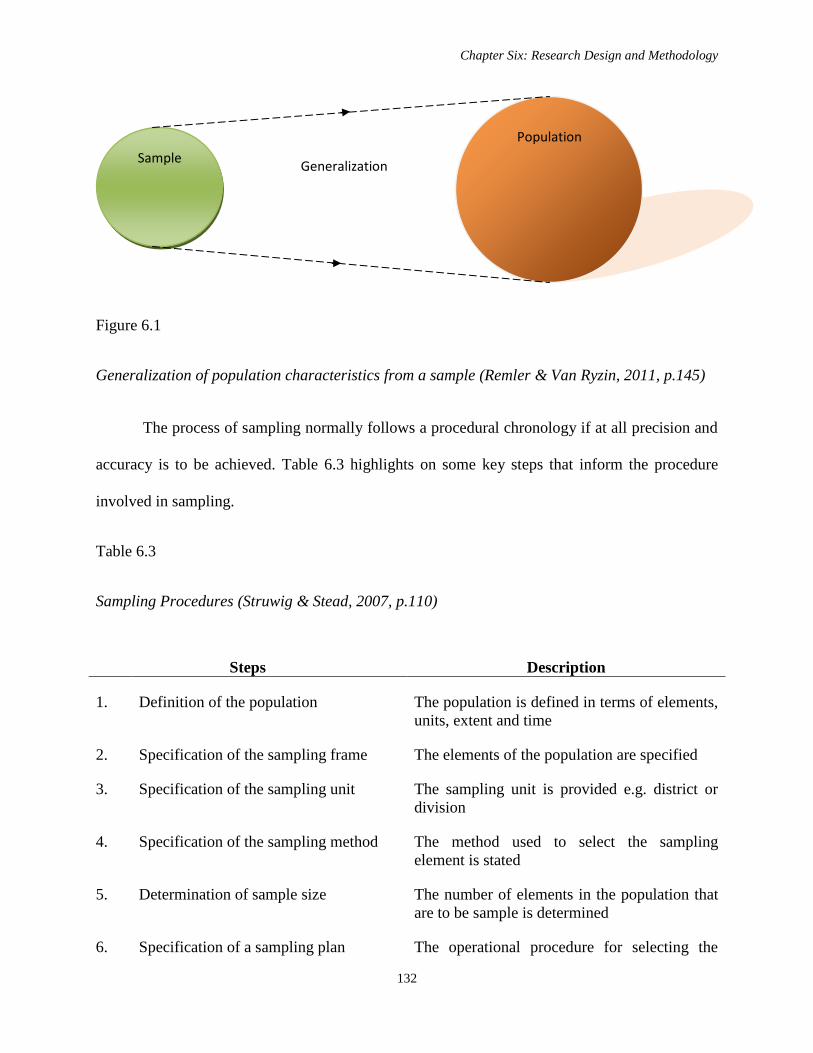
Chapter Six: Research Design and Methodology
132
Figure 6.1
Generalization of population characteristics from a sample (Remler & Van Ryzin, 2011, p.145)
The process of sampling normally follows a procedural chronology if at all precision and
accuracy is to be achieved. Table 6.3 highlights on some key steps that inform the procedure
involved in sampling.
Table 6.3
Sampling Procedures (Struwig & Stead, 2007, p.110)
Steps Description
1. Definition of the population The population is defined in terms of elements,
units, extent and time
2. Specification of the sampling frame The elements of the population are specified
3. Specification of the sampling unit The sampling unit is provided e.g. district or
division
4. Specification of the sampling method The method used to select the sampling
element is stated
5. Determination of sample size The number of elements in the population that
are to be sample is determined
6. Specification of a sampling plan The operational procedure for selecting the
Sample
Population
Generalization
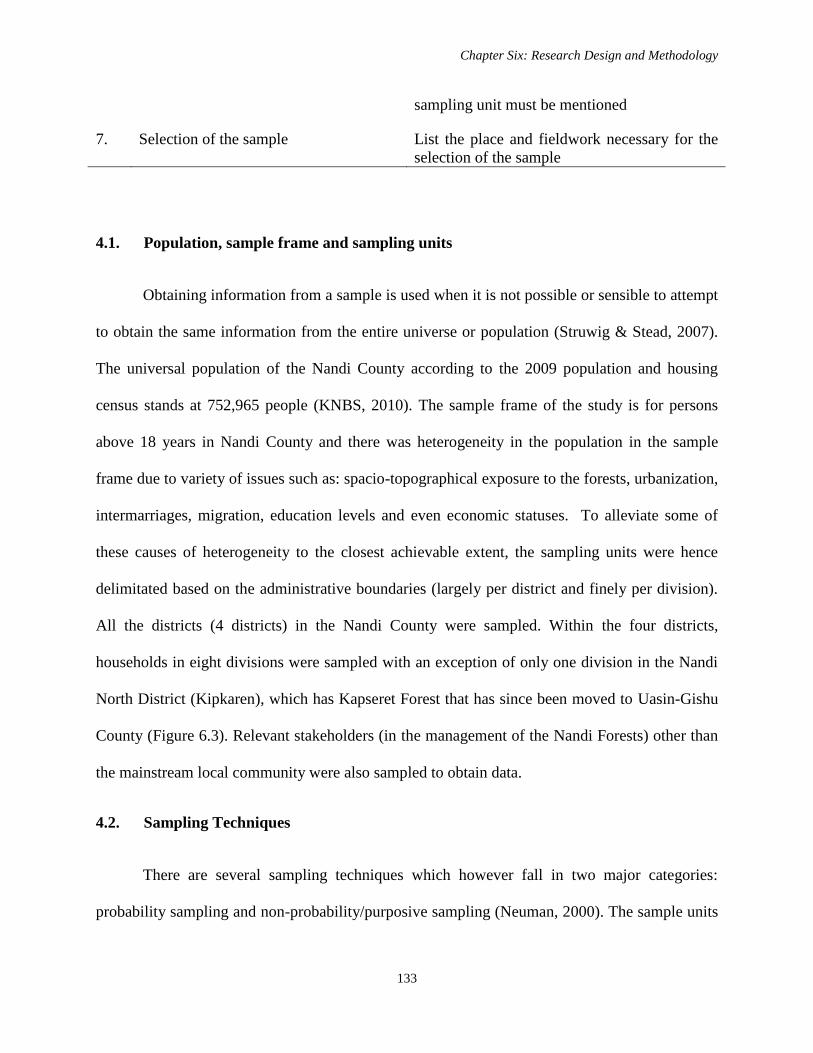
Chapter Six: Research Design and Methodology
133
sampling unit must be mentioned
7. Selection of the sample List the place and fieldwork necessary for the
selection of the sample
4.1. Population, sample frame and sampling units
Obtaining information from a sample is used when it is not possible or sensible to attempt
to obtain the same information from the entire universe or population (Struwig & Stead, 2007).
The universal population of the Nandi County according to the 2009 population and housing
census stands at 752,965 people (KNBS, 2010). The sample frame of the study is for persons
above 18 years in Nandi County and there was heterogeneity in the population in the sample
frame due to variety of issues such as: spacio-topographical exposure to the forests, urbanization,
intermarriages, migration, education levels and even economic statuses. To alleviate some of
these causes of heterogeneity to the closest achievable extent, the sampling units were hence
delimitated based on the administrative boundaries (largely per district and finely per division).
All the districts (4 districts) in the Nandi County were sampled. Within the four districts,
households in eight divisions were sampled with an exception of only one division in the Nandi
North District (Kipkaren), which has Kapseret Forest that has since been moved to Uasin-Gishu
County (Figure 6.3). Relevant stakeholders (in the management of the Nandi Forests) other than
the mainstream local community were also sampled to obtain data.
4.2. Sampling Techniques
There are several sampling techniques which however fall in two major categories:
probability sampling and non-probability/purposive sampling (Neuman, 2000). The sample units
Chapter Six: Research Design and Methodology
134
representing the smallest entity that provided responses in this study were the households,
community groups and institutions involved in forest management. The choosing of these
sampling units was predicated on the premise that forest management and utilization is directly
related to the household size and need for forest resources, and the institutional capabilities and
input of the relevant institutions.
4.2.1. Stratified random sampling
Stratified sampling was used particularly to enhance homogeneity as much as possible in
the strata; in this case a division was regarded as a stratum. Random sampling was then
undertaken within each stratum. Stratified sampling was used to identify the administrative
divisions of the Nandi County then random sampling was applied to select the samples of
respondents in the case of households and community groups. The part of the population within
each division chosen for the administration of questionnaires was a product of a random process.
Selection of homesteads or households did not follow any prearranged order except for the
predetermination of which stratum they belong, and all of them had equal chances of being
selected to be respondents. PRA sessions were also conducted in all the districts such that each
district was entitled to one PRA. The invitation of the community members for PRA sessions
was done through the provincial administration. This also formed an aspect of auto-
randomization because not everybody who received the information about the meeting came for
the PRA meetings. The attendance of the meetings was based on a personal choice. Conversely
the institutions were also stratified into Government Agencies, NGOs and CBOs then sampled
within each institutional category stratum.
Chapter Six: Research Design and Methodology
135
4.2.2. Convenience sampling
This technique was particularly relevant in backing up the random sampling technique. In
each stratum respondents were interviewed to a certain extent at the convenience of the field
enumerators (due to distance) and availability/accessibility of the respondents themselves.
4.2.3. Quota sampling
This is a non-probability sampling technique which involves respondents being selected
according to their characteristic e.g. age, income, socio-economic status and gender (Struwig &
Stead, 2007). In this study, quota sampling took the shape of considering the ages of the
population and picking on only those who are above 18 years of age.
4.2.4. Judgemental sampling
This technique takes cognizance expert judgement in choosing what the best sample is for
a particular study. I used this technique in identifying the institutions and practitioners involved
in the management of the Nandi Hills Forests and sampling them for response. This sampling
technique also led to the identification of key community informants with rich information on the
cultural practices, indigenous forest management strategies and on-site understanding of land use
and land cover change in the study area.
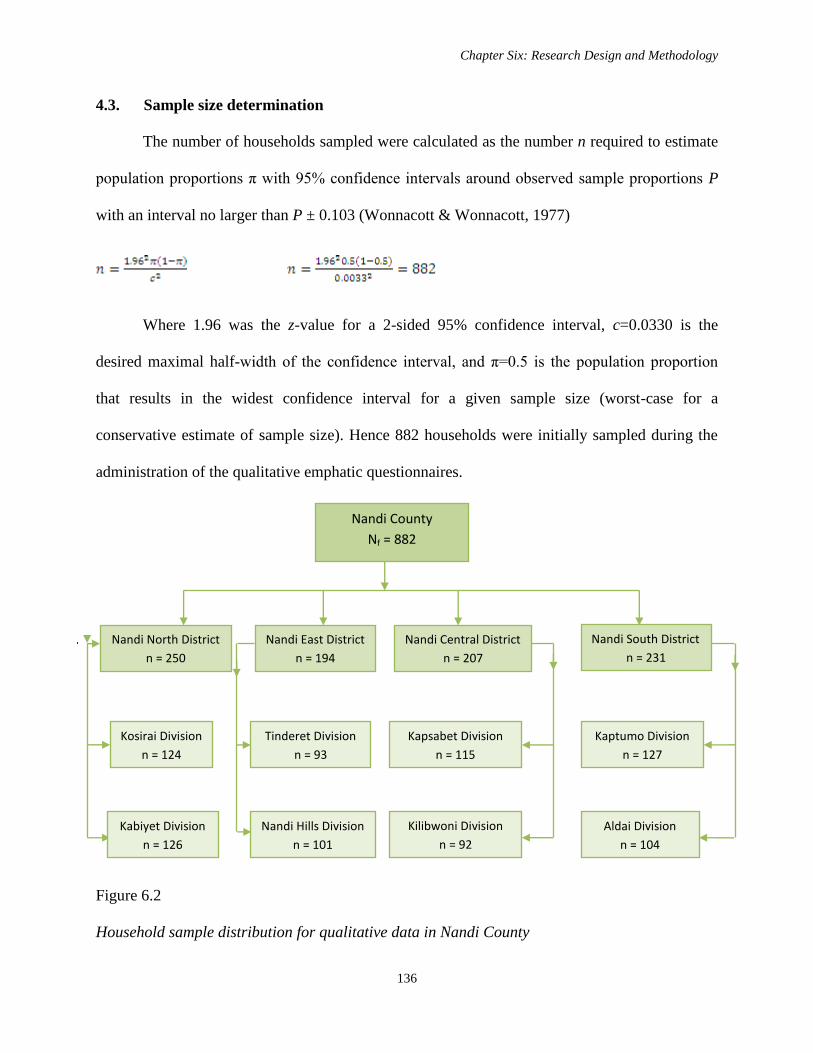
Chapter Six: Research Design and Methodology
136
4.3. Sample size determination
The number of households sampled were calculated as the number n required to estimate
population proportions π with 95% confidence intervals around observed sample proportions P
with an interval no larger than P ± 0.103 (Wonnacott & Wonnacott, 1977)
Where 1.96 was the z-value for a 2-sided 95% confidence interval, c=0.0330 is the
desired maximal half-width of the confidence interval, and π=0.5 is the population proportion
that results in the widest confidence interval for a given sample size (worst-case for a
conservative estimate of sample size). Hence 882 households were initially sampled during the
administration of the qualitative emphatic questionnaires.
Figure 6.2
Household sample distribution for qualitative data in Nandi County
Nandi North District
n = 250
Nandi County
Nf = 882
Nandi Central District
n = 207
Nandi South District
n = 231
Nandi East District
n = 194
Kosirai Division
n = 124
Kabiyet Division
n = 126
Nandi Hills Division
n = 101
Tinderet Division
n = 93
Kaptumo Division
n = 127
Kilibwoni Division
n = 92
Aldai Division
n = 104
Kapsabet Division
n = 115
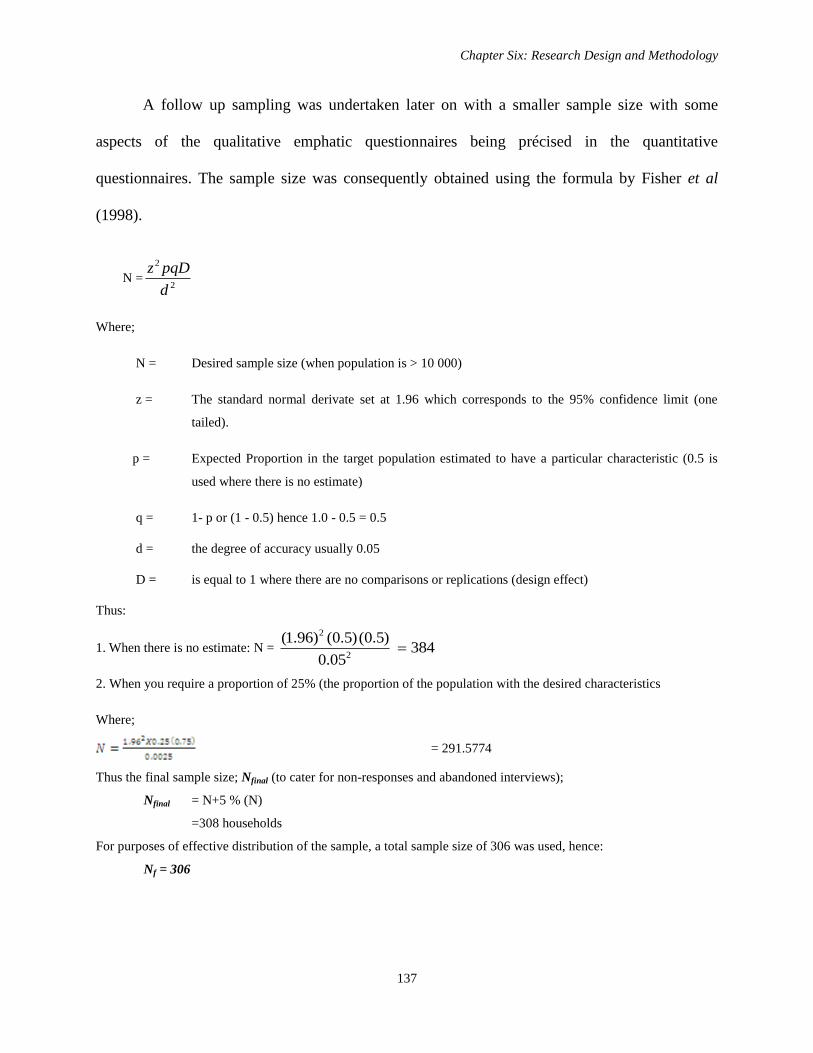
Chapter Six: Research Design and Methodology
137
A follow up sampling was undertaken later on with a smaller sample size with some
aspects of the qualitative emphatic questionnaires being précised in the quantitative
questionnaires. The sample size was consequently obtained using the formula by Fisher et al
(1998).
N =2
2
d
pqDz
Where;
N = Desired sample size (when population is > 10 000)
z = The standard normal derivate set at 1.96 which corresponds to the 95% confidence limit (one
tailed).
p = Expected Proportion in the target population estimated to have a particular characteristic (0.5 is
used where there is no estimate)
q = 1- p or (1 - 0.5) hence 1.0 - 0.5 = 0.5
d = the degree of accuracy usually 0.05
D = is equal to 1 where there are no comparisons or replications (design effect)
Thus:
1. When there is no estimate: N = 38405.0
)5.0()5.0()96.1(2
2
2. When you require a proportion of 25% (the proportion of the population with the desired characteristics
Where;
= 291.5774
Thus the final sample size; Nfinal (to cater for non-responses and abandoned interviews);
Nfinal = N+5 % (N)
=308 households
For purposes of effective distribution of the sample, a total sample size of 306 was used, hence:
Nf = 306
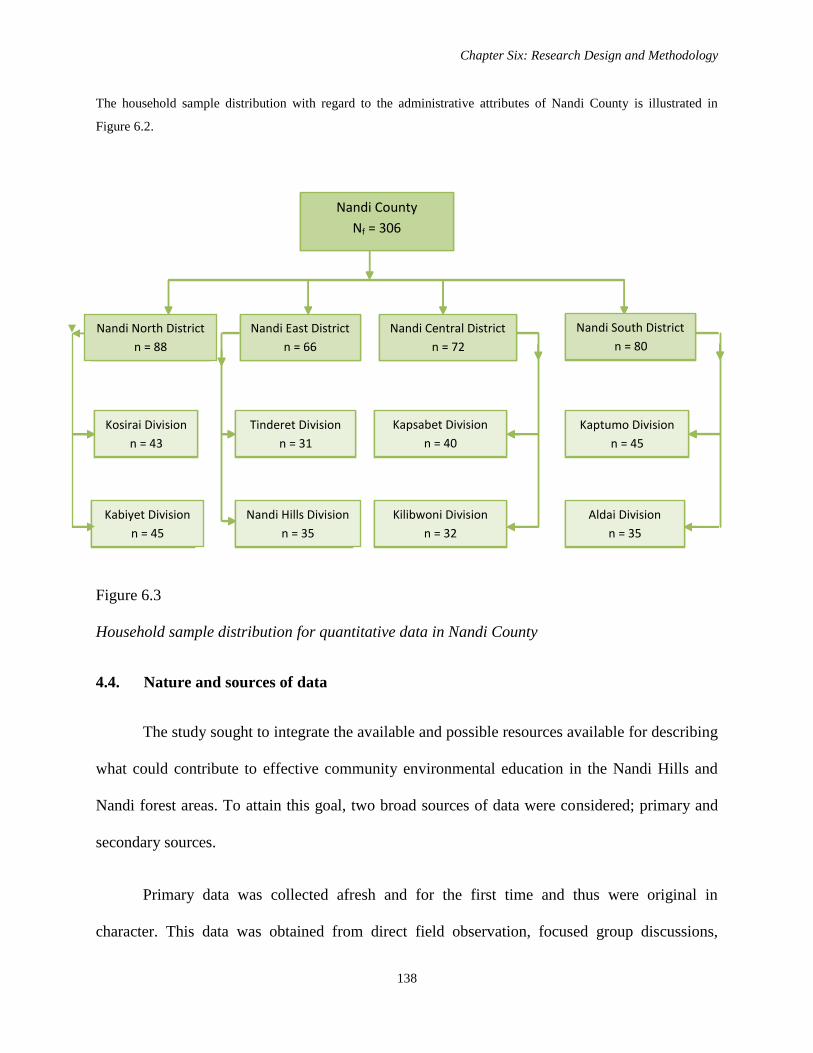
Chapter Six: Research Design and Methodology
138
The household sample distribution with regard to the administrative attributes of Nandi County is illustrated in
Figure 6.2.
Figure 6.3
Household sample distribution for quantitative data in Nandi County
4.4. Nature and sources of data
The study sought to integrate the available and possible resources available for describing
what could contribute to effective community environmental education in the Nandi Hills and
Nandi forest areas. To attain this goal, two broad sources of data were considered; primary and
secondary sources.
Primary data was collected afresh and for the first time and thus were original in
character. This data was obtained from direct field observation, focused group discussions,
Nandi North
District
n = 88
Nandi County
Nf = 306
Nandi Central District
n = 72
Nandi South District
n = 80
Nandi East District
n = 66
Kosirai Division
n = 43
Kabiyet
Division
n = 45
Nandi Hills
Division
n = 35
Tinderet Division
n = 31
Kaptumo Division
n = 45
Kilibwoni Division
n = 32
Aldai Division
n = 35
Kapsabet Division
n = 40
Nandi North District
n = 88
Nandi County
Nf = 306
Nandi Central District
n = 72
Nandi South District
n = 80
Nandi East District
n = 66
Kosirai Division
n = 43
Kabiyet Division
n = 45
Nandi Hills Division
n = 35
Tinderet Division
n = 31
Kaptumo Division
n = 45
Kilibwoni Division
n = 32
Aldai Division
n = 35
Kapsabet Division
n = 40
Chapter Six: Research Design and Methodology
139
interviews from resource persons and use. The primary data was obtained using structured
questionnaires (households and institutional), interview schedules for guided Focus Group
Discussions (FGDs) and key informant interviews. Ground truthing and direct field observations
coupled with real-time photography were also embraced by use of mechanical devices such as
GPS and digital cameras.
Secondary data consisted of published and unpublished information about the study area,
the subject and the greater Nandi County in general. They included; satellite images, published
books, journals, study area-specific reports, strategy papers and development plans, abstracts,
and other government documents and related reviews of the above sources.
5. DATA COLLECTION AND DATA COLLECTION INSTRUMENTS
This subsection discusses the instruments used to gather field data and how they were
used. A combination several data collection instruments were embraced to gather the information
in this study. They included Rapid Rural Appraisal, non-participant observation, questionnaire
administration, photography, oral interviews and the use of schedules and checklists. The
analysis of forest inventory maps, satellite data (using GIS and Remote Sensing) and the review
of already documented information also formed part of this process.
5.1. Rapid rural appraisal
Participatory approaches of data collection were used under the banner of Rapid Rural
Appraisal (RRA). Stinson (1979) observes that RRA is done over a relatively shorter period of
time (a few days to a few weeks). RRA are semi-structured, multi-disciplinary, and provide room
Chapter Six: Research Design and Methodology
140
for flexibility and innovation. Data collection emphasised learning directly from the local
inhabitants.
This methodology was used to collect information from stakeholders as to what was the
best strategy for participatory forest management. The questions asked in these sessions were
open ended to stimulate an argumentative process during the sessions. Webb (2008a) confers that
questioning that elicits an argumentative process is critical in order to spur the respondents into
justifying their claims, a vital component of deriving meaning from one‟s submissions. A series
of RRA sessions were undertaken in every sub-location within the Nandi Hills area sampled for
by the study for data gathering. The sessions culminated into an all-inclusive stakeholders
meeting in the two District Headquarters, Nandi South and Nandi North Districts. The
discussions were moderated by the researcher assisted by personnel from the KFS and local
Provincial Administration. The views that were generated informed the findings of the study.
5.2. Non-participant observation
This method was used to obtain information on the level of degradation of forest
resources, the manifestation of impacts of the current forest utilization practices and the
community‟s relationship with forest resources. An observation schedule was used for this
purpose. This was because observations were anticipated to increase the relevance and reliability
of the data gathered during field work (Piel, 1982)
5.3. Oral interview schedule
Oral interview schedules were used to obtain information from the line ministries‟
officers and the civil society personnel with interests in forest management in the Nandi Hills
Chapter Six: Research Design and Methodology
141
area. Kerlinger (1973) observed that interviews are advantageous because of face to face
interpersonal interaction and this formed the basis for this choice. A great deal of information
can be obtained through schedules within a short time, adding credence to this choice.
5.4. Questionnaires
As noted earlier, the utilization of the forest and its products is driven by the household
size and needs. Every community member targeted for environmental education was a member
of a household. Two types of household questionnaires were administered namely; qualitative
and quantitative data questionnaires. The sample size was 882 for the qualitative household
questionnaires, 306 for the quantitative household questionnaires. With the help of the Provincial
Administration and opinion leaders within the community, the principal access roads in the
villages were identified and used as transects. Simple random sampling was used along the
transect line for homesteads and households for interviewing. The heads of the families were
interviewed because they are the major decision makers within the households. In the event that
the household head was not found, the second available authority within the household was
interviewed. The researcher and the research assistants then administered the instruments.
5.5. Mechanical devices
Digital cameras were used to capture real-time data on land use, the extent of visible
degradation and the other relevant data related to this study.
5.6. Remote sensing and GIS
Remote Sensing and GIS data were generated by obtaining Landsat images from the
Regional Centre for Mapping of Resources for Development in Nairobi. The acquired maps and
satellite imagery were analysed using Erdas Version 8.6 and ArcGIS Version 9.1 software
Chapter Six: Research Design and Methodology
142
platform for spatio-temporal variability. This was done to provide the baseline for interpretation
and subsequent on-site verification survey. Ground truthing was done by means of field visits, an
observation checklist and photographic evidence. After on-site verification, the land use/land
cover classes established were geo-referenced and digitized for geospatial analysis. The
observation from satellite images enhanced assessment of the extent of spatiotemporal variations
in land use and land cover over the period considered.
Satellite images, Landsat TM series of 1990s and ETM of 2000s imagery of the study
area were evaluated for land cover change. The remote sensing (satellite) data applied in
assessing the land cover changes covered the years of 1994, 1999, 2003 and 2009. Image
interpretation was made based on land cover types, supervised land cover classification and the
Normalised Difference Vegetation Index (NDVI) computed for images captured at different
dates. Standard procedures were followed during image interpretation based on land cover types
and visual interpretation of the tonal, textual and structural characteristics renders on images that
helped in delineation of land cover classes digitized for various image dates. The various land
use and their associated changes were mapped based on the pixel size of the satellite data types.
The interpreted data informed on landscape qualities, land cover changes and land use patterns
over the study area. The framework that guided the change detection is illustrated in figure 6.3.
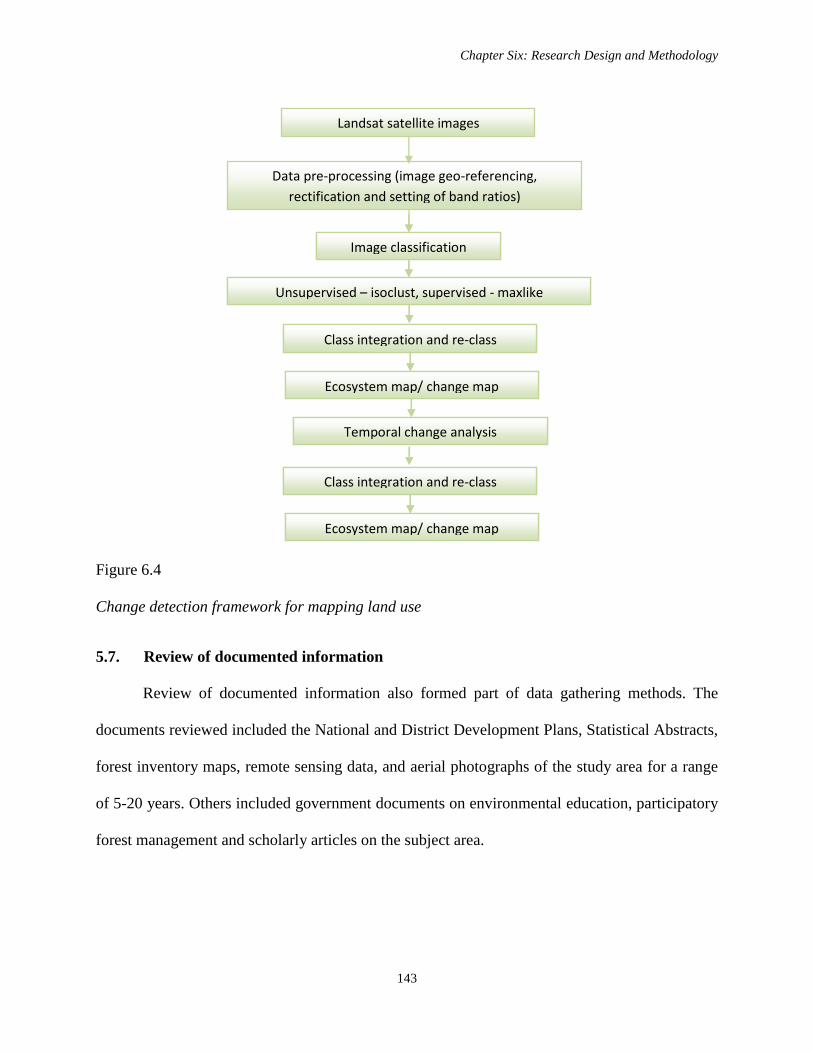
Chapter Six: Research Design and Methodology
143
Figure 6.4
Change detection framework for mapping land use
5.7. Review of documented information
Review of documented information also formed part of data gathering methods. The
documents reviewed included the National and District Development Plans, Statistical Abstracts,
forest inventory maps, remote sensing data, and aerial photographs of the study area for a range
of 5-20 years. Others included government documents on environmental education, participatory
forest management and scholarly articles on the subject area.
Ecosystem map/ change map
Class integration and Re-class
Ecosystem map/ change map
Class integration and re-class
Data pre-processing (image geo-referencing,
rectification and setting of band ratios)
Temporal change analysis
Unsupervised – isoclust, Supervised - maxlike
Image Classification
Ecosystem map/ change map
Class integration and Re-class
Landsat satellite images
Temporal change analysis
Unsupervised – isoclust, supervised - maxlike
Image classification
Ecosystem map/ change map
Class integration and re-class
Chapter Six: Research Design and Methodology
144
6. DATA ANALYSIS
According to Mouton (2001), data analysis entails the process of disassembling the data
into manageable themes, patterns, trends and relationships. Patton (2002, p.108) argues that data
analysis “involves reducing the amount of raw information, sifting trivia from significance,
identifying significant patterns, and constructing a framework for communicating the essence of
what the data reveal.” It appears from these two explanations that data analysis is about making
meaning and transforming data into findings.
The data analysis process began as soon as the data had been collected. Qualitative data
was transcribed, typed, read and common themes identified as described by Henn, Weinstein and
Foard (2006), thus allowing coding and scoring in a master sheet. Quantitative data was on the
other hand tabulated, entered into a data base, edited and encoded. This was meant to eliminate
errors in the raw data and to place the data into categories to facilitate their tabulation and
interpretation (Struwig & Stead, 2007). The tabulation typologies used during data analysis as
described by Struwig and Stead (2007, p. 18) included; univariate tabulation – “tabulation of
responses to one question at a time one” and bivariate tabulation – “tabulation of responses to
two questions simultaneously”. To provide statistical summaries of the data, descriptive statistics
were used. This helped in the provision of an overall, coherent and straight forward picture of the
data (Struwig & Stead, 2007). Descriptive statistics use in this research were; measures of central
tendency (mean or averages), measures of dispersion or variability (standard deviation and
variance). Frequencies averages and percentages were calculated for reporting on the findings.
Averages were used to analyse land sizes and land use while percentages used to analyse
incomes from forest utilization.
Chapter Six: Research Design and Methodology
145
The acquired satellite images were analysed and change detection differences computed
in tables and the corresponding percentages calculated using MS Excel. The differences were
later presented as bar graphs and tables. Statistical package for Social Sciences (SPSS) Version
16 and Microsoft Excel 2007 packages were used.
7. ETHICAL CONSIDERATIONS
The main ethical issues observed and considered in this study are as follows:
Participants had a right to take part in the study and research or not;
Participants were provided with adequate information on the research before the
interview, and because of the level of literacy, consent obtained was mainly verbal (oral);
Anonymity and confidentiality of the respondents was ensured by not divulging any
sensitive information they gave during the study;
Scientific accountability was observed as much as possible through proper cross-
referencing and by listing all sources used at the end of this thesis; and
Authority to conduct the research was obtained from Nelson Mandela Metropolitan
University Ethics Committee and the Ministry of Education, Science and Technology,
Kenya.
8. VALIDITY, RELIABILITY AND TRIANGULATION
Joppe (2000) defines validity as the measure or extent to which the research truly
measures what it was intended to determine or how truthful or accurate the research findings are.
Chapter Six: Research Design and Methodology
146
Mertens (1998) expands his reference to validity to refer to the trustworthiness or credibility,
hence to the extent to which deductions can be drawn from data collection tools that are
appropriate and meaningful to the specific study. Validity hence formed a pivotal consideration
throughout the process formulating the research, data collection and analysis.
In order to increase the internal validity of the data the following considerations were
made during the study: the use of sampling techniques which attempted to ensure the
homogeneity of the selected sample through stratification (see sub-section 4.1. Population,
Sample Frame and Sampling Units); and blocking of some of the possible intervening or
extraneous variables, for instance the demographic characteristics, by including and measuring
them. In this study attempts were made to boost external validity by using a large sample
improve its representativeness, and comparing and contrasting the findings of the study with
other previous and relevant studies highlighted in the literature.
Reliability refers to the accuracy and consistency of data collected in a study and the term
is most connected to the methods embraced to measure research variables (Campbell, 1996). In
this study, the use of a regulated interview protocol for all respondents augmented the reliability
of the information gathered, while triangulation of data from diverse sources was done to shed
light on a theme or perspective (Creswell, 2007). Webb (2008b) recommends the need defend
one‟s findings before and audience, who cross examine the findings, as a way of checking
reliability. Triangulation is classically an approach used in enhancing the validity and reliability
of the research findings by a particular researcher. Mathison (1988, p. 13) details this by
articulating that:
Chapter Six: Research Design and Methodology
147
“Triangulation has raised an important methodological issue in naturalistic and
qualitative approaches to evaluation [in order to] control bias and establishing
valid propositions because traditional scientific techniques are incompatible with
this alternate epistemology.”
In this study, different research protocols were utilized at analysis and interpretation
levels in order to boost both the quantitative and qualitative aspects of the data for reporting. For
instance, information from households on land use practices and land use change was
corroborated with quantitative information gleaned from satellite images to depict the extent of
spatio-temporal variability. Likewise, trends in land use practices, community perceptions on
forest utilization practices were triangulated with information on the same from FGDs and KIIs.
9. METHODOLOGICAL CONSTRAINTS
Creswell (2007) acknowledges that researchers engaged in studies face difficult issues in
the field when gathering data. The following were some of constrains experienced in the course
of the study. They included but were not limited to the following:
(a) Access to organization/individuals and groups
Convincing individuals to participate in the study, building trust and credibility at the
sites and getting people to respond to the study questions during interview was one of the
challenges. Organization and community groups were the hardest to deal with here since they
requested for monetary facilitation so as to participate in the study.
Chapter Six: Research Design and Methodology
148
(b) Topographically related limitations
The steep slopes, rocky surfaces and lack of access roads for use by vehicles to certain
interiors of the river valleys which hampered the mobility of the researchers
(c) Sensitivity of the topic
Since the topic touches on the delicate issues of land, forest and water resources, which
the local community holds dear, may have elicited guarded responses local participants.
(d) The community’s perception towards monitoring and evaluation:
The local communities experiences of monitoring and evaluation has not always been
positive and may have also resulted in guarded responses.
All of the above are constraints could threaten the validity and reliability of the findings.
However, the type and amount of data generated, and the triangulation that they enabled, suggest
that the level of validity and reliability of the data falls within the bounds of „believability‟
(Creswell, 2009).
10. CHAPTER SUMMARY
This chapter discussed the research methodology and design, the nature and source of
data, the population description, sampling methods, data collection techniques, data processing,
statistical techniques used in data analysis and presentation. The chapter also discussed
constraints to data collection during field work. The next chapter presents the data generated by
the study.
Chapter Seven: Results
149
CHAPTER SEVEN
RESULTS
1. INTRODUCTION
The data generated in this study are presented in terms of (i) the institutions which
contribute to the management of the Nandi Hills forests (ii) land use in the Nandi Hills district as
revealed by GIS, remote sensing and ground truthing (iii) interview data which provided
information on issues of land ownership, land size occupied by households, as well as
householders‟ perceptions of forest use, their current status and their potential, and the sources of
their knowledge. The mixed methodological approach embraced in this study (see sub-section
3.2 of chapter six) informed the analysis and presentation of results in this chapter. The analyzed
satellite images were buttressed on the qualitative and quantitative household questionnaires,
FGD and KII data.
2. INSTITUTIONS WHICH CONTRIBUTE TO THE MANAGEMENT OF THE
NANDI HILLS FORESTS
A literature search was undertaken to identify institutions that attempt to contribute to the
management and conservation of the Nandi Hills Forests, after which field visits were made to
the institutions where focus group and key informant interviews were held. The households in
the Nandi Hills and Nandi Forest areas (882 qualitative and 306 quantitative household
questionnaires) were also interviewed as to their perceptions of the roles, achievements and
shortcomings of the institutions involved in the management and conservation of the Nandi Hills
Forests. The data indicate that only slightly over two thirds (67%) of the respondents were able
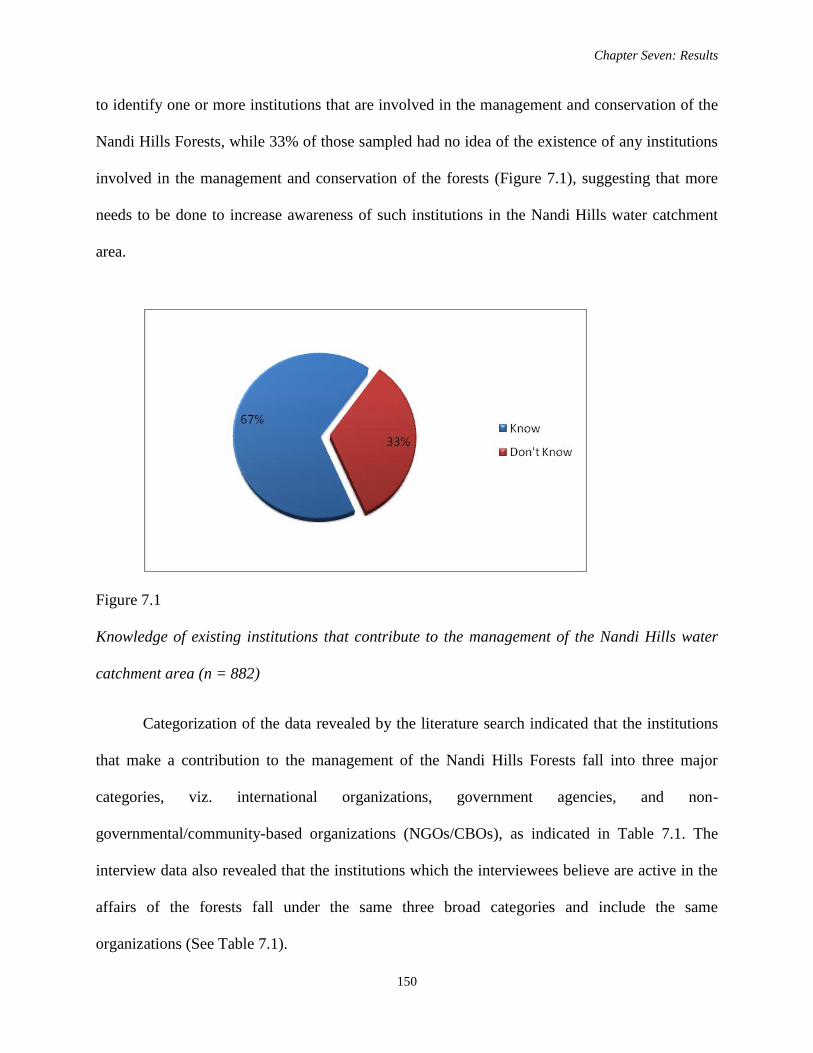
Chapter Seven: Results
150
to identify one or more institutions that are involved in the management and conservation of the
Nandi Hills Forests, while 33% of those sampled had no idea of the existence of any institutions
involved in the management and conservation of the forests (Figure 7.1), suggesting that more
needs to be done to increase awareness of such institutions in the Nandi Hills water catchment
area.
Figure 7.1
Knowledge of existing institutions that contribute to the management of the Nandi Hills water
catchment area (n = 882)
Categorization of the data revealed by the literature search indicated that the institutions
that make a contribution to the management of the Nandi Hills Forests fall into three major
categories, viz. international organizations, government agencies, and non-
governmental/community-based organizations (NGOs/CBOs), as indicated in Table 7.1. The
interview data also revealed that the institutions which the interviewees believe are active in the
affairs of the forests fall under the same three broad categories and include the same
organizations (See Table 7.1).
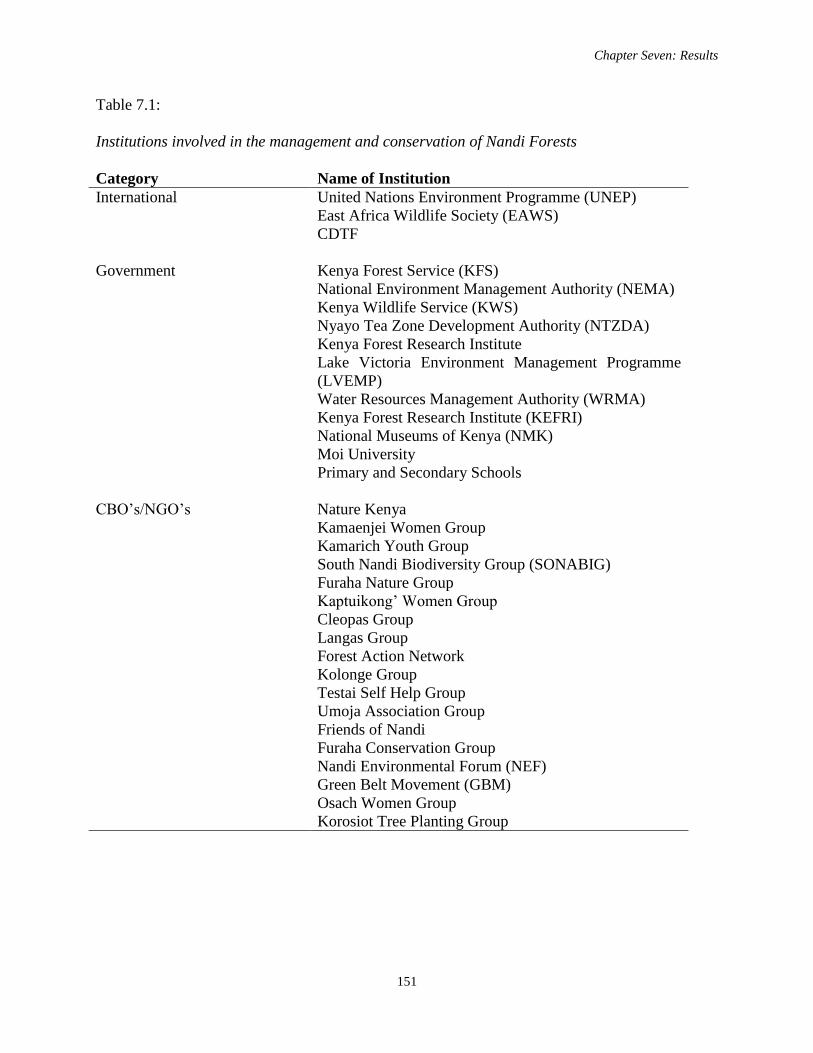
Chapter Seven: Results
151
Table 7.1:
Institutions involved in the management and conservation of Nandi Forests
Category Name of Institution
International United Nations Environment Programme (UNEP)
East Africa Wildlife Society (EAWS)
CDTF
Government Kenya Forest Service (KFS)
National Environment Management Authority (NEMA)
Kenya Wildlife Service (KWS)
Nyayo Tea Zone Development Authority (NTZDA)
Kenya Forest Research Institute
Lake Victoria Environment Management Programme
(LVEMP)
Water Resources Management Authority (WRMA)
Kenya Forest Research Institute (KEFRI)
National Museums of Kenya (NMK)
Moi University
Primary and Secondary Schools
CBO‟s/NGO‟s Nature Kenya
Kamaenjei Women Group
Kamarich Youth Group
South Nandi Biodiversity Group (SONABIG)
Furaha Nature Group
Kaptuikong‟ Women Group
Cleopas Group
Langas Group
Forest Action Network
Kolonge Group
Testai Self Help Group
Umoja Association Group
Friends of Nandi
Furaha Conservation Group
Nandi Environmental Forum (NEF)
Green Belt Movement (GBM)
Osach Women Group
Korosiot Tree Planting Group
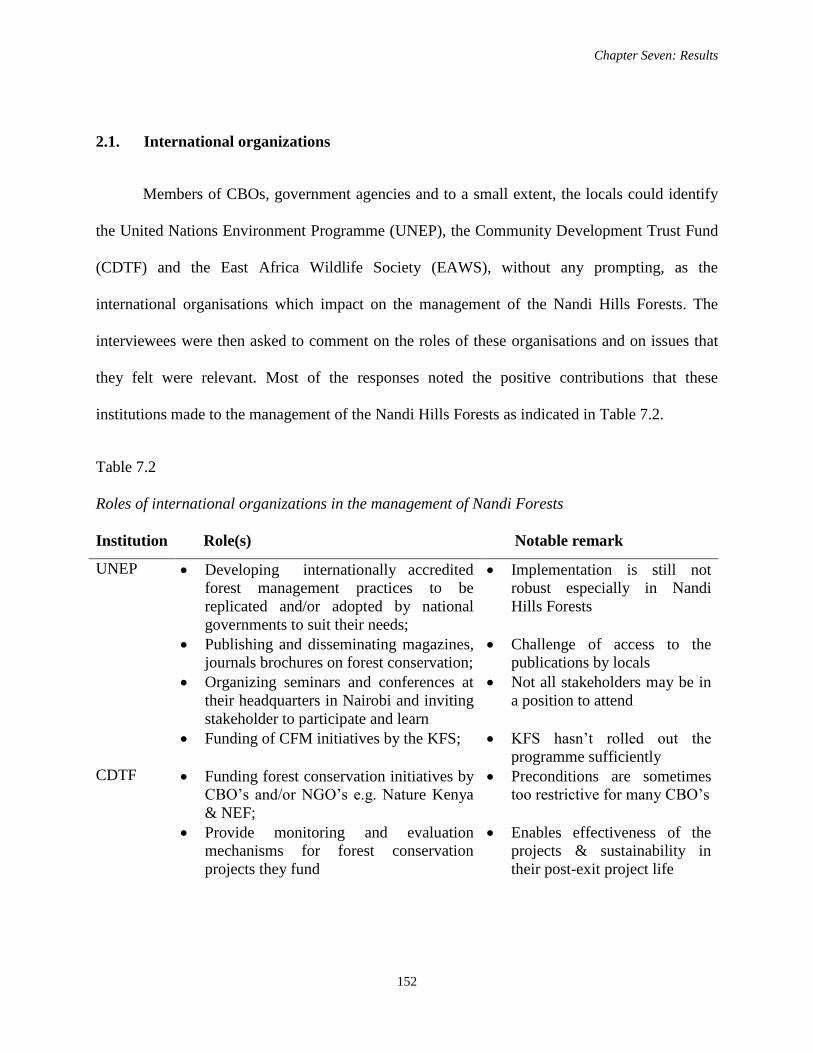
Chapter Seven: Results
152
2.1. International organizations
Members of CBOs, government agencies and to a small extent, the locals could identify
the United Nations Environment Programme (UNEP), the Community Development Trust Fund
(CDTF) and the East Africa Wildlife Society (EAWS), without any prompting, as the
international organisations which impact on the management of the Nandi Hills Forests. The
interviewees were then asked to comment on the roles of these organisations and on issues that
they felt were relevant. Most of the responses noted the positive contributions that these
institutions made to the management of the Nandi Hills Forests as indicated in Table 7.2.
Table 7.2
Roles of international organizations in the management of Nandi Forests
Institution Role(s) Notable remark
UNEP Developing internationally accredited
forest management practices to be
replicated and/or adopted by national
governments to suit their needs;
Publishing and disseminating magazines,
journals brochures on forest conservation;
Organizing seminars and conferences at
their headquarters in Nairobi and inviting
stakeholder to participate and learn
Funding of CFM initiatives by the KFS;
Implementation is still not
robust especially in Nandi
Hills Forests
Challenge of access to the
publications by locals
Not all stakeholders may be in
a position to attend
KFS hasn‟t rolled out the
programme sufficiently
CDTF Funding forest conservation initiatives by
CBO‟s and/or NGO‟s e.g. Nature Kenya
& NEF;
Provide monitoring and evaluation
mechanisms for forest conservation
projects they fund
Preconditions are sometimes
too restrictive for many CBO‟s
Enables effectiveness of the
projects & sustainability in
their post-exit project life
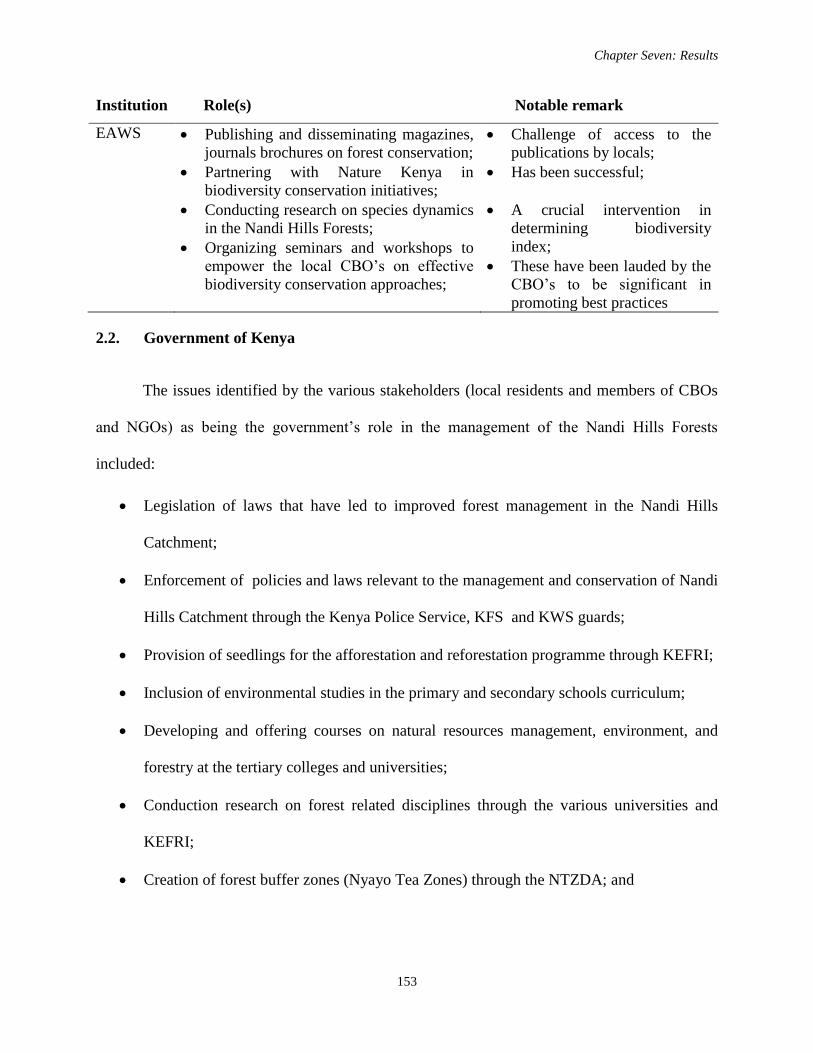
Chapter Seven: Results
153
Institution Role(s) Notable remark
EAWS Publishing and disseminating magazines,
journals brochures on forest conservation;
Partnering with Nature Kenya in
biodiversity conservation initiatives;
Conducting research on species dynamics
in the Nandi Hills Forests;
Organizing seminars and workshops to
empower the local CBO‟s on effective
biodiversity conservation approaches;
Challenge of access to the
publications by locals;
Has been successful;
A crucial intervention in
determining biodiversity
index;
These have been lauded by the
CBO‟s to be significant in
promoting best practices
2.2. Government of Kenya
The issues identified by the various stakeholders (local residents and members of CBOs
and NGOs) as being the government‟s role in the management of the Nandi Hills Forests
included:
Legislation of laws that have led to improved forest management in the Nandi Hills
Catchment;
Enforcement of policies and laws relevant to the management and conservation of Nandi
Hills Catchment through the Kenya Police Service, KFS and KWS guards;
Provision of seedlings for the afforestation and reforestation programme through KEFRI;
Inclusion of environmental studies in the primary and secondary schools curriculum;
Developing and offering courses on natural resources management, environment, and
forestry at the tertiary colleges and universities;
Conduction research on forest related disciplines through the various universities and
KEFRI;
Creation of forest buffer zones (Nyayo Tea Zones) through the NTZDA; and
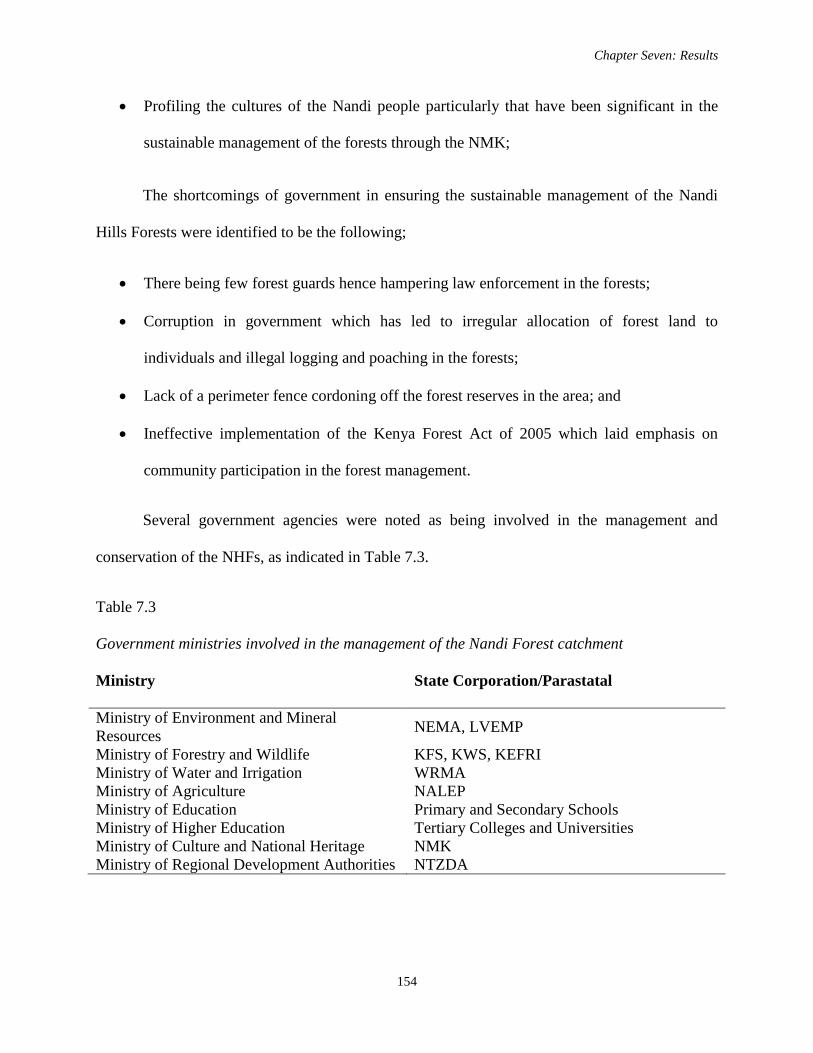
Chapter Seven: Results
154
Profiling the cultures of the Nandi people particularly that have been significant in the
sustainable management of the forests through the NMK;
The shortcomings of government in ensuring the sustainable management of the Nandi
Hills Forests were identified to be the following;
There being few forest guards hence hampering law enforcement in the forests;
Corruption in government which has led to irregular allocation of forest land to
individuals and illegal logging and poaching in the forests;
Lack of a perimeter fence cordoning off the forest reserves in the area; and
Ineffective implementation of the Kenya Forest Act of 2005 which laid emphasis on
community participation in the forest management.
Several government agencies were noted as being involved in the management and
conservation of the NHFs, as indicated in Table 7.3.
Table 7.3
Government ministries involved in the management of the Nandi Forest catchment
Ministry State Corporation/Parastatal
Ministry of Environment and Mineral
Resources NEMA, LVEMP
Ministry of Forestry and Wildlife KFS, KWS, KEFRI
Ministry of Water and Irrigation WRMA
Ministry of Agriculture NALEP
Ministry of Education Primary and Secondary Schools
Ministry of Higher Education Tertiary Colleges and Universities
Ministry of Culture and National Heritage NMK
Ministry of Regional Development Authorities NTZDA
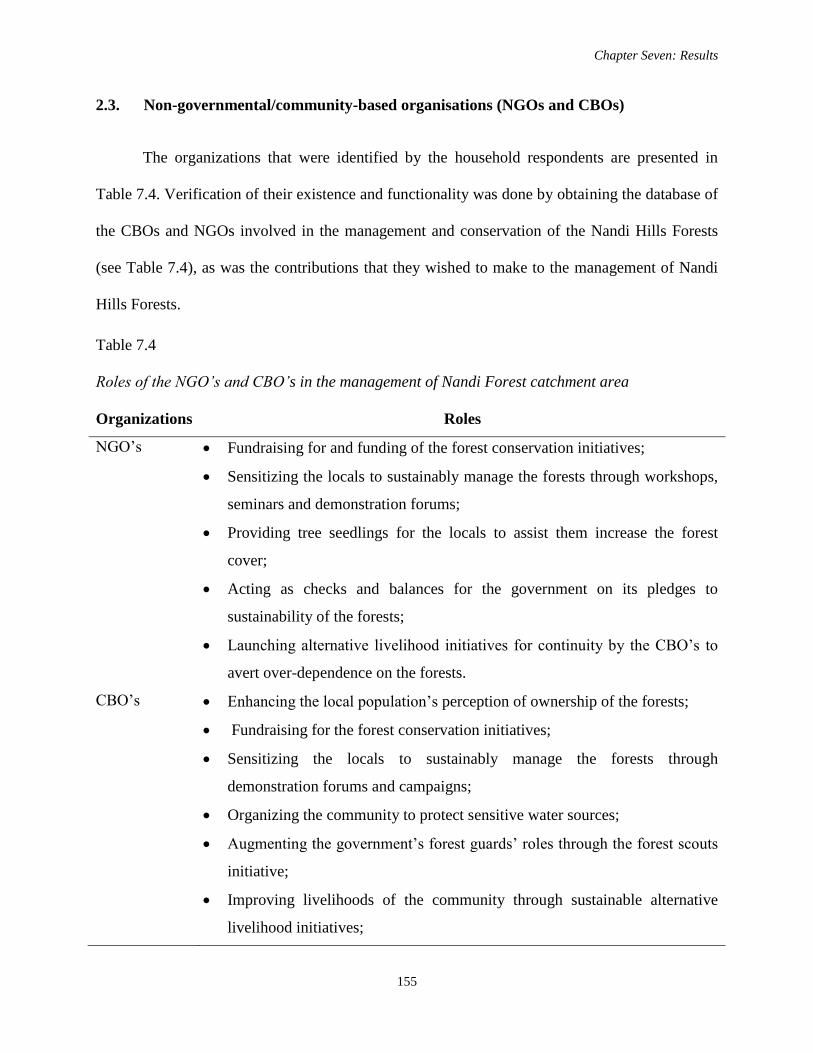
Chapter Seven: Results
155
2.3. Non-governmental/community-based organisations (NGOs and CBOs)
The organizations that were identified by the household respondents are presented in
Table 7.4. Verification of their existence and functionality was done by obtaining the database of
the CBOs and NGOs involved in the management and conservation of the Nandi Hills Forests
(see Table 7.4), as was the contributions that they wished to make to the management of Nandi
Hills Forests.
Table 7.4
Roles of the NGO’s and CBO’s in the management of Nandi Forest catchment area
Organizations Roles
NGO‟s Fundraising for and funding of the forest conservation initiatives;
Sensitizing the locals to sustainably manage the forests through workshops,
seminars and demonstration forums;
Providing tree seedlings for the locals to assist them increase the forest
cover;
Acting as checks and balances for the government on its pledges to
sustainability of the forests;
Launching alternative livelihood initiatives for continuity by the CBO‟s to
avert over-dependence on the forests.
CBO‟s Enhancing the local population‟s perception of ownership of the forests;
Fundraising for the forest conservation initiatives;
Sensitizing the locals to sustainably manage the forests through
demonstration forums and campaigns;
Organizing the community to protect sensitive water sources;
Augmenting the government‟s forest guards‟ roles through the forest scouts
initiative;
Improving livelihoods of the community through sustainable alternative
livelihood initiatives;
Chapter Seven: Results
156
3. LAND USE IN THE NANDI HILLS DISTRICT OF KENYA
A database on land use within the administrative boundaries of the Nandi District was
generated via GIS and Remote Sensing (Landsat images of 1994, 1999, 2003 and 2008, thematic
layers clipped from Kenya and Nandi District images that include forests and vegetation), ground
truthing (observations and photographs taken in the field from 2007 to 2010), questionnaires
completed by members of the sample of households, and key informant interviews.
3.1. Remote sensing and GIS
Remote Sensing and GIS data were generated by obtaining Landsat images from the
Regional Centre for Mapping of Resources for Development in Nairobi. Broad classes of land
use/land cover were established and classified images of the land cover prepared following the
supervised classification criteria. These included: forest (areas under total forest cover), shrubs
(areas with continuous un-interrupted interrupted shrub cover), tea (areas with total tea
vegetation cover), grasslands (areas with continuous un-interrupted and interrupted grass cover)
and bare ground. The preliminary images interpretation was done in reference to the five land
use and/or land cover classes (created following the procedure outlined in figure 6.3). These
included land use/land cover typologies from 1994, 1999, 2003 and 2008 from the respective
Landsat images. The results of spatiotemporal variability in land use based on false colour
composite Landsat images prepared from the clipped bands 2, 3 and 4 of the 1994, 1999, 2003
and 2008 revealed the variation in land cover and land uses within the study sites. PCA was
undertaken for the acquired images for purposes of change detection for the five classes of the
training area.
Chapter Seven: Results
157
Areas for supervised classification were computed using Idrisi Kilimanjaro GIS analysis
area computation software. This classification was carried out by prompting the software to run
GIS analysis for specific areas in the training site. During the supervised classification of the
satellite data for change detection, the analysis software was instructed to adhere to the earlier
created land use classes. The preliminary images interpretation was done in reference to the five
land use and or land cover classes (created during the initial interpretation). These included land
use /land cover typologies from 1994, 1999, 2003 and 2008 from the respective Landsat images
(the classes were created based on observers‟ own image interpretation skills).
The resultant Landsat images for detection of changes of different land uses and land
cover classes in the study area are presented below (processed Landsat satellite images of 1994,
1999, 2003 and 2008 in Figures 7.2, 7.3, 7.4 and 7.5 respectively)
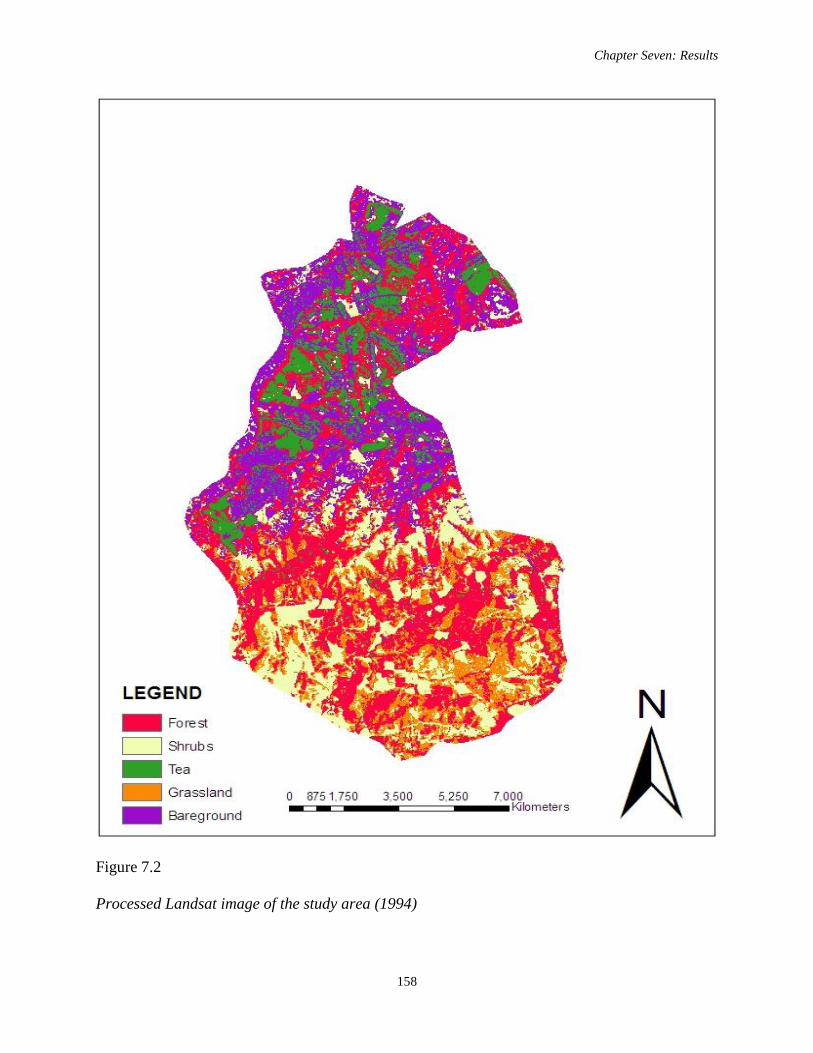
Chapter Seven: Results
158
Figure 7.2
Processed Landsat image of the study area (1994)
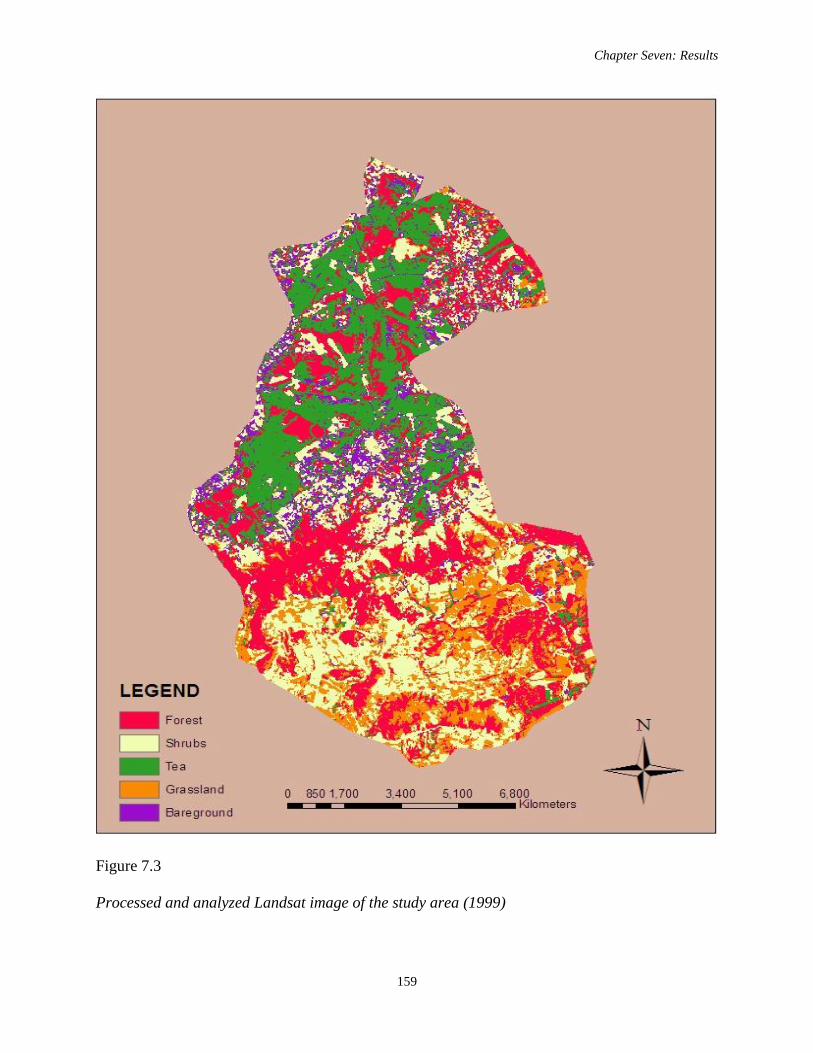
Chapter Seven: Results
159
Figure 7.3
Processed and analyzed Landsat image of the study area (1999)
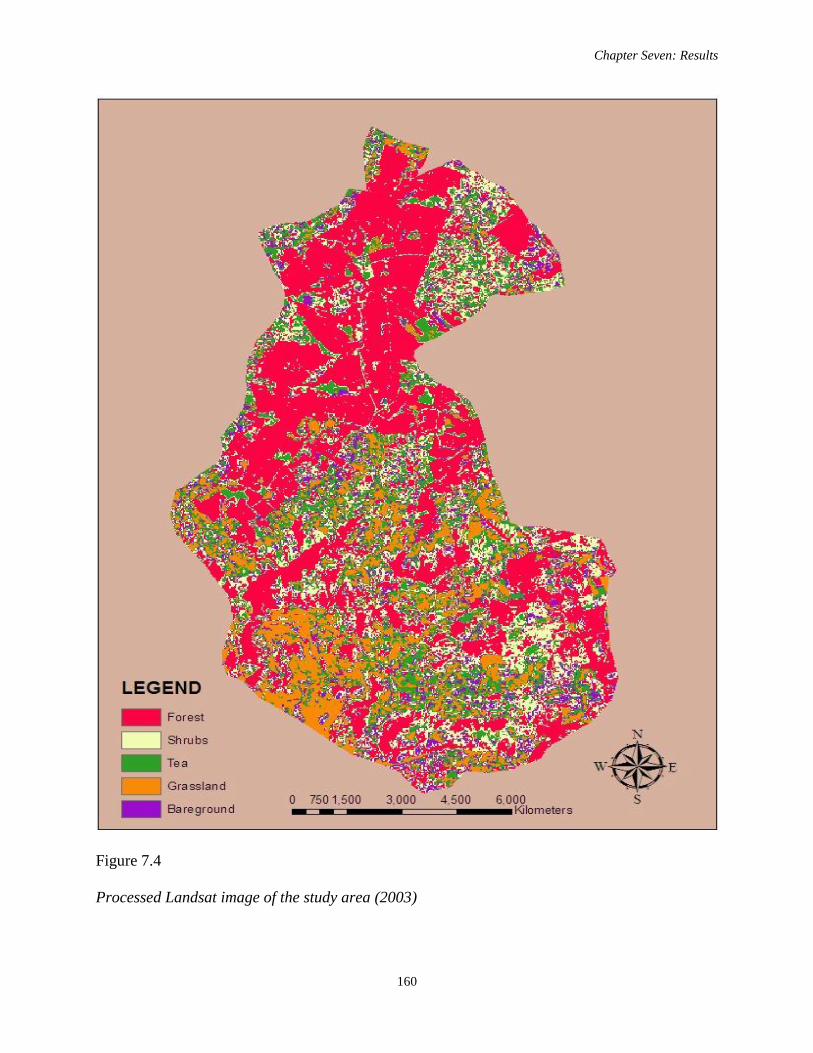
Chapter Seven: Results
160
Figure 7.4
Processed Landsat image of the study area (2003)
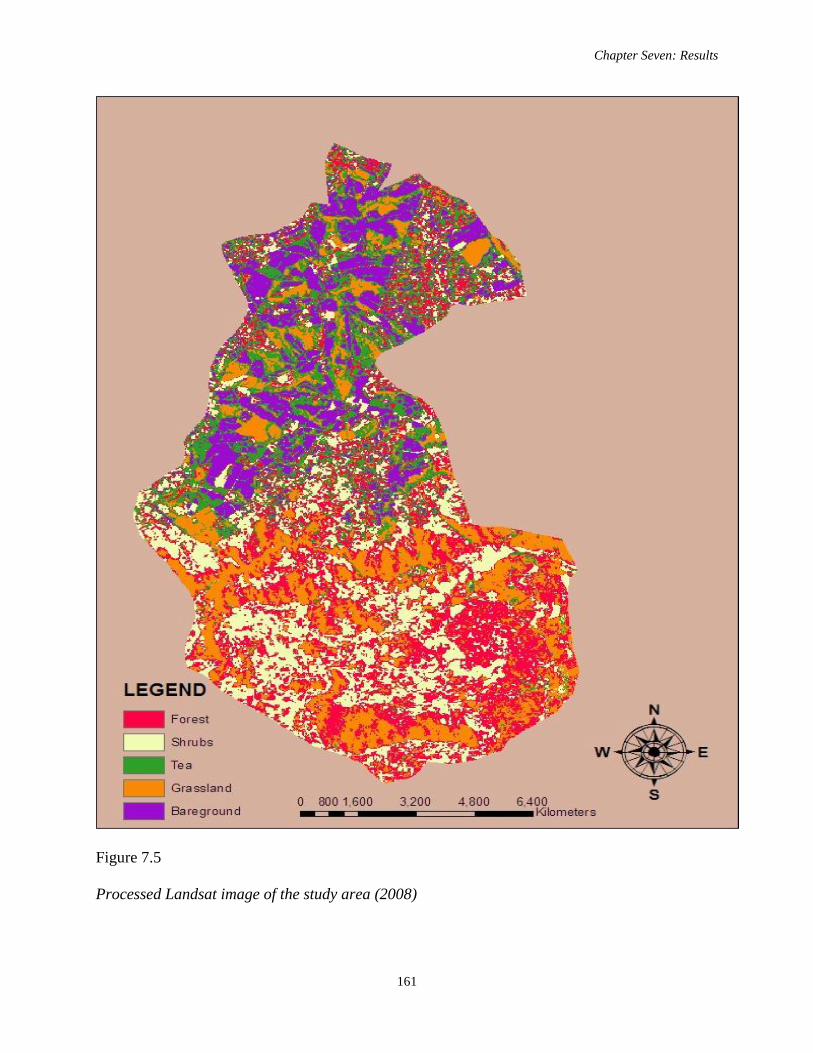
Chapter Seven: Results
161
Figure 7.5
Processed Landsat image of the study area (2008)
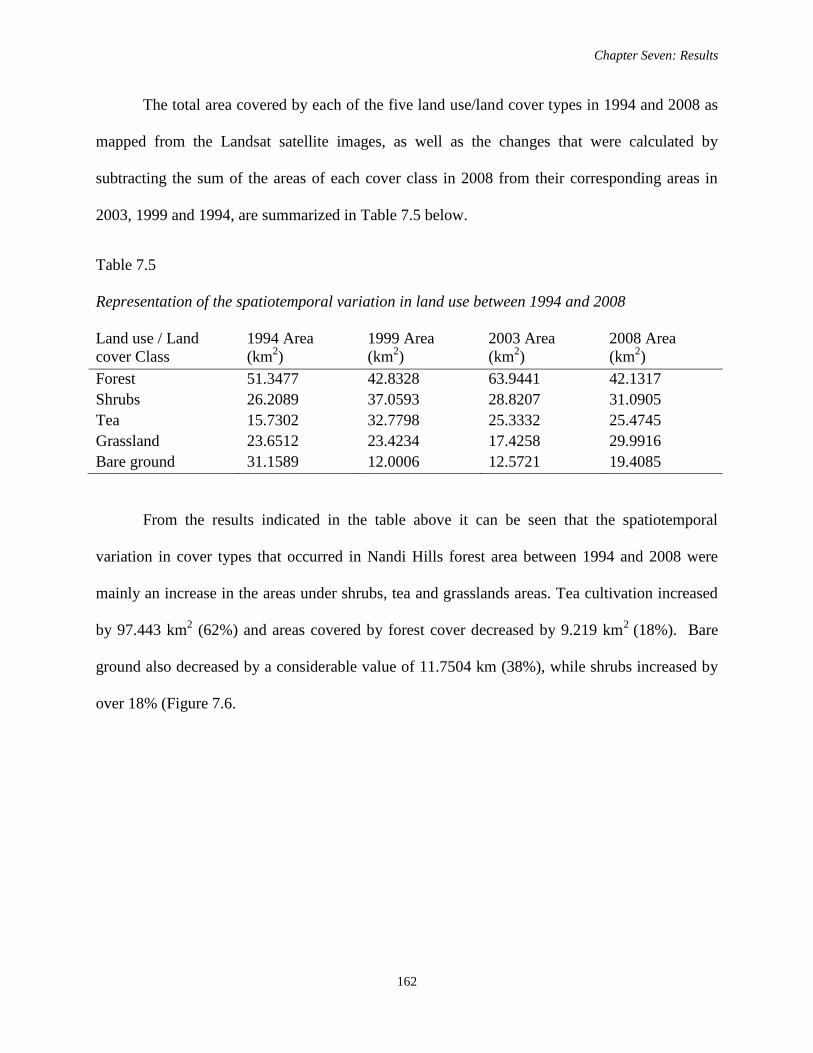
Chapter Seven: Results
162
The total area covered by each of the five land use/land cover types in 1994 and 2008 as
mapped from the Landsat satellite images, as well as the changes that were calculated by
subtracting the sum of the areas of each cover class in 2008 from their corresponding areas in
2003, 1999 and 1994, are summarized in Table 7.5 below.
Table 7.5
Representation of the spatiotemporal variation in land use between 1994 and 2008
Land use / Land
cover Class
1994 Area
(km2)
1999 Area
(km2)
2003 Area
(km2)
2008 Area
(km2)
Forest 51.3477 42.8328 63.9441 42.1317
Shrubs 26.2089 37.0593 28.8207 31.0905
Tea 15.7302 32.7798 25.3332 25.4745
Grassland 23.6512 23.4234 17.4258 29.9916
Bare ground 31.1589 12.0006 12.5721 19.4085
From the results indicated in the table above it can be seen that the spatiotemporal
variation in cover types that occurred in Nandi Hills forest area between 1994 and 2008 were
mainly an increase in the areas under shrubs, tea and grasslands areas. Tea cultivation increased
by 97.443 km2 (62%) and areas covered by forest cover decreased by 9.219 km
2 (18%). Bare
ground also decreased by a considerable value of 11.7504 km (38%), while shrubs increased by
over 18% (Figure 7.6.
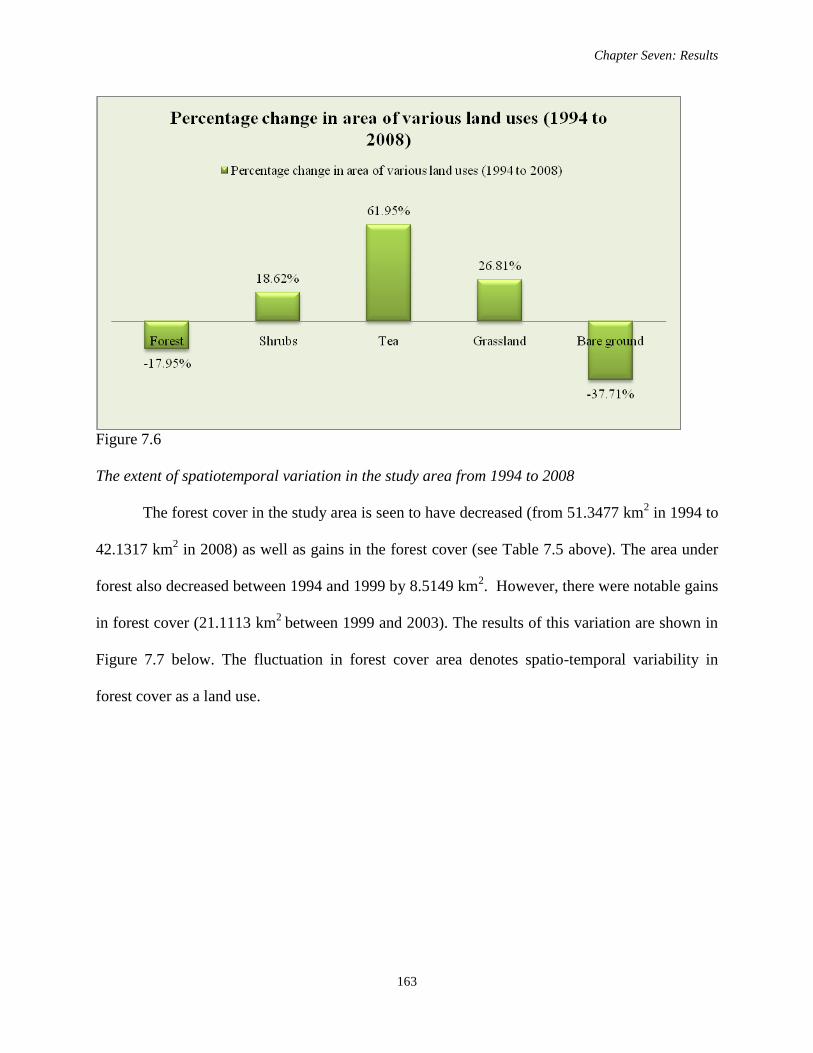
Chapter Seven: Results
163
Figure 7.6
The extent of spatiotemporal variation in the study area from 1994 to 2008
The forest cover in the study area is seen to have decreased (from 51.3477 km2 in 1994 to
42.1317 km2 in 2008) as well as gains in the forest cover (see Table 7.5 above). The area under
forest also decreased between 1994 and 1999 by 8.5149 km2. However, there were notable gains
in forest cover (21.1113 km2
between 1999 and 2003). The results of this variation are shown in
Figure 7.7 below. The fluctuation in forest cover area denotes spatio-temporal variability in
forest cover as a land use.
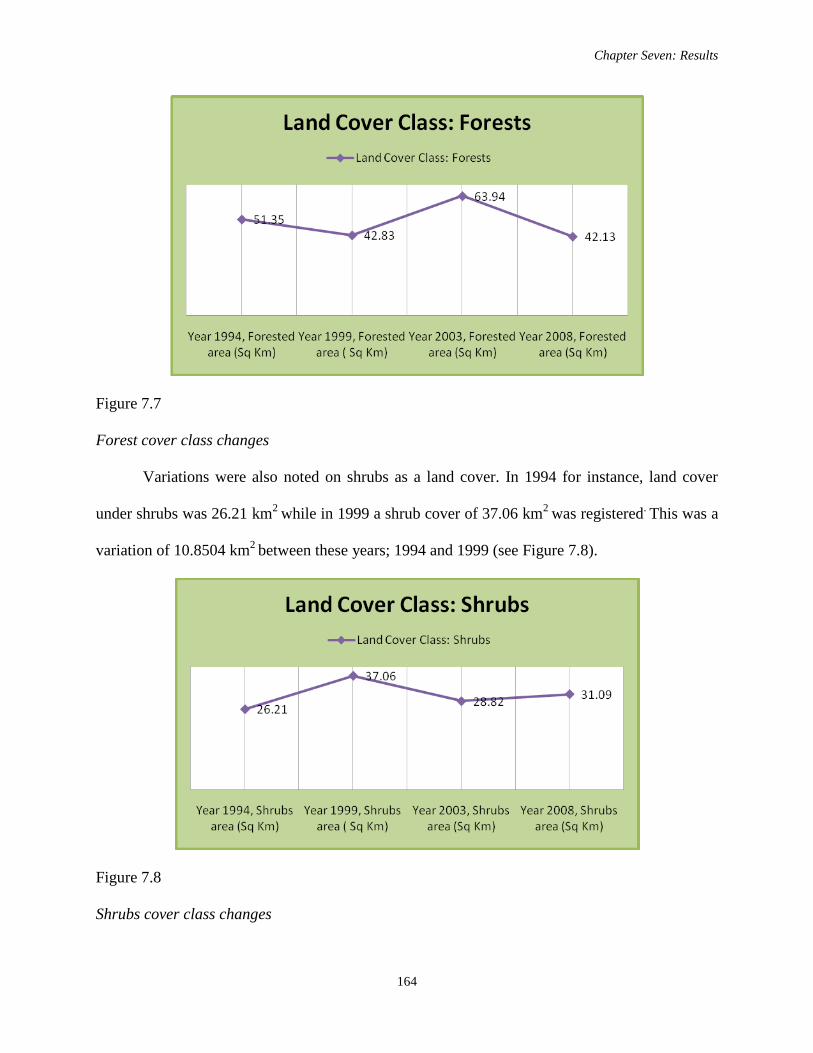
Chapter Seven: Results
164
Figure 7.7
Forest cover class changes
Variations were also noted on shrubs as a land cover. In 1994 for instance, land cover
under shrubs was 26.21 km2
while in 1999 a shrub cover of 37.06 km2
was registered. This was a
variation of 10.8504 km2
between these years; 1994 and 1999 (see Figure 7.8).
Figure 7.8
Shrubs cover class changes
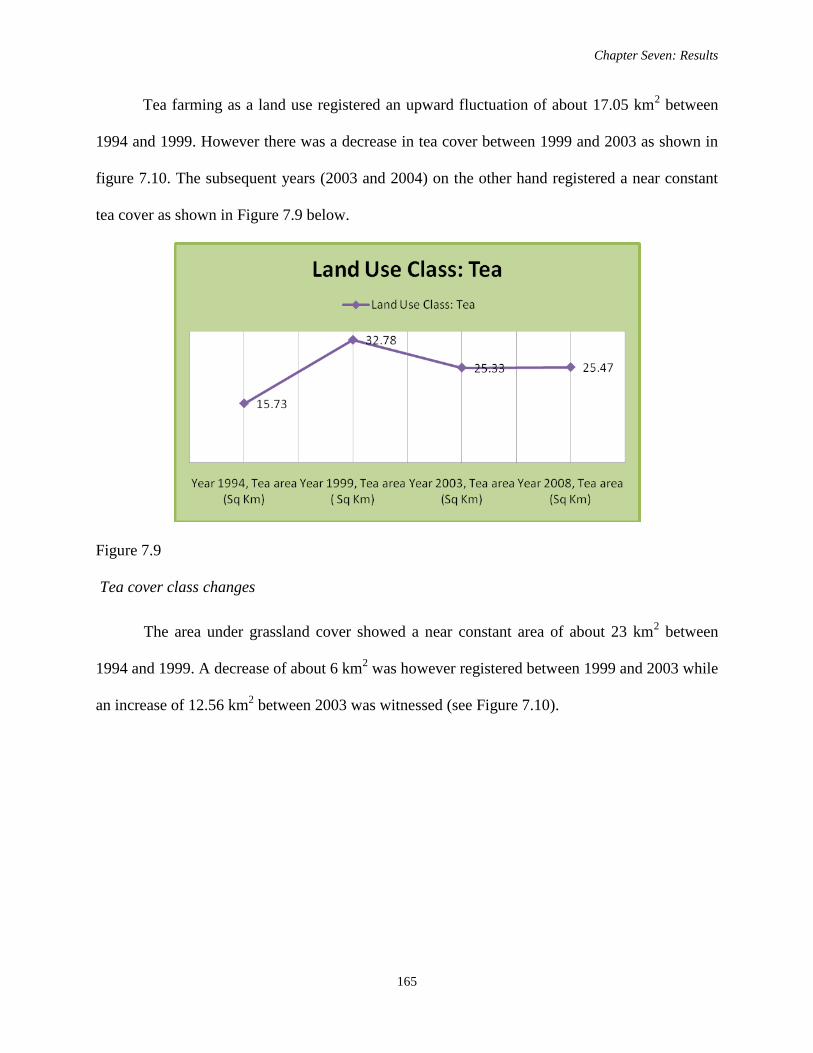
Chapter Seven: Results
165
Tea farming as a land use registered an upward fluctuation of about 17.05 km2 between
1994 and 1999. However there was a decrease in tea cover between 1999 and 2003 as shown in
figure 7.10. The subsequent years (2003 and 2004) on the other hand registered a near constant
tea cover as shown in Figure 7.9 below.
Figure 7.9
Tea cover class changes
The area under grassland cover showed a near constant area of about 23 km2 between
1994 and 1999. A decrease of about 6 km2 was however registered between 1999 and 2003 while
an increase of 12.56 km2 between 2003 was witnessed (see Figure 7.10).
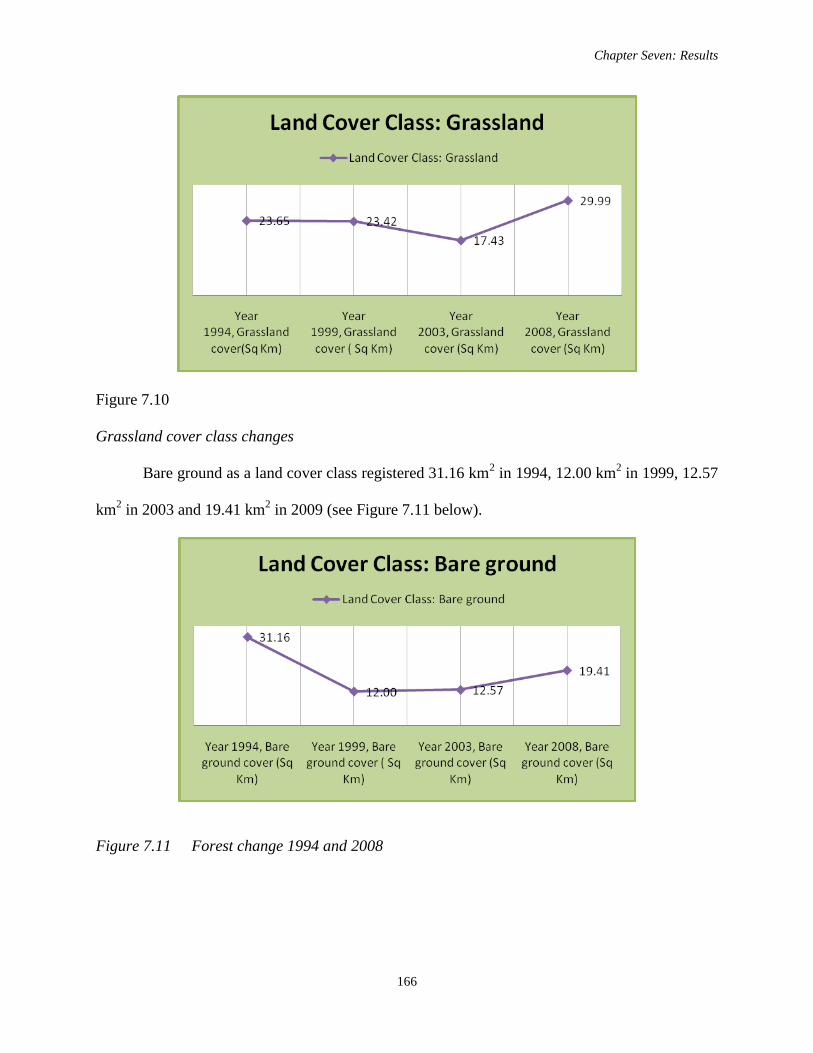
Chapter Seven: Results
166
Figure 7.10
Grassland cover class changes
Bare ground as a land cover class registered 31.16 km2 in 1994, 12.00 km
2 in 1999, 12.57
km2 in 2003 and 19.41 km
2 in 2009 (see Figure 7.11 below).
Figure 7.11 Forest change 1994 and 2008
Chapter Seven: Results
167
3.2. Ground truthing and verification
The results presented in this section are informed by on-site inspection, analysis of the
responses on the household questionnaires, information from key informant interviews,
interpretation of photographs taken in the field, and the researcher‟s field notes.
3.2.1. Forests
Preliminary findings from the empirical study based on satellite images shows that more
than 10% of forest land has been transformed from primary forests to farm lands between 1994
and 2008 alone. Such changes usually have a serious consequence on both the native forest
species of trees and animals. Household data not only supported the visual observation of
satellite imagery between 1994 and 2008 which revealed that there was a reduction in the density
of trees in the forests, but indicated that this trend emanated from activities undertaken by
households like illegal logging, honey harvesting and firewood poaching for fuel wood. The
intensification of grazing in the forests, a consequence of climate change (extreme dry weather
and unpredictable rainfall), has resulted in the destruction of forest undergrowth with subsequent
consequences to biodiversity and environmental aesthetics, such as leaving the forest ground
bare and susceptible to soil erosion.
Even when unaccompanied by apparent changes in land cover, similar effects are
observed whenever relatively undisturbed forest lands are transformed to more intensive uses,
including livestock grazing and selective tree harvest. Ground truthing by on-site inspection
confirmed the remote sensing data and revealed that the fragmenting of existing habitat into
smaller pieces (habitat fragmentation), which exposes forest edges to external influences, had a
negative impact on the core habitat of forests in the study area.
Chapter Seven: Results
168
For example, vegetation removal has made the soils near the Cherabus Location, for
instance, vulnerable to increased soil erosion by wind and water, especially on steep terrain. A
significant loss of plant cover biomass, especially from the closed canopy forest, was
documented during the field observations, as was increased intensification of agriculture. A
focus group participant in Chepkong‟ony Location, Nandi Hills District, put it as follows:
“In the past, we could not see any light in the forest because of the thick
undergrowth and overhead canopy cover. Nowadays we could see spaces even a
mile ahead. The small land animals and birds have either been hunted for food or
scared away by the grazers.”
Observation and key informant interviews revealed that illegal logging, charcoal burning
and encroachment for settlement and infrastructural development have been the major drivers of
this forest cover change (see Figure 7.12). Data gathered during interviews revealed that wild
fires occasioned by honey poachers, mostly during the dry seasons, exacerbated the problem. Not
only do changed land-use practices and wildfires degrade soil fertility over time and reduce the
suitability of land for future agricultural use, they also have the potential to release quantities of
phosphorus, nitrogen, and sediments to streams and other aquatic ecosystems, causing a variety
of negative impacts including increased sedimentation and turbidity.
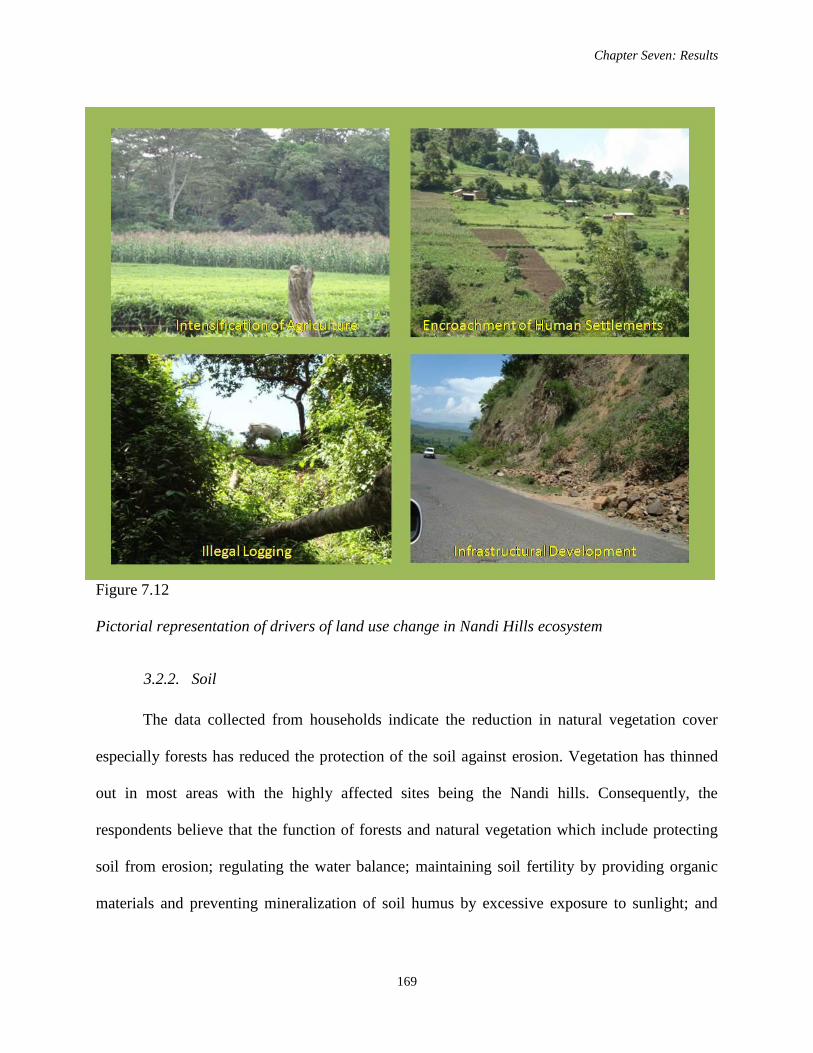
Chapter Seven: Results
169
Figure 7.12
Pictorial representation of drivers of land use change in Nandi Hills ecosystem
3.2.2. Soil
The data collected from households indicate the reduction in natural vegetation cover
especially forests has reduced the protection of the soil against erosion. Vegetation has thinned
out in most areas with the highly affected sites being the Nandi hills. Consequently, the
respondents believe that the function of forests and natural vegetation which include protecting
soil from erosion; regulating the water balance; maintaining soil fertility by providing organic
materials and preventing mineralization of soil humus by excessive exposure to sunlight; and
Chapter Seven: Results
170
supplying important products for human and animal nutrition (including medicines) are now
impaired and in some instances completely eliminated.
In the course of the field work it was observed that there was a widespread loss of soil
surface layer as a result of wind and water erosion with a number of consequences. In some
instances land surface has been devegetated and the soil surface, being not permanently
protected, has been eroded by wind and running water. Such soils are characterized by an
incremental fertility loss (soil nutrient depletion) evidenced in decreasing land productivity over
time. The soils have a reduced ability to sustain plant growth thus increasing the encroachment
of desert-like conditions. Soil loss through water and wind activity have led to soil surface
sealing and encrustation of topsoil reducing water intake resulting in a drier environment;
indications of a spiral of edaphic aridity which continues as a self-catalytic effect.
The study site is now characterized by widespread soil degradation caused by
deforestation and domestic overexploitation of vegetation. Patches cleared within the forest in
anticipation of finding good soils to support agriculture have become bare ground and patches of
bare ground and mono-cropping of tea in farm holdings has significantly reduced the ability of
water percolation into the soil.
The intensification of agriculture as a land use with emphasis on tea production
accompanied by increase in the use of agricultural chemicals, including herbicides and pesticides
released to ground and surface waters in some cases have remained as contaminants in the soil.
The burning of vegetation biomass to clear agricultural fields (crop residues, weeds and pests)
remain a potentially potent contributor to air pollution in the locality.
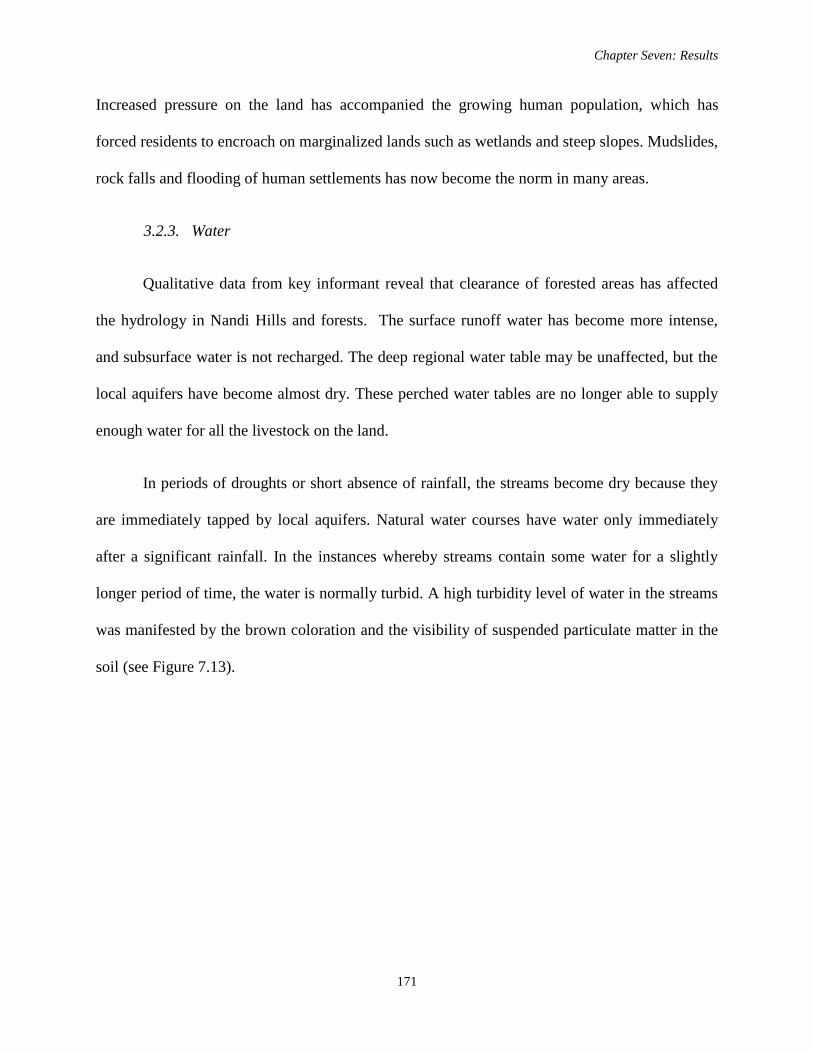
Chapter Seven: Results
171
Increased pressure on the land has accompanied the growing human population, which has
forced residents to encroach on marginalized lands such as wetlands and steep slopes. Mudslides,
rock falls and flooding of human settlements has now become the norm in many areas.
3.2.3. Water
Qualitative data from key informant reveal that clearance of forested areas has affected
the hydrology in Nandi Hills and forests. The surface runoff water has become more intense,
and subsurface water is not recharged. The deep regional water table may be unaffected, but the
local aquifers have become almost dry. These perched water tables are no longer able to supply
enough water for all the livestock on the land.
In periods of droughts or short absence of rainfall, the streams become dry because they
are immediately tapped by local aquifers. Natural water courses have water only immediately
after a significant rainfall. In the instances whereby streams contain some water for a slightly
longer period of time, the water is normally turbid. A high turbidity level of water in the streams
was manifested by the brown coloration and the visibility of suspended particulate matter in the
soil (see Figure 7.13).
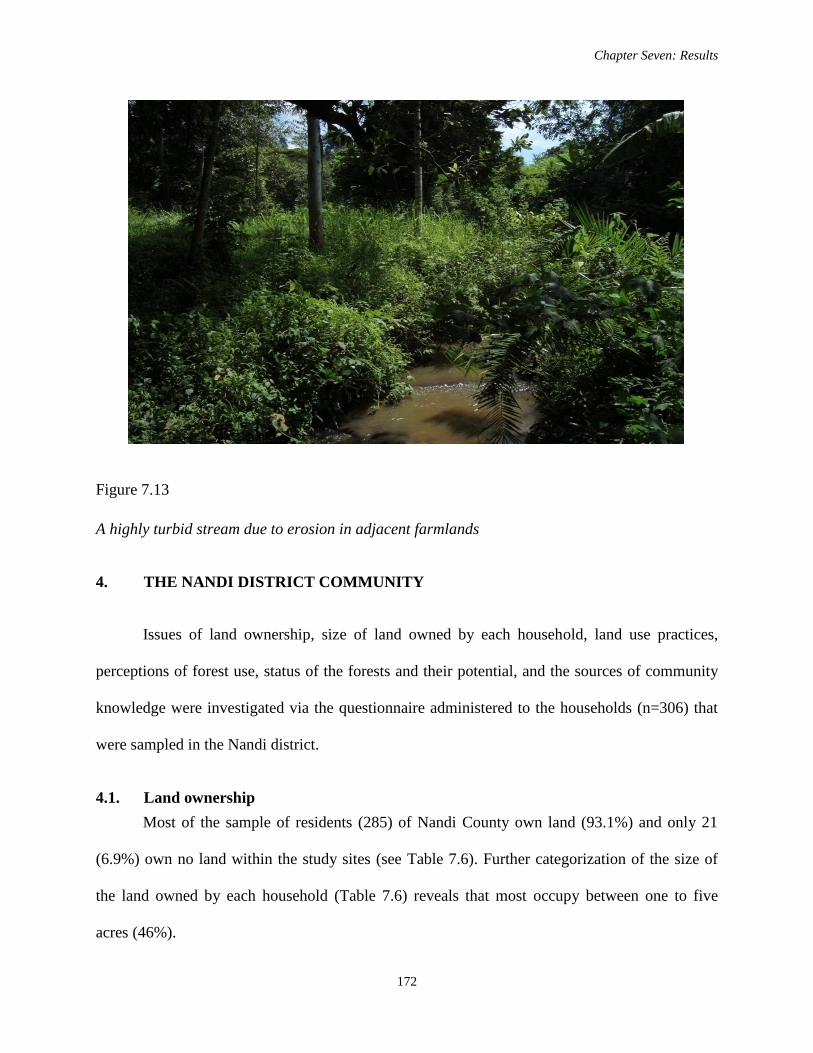
Chapter Seven: Results
172
Figure 7.13
A highly turbid stream due to erosion in adjacent farmlands
4. THE NANDI DISTRICT COMMUNITY
Issues of land ownership, size of land owned by each household, land use practices,
perceptions of forest use, status of the forests and their potential, and the sources of community
knowledge were investigated via the questionnaire administered to the households (n=306) that
were sampled in the Nandi district.
4.1. Land ownership
Most of the sample of residents (285) of Nandi County own land (93.1%) and only 21
(6.9%) own no land within the study sites (see Table 7.6). Further categorization of the size of
the land owned by each household (Table 7.6) reveals that most occupy between one to five
acres (46%).
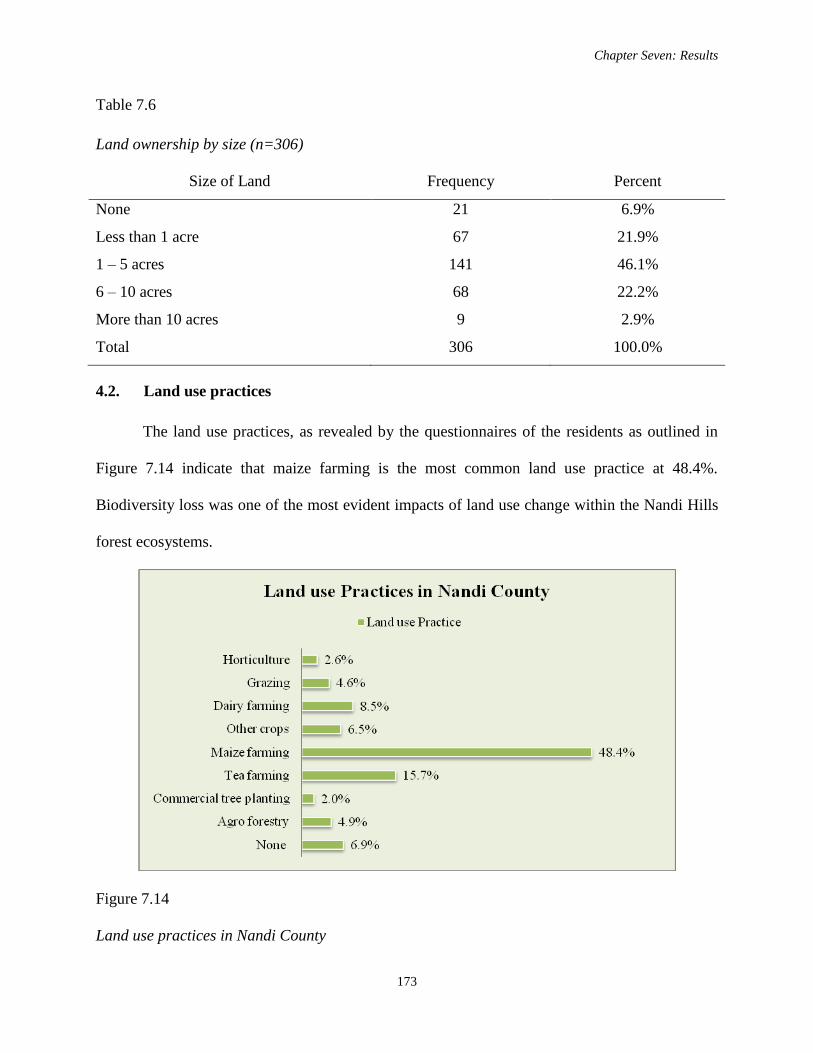
Chapter Seven: Results
173
Table 7.6
Land ownership by size (n=306)
Size of Land Frequency Percent
None 21 6.9%
Less than 1 acre 67 21.9%
1 – 5 acres 141 46.1%
6 – 10 acres 68 22.2%
More than 10 acres 9 2.9%
Total 306 100.0%
4.2. Land use practices
The land use practices, as revealed by the questionnaires of the residents as outlined in
Figure 7.14 indicate that maize farming is the most common land use practice at 48.4%.
Biodiversity loss was one of the most evident impacts of land use change within the Nandi Hills
forest ecosystems.
Figure 7.14
Land use practices in Nandi County
Chapter Seven: Results
174
4.3. Perceptions of forest use
In part three of the household questionnaires the respondents were asked to indicate if
they felt that the forests were useful to them. A total of 271 respondents, representing 89.4% of
the valid households (n=306), indicated that forest were indeed useful to them by indicating a
„Yes‟ response on the questionnaire. Thirty two respondents (approximately 10% of households
interviewed) said that forest were not useful (see Table 7.9).
Those who had responded that forests were useful to them, when prompted further to list how the
forest were useful to them, provided a variety of responses. These included:
Provide dry season pasture for livestock;
Increase the aesthetic value of the environment;
Are water catchments that attract rainfall and store water for rivers;
Are a source of timber and firewood for domestic and industrial uses;
Act as purifiers of water and air thus ensuring ecosystems balance;
Are habitats for an array of biodiversity including plants, birds, reptiles and other
wild animals;
Are tourists‟ attraction sites that benefit the government and the local communities
through revenues generation
The respondents who indicated forests were not useful to them believed that they are:
Hideouts for thieves;
Havens for wild and dangerous animals;
Only important to the government; and
Chapter Seven: Results
175
Are barriers to extension of farmlands - if one destroys them then one is arrested by
the government
4.4. Perceptions of the current status of the Nandi Hills Forests and their potential
Results of focus group discussions, key informant and household interviews revealed that
a significantly large proportion of the respondents perceived the forest cover in these areas as
rapidly declining. The primary drivers of this trend were noted as intensification of agriculture
and the need of more land for food production to feed the teeming populations. The majority of
households sampled indicated that the forest cover of Nandi Hills Forest has suffered severe
deforestation and degradation through heavy exploitation resulting from an escalating demand
for timber and fuel wood, land for cropping and grazing. They further purported that the
depletion and degradation of the Nandi hills forest are a threat to ecosystem diversity and a
fundamental influence on the declining standard of living of many households. The decline in
forest resources – and a subsequent decline in land productivity and lack of forage and fodder as
well as other tree products and services – was perceived by the farming communities in almost
all the locations in the study site.
The forest community indicated that, tea farming, maize production, horticulture farming
and livestock rearing are the major agricultural activities in these districts. Consequently, more
forest land has been cleared or interfered with to support these activities with a serious loss to
biodiversity and ecosystem services provisioning. The community reported that planting of trees
for water conservation would prevent the drying up of streams that supply domestic water. A tree
called Sesigium in the local language was perceived specifically to help in water purification.
Chapter Seven: Results
176
Further it was widely suggested that this tree species be planted along the riparian areas and in
wetlands for water conservation.
Culturally forests were perceived to have a religio-cultural significance. Among the
Kalenjin groups forest trees and products that were used during circumcision and marriage
ceremonies. The forest also acted as a home for initiates during the rites of passage of male
members of the community up to the time they fully recovered to rejoin the community.
In terms of livelihood support for the households, forests were perceived to provide dry
season grazing relief, honey, wild berries and fruits, wild edible roots and undergrowths that
supplemented peoples‟ diets. It was also noted that the local Kalenjin Community borrowed a lot
of forest conservation practices form the Ogiek, the aboriginal community of Nandi Hills area. A
section of the households also reported that the forest modified the climate by attracting rain and
creating a micro-climate that favoured the production of tea and other agricultural crops. This
was very significant in defining household socioeconomic power.
The study also shows that farmers are very interested in tree planting and are in favour of
private ownership of trees and forests (farm and/or plantation forestry). Tree planting and
forestry at the household level was seen to have the capacity to supplement household incomes.
This could be achieved through planting of fruit trees, fodder trees and beekeeping for small
scale commercial purposes. Protection of natural regeneration is also recognized as an important
complement to tree planting in the rehabilitation of degraded forest landscapes.
4.5. Sources of community knowledge
The household interviews conducted in the eight divisions revealed that virtually all the
respondents were aware of the existence of forests and forest resources around them (98%). Only
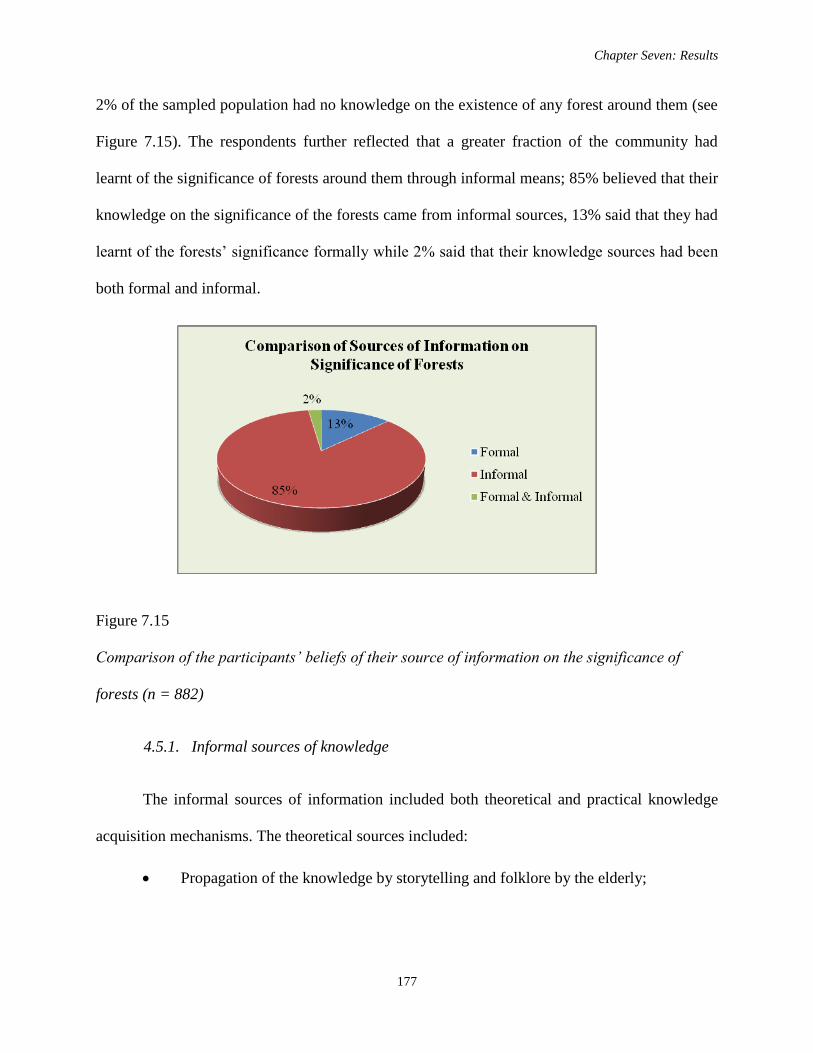
Chapter Seven: Results
177
2% of the sampled population had no knowledge on the existence of any forest around them (see
Figure 7.15). The respondents further reflected that a greater fraction of the community had
learnt of the significance of forests around them through informal means; 85% believed that their
knowledge on the significance of the forests came from informal sources, 13% said that they had
learnt of the forests‟ significance formally while 2% said that their knowledge sources had been
both formal and informal.
Figure 7.15
Comparison of the participants’ beliefs of their source of information on the significance of
forests (n = 882)
4.5.1. Informal sources of knowledge
The informal sources of information included both theoretical and practical knowledge
acquisition mechanisms. The theoretical sources included:
Propagation of the knowledge by storytelling and folklore by the elderly;
Chapter Seven: Results
178
Peer information propagation: peers spreading the knowledge during interactions;
and
Presentation of songs.
The practical sources included:
Proximity knowledge acquisition, which entails learning of the forest existence by
virtue of being a forest adjacent resident;
Default knowledge acquisition on ancestral surrounding by virtue of being born
there; and
Resource destination phenomena: when one accesses the forest as a source for
firewood, pasture, medicine, honey and other raw materials.
4.5.2. Formal sources of knowledge
Despite the prolific effect the indigenous knowledge system has had on the local
community, there still remain a fraction that obtained knowledge on the forest(s) through formal
means. The formal source of the knowledge included:
Lessons in class;
Academic visits to the forests as a fulfillment of coursework in school;
Awareness creation by government agencies such as the KFS, KWS, NTZDA and
NEMA;
Attending seminars and workshops organized by the local CBO‟s; and
Print and electronic media.
Chapter Seven: Results
179
4.5.3. Integration of formal knowledge and informal knowledge sources
The data sources of knowledge on forest management and conservation that were
gathered through household interviews were placed in categories. After categorization, key
informant interviews (KIIs) were conducted with 18 key informants where they were asked to
identify scenarios of integration of formal and informal sources of knowledge that they had
experienced. Their responses are presented in Table 7.8.
Inspection of the table suggests that opportunities exist for storytelling, peer information
propagation, proximity knowledge acquisition, and default knowledge acquisition in school
classrooms. Proximity knowledge acquisition has also taken place during formal seminars and
during awareness creation by government. Resource destination learning has taken place during
awareness creation by government, while the print and electronic media have only contributed to
knowledge acquisition related to resource destination phenomena.
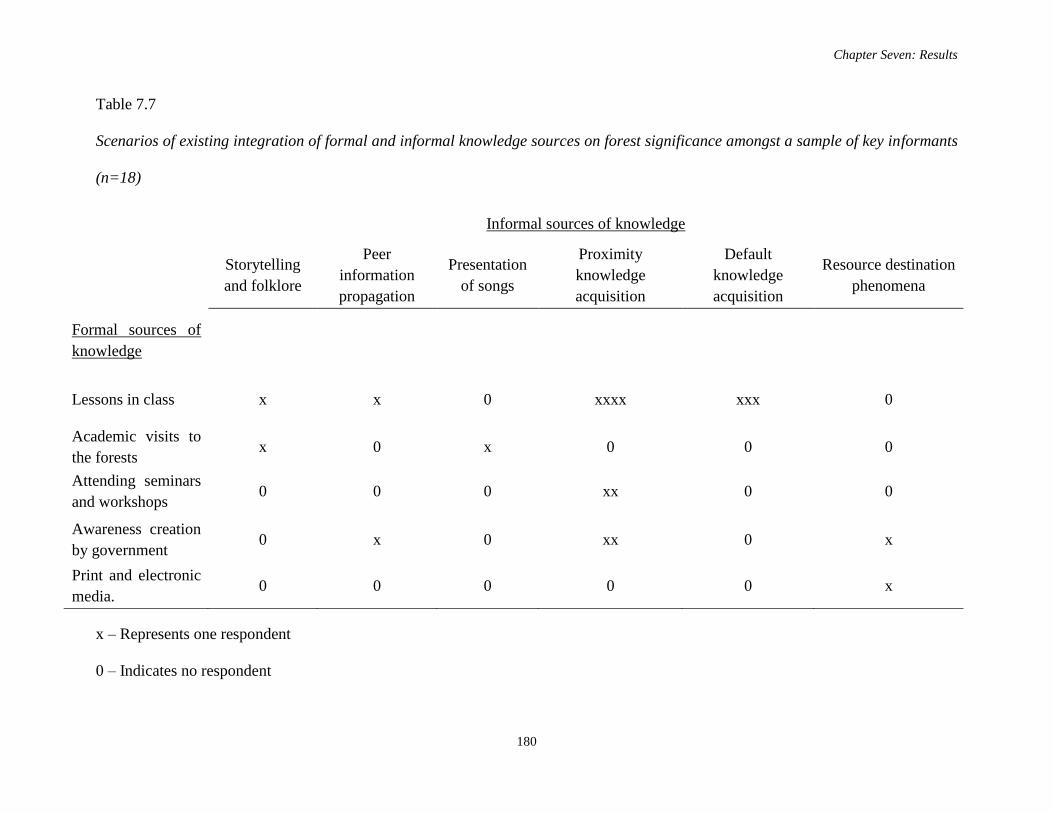
Chapter Seven: Results
180
Table 7.7
Scenarios of existing integration of formal and informal knowledge sources on forest significance amongst a sample of key informants
(n=18)
Informal sources of knowledge
Storytelling
and folklore
Peer
information
propagation
Presentation
of songs
Proximity
knowledge
acquisition
Default
knowledge
acquisition
Resource destination
phenomena
Formal sources of
knowledge
Lessons in class x x 0 xxxx xxx 0
Academic visits to
the forests x 0 x 0 0 0
Attending seminars
and workshops 0 0 0 xx 0 0
Awareness creation
by government 0 x 0 xx 0 x
Print and electronic
media. 0 0 0 0 0 x
x – Represents one respondent
0 – Indicates no respondent
Chapter Seven: Results
181
5. CHAPTER SUMMARY
In this chapter the institutions that impact on the management of the Nandi Hills Forests
are documented and their roles in the eyes of local stakeholders are interrogated. The extent of
spatiotemporal variability in land use in the forest and its catchment is investigated using GIS,
Remote Sensing and ground truthing data. Finally, the local community‟s (householders)
perceptions of the utilization practices in the forest resources of Nandi Hills and Nandi Forests,
their current status and their potential, as well as the formal and informal sources of their
knowledge, are considered.
Chapter Eight: Discussion
182
CHAPTER EIGHT
DISCUSSION
1. INTRODUCTION
This chapter discusses the findings of the study in terms of current environmental
education and institutional arrangements and policy frameworks in and around the Nandi forests
and considers the extent of spatiotemporal variation in land use in the Nandi district, the impact
of these changes, and the use of such information in terms of promoting local community
environmental education. Community perceptions on utilization of forest resources and their
implications are also considered. The research sub-questions in this study guide the discussion.
An integrated community environmental education heuristic for sustainable forest management
is also presented.
2. ENVIRONMENTAL EDUCATION AND CONSERVATION IN AND AROUND
THE NANDI FORESTS
This sub-section interrogates the findings in chapter seven in terms of the formal and
informal contributors to environmental education in the Nandi Hills area in an attempt to answer
the first research sub-question that is required to be answered when attempting to answer the
main research question in this study, viz.:
What are the formal and informal environmental education and management
practices that exist that could be meaningfully integrated into the heuristic?
Chapter Eight: Discussion
183
2.1. Formal education and management practices
The sustainable management of forests, such as those in the Nandi Hills, depends on
environmental education, and the institutionalization of environmental education has acted as an
interface for the informal environmental education and formal environmental education (Mula &
Tilbury, 2011). The results generated from this study reveal that there are a range of institutions
and institutional arrangements which aim at influencing the management of the Nandi Forests.
These institutions, which mainly include NGOs, local CBOs and the Government of Kenya, play
a variety of specific and/or general roles in the day to day management of forests in Nandi
County and have had an impact in the area.
In as much as the findings of this study reveals that most of the residents of the Nandi
County (67%) are aware of existing relevant institutions in the management of the Nandi Forests,
the remaining 33% represent a significant number of people who need to be reached if
institutional frameworks geared towards strengthening the knowledge base of forestry in Africa
(without which major advancements are prone to bypass the African forest sector) are to benefit
the majority of local inhabitants (Matiru, 1999).
While there are a number of forestry-relevant international organisations, government
agencies and NGOs which are active in the Nandi County, it is important to note the significant
number of CBO‟s undertaking various projects in the water catchment area. The existence of
these CBOs is an indicator of the involvement of the local community in the management of the
forests. Such involvement of the forest adjacent communities in the management and
conservation of the forests are an important factor if sustainable management is to be achieved as
the literature previously reviewed in this study suggest that the influence of such organisations
provide access to conferences, insight into development plans and, in turn, a broad but
Chapter Eight: Discussion
184
sometimes grudging acceptance by the development community of the value of local/indigenous
knowledge as part of a shift in addressing the direct concerns of the poor (Warren, 1991, 1992;
World Bank, 2000; Shepherd, 2001; Hubbard, 2001).
2.1.1. International organisations
International organizations have been active mainly as partners on issues of sustainable
forest management and biodiversity conservation. Apart from playing a funding role, they have
played a logistical role or have initiated projects whose implementation rested on the
government, CBO‟s and/or (see Table 7.3 and 7.4). While emphasizing globally acceptable
practices, they have encouraged the localization of these practices to promote relevance and
effectiveness.
2.1.2. Government of Kenya
The Government of Kenya is the major institutional player in the management of the
Nandi Hills Forests and other forests within the country. The FAO (2006) confirms that
government forestry institutions remain the single-most dominant player in the sector and that
more than 80% of global forests are under public jurisdiction. The government plays a
significant role in protecting its natural resources and protecting its citizens from adverse natural
and technological mishaps (World Bank, 2002). In 2008, following a contested presidential
election, a coalition government was formed and since then the number of ministries were
increased to forty. These ministries have been active in one way or the other in the affairs of the
Nandi Hills water catchment zone, and the fact that they were identified by members of local
communities (Table 7.5) suggests that they believe that the government has a pivotal role in
ensuring the forests are well managed.
Chapter Eight: Discussion
185
2.1.3. NGOs and CBOs
A number of NGOs and CBOs are recognised as being actively involved in the Nandi
Hills, either working in partnership with communities, or fully constituted by members of the
local community. These organizations have increased in number, especially after the passing of
the Kenya Forest Act of 2005, which recognized the importance of stakeholders‟ involvement in
decision-making on matters affecting forests (Government of Kenya, 2005). As outlined in
chapter seven, these organizations engage in various activities geared towards the management
of the forests and facilitating alternative livelihoods for the Nandi Hills Forest communities. The
demand for transparency and good governance by civil society has brought about fundamental
changes in Africa (FAO, 2008), and the acceptability of the NGOs and CBOs by the local
community has been a plus to the sustainable management of the Nandi Forests. Interview data
suggest that there has been a greater degree of collaboration between the NGOs/CBOs and
government, including the international organizations, in the recent past
Environmental education via NGOs and CBOs appears to have enhanced the awareness
of the local community on the existence and value of forests in their neighbourhood. Three
hundred out of the 306 respondents (98%) interviewed asserted that they are aware of the
existence of forests and their resources - a very high level of awareness. They recognize that
forests act as water catchment areas, that they are a source of tourist attraction, that they provide
fodder for livestock, that they are sources of medicine, and that they are also important religious
and cultural sites. These findings, coupled with the fact that environmental education has been
elucidated as a driver of awareness, conservation practices, and alternative livelihood systems
that have a positive impact on the forests and the community, suggest that environmental
Chapter Eight: Discussion
186
education, if effectively used, could be a key tool in enhancing the sustainable management of
Nandi Hills Forests.
2.2. Informal environmental education
The high number of respondents who stated that their source of information on forest
significance was informal underscores the importance of the preservation and propagation of the
local knowledge of the Nandi Hills Forests Communities. This notion is supported by Bicker et
al. (2004) who argue that although informal knowledge was inaugurated in communities long
before the initiation of formal forest science aspects of it form the basis of several modern
forestry practices. Local knowledge among the Nandi Forest Communities is as old as the
existence of the Ogiek in Nandi Forests and its hinterland (Ng‟ang‟a, 2005). The Ogiek were
wholly depended on the forests for their source of livelihood as they were hunters and gatherers
and, as such, developed an intrinsic conservation perspective, which was prevalent within all
Nandi Forest communities.
Local communities have been reservoirs of vital knowledge that relates to the
conservation and sustainable utilization of the forests and the forest resources (Ng‟ang‟a, 2005),
and the various informal knowledge transmission mechanisms (storytelling, folklore, peer relay
and proximity knowledge acquisition) noted in this study support this contention. Significance of
the local community as local knowledge reservoirs is further adduced by the findings of the
study that point out that the sources of information held by local people on forests and their
related resources was majorly informal (85%). This understanding is corroborated by Langton
and Ma Rhea (2003) who submit that the nature of informal knowledge places custody of the
knowledge in humans. The informal education system generates customs, traditions, and norms
Chapter Eight: Discussion
187
handed down to generations both verbally and practically. In the case of the Nandi Hills these
practices included, and in some cases still include:
Circumcision ceremonies which were performed deep inside the forest at specially
designated sites which are respected and exclusively preserved. This practice is
evidenced by the richness of biodiversity in these circumcision sites within the Nandi
Forests;
Herding of livestock was prohibited in the forest except during dry spells when the locals
were allowed to graze selectively at the forest peripheries albeit to a limited extent;
Hunting and gathering practices, as exemplified by the Ogiek (arguably the aboriginal
community of the Nandi Hills Forests and the larger Mau Forest Complex), have
survived in these forests. Besides the forests being a source of livelihood for the Ogiek
they have had a nostalgic attachment to the forests. The concerns of the Ogiek in
preserving and maintaining their traditional knowledge was not only motivated by the
desire to conserve 'biodiversity' as an end in itself, but also by the desire to live on their
ancestral lands, to preserve their traditional livelihoods, and to safeguard local food security
(Langton, 2003). The Ogiek have therefore played an important role as conservationists of
the Rift Valley forests, of which the Nandi Hills Forests are a part.
Members of local communities have continued to undertake traditional marriages, which
form significant rites of passage for the young people. These ceremonies, according to
Langley (1979), are usually a culmination of several trainings that have been carried out
for the bride and groom, which include emphasis on the importance of the forests and
their resources;
Chapter Eight: Discussion
188
The proclamation of superstitious curses and blessings was a preserve of the ‘Orkoiyot’
(the religious head of the Nandi tribe) and were proclaimed as consequences of behaviour
or actions. A case in point would be the destruction of the meeting place for the elders,
which was normally deep in the forest under a fig tree, hence enhancing the conservation
of the forests (explain this – how does it enhance conservation), and;
The Orkoiyot had the exclusive responsibility of prescribing and in some case
administering medicine to the Nandi community. This organized social structure did not
allow anyone to harvest or administer the forest resources except by the sanctioning of
the Orkoiik.
It appears therefore that the local knowledge system of the Nandi Community
emphasized the sustainable utilization of the forest and the forest products. Local community
members had acquired sufficient knowledge of plant and animal species and their management
and use to enable them to cope with changing abundances of preferred species used for food,
medicine, cultural activities (circumcision & rites of passage), and other purposes. However,
certain fundamental practices are slowly fading away due to rapid population growth, high
urbanization rate and cross-cultural dilution effects (Langley, 1979).
The rapid population growth, standing at 2.9% (Government of Kenya, 2005), has forced
the local community to encroach fragile ecosystems such as hill-slopes and to some extent the
forest ecosystem including wetlands. Coupled with rapid urbanization, the immigration of
foreign communities into the area has diluted the cultural stimulus of the native community,
which has provided the driving factor for the effective management of the Nandi Hills Forests.
Chapter Eight: Discussion
189
Nevertheless, formal environmental approaches have attempted to re-energize effective
management and these efforts will hopefully bear fruit in the future.
2.3. Integration of formal knowledge and indigenous knowledge systems
It appears that formal environmental education has provided a platform for the Nandi
Hills Forest communities to interact, not only with their traditional forest conservation practices,
but also to appreciate modern day approaches. Matiru (1999) points out that a number of NGOs,
CBOs and voluntary organizations are making reliably helpful progress in enlightening the
ordinary citizens on laws and their rights in Kenya, and that the escalation of environmental
lobby groups has translated into greater awareness by the ordinary citizens on environmental
issues that affect them and the community at large. The resolutions of the United Nations
Conference on Environment and Development (1992) to advocate for sustainable development
through environmental education remains a pivotal issue, internationally, nationally, and in the
Nandi Hills Forests. It is this premise that predicates formal environmental education as a crucial
tool for effective forest management and conservation and, encouragingly, both the formal and
informal systems of environmental education appear to have been embraced at several levels in
the Nandi Hills, as evidenced in this study.
The dimensions embraced by the various players in the practice and propagation of
formal environmental education may vary in terms of curricula and approach but still remain
relevant in content. Depending on the target group, the depth of information investigated in this
study varied, such that the higher levels of education and research embraced more technical
issues while the lower levels and community-direct levels had simpler content which was often
simplified by using local examples in drawing case studies and illustrations. However, findings
Chapter Eight: Discussion
190
of this study suggest that in as much as there is a large portion of the forest communities that is
aware of the existence of the forests, information on the reality of their progressive destruction or
conservation still remains a vital aspect that requires attention.
Richards (1995) warns that indigenous systems of knowledge and practices are threatened
worldwide by socioeconomic and historical pressures. Borrini and Buchan (1997) submit that
indigenous knowledge is of increasing interest to forest science as it is ever more acknowledged
that indigenous resource management systems can help to improve the framework for sustainable
forest management. They also note that limitations of local knowledge by knowledge mortality
and lack of codification, which can lead to inter-generational loss of information, can be averted
by documentation. These caveats suggests that the integration of formal and informal knowledge
systems, which is being undertaken in some instances by the government, NGOs and CBOs, is a
crucial aspect that ought to be cemented further in any attempts to design environmental
education interventions in the Nandi Hills Forests.
As such, it appears that there is a great potential for sustainable forest management by
integrating formal and informal education approaches in order to enhance sustainable
management of the Nandi Forests. More than half of the respondents who indicated that they
obtained information on the forests and forest resources from both formal and informal sources
indicated that they had got their information from lessons learnt in class. Just less than half
indicated that they had acquired information on the forests through proximity knowledge
acquisition (see Table 7.7). The proximity knowledge acquisition is owed to the fact that most of
those living within the Nandi Forests have stayed there for a significantly long time. In turn, the
„lessons learnt in class‟ category of formal knowledge source is owed to the fact that most of the
respondents had attained at least some formal education (86.9%). Therefore, integrating both
Chapter Eight: Discussion
191
formal and informal environmental education should provide synergistic opportunities for better
management and conservation of the Nandi Hills Forests by local communities.
As noted earlier, two thirds of the forest communities is aware of the existence of the
forests and have proximal knowledge of changes to the forest ecosystem, information on the
reality of their progressive destruction or conservation still remains a vital aspect that requires
attention. It is for this reason that an extensive GIS database was generated in this study and
maps were drawn to illustrate spatiotemporal variations in land use in the water catchments
regions of Lake Victoria in the Nandi District of western Kenya.
3. EXTENT OF SPATIOTEMPORAL VARIATION IN LAND USE IN THE NANDI
DISTRICT AND THE IMPACT OF THE CHANGES
This section discusses the findings on spatial temporal variations in land use in the forest
and the forest catchment areas of the Nandi district as evidenced by Geographic Information
Systems (GIS) and Remote Sensing (RS) observations, photography, and a ground truthing
survey, in an attempt to answer the second research sub-question of this study, which is
What is the extent of spatiotemporal variability in land use in the forest and its
catchment?
3.1. Spatiotemporal variation
As noted in chapter seven, a comprehensive GIS database for the Nandi District has been
generated in this study. This database comprises of the following GIS layers:
Landsat images of 1994, 1999, 2003 and 2008
Chapter Eight: Discussion
192
Thematic layers clipped from the Kenya and Nandi District map that include
forests and vegetation.
Administrative boundary of the Nandi District
Field photographs
The extent of spatiotemporal variation in land use empirically obtained through
triangulation of Remote Sensing (RS), Geographic Information Systems (GIS) data generated
from Landsat maps change computations, observation and ground truth survey of the study area,
revealed a number of spatiotemporal variations in land use and land cover over the period
considered. False colour composite Landsat images prepared from the mosaiced and clipped
bands 2, 3 and 4 of the 1994, 1999, 2003 and 2008 provided the resultant Landsat images for
detection of changes of different land uses and land cover classes in the study area as presented
in the previous chapter (refer to figures 7.2, 7.3, 7.4 and 7.5).
To further understand the extent of spatiotemporal variation in land use, an unsupervised
classification of RS data was undertaken. The results indicated the variation that occurred in land
cover types such as shrubs, tea and grasslands were positive while there was a reduction in forest
cover and bare ground cover, which suggests that there might be serious implications for forests
in the Nandi district. On aggregate land areas under shrubs, tea and grasslands areas increased
between 1994 and 2008. The nature of the changes in land uses/cover types seem to be in
consonance with as the case in other parts of the globe (Geist & Lambin, 2001; Wade et al.,
2003), but the data indicates that the spatiotemporal variations are a consequence loss of forest
cover and conversion of bare ground to agriculture, and human settlement influx in areas not
suitable for agriculture.
Chapter Eight: Discussion
193
One cover type, tea increased by 61.95% between 1994 and 2008. The greatest registered
upward fluctuation of about 17.05 km2 was noted between 1994 and 1999. However there was a
decrease in tea cover between 1999 and 2003. The change in tea cover levels are believed to
have come from the prevailing fall in tea prices in the global market as at that time. Shrubs
increased by 18.62% between 1994 and 2008. In 1994 for instance, land cover under shrubs was
21.21 km2
while in 1999 a shrub cover of 37.06 km2
was registered. This was a variation of
10.8504 Km2
between these years. Increases in shrubs as a land cover suggests either a
continuous loss of forest cover or encroachment of aridity from loss of forests. The area under
grassland cover showed a near constant area of about 23 km2 between 1994 and 1999. A
decrease of about 6 km2 was however registered between 1999 and 2003 while an increase of
12.56 km2 between 2003 and 2008 just like shrubs basically exhibiting similar trends.
Results from the GIS data indicated a decrease in forest cover of 9.219 km2
(17.95%).
This is an implication of changing land use practices from forests to human settlements and
agriculture as emergent land uses/land practices. The fluctuations in forest cover area denote
spatiotemporal variability in forest cover as a land use and the data, based on the predetermined
classes, clearly showed variations in land use and land cover over time and that the forest cover
in Nandi Forests is under considerable threat.
3.2. Impacts of land use change
The data under discussion are informed by the analysis of the coded entries from the
household questionnaires, observation notes, information from key informant interviews,
photographic interpretation and GIS and RS data, as well as selected literature on the topic. It is
broadly recognized that land cover transformation has the potential to cause soil erosion,
biodiversity losses, amplified surface run off and flooding, climate change effects, and an
Chapter Eight: Discussion
194
increase in carbon dioxide concentration in the atmosphere (Lambin et al., 2003). Another school
of thought suggests that land cover variation contributes to land degradation in all its forms
including earth-atmosphere exchanges and loss in biodiversity with potential to demean
sustainable development (Turner et al., 2004). Changes in land use are related to land ownership
(or not) and the resultant land use practices, which have an effect on biodiversity, forest cover,
soil resources, and hydrology are factors which contribute to the impact they have on the
environment. Each of the above are discussed below.
3.2.1. Land ownership
The study data reveals that most of the residents of Nandi County own land (93.1%) and
only about 6.9% own no land within the study site. Out of those who own land, a significant
proportion (68%), own land less than five acres in extent and, as a result, one of the major
impacts of land use change is land fragmentation. An increasing population has exerted pressure
on the limited land resources, thus accelerating land fragmentation in the Nandi district, and
settlements were observed on marginal lands such as slopes and hillsides (Figure 7.12).
3.2.2. Land use practices
Agriculture‟s contributions to GDP vary across countries, but assessments suggest an
average contribution of 21% internationally, ranging from 10% to 70% (Mendelsohn et al.,
2000). In Africa, the agricultural sector is a critical mainstay of local livelihoods and national
GDP in most countries. According to Kenya London News (2011), Kenya‟s agriculture sector
contributes 25% of GDP and at least 50% of exports, including tea and horticulture. In order to
maintain this level of GDP, Vision 2030 envisages that Kenya will raise income from agriculture
by processing and thereby adding value to her products before they reach the market. Kenya‟s
Chapter Eight: Discussion
195
vision is to do so in a manner that enables her producers to compete with the best in other parts
of the world.
Findings in this study, and other sources used in the research appear, to substantiate that
agriculture in all its forms is the leading land use activity within the study site. However, of all
the agricultural activities noted during the study, maize farming was the most dominant. Perhaps
this is as a consequence of the fact that maize is Kenya‟s staple food for most of her population.
The increasing human population exerts pressure on the agricultural land available to produce
more food even, if it means clearance of forest as seen in Nandi hills forests area. Cumulatively,
all evidence points to agriculture being the major driver of land use change within the study site.
3.2.3. Biodiversity loss
The degree and type of land use has a direct bearing on floral and faunal resources and
their habitats, and impacts biodiversity at both the local and global levels. Anthropogenic
modification of landscapes from natural vegetation (e.g. wilderness) to any other use typically
results in habitat loss, degradation, and fragmentation, all of which can have devastating effects
on biodiversity, and land conversion is the single greatest cause of extinction of terrestrial
species (Bierregaard et al., 2001).
Field observation and photographic evidence revealed cases where deforestation from
logging or burning is followed by the conversion of the land to agriculture or other land uses.
This is a typical case of biodiversity loss as a consequence of land use change within the study
sites. Even in instances whereby some forests are left standing, the ensuing fragmentised
landscape typically fails to support many species that previously existed there. The habitat
suitability of forests have been impacted by the fragmenting of existing habitat into smaller
Chapter Eight: Discussion
196
pieces (habitat fragmentation) which exposes forest edges to external influences and decreases
core habitat area that subsequently negates on the ability of forests to optimally perform their
functions.
Preliminary findings based on satellite images shows that more than 10% of forest land
was transformed from primary forests to farm lands between 1994 and 2008 alone. This has had
a serious consequence on the native forest species of tree and animals through habitat deprivation
and losses. Even when unaccompanied by apparent changes in land cover, similar effects were
observed whenever relatively undisturbed forest lands were transformed to more intensive uses,
including livestock grazing and selective tree harvest.
Observations suggest that changes in land use and land cover, especially land clearing for
agriculture and the harvest of trees and other biomass, has impacted all aspects of the
environment detrimentally. The practice has made the soils in the study site vulnerable to
massive increases in soil erosion by wind and water, especially on steep terrain. Wild fires
occasioned by honey poachers, more so during the dry seasons, releases pollutants to the
atmosphere, with a number of possible consequent human effects. The overall scenario in the
Nandi Hills appears to be not only degraded soil fertility over time and reduced suitability of
land for future agricultural use, but also the release of quantities of phosphorus, nitrogen, and
sediments to streams and other aquatic ecosystems, causing a variety of negative impacts on the
Nyando and Yala Rivers, which source their water from this catchment area and feed water to
Lake Victoria (Verchot et al., 2008).
Chapter Eight: Discussion
197
3.2.4. Forest cover
The impact of land use change on natural ecosystems is also measured by plant cover and
biomass production and by the disruption of food production systems or the functioning of the
natural environment. The results of this study indicated a significant loss of plant cover biomass
especially from the closed canopy forest. This loss, as documented from the field observations,
reveal that the intensification of agriculture, illegal logging, charcoal burning and encroachment
for settlement and infrastructural development have been the major drivers of this forest cover
change. However, the analysis of satellite images indicates an increase in forest cover between
the 1999 and 2003, which may be partly attributed to the reduction of shrub cover in the same
period. What were observed as shrubs in 1999 would have grown into trees by 2003. Another
explanation could be that after the passage of the Kenya Forest Policy in 1994 several state and
non-state sectors were enabled to work with communities adjacent to the Nandi Forests in terms
of promoting agroforestry (Kohler, 2004).
Deforestation (the overall and effectively permanent reduction in the extent of tree cover)
has emerged as one of the major impacts of land use change in the study area. Visual observation
of satellite imagery of between 2003 and 2008 reveal that there was a reduction in the density of
trees in the forests. Even though interventions were introduced by the government which were
backed by robust legislative provisions in the Kenya Forest Act 2005 (Government of Kenya,
2005), encroachment of hillsides due to increased population pressure was a major contributer to
the rapid decline of forest cover during this period (Adhola et al., 2009). Also, the lawlessness
that accompanied the 2008 post-election violence resulted in the burning of a large chunk of the
Nandi South Forest near Koyo in the Kaptumo Division. Household data support that the trend
emanated from activities undertaken by households like illegal logging, honey harvesting and
Chapter Eight: Discussion
198
firewood poaching for fuel wood. The intensification of grazing in the forests, a consequence of
climate change (extreme dry weather and unpredictable rainfall), has resulted in the destruction
of forest undergrowth with consequence for biodiversity and environmental aesthetics. This has
left the forest ground bare and susceptible to soil erosion.
3.2.5. Soil resources
The data collected from households indicate the reduction in natural vegetation cover,
especially forests, has reduced the protection of the soil against erosion. Vegetation has thinned
out in most areas in the Nandi hills. Consequently, the function of forests and natural vegetation
which include protecting soil from erosion; regulating the water balance; maintaining soil
fertility by providing organic materials and preventing mineralization of soil humus by excessive
exposure to sunlight; and supplying important products for human and animal nutrition
(including medicines) are now impaired, and in some instances completely eliminated.
Field observations revealed that there was widespread loss of the soil surface layer as a
result of wind and water erosion with a number of consequences. Land surface having been
devegetated and as the soil surface is not permanently protected it is seasonally eroded by wind
and running water. Such soils are characterized by an incremental fertility loss (soil nutrient
depletion) evidenced in decreasing land productivity over time. The soils have a reduced ability
to sustain plant growth thus increasing the encroachment of desert-like conditions. Soil loss
through water and wind activity have led to soil surface sealing and encrustation of topsoil
reducing water intake resulting in a drier environment; a whole spiral of edaphic aridity is thus
triggered, which continues as a self-catalytic effect.
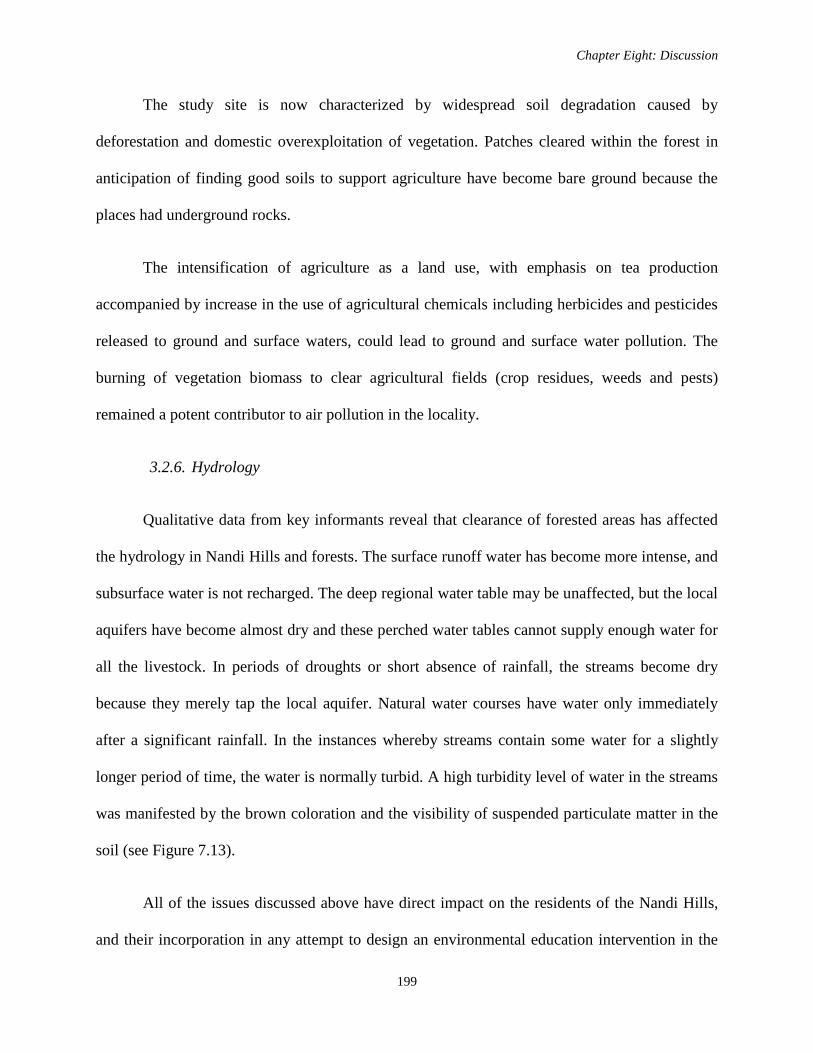
Chapter Eight: Discussion
199
The study site is now characterized by widespread soil degradation caused by
deforestation and domestic overexploitation of vegetation. Patches cleared within the forest in
anticipation of finding good soils to support agriculture have become bare ground because the
places had underground rocks.
The intensification of agriculture as a land use, with emphasis on tea production
accompanied by increase in the use of agricultural chemicals including herbicides and pesticides
released to ground and surface waters, could lead to ground and surface water pollution. The
burning of vegetation biomass to clear agricultural fields (crop residues, weeds and pests)
remained a potent contributor to air pollution in the locality.
3.2.6. Hydrology
Qualitative data from key informants reveal that clearance of forested areas has affected
the hydrology in Nandi Hills and forests. The surface runoff water has become more intense, and
subsurface water is not recharged. The deep regional water table may be unaffected, but the local
aquifers have become almost dry and these perched water tables cannot supply enough water for
all the livestock. In periods of droughts or short absence of rainfall, the streams become dry
because they merely tap the local aquifer. Natural water courses have water only immediately
after a significant rainfall. In the instances whereby streams contain some water for a slightly
longer period of time, the water is normally turbid. A high turbidity level of water in the streams
was manifested by the brown coloration and the visibility of suspended particulate matter in the
soil (see Figure 7.13).
All of the issues discussed above have direct impact on the residents of the Nandi Hills,
and their incorporation in any attempt to design an environmental education intervention in the
Chapter Eight: Discussion
200
area would benefit from making this issues and findings explicit (and in visual form where
possible).
4. COMMUNITY PERCEPTIONS ON UTILIZATION OF FOREST RESOURCES
This sub-section interrogates the findings of the study on the perceptions of the local
community on the state of and the forest utilization practices that they are undertaking, based on
the research question:
What knowledge and perceptions do community members have in terms of the current
utilization practices in the forest resources of Nandi Hills and Nandi Forests?
The people‟s perception that forests are critical to their livelihoods is vital if they are to
become involved in fighting for the conservation of their habitat. Many households were able to
link forests with values such as water conservation, income generation, flood control, rainfall,
food and medicine, grazing lands during the dry season, tourism development and biodiversity
conservation. Their awareness on these aspects corroborates the assertions of White and Martin
(2002) who have postulated that if indigenous and other local communities have been
increasingly acknowledged for being important stewards of forest estates, they would ensure that
forest utilities and environmentally crucial resources are exploited sustainably.
4.1. Perceptions on forests’ significance
The findings of the study indicate that a significant portion of the local community
(89.4%) believe that forests and forest resources are useful to them. These data, and the fact that
the Kenya Forest Act of 2005 (Government of Kenya, 2005) empowers local communities in
forest management through the Community Forest Management mechanism; suggest that there is
hope for the sustainable management of the Nandi Forests.
Chapter Eight: Discussion
201
As pointed out by the respondents, the forests are crucial since they act as water
catchments, are a source of timber and firewood, are habitats for an array of floral and faunal
biodiversity and are major tourist attraction sites that benefit the government and the local
communities through revenues generation. The few (10.6%) who did not see the significance of
these forests were not able to build a strong case. Their reservations were informed by issues
such as: the forests being hideouts for thieves, havens for wild and dangerous animals and
barriers to extension of farmlands.
4.2. Perception of the forest status
The submission by Enger et al. (1992) that whenever a resource is exploited, the two
major interests that are always in conflict are environmental and economic has been buttressed
by the strong perception by the locals that the forest cover in the area had rapidly declined and
suffered severe deforestation and degradation due to human exploitation. Farmers‟ responses
suggested that the forest and wetlands under the jurisdiction of the government had been more
severely deforested and degraded compared to community and private owned ones. This is
because the forests and wetlands were perceived as government property of some sort. The
perception was evidenced with great extremity during the post election violence in Kenya after
the 2007 general elections, when the locals torched sections of forests to express their
displeasure with the government. They also used some wetlands as burying sites for victims of
the violence. The most affected areas were found around Koyo wetland and Kimondi forest in
Nandi South District.
However, the keen interest and involvement of farmers in tree planting and particularly
agroforestry and plantation forestry is a sign of hope in boosting the general forest cover of the
area. The willingness by the local community to play a part in enhancing the natural regeneration
Chapter Eight: Discussion
202
of the indigenous forests is based on the perception, amongst others, that further irresponsible
forest exploitation would result in little or no rainfall in the area. Albeit most of them not
understanding the push and pull factors of that determine precipitation in the Nandi County, their
appreciation of the forests‟ role in the hydrological cycle is valuable.
Data generated from the local community indicated that, tea farming, maize production,
horticulture farming and livestock rearing are the major agricultural activities in these districts.
Consequently, more forest land has been cleared or interfered with to support these activities,
with a serious loss of biodiversity and ecosystem services provisioning. Community members
stated that planting of trees for water conservation would prevent the drying up of streams that
supply domestic water. A tree called Sesigium in the local language was perceived specifically to
help in water purification. Further it was widely suggested that this tree species be planted along
the riparian areas and in wetlands for water conservation. Tree planting and forestry at the
household level was seen to have the capacity to supplement household incomes. This could be
achieved through planting of fruit trees, fodder trees and beekeeping for small scale commercial
purposes.
The data reveals that there is also strong religious and cultural significance of forests.
This is pegged on the perception that the forest is more of a sacred place compared to other areas
that are dominated by other land uses. For instance, the use of ‘Sinendet’ (Periploca linearifolia),
a creeper, as a symbolic plant during ‘Tuluap Ng’etik’ (a place for circumcision ceremony) to
signify successful completion of the circumcision process is an important ritual. The choice of
the ‘Sinendet’ by the community as the plant for this purpose is based on its fast regeneration.
Albeit being able to regenerate fast, ‘Sinendet’ is a forest interior specie that has been conserved
as it is only harvested once a year during circumcision ceremonies.
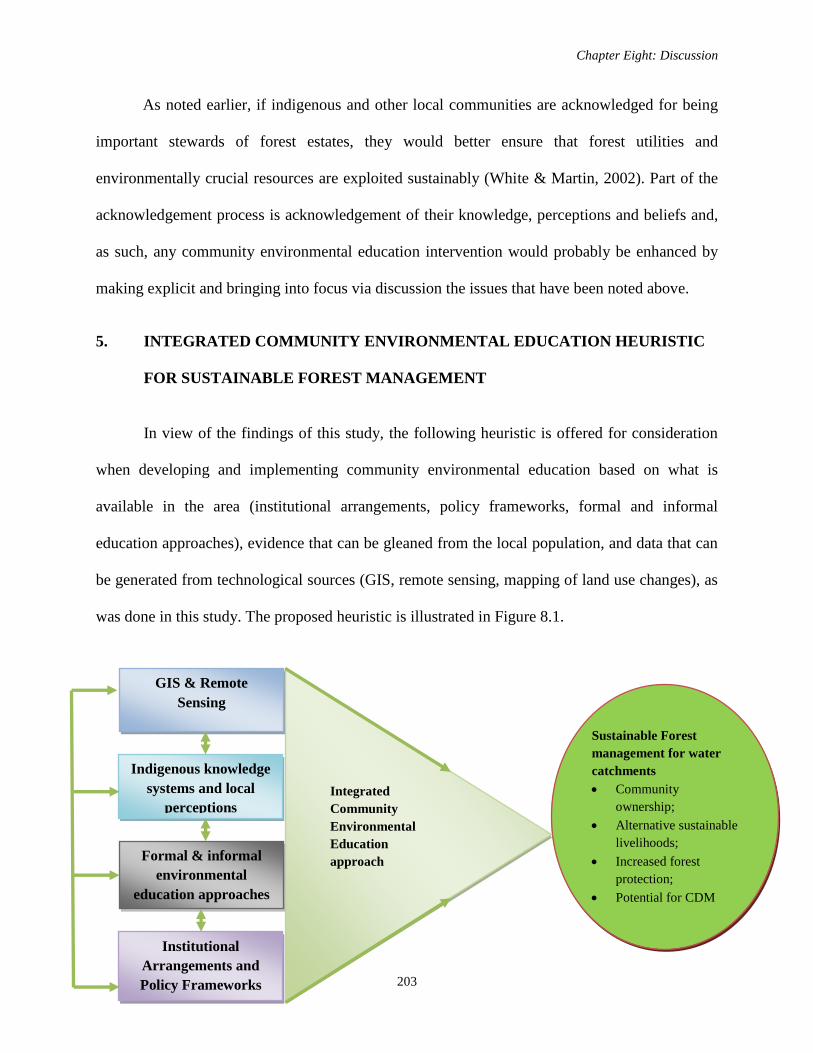
Chapter Eight: Discussion
203
As noted earlier, if indigenous and other local communities are acknowledged for being
important stewards of forest estates, they would better ensure that forest utilities and
environmentally crucial resources are exploited sustainably (White & Martin, 2002). Part of the
acknowledgement process is acknowledgement of their knowledge, perceptions and beliefs and,
as such, any community environmental education intervention would probably be enhanced by
making explicit and bringing into focus via discussion the issues that have been noted above.
5. INTEGRATED COMMUNITY ENVIRONMENTAL EDUCATION HEURISTIC
FOR SUSTAINABLE FOREST MANAGEMENT
In view of the findings of this study, the following heuristic is offered for consideration
when developing and implementing community environmental education based on what is
available in the area (institutional arrangements, policy frameworks, formal and informal
education approaches), evidence that can be gleaned from the local population, and data that can
be generated from technological sources (GIS, remote sensing, mapping of land use changes), as
was done in this study. The proposed heuristic is illustrated in Figure 8.1.
GIS & Remote
Sensing
Indigenous knowledge
systems and local
perceptions
Sustainable Forest
management for water
catchments
Community
ownership;
Alternative sustainable
livelihoods;
Increased forest
protection;
Potential for CDM
approaches
Integrated
Community
Environmental
Education
approach
Formal & informal
environmental
education approaches
Institutional
Arrangements and
Policy Frameworks
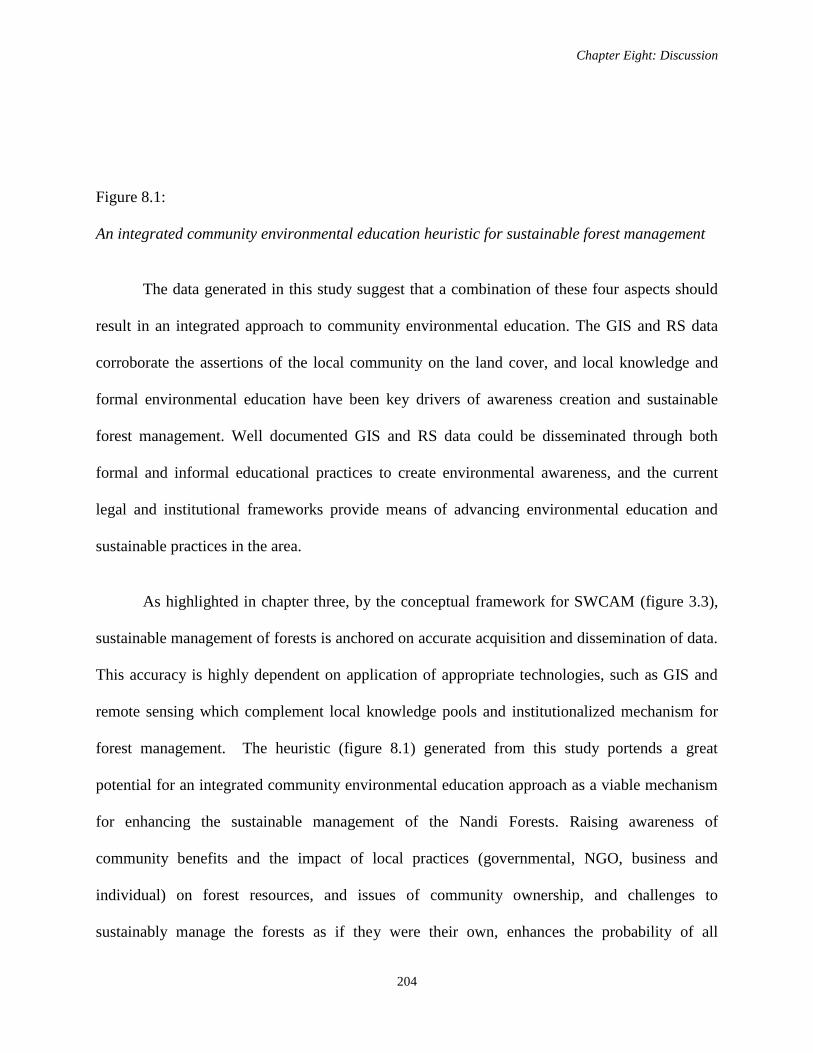
Chapter Eight: Discussion
204
Figure 8.1:
An integrated community environmental education heuristic for sustainable forest management
The data generated in this study suggest that a combination of these four aspects should
result in an integrated approach to community environmental education. The GIS and RS data
corroborate the assertions of the local community on the land cover, and local knowledge and
formal environmental education have been key drivers of awareness creation and sustainable
forest management. Well documented GIS and RS data could be disseminated through both
formal and informal educational practices to create environmental awareness, and the current
legal and institutional frameworks provide means of advancing environmental education and
sustainable practices in the area.
As highlighted in chapter three, by the conceptual framework for SWCAM (figure 3.3),
sustainable management of forests is anchored on accurate acquisition and dissemination of data.
This accuracy is highly dependent on application of appropriate technologies, such as GIS and
remote sensing which complement local knowledge pools and institutionalized mechanism for
forest management. The heuristic (figure 8.1) generated from this study portends a great
potential for an integrated community environmental education approach as a viable mechanism
for enhancing the sustainable management of the Nandi Forests. Raising awareness of
community benefits and the impact of local practices (governmental, NGO, business and
individual) on forest resources, and issues of community ownership, and challenges to
sustainably manage the forests as if they were their own, enhances the probability of all
Chapter Eight: Discussion
205
concerned coming to greater consensus on sustainable management of the local natural
resources. Increased awareness of locals and wider implications, such as sustainable income
generation and water provision to Lake Victoria (which has implications for both Kenyans and
other African nations fed water by the Nile), also improves attitudes to forest preservation
possibilities of embracing more sustainable alternative livelihoods. Once better understandings
of local issues are developed, further opportunities such as the potential of the community to
benefit from compensations drawn from carbon trading under the Afforestation and
Reforestation Clean Development Mechanism envisaged by the Kyoto Protocol, can be better
argued and understood.
6. CHAPTER SUMMARY
This chapter brings out the discussions drawn from the findings of the study. It begins by
discussing on environmental education and conservation in and around the Nandi Forests, then
expounds on the findings on the extent of spatiotemporal variation in land use in the Nandi
County and the impact of the changes. The perception of the community on forests and forest
resources is also discussed in this chapter and the chapter ends by drawing up an integrated
community environmental education heuristic for sustainable forest management.
Chapter Nine: Conclusion and Recommendations
206
CHAPTER NINE
CONCLUSION AND RECOMMENDATIONS
1. INTRODUCTION
Institutions play a pivotal role in enhancing sustainable resource management besides
being conduits necessary for integrating various environmental management approaches for
effective resource use (FAO, 2009). As pointed out by the FAO (2006), the existence and extent
of specific forest types are important since they form the basis for conservation efforts that
reduce deforestation, restore and rehabilitate degraded forest landscapes. Significantly, the
indigenous and/or local communities that may be well equipped with information on best
practices and management approaches can contribute to the sustainable management of forests.
This closing chapter reflects upon the key finding of the study highlighting on the place
of institutional environmental and educational arrangements and practices which are pertinent to
the sustainable management of the Nandi Hills Forests. The limitations of the study are also
presented, coupled with recommendations for further research.
2. MAIN FINDINGS
The results of this study reveal that the already existing institutions in the Nandi Hills
area are reservoirs of important information and are vehicles of awareness creation. While the
findings of this study indicate that most of the residents of the Nandi County (67%) are aware of
existing relevant institutions in the management of the Nandi Forests, the remaining 33%
Chapter Nine: Conclusion and Recommendations
207
represent a significant number of people who ought to be empowered with knowledge on the
existence and significance of these institutions.
The passage of the Kenya Forest Act (2005) was a major milestone in enhancing the
involvement of the Nandi Forests adjacent communities in the management of the forest. The
anchoring of community forestry principles in law that gave way to the formation of Community
Forest Associations (CFAs) has seen the progressive increment of participation of the local
community in the management of the Nandi Forests, exemplified by the already several existing
CBOs in the area. This in return has contributed to the increased awareness and consciousness of
the local community on the need and importance of conserving the forests not just to them but
for the future generations.
The majority of households sampled indicated that the forest cover of Nandi Forest has
suffered severe deforestation and degradation through heavy exploitation resulting from an
escalating demand for timber and fuel wood, land for cropping and grazing. They further noted
that the depletion and degradation of the Nandi Forest are a threat to ecosystem diversity and a
fundamental influence on the declining standard of living of many households.
The decline in indigenous forest resources and a subsequent decline in land productivity
and lack of forage and fodder as well as other tree products and services were perceived as
threats by the farming communities in almost all the locations in the study site. Several changes
have been noted with the most significant being: increased area of tea plantations, cropping, rural
residential development, and both increased and decreased dairying in different parts of the
region. Changes in how cropping and dairying are undertaken, increased farm amalgamation and
Chapter Nine: Conclusion and Recommendations
208
changes in water availability and use, were also noted as being significant threats to
sustainability.
It is also noteworthy that the uptake of on-farm forestry, exemplified by the involvement
of the locals in agroforestry, has significantly improved in the last 15 years. This has also eased
the pressure on the indigenous forests and enhanced the timber and fuel wood supply for the
community for domestic and commercial purposes. More farmers are currently involved in
agroforestry and are able to generate revenue from on-farm forestry and at the same time aid in
increasing tree cover and pressure on forests. This is an indication that once a community is
empowered with the necessary knowledge on what benefits them and what they stand to benefit
from, they shall definitely embrace it and make it part of their societal orientation.
There has been a great degree of spatiotemporal variation (land use change) within the
study site. Land-use change is arguably the most predominant socioeconomic force driving
changes and degradation of the Nandi Forest ecosystem. Deforestation, agriculture, and other
human activities have substantially altered the landscape of Nandi Forests. Such disturbance of
the land has affected important ecosystem processes and services, the implication of which have
had wide ranging consequences such as irregular rainfall regimes, increased river turbidity,
increased erosion and the cessation of forest interior species.
An integrated approach to community environmental education possesses a profound
potential in the quest to sustainably manage the Nandi Forests, since it incorporating variously
crucial conservation and benefit-based considerations. The heuristic developed from this study,
which underscores community environmental education, asserts the essentials of SFM, while
Chapter Nine: Conclusion and Recommendations
209
incorporating a community-driven approach that is informed by knowledge, technology and
institutional frameworks.
3. LIMITATIONS OF THE STUDY
The findings of this study need to be considered with the following limitations. While
random sampling would have been the desired methodology, certain circumstances in the field
called for adoption of non-probability sampling criteria. For instance convenience sampling was
embraced especially in areas that had rugged terrains and homesteads were scattered far and
wide. The households to be interviewed were conveniently picked from those that were at least
5km from the main access roads. It should also be noted that the membership of the FGD
sessions that were conducted among the local community was dominated by the elderly males.
The perspectives drawn from the FGDs could have harboured some biases that might have not
been representative of the females and younger men in the community. Satellite images for
analysis to quantify land use change could only be obtained from the year 1994 to 2008,
therefore the information obtained from the respondents that dated earlier years or after 2008
could not be verified from the satellite images. However the trend observed from the Landsat
images analyzed in this study suggested an acceptable degree of validity and reliability.
4. SUGGESTIONS FOR FURTHER RESEARCH
This study has explored the various synergistic, possible relationships that exist between
the local knowledge systems of the Nandi Forests Community, formal environmental education
and GIS/Remote Sensing with a view of enhancing sustainable management of these forests.
Chapter Nine: Conclusion and Recommendations
210
However, it is imperative to point out relevant and related areas of study for further research. The
study consequently recommends the following, based on its findings:
The data suggests that more emphasis needs to be taken in order to not just increase the
awareness of the local population about these institutions, but to empower them with
relevant forest management and conservation initiatives and skills in order to secure the
future of the forests and the forest-adjacent communities. Therefore further research
needs to be undertaken to explore the possibilities of strengthening concepts of
community forest management, driven by the local population.
It is also important in future to consider how merging the myriad of CBOs into fewer
CFAs which would probably have a stronger impact on the conservation of the forests.
Currently there is duplicity of roles by CBOs and efficient dissemination of best practices
is hampered by the uncoordinated approach and piecemeal conservation initiatives by the
various groups.
A detailed study on climate change adaptation-mitigation synergies framed within the
findings of this study, which highlight the significance of community and institutional
use and management of forest resources, could provide deeper understanding and
significance for all concerned with the process.
The GIS files generated in this study are flexible and can always be updated as a way of
checking future state of land use and land cover in the area as well as the future trend of
land use and land cover changes. Therefore further studies should be undertaken with an
aim of frequently updating the LULC change and disseminating the change detection
patterns to the local community.
Chapter Nine: Conclusion and Recommendations
211
In recent times ICTs, especially mobile phones and computers, have been instrumental in
disseminating information, capacity building local communities and even enhancing
resource use efficiency. Therefore the uptake of ICTs need to be interrogated and proper
action taken, especially in illuminating best practices on SFM to the local communities
around the Nandi Forests.
It is important to explore both the observable and perceived impacts of land use change;
how both perceived and observable impacts differ across different types of socio
economic classes and proximity to forest ecosystems and the reasons views may differ
across groups on the utilization practices of forest resources. This will help in further
disaggregating the awareness creation mechanisms relevant to the various cohorts or
socioeconomic classes of the community.
5. CONCLUSION
This study has brought to light the essence of environmental education that is
incorporative of the community through formal and informal approaches in forest knowledge
acquisition and management in the Nandi County. The heuristic developed in this study
encapsulates an integrated community environmental education approach that is anchored in
institutional and policy frameworks, local forest knowledge, formal environmental education,
and GIS/remote sensing. The heuristic (figure 8.1) enables the adoption of strategies using
readily accessible, though loosely applicable, information for problem solving in developing and
implementing community environmental education practices for effective forest management
and conservation practices that are responsive to the needs of the Nandi Forest Community. Such
environmental education has the potential to best reveal to the local community the accruable
Chapter Nine: Conclusion and Recommendations
212
benefits they stand to reap by sustainably managing the Nandi Forest, which are dependent, to a
great extent, on the level of awareness of the local community of the significance of sustainable
forest management and what their actions and/or inactions mean to the forests.
Although the heuristic developed in this study has the potential to assist in the facilitation
of community environmental education for the sustainable management of forests, this goal will
not be attained if the findings of the study is not effectively disseminated. Possible avenues for
dissemination are (i) to run a series of workshops and seminars for the Nandi Forest Stakeholders
via the local university (Moi University) and the NEF, and (ii) to publish the findings of the
study in both academic journals and popular media (magazines, newspapers, local radio stations,
etc.) in order to make to make the findings accessible to both policy makers and implementers at
the highest level and local stakeholders in the area.
.
213
REFERENCES
Abbott, J. (2002). An analysis of informal settlement upgrading and critique of existing
methodological approaches. Habitat International, 26(3), 303-15.
Adams, W., Potkanski, T. and Sutton, J. (1994). Indigenous farmer-managed irrigation in Sonjo,
Tanzania. Geographical Journal, 160, 17–32.
Adhola, T., Ng‟weno, F., Matiku, P., Mulwa, R., Ngari, A., Barasa, F., Madindou, I., Wanyiri,
M., Mwango‟mbe, J., Musyoki, C., Ndonye, P., Ogoma, M., Machekele, J. & Musila, S.
(2009). Kenya’s important bird areas: Status and trends 2008. Nairobi: Nature Kenya.
Agrawal, A. (1995). Dismantling the divide between indigenous and scientific knowledge.
Development and Change, 26, 413–39.
Agrawal, A. (2005). Environmentality: Technologies of government and the making of subjects.
London: Duke University Press.
Akotsi, E., Gachanja, M. & Ndirangu, J. (2006). Changes in the forest cover in Kenya’s five
water towers, 2003-2005. Nairobi: Department of Resource Surveys and Remote Sensing.
Alberti, M. (1996). Measuring urban sustainability. Environmental Impact Assessment Review
16, 381-424.
Alvarez, M. (2007). State of America's forests. Bethesda, MD: Society of American Foresters.
214
Amberg, W., & Sebego, R. J. G. (2002). Interpretation of mopane woodlands using air photos
with implications on satellite images classification. International Journal of Applied Earth
Observation, 4, 119-135.
Anderson, B., Conway, R. G., Davis, R. J., Peckham, R. J., Richards, P. J., Spencer, R. E., &
Wilkinson, P. N. (1972). Nature Physical Science, 239, 117.
Anyimba A. M. (1993): Borehole site investigations in fractured hard-rock, aquifers in Gachoka
Division. Proceedings of the fifth conference on the geology of Kenya, University of Nairobi.
Aranoff, S. (1989). Geographic information systems: A management perspective. Canada: WDL
Publications.
Babbie, E. (1993). The practice of social research (7th
ed.). Belmont, CA: Wadsworth Publishing
Company.
Baltzer, J. L., Davies, S. J., Kassim, A. R., Noor, N. S., & LaFrankie, J. V. (2007). Geographic
distributions in tropical trees: Can geographic range predict performance and habitat
association in co-occurring tree species? Journal of Biogeography, 34, 1916–1926.
Balzter, H., Luckman A, Skinner, I., Rowland, C. & Dawson, T. (2007). Observations of forest
stand top height and mean height from Interferometric SAR and LiDAR over a conifer
plantation at Thetford Forest, UK. International Journal of Remote Sensing, 28(6), 1173–
1197.
Barrera-Bassols, N. & Zinck, J.A. (2003). Ethnopedology: A worldwide view on the soil
knowledge of local people. Geoderma, 111, 171–95.
215
Barry, G. (2002). Status of implementation of forest-related clauses in the CBD: An independent
review and recommendations for action, Papua New Guinea. Stanford: Fern
Bebbington, A. (1993). Modernisation from below: An alternative indigenous development?
Economic Geography, 69, 274–92.
Bell, M. (1979). The exploitation of indigenous knowledge or the indigenous exploitation of
knowledge: Whose use of what for what? IDS Bulletin, 10, 44–50.
Bennun, L., & Njoroge, P. (2001). Important bird areas in Africa and associated islands: Kenya.
(L. D. Fishpool, & M. I. Evans, Eds.) Newbury and Cambridge, UK: Pisces Publications and
BirdLife International (BirdLife Conservation Series No. 11).
Bernard, E. F. (1985). Planning and environmental risk in Kenyan drylands. Geographical
Review, 75, 58-70.
Bestow, T., T. (1958). Water resources of Malindi. Nairobi: Public Works Department.
Bicker, A., Sillitoe, P., & Pottier, J. (2004). Development and local knowledge: New approaches
to issues in natural resource management, conservation and agriculture. New York:
Routledge.
Bierregaard, R., Gacscon, C., Thomas, E., Lovejoy, T., E., & Rita, M. (eds.) (2001). Lessons
from Amazonia: The ecology and conservation of a fragmented forest. New Haven: Yale
University Press.
BirdLife International. (2011). Important bird areas factsheet: North Nandi Forest. Retrieved
May 7, 2011, from http://www.birdlife.org/datazone/sitefactsheet.php?id=6443
216
Blackett, H. L. (1994). Forest inventory report of the Mathews Range Forest Reserve. 8, 1-14.
Nairobi: Kenya Indigenous Forest Conservation Programme (KIFCON).
Blaikie, P. (1995). Changing environments or changing views? : A political ecology for
developing countries. Geography, 30(3), 203-214.
Blaikie, P. M. & Muldavin, J.S.S. (2004). Upstream, downstream, China, India: The politics of
environment in the Himalayan region. Annals of the Association of American Geographers,
94, 520–548.
Borrini, F. G., & Buchan, D. (Eds.). (1997). Beyond fences: Seeking social sustainability in
conservation (Vol. 1). Gland, Switzerland and Cambridge, UK: IUCN.
Boyd, C., & Slaymaker, T. (2000, November). Re-examining the „more people less erosion‟
hypothesis: Special case or wider trend? , No.63 Nov.2000. (A. Wyles, Ed.) Natural
Resources Perspectives, p. 6.
Boyd, D. S, Foody, G. M & Ripple, W. J. (2002). Evaluation of approaches for forest cover
estimation in Pacific Northwest, USA, using remote sensing. Applied Geography, 22, 375-
392.
Bradley, A. B. & Mustard, J. F. (2005). Identifying land cover variability distinct from land
cover change: Cheatgrass in the great basin. Remote Sensing of Environment, 94, 200-213.
Briggs, J., Badri, M. & Mekki, A. M. (1999). Indigenous knowledge and vegetation use among
Bedouin in the Eastern Desert of Egypt. Applied Geography 19, 87–103.
217
Brink P. J., & Wood, M. J. (1998). Advanced design in nursing research (2nd ed.). Thousand
Oaks, California: Sage.
Bruijnzeel, L. A. & Hamilton, L. S. (2000). Decision time for Cloud Forests. IHP Humid Tropics
Programme Series No. 13. Paris: UNESCO.
Bruijnzeel, L.A. (1990). Hydrology of Moist Tropical Forests and Effects of Conversion: A State
of Knowledge Review. Paris: UNESCO International Hydrological Programme.
Brundtland, H. (1987). Our common future. Oxford: Oxford University Press for World
Commission on Environment and Development.
Bryman (2004). Quantity and quality in social research (2nd
ed). London: Routledge.
Bullock, A. (1992). The role of dambos in determining river flow regimes in Zimbabwe. Journal
of Hydrology. 134, 348-375.
Burnham, P. (2000). Indian country, God’s country: Native Americans and the national parks.
Washington D.C: Island Press.
Buschbacher, R., Hull, C., Serrano, E. A. (1988). Abandoned pastures in eastern Amazonia:
Nutrient stocks in the soil and vegetation. Journal of Ecology, 76, 682–699.
Caldecott, J. O., Jenkins, M. D., Johnson, T. & Groombridge, B. (1994). Priorities for
conserving global species richness and endemism. Cambridge, UK: World Conservation
Press.
218
Calder, I. C. (2003). Assessing the water use of vegetation and forests-development of the
Hydrological Land Use Change (HYLUC) model. Water Resources Res., 39(11), 1318.
Campbell, B., Mandondo, A., Nemarundwe, N., Sithole, B., De Jong, W., Luckert, M., &
Matose, F. (2001). Challenges to proponents of common property resource systems:
Despairing voices of the social forests of Zimbabwe. Society Natural Resources 29(4): 589–
600.
Carson, R. (1962). Silent Spring (1st ed.). Boston: Houghton Mifflin.
Cavaye, A. L. M. (1996). Case study research: A multi-faceted research approach for IS.
Information Systems Journal, 6, 227–242.
Center for International Forestry Research. (2004). Operationalising the ecosystem approach:
Reinventing research. Forest Livelihoods Briefs No. 2. Bogor, Indonesia. Available at:
http://www.cifor.cgiar.org/publications/pdf_files/livebrief/livebrief0402e.pdf
Central Bureau of Statistics (CBS) Kenya. (1995). Statistical Abstract. Nairobi: Government
Printer.
Chalmers, A.F. (1996). What is this thing called science? An assessment of the nature and status
of science and its methods. St. Lucia Q: University of Queensland Press.
Chambers, R. (1979). Editorial rural development: Whose knowledge counts? IDS Bulletin, 10,
1–3.
Chambers, R. (1983). Rural development: Putting the last first. Harlow: Longman.
219
Chambers, R. (2001). The world development report: Concepts, content and chapter 12. Journal
of International Development, 13, 299–306.
Chandra, G., Zhilang, Z., & Reed, B. (2005). A comparative Analysis of the global land cover
2000 and MODIS land cover data sets. Remote Sensing of Environment, 94, 123-132.
Chavez, P. S (1996). Image-based atmospheric corrections-revisited and improved.
Photogrametric Engineering and Remote Sensing, 60, 1285-1294.
Chemelil, M. C. (2004). Environmental degradation of River Mara water shed and its effects on
Lake Victoria. Paper Presented to Mau Watershed Outreach Stakeholders Consultative
Meeting, 10th
Sept. 2004, Egerton University.
Chira, R.M. (2003) Changes in wildlife habitat and numbers in Embu and Mbeere Districts,
Eastern Province, Kenya. LUCID working paper no.37. Available at:
http://www.lucideastafrica.org/publications/Chira_LUCID_WP37.pdf
Chokor, B., & Odemerho, F. (1994). Land degradation assessment by small-scale traditional
African farmers and implications for sustainable conservation management. Geoforum, 25,
145–54.
Cichoke, A. J. (2001). Secrets of native American herbal remedies: A comprehensive guide to the
native American tradition of using the mind/body/spirit connection for improving health and
well-being. New York: Penguin Putnam Inc.
Cihlar, J., & Jansen, J. M. (2001). From land cover to land use: A methodology for efficient land
use mapping over large areas. Professional Geography, 53(2), 275-289.
220
Cihlar, J., & Jansen, J. M. (2001). From land cover to land use: A methodology for efficient land
use mapping over large areas. Professional Geography, 53(2), 275-289.
Claire, S., Jahoda, M., Deutsch, M., & Wellford, S. C. (1962). Research methods in social
relations. New York: Holt, Rinehart and Winston.
Colby, J. D., & Keating, P. L. (1998). Land cover classification using Landsat TM imagery in the
tropical highlands: The influence of anisotropic reflectance. International Journal of Remote
Sensing, 19(8), 1479-1500.
Colchester, M. (ed.) (2001). Survey of indigenous land tenure: A report for the land tenure
service of the Food and Agricultural Organization. Stanford, UK: Forest Peoples
Programme.
Collins, J. B., & Woodcock, E. C. (1996). An assessment of several linear change detection
techniques for mapping forest mortality using multitemporal Landsat TM data. Remote
Sensing of Environment, 56, 66-77.
Congation, R. (1991) A review of assessing the accuracy of classifications of remotely sensed
data. Remote Sensing of Environment, 37, 35-46.
Congation, R., & Green, K. (1993). A practical look at the sources of confusion in error matrix
generation. Photogrammetric Engineering and Remote sensing, 59(5), 641-644.
Cook, B., & Kothari, U. (Eds.) (2001). Participation: The new tyranny. London: Zed Books.
Cook, T.D. (1986). Postpositivist critical multiplism. In R. L. Shotland & M. M. Mark (eds.),
Social Science and Social Policy (pp. 21-62). London: Sage.
221
Coppin, P. I., Jonckheere, K. & Nackers, B. M. (2004). Digital change detection in ecosystem
monitoring: A review. International Journal of Remote Sensing, 25(9), 1565-1596.
Costanza, R., Daly, M., Folke, C., Hawken, P., Holling, C.S., Mcmichael, A.J., Pimentel, D., &
Rapport, D. (2000). Managing our environmental portfolio. Bioscience, 50,149–155.
Creswell, J.W. & Plano, C.V. (2007). Designing and conducting mixed methods research.
London: Sage.
Creswell, J.W. (2003). Research design: Qualitative, quantitative and mixed methods
approaches (2nd
ed). London: Sage.
Creswell, J.W. (2007). Qualitative inquiry and research design: Choosing among five
approaches (2nd
ed). London: Sage.
Creswell, J.W. (2009). Research design: Qualitative, quantitative and mixed method approaches
(3rd
ed). Thousand Oaks, California: Sage.
Cronje, J. C. (2011). The ABC (Aim, Belief, Concern) instant research question generator.
Fourth Advanced International Colloquium on Building the Scientific Mind (BtSM2011).
Stellenbosch, South Africa: Sustainability Institute. Available at:
http://www.learndev.org/dl/BtSM2011/Cronj%E9-
The_ABC_Instant_research_question_generator.pdf
Dale, V.H., Joyce, L.A., Mcnulty, S., Neilson, R.P., Ayres, M.P., Flannigan, M.D., Hanson, P.J.,
Irland, L.C., Lugo, A.E., Peterson Peterson, C.J., Simberloff, D., Swanson, F.J., Stocks, B.J.,
& Wotton, B.M. (2001). Climate change and forest disturbances. Bioscience, 51, 723–734.
222
Dale, V.H., Southworth, F., O‟Neill, R.V., Rouse, A., Frohn, R. (1993). Simulating spatial
patterns of land-use change in Rondonia, Brazil. In R.H. Gardner (ed.), Some Mathematical
Questions in Biology (pp. 29-56). Providence, RI: American Mathematical Society.
Davies, S. (1994). Information, knowledge and power. IDS Bulletin, 25, 1–13.
De Boef, W., Amanor, K. & Wellard, K. (eds). (1993). Cultivating knowledge: Genetic diversity,
farmer experimentation and crop research. London: Intermediate Technology Publications.
de Leeuw, P. N., Grandin, B. E., & Bekure, S. (1991). Introduction to the Kenyan rangelands and
Kajiado District. In S. Bekure, P. N. de-Leeuw, B. E. Grandin, & P. J. Neate (Eds.), Maasai
Herding: An analysis of the livestock production system of Maasai pastoralists in eastern
Kajiado District, Kenya. ILCA System study 4 (pp. 7-19). Addis Ababa, Ethiopia:
International Livestock Centre for Africa (ILCA).
Deetz, S. (1996). Describing differences in approaches to organization science: Rethinking
Burrell and Morgan and their legacy. Organization Science, 7, 191–207.
DeFries, R. S., Asner, G. P., & Houghton, R. A. (eds). (2004). Ecosystems and land use change. ,
Washington, DC: American Geophysical Union.
Defries, R.S., & Townshend, R.G. (1999). Global land cover characteristics from satellite data:
From research to operational implementation? Global Ecology and Biogeography, 8, 367-
379.
223
Denzin, N. K. (1994). In Joniak, L. The Qualitative Paradigm: An Overview of some basic
Concepts, Assumptions, and Theories of Qualitative Research. [Available On-Line]
http://www.unf.edu/dept/cirt/workshops/joniak/qual_par.pdf
Denzin, N. K., & Lincoln, Y. S. (2005): Introduction: The discipline and practice of qualitative
research. In Denzin & Lincoln (eds) 2005: The Sage Handbook of Qualitative Research.
Thousand Oaks, California: Sage.
Denzin, N.K. & Lincoln, Y. S. (1994). Handbook of Qualitative Research. Thousand Oaks,
California: SAGE.
Disinger, J. F., & Roth, C. E. (1992, September). Environmental education research news. The
Environmentalist, 12 (3).
Dovers, S. R., & Norton, T. W. (1994). Sustainability: Questions for ecosystem management. In
T. W. Norton, S. R. Dovers (eds), Ecology and Sustainability of Southern Temperate
Ecosystems (pp. 1-9). Melbourne: CSIRO.
Dovers, S.R., & Handmer, J. W. (1993). Contradictions in sustainability. Environmental
Conservation, 20(3), 217–222.
Dregne, H.E. (2002). Land degradation in the drylands. Arid Land Research and Management,
16, 99-132.
East African Standard. (2008, November 7). Loggers threaten valuable trees in their pursuit of
riches. East African Standard.
224
Eboe, H. (2002). Ghana's adjustment experience: The paradox of reform. United Nations
Research Institute for Social Development.
Edoh, F.M. (1997). Globalization and the new world order: Promises, problems, and prospects
for Africa in the twenty first century. USA: Greenwood Press.
Ellen, R., & Harris, H. (2000). Introduction. In R. Ellen, P. Parkes & A. Bicker (eds), Indigenous
environmental knowledge and its transformations (pp. 1–33). Amsterdam: Harwood
Academic Publishers.
Elvidge, C. D., & Chen, Z. (1995). Comparison of broad-band and narrow-band red and near-
infrared vegetation indices. Remote Sensing of Environment, 54, 38-48.
Emerton, L., & Karanja, F. (2001). Valuation of forest resources in East Africa. Nairobi, Kenya:
African Centre for Technology Studies (ACTS) and World Conservation Union (IUCN)
Eastern Africa Regional Office (EARO).
Emerton, L., Karanja, F., & Gichere, S. (2001). Environment, poverty and economic growth in
Kenya: What are the links, and why do they matter? Policy Brief No. 2. Nairobi: The World
Conservation Union (IUCN), 8pp.
Enger, D. E., & Smith, B. F. (1992). Environmental science: A study of interrelationships. (4th
Ed). Washington DC, USA: Brown Publishers.
Ermerton, L. (1996). Valuing the environment: Case studies from Kenya. Nairobi: Africa
Wildlife Foundation.
225
Escobar, A. (1998). Whose knowledge, whose nature? Biodiversity, conservation, and the
political ecology of social movements. Journal of Political Ecology, 5, 53- 80.
Eyzaguirre, P. B. (2001). Global recognition of indigenous knowledge: Is this the latest phase of
„globalization‟? Indigenous Knowledge and Development Monitor 9. Retrieved 12 May 2010
from http://www.nuffic.nl/ciran/ikdm/9-2/column.html
Falconer, D. J., & Mackay, D. R. (1999). Ontological problems of pluralist research
methodologies. Available at:
http://aisel.isworld.org/article.asp?Subject_ID=31&Publication_ID=2
Feeny, D., Fikret, B., McCay, B. J., & Acheson, J. M. (1990). The tragedy of the commons:
Twenty-two years later. Human Ecology, 18(1), 1–18.
Fisher, P. F., & Unwin, D. J. (Eds.). (2005). Re-presenting GIS. West Sussex: John Wiley &
Sons Ltd.
Fleming, R.A., Hopkin, A.A., Candau, J.N. (2000). Insect and disease disturbance regimes in
Ontario‟s forests. In A.H. Perera, D.L. Euler, I.D. Thompson (eds), Ecology of a Managed
Terrestrial Landscape: Patterns and Processes of Forest Landscape in Ontario (pp. 141–
162). Vancouver, BC: UBC Press.
Foley, J. A., DeFries, R., Asner, G. P., Barford, C., Bonan, G., Carpenter, S. R., Chapin, F. S.,
Coe, M. T., Daily, G. C., Gibbs, H. K., Helkowski, J. H., Holloway, T., Howard, E. A.,
Kucharik, C. J., Monfreda, C., Patz, J. A., Prentice, I. C., Ramankutty, N., & Snyder, P. K.
(2005). Global consequences of land use. Science, 309, 570-574.
226
Food and Agriculture Organization & Centre for International Forestry Research. (2005). Forests
and floods: Drowning in friction or thriving on facts. Forestry Perspectives 2. Bangkok,
Thailand: Food and Agriculture Organization of the United Nations (FAO)
Food and Agriculture Organization. (1991). Statistical yearbook. Rome, Italy: UN Food and
Agriculture Organization, FAO.
Food and Agriculture Organization. (1997). AfriCover land cover classification. Environment
and Natural Resources Service (SDRN), pp 76. Rome, Italy: UN Food and Agriculture
Organization, FAO.
Food and Agriculture Organization. (1999a). Status and progress in the implementation of
national forest programs: outcomes of a FAO worldwide survey. Rome, Italy: UN Food and
Agriculture Organization, FAO.
Food and Agriculture Organization. (1999b). The FAO strategic plan for forestry. Rome, Italy:
UN Food and Agricultural Organization, FAO. Available at:
http://foris.fao.org/static/pdf/strat-plan/FOStrat_E.pdf
Food and Agriculture Organization. (2001). Global forest resources assessment 2000. main
report. FAO Forestry Paper No. 140. Rome, Italy: UN Food and Agriculture Organization,
FAO. Available at: www.fao.org/docrep/004/y1997e/y1997e00.htm).
Food and Agriculture Organization. (2005). State of the world’s forests 2005. Rome, Italy: UN
Food and Agriculture Organization, FAO. Available at:
www.fao.org/docrep/007/y5574e/y5574e00.htm).
227
Food and Agriculture Organization. (2006). Global forest resources assessment 2005: Progress
towards sustainable forest management. FAO Forestry Paper No. 147. Rome, Italy: UN Food
and Agriculture Organization, FAO.
Food and Agriculture Organization. (2008). Human wildlife conflict in Africa: Causes,
consequences and management strategies. FAO Forestry Paper. Rome, Italy: UN Food and
Agriculture Organization, FAO.
Food and Agriculture Organization. (2009). State of the World’s Forests 2009. Rome, Italy: UN
Food and Agriculture Organization, FAO.
Foody, G.M. (2001) Monitoring the magnitude of land cover change around the southern limits
of Sahara. Photogrammetric Engineering & remote sensing, 67(7), 841-847.
Forman, R.T.T. (2000). Estimate of the area affected ecologically by the road system in the
United States. Conservation Biology, 14, 31–35.
Fraser, B. (1996). “Grain sizes” in educational research: Combining qualitative and quantitative
methods. Paper presented at the conference on improving interpretive research methods in
research on science classroom environments. Taipei, Taiwan.
Fung, D., & LeDrew, E. (1987) Application of principal components analysis to change
detection. Photogrammetric Engineering and Remote Sensing, 53(12), 1649-1658.
Gaciri S. J. & Davis (1993). The occurrence and geochemistry of fluoride in natural waters in
Kenya. Journal of Hydrology, 143, 395–412.
228
Gakii, C. (2005, March 9). Logging around Seven Forks dam may affect electricity production.
The East African Standard.
Gaston, K. J., & Blackburn, T. M. (2000). Pattern and processes in macroecology. Oxford:
Blackwell Scientific.
Gathaara, G. (1999). Aerial survey of the destruction of Mt Kenya, Imenti and Ngare Ndare
Forest Reserves. Nairobi: Kenya Wildlife Service (KWS).
Gauld, R. (2000). Maintaining centralized control in community-based forestry: Policy
construction in the philippines. Development and Change, 31 (2), 229-54.
Geist, H.J & Lambin, E.F. (2001). What drives tropical deforestation? LUCC Report Series No.
4. CIACO: Louvain-la-Neuve.
Giorgi, A. (1997). The theory, practice and evaluation of the phenomenological method as a
qualitative research procedure. Journal of Phenomenological Psychology, 28(2), 235-260.
Githaiga, J. (1998). Recent wildlife population trends in Kenya. Nairobi: Kenya Wildlife Service.
Glenday, J. (2006). Carbon storage and emissions offset potential in an East African tropical
rainforest. Forest Ecology and Management, 235, 72-83.
Global Land Project. (2005). Science plan and implementation strategy. IGBP Report No.
53/IHDP Report No. 19. Stockholm: IGBP Secretariat.
Gomez, A. A. (1938). Multiple cropping in the humid tropics of Asia. , Canada: IDRC.
229
Government of Benin (2003). Benin poverty reduction strategy. Paper 30. Cotonou: Government
of Benin.
Government of Kenya (1965). Sessional paper no. 10 of 1965: African nationalism and its
application to planning in Kenya. Nairobi: Government of Kenya.
Government of Kenya (1972). Kenya's national report to the United Nations on the human
environment. Nairobi: Government Printer.
Government of Kenya (1977). The Wildlife (Conservation and Management) Act, Cap 376.
Nairobi: Government Printer.
Government of Kenya (1983). District Focus for Rural Development Policy Paper. Nairobi:
Government Printer.
Government of Kenya (1986a). The Kenya gazette supplement, acts: States Corporation (Nyayo
Tea Zones Corporation) Act 1986. Nairobi: Government Printer.
Government of Kenya (1986b). The Kenya gazette supplement: Science and Technology
Ammendment Act (Chapter 250). Nairobi: Government Printer.
Government of Kenya (1988). The Kenya gazette supplement, acts: Chief’s Authority Act 1988.
Nairobi: Government Printer.
Government of Kenya (1989): Wildlife (Conservation and Management–Amendment) Act. Kenya
Gazette Supplement No. 95. Nairobi: Government Printer.
230
Government of Kenya (1994a). The National Environment Action Plan Report. NES, Nairobi,
Nairobi: Government Printer.
Government of Kenya (1994b). Kenya Forest Policy, 1994.Nairobi: Government Printer.
Government of Kenya (1994c). Kenya Forestry Master Plan. Nairobi: Government Printer.
Government of Kenya (1997): Africa Country Facts Book, 1997. Nairobi: Government Printer.
Government of Kenya (1999a): The Forestry Master Plan for Kenya. Ministry of Environment
and Natural Resources. Nairobi: Government Printer.
Government of Kenya (1999b). National Policy on Water Resources Management and
Development, Sessional Paper No 1 of 1999. Government Printer, Nairobi.
Government of Kenya (2000a). The Kenya Gazette Supplement, Acts: Environmental
Management and Co-ordination Act, 1999. Nairobi: Government Printer.
Government of Kenya (2000b). The National Biodiversity Strategy and Action Plan. NES,
Nairobi: Government Printer.
Government of Kenya (2001a). State of Forests in Kenya, 2001. Kenya Forest Department,
Nairobi: Government Printer.
Government of Kenya (2001b). Nandi District Development Plan 2001-2008. Nairobi:
Government Printer.
231
Government of Kenya (2002). The Kenya Gazette Supplement, Acts: Water Act 2002. Nairobi:
Government Printer.
Government of Kenya (2003). Poverty Reduction Strategy Paper, Nandi District. Nairobi:
Government Printer
Government of Kenya (2005). The Kenya Gazette Supplement, Acts: Forest Act 2005. Nairobi:
Government Printer.
Government of Kenya (2007). National Land Policy Draft. Ministry of Lands. Nairobi:
Government Printer.
Government of Kenya (2008). Final Draft Sessional Paper on National Wetlands Conservation
and Management. Nairobi: Government Printer.
Government of Kenya. (2005). Nandi District Strategic Plan 2005 - 2010 for the Implementation
of National Population Policy for Sustainable Development. Nairobi: National Coordination
Agency for Population and Development (Ministry of Planning and National Development).
Government of Kenya. (2005). Nandi District Strategic Plan 2005-2010 for Implementation of
the National Population Policy for Sustainable Development. Nairobi: National Coordination
Agency for Population and Development, Ministry of Planning and National Development.
Government of Kenya/United Nations Environment Programme. (1997): National land
degradation and natural resources mapping in Kenya. Nairobi: Government Printer.
232
Government of Kenya/United Nations Environment Programme. (2001): Devastating Drought in
Kenya: Environmental Impacts and responses. Nairobi: Government Printer.
Government of the Papua New Guinea. (2006). National report of the Papua New Guinea for the
fifth session of the committee for the review of the implementation of the United Nations
convention to combat desertification. (C. Kaluwin, A. Nita, & P. Samuel, Eds.) Port
Moresby, Papua New Guinea: University of Papua New Guinea.
Green, E., Clark, C. D., Mumby, P. J., Edwards, A. J., & Ellis, A. C. (1998). Remote sensing
techniques for mangrove mapping. International journal of remote sensing, 19(5), 935-956.
Greene, J. C., & Caracelli, V. J. (1997). Defining and describing the paradigm issue in mixed
method evaluation. In J. C. Greene and V. J. Caracelli (Eds.), Advances in mixed-method
evaluation: The challenges and benefits of integrating diverse paradigms. San Francisco:
Jossey-Bass.
Gregorio, A. D., & Latham, J. (2002). AFROCOVER landcover and classification and mapping
project (Vol. 1). Rome: FAO.
Groundwater (1988): well site for low supplies (well sitting guide). World Bank/UNDP.
Guba, E. G., & Lincoln, Y. S. (1994). Competing paradigms in qualitative research. In Denzin
and Lincoln (1994), Handbook of Qualitative Research. Thousand Oaks, California: Sage.
Hall, B., & Howard, K. (2008). A synergistic approach: Conducting mixed methods research
with typological and systemic considerations. Journal of Mixed Methods Research, 2(3),
248-269.
233
Halls, P. M. (1995). Moving GIS into the fourth dimension: Or the case of todes. Proceedings of
the GIS Research UK 1995 Conference. Newcastle upon Tyne, pp 41-43.
Hamilton I. D., et al. (1992). African elephant database, 1992. European Commission African
Elephant Survey and conservation Programme.
Hamilton, K., Sjardin, M., Marcello, T., Xu, G. (2008). Forging a frontier: State of the voluntary
carbon markets 2008. New York and Washington, DC: Ecosystem Marketplace & New
Carbon Finance.
Hamilton, L. S. & Pearce, A. J. (1987). What are the soil and water benefits of planting trees in
developing country watersheds? In D. D. Southgate, and J. D. Disinger (eds), Sustainable
development of natural resources in the third world (pp. 39-58). Boulder CO, USA:
Westview Press.
Hamilton, L. S., & King, P. N. (1983). Tropical Forested Watersheds: Hydrologic and Soils
Response to Major Uses or Conversions. Boulder, Colorado, USA: Westview Press.
Hamilton, L. S., et al. (2008). Forests and water: A thematic study prepared in the framework of
the global forest resource assessment 2005. Rome: FAO.
Hamilton, L. S., Juvik, J. O., & Scatena, F. N. (eds). (1994). Tropical montane cloud forests.
Ecological Studies Series, Vol. 110. New York, Berlin, London, Paris and Tokyo: Springer-
Verlag.
Hardin, G. (1959). Journal of Heredity 50, 68.
234
Hardin, G. (1968). Tragedy of the commons. Science. 162, 1243-1248.
Hart, G. (2001). Development critiques in the 1990s: Cul de sac and promising paths. Progress
in Human Geography, 25, 649–58.
Henn, M., Wienstein, M., & Foard, N. (2006). A Short introduction to Social Research. London
and Thousand Oaks, California: SAGE.
Herbert, S. (2000). For Ethnography. Progress in Human Geography, 24, 550–68.
Heron, J. & Reason, P. (1997). A participatory inquiry paradigm. Qualitative Inquiry, 3(3), 274-
294.
Hestira, E. L., Khannaa, S., Andrewa, M. E., Santosa, M. J., Viersb, J. H., Greenberga, J. A., et
al. (2008). Identification of invasive vegetation using hyperspectral remote sensing in the
California Delta ecosystem. Remote Sensing of Environment , 112(11), 4034-4047.
Hetemäki, L., & Nilsson, S. (2005). Information technology and the forest sector. IUFRO
World Series, Volume 18, International Union of Forestry Research Organizations (IUFRO),
Vienna, Austria.
Hewlett, J. D. (1982). Forests and floods in light of recent investigations. Proceedings of the
Canadian Hydrology Symposium; 14-15 June 1982; Fredericton, New Brunswick. Associate
Committee on Hydrology, National Research Council of Canada, pp. 543-59.
Hoekstra, J. M., Boucher, T. M., Ricketts, T. H., & Roberts, C. (2005). Confronting a Biome
Crisis: Global Disparities of Habitat Loss and Protection. Ecology Letter, 8, 23–29.
235
Holling, C. S. (1986). The Resilience of Ecosystems: Local Surprise and Global Change. In
W.C. Clark and R.E. Munn (eds) Sustainable Development of the Biosphere (pp. 292–397.
Cambridge, UK: Cambridge University Press.
Holling, C.S. (1973). Resilience and stability of ecological systems. Annu. Rev. Ecology
Evolution, 4, 2–23.
Honnay, O., Verheyen, K., Butaye, J., Jacquemyn, H., Bossuyt, B., and Hermy, M. (2002).
Possible effects of habitat fragmentation and climate change on the range of forest plant
species. Ecology Letter, 5, 525–530.
Howes, M. (1979). The uses of indigenous technical knowledge in development. IDS Bulletin,
10, 12–23.
Howes, M., & Chambers, R. (1979). Indigenous technical knowledge: analysis, implications and
issues. IDS Bulletin, 10, 5–11.
Hubbard, M. (2001). Attacking poverty: A strategic dilemma for the World Bank. Journal of
International Development, 13, 293–98.
Huber, U. M., Bugmann, H. K. M., & Reasoner, M. A., (eds). (2005). Global change and
mountain regions: An overview of current knowledge. Advances in Global Change Research,
Vol. 23. Netherlands: Springer-Verlag.
Huchzermeyer, M., & Karam, A., (eds). (2006). Informal settlements: A perpetual challenge
Cape Town: UCT Press.
236
Husen, T. (1999). Research paradigm in education. In J. P. Keeves & G. Lamomski (Eds.),
Issues in Education Research (pp. 31-39). New York: Pergamon.
Intergovernmental Panel on Climate Change. (2000). Land-use, Land-use Change and Forestry.
Intergovernmental Panel on Climate Change. Cambridge: Cambridge University Press.
Intergovernmental Panel on Climate Change. (2007). Climate change 2007: Impacts, Adaptation
and Vulnerability. Contribution of Working Group II to the Fourth Assessment Report of the
Intergovernmental Panel on Climate Change. Cambridge: Cambridge University Press.
International Tropical Timber Organization. (2006). Status of tropical forest management 2005.
ITTO Technical Series No. 24. Yokohama, Japan.
Jansen, L. J. M., & Gregorio A. (2003) Land-use data collection using the “land cover
classification system”: Results from a case study in Kenya. Land Use policy, 20, 131-148.
Jansen, L. J. M., & Gregorio, A. (2002). Parametric land cover and land-use classifications as
tools for environmental change detection. Agriculture, Ecosystems and Environment, 91, 89-
100.
Jensen, R. (2005). Introductory digital image processing: a remote sensing perspective. (3rd ed.).
New Jersey: Pretence Hall.
Joppe, M. (2000). The research process. Retrieved June 12, 2011, from
http://www.ryerson.ca/~mjoppe/rp.htm
237
Juday, G. P., Barber, V., Duffy, P., Linderhorm, H., Rupp, S., Sparrow, S., Vaganov, E., &
Yarie, J. (2005). Forests, land management and agriculture. In: Arctic climate impact
assessment: Scientific report (781–862). Cambridge: Cambridge University Press.
Kaimowitz, D. (2004). Useful myths and intractable truths: the politics of the link between
forests and water in Central America. In M. Bonell and L.A. Bruijnzeel (eds). Forests, water
and people in the humid tropics: past, present and future hydrological research for
integrated land and water management. Cambridge, UK: Cambridge University Press.
Kellert, S. R., Mehta, J. N., Ebbin, S. A., & Lichtenfeld, L. L. (2000). Community natural
resource management: Promise, rhetoric, and reality. Society Natural Resources, 13, 705–
715.
Kenya Forest Working Group/East African Wildlife Society. (2001). Forest excision in Kenya
and their impacts. Nairobi: UNEP.
Kenya National Bureau of Statistics. (2010). Kenya 2009 Population and Housing Census
Highlights. Nairobi: Kenya National Bureau of Statistics.
Kim, S. (2003). Research paradigms in organizational learning and performance. Competing
Modes of Inquiry. Information Technology, Learning, and Performance Journal, 21(1), 9-18.
Kimpei, M. (1991): Subdivision of group ranches in Kajiado District. Nairobi: Kenya Wildlife
Service.
Knamiller, G. (1983). Environmental Education for Relevance in Developing Countries. The
Environmentalist. Springer Netherlands. Volume 3, Number 3 / June, 1983.
238
Knamiller, G. (1983, June). Environmental education for relevance in developing countries. The
Environmentalist, 3 (3).
Kohler, W. (2004). Aspects of international fragmentation. Review of International Economics,
12 (5), 793-816.
Kokwaro, J. O. (1988). Conservation status of the Kakamega Forest in Kenya: The easternmost
relic of the equatorial rainforests of Africa. Monographs in Systematic Botany (Missouri
Botanical Garden), 25, 471-489.
Kotwal, P. C., Omprakash, M. D., Kandari, L. S., Mali, K. P., Mohit, B., & Apurva, M. (2008).
Sustainable forest management through community participation. Current Science, 95(8),
1015-1017.
Lambin, E. F., Geist, J. H., & Lepers, E. (2003). Dynamics of land-use and land-cover change in
tropical regions. Annual review of environmental resources, 28, 205-241.
Lambin, E. F., Tuner, B. L., Geist, H. J., Agbola, S. B., Angelsen, A., Bruce, J. W., Coomes, T.
O., Dirzo, R., Ficher, G., Folke, C., George, P. S., Homewood, I. J., Leemans, R., Li, X.,
Moran, E. F., Mortimore, M., Ramakrishan, P. S., Richards, J. F., Skanes, H., Stone, G. D.,
Svedin, U., Veldkamp, T. A., Coleen, V., & Xu, J. (2001). The causes of land-use and land-
cover change: moving beyond the myths. Global environmental change, 11, 261-269.
Langley, M. S. (1979). The Nandi of Kenya: Life Crisis Rituals in a Period of Change. London:
C. Hurst and Co. Ltd.
239
Langton & Ma Rhea (2003). The "wild", the market, and the native: Indigenous people face new
forms of global colonization. In S. Vertovec and D. Posey (eds). Globalization, Globalism,
Environments and Environmentalism: Consciousness of Connections, The Linacre Lectures
(pp l41-167). Oxford: Oxford University Press Oxford.
Lanly, J. P. (1995). Sustainable Forest Management: Lessons of History and Recent
Developments. Unasylva, 46(182), 38–45.
Lasaponara, L. (2006). The use of principal component analysis (PCA) for evaluating inter-
annual vegetation anomalies from SPOT/ VEGETATION NDVI temporal series. Ecological
Modeling, 194, 429-434.
Laurance, W.F. (1999). Reflections on the tropical deforestation crisis. Biological Conservation,
91, 109–117.
Lawrence, R, L., & Ripple, W, J. (1998). Comparisons among vegetation indices and bandwise
regression in a highly disturbed, heterogeneous landscape: Mt st. Helens, Washington.
Remote Sensing of environment, 64, 91-102.
Leach, M. & Fairhead, J. (2000). Fashioned forest pasts, occluded histories? International
environmental analysis in West African locales. Development and Change, 31, 35–59.
Leitao, A. B., & Ahern, J. (2002). Applying Landscape ecological concepts and metrics in
sustainable landscape planning. Landscape and urban Planning, 59, 65-93.
Li, C. (2000). Fire regimes and their simulation with reference to Ontario. In A.H. Perera, D.L.
Euler, and I. D. Thompson (eds). Ecology of a managed terrestrial landscape: Patterns and
processes of forest landscapes in Ontario(115–140). Vancouver: UBC Press.
240
Liebhold, A. M., Macdonald, W. L., Bergdahl, D., & Maestro, V. C. (1995). Invasion by Exotic
Forest Pests: A Threat to Forest Ecosystems. Forest Science, 41, 1-49.
Lillesand, T. M., Kiefer, R., & Chipman, J. W. (2004). Remote sensing and image interpretation.
(5th ed.). New York: John Wiley & sons, Inc.
Lincoln, Y. & Guba, E. (2000). Paradigmatic controversies, contradictions, and emerging
confluences. In N. Denzin and Y. Lincoln (eds). Handbook of Qualitative Research. (2nd
ed),
(163-188). London: Sage.
Lori, A. T., & Susanna, B. (1997). Diversity and dynamics of shifting cultivation: Myths,
realities and policy implications. Washington DC, USA: World Resources Institute.
Lu, D., Mausel, P., Brondizio, E., & Moran, E. (2003). Change detection techniques.
International Journal of Remote Sensing, 25(12), 2365-2407.
Lulla, K. (1983). The Landsat satellites and selected aspects of physical geography. Physical
Geography , 7, 1-45.
Macleod, R. D., & Congalton, R. G., (1998). A quantitative comparison of change detection
algorithms for monitoring eelgrass from remotely sensed data. Photogrammetric Engineering
and Remote Sensing, 64(3), 207-216.
Majale, M. (2008). Employment creation through participatory urban planning and slum
upgrading: The case of Kitale, Kenya. Habitat International, 32(2), 270-282.
Mas, J. F. (2004). Mapping land use/cover in a tropical coastal area using satellite data, GIS and
artificial neural networks. Estuarine, coastal and Shelf Science, 59, 219-230.
241
Maser, C. (1994). Sustainable Forestry: Philosophy, Science and Economics. Florida: St. Lucie
Press Inc.
Matiru, V. (Ed.). (1999). Forest Cover and Forest Reserves in Kenya: Policy and Practice.
Nairobi: Kenya Forest Working Group.
Mautner, T. (2005): The Penguin Dictionary of Philosophy. Penguin Books.
McCay, B. J. (2002). Emergence of Institutions for the Commons: Contexts, Situations and
Events. In E. Ostrom, T. Dietz, N. Dolsak, P. Stern, S. Stonich, and E. U. Weber (eds) The
Drama of the Commons (pp 361–402). Washington, DC: National Academy Press.
McKean, M. A. (2000). Common property: What is it? What is it good for, and what makes it
work? In C. G. Gibson, M. A. McKean and E. Ostrom (eds), People and forests:
Communities, institutions and governance (pp 27–56). Cambridge, MA: MIT Press.
McMillan, J. Schumacher, S. (1993). Research in Education. Lebanon, IN: Addison Wesley
Educational Publisher
Mertens, B., & Lambin, E. F. (2000). Land cover change trajectories in southern Cameroon.
Annals of Association of American Geographers, 90(3), 467-494.
Mertens, D. M. (1998). Research methods in education and Psychology: Integrating diversity
with quantitative and qualitative approaches. Thousand Oaks, California: Sage.
Mesev, V. (2007). Fusion of point-based urban data with IKONOS imagery for locating urban
neighbourhood features and patterns. Information Fusion, 8, 157-167.
242
Mesev, V. (Ed.). (2007). Integration of GIS and Remote Sensing. West Sussex: John Wiley &
Sons.
Meyer, W. B., & Turner, B. L. (1992). Human population growth and global land use/cover
change. Annual Review of Ecology and Systematics, 23, 39-61.
Meyer, W. B., & Turner, B. L. (1994). Changes in land use and land cover: A global
perspective. Cambridge, UK and New York, USA: Cambridge University Press.
Michon G. (2005). Domesticating forests: How Farmers manage forest resources in
FORRESASIA, Bogor, Indonesia. In R. S. Mark, W. Peter (eds), Communities and forest
stewardship: Regional transitions in Southeast Asia. Bohol, Philippines: Asia Forest
Network.
Miller, G.T. (2001). Environmental Science (8th
Ed). California: Brooks/Cole Thomson
Learning.
Mitchell, T. (1995). The object of development: America‟s Egypt. In J. Crush (ed), Power of
development (129–157). London: Routledge.
Mohan, G. & Stokke, K. (2000). Participatory development and empowerment: the dangers of
localism. Third World Quarterly, 21, 247–68.
Molnar, A. & White, T. A. (2001). Forestry and land management. In M. M. Guigale, O.
Lafourcade and V.H. Nguyen (eds), A Comprehensive Development Agenda for the New Era
(pp 669-681). Washington, D.C: World Bank.
243
Moran, E. F. (1993). Deforestation and land use in the Brazilian Amazon. Human Ecology, 21,
1–21.
Morse, J. (1991). Approaches to qualitative-quantitative methodological triangulation. Nursing
Research, 40(1), 120-123.
Moss, C., Schreckenberg, K., Luttrell, C. & Thassim, E. (2005) Participatory Forest
Management and Poverty Reduction: a review of the evidence Draft review, ARPIP project,
ODI. Available at:
http://www.odi.org.uk/fpeg/activities/environmental_governance/SO137/impact_review.pdf
Mula, I., & Tilbury, D. (Eds.). (2011). National Journeys towards Education for Sustainable
Development. Paris, France: UNESCO.
Mumma, A. (2005). Kenya‟s new water law: An analysis of the implications for the rural poor. A
paper presented at the International workshop on African Water Laws: Plural Legislative
Frameworks for Rural Wate rManagement in Africa, 26-28 January 2005, Johannesburg,
South Africa.
Mwakubo, S. M., & Obare, G. A. (2009). Vulnerability, livelihood assets and institutional
dynamics in the management of wetlands in Lake Victoria watershed basin. Wetlands
Ecology and Management , 17, 613–626.
Mwiturubani, D. A. (2010). Climate Change and Access to Water Resources in the Lake Victoria
Basin. In D. A. Mwiturubani, J.-A. van Wyk, R. Mwebaza, & T. Kabanda (Eds.), Climate
Change and Natural Resources Conflicts in Africa (pp. 63-79). Pretoria, South Africa:
Institute for Security Studies (ISS).
244
Myers, G.A. (2002). Local communities and the new environmental planning: A case study from
Zanzibar. Area, 34, 149–59.
Nair, C. T. & Dykstra, D. P. (1998). Roles of global and regional networks and consortia in
strengthening forestry research. In Proceedings of the International Consultation on
Research and Information Systems in Forestry, Vienna, Austria, Federal Ministry of
Agriculture and Forestry.
Nair, C. T. (2004). What does the future hold for forestry education? Unasylva, 216, 3–9.
National Environmental Education Advisory Council. (2005). Setting the standard, measuring
results, celebrating successes: A report to congress on the status of environmental education
in the United States. Washinton DC: National Environmental Education Advisory Council.
Neuman, W. L. (2000). Social Research Methods (4th
ed). Boston, MA: Allyn and Bacon.
Newman, E.I. (1995). Phosphorus inputs to terrestrial ecosystems. Journal of Ecology, 83, 713–
726.
Ng'ang'a, W. (2005). Kenya's ethnic communities: Foundation of the nation. Nairobi, Kenya:
Primex Printers Ltd.
Ngassa E. A. (2003). Traditional doctors and psychiatry in the north west province of
Cameroon: The case of Bafut and Njinikom. Michigan: University of Michigan.
Nkako, F. M. (1999). Project impacts downstream and natural resource use conflicts: The case of
the Lower Tana riverine forests. A paper presented at the Regional Workshop on Natural
Resource Based Conflict Management: Implications for Community Forestry 11-17 April,
1999, Mombasa, Kenya.
245
Ntsebeza, L. (2005). Democracy Compromised: Chiefs and the Politics of the Land in South
Africa. Leiden and Boston: Brill Academic Publishers.
Nyrud, A. Q. & Devine, Å. (2005). E-Commerce. In L. Hetemäki & S. Nilsson (eds),
Information technology and the forest sector (pp. 49–64). Vienna: IUFRO.
Ogweno, D. O. & P. O. Odwori. (2001). Modeling forest plantation development in Kenya.
Discovery and innovations, (Special Edition), 2001.
Ojang, F. F., & Ogendo, R. B. (1973). A Study in Physical and Human Geography. Nairobi:
Longman Kenya.
Okali, C., Sumberg, J. & Farrington, J. (1994). Farmer participatory research: Rhetoric and
reality. London: Intermediate Technology Publications/Overseas Development Institute.
Okoth, O. (2001). Legislating the commons: The opportunity and the challenge in the common
property resource digest (Vol. 57). Quarterly publication of the International Association for
the Study of Common Property. Gary, Indiana. U.S.
Onyando J. (2004). Degradation of Mau Forest water catchment and its effect on Sondu Miriu
River. Paper presented to Mau watershed outreach stakeholders consultative meeting, 10th
September 2004, Egerton University, Kenya.
Orodho, A. B. (1997). Country Pasture/Forage Resource Profiles: Kenya. Retrieved May 11,
2011, from http://www.fao.org/ag/AGP/AGPC/doc/Counprof/Kenya.htm
Ostrom, E. (1990). Governing the commons: the evolution of institutions for collective action.
Cambridge, UK, and New York: Cambridge University Press.
246
Otiende, J., Ezaza, W., Boisvert, R., Ombech, A., Ogeno, J., Shiundu, J., et al. (1991). An
Inroduction to Environmental Education. Nairobi: Nairobi University Press.
Overseas Development Institute (ODI). (2005). Draft literature review on impacts of
Participatory Forest Management. Nairobi, Kenya.
Palmer, J. A. (1998). Environmental education in the 21st century: Theory, practice, progress
and promise. New York: Routledge.
Pandey, V. C. (2005). Environmental Education. Delhi: Isha Books.
Parrotta, J. A. & Agnoletti, M. (2007). Traditional forest knowledge: Challenges and
opportunities. Forest Ecology and Management, 249, 1–4.
Paulsson, B. (1992). Urban Applications of Satellite Remote Sensing and GIS Analysis.
Washington: World Bank.
Peng, C. (2000). Understanding the role of forest simulation models in sustainable forest
management. Environmental Impact Assessment Review, 20, 481–501.
Peterson, G. D., Allen, C. R., & Holling, C. S. (1998). Ecological resilience, biodiversity, and
scale. Ecosystems, 1, 6–18.
Petit, C., Scudder, T., & Lambin, E. (2001). Quantifying processes of land-cover change by
remote sensing: Resettlement and rapid land-cover changes in south-east Zambia.
International Journal of Remote Sensing, 22(17), 3435-3456.
Post, W. M., Peng, T. H., Emanuel, W., King, A. W., Dale, V. H., DeAngelis, D. L. (1990). The
global carbon cycle. American Scientist, 78, 310–326.
247
Pottier, J. (2003). Negotiating local knowledge: An introduction. In J. Pottier, A. Bicker and P.
Sillitoe (eds). Negotiating local knowledge: Power and identity in development (pp 1–29).
London: Pluto Press.
Rebugio, L. L., & Camacho, L. D. (2005). Reorienting forestry education to sustainable forest
management: The case of the University of the Philippines Los Banos College of forestry and
natural resources. Forest Science and Technology, 1 (2), 193-198.
Rendeaux, G., Steven, M., & Baret, F. (1996). Optimization of soil adjusted vegetation indices.
Remote Sensing of Environment, 55, 95-107.
Revilla A. V., Javier E., Vergara N. & Gendrano, O. (1999). Quo vadis Philippine forestry:
Toward environmental disaster or on to sustainability. A green paper on Sustainable
Forestry/Watershed-Based Sustainable Development, Forestry: 2050. Los Baños, Laguna,
Philippines.
Reyes, P. (2002). Qualitative Research Design 2002. Available at:
http://www.edb.utexas.edu:16080/reyes/appendixb.html
Ribot, J. C. (1999). Decentralization, participation and accountability in sahelian forestry: Legal
instruments of political-administrative control. Africa, 69(1), 23–65.
Ribot, J. C. (2002). Democratic decentralization of natural resources: Institutionalizing popular
participation. Washington, DC: World Resources Institute.
Richard, E., & Haack, B. (1996). National land cover mapping by remote sensing. World
Development, 24, (5), 845-855.
248
Richards, P. (1995). Indigenous agricultural: Ecology and food production in West Africa. ,
London: Hunchinson.
Ruddiman, W. F. (2003). The anthropogenic greenhouse era began thousands of years ago.
Climatic Change, 61, 261-293.
Rutten, M. M. (1992). Selling wealth to buy poverty: The process of the individualization of
landownership among the Maasai pastoralists of Kajiado District, Kenya, 1890-1990.
Saarbrucken, Germany: Verlag Breitenbach Publishers.
Ryerson, R. A., & Rencz, A. N. (Eds.). (1999). Manual of Remote Sensing: Remote sensing for
the earth sciences (3 ed., Vol. 3). Bethesda, Maryland : American Society for
Photogrammetry and Remote Sensing.
S. von Hoernor (1962). Science 137, 18.
Samper, D. A. (1997). 'Love, peace, and unity': Romantic nationalism and the role of oral
literature in Kenya's secondary schools. Folklore Forum , 28(1), 29-47.
Schneider, R. R., Stelfox, J. B., Boutin, S., & Wasel, S. (2003). Managing the cumulative
impacts of land uses in the Western Canadian Sedimentary Basin: A modelling approach.
Conservation Ecology, 7(1), 8. Available online at:
http://www.ecologyandsociety.org/vol7/iss1/art8/print.pdf
Schreier, G., & Dech, S. (2005). High resolution earth observation satellites and services in the
next decade: A European perspective. Acta Astronautica , 57 (2-8), 520-533.
249
Senge, P. (1990). The fifth discipline: The art and practice of the learning organization. New
York: Doubleday.
Seto, K. C., Woodcock, C. E., Song, C., Huang, X., Lu, J., & Kaufmann, R. K. (2002).
Monitoring land‐use change in the Pearl River Delta using Landsat TM. International
Journal of Remote Sensing, 23(10), 1985‐2004.
Shepherd, A. (2001). Consolidating the lessons of 50 years of „development‟. Journal of
International Development, 13, 315–20.
Sheppard, S. R. J., & Meitner, M. (2005). Using multi-criteria analysis and visualization for
sustainable forest management planning with stakeholder groups. Forest Ecology and
Management, 207(1-2), pp 171-187.
Shivoga, W. A. (2004). River Njoro water shed in the Eastern Mau, Rift Valley Province. Paper
presented to Mau watershed consultative outreach stakeholders consultative meeting, 10th
Sept. 2004, Egerton University, Kenya.
Shukla, J., Nobre, C., Sellers, P. (1990). Amazon deforestation and climate change. Science, 247,
1322–1325.
Shvidenko, A, Barber, C. V., & Persson, R. (2005). Forest and woodland systems. In R. Hassan,
R. Sholes and N. Ahs (eds), Ecosystems and Human Well-Being: Current State and Trends.
(pp 585 – 621). Washington, DC: Island Press.
Simberloff, D. (2000). Global Climate Change and Introduced Species in United States Forests.
Science and Total Environment, 262, 253–261.
250
Singh, A. 1989. Digital change detection techniques using remotely-sensed data. International
Journal of Remote Sensing,10, 989-1003.
Singh, S. (1991). Environmental Geography. Allahabad: Prayag Pustak Bhawan.
Singh, Y. K., & Bajpai, R. B. (2007). Research methodology: Techniques and trends. New
Delhi, India: APH Publishing Corporation.
Smith, C. & Dainty, P. (1991). The management research handbook. London and New York:
Routledge.
Smith, J. K. (1983). Quantitative versus qualitative research: An attempt to clarify the issue.
Educational Researcher, 12(3), 6-13.
Sombroek, W. C., Braun, H. M., & van-der-Pouw, B. J. (1982). Explanatory soil map and agro-
climatic zone map of Kenya. Report E1. Nairobi: National Agricultural Laboratories, Soil
Survey Unit.
Stow, D. A. (1993). The role of geographical information systems for landscape ecological
studies. In R. Haines-Young, D. R. Green, & S. Cousins (Eds.), Landscape Ecology and GIS.
(pp. 11-21). London: Taylor and Francis.
Struwig, F. W., & Stead G. B. (2007). Planning, designing and reporting research. Cape Town:
Pearson Education South Africa.
Teddlie, C., & Fen, Y. (2007). Mixed method sampling: A typology with examples. Journal of
Mixed Methods Research, 1(1), 77-100.
251
Teddlie, C., & Tashakkori, A. (2006). A general typology of research designs featuring mixed
methods. Research in the Schools, 13(1), 12-28.
Temu, A. (2004). Africa south of the Sahara. In trends in forestry education in Southeast Asia
and Africa, 1993 to 2002: Preliminary results of two surveys. Unasylva, 216, 17-21.
Temu, A., & Kiwia, A. (2008). Future forestry education: responding to expanding societal
needs. Nairobi: World Agro-forestry Centre.
Temu, A., & Ogweno, D. (2007). Global forestry education guidance and monitoring: how
imperative is it? In A. Temu, A. Kiwia, J. Kaboggoza, J. Kung‟u, S. Chamshama, & B.
Chikamai (Eds.), New perspectives in forestry education. Nairobi, Kenya: World
Agroforestry Centre (ICRAF).
Toews, D. W., Kay, J. J., & Nina, M. L. (2008). The ecosystem approach: Complexity,
uncertainty, and managing for sustainability. New York: Columbia University Press.
Toman, M. A., & Ashton, P. M. (1996). Sustainable forest ecosystems and management: A
review article. Forest Science, 42, 366–377.
Tomar, A. (2007). Environmental education. Delhi, India: Kalpaz Publications.
Tomich, T. P., Thomas, D. E. & van Noordwijk, M. (2004). Environmental services and land use
change in Southeast Asia: From recognition to regulation or reward? Agriculture Ecosystems
and Environment, 104, 229-244.

252
Townshed, J. R. G., Justice, C. O., Kalb, V. T. (1987). Characterization of and classification of
South American land cover types using satellite data. International journal of Remote
Sensing, 8, 1189-1207.
Tretiz, P., & Rogan, J. (2004). Remote Sensing for mapping and monitoring land-cover and land-
use change: An introduction. Progress in planning, 61, 269-279.
Trochim, W. M. (2006, October 20). Positivism and post-positivism. Retrieved June 12, 2011,
from Social research methods: http://socialresearchmethods.net/kb/positvsm.php
Trombulak, S.C., & Frissell, C. A. (2000). Review of ecological effects of roads on terrestrial
and aquatic communities. Conservation Biology, 14, 18–30.
Turker, M. (2000). Change detection using the integration of remote sensing and GIS: A polygon
based approach. International Archives of Photogrammetry and Remote Sensing , 33, 560-
564.
Turner II, B. L., W. C. Clark, R. W. Kates, J. F. Richards, J. T. Mathews, and W. B. Meyer.
1990. The Earth as Transformed by Human Action: Global and Regional Changes in the
Biosphere Over the Past 300 Years. Cambridge and New York: Cambridge University Press
with Clark University.
Uhlenbrook, S., Wenninger, J. & Lorentz, S. (2005). What happens after the catchment caught
the storm? Hydrological processes at the small, semi-arid Weatherly catchment, South-
Africa. Advances in Geosciences, 2, 237-241.
253
United Nations Conference on Environment and Development. (1992). Agenda 21. United
Conches, Switzerland: UNCED Secretariat.
United Nations Development Programme. (1999). Programme support document: Environment
and natural resource management. Nairobi, Kenya: United Nations Development
Programme (UNDP).
United Nations Educational, Scientific and Cultural Organization (1999). Declaration of science
and use of scientific knowledge, science for the twenty-first century. Budapest, Hungary,
June 26- July 1, 1999. Available at: http://www.unesco.org/science/wcs/eng/declaration.htm
United Nations Environment Programme (2001). An assessment of the status of the world’s
remaining closed forests. Nairobi: UNEP/DEWA/TR 01-2.
United Nations Environment Programme (2007). Global environmental outlook: Environment
for development, GEO 4. Nairobi: UNEP.
United Nations Forum on Forests. (2004). Traditional Forest-related Knowledge. Report of the
Secretary-General. E/CN.18/2004/7. United Nations Forum on Forests. Available at
www.un.org/esa/forests/document-sunff.html#4
van Manen, M. (1998). Researching live experience: Human science for an action sensitive
pedagogy (2nd
ed.). London, Ontario: The Althouse Press.
Verchot, L., Boye, A., & Zomer, R. (2008). Western kenya integrated ecosystem management
project: Findings from the baseline surveys. ), Nairobi: World Agroforestry Centre (ICRAF).
254
Verma, K., Ferguson, I., Wild, I. (2000). Decision support system for the sustainable forest
management. Forest Ecology and Management, 128, 49-55.
Vitousek, P. M., Aber, J. D., Howarth, R. W., Likens, G. E., Matson, P. A., Schindler, D. W.,
Schlesinger, W. H., & Tilman, D. G. (1997). Human alteration of the global nitrogen cycle:
Sources and consequences. Ecological Application, 7, 737–750.
Vogt, K. A., Gordon, J. C., Wargo, J. P., Vogt, D. J., Asbjornsen, H., Palmiotto, P. A., Clark, H.
J., O‟Hara, J. L., Keeton, W. S., Patel-Weynand, T. & Witten, E. (1997). Ecosystems:
Balancing Science with Management. New York: Springer.
Warnecke, L., Nani, R. V., Nedovic-Budic, Z., & Stiteler, W. (2002). Remote sensing and
geographic information technology in the nation's 50 state forest organizations. New York:
GeoManagement Associates Inc.
Warren, D. M. (1991). Using indigenous knowledge in agricultural development. World Bank
Discussion Paper No. 127. Washington DC: World Bank.
Warren, D. M. (1992). Indigenous knowledge, biodiversity conservation and development.
Keynote address at the international conference on conservation of biodiversity in Africa:
Local initiatives and institutional roles, Nairobi, Kenya, 1992.
Webb, P. (2008a). Arguing to learn science. In P. Webb (Ed.), Scientific literacy: A new
synthesis (4th ed., pp. 131-147). Port Elizabeth, South Africa: Bay Books.
Webb, P. (2008b). Planning an investigation. In P. Webb (Ed.), Scientific literacy: A new
synthesis (4th ed., pp. 51-76). Port Elizabeth, South Africa: Bay Books.
255
White, A. & Martin, A. (2002). Who owns the world’s forests? Forest tenure and public forests
in transition. Washington DC: Forest Trends and Centre for International Environmental
Law.
Wonnacott, T. H., & Wonnacott, R. J. (1977). Introductory statistics (3rd ed.). New York, USA:
John Wiley & Sons.
Worah, S. (2002). The challenge of community-based protected area management. PARKS, 12,
(2), 80–93
World Bank (2000). World development report 2000–01: attacking poverty. Oxford: Oxford
University Press for the World Bank.
World Bank (2004). Doing business in 2005: Removing obstacles to growth. Washington DC,
USA, Oxford University Press and World Bank.
World Bank. (1998, November 4). Indigenous knowledge for development: A framework for
development. . Retrieved June 12, 2011, from
http://siteresources.worldbank.org/EXTINDKNOWLEDGE/Resources/ikrept.pdf
World Bank. (2002). The environment and the millennium development goals. Washington DC:
World Bank.
World Conservation Union. (1993). Guidelines for the ecological sustainability of non-
consumptive and consumptive uses of wild species. Gland, Switzerland: IUCN-The World
Conservation Union.
256
World Conservation Union. (1994). Draft Initial Procedure for Assessing the Sustainability of
Use of Wild Species. Gland, Switzerland: IUCN-The World Conservation Union.
World Rainforest Movement. (2006). Excessive paper consumption: The impacts of injustice.
World Rainforest Movement (WRM) bulletin No. 109. Retrieved June 12, 2011, from
http://www.wrm.org.uy/bulletin/
World Resources Institute (2000). Canada’s forests at a crossroads: An assessment in the year
2000. Washington, D.C: World Resources Institute.
Wunder, S. (2001). The economics of deforestation: The example of Ecuador. London and New
York: St. Anthony‟s Series, Macmillan & St. Martin‟s Press.
Xu, X., Guo, H., Chen, X., Lin, H., & Du, Q. (2002). A multi-scale study on land use and land
cover quality change: The case of the Yellow River Delta in China. Geojournal, 56, 177-183.
Xu, Z. X., Zhao, M. L., Han, G. D. (2000). Eco-environmental deterioration and strategies for
preventing it in Inner Mongolia. Grassland of China, 5, 59-63.

257
APPENDICES
Appendix A: Promoter’s letter
258
Appendix B: Letter to the respondents
Nelson Mandela Metropolitan University
Faculty of Education
P.O. Box 77000
Port Elizabeth- 6031
SOUTH AFRICA.
Dear respondent,
I am a Doctor of Philosophy student undertaking a research entitled „Towards Community
Environmental Education Using Current Institutional Resources, GIS and Remote Sensing, and
Local Knowledge: A Case Study of The Nandi Hills and Nandi Forests, western Kenya.‟
I kindly request for your assistance in my research work by filling in the attached questionnaire
honestly and objectively. Your unreserved responses will be treated with utmost confidentiality
and will be exclusively used for the purposes of this study.
Thank you.
Yours faithfully,
Julius Gordon Tanui
Student No. 210117133
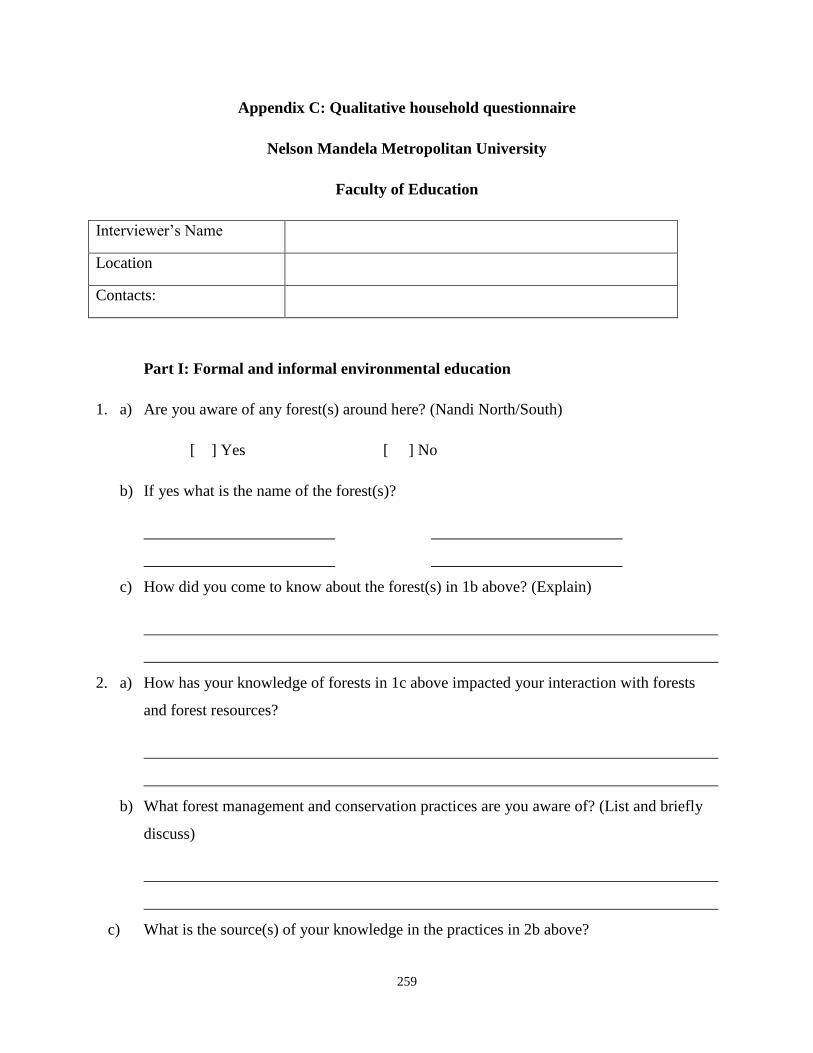
259
Appendix C: Qualitative household questionnaire
Nelson Mandela Metropolitan University
Faculty of Education
Interviewer‟s Name
Location
Contacts:
Part I: Formal and informal environmental education
1. a) Are you aware of any forest(s) around here? (Nandi North/South)
[ ] Yes [ ] No
b) If yes what is the name of the forest(s)?
c) How did you come to know about the forest(s) in 1b above? (Explain)
2. a) How has your knowledge of forests in 1c above impacted your interaction with forests
and forest resources?
b) What forest management and conservation practices are you aware of? (List and briefly
discuss)
c) What is the source(s) of your knowledge in the practices in 2b above?
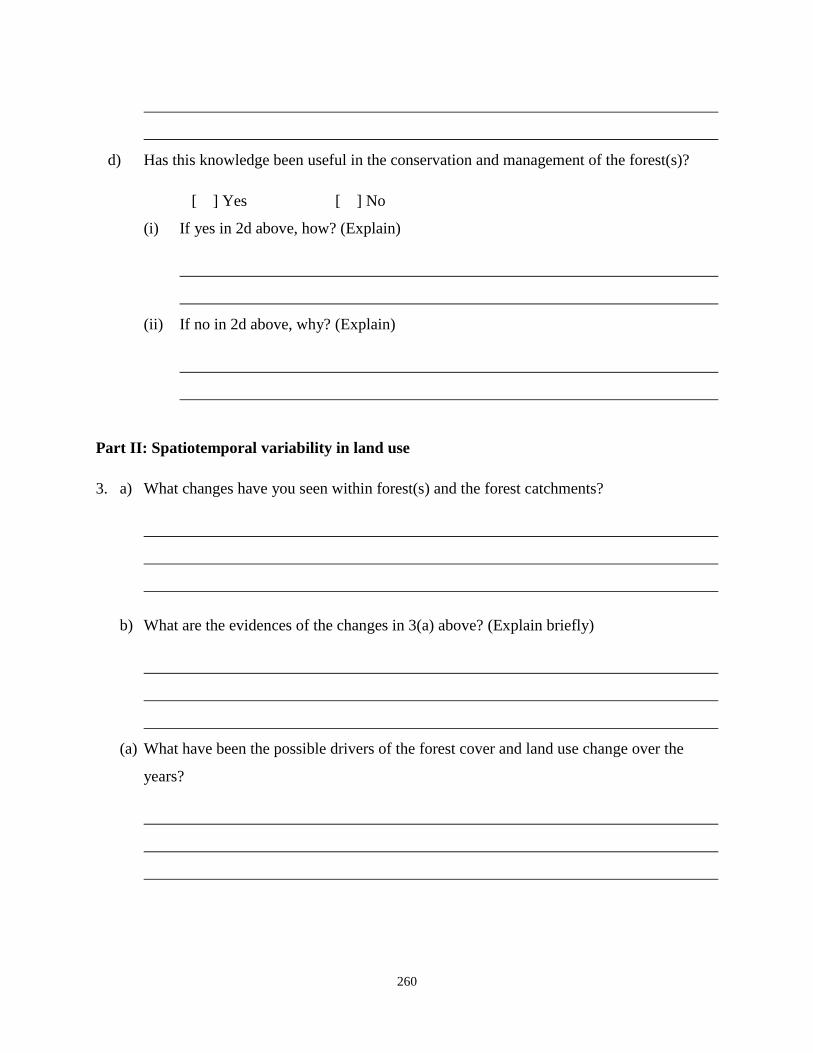
260
d) Has this knowledge been useful in the conservation and management of the forest(s)?
[ ] Yes [ ] No
(i) If yes in 2d above, how? (Explain)
(ii) If no in 2d above, why? (Explain)
Part II: Spatiotemporal variability in land use
3. a) What changes have you seen within forest(s) and the forest catchments?
b) What are the evidences of the changes in 3(a) above? (Explain briefly)
(a) What have been the possible drivers of the forest cover and land use change over the
years?
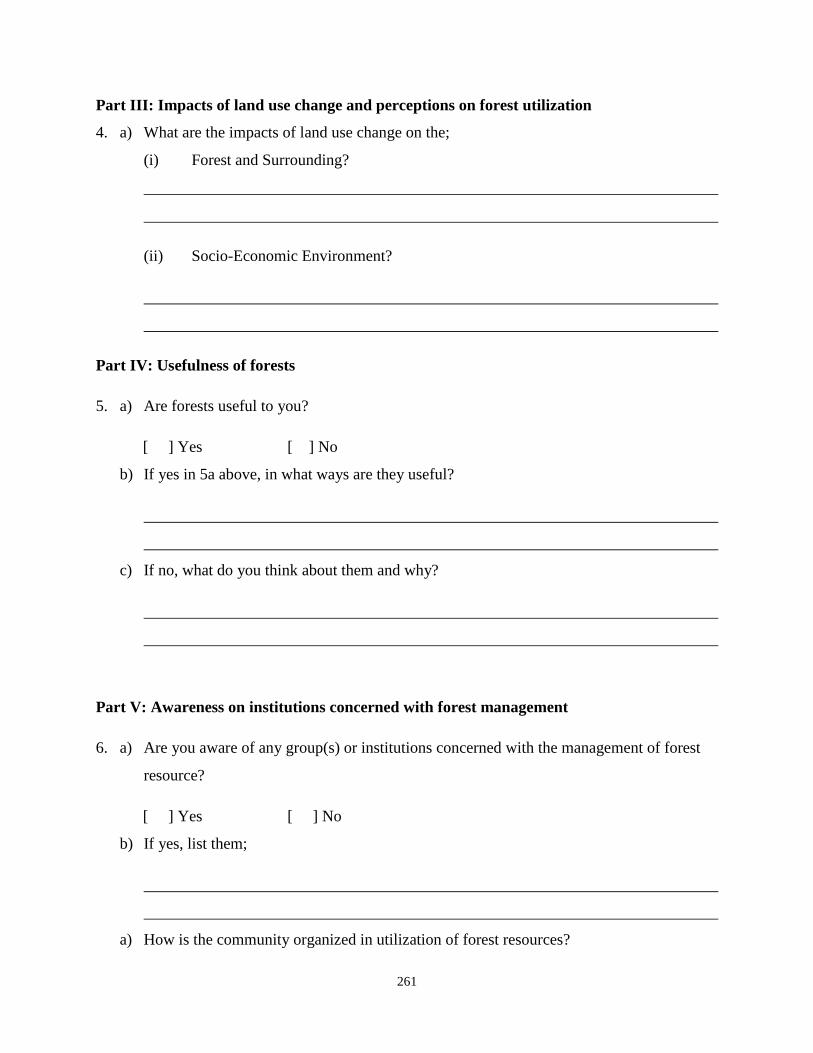
261
Part III: Impacts of land use change and perceptions on forest utilization
4. a) What are the impacts of land use change on the;
(i) Forest and Surrounding?
(ii) Socio-Economic Environment?
Part IV: Usefulness of forests
5. a) Are forests useful to you?
[ ] Yes [ ] No
b) If yes in 5a above, in what ways are they useful?
c) If no, what do you think about them and why?
Part V: Awareness on institutions concerned with forest management
6. a) Are you aware of any group(s) or institutions concerned with the management of forest
resource?
[ ] Yes [ ] No
b) If yes, list them;
a) How is the community organized in utilization of forest resources?

262
b) How effective have the arrangement in (c) above succeeded in sustainable forest
management (Briefly Explain)
7. In your view, what do you think can be done to enhance sustainable forest management;
a) By the Government?
b) By the local community?
c) N.G.Os?
d) Educational Institutions?
Thank You!
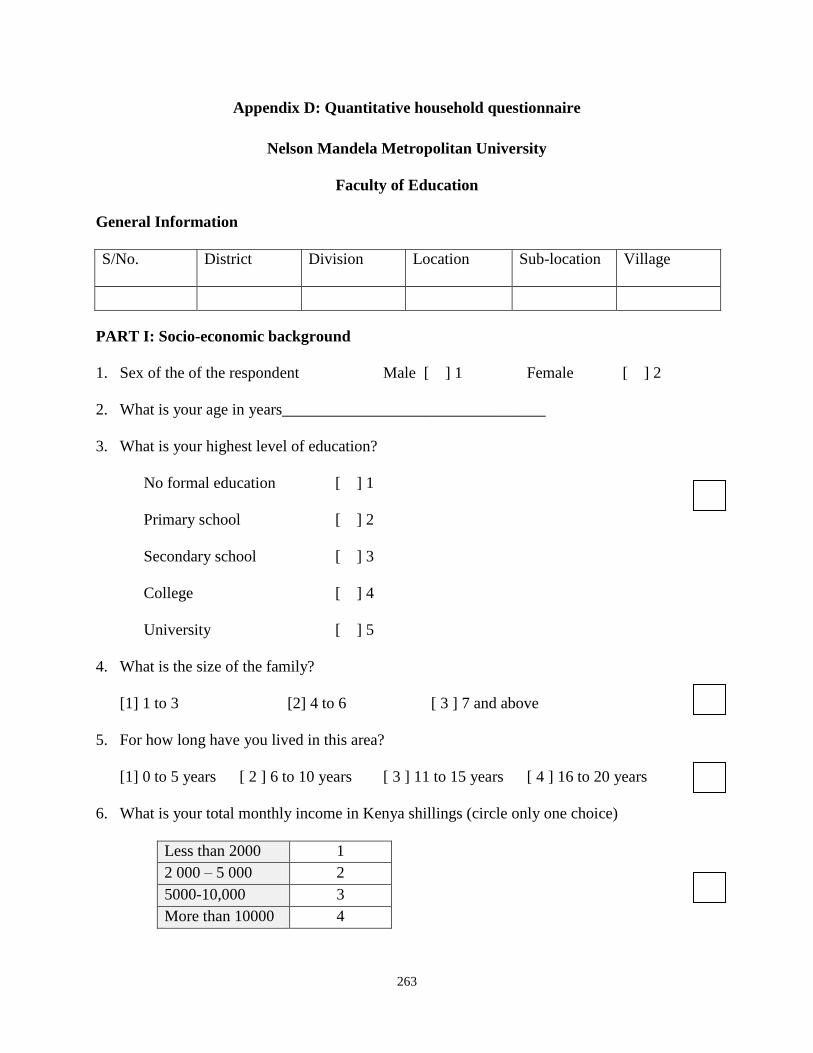
263
Appendix D: Quantitative household questionnaire
Nelson Mandela Metropolitan University
Faculty of Education
General Information
S/No. District Division Location Sub-location Village
PART I: Socio-economic background
1. Sex of the of the respondent Male [ ] 1 Female [ ] 2
2. What is your age in years_________________________________
3. What is your highest level of education?
No formal education [ ] 1
Primary school [ ] 2
Secondary school [ ] 3
College [ ] 4
University [ ] 5
4. What is the size of the family?
[1] 1 to 3 [2] 4 to 6 [ 3 ] 7 and above
5. For how long have you lived in this area?
[1] 0 to 5 years [ 2 ] 6 to 10 years [ 3 ] 11 to 15 years [ 4 ] 16 to 20 years
6. What is your total monthly income in Kenya shillings (circle only one choice)
Less than 2000 1
2 000 – 5 000 2
5000-10,000 3
More than 10000 4
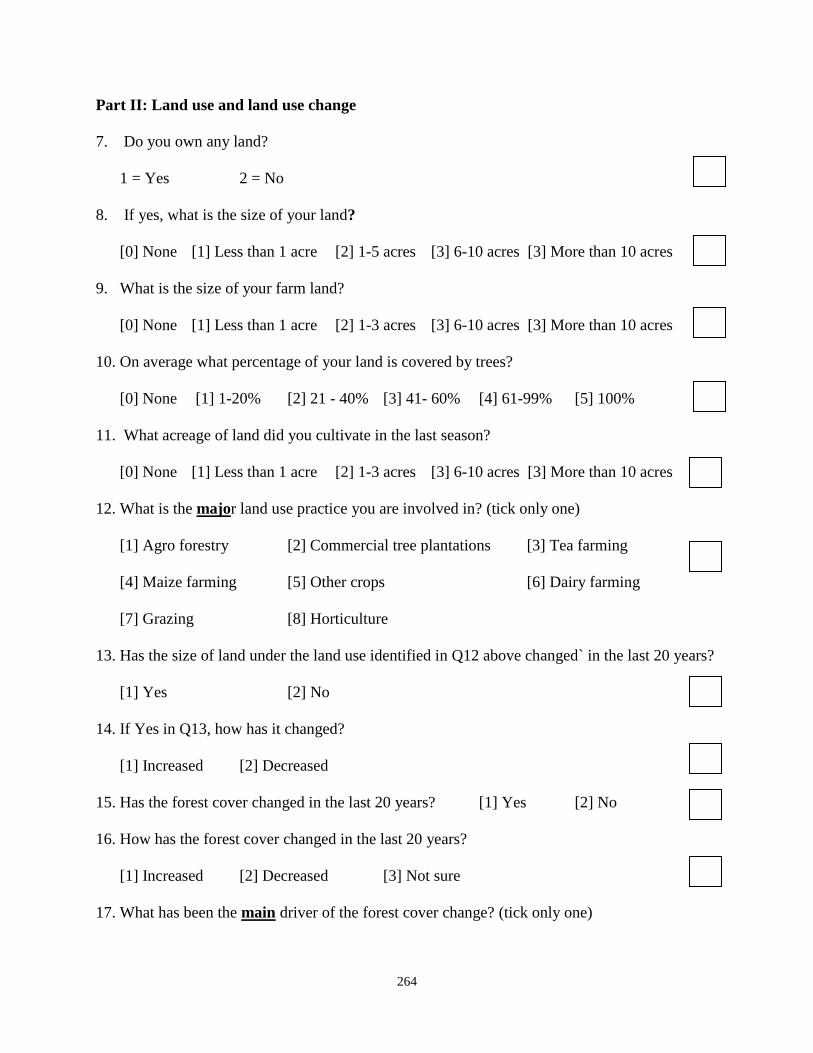
264
Part II: Land use and land use change
7. Do you own any land?
1 = Yes 2 = No
8. If yes, what is the size of your land?
[0] None [1] Less than 1 acre [2] 1-5 acres [3] 6-10 acres [3] More than 10 acres
9. What is the size of your farm land?
[0] None [1] Less than 1 acre [2] 1-3 acres [3] 6-10 acres [3] More than 10 acres
10. On average what percentage of your land is covered by trees?
[0] None [1] 1-20% [2] 21 - 40% [3] 41- 60% [4] 61-99% [5] 100%
11. What acreage of land did you cultivate in the last season?
[0] None [1] Less than 1 acre [2] 1-3 acres [3] 6-10 acres [3] More than 10 acres
12. What is the major land use practice you are involved in? (tick only one)
[1] Agro forestry [2] Commercial tree plantations [3] Tea farming
[4] Maize farming [5] Other crops [6] Dairy farming
[7] Grazing [8] Horticulture
13. Has the size of land under the land use identified in Q12 above changed` in the last 20 years?
[1] Yes [2] No
14. If Yes in Q13, how has it changed?
[1] Increased [2] Decreased
15. Has the forest cover changed in the last 20 years? [1] Yes [2] No
16. How has the forest cover changed in the last 20 years?
[1] Increased [2] Decreased [3] Not sure
17. What has been the main driver of the forest cover change? (tick only one)
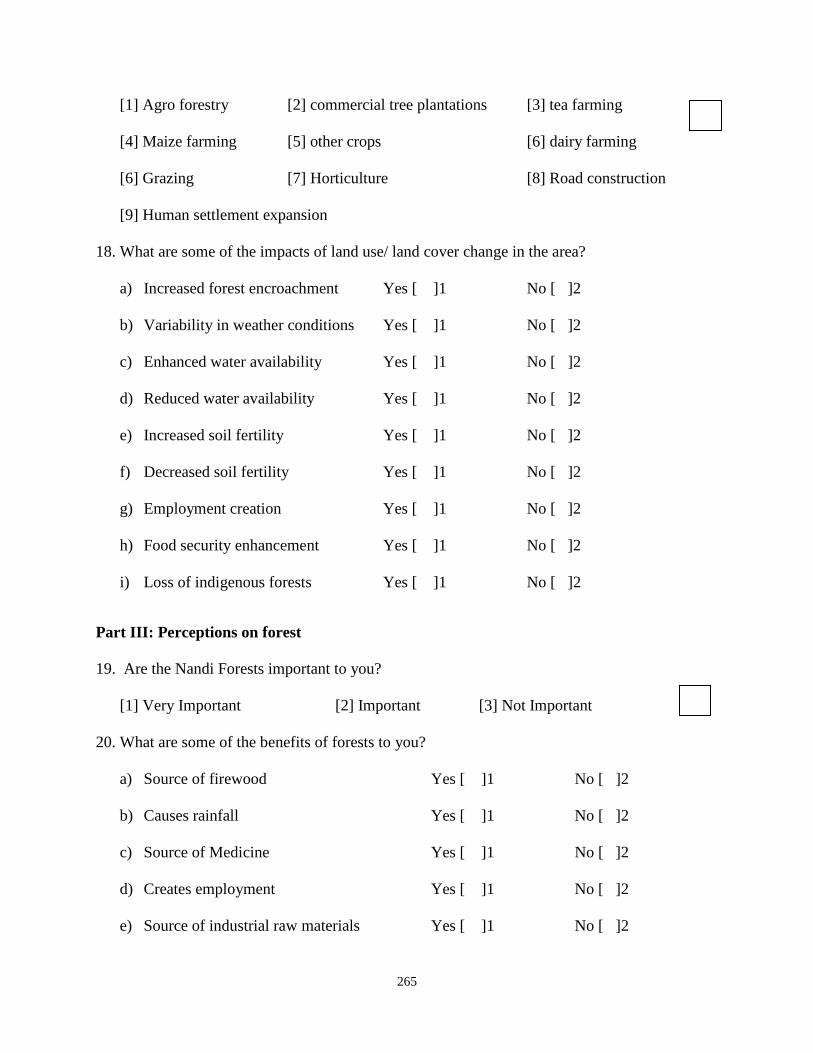
265
[1] Agro forestry [2] commercial tree plantations [3] tea farming
[4] Maize farming [5] other crops [6] dairy farming
[6] Grazing [7] Horticulture [8] Road construction
[9] Human settlement expansion
18. What are some of the impacts of land use/ land cover change in the area?
a) Increased forest encroachment Yes [ ]1 No [ ]2
b) Variability in weather conditions Yes [ ]1 No [ ]2
c) Enhanced water availability Yes [ ]1 No [ ]2
d) Reduced water availability Yes [ ]1 No [ ]2
e) Increased soil fertility Yes [ ]1 No [ ]2
f) Decreased soil fertility Yes [ ]1 No [ ]2
g) Employment creation Yes [ ]1 No [ ]2
h) Food security enhancement Yes [ ]1 No [ ]2
i) Loss of indigenous forests Yes [ ]1 No [ ]2
Part III: Perceptions on forest
19. Are the Nandi Forests important to you?
[1] Very Important [2] Important [3] Not Important
20. What are some of the benefits of forests to you?
a) Source of firewood Yes [ ]1 No [ ]2
b) Causes rainfall Yes [ ]1 No [ ]2
c) Source of Medicine Yes [ ]1 No [ ]2
d) Creates employment Yes [ ]1 No [ ]2
e) Source of industrial raw materials Yes [ ]1 No [ ]2
266
f) Aesthetic value Yes [ ]1 No [ ]2
g) Generates tourism revenue Yes [ ]1 No [ ]2
h) Water resources conservation Yes [ ]1 No [ ]2
i) Source of grass for livestock Yes [ ]1 No [ ]2
j) Source of honey, wild fruits and berries Yes [ ]1 No [ ]2
k) Cultural Significance (rites, worship, etc.) Yes [ ]1 No [ ]2
l) Fertile land for agriculture Yes [ ]1 No [ ]2
21. What is the most important benefit of forests to you?
Source of firewood [ ] 1
Causes rainfall [ ] 2
Source of Medicine [ ] 3
Creates employment [ ] 4
Source of industrial raw materials [ ] 5
Aesthetic value [ ] 6
Generates tourism revenue [ ] 7
Water resources conservation [ ] 8
Source of grass for livestock [ ] 9
Source of wild fruits and berries [ ] 10
22. Do you think that the Nandi forests are being managed well?
[1] Yes [ ] [2] No
23. If No in Q19 above, what are some of the management practices you would propose to
improve the management of the Nandi forests?
a) Public community education on importance of forest Yes [ ] No [ ]
267
b) Community Forest Management Yes [ ] No [ ]
c) Agro-forestry Yes [ ] No [ ]
d) Regulated logging Yes [ ] No [ ]
e) Statutory regulation/Full government control Yes [ ] No [ ]
f) Fencing Yes [ ] No [ ]
g) Conservation by NGOs e. g Nature Kenya Yes [ ] No [ ]
Thank You!
268
Appendix E: Key informant interview schedule
Nelson Mandela Metropolitan University
Faculty of Education
Name of the enumerator:
Name of the Institution:
Designation of the officer:
1. What are the formal or informal environmental practices that have influence management of
Nandi Forest and Nandi Hills within the community?
______________________________________________________________________________
______________________________________________________________________________
______________________________________________________________________________
2. What role does your organization play in management and conservation of Nandi Forests and
Nandi Hills?
______________________________________________________________________________
______________________________________________________________________________
______________________________________________________________________________
3. What are some of the changes in land use in the forest and forest catchments that you have
noted?
4. What are the possible impacts of land use change in Nandi Forest and Nandi Hills?
5. In your view, how does the local community perceive forest and forest resources?
269
6. What are the existing institutional arrangement for the management and conservation of
Nandi Hills and Nandi Forest?
At the:
Community level ( Village, sub location level)
Division level
District level
National Level
7. What is the effectiveness of these arrangements of these arrangements in the management
and conservation of Nandi Hills and Nandi Forest? (Answer as per the levels above)
Community level
District level
National level
270
National level (water Act, 2002, forest Act 2005)
8. What are some of the opportunities that you think have been explored for sustainable
management of Nandi Hills and Nandi Forests?
9. In your opinion, how should Nandi Hills and Nandi Forest be managed and Conserved in
view of the concepts of community Environmental education?
Thank You!
271
Appendix F: Observation checklist on forest utilization
Nelson Mandela Metropolitan University
Faculty of Education
General Information
Name of the observer:
Site Name:
Date:
Brief site description:
Forest utilization Practices
1. Timber/Wooded walled houses or fencing ( ) Yes ( ) No.
How many cases? ______
Likely source of building material:
2. Charcoal/ fuel wood used in the homestead for cooking ( ) Yes ( ) No.
How many households? _____
Likely source of charcoal or firewood:
3. a) Any evidence of harvesting of forest resources
( ) Yes ( ) No
b) Specify the exact activity for which the product is intended/utilized for:
272
Forest Ecosystem Change Drivers
a) Any damage or destruction to the forest? ( ) Yes ( ) No
b) Name exact location where damage has been done:
c) Describe the activity that has caused the damage:
d) Quantify the extent of the damage (intensity)
_______Low
_______Moderate
_______High
_______Severe
_______Very severe
a) Any evidence of indiscriminate logging or grazing? ( ) Yes ( ) No
b) Describe the extent:
_______Low
_______Moderate
_______High
_______Severe
_______Very severe
c) Describe the likely cause and rationale for the conclusion:
Conclusion
Describe the general health of the forest ecosystem

273
Appendix G: Focus group discussion guide
Nelson Mandela Metropolitan University
Faculty of Education
1. a) Have there been any changes, and what changes have you seen within forest(s) and the
forest catchments in Nandi County?
b) What are the evidences of the changes in 1(a) above? (Explain briefly)
2. In your opinion, what have been the possible drivers of the forest cover and land use change
over the years in Nandi County?
3. What are some of the cultural and indigenous practices among the local community that have
an impact on the Nandi Forests (whether positive or negative)
4. a) Are you aware of any initiatives by the state and non-state actors geared towards
conserving the Nandi Forests? (Please list them)

274
b) How effective have these initiatives in 4(a) above succeeded in sustainably managing the
Nandi Forests (Briefly Explain)
c) In your view, what do you think can be done to ensure that the Nandi Forests are
sustainably managed?
Thank You!

275
Appendix H: List of FGD participants in Chemomi Location, Nandi Hills Division
Nelson Mandela Metropolitan University
Faculty of Education

276
Appendix I: List of FGD participants in Chepkong’ony Location, Kaptumo Division
Nelson Mandela Metropolitan University
Faculty of Education

277
Appendix J: Research authorisation letter

278
Appendix K: Research clearance permit
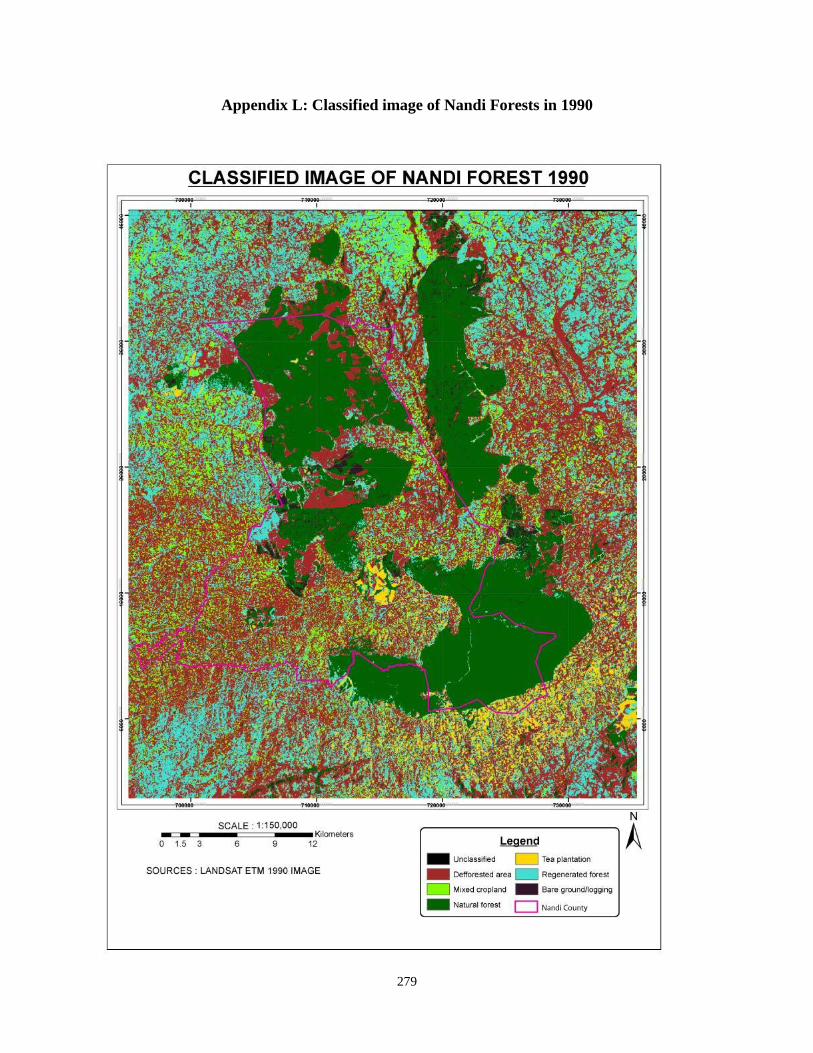
279
Appendix L: Classified image of Nandi Forests in 1990
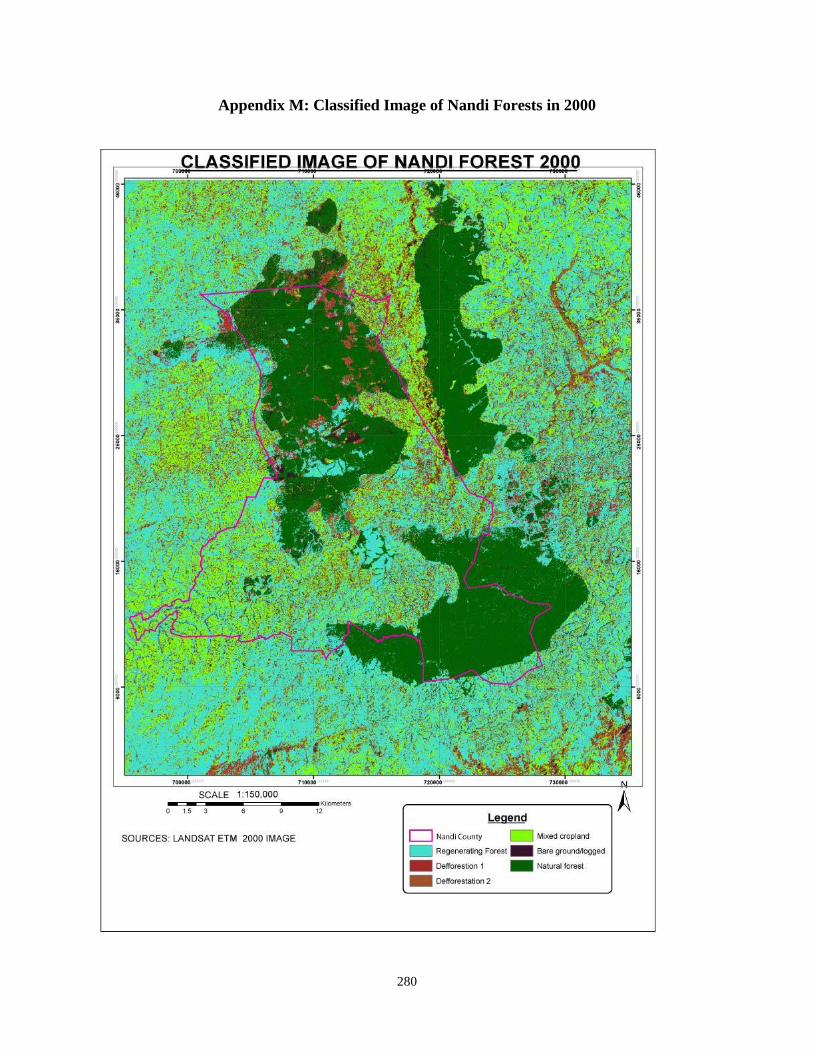
280
Appendix M: Classified Image of Nandi Forests in 2000
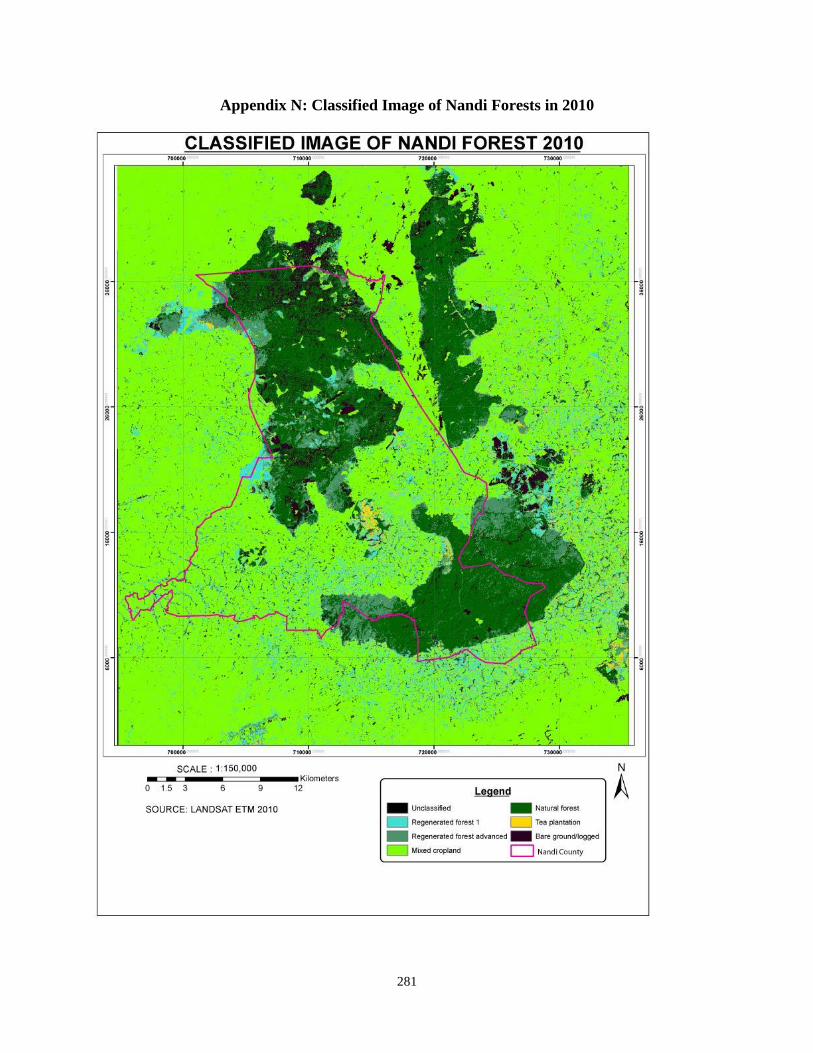
281
Appendix N: Classified Image of Nandi Forests in 2010