towards cataloguing the subcellular proteomes of eukaryotic organisms · towards cataloguing the...
TRANSCRIPT
Towards Cataloguing the Subcellular Proteomes of Eukaryotic Organisms
Chittibabu Guda Department of Genetics, Cell Biology and Anatomy, University of Nebraska Medical Center,
Omaha, Nebraska.
1 Introduction
The organization of eukaryotic cells exemplify the concept of ‘division of labor’, where each subcellular organelle or location carryout and coordinate a set of specialized functions in the global context of the cellular function. To a large extent, subcellular proteomes are genetically programmed to localize and function in a given subcellular compartment at a steady cellular state. Nevertheless, the concept of an organellar proteome is rather dynamic depending upon the spatial (tissue-specific), temporal (stage-specific) and physiological state of a cell. A recent surge in cataloging the organellar proteomes is fuelled by rapid advances in mass-spectrometry-based (MS) identification of organellar proteomes. These experimental approaches have facilitated systematic interrogation of gene function(s) at the protein level in a given tissue or in a specific perturbed state of a cell. Subcellular localization of a protein is deemed as one of the most intuitive attributes of the function of a protein because most of the cellular processes are spatially constrained to one or a few subcellular organelles. Hence, organellar proteomics is emerging as a powerful tool for the functional annotation of genomes. Several efforts have been made to catalog the complete organellar/subcellular proteomes of organisms (Yates et al., 2005, Andersen & Mann, 2006). Similarly, proteomes of specific organelles have been experimentally characterized. Some of these organelles include total nuclear (Fink et al., 2008, Takata et al., 2009) or subnuclear compartments (Warters et al., 2010, Batrakou et al., 2009), plasma membrane (Aggelis et al., 2009, Leth-Larsen et al., 2008), cell surface (Babujee et al., 2010), mitochondria (Zhang et al., 2008), microsomes (Wong & Adeli, 2009), cytoskeleton (Xu et al., 2009), endocytic organelles (de Araujo et al., 2008), Golgi (Takatalo et al., 2006), and plant organelles like chloroplasts (Joyard et al., 2010) and peroxisomes (Reumann et al., 2009). The primary goal of most of these studies is to identify the organellar proteomes at a steady cellular state. Nevertheless, studies on the spatial and temporal dynamics of organellar proteomes are on the rise owing to their applications in a wide range of biomedical fields. For instance, recent studies highlight the use of plasma membrane proteomics (Leth-Larsen et al., 2010) and the nuclear proteomics (Warters et al., 2010) for the identification of cancer biomarkers. Similarly, MS-based quantitative proteomics has been used to measure condition-specific protein trafficking and protein interactions in human brain (Li & Smit, 2008). Studies on the mitochondrial proteomes have been widely popular in evolutionary studies to trace the origin of eukaryotic species. Phylogenetic reconstruction of nuclear-encoded mitochondrial protein families revealed that subcellular relocalization is an important mechanism for the retention and gain of function of duplicated genes in animal genome evolution (Wang et al., 2009). A similar study estimates
260 Chapter 14 – Towards Cataloguing the Subcellular Proteomes of Eukaryotic Organisms
that the mitochondrial proteome expanded at least 50% since the common ancestor of human and yeast (Szklarczyk & Huynen, 2009). In a separate study, the biogenesis and function of melanosomes was investigated by characterizing the proteomes of melanosomes from pigmented and nonpigmented melanocytes (Chi et al., 2006). Studies on the ‘spatial proteomics’ and ‘comparative organellar proteomics’ are gaining popularity in a variety of research investigations. A spatial proteomics study measured the relative distribution of subcellular proteomes between cytoplasm, nucleus and nucleolus of over 2000 proteins in HCT11 cells (Boisvert et al., 2010). This study shows that at steady state, the proteome is predominantly distributed into specific subcellular locations, but perturbed conditions like DNA damage has elicited dynamic changes in protein localization. Another study on the comparative nuclear proteomics in chickpea at normal versus dehydrated conditions revealed that 147 nuclear proteins are differentially expressed that include a variety of regulatory and functional proteins (Pandey et al., 2008). Such studies provide insights into the altered metabolic networks operating in the nucleus under perturbed conditions. Computational methods have been proven invaluable in proteome-wide prediction of subcellular proteomes (King & Guda, 2007) or in complementing experimental methods to identify the function of subcellular proteomes (Fink et al., 2008). Several subcellular proteome databases have been developed that include LOCATE for mammalian proteomes (Sprenger et al., 2008), eSLDB for eukaryotic proteomes (Pierleoni et al., 2007) and Mitoproteome for exclusive nuclear-encoded mitochondrial proteins (Cotter et al., 2004). A computational method called ConLoc was used for the construction of localization-guided functional interaction network of the human proteome (Park et al., 2009). Countless prediction methods are available for subcellular localization with varying levels of coverage over different locations (Donnes & Hoglund, 2004). Existing methods for predicting subcellular localization of proteins vary significantly, from the seminal work on PSORT (Nakai & Kanehisa, 1992), which is a rule-based system derived by considering signal peptides, motifs and amino acid compositions; to the pure statistical-based methods (Chou & Elrod, 1999), which employed covariant discriminant analysis; to the machine learning and data mining algorithms, including artificial neural networks and support vector machines (SVMs) (Reinhardt & Hubbard, 1998, Park & Kanehisa, 2003). Regardless of the approach used, the majority of protein classification methods have capitalized on the sequence homology to an experimentally-known protein (i.e., a labeled protein) to predict the localization of an unknown protein (unlabeled protein). We have previously developed a genome-scale prediction method known as MITOPRED for predicting the nuclear-encoded mitochondrial proteomes of eukaryotic organisms (Guda et al., 2004), followed by another method known as pTARGET for predicting over 10 different subcellular proteomes (Guda & Subramaniam, 2005). Recently, we published a novel method called ngLOC: an n-gram-based Bayesian classifier that predicts the localization of a protein sequence over ten distinct subcellular locations with high accuracy and high coverage (King & Guda, 2007). In the current study, we used an enhanced version of ngLOC, known as ngLOC-X for proteome-wide prediction of organellar or subcellular proteomes. Here we report the estimated fractions of 14 different subcellular proteomes in eight completely sequenced eukaryotes that are spread across the evolutionary spectrum. 2 Datasets and Methods
2.1 Datasets
Training datasets of protein sequences for ngLOC method were collected from the Swiss-Prot database (Bairock et al., 2004) release 57.8, containing experimentally determined annotations on subcellular localization. We have applied the following filters to obtain high-quality data for testing and training our
C. Guda 261
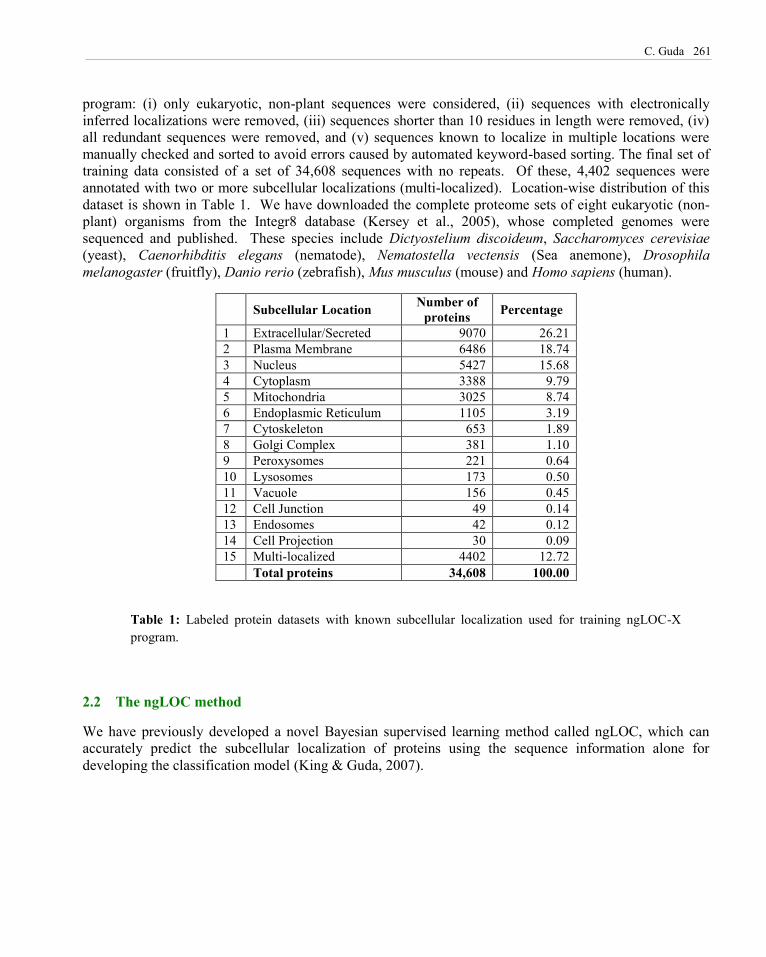
program: (i) only eukaryotic, non-plant sequences were considered, (ii) sequences with electronically inferred localizations were removed, (iii) sequences shorter than 10 residues in length were removed, (iv) all redundant sequences were removed, and (v) sequences known to localize in multiple locations were manually checked and sorted to avoid errors caused by automated keyword-based sorting. The final set of training data consisted of a set of 34,608 sequences with no repeats. Of these, 4,402 sequences were annotated with two or more subcellular localizations (multi-localized). Location-wise distribution of this dataset is shown in Table 1. We have downloaded the complete proteome sets of eight eukaryotic (non-plant) organisms from the Integr8 database (Kersey et al., 2005), whose completed genomes were sequenced and published. These species include Dictyostelium discoideum, Saccharomyces cerevisiae (yeast), Caenorhibditis elegans (nematode), Nematostella vectensis (Sea anemone), Drosophila melanogaster (fruitfly), Danio rerio (zebrafish), Mus musculus (mouse) and Homo sapiens (human).
Subcellular Location Number of proteins Percentage
1 Extracellular/Secreted 9070 26.21 2 Plasma Membrane 6486 18.74 3 Nucleus 5427 15.68 4 Cytoplasm 3388 9.79 5 Mitochondria 3025 8.74 6 Endoplasmic Reticulum 1105 3.19 7 Cytoskeleton 653 1.89 8 Golgi Complex 381 1.10 9 Peroxysomes 221 0.64 10 Lysosomes 173 0.50 11 Vacuole 156 0.45 12 Cell Junction 49 0.14 13 Endosomes 42 0.12 14 Cell Projection 30 0.09 15 Multi-localized 4402 12.72 Total proteins 34,608 100.00
Table 1: Labeled protein datasets with known subcellular localization used for training ngLOC-X program.
2.2 The ngLOC method
We have previously developed a novel Bayesian supervised learning method called ngLOC, which can accurately predict the subcellular localization of proteins using the sequence information alone for developing the classification model (King & Guda, 2007).
262 Chapter 14 – Towards Cataloguing the Subcellular Proteomes of Eukaryotic Organisms
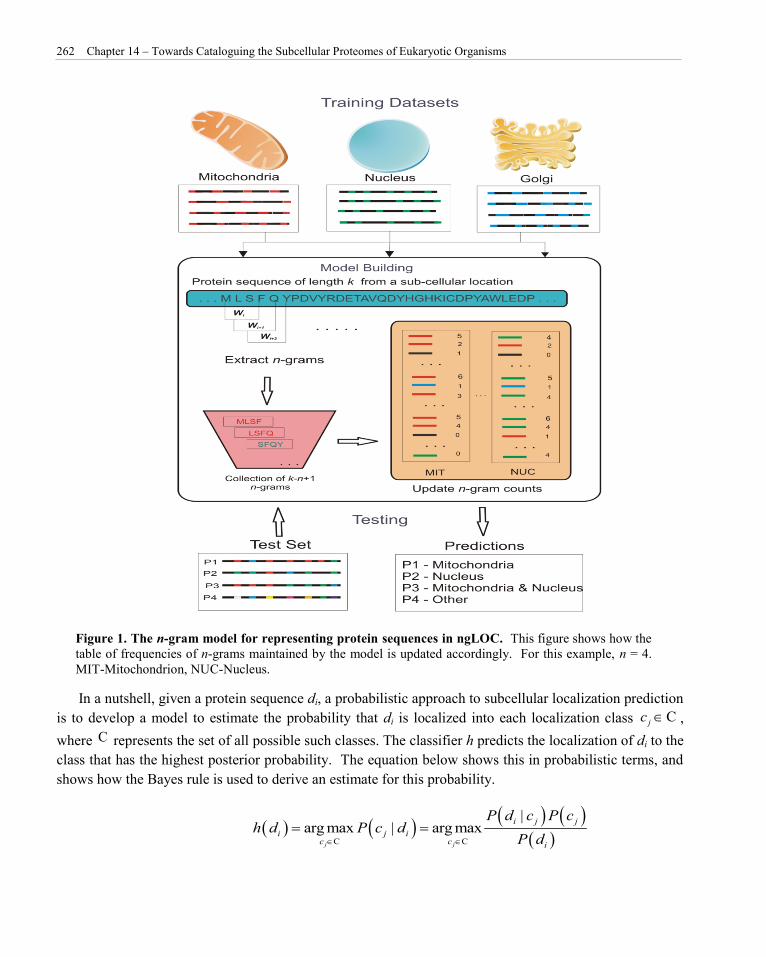
Figure 1. The n-gram model for representing protein sequences in ngLOC. This figure shows how the table of frequencies of n-grams maintained by the model is updated accordingly. For this example, n = 4. MIT-Mitochondrion, NUC-Nucleus.
In a nutshell, given a protein sequence di, a probabilistic approach to subcellular localization prediction is to develop a model to estimate the probability that di is localized into each localization class , where represents the set of all possible such classes. The classifier h predicts the localization of di to the class that has the highest posterior probability. The equation below shows this in probabilistic terms, and shows how the Bayes rule is used to derive an estimate for this probability.
C
|arg max | arg max
j j
i j ji j i
c c i
P d c P ch d P c d
P d
C C
jc C
C. Guda 263
ngLOC is an n-gram based Bayesian classifier that predicts the localization of a protein sequence over multiple classes of proteins. In the context of proteins, an n-gram is defined as a subsequence of the protein sequence of a fixed-length size of n. This model effectively shrinks the protein sequence space, thereby allowing a higher degree of redundancy between proteins of different classes that could not be achieved by considering the entire protein sequence (Figure 1). As a result, the model can effectively capture discriminatory n-grams between classes at the subsequence level. Therefore, ngLOC does not need prior knowledge of specific targeting signals, as it is likely that analogous signals (discriminatory n-grams) are inherently identified de novo and used for the localization prediction of the protein. Because of this plasticity, the ngLOC method has the ability to perform well on all types of subcellular classes, and hence is highly suitable for proteome-wide prediction of a spectrum of evolutionary species. In this study, proteomes of 14 distinct subcellular organelles were predicted using a model known as ngLOC-X. This model essentially extends our core ngLOC model by allowing the dynamic adjustment of the model parameters specific to a proteome being estimated, thus introducing a bias toward that proteome (King & Guda, 2007). This model allows us to consider the distribution of n-grams over an entire proteome by adjusting the probabilities of each n-gram in the training data to more accurately represent the distributions of n-grams in the proteome being classified.
3 Results and Discussion
3.1 Selection of methodology and datasets
The ngLOC method explores the entire protein sequence to identify discriminatory n-grams that uniquely exist or are enriched in the proteins of a specific subcellular compartment. The n-gram model is able to capture sequence homology by effectively shrinking the protein sequence space. This is likely because these n-gram peptides are ideal for mapping the secondary structure space of proteins, which are evolutionarily conserved in the proteomes of cellular organelles to maintain the functional integrity of the cell. Our proteome prediction results showed that although a single model can be used on a variety of species, better results can be had if the model is tuned for a specific species being considered (King & Guda, 2007). If a single model is being used across numerous species, it is very important to include a broad spectrum of training data across all species. Nevertheless, this is not possible due to the imbalanced nature of available labeled sequence data in the public domain. Thus, ngLOC-X, which can dynamically adjust the model parameters of the proteome being predicted, is useful for predicting the organellar proteomes of any species. In this study, the ngLOC-X method is trained to predict 14 distinct subcellular locations in the training dataset.
We have selected eight species that include four lower eukaryotes and four higher eukaryotes. The four lower eukaryotic species include an unicellular yeast (Saccharomyces cerevisiae); a slime mold (Dictyostelium discoideum), which is a primitive eukaryote that transitions from a collection of unicellular amoebae into a multicellular slug; a sea anemone (Nematostella vectensis), which is one of the simplest animals with primitive tissue grade of organization; and a nematode (Caenorhibditis elegans) which is a 1 mm long soil dwelling worm. The four higher eukaryotic species include fruitfly (Drosophila melanogaster), zebrafish (Danio rerio), mouse (Mus musculus) and human (Homo sapiens) that possess well organized tissue and organ structures. Our selection of species was influenced by the availability of completely sequenced genomes and their relative positions in the evolutionary hierarchy.
264 Chapter 14 – Towards Cataloguing the Subcellular Proteomes of Eukaryotic Organisms
3.2 Prediction of Organellar Proteomes
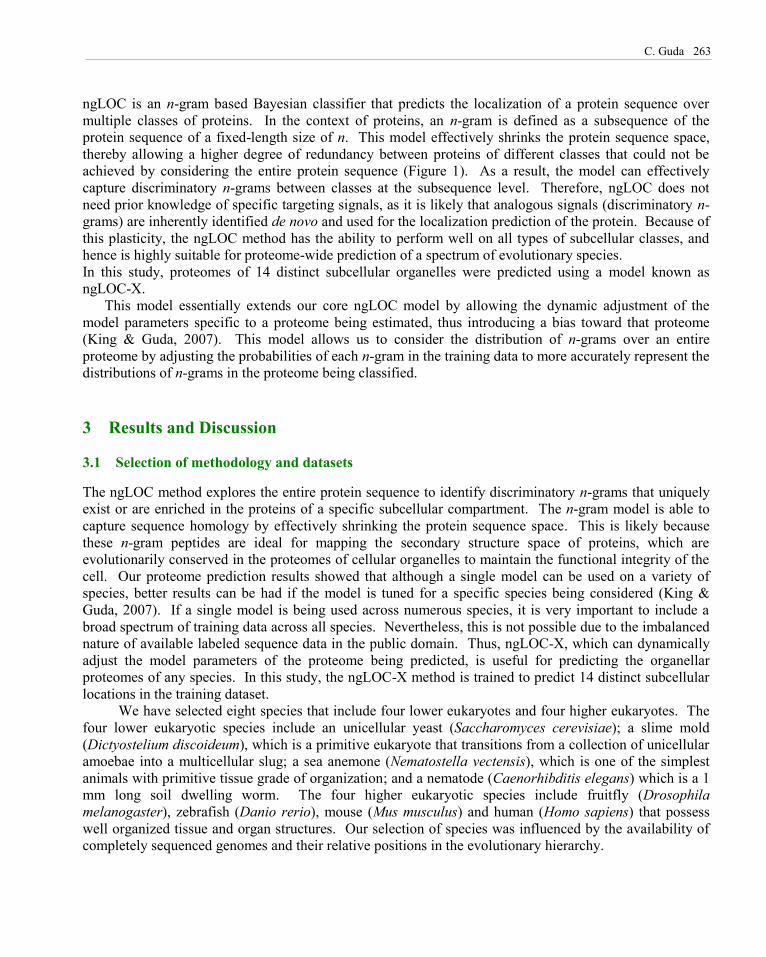
In this study, we have predicted the subcellular proteomes of 14 distinct organelles from eight eukaryotic species using our enhanced ngLOC-X program. The earlier version of this program was able to predict only 10 subcellular locations and we have added four additional locations that include: cell junction, cell projection, endosomes and vacuole. All of these new locations have very limited training data. As shown in Table 2, the relative percentage of organellar proteomes varies across species, but in a predictable manner. Note that in Table 2, the species under study were sorted from yeast to human in an increasing evolutionary complexity with respect to their cell, tissue and organ structure. Broadly, the first 4 species (Yeast, Dictyostellium, Sea anemone and C. elegans) are referred as lower eukaryotes and the latter 4 species (fluitfly, zebrafish, mouse and human) are referred as higher eukaryotes in this study.
Yeast Dicty Sea
Anemone C.
elegans Fruitfly Zebrafish Mouse Human RANGE
Proteome size 5858 12930 24430 24163 15650 21840 43905 64611
ngLOC Coverage 99.5% 96.6% 95.8% 96.0% 97.7% 98.1% 94.4% 91% 91.0 – 99.5
Cell Junction 0.05 0.20 0.95 1.21 0.63 1.04 1.46 1.80 0.05 – 1.80
Cell Projection 0.07 0.08 0.30 0.29 0.16 0.22 0.33 0.43 0.07 – 0.43
Cytoplasm 23.46 15.23 16.69 16.27 16.11 18.82 17.85 18.16 15.23 – 23.46
Cytoskeleton 1.67 1.60 3.31 2.98 2.67 3.33 4.04 4.52 1.60 – 4.52
Endoplasmic Reticulum 3.99 2.16 3.11 3.47 2.73 3.42 3.44 3.71 2.16 – 3.99
Endosomes 0.57 0.18 0.35 0.36 0.24 0.36 0.49 0.64 0.18 – 0.64
Extracellular/Secreted 6.73 11.46 17.60 12.46 12.07 11.28 11.69 11.52 6.73 – 17.60
Golgi Complex 1.74 0.80 1.71 1.57 1.29 1.94 1.99 2.37 0.80 – 2.37
Lysosomes 0.02 0.50 0.78 0.50 0.51 0.74 0.66 0.82 0.02 – 0.82
Mitochondria 10.39 4.48 5.30 5.49 5.00 4.75 4.67 5.21 4.48 – 10.39
Nucleus 36.52 47.89 27.11 33.09 39.51 33.97 30.58 29.52 27.11 – 47.89
Peroxysomes 0.69 0.35 0.64 0.57 0.35 0.51 0.55 0.65 0.35 – 0.69
Plasma Membrane 12.14 14.81 21.73 21.24 18.52 19.41 22.01 20.28 12.14 – 22.01
Vacuole 1.98 0.25 0.42 0.50 0.22 0.21 0.23 0.36 0.21 – 1.98
*Multi-Localized (%) 32.9 32.9 25.2 19.8 26.6 24.9 18.2 17.4 17.4 – 32.9 *The multi-localized fraction includes proteins localized to two or more locations. The original fourteen fractions add up to 100% and the multi-localized fraction was calculated separately with respect to the total proteome size.
Table 2: Predicted proteome percentages of fourteen subcellular organelles from eight eukaryotic organisms.
Comparison of organellar proteomes across species reveals that yeast proteome contains 5 of the largest and 6 of the smallest proteomes out of 14 organellar proteomes. The largest proteomes include cytoplasmic (23.46%), mitochondrial (10.39%), endoplasmic reticulum (ER), peroxysomal and vacuolar; and the smallest ones include cell junction, cell projection, cytoskeletal, lysosomal, plasma membrane and extracellular or secreted proteomes. Interestingly, Dictyostelium contains 7 of the smallest proteomes in contrast to its largest nuclear proteome (47.89%). On the other end, human and mouse proteomes have the distinction of containing 7 of the largest organellar proteomes associated with cellular structure (cell junction, cell projection, cytoskeletal) or with endocytic membrane transport pathway (plasma membrane,
C. Guda 265
endosomal, Golgi and lysosomal). In general, the organellar proteomes associated with cell structure have increased in size considerably in higher eukaryotes owing to the complexity and variety of tissue and organ structures developed in these species. Similarly, organellar proteomes associated with the endocytic transport system have also increased considerably in higher eukaryotes, presumably due to the increased necessity of inter and intra-cellular transport mechanisms. It was reported that multi-cellular taxa have developed extensive trafficking machinery through the expansion of multiple modes of endocytosis, tissue- and lineage-specific transport mechanisms (Dacks & Field, 2007). With the exception of peroxysomal and vacuolar proteomes, the lower eukaryotes have the most number of largest prominent organellar proteomes (cytoplasm, nucleus, mitochondria and ER) while the higher eukaryotes have the most number of largest tiny organellar proteomes (Table 2). In other words, the fractions of tiny organellar proteomes have gradually increased as a function of evolution that requires functional diversification of gene families in newer species. Our results strongly support a recently proposed notion that protein subcellular neolocalization (localization to new subcellular locations) is a key event for functional diversification of duplicated genes (Marques et al., 2008). We also predicted the multi-localized proteome fractions using ngLOC-X program, which range from 17.4% to 32.9%. Our score threshold for considering multi-localized sequences is rather high and we expect that these numbers are on the lower end. Our results show that the multi-localized fractions are higher in lower eukaryotes compared to the higher species and the reason for this pattern is unknown. The relative proteome fractions for some organelles and for the multi-localized fractions reported in our earlier work (King & Guda, 2007) are higher from those reported here, because in the earlier work the multi-localized proteome was calculated as a separate class and was part of the total 100%, while here the multi-localized fractions include proteins that were already counted once in one of the original fourteen classes.
3.3 Evolutionary implications of organellar proteomes
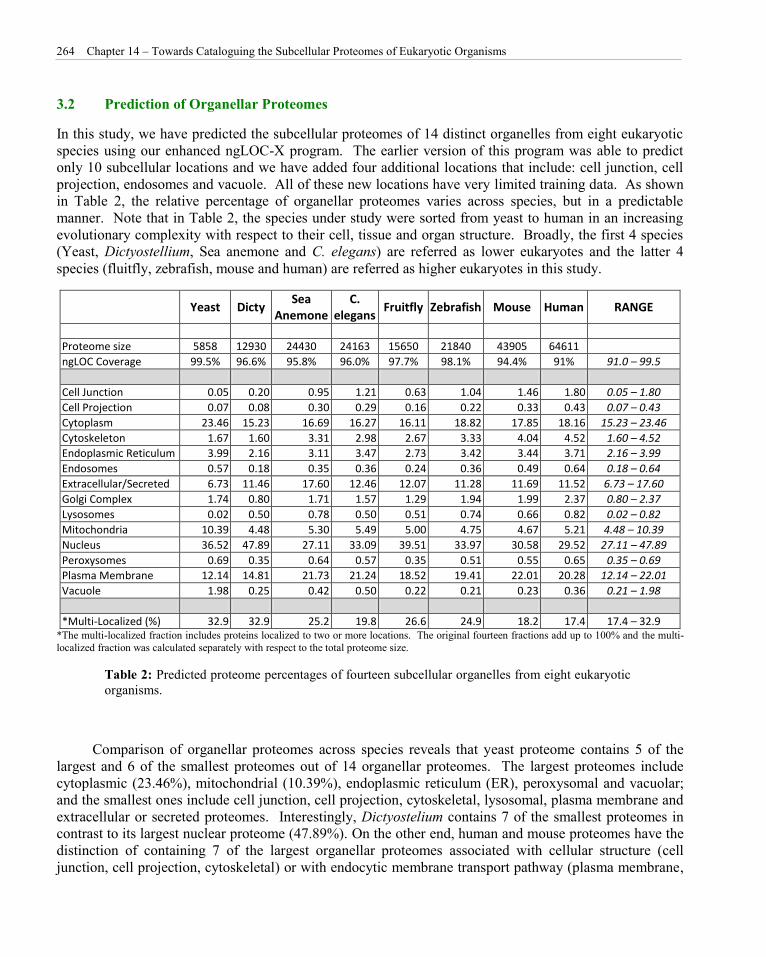
Estimation of various subcellular proteome fractions from a wide variety of species has provided us insights into the evolutionary implications of organellar proteomes. We have divided 14 distinct subcellular classes into three groups based on their proteome size. The first group contains larger organellar proteomes that includes cytoplasm, extracellular or secreted, mitochondria, nucleus and plasma membrane. Together, this group constitute over 88-94% of the cellular proteomes in different species (Figure 2). The nuclear proteome showed a lot of size variation across species with the highest recorded fraction in Dictyostellium (48%). The cytoplasmic and mitochondrial fractions were the highest in yeast, but their relative proteome size was reduced and stabilized since the dawn of multicellular organisms. On the other hand, the proteomes of extracellular/secreted and the plasma membrane started off smaller in yeast but got larger in higher organisms, which is likely due to the need for better cell to cell communication within and across different cell and tissue types.
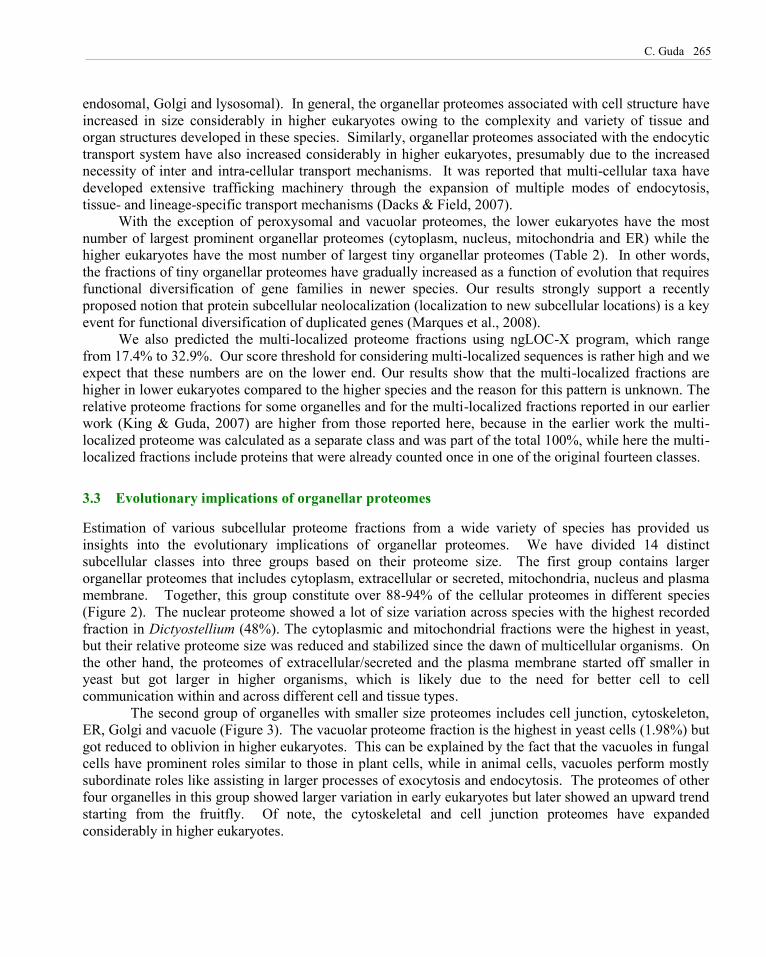
The second group of organelles with smaller size proteomes includes cell junction, cytoskeleton, ER, Golgi and vacuole (Figure 3). The vacuolar proteome fraction is the highest in yeast cells (1.98%) but got reduced to oblivion in higher eukaryotes. This can be explained by the fact that the vacuoles in fungal cells have prominent roles similar to those in plant cells, while in animal cells, vacuoles perform mostly subordinate roles like assisting in larger processes of exocytosis and endocytosis. The proteomes of other four organelles in this group showed larger variation in early eukaryotes but later showed an upward trend starting from the fruitfly. Of note, the cytoskeletal and cell junction proteomes have expanded considerably in higher eukaryotes.
266 Chapter 14 – Towards Cataloguing the Subcellular Proteomes of Eukaryotic Organisms
Figure 2: The proteome fractions of five major subcellular organelles across eight species.
Figure 3: The proteome fractions of five smaller subcellular organelles across eight species.
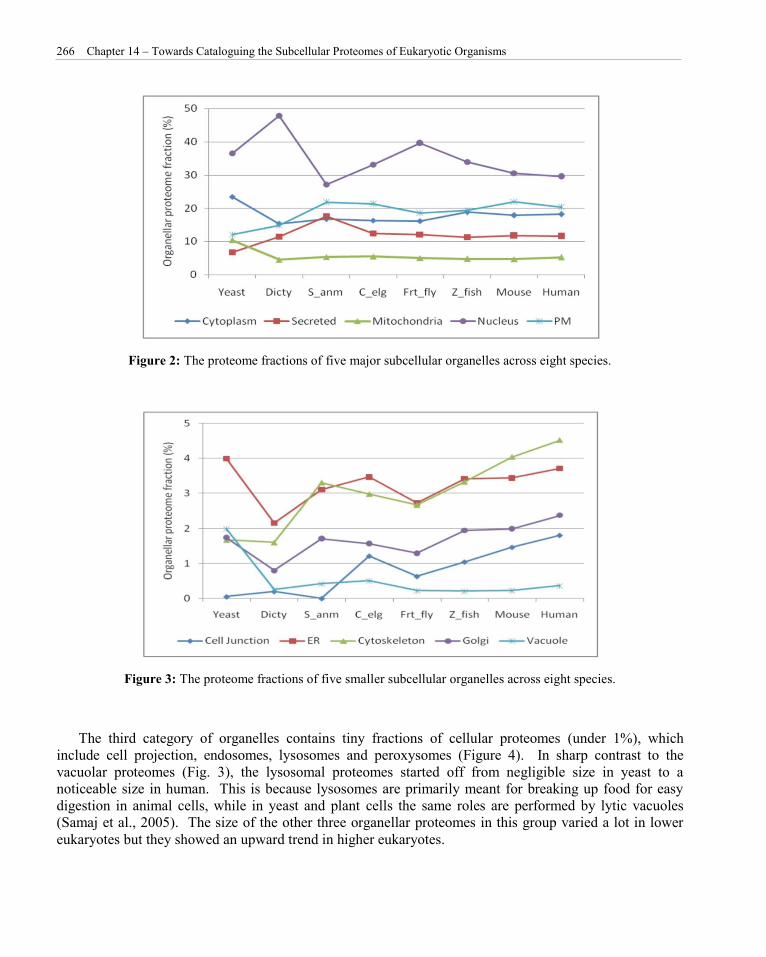
The third category of organelles contains tiny fractions of cellular proteomes (under 1%), which include cell projection, endosomes, lysosomes and peroxysomes (Figure 4). In sharp contrast to the vacuolar proteomes (Fig. 3), the lysosomal proteomes started off from negligible size in yeast to a noticeable size in human. This is because lysosomes are primarily meant for breaking up food for easy digestion in animal cells, while in yeast and plant cells the same roles are performed by lytic vacuoles (Samaj et al., 2005). The size of the other three organellar proteomes in this group varied a lot in lower eukaryotes but they showed an upward trend in higher eukaryotes.
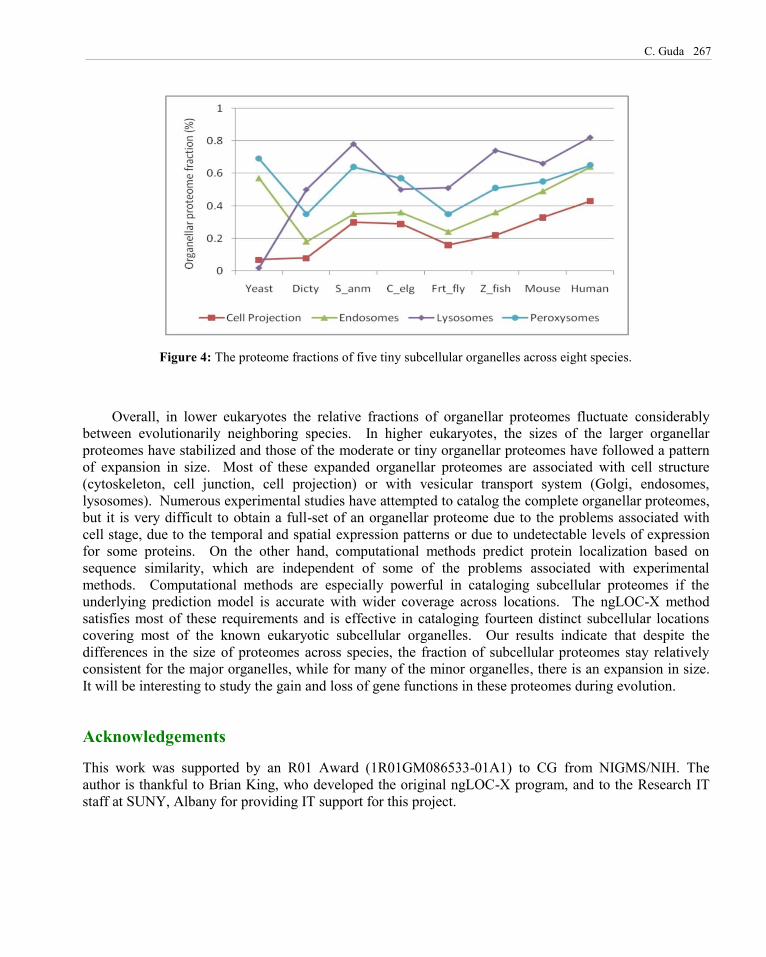
C. Guda 267
Figure 4: The proteome fractions of five tiny subcellular organelles across eight species.
Overall, in lower eukaryotes the relative fractions of organellar proteomes fluctuate considerably between evolutionarily neighboring species. In higher eukaryotes, the sizes of the larger organellar proteomes have stabilized and those of the moderate or tiny organellar proteomes have followed a pattern of expansion in size. Most of these expanded organellar proteomes are associated with cell structure (cytoskeleton, cell junction, cell projection) or with vesicular transport system (Golgi, endosomes, lysosomes). Numerous experimental studies have attempted to catalog the complete organellar proteomes, but it is very difficult to obtain a full-set of an organellar proteome due to the problems associated with cell stage, due to the temporal and spatial expression patterns or due to undetectable levels of expression for some proteins. On the other hand, computational methods predict protein localization based on sequence similarity, which are independent of some of the problems associated with experimental methods. Computational methods are especially powerful in cataloging subcellular proteomes if the underlying prediction model is accurate with wider coverage across locations. The ngLOC-X method satisfies most of these requirements and is effective in cataloging fourteen distinct subcellular locations covering most of the known eukaryotic subcellular organelles. Our results indicate that despite the differences in the size of proteomes across species, the fraction of subcellular proteomes stay relatively consistent for the major organelles, while for many of the minor organelles, there is an expansion in size. It will be interesting to study the gain and loss of gene functions in these proteomes during evolution.
Acknowledgements
This work was supported by an R01 Award (1R01GM086533-01A1) to CG from NIGMS/NIH. The author is thankful to Brian King, who developed the original ngLOC-X program, and to the Research IT staff at SUNY, Albany for providing IT support for this project.
268 Chapter 14 – Towards Cataloguing the Subcellular Proteomes of Eukaryotic Organisms
References
Aggelis, V., Craven, R., Peng, J., Harnden, P., Cairns, D., Maher, E., Tonge, R., Selby, P., & Banks, R. (2009) Proteomic identification of differentially expressed plasma membrane proteins in renal cell carcinoma by stable isotope labeling of a von Hippel-Lindau transfectant cell line model. Proteomics, 9, 2118-2130.
Andersen, J. S., & Mann, M. (2006). Organellar proteomics: turning inventories into insights. EMBO reports, 7, 874-879.
Babujee, L., Wurtz, V., Ma, C., Lueder, F., Soni, P., van Dorsselaer, A., & Reumann, S. (2010). The proteome map of spinach leaf peroxisomes indicates partial compartmentalization of phylloquinone (vitamin K1) biosynthesis in plant peroxisomes. Journal of Experimental Botany, 61, 1441-1453.
Bairoch, A., Boeckmann, B., Ferro, S., & Gasteiger, E. (2004). Swiss-Prot: Juggling between evolution and stability. Briefings in Bioinformatics, 5, 39-55.
Batrakou, D. G., Kerr, A. R., & Schirmer, E. C. (2009). Comparative proteomic analyses of the nuclear envelope and pore complex suggests a wide range of heretofore unexpected functions. Journal of Proteomics, 15, 72, 56-70.
Boisvert, F. M., Lam, Y. W., Lamont, D., Lamond, A. I. (2010). A quantitative proteomics analysis of subcellular proteome localization and changes induced by DNA damage. Molecular & Cellular Proteomics, 9, 457-470.
Chi, A., Valencia, J. C., Hu, Z. Z., Watabe, H., Yamaguchi, H., Mangini, N. J., Huang, H., Canfield, V. A., Cheng, K. C., Yang, F., Abe, R., Yamagishi, S., Shabanowitz, J., Hearing, V. J., Wu, C., Appella, E., & Hunt, D. F. (2006). Proteomic and bioinformatic characterization of the biogenesis and function of melanosomes. Journal of Proteome Research, 5, 3135-3144.
Chou, K. C., & Elrod, D. W. (1999). Protein subcellular location prediction. Protein Engineering, 12, 107-118.
Dacks, J. B., & Field, M.C. (2007). Evolution of the eukaryotic membrane-trafficking system: origin, tempo and mode. Journal of Cell Science, 120, 2977-2985.
De Araùjo, M. E., Huber, L. A., & Stasyk, T. (2008). Isolation of endocytic organelles by density gradient centrifugation. Methods in Molecular Biology, 424, 317-331.
Dönnes, P., & Höglund, A. (2004). Predicting protein subcellular localization: past, present, and future. Genomics Proteomics and Bioinformatics, 2, 209-215.
Fink, J. L., Karunaratne, S., Mittal, A., Gardiner, D. M., Hamilton, N., Mahony, D., Kai, C., Suzuki, H., Hayashizaki, Y., & Teasdale. R. D. (2008). Towards defining the nuclear proteome. Genome Biology, 9, R15.
Guda, C., & Subramaniam, S. (2005) pTARGET: a new method for predicting protein subcellular localization in eukaryotes. Bioinformatics, 21, 3963-3969.
Guda, C., Fahy, E., & Subramaniam, S. (2004) MITOPRED: a genome-scale method for prediction of nucleus-encoded mitochondrial proteins. Bioinformatics, 20, 1785-1794.
Joyard, J., Ferro, M., Masselon, C., Seigneurin-Berny, D., Salvi, D., Garin, J., & Rolland, N. (2010). Chloroplast proteomics highlights the subcellular compartmentation of lipid metabolism. Progress in Lipid Research, 49, 128-158.
Kersey, P., Bower, L., Morris, L., Horne, A., Petryszak, R., Kanz, C., Kanapin, A., Das, U., Michoud, K., Phan, I., Gattiker, A., Kulikova, T., Faruque, N., Duggan, K., McLaren, P., Reimholz, B., Duret, L., Penel, S., Reuter, I., & Apweiler, R. (2005). Integr8 and Genome Reviews: integrated views of complete genomes and proteomes. Nucleic Acids Research 33, D297-D302.
King, B. R., & Guda, C. (2007). ngLOC: an n-gram-based Bayesian method for estimating the subcellular proteomes of eukaryotes. Genome Biology, 8, R68.
C. Guda 269
Leth-Larsen, R., Lund, R., Hansen, H. V., Laenkholm, A. V., Tarin, D., Jensen, O. N., & Ditzel, H. J. (2009) Metastasis-related plasma membrane proteins of human breast cancer cells identified by comparative quantitative mass spectrometry. Mol Cell Proteomics, 8, 1436-1449.
Leth-Larsen, R., Lund, R. R., & Ditzel, H. J. (2010). Plasma membrane proteomics and its application in clinical cancer biomarker discovery. Molecular and Cellular Proteomics, (Epub ahead of print).
Li, K. W., & Smite, A. B. (2010). Subcellular proteomics in neuroscience. Frontiers in Bioscience, 13, 4416-4425.
Marques, A. C., Vinckenbosch, N., Brawand, D., & Kaessmann, H. (2008). Functional diversification of duplicate genes through subcellular adaptation of encoded proteins. Genome Biology. 9, R54.
Nakai, K., & Kanehisa, M. (1992). A knowledge base for predicting protein localization sites in eukaryotic cells. Genomics, 14, 897-911.
Pandey, A., Chakraborty, S., Datta, A., & Chakraborty, N. (2008). Proteomics approach to identify dehydration responsive nuclear proteins from chickpea (Cicer arietinum L.). Molecular & Cellular Proteomics, 7, 88-107.
Park, K. J., Kanehisa, M. (2003) Prediction of protein subcellular locations by support vector machines using compositions of amino acids and amino acid pairs. Bioinformatics, 19, 1656-1663.
Reinhardt, A., & Hubbard, T. (1998). Using neural networks for prediction of the subcellular location of proteins. Nucleic Acids Research, 20, 2230-2236.
Reumann, S., Quan, S., Aung, K., Yang, P., Manandhar-Shrestha, K., Holbrook, D., Linka, N., Switzenberg, R., Wilkerson, C. G., Weber, A. P., Olsen, L. J., & Hu, J. (2009). In-depth proteome analysis of Arabidopsis leaf peroxisomes combined with in vivo subcellular targeting verification indicates novel metabolic and regulatory functions of peroxisomes. Plant Physiology, 150, 125-143.
Samaj, J., Read, N. D., Volkmann, D., Menzel, D., & Baluska, F. (2005). The endocytic network in plants. Trends in Cell Biology,15, 425–433.
Szklarczyk, R., & Huynen, M. A. (2009). Expansion of the human mitochondrial proteome by intra- and inter-compartmental protein duplication. Genome Biology, 10, R135.
Takata, H., Nishijima, H., Ogura, S., Sakaguchi, T., Bubulya, P. A., Mochizuki, T., & Shibahara, K. (2010). Proteome analysis of human nuclear insoluble fractions. Genes Cells, 14, 975-990.
Takatalo, M. S., Kouvonen, P., Corthals, G., Nyman, T. A., & Rönnholm, R. H. (2006). Identification of new Golgi complex specific proteins by direct organelle proteomic analysis. Proteomics, 6, 3502-3508.
Wang, X., Huang, Y., Lavrov, D. V., & Gu, X. (2009). Comparative study of human mitochondrial proteome reveals extensive protein subcellular relocalization after gene duplications. BMC Evolutionary Biology, 9, 275.
Warters, R. L., Cassidy, P. B., Sunseri, J. A., Parsawar, K., Zhuplatov, S. B., Kramer, G. F., & Leachman, S. A. (2010). The nuclear matrix shell proteome of human epidermis. Journal of Dermatological Science, 58, 113-122.
Wong, D. M., Adeli, K. (2009). Microsomal proteomics. Methods in Molecular Biology, 519, 73-89.
Xu, P., Crawford, M., Way, M., Godovac-Zimmermann, J., Segal, A. W., & Radulovic, M. (2009) Subproteome analysis of the neutrophil cytoskeleton. Proteomics, 9, 2037-2049.
Yates, J. R., Gilchrist, A., Howell, K. E., & Bergeron, J. J. (2005). Proteomics of organelles and large cellular structures. Nature Reviews in Molecular Cell Biology, 6, 702-714.
Zhang, J., Li, X., Mueller, M., Wang, Y., Zong, C., Deng, N., Vondriska, T. M., Liem, D. A., Yang, J. I., Korge, P., Honda, H., Weiss, J. N., Apweiler, R., & Ping, P. (2008). Systematic characterization of the murine mitochondrial proteome using functionally validated cardiac mitochondria. Proteomics, 8, 1564-1575.

270 Chapter 14 – Towards Cataloguing the Subcellular Proteomes of Eukaryotic Organisms