toward a global ocean acidification observing network€¦ · toward a global ocean acidification...
TRANSCRIPT

Toward a Global Ocean Acidification Observing Network
Consensus of an international workshop held at the University of Washington Seattle, WA, USA 26-28 June 2012
Sponsored by: NOAA, IOCCP, GOOS, IOOS, and UW JA Newton, RA Feely, EB Jewett, D Gledhill
1. Background and Introduction
In order to coordinate international efforts to document the status and progress of ocean acidification in open-ocean and coastal environments, and to understand its drivers and impacts on marine ecosystems, it will be necessary to develop a coordinated multidisciplinary multinational approach for observations and modeling that will be fundamental to establishing a successful monitoring and research strategy for ocean acidification. This will facilitate the development of our capability to assess present-day and predict future biogeochemistry, and climate change feedbacks and the responses of marine biota, ecosystem processes, and socioeconomic consequences. Required research elements include regional and global networks of observations collected in concert with process studies, manipulative experiments, field studies, and modeling. Global and regional observation networks will provide the necessary data required to firmly establish impacts attributable to ocean acidification1. With support from the NOAA Ocean Acidification Program, the International Ocean Carbon Coordination Project (IOCCP), the Global Ocean Observing System, including the U.S. Integrated Ocean Observing System (IOOS), and the University of Washington, an international workshop was held in Seattle, Washington, USA during July 26-28, 2012 to bring focus on and define a global observing network for both carbon and ocean acidification that addresses the requirements of nations affected by this emerging environmental problem in the context of an overall framework for ocean observing responding to societal needs. This workshop report provides the strategy for the observing network for review and vetting and hopeful support by the member countries. The focus of this workshop was to design a Global Ocean Acidification (OA) Observing Network that will monitor biogeochemical changes at sufficient detail to discern trends in acidification and determine relative attribution the primary physical-chemical processes governing such changes. Furthermore, this observing network should also include a means of tracking changes in large-scale biological processes (changes in productivity, nutrient distributions, etc.) which can be
1 The International Panel on Climate Change (IPCC) Workshop on Impacts of Ocean
Acidification on Marine Biology and Ecosystems (2011, p. 37) defines Ocean Acidification (OA)
as “a reduction in the pH of the ocean over an extended period, typically decades or longer,
which is caused primarily by uptake of carbon dioxide from the atmosphere, but can also be
caused by other chemical additions or subtractions from the ocean.”

impacted by ocean acidification. The existing global oceanic carbon observatory network of repeat hydrographic surveys, time-series stations, floats and glider observations, and volunteer observing ships in the Atlantic, Pacific, Arctic, Southern, and Indian Oceans offers a strong foundation of observations of the carbonate chemistry needed to understand chemical changes resulting from ocean acidification. Assuring the continuity and quality of these foundational observations affords us an opportunity to build from them a more comprehensive network capable of meeting the multidisciplinary observational requirements of an ocean acidification network. A more fully developed global ocean acidification spatial and time-series network will require the adoption of advanced new technologies that would reliably provide the community with the requisite biogeochemical measures necessary to track ocean acidification synoptically (e.g. with new carbonate chemistry sensors developed and adapted for moorings, volunteer observing ships, floats and gliders). Such technologies would provide critically important information on the changing conditions in both open-ocean and coastal environments that are presently under-sampled.
A fully realized Network would have the capability to track changes in CaCO3 saturation states, biological production rates and species functional groups. New technologies for monitoring dissolved inorganic carbon and total alkalinity would also be beneficial for tracking changes in the marine inorganic carbon system, including inputs of non-CO2 sources of acidification. Measurements of net primary production and community metabolism, either directly or from nutrient or oxygen inventories, along with an understanding of hydrodynamics are important in order to identify biological impacts and adaptations to ocean acidification, especially in coastal zones where secular changes in ocean acidification are augmented by local processes. These additional measurements are needed to predict the rates and magnitude of ocean acidification and better discern ecosystem responses.
Establishing a Global OA Observing Network will require a coordinated and integrated international research effort that is closely linked with other international carbon research programs. Where appropriate, leveraging existing infrastructure and monitoring programs (both carbon and ecological) will improve efficiency although it is envisioned that new infrastructure will also be necessary given that considerable observational gaps remain. We must both assure that the existing infrastructure is adequately sustained and fully capable, and identify and prioritize new time series stations, repeat surveys and underway measurements that are urgently needed in under sampled open-ocean and coastal regions. The global ocean acidification observing network must be developed as a collaborative international enterprise whereby international coordination is sought when advancing ocean acidification infrastructure development.
Finally, the role of the IOCCP will be to track the international network in terms of both the infrastructure deployment and the integration of the data collected across platforms and countries. This will also be supported by the Ocean Acidification International Coordination Centre (OA-ICC).

2. Workshop Goals
The goals of this international workshop were to:
1. Provide the rationale and design of the components and locations of a Global OA Observing Network that includes repeat hydrographic surveys, underway measurements on volunteer observing ships, moorings, floats and gliders and leverages existing networks and programs wherever possible;
2. Identify a minimum suite of measurement parameters and performance metrics, with guidance on precision and accuracy requirements, for each major component of the observing network;
3. Develop a strategy for data quality assurance and data distribution; and
4. Discuss requirements for international program integration and governance. 3. Workshop Participation and Community Input
Workshop participants totaled 62 scientists from 23 countries. Participant expertise included carbon chemists, oceanographers, biologists, data managers, and numerical modelers. Countries represented included: USA, Australia, Sweden, Venezuela, Bermuda, Taiwan, China, Canada, New Zealand, UK, Mexico, Norway, Chile, Korea, China, South Africa, Japan, Iceland, India, Israel, Italy, Germany, and France. See Appendix 1 for participant list and Appendix 2 for workshop agenda. Prior to the workshop, participants and their colleagues were requested to identify existing (green) and planned (red) OA observing assets, as shown in Figure 1.
4. Paths to the Present Workshop
The international OA governance leading to this workshop is shown in Figure 2. The Surface Ocean Lower Atmosphere Study/Integrated Marine Biogeochemistry and Ecosystem Research (SOLAS/IMBER) Working Group on Ocean Acidification was established in 2009. The subcommittee produced the initial plans and proposal for the Ocean Acidification International Coordination Centre (OA-ICC) – which was announced at the Rio +20 United Nations Conference on Sustainable Development held in Rio de Janeiro, Brazil, in June 2012. The OA-ICC began its work in early 2013. In addition, a number of white papers on observing requirements for ocean acidification were published as part of the OceanObs’09 Conference. These white papers (Feely et al., 2010; Iglesias-Rodriguez et al. 2010) provide a solid structural framework for the Global Ocean Acidification Observing Network (GOA-ON) described in this document. The IOCCP developed a cooperative agreement with GOOS and released the Framework for Ocean Observing (Lindstrom et al., 2013). IOCCP, GOOS and the OA-ICC will be important coordinating bodies for the international network – how they will work together is still unfolding.

Figure 1. Map of current and planned Global Ocean Acidification Observing Network components (last updated 2013) (http://www.pmel.noaa.gov/co2/story/International+OA+Observing+Network ).
Figure 2. Schematic diagram of the international ocean acidification (OA) governance that led to this workshop.

5. Global OA Observing Network Justification and Vision
With strong consensus, workshop participants identified the need for an integrated global ocean acidification network capable of delivering physical, chemical, and biological observations.
a. Why is a Global OA Observing Network needed?
We need information and data products that can inform policy and the public with respect to OA and implications for the overall ecosystem health (status) of the planet.
Processes are occurring at global scales; therefore, we need to go beyond local measurements and observe on global scales in order to understand OA and its drivers correctly.
There exist insufficient data and understanding to develop robust predictive skills regarding OA and impacts. While we need enhanced coverage at finer-scales, successful international coordination of these observations will allow for nesting of these local observations within a global context.
b. What does the Global OA Observing Network need to provide?
Goal 1 Provide an understanding of global OA conditions: o Determine status of and spatial and temporal patterns in carbon
chemistry, assessing the generality of response to OA; o Document and evaluate variation in carbon chemistry to infer
mechanisms (including biological mechanisms) driving OA conditions; o Quantify rates of change, trends, and identify areas of heightened
vulnerability or resilience. Goal 2 Provide an understanding of ecosystem response to OA:
o Track biological responses in concert with physical/chemical changes; o Quantify rates of change and identify locations as well as species of
heighted vulnerability or resilience.
Goal 3 Provide data necessary to optimize modeling for OA: o Provide spatially and temporally resolved biogeochemical data for use in
parameterizing and validating models including initial and boundary conditions;
o Guide Goals 1 and 2 through improved model outputs in an iterative fashion.
6. System Design of the Global OA Observing Network: Conceptual
Conceptually, the envisioned Global OA Observing Network will address each of the three goals identified through the use of a nested design encompassing observations from open ocean and coastal waters (to include estuaries and coral reefs) using a variety of integrated and interdisciplinary observing strategies appropriate to the environment of interest.

a. Global OA Observing Network Nested System Design
• To address the goals, a nested design is proposed for measurements at stations:
o Level 1: critical minimum measurements (Operational measurements applied to document OA dynamics).
o Level 2: an enhanced suite of measurements that further promote understanding of the primary mechanisms (including biologically mediated mechanisms) governing control of ocean acidification dynamics (Operational measurements applied towards understanding OA dynamics).
o Level 3: Opportunistic or experimental measurements that may offer enhanced insights into OA dynamics and impacts (non-operational measurements under development that may be later adapted to Level 2).
• The system design of the Network is further nested because observing investments designed to address Goal 2 should be implemented at a subset of the Goal 1 stations.
b. Global OA Observing Network Design Attributes
• The Global OA Observing Network will be comprised of observing assets within multiple ecosystem domains, specifically, the open ocean, coasts (including estuaries), and coral reef waters.
• The Network will utilize a variety of observing platforms, classified here into three categories that share similar capabilities and QA/QC considerations. These are: 1) shipboard cruises including survey cruises, the Voluntary Observing Ship (VOS) program and Ship of Opportunity Program (SOOP); 2) fixed platforms, including moorings and piers; and 3) mobile platforms, including gliders (both profiling and wave) and floats (possibly others, such as animals).
• Existing platforms will be leveraged wherever possible and appropriate.
• The Network shall be interdisciplinary in approach, including these fundamental disciplines: carbon chemistry, oceanography, biogeochemistry, and biology. These disciplines will be much more effective if integrated, from a system design standpoint, a priori. For instance, while typically ocean chemistry is measured to assess effects on biology, an equally critical question to assess is “How is biology affecting ocean chemistry?” and the design of the Network must reflect such needs.
7. System Design of the Global OA Observing Network: Data Quality A major data quality conceptual tenant essential to consider within the Global OA Observing Network design is the recognition that acceptable levels of analytical uncertainty may differ depending on which primary Goal is being addressed by a
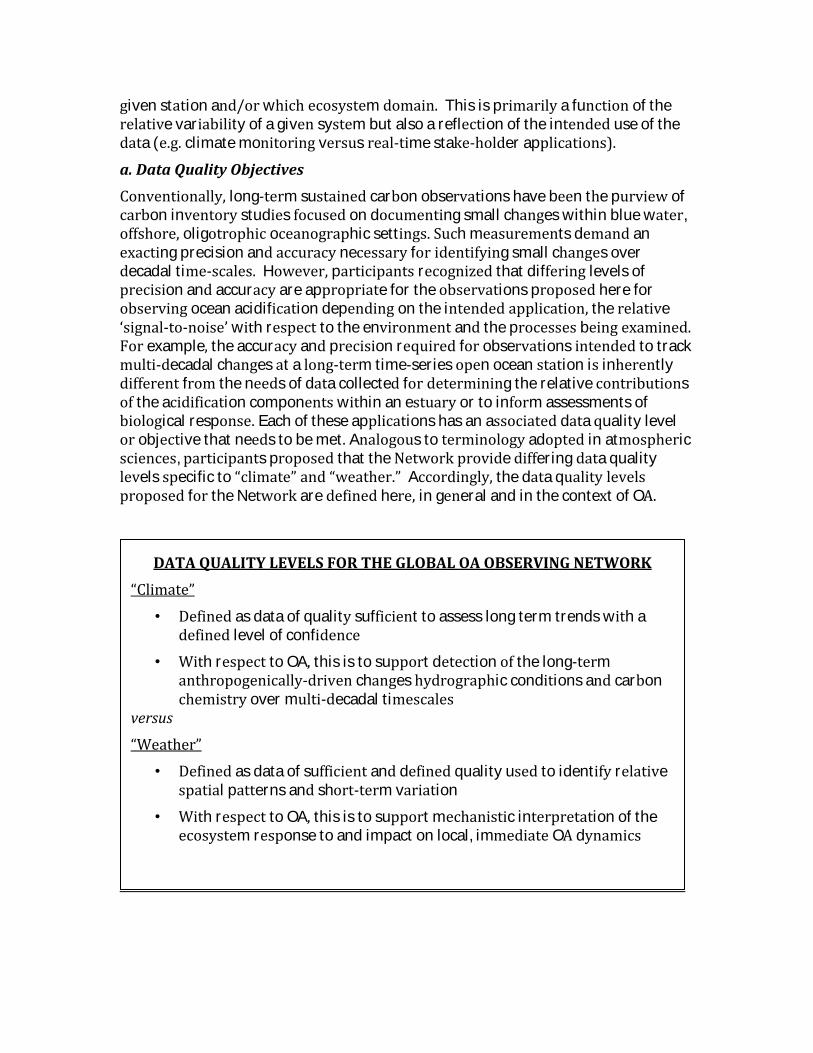
given station and/or which ecosystem domain. This is primarily a function of the relative variability of a given system but also a reflection of the intended use of the data (e.g. climate monitoring versus real-time stake-holder applications).
a. Data Quality Objectives
Conventionally, long-term sustained carbon observations have been the purview of carbon inventory studies focused on documenting small changes within blue water, offshore, oligotrophic oceanographic settings. Such measurements demand an exacting precision and accuracy necessary for identifying small changes over decadal time-scales. However, participants recognized that differing levels of precision and accuracy are appropriate for the observations proposed here for observing ocean acidification depending on the intended application, the relative ‘signal-to-noise’ with respect to the environment and the processes being examined. For example, the accuracy and precision required for observations intended to track multi-decadal changes at a long-term time-series open ocean station is inherently different from the needs of data collected for determining the relative contributions of the acidification components within an estuary or to inform assessments of biological response. Each of these applications has an associated data quality level or objective that needs to be met. Analogous to terminology adopted in atmospheric sciences, participants proposed that the Network provide differing data quality levels specific to “climate” and “weather.” Accordingly, the data quality levels proposed for the Network are defined here, in general and in the context of OA.
DATA QUALITY LEVELS FOR THE GLOBAL OA OBSERVING NETWORK
“Climate”
• Defined as data of quality sufficient to assess long term trends with a defined level of confidence
• With respect to OA, this is to support detection of the long-term anthropogenically-driven changes hydrographic conditions and carbon chemistry over multi-decadal timescales
versus
“Weather”
• Defined as data of sufficient and defined quality used to identify relative spatial patterns and short-term variation
• With respect to OA, this is to support mechanistic interpretation of the ecosystem response to and impact on local, immediate OA dynamics

b. Data Quality Requirements
For a Network to succeed at delivering on the global goals identified here, observations must be of a verifiable quality and consistency. Participants identified three critical data quality requirements that must be followed in order to implement the Network:
Observations provided to the Network will be accompanied by uncertainty levels in measured, estimated, and calculated parameters, regardless of data quality level.
Observations will be calibrated to a community-accepted set of reference materials.
All constants applied in the derivation of calculated parameters will be documented and reported.
8. System Design of the Global OA Observing Network: Measurements
a. Measurements for GOAL 1: An understanding of global OA conditions
i. Position statement: Contributors to the Global OA Observing Network will provide the hydrographic conditions and carbon chemistry data necessary to provide for:
1. At a minimum, mechanistic interpretation of the ecosystem response to and impact on local, immediate OA dynamics (Weather).
2. Optimally, detection of the long-term anthropogenically-driven changes in hydrographic conditions and carbon chemistry over multi-decadal timescales (Climate).
The primary metric of interest adopted by the participants was the calcium carbonate saturation state, Ω. Constraint of the inorganic carbon system implies that the concentrations of hydrogen ions, all species of the inorganic carbon system, and calcium are all known within known uncertainty. This necessitates at least two components of the inorganic carbon system [total alkalinity (AT), total dissolved inorganic carbon (CT), partial pressure of carbon dioxide (pCO2), and pH (total scale)] and calcium are measured or derived from proxies. Each must be associated with quantified uncertainty and the state variables (temperature, salinity, pressure) that determine thermodynamic terms. ii. GOAL 1 Level 1 Measurements for Oceans and Coasts:
Temperature, Salinity, Pressure, Oxygen, and Carbonate-system constraint* with stated uncertainties
*Carbonate-system constraint can be achieved in a number of ways, including combinations of measurements and synthetic, non-collocated estimates of other parameters.
Fluorescence+ and Irradiance+
+Except where platform is not appropriate or available for this measurement

The weather objective requires ±10% measurement resolution of Ω. • Implies order of 10 measurement resolution2 in AT, CT, and pCO2 and 0.01
in pH. • Achievable in good (but not reference) labs. • Barely achievable with best autonomous sensors.
The climate objective requires 10x better measurement resolution of Ω.
• Implies order of 1 measurement resolution in AT, CT, and pCO2 and 0.001 in pH.
• Equivalent to best reference lab MR • Not currently achievable with best autonomous sensors.
As stated in the data quality requirements section, observations provided by the Network will report uncertainty in measured, estimated, and calculated parameters, regardless of quality level. Observations will relate to a community-accepted set of reference materials.
The addition of fluorescence and irradiance is because biological processes, e.g., respiration, photosynthesis, may affect the chemical status of OA and its attribution to underlying mechanism. However, it was noted that not all platforms or efforts could accommodate these measurements. Thus, while these remain Level 1 measurements, it is understood that in some cases, these cannot occur. iii. GOAL 1 Level 2 Measurements for Oceans and Coasts: There was no consensus as to which measurements would be broadly relevant at a global scale. That is, the optimal set of Level 2 measurements is condition- (locale, season, hydrographic) and question-dependent. Measurements recommended included:
Nutrients, Bio-optical parameters (beam C, backscatter, turbidity, absorption), Transport, Meteorology, Net Community Metabolism (NCM), Trace metals, 18O, 13C, Export production, PIC, POC, Atmospheric pCO2, and Phytoplankton species
In reality, some of these measurements are currently more likely Level 3 measurements, and that distinction may actually vary in different systems. iv. GOAL 1 Level 1 Measurements for Coral Reefs: In addition to the Goal 1 Level 1 measurements for Oceans and Coasts, measurements for assessing the effect of biology on OA in Coral Reefs are:
Biota biomass o Corals, Photosynthesizers (algae, seagrasses), Coralline Algae
Changes in Net Ecosystem Processes o Calcification/Dissolution (NEC: Net Ecosystem Calcification) o Production/Respiration (NPP: Net Primary Production)
2 Measurement resolution is in units that are the same as the measurement itself. Thus, “order of 10 measurement resolution” means 10 ppm for pCO2 and 10 µmol/kg for CT.

v. GOAL 1 Level 2 Measurements for Coral Reefs: These measurements were specified as necessary in some areas or instances:
Processes o Freshwater input o Nutrification (especially for inshore reefs)
Wind (for oxygen-derived NPP) b. Measurements for GOAL 2: An understanding of ecosystem response to OA
i. Position statement: In discussing Goal 2, participants noted the need to consider two questions with respect to biology and OA:
1. What effect does biology have on OA (i.e. how do species, communities and ecosystems affect OA)?
2. What are biological responses to OA (i.e. how will ecosystems respond to OA vis-à-vis metabolic rates, morphology, and community composition)?
The first question actually needs to be considered in the context of both Goals 1 and 2. This question notes the biological contribution to OA chemical status. As reflected in the Goal 1 sections above, biologically relevant measurements are required. Thus, for oceans and coasts, fluorescence and light are defined as Goal 1 Level 1 measurements to help assess photosynthesis and respiration, along with the other Goal 1 Level 1 measures, including oxygen (for hypoxia) and salinity (for freshwater input) and some measure of the biological community (e.g., phytoplankton species) is desired for Goal 1 Level 2. However, there is a consequent feed-back loop from biologically mediated changes on OA to the second question, biological responses. While the remainder of the discussion in this section is focused on the second question only (Goal 2: the biological/ecosystem responses to OA), an inherent coupling of these two questions is noted.
In the context of Goal 2, a conceptual structure for the effects of OA on ecosystems is depicted in Figure 3 that illustrates direct effects of CO2 and pH on organisms, as well as indirect effects of OA on ecosystems and ecosystem services.
The Global OA Observing Network will focus on specific measurements within this conceptual structure to resolve thresholds of response to OA in relation to site-specific baselines. For inter-site comparisons, it is recommended to use anomalies from long-term means as a basis, where absolute values are difficult to compare. Thus, the focus of these measurements is cross-cutting, not ecosystem dependent, accordingly with the conceptual structure. Network design and site selection should consider the utility of the resultant information to management and mitigation. While the emphasis of the Network will be to assess Goal 2, there is payoff to other science inquiry. That is, while experiments will not be part of the Global OA Observing Network, the Network will help inform independent experimental site selection.

Figure 3. Conceptual model of the effects of OA on ecosystems illustrating direct effects of CO2 and pH on organisms, as well as indirect effects of OA on ecosystems and ecosystem services (adapted from Williamson & Turley, 2012). ii. GOAL 2 Level 1 measurements for Oceans and Coasts: To assess the biological response to OA in Oceans and Coasts the following measurements would be made with the contemporaneous physical and chemical measurements as defined above for OA Goal 1 with at least ‘weather’ data quality. During the workshop, Level 1 measurements were defined as:
Biomass of functional groups: o Phytoplankton (including timing of bloom, community shifts, pigments) o Zooplankton, both micro- (e.g., protists) and meso- (i.e., multicellular and
including meroplankton) o Microbes o Benthic Animals, Algae, and Plants
Methods for biota biomass measurements may include acoustics, pigment analysis, TRFLP, and flow cytometry. Biomass of calcified versus non-calcified species is desired.

iii. GOAL 2 Level 2 measurements for Oceans and Coasts: Goal 2 Level 2 measurements would add measurements of:
Species Processes, including growth and grazing rates, respiration, net primary
production, growth rates of calcifiers vs. non-calcifiers, etc. While useful guidance, the Goal 2 Level 1 and 2 measurements as presented above are fairly all-encompassing and illustrate the difficulty of identifying specific biological measurements for a Global OA Observing Network. In section 9, priority products from the Global OA Observing Network are presented and offer a means to narrow and specify the focus, and thus measurements, of Goal 2 in the oceans and coasts. iv. GOAL 2 Level 1 Measurements for Coral Reefs: To assess the biological response to OA in Coral Reefs the following measurements would be made with the contemporaneous physical and chemical measurements as defined above for OA Goal 1 with at least ‘weather’ data quality:
Biota biomass (to assess shifts) o Corals, Photosynthesizers (macroalgae, turf algae), Coralline Algae
Processes o Calcification/Dissolution (NEC: Net Ecosystem Calcificiation) o Production/Respiration (NPP: Net Primary Production)
v. GOAL 2 Level 2 Measurements for Coral Reefs:
Distribution
o Rugosity – to assess for loss in architectural complexity - low frequency sampling with highly consistent methods.
o Species distribution – to assess community composition shifts, e.g., from more sensitive genera like Acropora to more robust species like Porites)
o Biogeographic distribution (long-term, large scale)
Rates o Growth rates o Consumption rates, including bio-eroders, via bioerosion blocks o Recruitment
Coral status o Coral disease frequency and distribution o Coral bleaching frequency and distribution
This group noted that temporal resolution was important when regarding all Goal 2 measurements as large diurnal and seasonal variability necessitates high temporal resolution to infer acidification signal.

a. Measurements for GOAL 3: Input data to optimize modeling for OA
i. Global/Basin and Climate Scales
To improve the capacity of existing models to yield widespread information on global/basin scale OA status and trends, the following recommendations are made.
• Large scale surveys – a snapshot of OA conditions is important in order to constrain models; need to coordinate information at basin-scale, repeat hydrography, VOS, historical sections.
• Better spatial coverage of moorings with OA physical/chemical/optics measurements; targeted process studies (rate measurements, budget, community structure) at time series stations and key locations to improve biogeochemical model structures and parameters.
• More Argo floats with bio-optical sensors (NPZD-O2 floats) with proper temporal sampling frequencies, which establish interconnections of the same water masses.
• Extended spatial coverage of gliders, based on modeling simulations and experiments (OSSE) to establish new glider and survey sections.
• Connect global/basin OA conditions with marginal seas/coastal processes; use coastal extensive OA observing networks and modeling capabilities to examine impact of coastal seas on the open ocean.
ii. Marginal Seas/Coastal – Weather and Climate Scales
To improve our capability to use coastal models for physical, chemical, and biological applications relevant to OA and to optimize a coupled monitoring-modeling network for the coastal/marginal seas, the following recommendations are made.
• Make better use of regional/coastal physical modeling capabilities, especially near-real time and short-term (weather) forecasting information; coastal OA observations provide necessary information to establish and improve physical-biogeochemical models.
• Evaluate and constrain model performance at OA observing locations (moorings, glider and survey sections); produce near-real time and short-term forecasts of OA conditions; extract and simplify model results to develop a set of usable OA indicators for the key locations.
• Based on physical-biogeochemical model results and numerical experiments (OSSE), identify new OA observing locations and modify existing OA monitoring networks.
• Integrate OA measurements with water quality information (oxygen, nutrients/loading, turbidity, etc.) and plankton community structures (survey data, bio-optical and remote sensing measurements); incorporate this information into physical-biogeochemical models to produce 3D distribution on dominated temporal scales.

• Develop models for pelagic and benthic organisms (vulnerable to OA) with connections to the habitat and OA conditions; establish ecosystem models to link with living marine resource management (integrated ecosystem assessment).
c. Coral Reef Systems – Weather and Climate Scales
To provide for the capability to assess OA impacts on coral reef systems the following recommendations are made.
• Very high spatial resolution (100 meters scale) circulation models for coral reef ecosystems need to be developed; these models will need to address connectivity related issues, linking with basin/regional models.
• Wave models should be incorporated into circulation models, which will address impact of extreme weather events.
• OA observing information is needed that constrains initial and boundary conditions for targeted reef systems (smaller spatial domain and shorter temporal simulations).
• There will need to be multiple model simulations and future projections of OA conditions and key physical processes (temperature, sea level, light, frequency and intensity of extreme events) for coral reef systems.
• Models must capture habitat conditions and ecosystems connections.
9. Global OA Observing Network Design: Spatial and Temporal Coverage
a. Current status
While other participants met in measurement-relevant breakout groups, this group focused on the desired spatial and temporal resolution of the measurements, the current status of a Global OA Observing Network relevant to the three broad ecosystem domains, oceans, coasts, and coral reefs, identification of gaps and high vulnerability areas, and follow-on discussions on priorities for filling gaps or building capacity for new measurements. Summarized here is a broad overview of the current status in these three domains; sequential sections present specific recommendations to fill needs.
OCEANS: On a global scale, for assessment of OA in the oceans, the significant building blocks of a network are well established and vetted by the ocean community (e.g., CLIVAR/CO2 Repeat Hydrography Program, GO-SHIP, OceanSITES, VOS), but it needs filling in for certain areas, some components lack sustained funds, and some components need enhancements.
COASTS: On a global scale, for assessment of OA in the coastal ocean, seas, and estuaries, a network needs construction. On regional scale, there are some systems in place, some ability to leverage OA observations on existing infrastructure (e.g., WAMS, LTER), but there are many gaps. A balanced representation is needed and that is currently lacking. This element needs
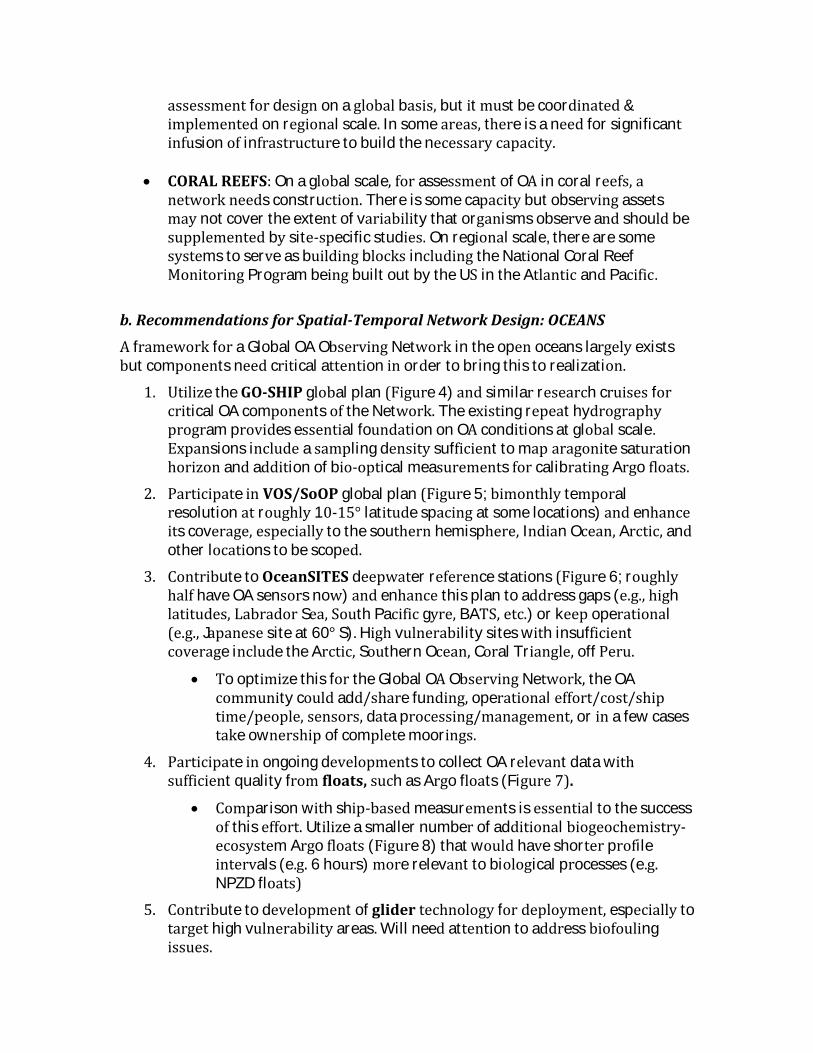
assessment for design on a global basis, but it must be coordinated & implemented on regional scale. In some areas, there is a need for significant infusion of infrastructure to build the necessary capacity.
CORAL REEFS: On a global scale, for assessment of OA in coral reefs, a network needs construction. There is some capacity but observing assets may not cover the extent of variability that organisms observe and should be supplemented by site-specific studies. On regional scale, there are some systems to serve as building blocks including the National Coral Reef Monitoring Program being built out by the US in the Atlantic and Pacific.
b. Recommendations for Spatial-Temporal Network Design: OCEANS
A framework for a Global OA Observing Network in the open oceans largely exists but components need critical attention in order to bring this to realization.
1. Utilize the GO-SHIP global plan (Figure 4) and similar research cruises for critical OA components of the Network. The existing repeat hydrography program provides essential foundation on OA conditions at global scale. Expansions include a sampling density sufficient to map aragonite saturation horizon and addition of bio-optical measurements for calibrating Argo floats.
2. Participate in VOS/SoOP global plan (Figure 5; bimonthly temporal resolution at roughly 10-15° latitude spacing at some locations) and enhance its coverage, especially to the southern hemisphere, Indian Ocean, Arctic, and other locations to be scoped.
3. Contribute to OceanSITES deepwater reference stations (Figure 6; roughly half have OA sensors now) and enhance this plan to address gaps (e.g., high latitudes, Labrador Sea, South Pacific gyre, BATS, etc.) or keep operational (e.g., Japanese site at 60° S). High vulnerability sites with insufficient coverage include the Arctic, Southern Ocean, Coral Triangle, off Peru.
To optimize this for the Global OA Observing Network, the OA community could add/share funding, operational effort/cost/ship time/people, sensors, data processing/management, or in a few cases take ownership of complete moorings.
4. Participate in ongoing developments to collect OA relevant data with sufficient quality from floats, such as Argo floats (Figure 7).
Comparison with ship-based measurements is essential to the success of this effort. Utilize a smaller number of additional biogeochemistry-ecosystem Argo floats (Figure 8) that would have shorter profile intervals (e.g. 6 hours) more relevant to biological processes (e.g. NPZD floats)
5. Contribute to development of glider technology for deployment, especially to target high vulnerability areas. Will need attention to address biofouling issues.

Figure 4. Map of Go-Ship Repeat Hydrographic Surveys in the global oceans as of 2012.
Figure 5. Map of global Volunteer Observing Ships (VOS) cruise tracks for underway measurements as of 2012.

Figure 6. Map of OceanSites mooring locations for time-series measurements. Color coding: Yellow = collecting some OA parameters in 2012; Orange = likely to happen in next year; Red = unlikely to happen without strong push from OA community.
Figure 7. Map of ARGO Float locations as of April 2013. Some of the floats are equipped with biogeochemical sensors, as shown in Figure 8.
Jamstec
NIO
RAMA/PMEL
RAMA/PMEL
Cloiker/Kerguelen
K2/Jamstec
Spot/Aucan
Jamste
BATS
Hausgarten
Canada
Agulhas/PMEL
??? AA supply ships
??
??Coral Seas
PAP/UK
OOI OOI
OOI

Figure 8. Map of ARGO floats with biogeochemical sensors.
c. Recommendations for Spatial-Temporal Network Design: COASTS
The status of a Global OA Observing Network in the coastal area is in a much different state than the open ocean. There is no existing framework for most regions and no global framework for coastal areas, so the Network’s design needs a more fundamental approach.
1. Create OA capacity: Incorporate existing OA observing, where available Inventory current observing capacity and expand subset to include OA
observations* Be proactive in treatment of gaps (e.g., Africa, etc).*
*Use statistical/quantitative analyses to: a) target new assets to optimal locations and b) provide a means of filling gaps (data extrapolation in a resource-limited world)
2. Aim for balanced representation:
Represent the full range of natural variability (and presumably ecosystem resilience); include high vulnerability areas and areas with important economic resources. For example, upwelling zones versus stable water column areas should both be captured. While the former may see lower pH in surface waters, organisms may be better adapted to variation, thus more resilient.
3. Work within regions to optimize capacity and relevance.
Encourage use of coastal observational networks as a framework for process studies

Improve upwelling indices for nearshore areas (useful in creating proxy methods for extrapolating sparse observations across complex coastal zones)
d. Recommendations for Spatial-Temporal Network Design: CORAL REEFS Capacity is adequate in some areas, but non-existent in others; a balance is needed for a truly Global OA Observing Network.
1. Utilize current observing assets including moorings/buoys in:
Hawaii (Kaneohe Bay and S. Shore), Bermuda (Hog Reef, Crescent), GBR (Heron Island) and Ningaloo (W Australia), Chuuk, Florida Keys (Cheeca Rocks), Puerto Rico (La Parguera).
BUT: these may not cover the extent of variability that organisms observe and should be supplemented.
2. Aim for balanced representation, monitoring across gradients of latitude, biodiversity, warm vs. coldwater systems, pristine vs. impacted.
3. The observing system should also give us insight as to what reefs will look like in 50-60 yrs., so include natural-CO2 seeps.
e. Recommendations for Spatial-Temporal Network Design: SYSTEM-WIDE
Participants identified several items that the Network system design needs to address that are not specific to any one of the above ecosystem types:
Data coverage gaps – a global network cannot be global if not adequately distributed to all sectors of the globe. The current status is not acceptable.
‘Threatened’ ecosystems – either due to proximity to perceived thresholds, rate of change in carbonate chemistry conditions, or vulnerability of ecosystem, these systems should be observed via the Network. It is likely that we, as a global community and perhaps through the auspices of the IOCCP and the OA-ICC, can focus attention on identifying those hot spots through a dedicated research effort.
Ecosystem function – because OA is an environmental condition with implications for biota, the ecosystem function must be a focal point for observations. This calls for integration of physical, chemical, and biological sensing.
Operational benefits – data from the Network should be available to and linked with those sectors of society that benefit from the data in making business and management decisions. The Reference User Group of the International Coordination Centre will become a focal point for bringing messages to industry, governments and the public.

10. Data Quality Objectives in the context of Goals and Sampling Platforms
Participants identified how the various sampling platforms currently available to the community were suited to the two goals and two data quality levels.
Data satisfying Goal 1 ‘climate’ data quality criteria currently can only be obtained from direct analysis of water samples, typically necessitating sampling from cruises or VOS. Thus, cruise and VOS sampling, analyzed appropriately, assures ‘climate’ quality data as well as offers sporadic validation of ‘weather’ quality measurements.
Data of Goal 1 ‘weather’ quality are often collected on moorings or fixed platforms, but must be calibrated, as noted above, by validation samples of ‘climate’ quality. The added benefit of mooring/fixed platforms is that these platforms can be used to obtain high temporal resolution data that is useful for elucidating mechanisms of variation. Such high temporal resolution measurements are also valuable in the ‘climate’ context to verify means in highly dynamic systems i.e. to increase knowledge on representativeness of spot sampling from cruises.
Goal 1 is also aided by ‘weather’ quality data obtained from gliders or floats yielding high spatial resolution data that is useful for assessing vertical variation (shoaling of saturation horizons) and elucidating mechanisms. The same caveats as for moorings/fixed platforms apply, that these should be calibrated.
Data for Goal 2 currently requires cruise-based sampling for all variables, except for some indicators relevant to phytoplankton and production, e.g., fluorescence and PAR.
Needs: In order to accurately satisfy goals in all environmental regimes, the applicability of method to environment is key and having documentation thereof. Important examples mentioned are the:
• Need to prepare CRMs for other environments (low salinity). • Need for SOPs for autonomous sensors and to standardize those. • Need for detailed honest documentation of what people are doing, including
validation, SOPs, metadata.
11. Global OA Observing Network Products
i. GOAL 1 priority products: Open Ocean
• Seasonally resolved global and regional surface maps of pH, alkalinity, saturation states, pCO2
• Time series stations (e.g. interactive maps) • Decadal changes from repeat hydrography • Export production (PIC, POC) • Subsurface saturation maps

Coastal • Seasonally resolved surface maps of pH, alkalinity, saturation states, pCO2 • Time series stations (e.g. interactive maps) • Near-Real-Time data access • Alkalinity anomaly • Subsurface maps of pH, alkalinity, saturation states, pCO2
Coral Reefs
• DIC/Alkalinity relationships for different sites • Biogeochemical model output at coral reef sites • Time series of delta Alkalinity (deviation from salinity)
ii. GOAL 2 priority products: For the seven priority products listed here, find notes on supporting measurements for these products in Appendix 3. These can guide prioritization of biological measurements for Goal 2.
Note that all products are to be spatially resolved and analyzed in relation to carbonate system variability. These are not prioritized.
Benthic recruitment and recruitment variability
Planktonic calcifiers (phyto- and zooplankton) abundance and variability
PIC:POC (calcifiers:non-calcifiers) in planktonic and benthic organisms
Phytoplankton biomass, primary production, and assemblage shifts
Habitat compression/expansion of pelagic & benthic organisms
Comparative resilience of managed vs. unmanaged ecosystems
Susceptibility to phase shifts
The group noted this was not an exhaustive list of products and recommended expansion of topics to possibly include:
Benthic (adult) calcifiers
Heterotrophic bacteria (e.g., differential responses of Archaea vs. Eubacteria; possible linkage to HABs)
Responses of marine fishes
12. Global OA Observing Network Data Management
a. Data Sharing: Consensus vision and solutions to roadblocks A group poll indicated that data sharing was sometimes problematic in coastal waters, due to national policies, so the workshop discussion on data sharing focused on the ocean scale.

A consensus statement voted on by all workshop participants regarding sharing of ocean Global OA Observing Network data was:
“The participants in the Global OA Observing Network agree to support in principal the construction of a web portal that
– builds on current capacity and capabilities, – accepts data streams from relevant data centers, – provides visual and data link capabilities, and – exhibits synthesis products for the ocean scale.”
Recommended metrics for data sharing for ocean Global OA Observing Network data were to:
• Provide the QC’ed data for synthesis products – 6 mo (desired) – 2 yr (longest possible) after collection – Work to accelerate the QC process
• Post the near-real-time (NRT) data – Picture of data (realistically possible) – Download of data (desired) – Work to accelerate the QC process
• Provide the data via public web portal
Further, the group was polled to identify roadblocks to data sharing and to brainstorm solutions. The five most common roadblocks and solutions are shown.
1. QA/QC: it takes time; there are no standardized procedures; capacity lacking • Solution: On the Global OA Network portal
– Advertise Data Managers, e.g., CDIAC, better – Create standardized procedures for the Network – Engender trusting relationship between data providers and data managers – Post info on benefits of data sharing
2. Institutional boundaries or national regulations • Solution:
– Develop terms of reference for Global OA Network – Network provides contacts for EEZ paperwork
3. There is no consistent data portal • Solution:
– Develop a data portal for the OA Network
4. Scientists’ reluctance • Solution:
– Publication, acknowledgement – Highlight examples of benefits on portal – Provide version control
5. Funding insufficient • Solution:
– Outreach to scientists regarding data expectations – Provide relevant products to users that are highly valued

b. Data Management Plan The Data Management Plan for the Global OA Observing Network can largely adopt an existing data management plan for OA that NOAA spearheaded in cooperation with other U.S. agencies. Seeing a critical need for data coordination and as lead for the United States Interagency Working Group on Ocean Acidification, the NOAA Ocean Acidification Program took lead to integrate ocean acidification-related data across the U.S. federal government, recognizing the paramount importance for data sharing both nationally and internationally. As a result, an OA Data Management Workshop was convened in March 2012 at the University of Washington, in coordination with IOOS and its Pacific Northwest regional association, NANOOS. Thirty representatives, both scientists and data managers, from across NOAA, from other ocean-related science federal agencies (DOE, NASA, NSF, USGS, etc.) and from academia attended. While this was a U.S.-only workshop, a vision to guide an OA Data Management Plan was established and titled “Interagency Ocean Acidification Data Management Plan: Draft One,” now located on the U.S. National Oceanographic Data Center website (NODC, 2012). The essence of that plan, which shapes the vision for data management, dubbed the “Declaration of Interdependence” was shared with the Global OA Observing Network workshop participants, who supported it. The declaration is appended to this report in Appendix 4. There is ongoing activity led by NODC to begin implementing that plan.
13. Global OA Observing Network International Coordination Coordination of the Global OA Observing Network will be conducted by the International Ocean Carbon Coordination Project (IOCCP) with support from the International Coordination Center for Ocean Acidification (ICC-OA), SOLAS-IMBER Ocean Acidification Working Group, and the Global Ocean Observing System, including the U.S. Integrated Ocean Observing System (IOOS). Through a series of international workshops, the IOCCP will: (1) provide the rationale and design of the components and locations of the Global OA Observing Network that includes repeat hydrographic surveys, underway measurements on volunteer observing ships, moorings, floats and gliders, (2) identify a minimum suite of measurements parameters and performance metrics for each of the components of the observing system, (3) develop a strategy for data management, data quality assurance and distribution, and (4) assist in the development of the ocean acidification observing strategy. In June of 2012 the IOCCP co-sponsored the first workshop in Seattle, Washington, USA and in July 2013 they will co-sponsor the follow-up workshop in St Andrews, Scotland. 14. Global OA Observing Network Support Requirements The Global OA Observing Network must be scoped in terms of the need to support a functional network in its entirety. A network is not just sensors in water; a network requires support for the following capacities:
Physical infrastructure, i.e., the platforms and sensors;

Operations and maintenance, i.e., the humans to run the network and keep it functioning;
Data QA/QC, i.e., the standards and application thereof to keep the data quality suitable to the application;
Analytical and synthesis activities, i.e., the humans and models to analyze the data, synthesize it into useful data products, and interpret and publish its significance to a variety of audiences;
Capacity, i.e., the new infrastructure and job force that will have to be built and provided for in order to bring this Global OA Observing Network to a global reality.
15. Global OA Observing Network Web Portal
In a consensus statement, the participants at the workshop put forth that participants in the Network would agree to support in principal the construction of a web portal that:
o builds on current capacity and capabilities o accepts data streams from relevant data centers (or provides access to
data in a variety of data centers through appropriate interfaces) o provides visual and data link capabilities, o exhibits synthesis products for the ocean scale.
16. Global OA Observing Network Outcomes and Applications
The outcomes of the Network are to have globally distributed high quality data, near-real-time data, and data synthesis products that:
o Facilitate research (new knowledge) on OA o Communicate status of OA and biological response o Enable forecasting/prediction of OA conditions
These data can be used to provide relevant products to variety of users. Specific applications with information needs relevant to OA were identified to be:
o Science o International policy o Education and outreach o Socio-economic o Fisheries o Cultural aspects o Insurance o Coral reefs and livelihood, especially developing countries o Regulatory needs and environmental agencies o International food and economic security o Shellfish aquaculture (widespread globally) o Shore protection, tsunami protection o Tourism

References cited: Feely, R. & Co-Authors (2010). "An International Observational Network for Ocean Acidification" in Proceedings of OceanObs’09: Sustained Ocean Observations and Information for Society (Vol. 2), Venice, Italy, 21-25 September 2009, Hall, J., Harrison, D.E. & Stammer, D., Eds., ESA Publication WPP-306, doi:10.5270/OceanObs09.cwp.29 Iglesias-Rodriguez, M. & Co-Authors (2010). "Developing a Global Ocean Acidification Observation Network" in Proceedings of OceanObs’09: Sustained Ocean Observations and Information for Society (Vol. 1), Venice, Italy, 21-25 September 2009, Hall, J., Harrison, D.E. & Stammer, D., Eds., ESA Publication WPP-306, doi:10.5270/OceanObs09.pp.24 Lindstrom, Fisher, & Gunn (2012). “GOOS and a Framework for Ocean Observing” http://www.iooc.us/wp-content/uploads/2012/12/15-GOOS-Lindstrom-13Nov2012.pdf NODC (National Oceanographic Data Center) (2012). “Interagency Ocean Acidification Data Management Plan” http://www.nodc.noaa.gov/media/pdf/oceanacidification/InteragencyOADataMgmtPlan_June2012-2.pdf

Appendix 1. Global OA Observing Network workshop participants 1Organizing Committee; 2 Steering Committee
Rebecca Albright - Australian Institute of Marine Science
Simone Alin - NOAA Pacific Marine Environmental Laboratory, USA
Leif Anderson - University of Gothenburg, Sweden
Andreas Andersson - Scripps Institution of Oceanography, USA
Yrene Astor - Estacion de Investigaciones Marinas de Margarita, Venezuela
Nick Bates - Bermuda Institute of Ocean Sciences
Louis Celliers - Council for Scientific and Industrial Research, South Africa
Fei Chai - University of Maine, USA
Arthur Chen - National Sun Yat-sen University, Taiwan
Liqi Chen - State Oceanic Administration, China
Melissa Chierici - Institute of Marine Research, Norway
Jim Christian - Institute of Ocean Sciences, Canada
Cathy Cosca - NOAA Pacific Marine Environmental Laboratory, USA
Sarah Cooley - Woods Hole Oceanographic Institute, USA
Kim Currie - National Institute of Water and Atmospheric Research, New Zealand
Andrew Dickson - Scripps Institution of Oceanography, USA
Sam Dupont - University of Gothenburg, Sweden
Richard Feely1,2 - NOAA Pacific Marine Environmental Laboratory, USA
Helen Findlay - Plymouth Marine Laboratory, UK
Gernot Friederich - Monterey Bay Aquarium Research Institute, USA
Hernan Garcia - National Oceanographic Data Center, USA
Dwight Gledhill - NOAA Ocean Acidification Program, USA
Burke Hales - Oregon State University, USA
J. Martin Hernandez Ayon - University Autonoma de Baja California, Mexico
Libby Jewett1,2 - NOAA Ocean Acidification Program, USA
Truls Johannessen - University of Bergen, Norway
Robert Key - Princeton University, USA
Alexander Kozyr - Carbon Dioxide Information Analysis Center, USA
Nelson Lagos - Universidad Santo Tomas Santiago de Chile
Kitack Lee2 - Pohang University, Korea
Jian Ma - State Key Laboratory of Marine Environmental Science, Xiamen University, China
Jeremy Mathis - University of Alaska, USA

Emilio Mayorga - University of Washington/APL/NANOOS, USA
Bruce Menge - Oregon State University, USA
Akihiko Murata - Japan Agency for Marine-Earth Science and Technology, Japan
Jan Newton1,2 - University of Washington/APL/NANOOS, USA
Mark Ohman - Scripps Institution of Oceanography, USA
Jon Olafsson - Marine Research Institute, Iceland
Are Olsen - University of Bergen, Norway
David Pearce - Centre for Environment, Fisheries & Aquaculture Science, Lowestof, UK
Benjamin Pfeil - University of Bergen, Norway
Lisa Robbins - U.S. Geological Survey, USA
Chris Sabine - NOAA Pacific Marine Environmental Laboratory, USA
Joe Salisbury2 - University of New Hampshire, USA
Eduardo Santamaria del Angel - Universidad Autonoma de Baja California, Mexico
Vedula Sarma - National Institute of Oceanography, India
Ute Schuster - University of East Anglia, UK
Uwe Send - Scripps Institution of Oceanography, USA
Jacob Silverman - Israel Oceanographic and Limnological Research, Israel
Stefania Sparnocchia - Istituto di Scienze Marine, Italy
Adrienne Sutton2 - NOAA Pacific Marine Environmental Laboratory, USA
Colm Sweeney - NOAA Earth System Research Laboratory, USA
Toste Tanhua - Leibniz Institute of Marine Sciences (IFM-GEOMAR), Germany
Kathy Tedesco1,2 - International Ocean Carbon Coordination Project, France
Maciej Telszewski - International Ocean Carbon Coordination Project, France
Bronte Tilbrook2 - Commonwealth Scientific and Industrial Research Organisation, Australia
Rodrigo Torres - Centro de Investigacian en Ecosistemas de la Patagonia, Chile
Cristian Vargas2 - Universidad de Concepcion, Chile
Rik Wanninkhof - NOAA Atlantic Oceanographic and Meteorological Laboratory, USA
Steve Weisberg2 - Workshop Facilitator
Steve Widdicombe - Plymouth Marine Lab, UK
Phil Williamson - University of East Anglia, Norwich Research Park, UK
Steering Committee members not able to attend: Albert Fischer1,2 - UNESCO - Intergovernmental Oceanographic Commission, France
Yukihiro Nojiri2 - National Institute for Environmental Studies (NIES), Japan
Kumiko Azetsu-Scott2 - Bedford Institute of Oceanography, Canada

Appendix 2. Global OA Observing Network Agenda
Day 1: 26 June 2012
08:15 - 09:00: Workshop Introduction: Welcome, Logistics, and Opening Remarks:
Jan Newton (UW-NANOOS, Workshop Leader) and Steve Weisberg
(SCCWRP, Workshop Facilitator); Dean Lisa Graumlich, College of the
Environment, University of Washington; Clark Mather on behalf of
Congressman Norm Dicks, U.S. House of Representatives
09:00 - 10:15: Session A: What is a Global Ocean Acidification Observing
Network and why do we need one?
The purpose of this session is to address and discuss the following questions:
1. What has been the activity to date regarding a global ocean acidification
observing network and why is one needed?
2. What are the likely benefits to the various stakeholders (academic,
governmental, and commercial) that could be provided by global ocean
acidification observing network?
3. What kind of ocean acidification observing network is needed to provide
such benefits?
4. How can it be coordinated at the international level?
Overview talk: “What are the benefits of a Global Ocean Acidification Observing
Network?” by Libby Jewett, NOAA OA Program Director, (9:00 – 9:20) followed
by Plenary Discussion (9:20 – 10:15).
10:30 - 12:00 Session B: Network Design: Building from existing programs and
assessing strategic needs for new locations
The purpose of this session is to address and discuss the following questions:
1. What are the existing global carbon observing efforts?
2. How do we define Tier 1 and Tier 2 measurements?
3. What are the obvious gaps in existing efforts when viewed as a global
ocean acidification observing network?
4. What should a global ocean acidification observing network consist of
(survey cruises, moorings, floats, gliders, etc) and where should assets be
located?
Overview talk: “What are the possible components of an ocean acidification
network based on existing resources?” by Richard Feely, NOAA PMEL, (10:30 –
11:15) followed by Plenary Discussion (11:15 – 12:00).
13:00 - 17:00 Session C: Global Ocean Acidification Observing Network System
Design: 1. Definition
The purpose of this session is to define attributes of the observing network system design.
13:00 Charge to Breakout Groups – Jan Newton/Steve Weisberg
13:30 - 15:00 Breakout Session I: Defining the Global Ocean Acidification
Observing Network’s System Design

Breakout Group 1 (OSB #425) Time Series Measurements and Platform Location
Network Design: This group will focus from a temporal and spatial perspective, what
scales need to be accounted for in the system design. They will focus on questions 2 & 3.
They will also focus on the rationale for the observations in various regions.
Uwe Send, Simone Alin, Maciej Telszewski
Breakout Group 2 (OSB #203) Physical/Chemical Measurements Network Design:
This group will focus from a physical/chemical disciplinary perspective, what
measurements need to be accounted for in the system design. They will focus on question
1, but also 2 and 3.
Andrew Dickson, Burke Hales, Kitack Lee
Breakout Group 3 (OSB #510) Biological Measurements Network Design:
This group will focus from a physical/chemical disciplinary perspective, what
measurements need to be accounted for in the system design. They will focus on question
1, but also 2 and 3.
Bruce Menge, Rebecca Albright, Joe Salisbury
Questions to be addressed by each group:
1. What minimum physical, chemical and biological parameters (Tier 1 and
Tier 2) should be measured for each platform? Where? At what depths?
2. What is the desired spatial and temporal resolution of these
measurements?
3. Where are the gaps in present observing systems? Where are the areas of
high vulnerability? Where do we need new measurements?
15:30 - 17:00 Continue Breakout Session C
Day 2: 27 June 2012
08:30 - 11:30 Session C: Global Ocean Acidification Observing Network System
Design: 2. Group Consensus - Steve Weisberg, Facilitator
The purpose of this session is to hear back from breakout groups re the observing
network system design and to reach consensus and/or identify unresolved issues.
08:30 - 10:00 Breakout Group Reports (30 min per group)
10:30 - 11:30 Plenary Discussion to reach consensus on Observing System
Design and/or identify unresolved issues
11:30 - 12:00 Session D: Data Quality Control and Validation for the
Global OA Observing Network in the context of International
Coordination: 1. Current International Network Coordination The purpose of this session is to introduce the current level of international OA network
coordination.
Presentation by Richard Feely for Jean-Pierre Gattuso, Chair, SOLAS-
IMBER Ocean Acidification Working Group
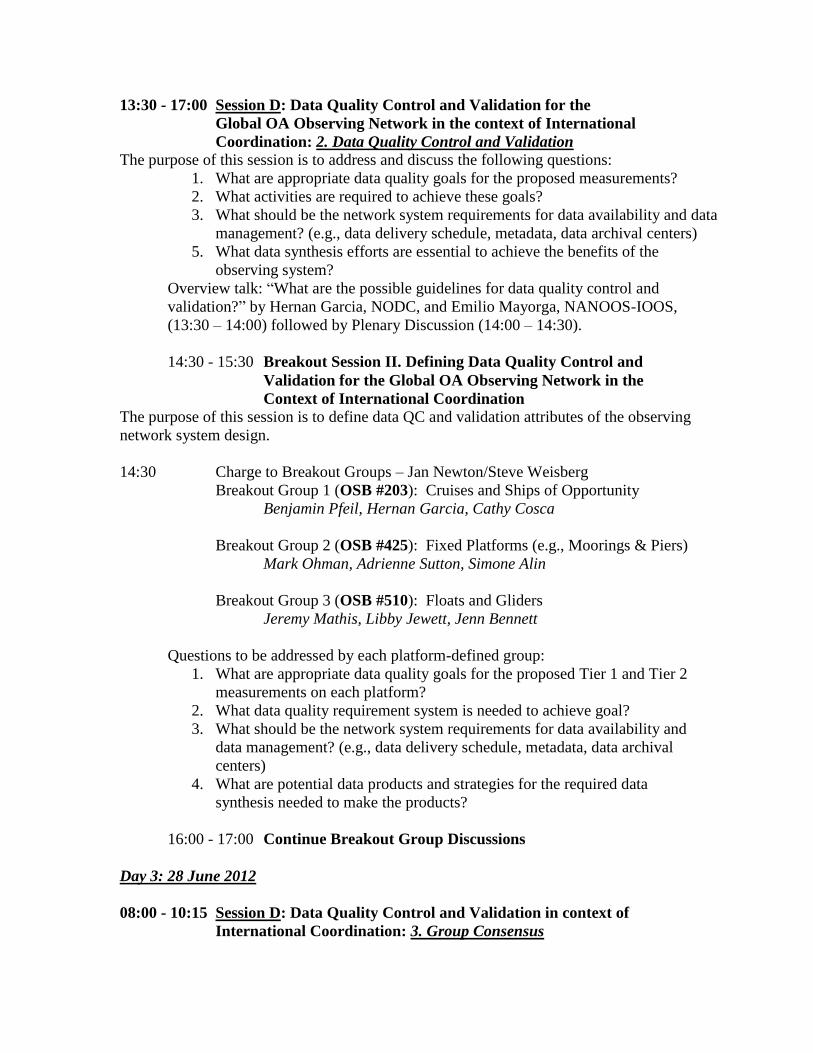
13:30 - 17:00 Session D: Data Quality Control and Validation for the
Global OA Observing Network in the context of International
Coordination: 2. Data Quality Control and Validation
The purpose of this session is to address and discuss the following questions:
1. What are appropriate data quality goals for the proposed measurements?
2. What activities are required to achieve these goals?
3. What should be the network system requirements for data availability and data
management? (e.g., data delivery schedule, metadata, data archival centers)
5. What data synthesis efforts are essential to achieve the benefits of the
observing system?
Overview talk: “What are the possible guidelines for data quality control and
validation?” by Hernan Garcia, NODC, and Emilio Mayorga, NANOOS-IOOS,
(13:30 – 14:00) followed by Plenary Discussion (14:00 – 14:30).
14:30 - 15:30 Breakout Session II. Defining Data Quality Control and
Validation for the Global OA Observing Network in the
Context of International Coordination The purpose of this session is to define data QC and validation attributes of the observing
network system design.
14:30 Charge to Breakout Groups – Jan Newton/Steve Weisberg
Breakout Group 1 (OSB #203): Cruises and Ships of Opportunity
Benjamin Pfeil, Hernan Garcia, Cathy Cosca
Breakout Group 2 (OSB #425): Fixed Platforms (e.g., Moorings & Piers)
Mark Ohman, Adrienne Sutton, Simone Alin
Breakout Group 3 (OSB #510): Floats and Gliders
Jeremy Mathis, Libby Jewett, Jenn Bennett
Questions to be addressed by each platform-defined group:
1. What are appropriate data quality goals for the proposed Tier 1 and Tier 2
measurements on each platform?
2. What data quality requirement system is needed to achieve goal?
3. What should be the network system requirements for data availability and
data management? (e.g., data delivery schedule, metadata, data archival
centers)
4. What are potential data products and strategies for the required data
synthesis needed to make the products?
16:00 - 17:00 Continue Breakout Group Discussions
Day 3: 28 June 2012
08:00 - 10:15 Session D: Data Quality Control and Validation in context of
International Coordination: 3. Group Consensus

The purpose of this session is to hear back from breakout groups re the data QC and
validation needs for the network and to reach consensus and/or identify unresolved
issues.
08:00 - 09:30 Breakout Group Reports (30 min per group)
09:30 - 10:15 Plenary Discussion to reach consensus on Data QC/V in context of
International Coordination and/or identify unresolved issues
10:45 - 12:00 Session E: International Data Integration and Network Coordination
Plenary Discussion on the International Coordination for Data and
Network Integration – Steve Weisberg, Facilitator
The purpose of this session is to identify if we have consensus on data sharing and what
roadblocks inhibit data integration and network coordination.
Presentation by Jan Newton of the “Declaration of Interdependence” from the
Consortium for the Integrated Management of Ocean Acidification Data
(CIMOAD)
Group poll: Do we have consensus to share data?
Identify roadblocks inhibiting data integration and network coordination on an
international scale (take individual participant contributions)
1. What are ideas to overcome identified roadblocks?
2. How will we ensure that the discrete observing efforts become a network?
3. Should there be an official structure or a more organic collective?
4. What actions are needed to better integrate and coordinate the observation
network?
5. What actions are needed to better integrate and coordinate data access?
13:00 - 15:30 Session F. Future Planning
The purpose of this session is to identify if we have consensus on vision for network and
what next steps are.
1. Looking at the current/planned observing system vs. the vision for the
system we have identified here to address gaps, do we a consensus view?
2. What tasks should be done first to move this effort forward?
3. What infrastructure will be needed to achieve this?
4. What has not been resolved and how shall this be addressed?
5. What is an appropriate timeline, with milestone steps, for implementation
of the network?
6. How should we define the network association and what is the most
efficient way to integrate efforts in the future? (e.g., regular meetings,
website, steering committee, etc.)
16:00 - 17:00 Workshop Summary: Recap Action Items and Identify Points of
Contact for follow-up

Appendix 3. Notes on supporting measurements needed for Goal 2 priority products
Benthic recruitment and recruitment variability:
• Abundance of numerically dominant species settled onto standardized surfaces (e.g., tuffies, brushes, plates)
• Taxa should be functionally significant with analogs in different regions • Sampling sites distributed spatially in relation to oceanographic variability • Sampling co-located with chemical/physical measurements
(where possible, including nearshore circulation) • Monthly sampling (minimum) • Fixed in buffered, non-denatured ethanol, hence suitable for:
- measurement of mineral skeletons - population genetic and genomic approaches
• Enumeration and identification by trained microscopists • Analyze differential responses of calcifiers and non-calcifiers • Deploy dissolution blocks at each site (CaCO3; perhaps aragonite) as simple
time-integrating measure of dissolution potential
Planktonic calcifiers (phyto- and zooplankton) abundance and variability:
• Abundance (ID’d to species) of numerically dominant species sampled by standardized water bottles or plankton tows
• Spatially distributed sampling in relation to spatial differences in OA variables
• Sampling co-located with chemical/physical measurements (preferably included continuous measurements, e.g. co-located with moorings)
• Standardized time of day/night • Where possible, vertically stratified sampling (required to assess habitat
compression) • Spatial replication needed (criteria tbd) • Temporal sampling interval tbd but must avoid aliasing seasonal cycle in
analysis of interannual trends • Fixed in buffered, non-denatured ethanol, hence suitable for:
- measurement of mineral skeletons - population genetic and genomic approaches
• Enumeration and ID by trained microscopists • Analyze differential responses of calcifiers and non-calcifiers • Deploy dissolution blocks at each site (CaCO3; perhaps aragonite); suspended
from moorings
PIC:POC (calcifiers:non-calcifiers) in planktonic and benthic organisms:
• Benthic Organisms: i) measure bulk PIC:POC ii) measure PIC:POC of target taxa
• Planktonic Organisms: measure PIC:POC of target taxa (changes in shell mass)

Seek to compare responses within functional guilds/taxonomic groups across diverse ocean regions
Phytoplankton biomass, primary production, and assemblage shifts: Phytoplankton biomass and primary production rates are important
integrative measures of responses to changing CO2, pH, and other CO3–
system variables. • i) Phytoplankton biomass is only roughly approximated by in vivo
fluorescence (IVF), but with standardization of protocols and complementary validation samples IVF can be informative. Validation measurements can include: - in situ flow cytometry (where feasible) - discrete samples – analyzed by HPLC, epifluoresence microscopy, flow cytometry
• ii) Primary Production Rates Derived from biomass, PAR, SST, PBOpt by analogy with satellite remote sensing Validation measurements needed to complement derived NPP 14C, 13C, O:Ar or O isotopes; Gas tension device; MIMS
• Measurements/estimates at two scales: 1) local, 2) satellite remote sensing • Characterization of assemblage shifts, with particular reference to calcifying
vs. non-calcifying organisms - Target taxa need to be agreed upon (with attention to local
circumstances) - Size distributions/size spectra may be informative
• Collaboration with HAB studies and HABS observing infrastructure needs to be developed
• Attention needs to be paid to interacting variables (e.g., Temp X pCO2 interactions significant, when either variable alone is not)
Habitat compression/expansion of pelagic & benthic organisms: • Many pelagic and benthic organisms (in Oceanic, Coastal, and Coral reefs
biomes) have defined limits of calcium carbonate saturation states, dissolved O2 concentrations, and other variables that define their habitat boundaries. As environmental characteristics change, their habitat will compress or, in some cases, expand, either vertically or horizontally.
• Organisms differ widely in motility, hence in ability to behaviorally avoid unfavorable habitat changes or propensity to succumb directly to such changes.
• To address this issue, attention should be paid to: o Spatially referenced (x,y,z) abundance data, by taxon o Target taxa should include both calcifiers and non-calcifiers o Study sites should be co-located with characterizations of
physical/chemical variables, preferably from high frequency to interannual
o Organism responses need to be measured on two time/space scales: 1) local scale - weather

2) biogeographic scale – climate - annual resolution
Comparative resilience of managed vs. unmanaged ecosystems: • Expanding numbers of Marine Protected Areas worldwide provide an
opportunity to directly compare managed vs. unmanaged marine ecosystems with respect to the effects of Ocean Acidification, and to assess the differential resilience of managed vs. unmanaged systems to altered CO3–
system stressors. • A first step is to inventory MPA networks worldwide and to determine the
extent of overlap with regions of OA vulnerability. The MPA community of experts needs to be consulted regarding key response variables for benthic and pelagic organisms.
• Example MPA networks include the: o U.S. National Marine Sanctuary program o California’s extensive MPA network under the Marine Life Protection
Act • Exploit gradients of human intervention (not simply intervention/no
intervention cases) where possible.
Susceptibility to phase shifts • Relatively abrupt changes in dominant ecosystem states have been
documented in a variety of benthic (e.g., coral reef « algal turf, calcifiers « non-calcifiers) and pelagic (e.g., North Pacific ecosystem shifts) ecosystems. Such ‘phase shifts’ result in major structural and functional changes in ecosystems. It is not known whether perturbations to the ocean CO3-- system will make such phase shifts more (or less) likely to occur.
• A first step is to map the co-location of ocean ecosystems with documented high and low propensity to phase shifts with those of high OA vulnerability, in order to select suitable comparison regions.
• The time scale of sampling will be determined by the life histories/generation times of the dominant organisms in each system, and the time scale over which phase transitions are thought to occur.

Appendix 4. An excerpt from the “Interagency Ocean Acidification Data Management Plan” produced by NOAA, US IOOS, and NODC.
“Declaration of Interdependence of Ocean Acidification Data Management Activities in the U.S.”
Whereas Ocean Acidification (OA) is one of the most significant threats to the ocean ecosystem with
strong implications for economic, cultural, and natural resources of the world;
Whereas our understanding of OA and our ability to: 1. inform decision makers of status, trends, and
impacts, and 2. research mitigation/adaptation strategies, requires access to data from observations,
experiments, and model results spanning physical, chemical and biological research;
Whereas the various agencies, research programs and Principal Investigators that collect the data
essential to understanding OA often pursue disparate, uncoordinated data management strategies that
collectively impede effective use of this data for synthesis maps and other data products;
Whereas an easily accessible and sustainable data management framework is required that:
i) provides unified access to OA data for humans and machines; ii) ensures data are version-controlled and
citable through globally unique identifiers; iii) documents and communicates understood measures of
data and metadata quality; iv) is easy to use for submission, discovery, retrieval, and access to the data
through a small number of standardized programming interfaces;
Whereas urgency requires that short-term actions be taken to improve data integration, while building
towards higher levels of success, and noting that immediate value can be found in the creation of a cross-
agency data discovery catalog of past and present OA-related data sets of a defined quality, including lists
of parameters, access to detailed documentation, and access to data via file transfer services and
programming interfaces;
Whereas this integration will also benefit other users of data for a diverse array of investigations;
Therefore, be it resolved that the 31 participants of an OA Data Management workshop in Seattle, WA on
13-15 March 2012 established themselves as the Consortium for the Integrated Management of Ocean
Acidification Data (CIMOAD) and identified three necessary steps forward to achieve this vision:
1. The endorsement of agency program directors and managers for collective use of machine-to-machine
cataloging and data retrieval protocols (including THREDDS/OPeNDAP) by each agency data center to
provide synergistic, consolidated mechanisms for scientists to locate and acquire oceanographic data;
2. The commitment of the scientific community to establish best practices for OA data collection and
metadata production, and the leadership to provide a means of gaining this consensus; and
3. The endorsement of agency program directors and managers to direct data managers to collaborate to
develop the system articulated above and contribute to a single national web portal to provide an access
point and visualization products for OA.
We, the undersigned, request your attention to this matter and commitment to bringing this vision to
reality in the next five years for the benefit of our nation and contribution to the global understanding.

Signatories to the Declaration of Interdependence of Ocean Acidification Data Management Activities:
1. Alexander Kozyr, Oak Ridge National Lab, CDIAC
2. Burke Hales, Oregon State U
3. Chris Sabine, NOAA PMEL
4. Cyndy Chandler, WHOI & NSF BCO-DMO
5. David Kline, UCSD
6. Emilio Mayorga, UW & NANOOS-IOOS
7. Hernan Garcia, NOAA NODC
8. Jan Newton, UW & NANOOS-IOOS
9. Jon Hare, NOAA NMFS NEFSC
10. Kevin O’Brien, NOAA PMEL
11. Kimberly Yates, USGS
12. Krisa Arzayus, NOAA OAR NODC
13. Libby Jewett, NOAA OAP
14. Libe Washburn, UCSB
15. Liqing Jiang, NOAA OAP
16. Michael Vardaro, OSU & OOI
17. Mike McCann, MBARI
18. Paul McElhany, NOAA NMFS NWFSC
19. Peter Griffith, NASA
20. Philip Goldstein, OBIS-USA
21. Richard Feely, NOAA PMEL
22. Roy Mendelssohn, NOAA SWFSC
23. Samantha Siedlecki, UW & JISAO
24. Sean Place, U South Carolina
25. Simone Alin, NOAA PMEL
26. Steve Hankin, NOAA PMEL
27. Tom Hurst, NOAA NMFS AFSC
28. Uwe Send, UCSD SIO
29. Sarah Cooley (via phone), WHOI and OCB
30. Derrick Snowden (via phone), NOAA IOOS
31. Jean-Pierre Gattuso (via phone) OAICC