tourism_impacts… · tourism impacts: evidence of impacts ... do we have clear evidence on...
TRANSCRIPT
ECONOMIC AND PRIVATE SECTOR
PROFESSIONAL EVIDENCE AND APPLIED KNOWLEDGE SERVICES HELPDESK REQUEST
Tourism Impacts
Evidence of Impacts on employment, gender, income
Alberto F. Lemma
Overseas Development Institute
July 2014
i
EPS-PEAKS is a consortium of organisations that provides Economics and Private Sector Professional Evidence and
Applied Knowledge Services to the DfID. The core services include:
1) Helpdesk
2) Document library
3) Information on training and e-learning opportunities
4) Topic guides
5) Structured professional development sessions
6) E-Bulletin
To find out more or access EPS-PEAKS services or feedback on this or other output, visit the EPS-PEAKS community
on http://partnerplatform.org/eps-peaks or contact Alberto Lemma, Knowledge Manager, EPS-PEAKS core services
Disclaimer Statement:
The views presented in this paper are those of the authors and do not necessarily represent the views of Consortium
partner organisations, DFID or the UK Government. The authors take full responsibility for any errors or omissions
contained in this report.
ii
Contents
List of boxes , figures and tables iii
Abbreviations iv
1 Introduction 1
1.1 Methodology 1
1.2 Summary of Findings 1
2 Impacts of Tourism on Growth, Employment, Income & Livelihoods 2
3 Impacts of Tourism on Gender 12
4 Impacts of Tourism on the Environment 15
5 Conclusions 19
References 20
Annex: A Note on the WTTC Methodology 22
iii
List of boxes , figures and tables
Box 1: Impacts of Tourism on Incomes & Employment in Nepal 10
Figure 1: Tourism Employment vis-à-vis other Sectors, 2012 9
Figure 2: Tourism Carbon Emissions by Destination (2005) 16
Table 1: Components of Direct, Indirect & Induced tourism contribution to GDP 3
Table 2: Direct & Total GDP Contribution of Tourism in South Asia, 2013 4
Table 3: Table 3: Direct and Total Effects of Tourism on GDP, 2013 5
Table 4: Estimated no. of Jobs Created in Tourism (by region) 2012 - 2022 6
Table 5: Direct, Indirect & Total Contribution to Employment for South Asia in 2013 7
Table 6: Global Contribution of Tourism to Employment, 2013 8
Table 7: Women Hotel/Restaurant Employees by Region, 2010 (%) 12
Table 8: Women employees by occupational status, 2010 (%) 13
Table 9: Female Employment in Tourism visi-a-vis other Sectors, 2010 (%) 13
Table 10: Gender Gap in Tourism Wages in Europe, 2011 (%) 14
Table 11: Carbon Emissions from Tourism (2005) 16
Table 12: CO2 Emissions by region of origin and destination (2005) 17
Table 13: Trampling Impacts on Vegetation and Soil 18

iv
Abbreviations
DFID UK’s Department for International Development
GATS General Agreement on Tariffs
GDP Gross Domestic Product
GHG Greenhouse Gases
ILO International Labour Organisation
UNEP United Nations Environment Programme
UNWTO United Nations World Tourism Organisation
WTTC World Travel & Tourism Council
Tourism Impacts: Evidence of Impacts on employment, gender, income
1
1 Introduction
1.1 Methodology
The paper, carried out under the DFID Economics and Private Sector Professional Evidence
and Applied Knowledge Services (EPS-PEAKS) framework seeks to answer the question
of:
Do we have clear evidence on tourism’s impact on income, jobs, gender and the
environment?
The report uses a mixture of quantitative data – of which the main sources were the World
Travel& Tourism Council and the United Nations World Tourism Organisation – as well as
academic literature and information from relevant websites, where available.
The report follows on from a previous EPS-PEAKS helpdesk which investigated the impacts
of tourism strategies for poverty reduction in South Asia, hence it includes some examples
(where data and case studies were available) of the impacts of tourism, on the above
factors, within the region.
Issues with the reliance on the use of WTTC indicators (see Annex 1 for further
explanations on the WTTC methodology for evaluating impact) for a number of economic
estimators is a potential cause of concern for the methodology as it was not apparent
whether the data coefficients used by the WTTC, especially for the indirect and induced
impacts of tourism on GDP and employment clearly represent actual impacts.
Environmental indicators for tourism also present a challenge in terms of their reliability
and availability.
1.2 Summary of Findings
Tourism impacts economies through three interrelated routes i.e. direct, indirect and
induced effects. These impacts and the structure of the tourism sector determine the
sectors economic impact on a country.
The impact of tourism on both economic growth and employment is clearly positive,
there is good quantifiable data and evidence that tourism positively contributes to both
economic growth (through measures of GDP) as well as on employment, both directly and
indirectly.
Estimating tourism’s overall impact on incomes is problematic due to limited evidence on
income and wage effects at the global level. Overall, available data shows positive impacts
on incomes as well as positive impacts on both livelihoods and poverty.
Good data on the gender impacts of the sector are limited to the number of females
employed in tourism and the types of work they undertake, both showing positive impacts.
Data on pay equality and working hours is more limited, but both show that females are
disadvantaged within tourism.
The environmental impacts of tourism are difficult to quantify – whilst data on emissions
is available (albeit old), there is limited data on other environmental impacts. Anecdotal
evidence does however suggest that tourism can have negative environmental impacts.
Tourism Impacts: Evidence of Impacts on employment, gender, income
2
2 Impacts of Tourism on Growth, Employment, Income & Livelihoods
The section highlights the economic impacts of the tourism sector, looking at its
contributions to growth, employment and incomes. The section first looks at the three
routes through which tourism achieves its impacts i.e. the direct, indirect and induced
impacts, subsequently assessing its impacts on employment and on incomes.
Economic Impacts of Tourism
Tourism has direct, indirect and induced impacts on local economies, these can often be
largely divergent between countries, based on the structure of the sector but most
importantly on how well linked tourism activities are with the local economy. Greater
linkages generally translate into higher levels of local economic activity (and growth),
which tend to occur when tourism enterprises source their goods and services (including
labour) locally whilst low levels of economic linkages occur where tourism enterprises are
dependent on imports (including staff) to supply their demands. The overall impacts of the
sector are the sum of the direct, indirect and induced effects (WTTC, 2012a):
Direct Impacts: Represents the GDP generated by activities that directly deal
with tourism such as hotels, travel agents, airlines and tour operators as well
as restaurants and other activities that cater to tourists.
Indirect Impacts, impacts which accrue due to the activities undertaken by
the sector, and are a function of three different factors:
1. Capital Investment in tourism: Includes capital investment within all sectors
that are directly involved in the tourism industry as well as spending by enterprises
in other sectors on tourism assets such as transport or accommodation.
2. Government Spending for Tourism: Government spending to support the
tourism sector, which can include both national and local spending. Activities
include tourism promotion, visitor services, administration etc.
3. Supply Chain Effects: These represent the purchase of domestic goods and
services, as inputs to the production of their final outputs, by enterprises within
the tourism sector.
Induced Impacts: Represents the wider contribution of tourism through the
expenditures of those who are directly or indirectly employed by the tourism
sector.
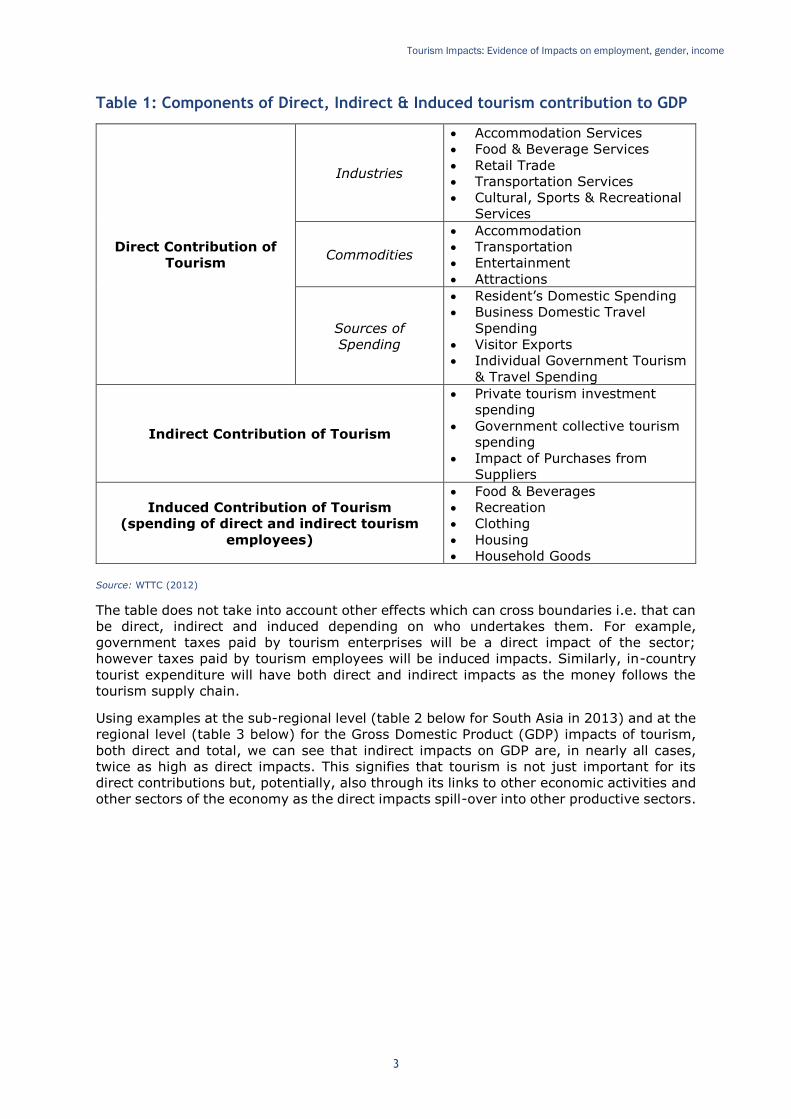
Table 1 (below) shows the different components of the direct, indirect and induced impacts
of tourism on an economy. The table highlights the different activities that are undertaken
at the three levels of impact i.e. direct impacts will be accrued through the activities of
accommodation or tourism transport services, indirect contributions through expenditure
on food and beverage suppliers to tourism enterprises, whilst induced impacts will be the
expenses of people working in the tourism sector (or benefitting from the sector) within
the local economy.
Tourism Impacts: Evidence of Impacts on employment, gender, income
3
Table 1: Components of Direct, Indirect & Induced tourism contribution to GDP
Direct Contribution of
Tourism
Industries
Accommodation Services
Food & Beverage Services
Retail Trade
Transportation Services
Cultural, Sports & Recreational
Services
Commodities
Accommodation
Transportation
Entertainment
Attractions
Sources of
Spending
Resident’s Domestic Spending
Business Domestic Travel
Spending
Visitor Exports
Individual Government Tourism
& Travel Spending
Indirect Contribution of Tourism
Private tourism investment
spending
Government collective tourism
spending
Impact of Purchases from
Suppliers
Induced Contribution of Tourism
(spending of direct and indirect tourism
employees)
Food & Beverages
Recreation
Clothing
Housing
Household Goods
Source: WTTC (2012)
The table does not take into account other effects which can cross boundaries i.e. that can
be direct, indirect and induced depending on who undertakes them. For example,
government taxes paid by tourism enterprises will be a direct impact of the sector;
however taxes paid by tourism employees will be induced impacts. Similarly, in-country
tourist expenditure will have both direct and indirect impacts as the money follows the
tourism supply chain.
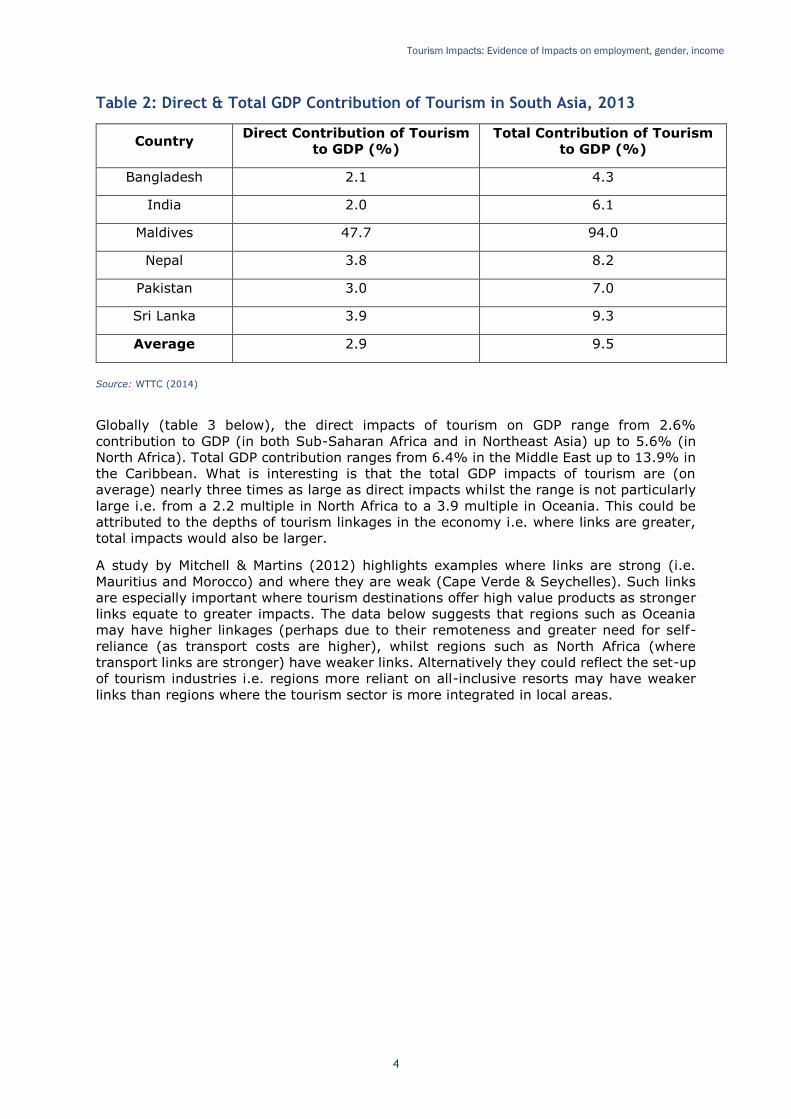
Using examples at the sub-regional level (table 2 below for South Asia in 2013) and at the
regional level (table 3 below) for the Gross Domestic Product (GDP) impacts of tourism,
both direct and total, we can see that indirect impacts on GDP are, in nearly all cases,
twice as high as direct impacts. This signifies that tourism is not just important for its
direct contributions but, potentially, also through its links to other economic activities and
other sectors of the economy as the direct impacts spill-over into other productive sectors.
Tourism Impacts: Evidence of Impacts on employment, gender, income
4
Table 2: Direct & Total GDP Contribution of Tourism in South Asia, 2013
Country Direct Contribution of Tourism
to GDP (%)
Total Contribution of Tourism
to GDP (%)
Bangladesh 2.1 4.3
India 2.0 6.1
Maldives 47.7 94.0
Nepal 3.8 8.2
Pakistan 3.0 7.0
Sri Lanka 3.9 9.3
Average 2.9 9.5
Source: WTTC (2014)
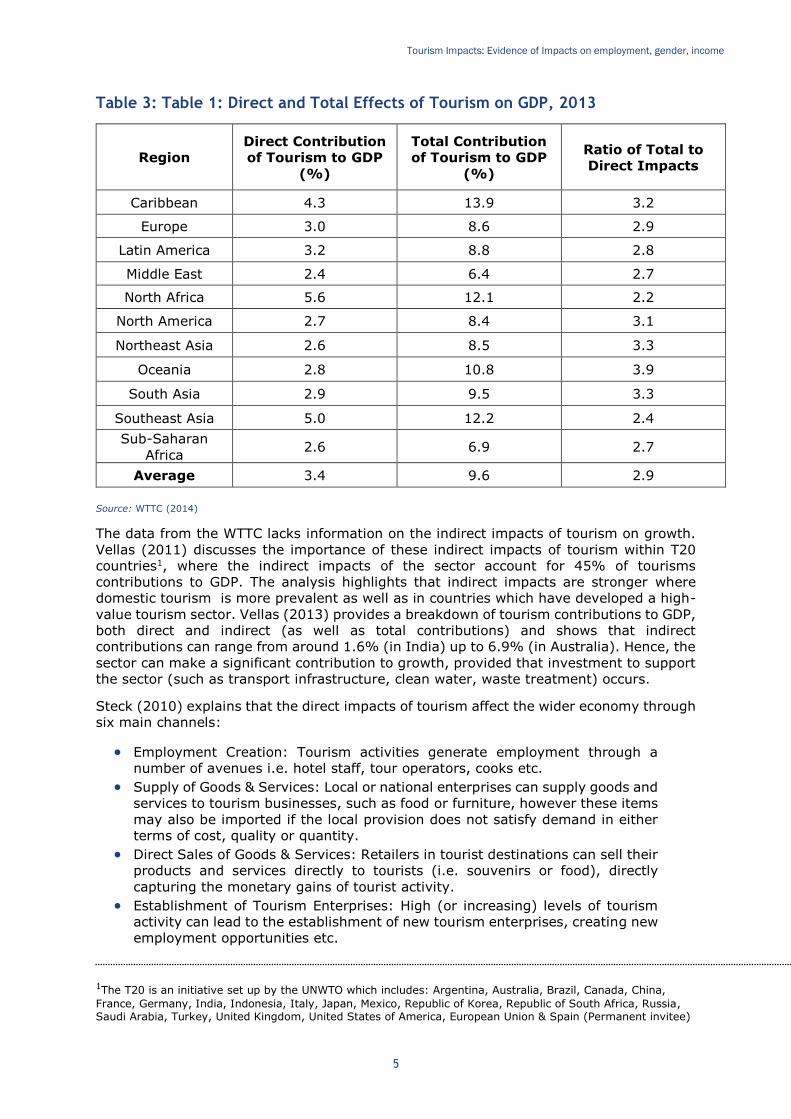
Globally (table 3 below), the direct impacts of tourism on GDP range from 2.6%
contribution to GDP (in both Sub-Saharan Africa and in Northeast Asia) up to 5.6% (in
North Africa). Total GDP contribution ranges from 6.4% in the Middle East up to 13.9% in
the Caribbean. What is interesting is that the total GDP impacts of tourism are (on
average) nearly three times as large as direct impacts whilst the range is not particularly
large i.e. from a 2.2 multiple in North Africa to a 3.9 multiple in Oceania. This could be
attributed to the depths of tourism linkages in the economy i.e. where links are greater,
total impacts would also be larger.
A study by Mitchell & Martins (2012) highlights examples where links are strong (i.e.
Mauritius and Morocco) and where they are weak (Cape Verde & Seychelles). Such links
are especially important where tourism destinations offer high value products as stronger
links equate to greater impacts. The data below suggests that regions such as Oceania
may have higher linkages (perhaps due to their remoteness and greater need for self-
reliance (as transport costs are higher), whilst regions such as North Africa (where
transport links are stronger) have weaker links. Alternatively they could reflect the set-up
of tourism industries i.e. regions more reliant on all-inclusive resorts may have weaker
links than regions where the tourism sector is more integrated in local areas.
Tourism Impacts: Evidence of Impacts on employment, gender, income
5
Table 3: Table 1: Direct and Total Effects of Tourism on GDP, 2013
Region
Direct Contribution
of Tourism to GDP
(%)
Total Contribution
of Tourism to GDP
(%)
Ratio of Total to
Direct Impacts
Caribbean 4.3 13.9 3.2
Europe 3.0 8.6 2.9
Latin America 3.2 8.8 2.8
Middle East 2.4 6.4 2.7
North Africa 5.6 12.1 2.2
North America 2.7 8.4 3.1
Northeast Asia 2.6 8.5 3.3
Oceania 2.8 10.8 3.9
South Asia 2.9 9.5 3.3
Southeast Asia 5.0 12.2 2.4
Sub-Saharan
Africa 2.6 6.9 2.7
Average 3.4 9.6 2.9
Source: WTTC (2014)
The data from the WTTC lacks information on the indirect impacts of tourism on growth.
Vellas (2011) discusses the importance of these indirect impacts of tourism within T20
countries1, where the indirect impacts of the sector account for 45% of tourisms
contributions to GDP. The analysis highlights that indirect impacts are stronger where
domestic tourism is more prevalent as well as in countries which have developed a high-
value tourism sector. Vellas (2013) provides a breakdown of tourism contributions to GDP,
both direct and indirect (as well as total contributions) and shows that indirect
contributions can range from around 1.6% (in India) up to 6.9% (in Australia). Hence, the
sector can make a significant contribution to growth, provided that investment to support
the sector (such as transport infrastructure, clean water, waste treatment) occurs.
Steck (2010) explains that the direct impacts of tourism affect the wider economy through
six main channels:
Employment Creation: Tourism activities generate employment through a
number of avenues i.e. hotel staff, tour operators, cooks etc.
Supply of Goods & Services: Local or national enterprises can supply goods and
services to tourism businesses, such as food or furniture, however these items
may also be imported if the local provision does not satisfy demand in either
terms of cost, quality or quantity.
Direct Sales of Goods & Services: Retailers in tourist destinations can sell their
products and services directly to tourists (i.e. souvenirs or food), directly
capturing the monetary gains of tourist activity.
Establishment of Tourism Enterprises: High (or increasing) levels of tourism
activity can lead to the establishment of new tourism enterprises, creating new
employment opportunities etc.
1The T20 is an initiative set up by the UNWTO which includes: Argentina, Australia, Brazil, Canada, China,
France, Germany, India, Indonesia, Italy, Japan, Mexico, Republic of Korea, Republic of South Africa, Russia, Saudi Arabia, Turkey, United Kingdom, United States of America, European Union & Spain (Permanent invitee)
Tourism Impacts: Evidence of Impacts on employment, gender, income
6
Tax & Levy Generation: Tourism enterprises contribute to national income
through taxes, whilst tourists can (and are often) be directly taxed, such as
through visa’s, further generating revenues for national or local governments.
Investment in Infrastructure: As the tourism sector expands its requirements
on local infrastructure will increase, which in turn pushes investment in
infrastructure either by private actors or by the public sector.
Employment
Turner & Sears (2014) state that the travel and tourism sector is a leading creator of
employment throughout the world, directly employing more than 98 million people (by
2013) and representing around 3% of total world employment, and indirectly creating one
out of every eleven jobs. WTTC (2014) estimates of the total contribution to employment
(both direct and indirect) place the sector’s contribution at around 266 million jobs in
2013.
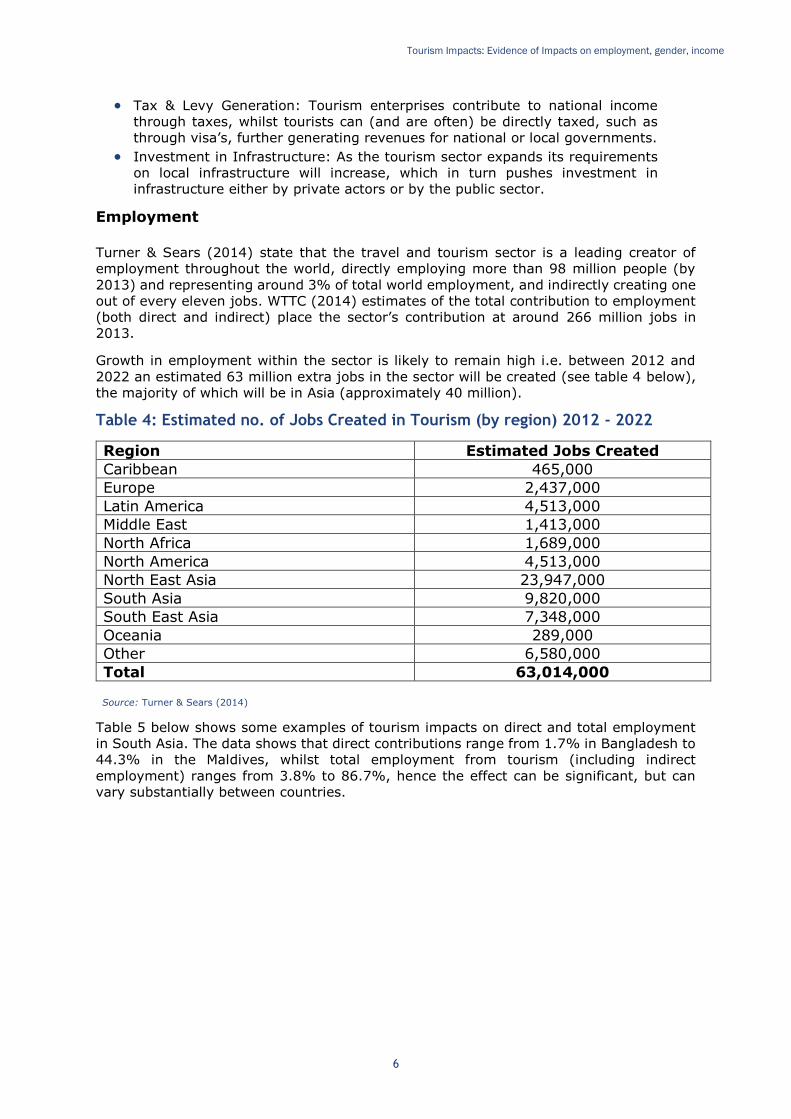
Growth in employment within the sector is likely to remain high i.e. between 2012 and
2022 an estimated 63 million extra jobs in the sector will be created (see table 4 below),
the majority of which will be in Asia (approximately 40 million).
Table 4: Estimated no. of Jobs Created in Tourism (by region) 2012 - 2022
Region Estimated Jobs Created
Caribbean 465,000
Europe 2,437,000
Latin America 4,513,000
Middle East 1,413,000
North Africa 1,689,000
North America 4,513,000
North East Asia 23,947,000
South Asia 9,820,000
South East Asia 7,348,000
Oceania 289,000
Other 6,580,000
Total 63,014,000
Source: Turner & Sears (2014)
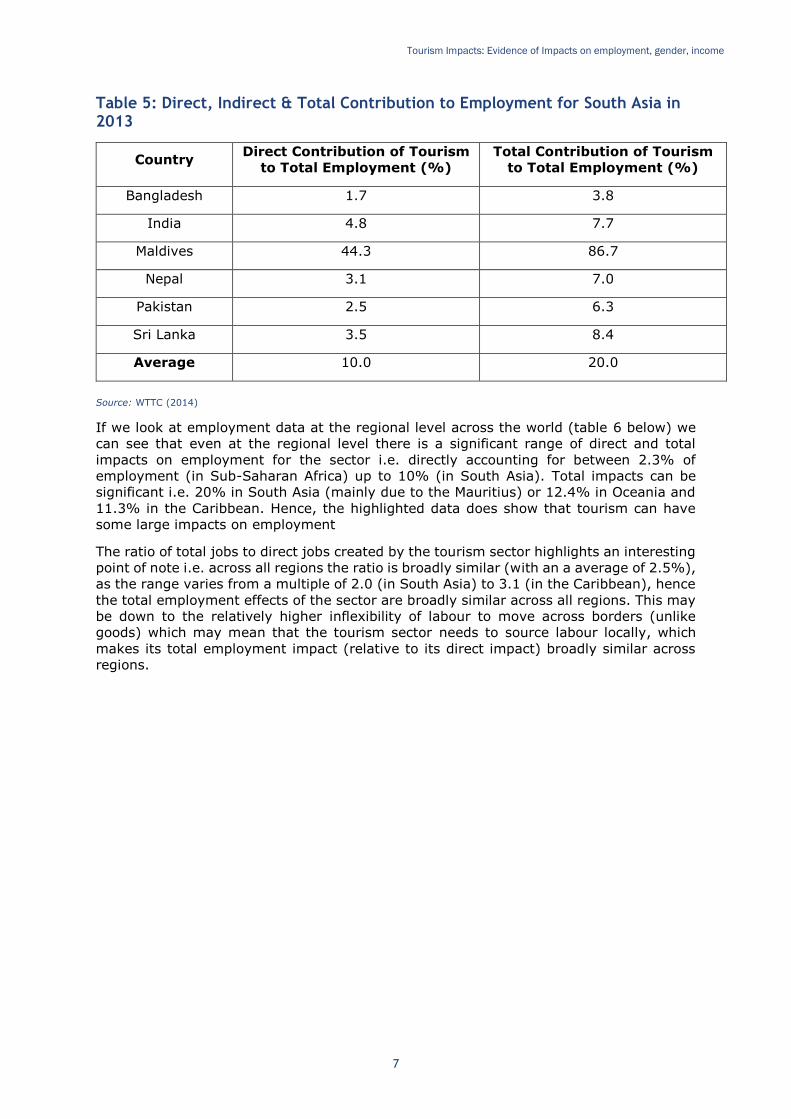
Table 5 below shows some examples of tourism impacts on direct and total employment
in South Asia. The data shows that direct contributions range from 1.7% in Bangladesh to
44.3% in the Maldives, whilst total employment from tourism (including indirect
employment) ranges from 3.8% to 86.7%, hence the effect can be significant, but can
vary substantially between countries.
Tourism Impacts: Evidence of Impacts on employment, gender, income
7
Table 5: Direct, Indirect & Total Contribution to Employment for South Asia in 2013
Country Direct Contribution of Tourism
to Total Employment (%)
Total Contribution of Tourism
to Total Employment (%)
Bangladesh 1.7 3.8
India 4.8 7.7
Maldives 44.3 86.7
Nepal 3.1 7.0
Pakistan 2.5 6.3
Sri Lanka 3.5 8.4
Average 10.0 20.0
Source: WTTC (2014)
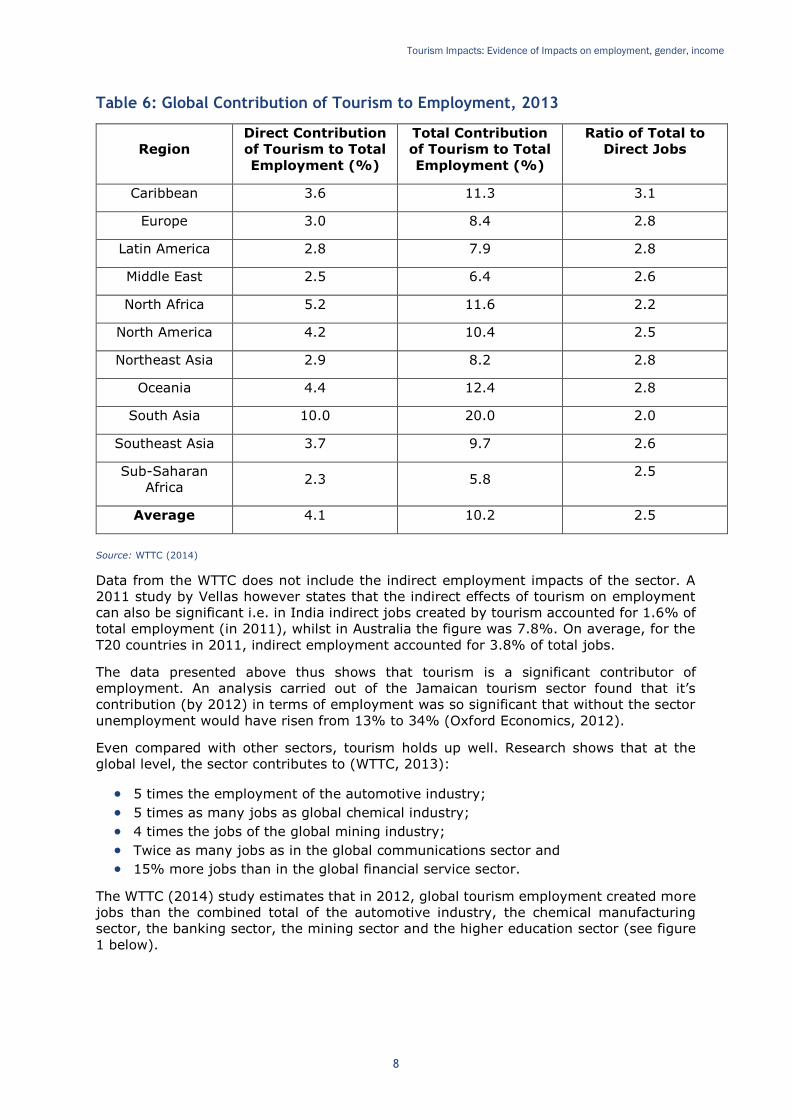
If we look at employment data at the regional level across the world (table 6 below) we
can see that even at the regional level there is a significant range of direct and total
impacts on employment for the sector i.e. directly accounting for between 2.3% of
employment (in Sub-Saharan Africa) up to 10% (in South Asia). Total impacts can be
significant i.e. 20% in South Asia (mainly due to the Mauritius) or 12.4% in Oceania and
11.3% in the Caribbean. Hence, the highlighted data does show that tourism can have
some large impacts on employment
The ratio of total jobs to direct jobs created by the tourism sector highlights an interesting
point of note i.e. across all regions the ratio is broadly similar (with an a average of 2.5%),
as the range varies from a multiple of 2.0 (in South Asia) to 3.1 (in the Caribbean), hence
the total employment effects of the sector are broadly similar across all regions. This may
be down to the relatively higher inflexibility of labour to move across borders (unlike
goods) which may mean that the tourism sector needs to source labour locally, which
makes its total employment impact (relative to its direct impact) broadly similar across
regions.
Tourism Impacts: Evidence of Impacts on employment, gender, income
8
Table 6: Global Contribution of Tourism to Employment, 2013
Region
Direct Contribution
of Tourism to Total
Employment (%)
Total Contribution
of Tourism to Total
Employment (%)
Ratio of Total to
Direct Jobs
Caribbean 3.6 11.3 3.1
Europe 3.0 8.4 2.8
Latin America 2.8 7.9 2.8
Middle East 2.5 6.4 2.6
North Africa 5.2 11.6 2.2
North America 4.2 10.4 2.5
Northeast Asia 2.9 8.2 2.8
Oceania 4.4 12.4 2.8
South Asia 10.0 20.0 2.0
Southeast Asia 3.7 9.7 2.6
Sub-Saharan
Africa 2.3 5.8
2.5
Average 4.1 10.2 2.5
Source: WTTC (2014)
Data from the WTTC does not include the indirect employment impacts of the sector. A
2011 study by Vellas however states that the indirect effects of tourism on employment
can also be significant i.e. in India indirect jobs created by tourism accounted for 1.6% of
total employment (in 2011), whilst in Australia the figure was 7.8%. On average, for the
T20 countries in 2011, indirect employment accounted for 3.8% of total jobs.
The data presented above thus shows that tourism is a significant contributor of
employment. An analysis carried out of the Jamaican tourism sector found that it’s
contribution (by 2012) in terms of employment was so significant that without the sector
unemployment would have risen from 13% to 34% (Oxford Economics, 2012).
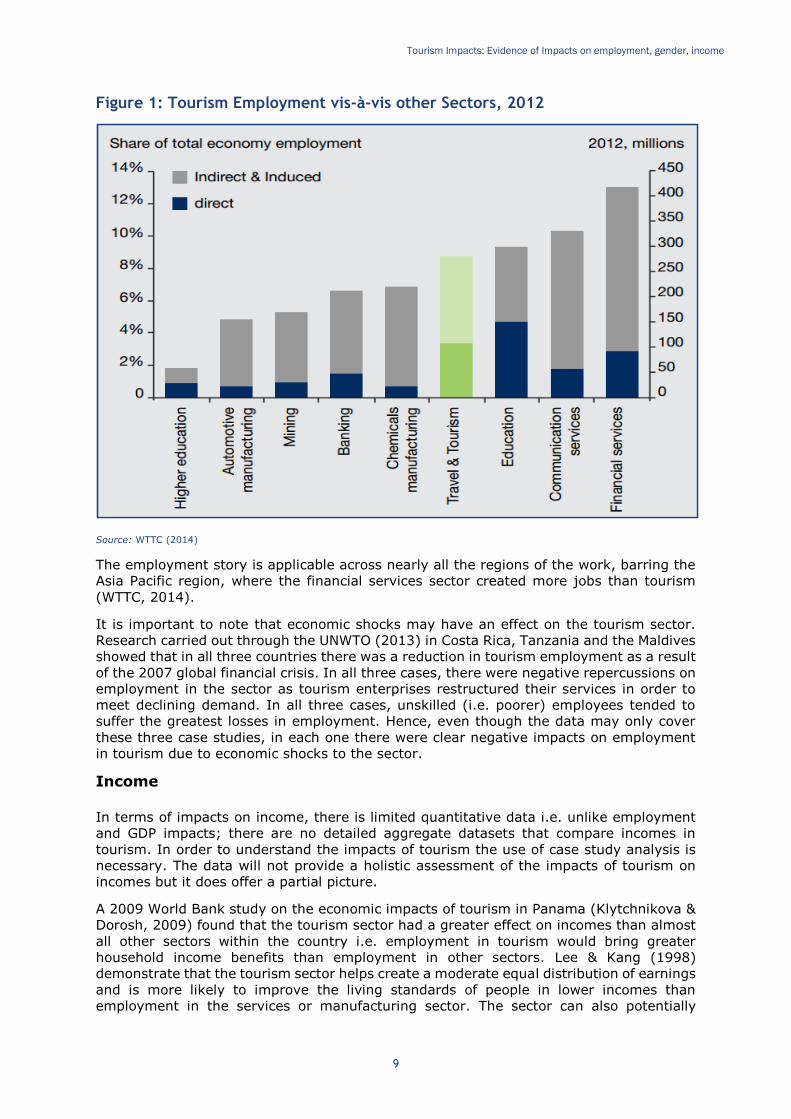
Even compared with other sectors, tourism holds up well. Research shows that at the
global level, the sector contributes to (WTTC, 2013):
5 times the employment of the automotive industry;
5 times as many jobs as global chemical industry;
4 times the jobs of the global mining industry;
Twice as many jobs as in the global communications sector and
15% more jobs than in the global financial service sector.
The WTTC (2014) study estimates that in 2012, global tourism employment created more
jobs than the combined total of the automotive industry, the chemical manufacturing
sector, the banking sector, the mining sector and the higher education sector (see figure
1 below).
Tourism Impacts: Evidence of Impacts on employment, gender, income
9
Figure 1: Tourism Employment vis-à-vis other Sectors, 2012
Source: WTTC (2014)
The employment story is applicable across nearly all the regions of the work, barring the
Asia Pacific region, where the financial services sector created more jobs than tourism
(WTTC, 2014).
It is important to note that economic shocks may have an effect on the tourism sector.
Research carried out through the UNWTO (2013) in Costa Rica, Tanzania and the Maldives
showed that in all three countries there was a reduction in tourism employment as a result
of the 2007 global financial crisis. In all three cases, there were negative repercussions on
employment in the sector as tourism enterprises restructured their services in order to
meet declining demand. In all three cases, unskilled (i.e. poorer) employees tended to
suffer the greatest losses in employment. Hence, even though the data may only cover
these three case studies, in each one there were clear negative impacts on employment
in tourism due to economic shocks to the sector.
Income
In terms of impacts on income, there is limited quantitative data i.e. unlike employment
and GDP impacts; there are no detailed aggregate datasets that compare incomes in
tourism. In order to understand the impacts of tourism the use of case study analysis is
necessary. The data will not provide a holistic assessment of the impacts of tourism on
incomes but it does offer a partial picture.
A 2009 World Bank study on the economic impacts of tourism in Panama (Klytchnikova &
Dorosh, 2009) found that the tourism sector had a greater effect on incomes than almost
all other sectors within the country i.e. employment in tourism would bring greater
household income benefits than employment in other sectors. Lee & Kang (1998)
demonstrate that the tourism sector helps create a moderate equal distribution of earnings
and is more likely to improve the living standards of people in lower incomes than
employment in the services or manufacturing sector. The sector can also potentially
Tourism Impacts: Evidence of Impacts on employment, gender, income
10
provide greater opportunities for income growth i.e. where people join the tourism sector
there seems to be higher upward mobility in employment skills and in wages than in other
sectors (WTTC, 2013).
The seasonality of tourism could also play a part in the sector’s income distribution. During
peak tourism season, income inequality (within the sector) tends to decrease whilst during
low seasons, income inequality tends to increase (Fernandez-Morales, 2003). Where the
tourism sector offers a greater variety of products, income inequality tends to be lower
than where the sectors offers more limited products (Fernandez-Morales, 2003). In
contrast, research by Perez-Dacal2 (2012), argues that seasonality may not have such
large income impacts on tourism wages but the specialisation of tourism activities may
actually have a positive impact on wages.
A study looking at tourism multiplier effects (Horvath & Frechtling, 1999), showed that
tourism had varied impacts on incomes across different countries i.e. in Australia (in
1984), tourism had a 25% greater effect on incomes than in Turkey (in the same year),
whilst in 1990, tourism’s effect on incomes in Bermuda were twice as large as in Samoa
(also for 1990). This suggests that income effects vary across countries.
In terms of rural incomes and livelihoods, a study by Tanrivermis & Sanli (2007) looking
at tourism in rural Turkey, found that the sector accrued for around a quarter of average
household incomes (26%) whilst the majority of household incomes (73.5%) was still
down to agricultural activities carried out by the region’s3 inhabitants. Similarly, Jamaican
tourism plays a large role in supplementing agricultural incomes within the country (Oxford
Economics, 2012).
A study by Shah & Gupta (2000) provides some anecdotal evidence on incomes, stating
that as a region’s tourism sector expands, there are increased opportunities for households
to benefit (i.e. supplement their incomes) from the sector through home-stay schemes,
however as the sector further develops, these home-stay initiatives are often supplanted
by lodges and hotels and the effects on local incomes depends on how high local
involvement is in these formal establishments 9i.e. higher involvement leads to increased
income capture at the local level).
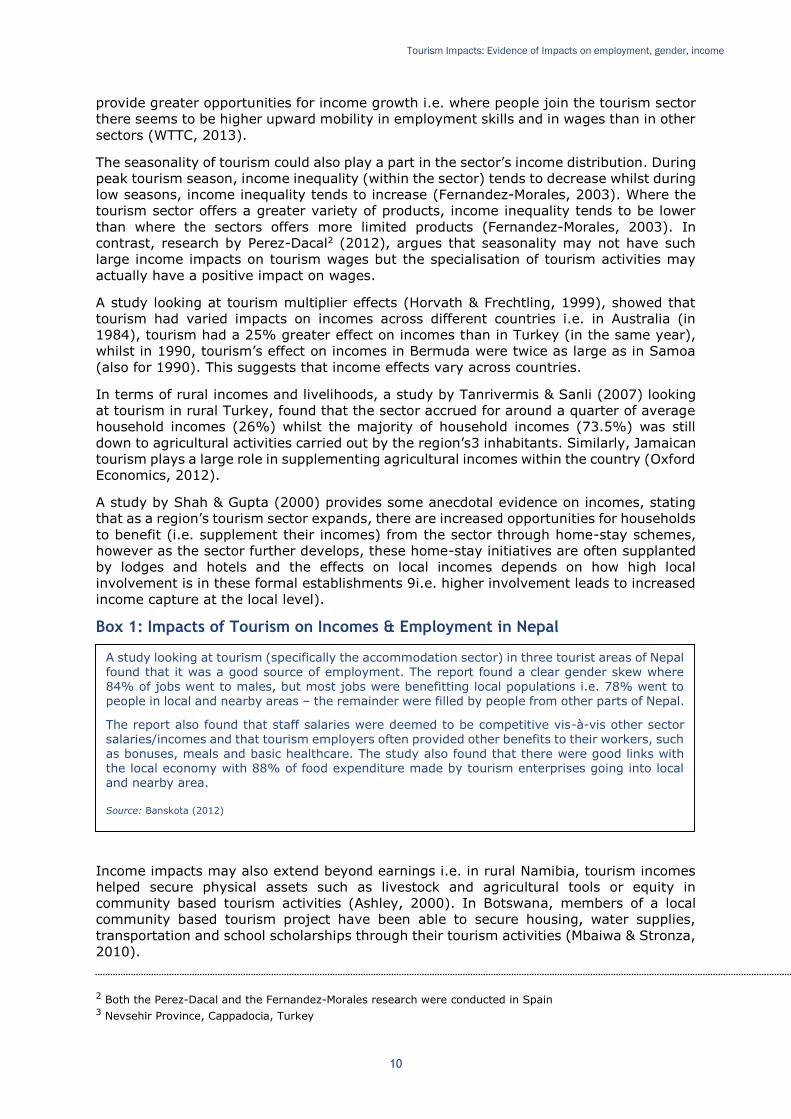
Box 1: Impacts of Tourism on Incomes & Employment in Nepal
Income impacts may also extend beyond earnings i.e. in rural Namibia, tourism incomes
helped secure physical assets such as livestock and agricultural tools or equity in
community based tourism activities (Ashley, 2000). In Botswana, members of a local
community based tourism project have been able to secure housing, water supplies,
transportation and school scholarships through their tourism activities (Mbaiwa & Stronza,
2010).
2 Both the Perez-Dacal and the Fernandez-Morales research were conducted in Spain 3 Nevsehir Province, Cappadocia, Turkey
A study looking at tourism (specifically the accommodation sector) in three tourist areas of Nepal found that it was a good source of employment. The report found a clear gender skew where 84% of jobs went to males, but most jobs were benefitting local populations i.e. 78% went to people in local and nearby areas – the remainder were filled by people from other parts of Nepal.
The report also found that staff salaries were deemed to be competitive vis-à-vis other sector salaries/incomes and that tourism employers often provided other benefits to their workers, such as bonuses, meals and basic healthcare. The study also found that there were good links with the local economy with 88% of food expenditure made by tourism enterprises going into local and nearby area.
Source: Banskota (2012)

Tourism Impacts: Evidence of Impacts on employment, gender, income
11
Poverty rates can also be affected by tourism but these are dependent on the structure of
the sector and its integration into the local economy i.e. in Zanzibar (Steck et al. 2010),
only 10% of tourism earnings go to poor people (as the sector mainly relies on imports).
On the other hand, in Panama, local households are able to access 56% of local tourism
income (Klytchnikova & Dorosh, 2009) whilst in Malaysia even though hotel owners
capture a large share of tourist expenditure (28%) vis-à-vis local businesses which capture
about 16%, local people can still capture around 34% of total tourism income (TPRG,
2009). In Costa Rica, tourism helps reduce poverty rates by between 1.5% to 3% (Rojas,
2009 and CEPAL, 2007).
Tourism Impacts: Evidence of Impacts on employment, gender, income
12
3 Impacts of Tourism on Gender
The UNWTO (2011) discuss the impacts of tourism on women. The report states a number
of key findings which include:
Women making up a larger proportion of the formal tourism workforce.
Women being well-represented in services and clerical jobs, but having limited
representation at professional levels.
Women typically earn 10% to 15% less than male counterparts.
Compared to other sectors, tourism has twice as many female employers.
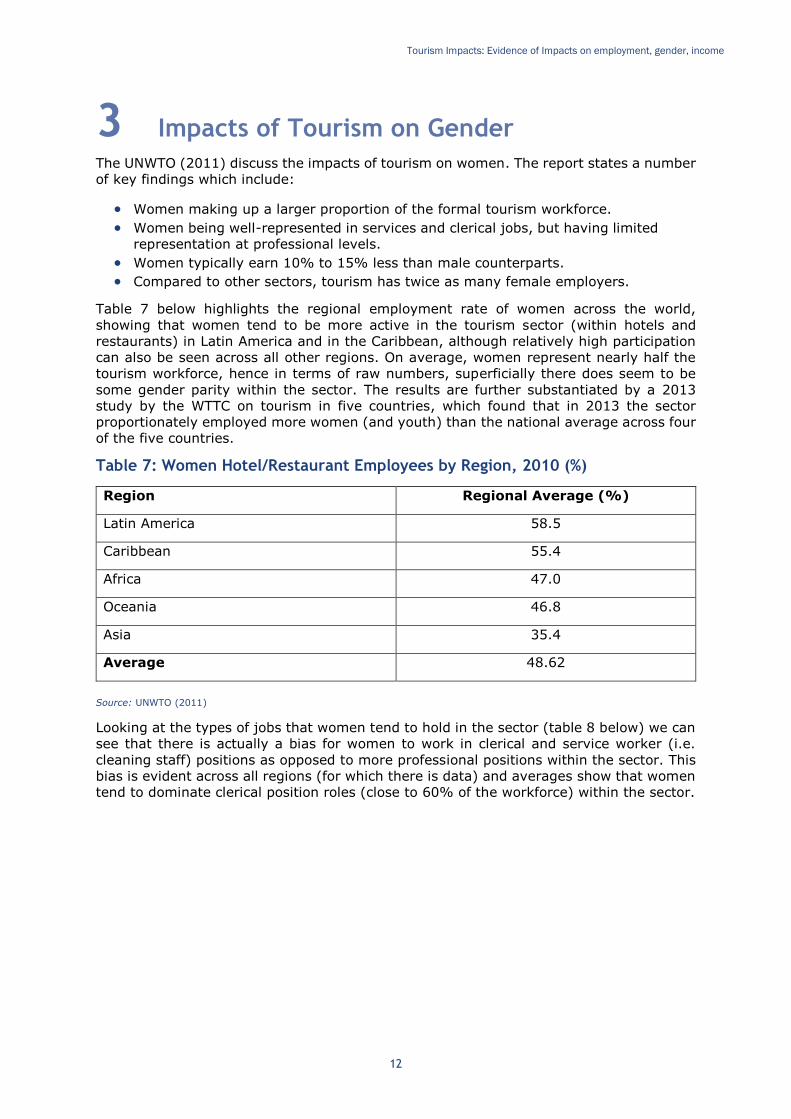
Table 7 below highlights the regional employment rate of women across the world,
showing that women tend to be more active in the tourism sector (within hotels and
restaurants) in Latin America and in the Caribbean, although relatively high participation
can also be seen across all other regions. On average, women represent nearly half the
tourism workforce, hence in terms of raw numbers, superficially there does seem to be
some gender parity within the sector. The results are further substantiated by a 2013
study by the WTTC on tourism in five countries, which found that in 2013 the sector
proportionately employed more women (and youth) than the national average across four
of the five countries.
Table 7: Women Hotel/Restaurant Employees by Region, 2010 (%)
Region Regional Average (%)
Latin America 58.5
Caribbean 55.4
Africa 47.0
Oceania 46.8
Asia 35.4
Average 48.62
Source: UNWTO (2011)
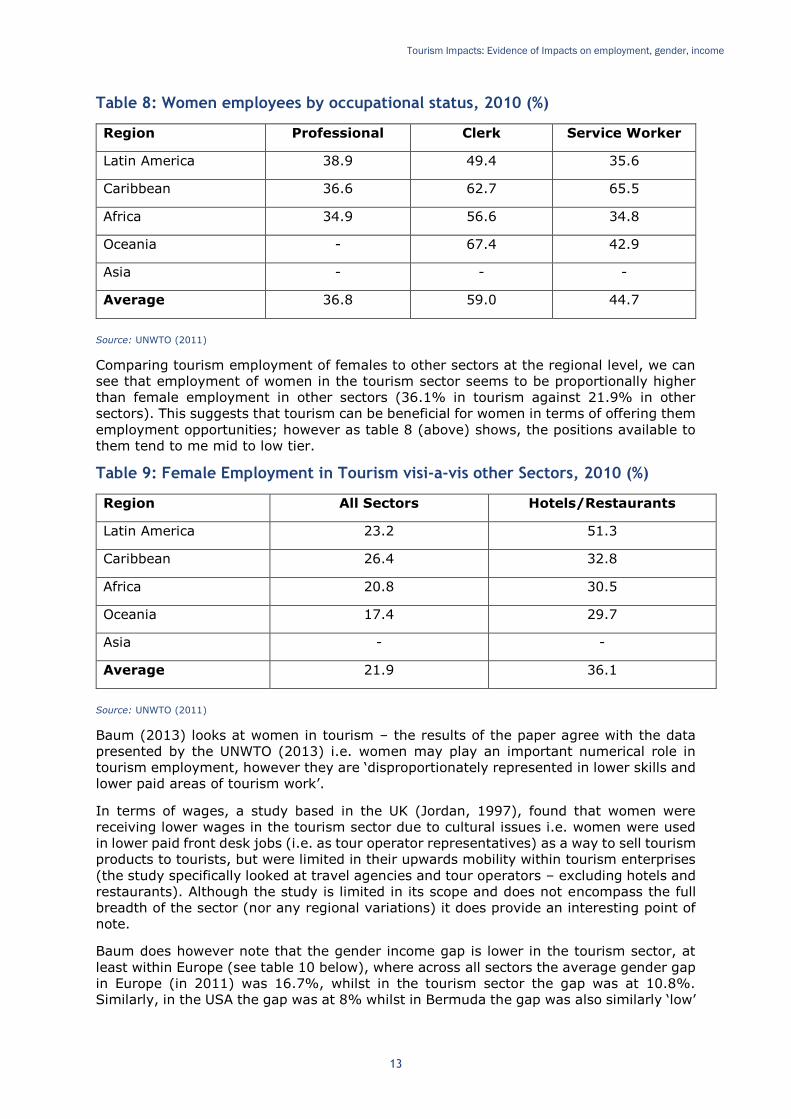
Looking at the types of jobs that women tend to hold in the sector (table 8 below) we can
see that there is actually a bias for women to work in clerical and service worker (i.e.
cleaning staff) positions as opposed to more professional positions within the sector. This
bias is evident across all regions (for which there is data) and averages show that women
tend to dominate clerical position roles (close to 60% of the workforce) within the sector.
Tourism Impacts: Evidence of Impacts on employment, gender, income
13
Table 8: Women employees by occupational status, 2010 (%)
Region Professional Clerk Service Worker
Latin America 38.9 49.4 35.6
Caribbean 36.6 62.7 65.5
Africa 34.9 56.6 34.8
Oceania - 67.4 42.9
Asia - - -
Average 36.8 59.0 44.7
Source: UNWTO (2011)
Comparing tourism employment of females to other sectors at the regional level, we can
see that employment of women in the tourism sector seems to be proportionally higher
than female employment in other sectors (36.1% in tourism against 21.9% in other
sectors). This suggests that tourism can be beneficial for women in terms of offering them
employment opportunities; however as table 8 (above) shows, the positions available to
them tend to me mid to low tier.
Table 9: Female Employment in Tourism visi-a-vis other Sectors, 2010 (%)
Region All Sectors Hotels/Restaurants
Latin America 23.2 51.3
Caribbean 26.4 32.8
Africa 20.8 30.5
Oceania 17.4 29.7
Asia - -
Average 21.9 36.1
Source: UNWTO (2011)
Baum (2013) looks at women in tourism – the results of the paper agree with the data
presented by the UNWTO (2013) i.e. women may play an important numerical role in
tourism employment, however they are ‘disproportionately represented in lower skills and
lower paid areas of tourism work’.
In terms of wages, a study based in the UK (Jordan, 1997), found that women were
receiving lower wages in the tourism sector due to cultural issues i.e. women were used
in lower paid front desk jobs (i.e. as tour operator representatives) as a way to sell tourism
products to tourists, but were limited in their upwards mobility within tourism enterprises
(the study specifically looked at travel agencies and tour operators – excluding hotels and
restaurants). Although the study is limited in its scope and does not encompass the full
breadth of the sector (nor any regional variations) it does provide an interesting point of
note.
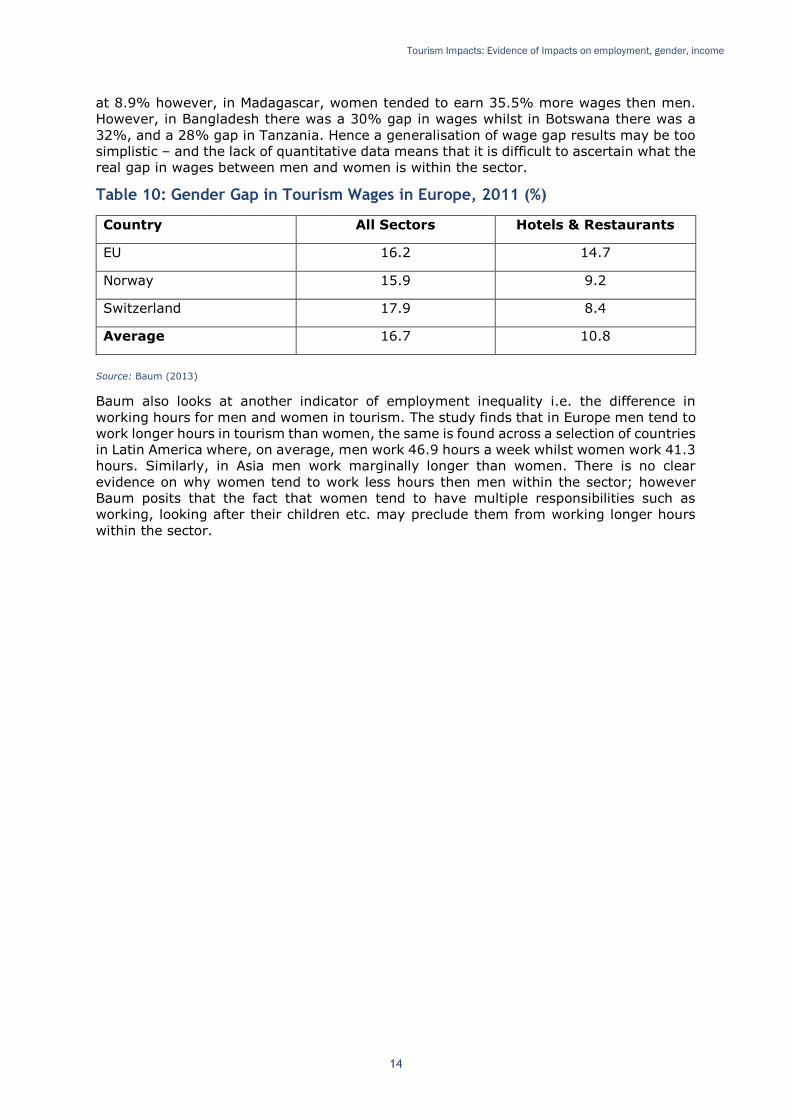
Baum does however note that the gender income gap is lower in the tourism sector, at
least within Europe (see table 10 below), where across all sectors the average gender gap
in Europe (in 2011) was 16.7%, whilst in the tourism sector the gap was at 10.8%.
Similarly, in the USA the gap was at 8% whilst in Bermuda the gap was also similarly ‘low’
Tourism Impacts: Evidence of Impacts on employment, gender, income
14
at 8.9% however, in Madagascar, women tended to earn 35.5% more wages then men.
However, in Bangladesh there was a 30% gap in wages whilst in Botswana there was a
32%, and a 28% gap in Tanzania. Hence a generalisation of wage gap results may be too
simplistic – and the lack of quantitative data means that it is difficult to ascertain what the
real gap in wages between men and women is within the sector.
Table 10: Gender Gap in Tourism Wages in Europe, 2011 (%)
Country All Sectors Hotels & Restaurants
EU 16.2 14.7
Norway 15.9 9.2
Switzerland 17.9 8.4
Average 16.7 10.8
Source: Baum (2013)
Baum also looks at another indicator of employment inequality i.e. the difference in
working hours for men and women in tourism. The study finds that in Europe men tend to
work longer hours in tourism than women, the same is found across a selection of countries
in Latin America where, on average, men work 46.9 hours a week whilst women work 41.3
hours. Similarly, in Asia men work marginally longer than women. There is no clear
evidence on why women tend to work less hours then men within the sector; however
Baum posits that the fact that women tend to have multiple responsibilities such as
working, looking after their children etc. may preclude them from working longer hours
within the sector.
Tourism Impacts: Evidence of Impacts on employment, gender, income
15
4 Impacts of Tourism on the Environment
In additional to tourism’s impact on national and local economies, the sector’s impacts
also has an environmental aspect that must be taken into account. The UNEP4 highlights
three main impact areas of tourism on the environment i.e. the depletion of natural
resources, pollution and tourism’s physical impacts.
Depletion of Natural Resources: Where tourism increases pressure on natural resources
where they may already be scarce, manifested through the use of water and the use of
local resources.
Water Resources: Overuse of water by tourism enterprises i.e. for tourist use, swimming
pools, garden maintenance etc. In dry regions, the use of water is particularly concerning
especially as tourists tend to consume twice as much water on holiday as they do at home
(440 litres against 220 litres), whilst the quantity of water used for a golf course in a year
is equivalent to its use by 60,000 rural villagers (UNEP, 2014). In some popular South
Asian resort areas, potable water is diverted away from local villages and supplied to
nearby hotels, leaving villagers only a few hours per day to use water (UNEP, 2011).
Tourism water use typically accounts for 5% of total national water use, although in some
countries it can be significantly higher i.e. around 40% in Mauritius or 35% in Cyprus
(Gossling et al. 2012).
Local Resources: Pressure on resources such as energy, food and raw materials can be
increased due to tourism. Increased use can affect their impact on local populations,
especially in peak seasons when demand for resources is higher. Tourism can also
negatively effect of biodiversity (UNEP, 2011), especially in coastal areas (such as coral
reefs or coastal wetlands), rainforests as well as arid and semi-arid regions and
mountainous areas. Trekking, over-fishing, the construction of tourism resorts etc. can all
contribute negatively to the biodiversity of these areas which can in-turn negatively affect
the attractiveness of such areas for tourism activities. Trekking tourists in Nepal, for
example, can use up to 5kg of wood (each) per day during treks, which compounds the
effects of deforestation, which are already severe in Nepal (UNEP, 2014).
Pollution: Tourism can contribute to pollution in the same way as many other economic
sectors i.e. through air pollution, solid waste and wastewater.
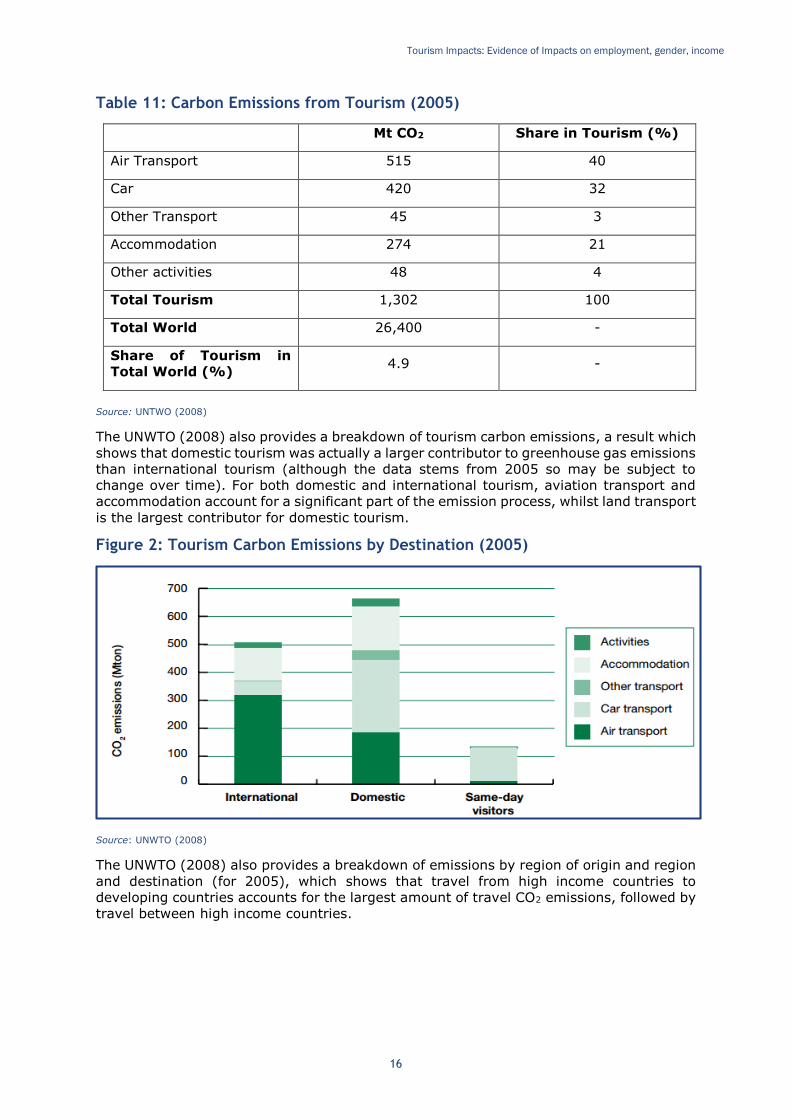
Air & Noise Pollution: Increases in tourist numbers (and subsequent demand in tourism
travel demand) means that the sector is becoming an increasingly important source of
emissions. The UNWTO (2008) has undertaken an analysis of the impact of tourism on
carbon emissions based on 2005 data. Table 11 below shows the results of estimated
emissions in 2005, highlighting how the sector (globally) accounted for close to 5% of total
carbon emissions.
4
http://www.unep.org/resourceefficiency/Business/SectoralActivities/Tourism/TheTourismandEnvironmentProgramme/FactsandFiguresaboutTourism/ImpactsofTourism/EnvironmentalImpacts/TourismsThreeMainImpactAreas/tabid/78776/Default.aspx
Tourism Impacts: Evidence of Impacts on employment, gender, income
16
Table 11: Carbon Emissions from Tourism (2005)
Mt CO2 Share in Tourism (%)
Air Transport 515 40
Car 420 32
Other Transport 45 3
Accommodation 274 21
Other activities 48 4
Total Tourism 1,302 100
Total World 26,400 -
Share of Tourism in
Total World (%) 4.9 -
Source: UNTWO (2008)
The UNWTO (2008) also provides a breakdown of tourism carbon emissions, a result which
shows that domestic tourism was actually a larger contributor to greenhouse gas emissions
than international tourism (although the data stems from 2005 so may be subject to
change over time). For both domestic and international tourism, aviation transport and
accommodation account for a significant part of the emission process, whilst land transport
is the largest contributor for domestic tourism.
Figure 2: Tourism Carbon Emissions by Destination (2005)
Source: UNWTO (2008)
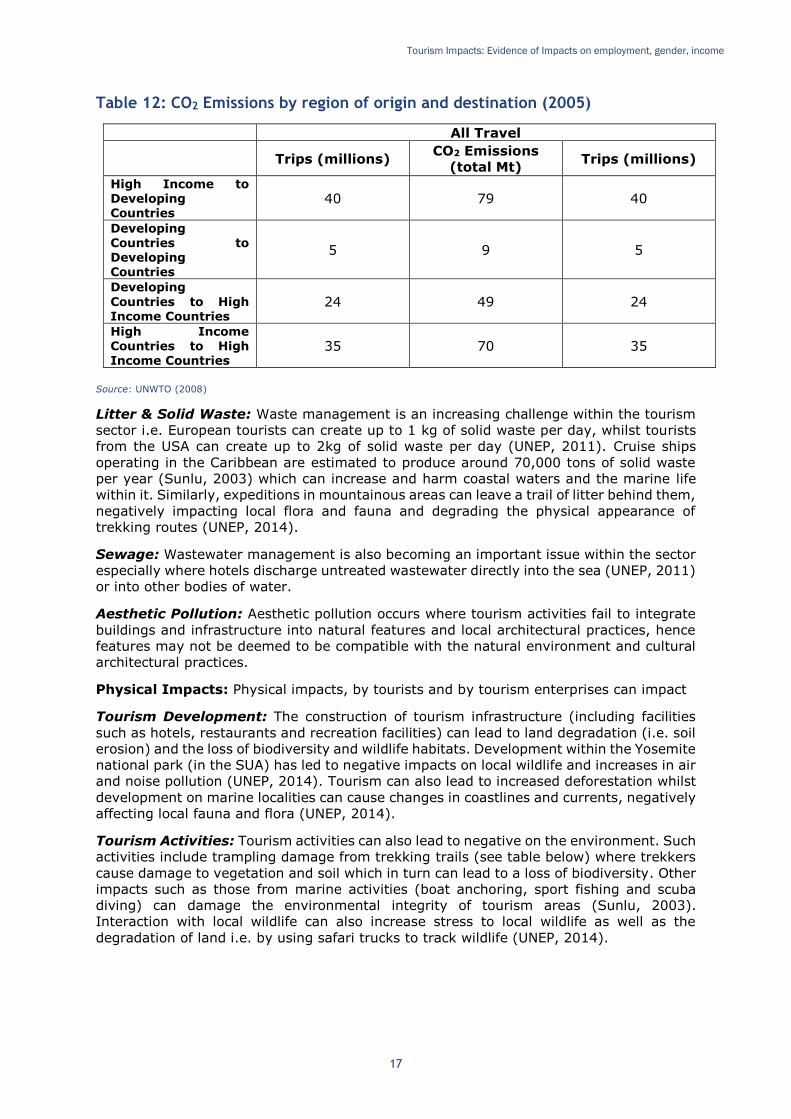
The UNWTO (2008) also provides a breakdown of emissions by region of origin and region
and destination (for 2005), which shows that travel from high income countries to
developing countries accounts for the largest amount of travel CO2 emissions, followed by
travel between high income countries.
Tourism Impacts: Evidence of Impacts on employment, gender, income
17
Table 12: CO2 Emissions by region of origin and destination (2005)
All Travel
Trips (millions)
CO2 Emissions
(total Mt) Trips (millions)
High Income to Developing Countries
40 79 40
Developing Countries to Developing Countries
5 9 5
Developing
Countries to High Income Countries
24 49 24
High Income
Countries to High Income Countries
35 70 35
Source: UNWTO (2008)
Litter & Solid Waste: Waste management is an increasing challenge within the tourism
sector i.e. European tourists can create up to 1 kg of solid waste per day, whilst tourists
from the USA can create up to 2kg of solid waste per day (UNEP, 2011). Cruise ships
operating in the Caribbean are estimated to produce around 70,000 tons of solid waste
per year (Sunlu, 2003) which can increase and harm coastal waters and the marine life
within it. Similarly, expeditions in mountainous areas can leave a trail of litter behind them,
negatively impacting local flora and fauna and degrading the physical appearance of
trekking routes (UNEP, 2014).
Sewage: Wastewater management is also becoming an important issue within the sector
especially where hotels discharge untreated wastewater directly into the sea (UNEP, 2011)
or into other bodies of water.
Aesthetic Pollution: Aesthetic pollution occurs where tourism activities fail to integrate
buildings and infrastructure into natural features and local architectural practices, hence
features may not be deemed to be compatible with the natural environment and cultural
architectural practices.
Physical Impacts: Physical impacts, by tourists and by tourism enterprises can impact
Tourism Development: The construction of tourism infrastructure (including facilities
such as hotels, restaurants and recreation facilities) can lead to land degradation (i.e. soil
erosion) and the loss of biodiversity and wildlife habitats. Development within the Yosemite
national park (in the SUA) has led to negative impacts on local wildlife and increases in air
and noise pollution (UNEP, 2014). Tourism can also lead to increased deforestation whilst
development on marine localities can cause changes in coastlines and currents, negatively
affecting local fauna and flora (UNEP, 2014).
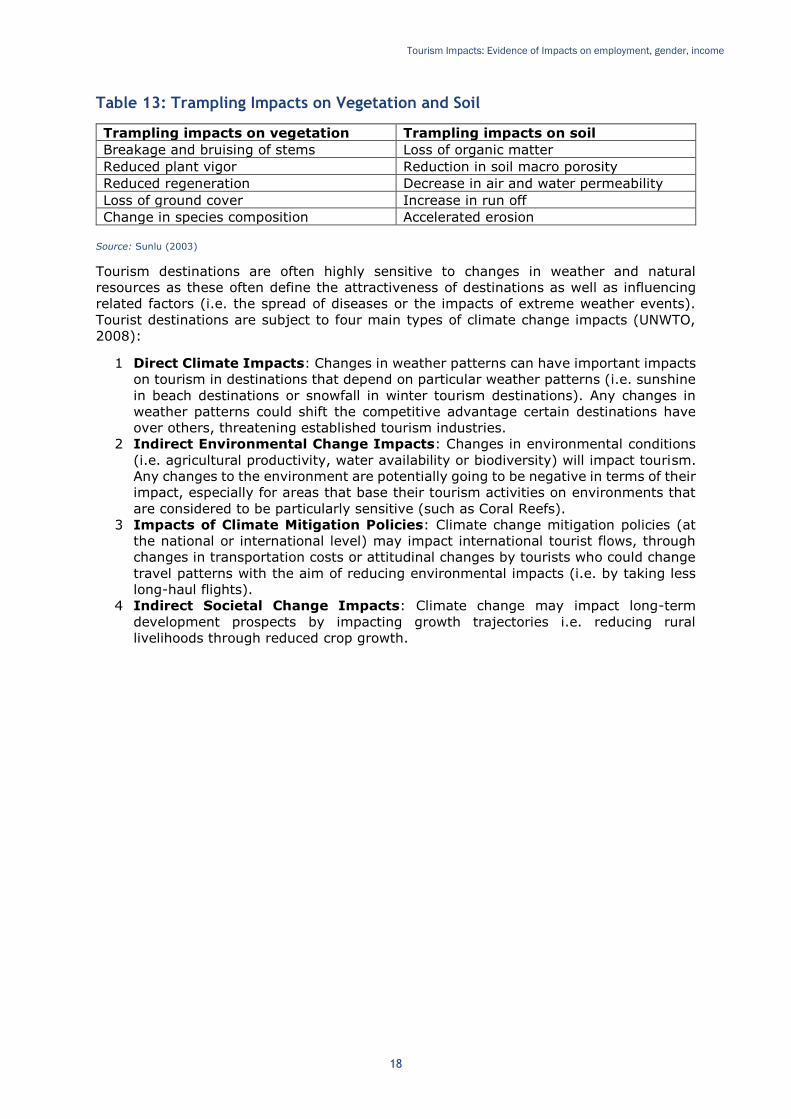
Tourism Activities: Tourism activities can also lead to negative on the environment. Such
activities include trampling damage from trekking trails (see table below) where trekkers
cause damage to vegetation and soil which in turn can lead to a loss of biodiversity. Other
impacts such as those from marine activities (boat anchoring, sport fishing and scuba
diving) can damage the environmental integrity of tourism areas (Sunlu, 2003).
Interaction with local wildlife can also increase stress to local wildlife as well as the
degradation of land i.e. by using safari trucks to track wildlife (UNEP, 2014).
Tourism Impacts: Evidence of Impacts on employment, gender, income
18
Table 13: Trampling Impacts on Vegetation and Soil
Trampling impacts on vegetation Trampling impacts on soil
Breakage and bruising of stems Loss of organic matter
Reduced plant vigor Reduction in soil macro porosity
Reduced regeneration Decrease in air and water permeability
Loss of ground cover Increase in run off
Change in species composition Accelerated erosion
Source: Sunlu (2003)
Tourism destinations are often highly sensitive to changes in weather and natural
resources as these often define the attractiveness of destinations as well as influencing
related factors (i.e. the spread of diseases or the impacts of extreme weather events).
Tourist destinations are subject to four main types of climate change impacts (UNWTO,
2008):
1 Direct Climate Impacts: Changes in weather patterns can have important impacts
on tourism in destinations that depend on particular weather patterns (i.e. sunshine
in beach destinations or snowfall in winter tourism destinations). Any changes in
weather patterns could shift the competitive advantage certain destinations have
over others, threatening established tourism industries.
2 Indirect Environmental Change Impacts: Changes in environmental conditions
(i.e. agricultural productivity, water availability or biodiversity) will impact tourism.
Any changes to the environment are potentially going to be negative in terms of their
impact, especially for areas that base their tourism activities on environments that
are considered to be particularly sensitive (such as Coral Reefs).
3 Impacts of Climate Mitigation Policies: Climate change mitigation policies (at
the national or international level) may impact international tourist flows, through
changes in transportation costs or attitudinal changes by tourists who could change
travel patterns with the aim of reducing environmental impacts (i.e. by taking less
long-haul flights).
4 Indirect Societal Change Impacts: Climate change may impact long-term
development prospects by impacting growth trajectories i.e. reducing rural
livelihoods through reduced crop growth.
Tourism Impacts: Evidence of Impacts on employment, gender, income
19
5 Conclusions
Tourism impacts economies through three interrelated routes i.e. direct, indirect and
induced effects. Direct impacts are those impacts that occur as a direct result of tourism
activities i.e. tourist spending, employment by the tourism sector and taxes paid by tourist
activities. Indirect impacts occur due to the effect of tourism activities on other economic
sectors i.e. hotels purchasing goods from retailers or sourcing food from producers.
Induced effects are the changes in economic activity that occur from households
benefitting from the tourism sector i.e. tourism employees paying taxes or spending
money on local goods and services. These impacts and the structure of the tourism sector
determine the sectors economic impact on a country.
Overall the section shows that there is a clear positive impact on growth by the tourism
sector – data on the direct and total impacts of the tourism sector shows strong positive
economic effects. What the data is missing, however, is the distribution of these effects in
terms of equality.
Much like the impact of tourism on growth, its impact on employment is also positive.
Overall tourism (globally) contributes to a significant amount of jobs and also compares
favourably vis-à-vis other significant sectors such as the extractive sector, the financial
sector and the automobile construction sector. The extent of its impacts varies by country
and by tourism’s predominance within it, but overall it is a net contributor to employment.
Tourism’s effect on incomes is harder to quantify than growth and employment, mainly
due to a limited amount of data and the global level. The available case study data does
highlight that tourism has a positive impact on incomes, both in monetary terms and in
non-monetary terms (especially for rural households that participate in the sector). The
sector also seems to positively impact livelihoods and poverty.
Whilst there the data on the impacts of tourism on growth and employment is good enough
to understand the ‘raw’ impacts of the sector, the limited available data (especially at the
global level) for incomes, livelihood and poverty effects means that the sector’s impacts
on equality are harder to effectively measure and monitor.
In terms of gender impacts, the sector shows that there are both positive and negative
impacts to female employment within tourism. The sector tends to employ more women
than other productive sectors, however there seems to be disparities both in the position
that women occupy as well as the wages that women earn i.e. women tend to occupy mid
to low skill positions and also tend to earn lower wages. The data evidence of gender
impacts seems to be strong in terms of the quantitative impacts of the sector i.e. the
number of women employed in the sector and the positions that they hold, but seem to
be less strong when taking into account wages and working hours, where limited country
evidence dominates impact measurement.
The environmental impacts of tourism are harder to effectively quantify due to a limited
availability of data on impacts. Tourism greenhouse gas emission data is available,
however it is nearly a decade old (2005) and there is limited data on other environmental
impacts of the sector such as waste, deforestation, land degradation etc. Anecdotal
evidence does however suggest that tourism can have negative environmental impacts,
as demand for the sector increases so does demand for travel, in turn increasing GHG
emissions. Similarly, tourists tend to use larger amounts of resources (water, energy) than
local people, which can be problematic where these resources are scarce.
Tourism Impacts: Evidence of Impacts on employment, gender, income
20
References Ashley, C. (2000) “The Impacts of Tourism on Rural Livelihoods: Namibia’s Experience” ODI Working Paper 128,
February 2000
Banskota, K (2012) “Impact of Tourism on Local Employment and Incomes in Three Selected Destinations: Case Studies of Sauraha, Nagarkot and Bhaktapur” Nepal Tourism and Development Review 2, 2012
Baum, T (2013) “International Perspectives on Women and Work in Hotels, Catering and Tourism” ILO, 2013
CEPAL (2007) “Turismo y Condiciones Sociales en Centroamerica: Las Experencias en Costa Rica y Nicaragua” ECLAC, 2007
Fernandez-Morales, A (2003) “Decomposing Seasonal Concentration” Annals of Tourism Research, Vol. 30 No.4, 2003
Gossling, S. Peeters, P. Hall, M.C. Ceron, JP. Dubois, G. Lehmann, LV. & Scott, D. (2012) “Tourism and Water Use: Supply, Demand and Security. An International Review” Progress in Tourism Management, No. 33 (2012)
Horvath, E & Frechtling, DC (1999) “Estimating the Multiplier Effects of Tourism Expenditures on a Local Economy Through a Regional Input-Output Model” Journal of Traveo Research, Vol. 37, No. 4, May 1999
Jordan, F (1997) “An Occupational Hazard? Sex Segregation in Tourism Employment” Tourism Management, Vol. 18, No. 8, 1997
Klytchnikova, II & Dorosh, PA (2009) “How Tourism can (and does) benefit the poor and the environment – A case study from Panama” World Bank, Enbreve Responsible Tourism Series, August 2009, No. 146
Lee C & Kang, S (1998) “Measuring earnings inequality and median earnings in the tourism industry” Tourism Management, Vol. 19 No. 4, 1998
Mbaiwa, JE & Stronza, AL (2010) “The effects of tourism development on rural livelihoods in the Okavango Delta, Botswana” Journal of Sustainable Tourism, Vol. 18, No. 5, June 2010
Mitchell, J & Martins, P (2012) “Pro-Poor Tourism Linkages in Cape Verde” ODI, May 2012
Oxford Economics (2012) “Travel & Tourism as a Driver of Economic Development in Jamaica” Oxford Economics, 2012
Perez-Dacal, D (2012) “The role of seasonality and tourism specialisation in wages and employment” University of Santiago de Campostela, 2012
Rojas, L (2009) “The Evolution and Importance of Tourism in costa Rica” Estado de la Nacion en Desarrollo Sostenible, San Jose’
Shah, K & Gupta, V (2000) “Tourism, the Poor and Other Stakeholders: Experience in Asia” ODI & Tourism Concern, 2000
Steck, B (2010) “Tourism: More Value for Zanzibar” SNV, February 2010
Sunlu, U (2003) “Environmental Impacts of Tourism” in Local Resources and Global Trades: Environments and Agriculture in the Mediterranean Region Camarda, D & Grassini, L (eds.), 2003
Tanrivermis, H & Sanli, H (2007) “A Research on the Impacts of Tourism on Rural Household Income and Farm Enterprises: The Case of the Nevsehir Province of Turkey” Journal of Agriculture and Rural development in the Tropics and Subtropics, Vol. 108, No. 2, 2007
TPRG (2009) “The Application of Value Chain Analysis to Measure Economic Benefits at Tanjong Piai, Pontian and Johor” Tourism Planning Research Group, Universiti Teknologi Malysia
Turner, R & Sears, Z (2014) “Travel & Tourism as a Driver of Employment Growth” in The Travel & Tourism Competitiveness Report 2013 World Economic Forum, 2014
UNEP (2011) “Tourism: Investing in Energy and Resource Efficiency” Part of the 2011 UNEP Green Economy Report, UNEP 2011
UNEP (2014) “Tourism’s Three Main Impact Areas” accessed in July 2014 at:
http://www.unep.org/resourceefficiency/Business/SectoralActivities/Tourism/TheTourismandEnvironmentProgramme/FactsandFiguresaboutTourism/ImpactsofTourism/EnvironmentalImpacts/TourismsThreeMainImpactAreas/tabid/78776/Default.aspx

Tourism Impacts: Evidence of Impacts on employment, gender, income
21
UNWTO (2008) “Climate Change & Tourism: Responding to Global Challenges” UNWTO, 2008
UNWTO (2011) “Global Report on Women in Tourism 2010: Preliminary Findings” United Nations World Tourism Organisation, 2011
UNWTO (2013) “Economic Crisis, International Tourism Decline and its Impact on the Poor” UNWTO, 2013
Vellas, F (2011) “The Indirect Impact of Tourism: An Economic Analysis” Paper prepared for the Third Meeting of T20 Tourism Ministers, Paris, France, October 2011
WTTC (2012) “Methodology for Producing the 2012 WTTC/Oxford Economics Travel & Tourism Economic Impact Research”, March 2012
WTTC (2013) “The Comparative impact of Travel & Tourism – Executive Summary, November 2013” WTTC, November 2013
WTTC (2014) The WTTC Data Research Tool at:
http://www.wttc.org/research/economic-data-search-tool/
Tourism Impacts: Evidence of Impacts on employment, gender, income
22
Annex: A Note on the WTTC Methodology
Number of Jobs Generated: The WTTC estimates tourism contribution to employment by looking at tourisms direct share of GDP as well as an estimate of the relative productivity of the tourism sector vis-à-vis the rest
of the economy. The methodology finds that less-developed countries tend to have higher productivity rates for tourism than other sectors.
Tourism’s Contribution to GDP:
o Direct: The WTTC calculates tourism’s direct contribution to GDP “as the sum of the demand components making up tourism consumption
(personal domestic Travel & Tourism spending, business domestic Travel & Tourism spending, foreign visitor Travel & Tourism spending and government individual Travel & Tourism spending) minus supply-chain
purchases (including imports) by Travel & Tourism providers” (WTTC, 2012).
o Indirect: In regards to tourism’s indirect contribution this is calculated through an input-output approach that relates the output of each industry to the components of the tourism sector. The approach weighs the ratio
of value added to output in these industries and divides the output equivalent of tourism consumption into the industry’s own direct value
added as well as the indirect value added of other industries in the supply chain.
o Total: The concept of tourism’s total contribution to GDP includes tourism consumption, its associated supply-chain value added as well as the goods and services that are produced on behalf of the tourism industry
by government spending and fixed investment. It also includes the induced effects of tourism through the spending of workers directly and
indirectly employed in the industry.
The WTTC states that for non-OECD countries, where the required national accounts data
necessary to estimate tourism’s wider contribution to GDP may not be readily available,
the relationship between tourism and other economic variables is based on data from
existing Tourism Satellite Accounts as well as appropriate tourism and economic indicators
that are available across all countries.
Source: WTTC (2012)