total organic carbon (toc) of the surface … · content in the surface sediments revealed values...
TRANSCRIPT

121Geo-Eco-Marina 18/2012
1. INTRODUCTION
One of the most important regions particularly affected by eutrophication, in ’80s–half ’90s was the North Western part of the Black Sea (MEE, 1992, Gomoiu, 1992, Gomoiu, 1983). The increased Danube’s nutrients input led to eu-trophication and its effects (Gomoiu, 1992) such as seasonal hypoxia or even anoxia of the bottom waters, resulting tons of dead plants and benthic animals (ICPDR-ICBS, 1999). The first signs of recovery occurred in the early ’90s, together with the decreased nutrients input. Thus, in 2005, the North West-ern part seemed to contain a strongly affected ecosystem as compared to the ’60s, but relatively functional (BSC, 2007). The disturbances symptoms, such as the incapacity of the system to recycle the high organic load received/produced in some areas and continuing dominance of mono-specific phytoplankton blooms in other areas were still evident, coastal and shelf Black Sea waters being still predominantly eutrophic (BSC, 2007).
Since most of marine organic carbon comes from pho-tosynthetic fixation of CO2 by phytoplankton, the nutrients excess from human activities represents an issue for many water bodies from shallow, coastal zone. High concentrations of nutrients can increase phytoplankton growth and, conse-quently, the sedimentation of debris. Thus, in eutrophic envi-ronments, the amount of organic matter deposited exceeds the assimilative capacity of the sediments, leading to low oxygen concentrations or anoxia in bottom areas, influenc-ing the biodiversity of the ecosystem. It was observed that, generally, the sediments from anoxic areas contain larger amount of organic matter as a consequence of increased productivity which could lead to oxygen depletion. Other organic carbon sources from marine environment could be: land-based sources (organic matter mainly transported by rivers and atmospheric deposition); decay of dead organisms decomposition; excretion of extra cellular products by algae which liberate appreciable proportions of the compounds produced by photosynthesis into the water; excretions of
TOTAL ORGANIC CARBON (TOC) OF THE SURFACE LAYER SEDIMENTS COVERING THE SEAFLOOR
OF THE ROMANIAN BLACK SEA COAST
Luminiţa LaZĂR(1), maRian - TRaian GOmOiu(2), LauRa BOiCEnCO(1), Dan VaSiLiu(2) (1) National Institute for Marine Research and Development „Grigore Antipa”, Constanţa, Romania, [email protected]
(2) National Research and Development Institute for Marine Geology and Geoecology – GeoEcoMar, Constanţa Branch, Romania
Abstract. The paper presents the distribution of the Total Organic Carbon (TOC) in the surface layer sediments of the Black Sea Romanian shelf, since Sep-tember 2009 to September 2010. The study is based on the analysis of samples from 21 stations. The results have led to the following conclusions: the TOC content in the surface sediments revealed values in the range „undetectable“ up to 14.94% (mean 3.38%, median 3.28%, standard deviation 2.70%). The values generally highlighted a gradient increasing with distance from the shore and, at the same time, nearby the Danube’s mouths, with the fine sediment fractions increase. Statistically, the TOC content of the stations under the direct influence of the river discharge was significantly higher in 2010 than 2009, due to the historical raised flow of the Danube. The spatial and temporal distribution of TOC content showed also high values in the Constanța area, in late summer, due to the increased river discharge in 2010, algal blooms and the anthropogenic influence of the wastewater treatment plants.
Key words: Black Sea, Total Organic Carbon, Surface sediments, Eutrophication
122 Geo-Eco-Marina 18/2012
Luminiţa Lazăr, Marian - Traian Gomoiu, Laura Boicenco, Dan Vasiliu – Total Organic Carbon (TOC) of the surface layer sediments covering the seafloor
zooplankton and marine animals, etc. may be an impor-tant source of dissolved organic matter (Kordel et al., 1997). Through the direct effect on the redox potential of sediment, total organic carbon has a major influence on chemical and biological processes occurring in sediments, including the regulation of the behavior of the other chemical species such as metals and organic pollutants. Therefore, determination of total organic carbon, TOC, (a measure of one of the basic chemical components of organic matter, used as an indicator of its presence in the sediment) is an essential component of environmental characterization analysis.
In this paper we report TOC accumulation in superficial sediments from the continental shelf of the North Western Black Sea (21 sites) after some extreme events from years 2009 and 2010. The dataset is supplemented with discus-sions about some influencing factors of the phenomenon at the Romanian littoral.
2. STUDY SITE AND METHODSThe Black Sea is one of the biggest semi-enclosed sea of
the world with area 432.000 km2, maximum depth 2.212 m and total volume of the water 547.000 km3 [25], of which ap-proximately 80% anoxic and containing hydrogen sulphide, H2S (Panin, 2008). Its hydro graphic basin has 2.400.000 km2 and 160 millions inhabitants (Panin, 2008; BSC, 2008; ICPDR, 2005). The total length of the coastal zone is 4340 km and is shared by six riparian countries: Bulgaria (300 km), Georgia (310 km), Romania (225 km), Russia (475 km), Turkey (1400 km) and Ukraine (1628 km) [25]. The Black Sea receives annu-ally a considerable freshwater input from the rivers: Danube, Dniepr, Dniestr, Southern Bug, Don and Kuban (Teodoru et al., 2007). The most important contribution comes from the Danube (55%), the second riverine basin from Europe, ap-proximately 33% from the Black Sea basin, representing 19 countries territory (ICPDR, 2005). The Danube crosses 2857 km from spring to the Black Sea where it flows with an aver-age rate of 194 km3/y from the total freshwater input of 350 km3/y (Panin, 2008; ICPDR, 2005; Mee and Topping, 1999) in-fluencing significantly the hydrography, chemistry and biol-ogy of the entire North Western part of the Black Sea (Mee and Topping, 1999).
The actual study was carried in September 2009–Sep-tember 2010, as part of the National Project “The influence of river input on the chemical composition and trophic status of Romanian transitional and coastal waters in order to imple-ment Water Framework and the Marine Strategy Directives” coordinated by National Institute for Marine Research and Development “Grigore Antipa”.
Seawater (N = 116) and sediments (N = 65) samples were collected from 21 stations in 5 cruises (on September 2009, February, March, July, and September 2010) done with the R/V “Steaua de Mare” along the Black Sea Romanian littoral. Emphasis was given to the stations in front of the main land based pollution sources such as: the Danube’s mouths and
wastewater treatment plants from Constanța, Eforie and Mangalia, all located in characteristic oxic areas. The stations belonged to 6 transects, of which 4 close to the Danube’s mouths: Sulina (3 stations, bottom depths of 10 m, 20 m, and 30 m), Mila 9 (3 stations, bottom depths of 5m, 20m, and 30m), Sf.Gheorghe (3 stations, bottom depths of 5 m, 20 m, and 30 m) and Portiţa (3 stations, bottom depths of 5 m, 20 m, and 30 m), 1 in the central part (Est Constanța, 4 stations, bot-tom depths within 14–47 m), 1 in the Southern part (Manga-lia, 2 stations, bottom depths of 5 m and 20 m). Besides these, other 3 stations were chosen: in front of WWTPs Constanţa Nord (20 m) and Constanţa Sud (5 m and 20 m). The name of the stations consists of the profile name accompanied by the bottom depth, excepting Est Constanța with stations named from 1 to 4 (Fig. 1).
Fig. 1 Map of sampling stations for sea-floor TOC at the Romanian coast of the Black Sea
Methods for water and biota sampling, preservation and analysis
Water samples were collected with Nansen equipment, fitted with reversible thermometers, and stored in labeled plastic containers in freezer bags. Water samples for determi-nation of dissolved oxygen were taken into Winkler bottles, made from clear glass with glass stopper. Each bottle had its own volume engraved and the sampling was carried out carefully in order not to contaminate the sample with oxygen from the atmosphere. Samples were immediately fixed with specific reagents, after sampling. Phytoplankton samples were preserved with 4% formaldehyde buffer. All samples were stored in a dark cool place and tests were performed in the shortest time of sampling.
Salinity was determined by Mohr-Knudsen method ac-cording to the manual „Methods of Seawater Analysis“ (Grass-hoff et al., 1999). Data quality was assured by participation in laboratory performance testing exercises organized by the reference laboratory QUASIMEME (Quality Assurance of

123Geo-Eco-Marina 18/2012
Luminiţa Lazăr, Marian - Traian Gomoiu, Laura Boicenco, Dan Vasiliu – Total Organic Carbon (TOC) of the surface layer sediments covering the seafloor
Information for Marine Environmental Monitoring in Europe) in the Netherlands.
Dissolved oxygen was determined by Winkler method (GRASSHOFF et al., 1999). Data quality is assured by the de-termination of sodium thiosulphate solution concentration before each set of tests.
Nutrients were analyzed by spectrophotometric meth-ods (Grasshoff et al., 1999). Data quality is assured by partici-pation to QUASIMEME exercises, use of reference materials, control charts and internal validation procedures.
Quantitative and qualitative phytoplankton determina-tions were achieved using sedimentation method (Morozo-va-Vodyaniskaya, 1954). Samples were concentrated up to 15–20 cm3 by decantation after storage for prior 20 days. De-termination and cell counting on the species was done in the 0.1 ml fractions of the sample under an inverted microscope ZEISS using the 40x objective for small forms (less than 15 to 20 m) and 10x or 20x dimensions for larger forms. The bio vol-ume was calculated by measuring cell and their uptake cor-responding geometric figures (Edler, 1979).
Methods – for sediment sampling, preservation and analysis
The sediments were collected with a van Veen type grab. The undisturbed surface layer, 1.0–1.5 mm thick, was careful-ly collected with a plastic tube and the samples were placed in polyethylene containers, sealed, labeled and transported into the laboratory. Before analysis the sediments had been refrigerated at 40C. Then, after the removal of coarse frag-ments (> 1 mm), the sediments were lyophilized and ho-mogenized. The sediments were analyzed by Walkely-Black method (UNEP, 1995).
The results were calculated with the formula (1):
% 10T O CST F1# #= -` j (1)
Where, S-volume of ferrous solution from blank titration (ml); T-volume of ferrous solution from sample titration (ml);
F = (1.0N) × 12/4000 × 1.72 × 100/sample weight: 12/4000 = mEq mass C (g), 1.72 = factor for easy oxidizing organic mat-ter. For total organic carbon we chose 0.6. For standardiza-tion, was used as blank lysine C6H14N2O2 • HCl, treated in the same manner as the sample but F = 30 for 0.01 g lysine. The method was internally validated with the next results: LOD = 0.09% TOC, LOQ = 1.00% TOC, Repeatability r = 0.05% TOC, Recovery R = 80.4% TOC.
The data have been processed with Excel 2003, Statistica-free version, ODV 4.3 (Schlitzer, 2011).
3. RESULTSTOC in superficial sediments ranged from “undetectable”
to 14.94% (mean 3.38%, median 3.28%, standard deviation 2.70%). The outliers were found on the Northern coast, lo-cated under the direct influence of the Danube, while the single extreme was recorded at 5 m depth, in front of the biggest wastewater treatment plant of Constanța city, WWTP Constanța Sud. All uncharacteristic values were from Septem-ber 2010 (Table 1).
Even if 80% of the values ranged within “undetectable” – 5.00% of which 50% in the interval 1.44–4.35% (Fig.2a), due to the presence of an extreme value and few outliers, the nor-mal distribution’s hypothesis was rejected by Shapiro-Wilk’s test (Fig. 2b).
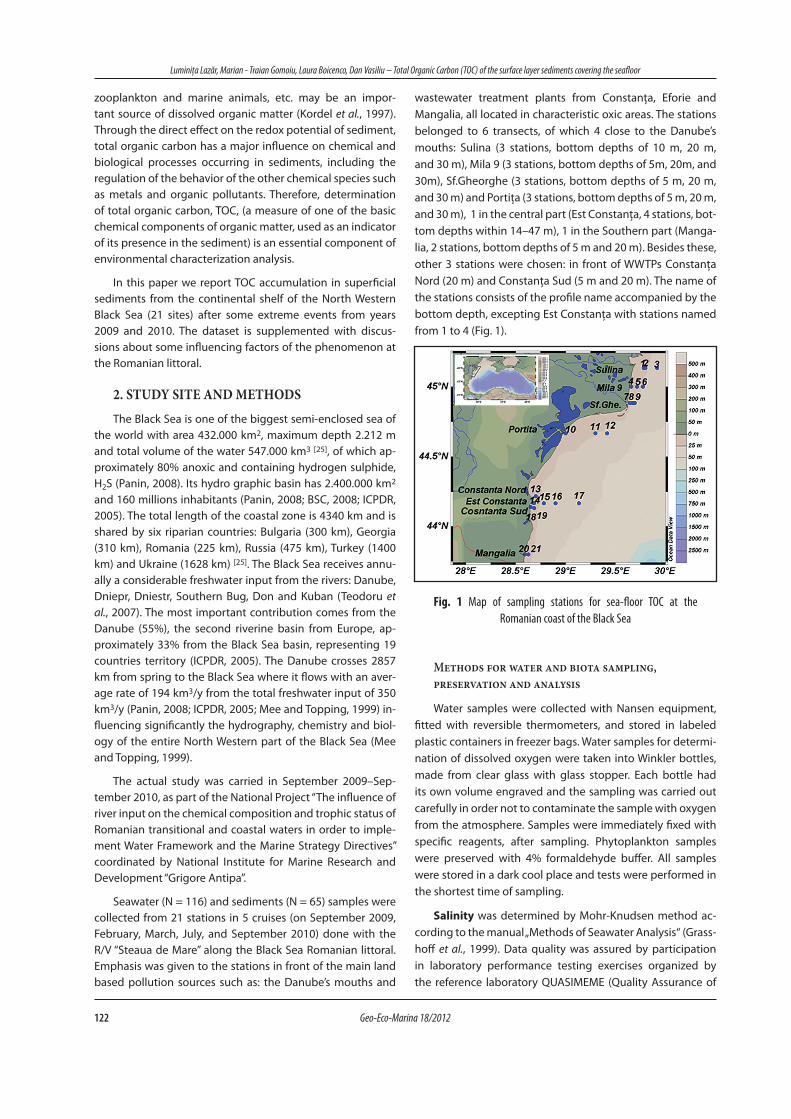
Data for 2009 (mean 1.41%, standard deviation 1.03%), were fitted to known data for the NW part of the Black Sea (Gomoiu and Cociasu., 1985; Secrieru D. and Secrieru A., 2002), as well as other regions (Teodoru, 2007; Aloupi and An-gelidis, 2001a; Aloupi and Angelidis, 2001b; Ceagatay et al., 1996; Algan et al., 1999). The distribution of the TOC content was characterized by continuous decrease along the entire coastal zone. In this respect, the spatial distribution diagram revealed three distinguished areas. First is represented by the Northern part, including Portiţa profile, separated from the central part by the 0.8% isoline. Next is the central part, Constanța area, directly influenced by the wastewater treat-
Fig. 2 Boxplot (a) and histogram (b) of TOC (%) in superficial sediments, Romanian Black Sea coast, 2009–2010

124 Geo-Eco-Marina 18/2012
Luminiţa Lazăr, Marian - Traian Gomoiu, Laura Boicenco, Dan Vasiliu – Total Organic Carbon (TOC) of the surface layer sediments covering the seafloor
ment plants Constanța Nord and Constanța Sud, both land-based sources of pollution at the Black Sea Romanian litto-ral. This influence was no more found at 20NM from shore, where concentrations reached the level 0.25% (station Est Constanța 4). The Southern part was separated from the cen-tral one by the isoline of 0.4% and it was characterized by the lowest contents. Thus, the “undetectable” level was found at Mangalia station at 20 m depth (Fig. 3).
On the other hand, it was also observed the increasing gradient with the distance from the shore, due to the higher percentage of the fine sedimentary fractions, which could be explained both by fine particles capacity to prevent the oxy-gen diffusion in sediments, thereby preserving the organic matter and organic particles adsorption on the surface of the mineral clays. Deviations from this model were found due to elevated terrestrial inputs of TOC and nutrients (Secrieru
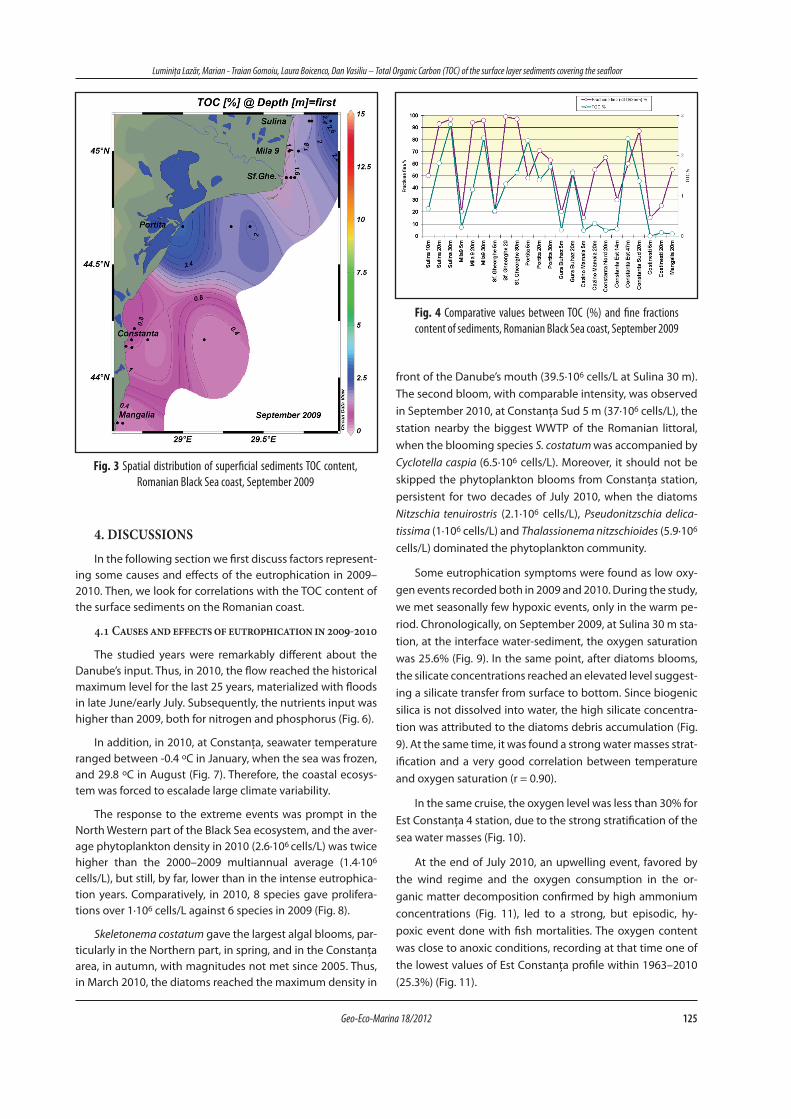
and Oaie, 2009). The observations confirmed correlations (r = 0.78) between TOC and fine sedimentary fractions, particu-larly in front of the Danube’s mouths (stations Sulina, Mila 9, and Sf. Gheorghe) (Fig. 4).
The seasonal variability of the TOC content was assessed for 2010 even if the sampling was not homogeneous spa-tial. Data ranged within 0.49–14.94% (mean 4.25%, median 3.92%, standard deviation 2.76%). Both extremes were from September, minimum at Constanța Nord 20 m and maxi-mum at Constanța Sud 5 m. During the winter, the values were higher than September 2009, at all stations. However, the decreasing gradient from North to South was maintained until September 2010. At the end of the warm season, the TOC content of surface sediments reached very high values in front of Portita transect and nearby WWTP Constanța Sud, at 5 m depth (Fig. 5).
Tabel 1 Total Organic Carbon (%) content of the superficial sediments - Romanian Black Sea littoral, 2009–2010
TOC, %
Area Map code
Station Bottom depth[m]
September2009
February2010
March2010
July2010
September2010
North
1 Sulina 10m 10 0.84 2.39 3.69
2 Sulina 20m 20 2.26 2.79 3.92 6.32
3 Sulina 30m 30 3.45 4.19 4.26
4 Mila 9 5m 5 0.27 0.99 3.86
5 Mila 9 20m 20 1.44 4.15 3.71 6.81
6 Mila 9 30m 30 3.04 5.09 5.73 1.31
7 Sf.Ghe. 5m 5 0.78 5.09
8 Sf.Ghe. 20m 20 1.61 5.34 2.60 7.39
9 Sf.Ghe. 30m 30 1.96 5.58 4.87 9.03*
10 Portita 5m 5 2.95 0.74 10.34*
11 Portita 20m 20 1.74 3.69 3.38 6.65
12 Portita 30m 30 2.14 4.35 4.13 8.17*
Cons
tanț
a
13Constanța Nord
20m 20 0.17 0.49
14 Est Constanța 1 14 0.21 0.90 1.65 0.62
15 Est Constanța 2 28 1.66 4.62 2.21
16 Est Constanța 3 36 3.28 3.88 1.54
17 Est Constanța 4 47 0.25 4.13
18 Constanța Sud 5m 5 1.07 14.94**
19Constanța Sud
20m 20 1.71 4.35
Sout
h 20 Mangalia 5m 5 0.52 3.37
21 Mangalia 20m 20 < LOD 3.86 0.82
* outliers; **extreme
125Geo-Eco-Marina 18/2012
Luminiţa Lazăr, Marian - Traian Gomoiu, Laura Boicenco, Dan Vasiliu – Total Organic Carbon (TOC) of the surface layer sediments covering the seafloor
4. DISCUSSIONSIn the following section we first discuss factors represent-
ing some causes and effects of the eutrophication in 2009–2010. Then, we look for correlations with the TOC content of the surface sediments on the Romanian coast.
4.1 Causes and effects of eutrophication in 2009-2010
The studied years were remarkably different about the Danube’s input. Thus, in 2010, the flow reached the historical maximum level for the last 25 years, materialized with floods in late June/early July. Subsequently, the nutrients input was higher than 2009, both for nitrogen and phosphorus (Fig. 6).
In addition, in 2010, at Constanţa, seawater temperature ranged between -0.4 oC in January, when the sea was frozen, and 29.8 oC in August (Fig. 7). Therefore, the coastal ecosys-tem was forced to escalade large climate variability.
The response to the extreme events was prompt in the North Western part of the Black Sea ecosystem, and the aver-age phytoplankton density in 2010 (2.6∙106 cells/L) was twice higher than the 2000–2009 multiannual average (1.4∙106 cells/L), but still, by far, lower than in the intense eutrophica-tion years. Comparatively, in 2010, 8 species gave prolifera-tions over 1∙106 cells/L against 6 species in 2009 (Fig. 8).
Skeletonema costatum gave the largest algal blooms, par-ticularly in the Northern part, in spring, and in the Constanța area, in autumn, with magnitudes not met since 2005. Thus, in March 2010, the diatoms reached the maximum density in
front of the Danube’s mouth (39.5∙106 cells/L at Sulina 30 m). The second bloom, with comparable intensity, was observed in September 2010, at Constanţa Sud 5 m (37∙106 cells/L), the station nearby the biggest WWTP of the Romanian littoral, when the blooming species S. costatum was accompanied by Cyclotella caspia (6.5∙106 cells/L). Moreover, it should not be skipped the phytoplankton blooms from Constanța station, persistent for two decades of July 2010, when the diatoms Nitzschia tenuirostris (2.1∙106 cells/L), Pseudonitzschia delica-tissima (1∙106 cells/L) and Thalassionema nitzschioides (5.9∙106 cells/L) dominated the phytoplankton community.
Some eutrophication symptoms were found as low oxy-gen events recorded both in 2009 and 2010. During the study, we met seasonally few hypoxic events, only in the warm pe-riod. Chronologically, on September 2009, at Sulina 30 m sta-tion, at the interface water-sediment, the oxygen saturation was 25.6% (Fig. 9). In the same point, after diatoms blooms, the silicate concentrations reached an elevated level suggest-ing a silicate transfer from surface to bottom. Since biogenic silica is not dissolved into water, the high silicate concentra-tion was attributed to the diatoms debris accumulation (Fig. 9). At the same time, it was found a strong water masses strat-ification and a very good correlation between temperature and oxygen saturation (r = 0.90).
In the same cruise, the oxygen level was less than 30% for Est Constanța 4 station, due to the strong stratification of the sea water masses (Fig. 10).
At the end of July 2010, an upwelling event, favored by the wind regime and the oxygen consumption in the or-ganic matter decomposition confirmed by high ammonium concentrations (Fig. 11), led to a strong, but episodic, hy-poxic event done with fish mortalities. The oxygen content was close to anoxic conditions, recording at that time one of the lowest values of Est Constanța profile within 1963–2010 (25.3%) (Fig. 11).
Fig. 4 Comparative values between TOC (%) and fine fractions content of sediments, Romanian Black Sea coast, September 2009
Fig. 3 Spatial distribution of superficial sediments TOC content, Romanian Black Sea coast, September 2009

126 Geo-Eco-Marina 18/2012
Luminiţa Lazăr, Marian - Traian Gomoiu, Laura Boicenco, Dan Vasiliu – Total Organic Carbon (TOC) of the surface layer sediments covering the seafloor
Fig. 5 TOC seasonal distribution in superficial sediments along the Romanian Black Sea coast, 2010

127Geo-Eco-Marina 18/2012
Luminiţa Lazăr, Marian - Traian Gomoiu, Laura Boicenco, Dan Vasiliu – Total Organic Carbon (TOC) of the surface layer sediments covering the seafloor
Fig. 7 Comparative analysis of multiannual monthly and annual averages of seawater temperature (oC), Constanța station, 1959–2009 and 2010
Fig. 6 The Danube’s flow and nutrients input at Reni station, 2000–2010, data from ABADL, Constanța
Fig. 8 Phytoplankton Density (L) and Biomass (R) annual averages, Constanța, 1983–2010

128 Geo-Eco-Marina 18/2012
Luminiţa Lazăr, Marian - Traian Gomoiu, Laura Boicenco, Dan Vasiliu – Total Organic Carbon (TOC) of the surface layer sediments covering the seafloor
Fig. 9a Silicate concentrations of water column, Sulina, September 2009
Fig. 9b Oxygen saturation of water column, Sulina, September 2009
Fig. 10a Temperature of water column, Est Constanța, September 2009

129Geo-Eco-Marina 18/2012
Luminiţa Lazăr, Marian - Traian Gomoiu, Laura Boicenco, Dan Vasiliu – Total Organic Carbon (TOC) of the surface layer sediments covering the seafloor
Fig. 11a Ammonium contents of water column, Est Constanța, July 2010
Fig. 11b Dissolved Oxygen contents of water column, Est Constanța, July 2010
Fig. 10b Oxygen saturation of water column, Est Constanța, September 2009

130 Geo-Eco-Marina 18/2012
Luminiţa Lazăr, Marian - Traian Gomoiu, Laura Boicenco, Dan Vasiliu – Total Organic Carbon (TOC) of the surface layer sediments covering the seafloor
4.2 Contributing factors of the TOC content into superficial sediments
The TOC content in surface sediments generally out-lined two areas along the Romanian coast separated by the Constanța city area. The Danube’s influence on the Northern resulted in the decreasing gradient from North to South. The only exception came from the neighborhood of the biggest WWTP of the area (Constanța Sud 5 m) on September 2010. Fortunately, unlike the Danube’s mouths, due to the lower flows, the impact was felt just nearby shore, at 5 m depth, val-ues from Constanța 20 m (approx. 5 nM distance from shore) being in the normal range of variability. Excepting this value, which statistically is an extreme, the difference between the two areas is highlighted also by the significant difference be-tween North and South values (t test, 95%, df = 63, tcr = 2.99, p = 0.0039) (Fig. 12).
Fig. 12 Spatial variability of TOC (%) mean content in superficial sediments, Romanian Black Sea coast, 2009–2010
Being under the direct influence of the Danube’s dis-charge, the Northern part was very responsive to the histori-cal flow of 2010 and its increased nutrients input. Thus, we report an increased TOC content (excepting station Mila 9 30 m) by 2.9–7.4 times than 2009. In that zone, the maximum TOC content was accumulated on September 2010 at Portiţa 5 m, reaching an uncharacteristic value (Table 1). Statistically, the values from the same stations started to be significantly different from September 2009 to March 2010 due to the ac-cumulations (t test, 95%, df = 21, tcr = 2.7549, p = 0.0119). The accumulations continued and the differences between Sep-tember 2009 and 2010, were highest (t test, 95%, df =21, tcr
= 5.4205, p<0.0001). The TOC strong accumulation in surface sediments at Portita 5 m station from March (0.74%) to Sep-tember 2010 (10.34%) and the absence of low oxygen events revealed the organic matter resistance to oxidation. In the same place, Portita, it was registered the inconsistency be-tween TOC content and sediments fine fractions, suggesting that the area is a carbon sink one. The low oxygen concentra-tion from Sulina 30 m (Fig. 9) was accompanied by normal TOC content (3.45%).
The discussions for the Southern part of the Romanian littoral will be split into three parts due to the specific of the coastal zone. First, we discuss the Est Constanța profile. Therefore, our attention was drawn to the first three stations where the TOC content reached maximum on March 2010 af-ter the strongest algal blooms of S. costatum since 2005. Next measurements done in July 2010, showed a decrease of ap-prox. 2-3 times accompanied by low oxygen concentrations. Therefore, we can assume that the strong hypoxic event from July 2010 was a consequence of the oxygen consumption in the organic matter mineralization process coupled with the winds and currents regimes. Unfortunately, we have not any TOC data for sediments in March 2010 at station 4, but the absence of the low oxygen concentrations coupled with the higher TOC level on July 2010, strongly suggested that, at dis-tance from shore, the amplitude of the extreme events was lower than near shore and organic carbon accumulations are slowly, but continuously done (Fig. 13). Actually, we found reported in literature a gradually decreasing mass accumula-tion rate (MAR) from 3580 g/cm2.y at the shelf to 230 g/cm2.y
at the shelf break, 123 g/cm2.y at the upper slope and 60 g/cm2.y at the lower slope and 52 g/cm2.y in the abyssal basin (Teodoru et al., 2007), confirming our supposition.
Fig. 13 Variability of TOC content in superficial sediments, Est Constanța profile
Second, we paid attention to the neighborhood of the Constanța South WWTP due to the highest TOC level meas-ured during the study. In the closest marine area, at Constanța Sud 5 m, we found important differences between Septem-ber 2009 and September 2010. Due to the lower value from Constanța Sud 20 m, we consider the WWTP influence as lim-ited, but with considerable impact through the nearby ma-rine ecosystem.
Third, in the southernmost area of the Romanian littoral, on Mangalia profile, the TOC levels were the lowest that we measured. Unlike other transects, at Mangalia, the TOC values decreased with the distance from shore indicating a reduced terrigenous input (Teodoru et al., 2007).

131Geo-Eco-Marina 18/2012
Luminiţa Lazăr, Marian - Traian Gomoiu, Laura Boicenco, Dan Vasiliu – Total Organic Carbon (TOC) of the surface layer sediments covering the seafloor
Studying the correlation factors, our attention was drawn by the differences between Northern and Southern areas (Fig. 14). Thus, the nutrients concentrations of the bottom waters influenced stronger the TOC content of the surface sediments from the southern area, suggesting the biogenic provenience of the organic matter, also confirmed by the ni-trite’s influence. Due to its instability, nitrite was correlated different: in the Northern part the correlation was negative (r = -0.35) and less significant than in South (r = 0.81). This could be explained by water column oxygenation and TOC proveni-ence. Generally, nitrite shows lower concentrations into well oxygenated waters (Gianguzza et al., 2000) where nitrate is predominant. It also corresponded to higher TOC contents in the Northern part where the TOC resistance to oxidation increased, thus suggesting more the terrigenous proveni-ence. Another significant positive correlation was found in the Northern part with salinity (r = 0.48). Thus, higher TOC content were found at distance from shore where the fine sedimentary fraction was raised. According to our data tem-perature and oxygenation of bottom waters didn’t influenced the TOC content of the surface sediments.
Fig. 14 Correlations factors between TOC content of the superfi-cial sediments and bottom waters physico-chemical parameters,
Romanian Black Sea shelf, 2009–2010
5. CONCLUSIONSThis study aimed at evaluating the Total Organic Carbon
(TOC) content of the surface sediments on the Romanian Black Sea coast and finding correlations with the eutrophica-tion of the same area. Surface sediments were analyzed from
21 stations (with bottom depths within 5–50 m) covering all Romanian Black Sea coast (maximum distance from shore 30 NM). In the same time, we analyzed eutrophication indicators (dissolved oxygen, nutrients concentrations and phytoplank-ton).
Excess carbon may be attributed to either excessive plant debris or anthropogenic loading. High organic carbon is considered a sign of frequent algal blooms in the overlying water column, the blooms being a result of increased nutrient (nitrogen and phosphorus) loadings into the system. Thus, on the Romanian littoral we found two main sources of the TOC content of the superficial sediments: the Danube and the biggest wastewater treatment plant of Constanța city, Constanța Sud. Due to their very different flow and accordingly, input, the main source is coming from the Danube’s direct influence area. The distribution of the TOC content was generally characterized by a decrease along the entire coastal zone, from North to South. Nearby the Danube’s mouths, the TOC strong accumulation into superficial sediments and the absence of hypoxic events revealed the organic matter resistance to oxidation suggesting that the area acts as a carbon sink. Extreme values were also recorded, seasonally, in the close proximity of the WWTP Constanța Sud. Thus, the anthropogenic influence of the urban area could be followed by extreme events, episodic, but with serious consequences for the marine ecosystem. With generally lower values than North, in the Southern littoral, the TOC content seems to originate more from biological input. Climatic factors particularly influenced the TOC content of the surface sediments from NW Black Sea through the Danube’s flow, with historical maximum in 2010, accompanied by higher nutrients input. According to our data, temperature and oxygenation of bottom waters didn’t influenced the TOC content of the surface sediments. Given the eutrophication complexity and its chain effects, we can assume that the TOC content of the surface sediments could roughly indicate the eutrophication potential of the area. Next studies should be conducted for regular TOC monitoring and researches of correlations with eutrophication indicators at different times. The observations showed correlations between TOC and fine sedimentary fractions only in front of the Danube’s mouths. Due to the proportionality between TOC content and organic matter which has affinity for trace metals and organic contaminants, next studies should be conducted in the area to use TOC as an indicator of marine pollution.

132 Geo-Eco-Marina 18/2012
Luminiţa Lazăr, Marian - Traian Gomoiu, Laura Boicenco, Dan Vasiliu – Total Organic Carbon (TOC) of the surface layer sediments covering the seafloor
REFERENCES
AlgAn, O., CeAgAtAy, M., SArikAyA, H., BAlkiS, n., SAri, e., 1999, Pollution
monitoring using marine sediments: A case study on the Istan-
bul metropolitan Area. Journal of Engineering and Environmental
Science, 23, 39–48.
AlOupi, M., AngelidiS, M.O., 2001a, Geochemistry of natural and anthro-
pogenic metals in the coastal sediments of the island of Lesvos,
Aegean Sea. Environmental Pollution, 113, 211–219.
AlOupi, M., AngelidiS, M.O., 2001b, Normalization to lithium for the as-
sessment of metal contamination in coastal sediment cores from
the Aegean Sea, Greece. Marine Environmental Research, 52, 1-12.
CeAgAtAy, M., AlgAn, O., BAlkiS, n., BAlkiS, M., 1996, Distribution of car-
bonate and organic carbon contents in late quaternary sedi-
ments of the southern Marmara shelf. Turkish Journal of Marine
Sciences, 2, 2, 67–82.
BSC, 2007, Black Sea Transboundary Analysis. Publication of the Com-
mission on the Protection of the Black Sea Against Pollution, pp.
269.
BSC, 2008, State of the environment of the Black Sea (2001-2006/7).
Publication of the Commission on the Protection of the Black Sea
Against Pollution, pp. 447.
edler, l., 1979, Recommendations on methods for Marine Biological
Studies in the Baltic Sea. Phytoplankton and Chlorophyll, Baltic
Marine Biologists Publication, 5, 1-38.
giAnguzzA, A., pelizzetti, e., SAMMArtAnO, S. (edS), 2000, Chemical pro-
cesses in marine environments, Springer, pp. 441.
grASSHOff, k., kreMling, k., eHrHArdt, M. (edS), 1999. Methods of Seawater
Analysis. 3rd Edition. Willey-VCH, Weinheim, pp. 632.
gOMOiu, M.-t., 1983, Sur la mortalite en masse des organisms ben-
tiques du littoral roumain de la Mer Noire. Rapp. Comm.int.Mer
Medit., 28, 3, 203-204 .
gOMOiu, M.-t., COCiASu, A., 1985, Donnees preliminaries sur la sub-
stance organique des sediments superficiels du plateau conti-
nental roumain de la Mer Noire. Rapp. Comm.int.Mer Medit., 29,
8, 197-198.
gOMOiu, M.-t., 1992, Marine eutrophication syndrome in the North-
Western part of the Black Sea. Science of the Total Environment
Suppl., Elsevier Science Publishers B. v., Amsterdam, 683-692.
iCpdr-iCpBS, 1999, Causes and Effects of Eutrophication in the Black
Sea Summary report. Programme Coordination Unit UNDP/GEF
Assistance, pp. 93.
iCpdr, 2005, Nutrient management in the Danube basin and its im-
pact on the Black Sea – daNUbs Final report. International Com-
mission for the Protection of the Danube River - http://www.icpdr.
org, pp. 69.
kOrdel, W., dASSSenAkiS, M., lintelMAnn, J., pAdBerg, S., 1997, The impor-
tance of natural and organic material for environmental process-
es in water and soils, Technical report, International Union of Pure
and Applied Chemistry, Pure & Appl. Chem., 69, 1571-1600.
Mee, l.d., 1992, The Black Sea in Crisis: A need for concerted interna-
tional action, Ambio, 21, 4, 278-286.
Mee, l.d., tOpping, g. (edS), 1999, Black Sea Pollution Assessment. Black
Sea Environmental Series, 10, United Nations publications, pp.
380.
MOrOzOvA-vOdyAniykAyA, v., 1954, Phytoplankton of the Black Sea II,
Trudy Sevastopol biol., 8, pp. 1-99.
pAnin, n., 2008, The Black Sea Geology, Environment and Archaeol-
ogy, Workshop Hazard natural: Evenimente Tsunami in Marea
Neagră, Bucureşti, 3-10.
SCHlitzer, r., 2011, Ocean Data View, http://odv.awi.de.
SeCrieru, d., SeCrieru, A., 2002, Heavy metal enrichment of Man-made
origin of superficial sediment on the continental shelf of the
North-western Black Sea. Estuarine, Coastal and Shelf Science, 54,
513-526.
SeCrieru, d., OAie, g., 2009, The relation between the grain size com-
position of the sediments from the NW Black Sea and their Total
Organic Carbon (TOC). Geoecomarina, 15, 5-11.
teOdOru, C.r., friedl, g., friedriCH, J., rOeHl, u., SturM, M., WeHrli, B., 2007,
Spatial distribution and recent changes in carbon, nitrogen and
phosphorus accumulation in sediments of the Black Sea, Marine
Chemistry, 105, 52–69.
unep, 1995, Manual for the geochemical analyses of marine sedi-
ments and suspended particulate matter, Reference Methods for
Marine Pollution Studies No. 63, pp. 41.
Http://WWW.BlACkSeA-COMMiSSiOn.Org/_geOgrApHy.ASp