total lunchroom makeovers: using the principle of...
TRANSCRIPT

1
Total Lunchroom Makeovers: Using the Principle of Asymmetric Paternalism to
Address New School Lunchroom Guidelines
Andrew S. Hanks (PhD) David R. Just (Phd) Brian Wansink (PhD)
Abstract
A key goal of the Healthy, Hungry-Free Kids Act of 2010 is to ensure that children have
access to healthy foods in schools. While the new policy mandates that healthy items must be
included on the lunch line—and even that children must take certain foods—there is concern
both over whether children will choose to eat the healthier fare, and what the ultimate cost may
be to schools that comply. We propose a series of behavioral nudges–the total lunchroom
makeover–that may help lead children to make healthier choices at little cost the schools in
accordance with the goals of the new legislation.. We report the results from a field experiment
in which a series of nudges lead to significant increases in the consumption of fruits and
vegetables—a substantive step in the right direction.

2
Introduction
“Over 31 million children receive meals through the school lunch program…With over
seventeen million children living in food insecure households and one out of every three
children in America now considered overweight or obese, schools often are on the front
lines of our national challenge to combat childhood obesity and improve children’s
overall health” (Healthy, Hunger-Free Kids Act of 2010: Fact Sheet).
Leading a free people to eat healthier foods is a difficult task even when those people are
cooperative. This task is made all the more difficult when those we wish to encourage are either
apathetic or resistant to eating healthier. Policies aimed at restricting choice, especially for
children, have become more and more common, despite evidence that they are ineffective and
can even backfire (for example see Hurley, Cross, and Hughes 2011; Watanabe 2011). In
January 2012, the USDA announced new nutrition standards that will require school cafeterias to
increase whole grain offerings, limit milk offerings to 1% and fat-free varieties, restrict the
frequency that childhood favorites will be offered, and make fruit and vegetables available every
day of the week and students will be required to take one or the other, (USDA 2012). Some
project that the costs of these new requirements may be prohibitive (Newman 2012). Moreover,
such restrictions do not necessarily teach children to make healthier choices; forcing children to
take fruits and vegetables, or other healthy items, does not mean they will eat them.
As a complement to the current policies in practice, we propose a more subtle approach
to improving the healthful attributes of what children eat as part of their school lunch program.
This approach is based on the behavioral economic principle termed libertarian paternalism, a
principle that preserves choices but uses behavioral cues to gently nudge decision-makers, in this
context school children, to make better choices than they would have made without the cue (see

3
Loewenstein et al. 2007). This not only preserves choice but has the potential to lead children to
develop life long habits of selecting and consuming healthier foods, even when confronted with
less healthy options.
Our alternative approach is to introduce a series of changes in a lunchroom that cost no
more than $50, preserve choice, and employ environmental queues to nudge (Thaler and
Sunstein 2008) children to take and consume healthier lunches. We implement these changes in
two schools located in Western New York, and rely on tray waste measurements to quantify the
impact. We found that the changes we made had a significant impact on consumption of fruits,
vegetables, and starchy sides, independent of the available side offerings. This evidence
demonstrates the power of behavioral controls for leading children to consume healthier lunches.
Background
School lunchrooms are an easy target for legislation designed to combat the current trend
of childhood obesity. Unfortunately, children tend to view these regulations as negative changes
to their lunchrooms. These regulations have a tendency to place restrictions on behavior instead
of gently nudging children to make appropriate decisions. Forcing children to take of healthier
foods does not ensure that children will actually eat them (Just and Wansink 2009; Price and Just
2010). Moreover, research has demonstrated that restrictions on food choices for children can
actually lead to increases in consumed calories an/or body mass in children (see Johnson and
Birch 1994, Fisher and Birch 1999; Faith, et al. 2004; Hurley, Cross, and Hughes 2011). This can
happen due to reactance—a feeling of rebellion against undesired restrictions on choice. Careful
consideration must be given to policies designed to encourage healthier eating in lunchrooms so
4
that students do not feel restricted and so that they eat the fruits and vegetables they place on
their trays.
Behavioral Biases and Libertarian Paternalism
As an alternative to restrictive policies, behavioral cues provide another set of tools that
can encourage healthier behavior while still preserving choice. Traditional approaches toward
nutrition policy assumes that individuals make rational and well reasoned decisions based upon
available nutrition information. Reality, however, is a different matter. Findings in the
behavioral sciences document biases in human cognition such as emotion based consumption
(Loewenstein 2000), biasing preferences towards the present experience rather than potential
longer term consequences (Downs, Loewenstein, Wisdom 2009; Cairns and van der Pol, 2000),
ignoring sunk costs1 (Just and Wansink 2011), and defying the independence of irrelevant
alternatives2 (Hanks, Just, and Wansink 2012), to name a few. In response to these biases,
libertarian paternalism exploits these biases and nudges people to make better decisions (see
Loewenstein, Brennan, and Volpp 2007).
Properly identifying which behavioral cues will be most effective in positively
influencing choice requires an understanding of the biases exhibited by consumers. For this study
we examine environmental changes that appeal to the five senses and others that are more
structural in nature. Environmental queues that stimulate the senses affect consumer behavior in
general (see Turley 2000; Massara, Liu, and Melara 2010; Knoferle et al. 2011). These same
queues can also have profound impacts on food choices. For example, background music can
1 A sunk cost is a previously incurred cost that cannot be recovered
2 The principle of independence of irrelevant alternatives says that a consumer’s choice between two goods is not affected by the attributes or availability of a completely separate good. For example, if a consumer prefers apples to oranges and is given a choice between the two, the consumer will choose the apple. Independence of irrelevant alternatives predicts that if the consumer were then offered an apple, orange, and pear, the consumer would still prefer the apple to the orange.
5
prolong a restaurant visit and increase food and drink consumption (see North and Hargreaves,
1996; Caldwell and Hibbert, 2002), ambient lighting can affect eating behavior by prolonging
restaurant visits or consuming an unplanned dessert (see Sommer, 1969; Lyman, 1989), odors
can suppress food consumption (see Rolls and Rolls, 1997; Stevenson et al., 1999;), restaurant
servicescape, encounter, and other modifications of restaurant décor can affect customer
satisfaction (Lin and Mattila 2010), and even enhancements to the visual presentation of more
healthful options have the potential to increase consumption of these foods (see Zampollo et al.,
2011).
Often times a simple change in the environment can lead decision-makers to choose
much healthier foods. For example, giving food descriptive or sentiment laden names (e.g., Big
Bad Bean Burrito) can increase consumption and perception of taste (see Wansink et al., 2007;
Berning et al. 2010). Similarly, suggestions by perceived “experts” or verbal prompts can
influence perceptions and behavior (see Caplin and Leahy 2004; Schwartz 2007). Slight
increases in the convenience of more healthful foods can decrease calorie consumption (see
Wisdom et al. 2010; Hanks et al. 2012).
In school lunchroom settings, researchers have tested various applications of these
principles and have seen improvements in food selection and consumption behavior. For
example, moving the salad bar to a more convenient location can increase salad selection by as
much as 200% to 300% (Just and Wansink 2009), placing chocolate milk behind white milk or to
a less convenient location can decrease chocolate milk consumption (Smith et al., 2011), placing
the healthy entrée in front of the other entrées can increase selection of that entrée (Wansink and
Just, 2011), and introducing a convenience line with the healthier options can decrease the
consumption of less healthy foods by 28% (Hanks et al., 2012).

6
Another very important environmental factor in school lunchrooms is the availability of
foods. Recent research has shown that competitive foods in the lunchroom compete with the
healthier options available in school lunch program meals (Fox et al. 2005; Probart et al. 2006;
Jensen et al. 2011). There is also evidence that the simple presence of a food choice, even when
it is never chosen, can affect the selection of other choices (Hanks, Just, and Wansink 2012).
In the studies described above, researchers focused on the behavioral impact of a single
change. Our intent here is to identify the effect of a series of environmental changes–the total
lunchroom makeover–in a controlled field experiment that can be carried out with little or no
additional cost so that schools across the nation can implement them (or at least some of them)
with relative ease.
The Total Lunchroom Makeover: A Controlled Field Experiment
Controlled field experiments are extremely useful in behavioral research because the
treatments provide a clearly exogenous source of variation in the treatment variables, allowing us
to make some claims of causality in the resulting changes in behavior (List, 2011; List, 2009;
Levitt and List, 2009; Harrison and List, 2004). Because field experiments can be reasonably
controlled, they maintain a high degree of internal validity—we can confidently state that the
treatment was causal. Field studies also have mid-to high levels of external validity (Roe and
Just 2009)—because they take place in natural settings, the behavior is likely to be similar to
what could be expected out in the wild. In other words, field studies allow a researcher to argue
causality (internal validity) and generalizability (external validity) of the results.
The changes in the total lunchroom makeover are based in the principles of asymmetric
paternalism because they rely on cues that do not restrict choice but encourage healthier eating

7
behavior. Even though we are not able to identify the effect of each individual change, the
power of this intervention is in extending its influence to a greater number of students and that
school lunchroom staff can select which changes are most appropriate for their lunchroom. Our
contribution to the literature is the sheer size of the intervention and the relative ease with which
it can be replicated in many locations.
Experimental Design and Data
At Addison and Campbell-Savona Central Schools in Western New York, food
service staff carried out various low-cost and simple changes for the total lunchroom
makeover. Our experimental design consists of a control period, March to April 2011,
where the status quo lunchroom was not altered. Then in May, the changes were made
and the intervention period lasted from May to June 2011. Even though the structure of
this experiment does not allow us to test the impact of any individual intervention, we are
still able to identify aggregate effects on what students took and consumed. These
changes included hanging a photographic menu poster, placing signs on the sneeze guard
to label each entrée with a descriptive name, moving the garbage and compost away from
the serving area, serving salad in transparent single serve shells, placing fruit in a basket
next to the register with a sign that read, “Last Chance for Fruit,” laying colorful linens
under the trays, verbal promptings from the staff,3 introducing a convenience line that
served subs and only healthier sides, and juices placed in the freezer next to the ice
cream. Based on findings from previous research, we predict that the total lunchroom
makeover will improve what students take and eat for lunch.
3 Verbal prompts were, “Would you like to try…?” No not veggie? How about [cold veggie like carrot sticks or salad] or [fruit]? At the register, staff said, “You can get another [1,2,3] sides with that–how about grabbing [fresh fruit in bowl by register]?”
8
We sent trained field researchers to the cafeterias inside of the two schools and recorded
each student’s waste. The cards on which the data were collected had a mark for whether a
serving of a starchy side (mashed potatoes, French fries, rice, etc.), fruit, or vegetables was not
eaten at all, half eaten, or completely eaten. Data for juice specified whether the box was open.
These researchers also took note of each available side on the measurement days. This
information allows us to determine the impact of each individual side on consumption of starchy
sides, fruits, and vegetables.
In the study, the control period lasted from March to April and the interventions were
implemented at the beginning of May. At Addison, we collected data on March 15, 17, and 18,
May 13 and 17, and June 8, 9, and 13. On March 15, options for fruit were not recorded so we
cannot use this date in the regression analyses. Also, on June 9, waste for one of the vegetable
sides was not measured so we drop the observations for this date. At Campbell-Savona we
collected data on March 14, 16, and 21, May 19 and 20, and June 6 and 9. On March 14, none of
the menu items were recorded so we drop the observations on this date for the regression
analyses. Table 1 reports the sample size on each of the observation dates. Before we drop
March 14 and 15 for the regression analysis, we have 4388 total observations over a span of
fourteen days. When we drop the observations for March 14 and 15 for the regression analyses,
we have 3762 observations over a span of 12 separate days.
In our analysis, we examine the impact that the total lunchroom makeover has on sales
and consumption of starchy sides, fruits, and vegetables. On two of our measurement days,
March 17th and 18th, starchy sides were not offered. Also, on March 21, starchy consumption
was not recorded. When we analyze starchy side consumption, we omit these dates, which leaves
us with 2,756 total observations. As a result, we have only one pre-treatment day in these

9
regressions and we use a smaller set of control variables. This is discussed in greater detail
below.
Since we did not assign either Addison or Campbel-Savona Central School as a control
school, we treat Waverly Central School in Western New York as such. This school is similar to
Addison and Campbell-Savona Central Schools because they are in less densely populated areas
of Western New York and are supplied school lunches by the same Greater Southern Tier Board
of Cooperative Educational Services group in New York State. Data from Waverly are daily
transaction records by student, and we have unique identifiers for each student, so we can
construct a panel of repeated observations from the data. The data also include meal and ice
cream sales both before and after the intervention. Unfortunately we only have fruit, vegetable,
starchy side, or milk sales after the intervention and not consumption. The data span school days
from March to June 2011. To determine if there are any external factors driving our results we
report trends in selection data for meals and ice cream before and after the intervention and
trends in selection data for starches, fruits and vegetables, white milk, and flavored milk after the
intervention.
In Figure 1, we plot data averaged data for meal sales on each date and draw a trend line
to see how time affects meal selection. The slope of the line is 0.00006 (p-value = 0.397) which
suggests no trend. We then use panel regression with a lagged dependent variable to account for
auto-correlation in the data. To determine if there is an impact before or after the intervention,
we also include a dummy variable that is coded as 0 before the intervention and 1 after the
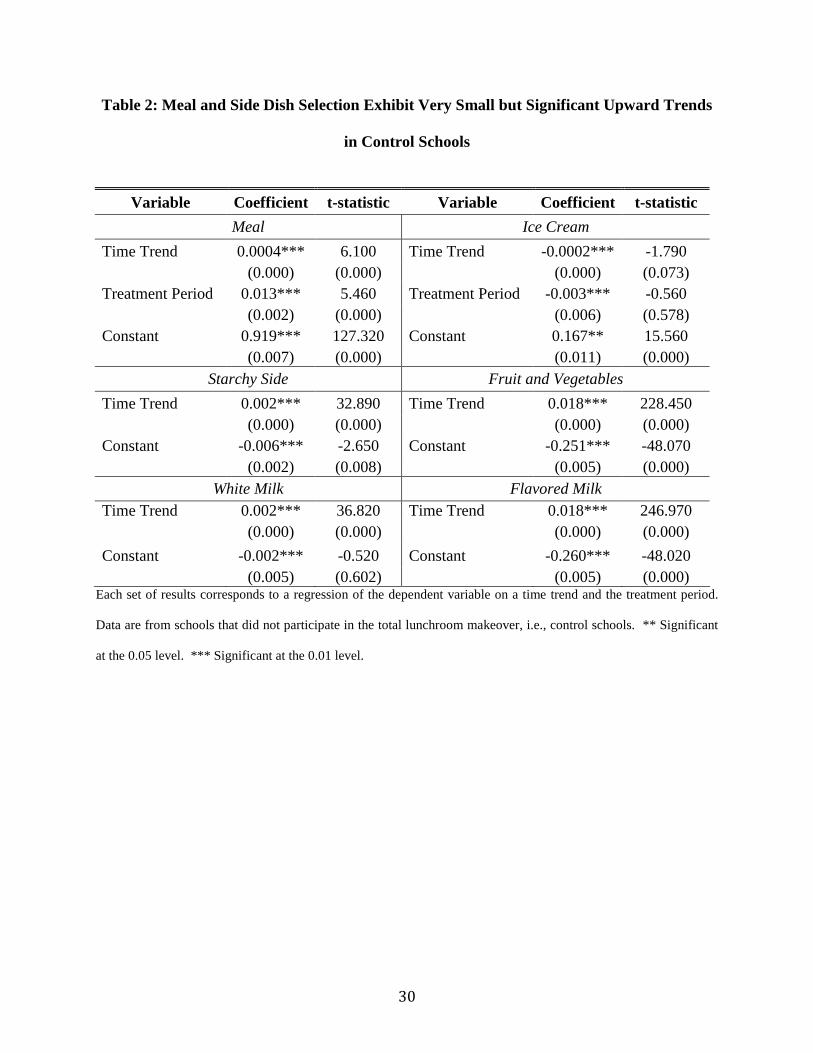
intervention (for meal and ice cream selection only). For meal selection, the time trend
coefficient is estimated as 0.0003 (p-value < 0.001) (Table 2) which is very small, yet
statistically significant. The lagged variable is also statistically significant, which suggests

10
autocorrelation in purchasing behavior, which is to be expected. In Table 2 we also report
significant time trends for starchy side, fruit and vegetable, and white and flavored milk
selection. Even though they are statistically significant, they are small increases over time. All
the items–meals, ice cream, starchy sides, fruits and vegetables, and white and flavored milk–
have significant lagged terms so there is evidence for autocorrelation in the data, but when it is
accounted for, we still see significant time trends for each item except ice cream.
Results
While each individual component of the total lunchroom makeover has the potential to
affect behavior, the purpose of this study is to confront the student with interventions on multiple
fronts. Since we are unable to measure any single effect, we report the impact of the makeover
itself. We first report simple means from the data that suggest the intervention mainly had an
impact on starchy side consumption. Once we control for available side dishes, we then see that
the total makeover has little or no impact on consumption of starchy sides, but it does affect
consumption of fruits and vegetables.
Simple Means Comparisons
A first look at the data reveals rather drastic results for consumption of starchy sides.
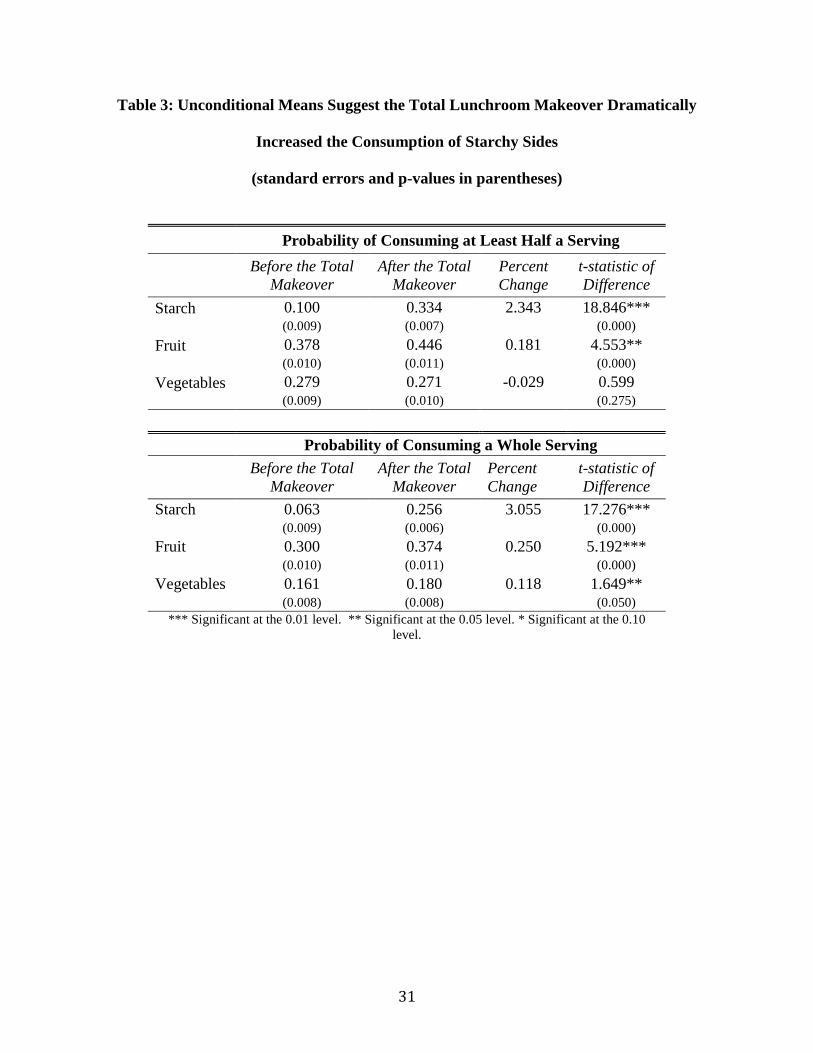
Figures 2a-b and corresponding data in Table 3, report simple means for consumption of starchy
sides, fruits, and vegetables. We find significant jumps in the means for starchy side
consumption during the total lunchroom makeover period. Specifically, the likelihood of
consuming at least half a serving increased by 234.3% (p-value < 0.001) and the likelihood of
consuming a whole serving increased by 305.5% (p-value > 0.001). Changes in fruit and

11
vegetable consumption were much more modest. Students were 18.1% (p < 0.001) more likely
to consume at least half a serving of fruit and 25% (p < 0.001) more likely to consume a whole
serving of fruit. Students were 11.8% (p = 0.050) more likely to consume a whole serving of
vegetables. Without further analysis, this change in behavior suggests that the total lunchroom
makeover had a very big impact on the consumption of starchy sides, which would have negated
any positive impact from the increase of fruit or vegetable consumption.
Regression Analysis: Control for Available Sides
The results in Figures 2(a-b) suggest that the total lunchroom makeover had a dramatic
impact on consumption of starchy sides. Without further analysis, this result would suggest that
even though students were more likely to consume more fruits and vegetables, the increase in
starchy side consumption would likely offset the healthy choices students made in the cafeteria.
A simple means comparison, however, does not control for options in a student’s set of
choices at lunch. This dramatic increase in starchy side consumption might be the result of the
availability of other foods after the total lunchroom makeover occurred. It is also possible that
there are other exogenous effects for which we are not able to control.
In order to account for menu options in the analysis of consumption of starchy sides,
fruits, and vegetables, we run a series of six regressions where the dependent variables are
whether a student consumed at least half or all of starchy side, fruit, or vegetable. In the
regressions consumption of fruits and vegetables, we include dummy variables for whether
celery, green beans, tomato soup, applesauce, fruit cocktail, bananas, canned peaches, and
potatoes were offered. Of course, there were many other sides offered, but these sides were
12
offered at least once before and after the total lunchroom makeover intervention, and these sides
are common items at meals.
Since we do not have individual consumption data, we are not able track individual
consumption patterns across time. Thus, we pool cross sections of data from each observation
date to estimate the effect that available sides and the total lunchroom makeover have on
consumption of starchy sides, fruits, and vegetables. Since we only use binary count data, we
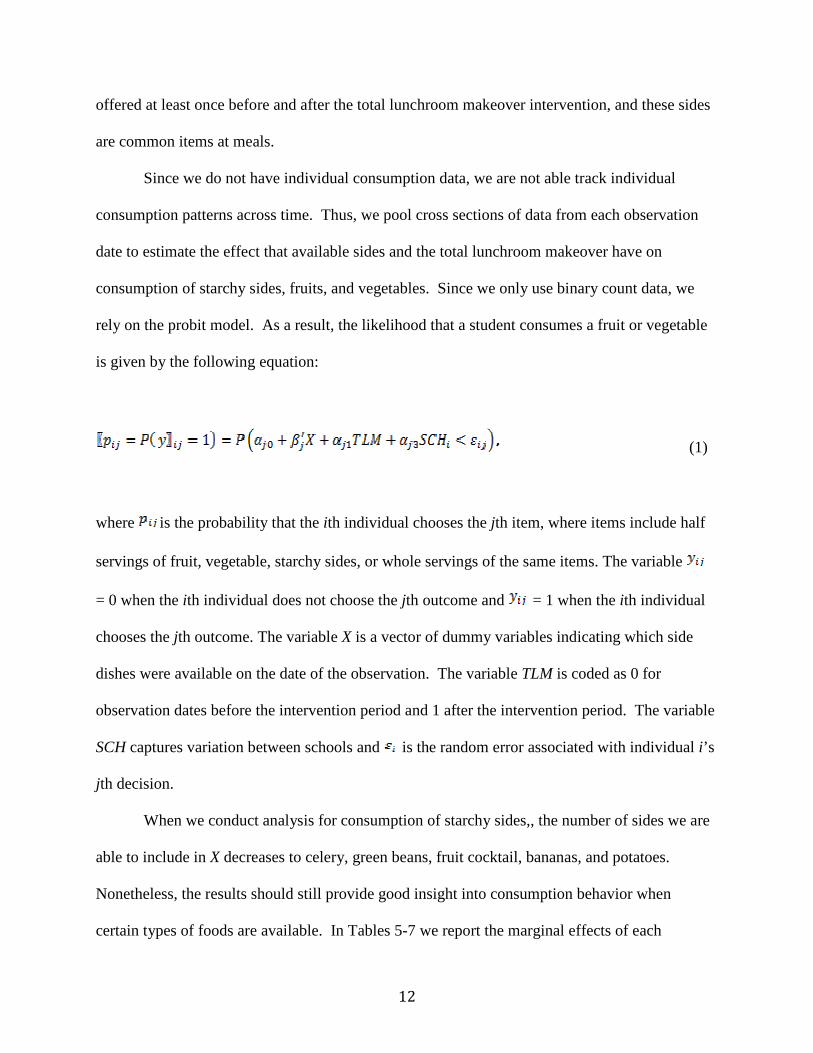
rely on the probit model. As a result, the likelihood that a student consumes a fruit or vegetable
is given by the following equation:
(1)
where is the probability that the ith individual chooses the jth item, where items include half
servings of fruit, vegetable, starchy sides, or whole servings of the same items. The variable
= 0 when the ith individual does not choose the jth outcome and = 1 when the ith individual
chooses the jth outcome. The variable X is a vector of dummy variables indicating which side
dishes were available on the date of the observation. The variable TLM is coded as 0 for
observation dates before the intervention period and 1 after the intervention period. The variable
SCH captures variation between schools and is the random error associated with individual i’s
jth decision.
When we conduct analysis for consumption of starchy sides,, the number of sides we are
able to include in X decreases to celery, green beans, fruit cocktail, bananas, and potatoes.
Nonetheless, the results should still provide good insight into consumption behavior when
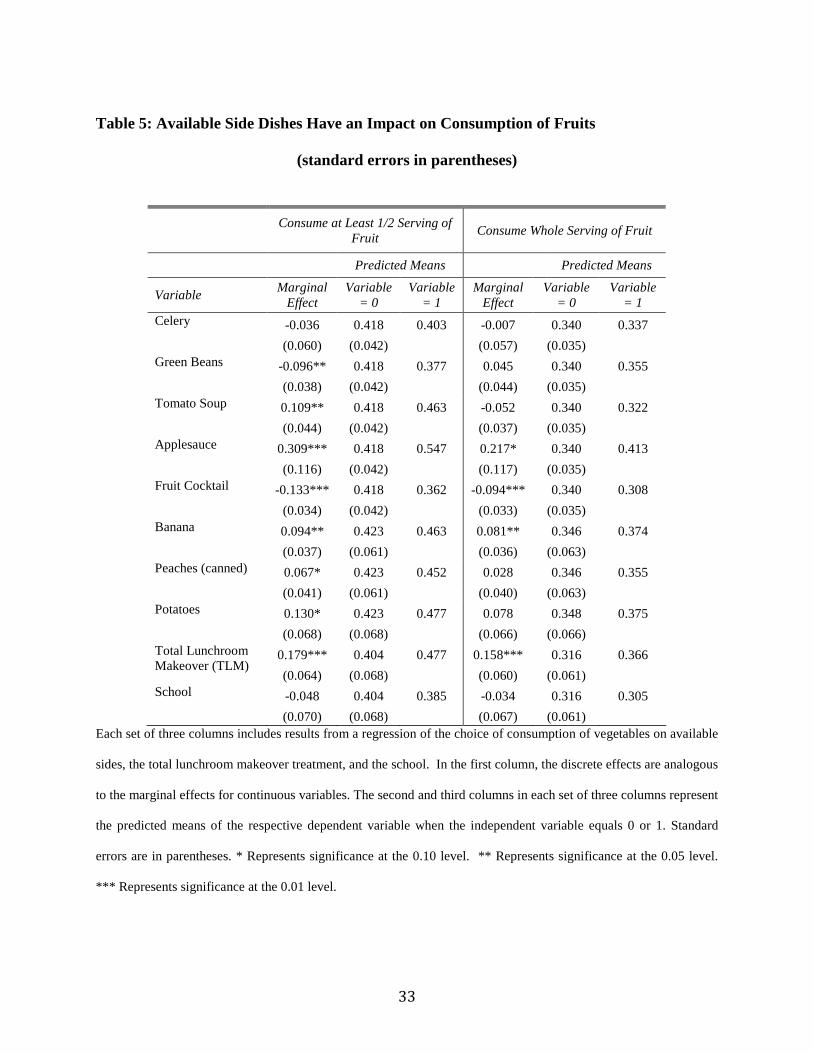
certain types of foods are available. In Tables 5-7 we report the marginal effects of each

13
regression variable and the predicted probabilities for consumption of starchy sides, fruits, and
vegetables before and after the total lunchroom makeover, as well as the predicted probability
when a particular side dish was and was not offered. We also report the standard errors for the
effects and denote statistical significance with asterisks.
To determine the impact of the total lunchroom makeover, we compare the predicted
probabilities of consumption before and after the total makeover was implemented. Figures 3(a-
b) graphically demonstrate the impact the total lunchroom makeover had on starchy side, fruit,
and vegetable consumption. We found that the total makeover slightly decreased the likelihood
that students consumed at least half a serving of a starchy side from 10% to 9.7% and slightly
increased the likelihood that they consumed a whole serving of a starchy side from 6% to 6.1%,
though these results are not statistically significant. Thus, after controlling for availability of
sides, the total lunchroom makeover did not have a significant impact on the consumption of
starchy sides.
In terms of fruit and vegetable consumption, the total lunchroom makeover increased the
likelihood that students consumed at least half a serving of fruit from 40.4% to 47.7% (p-value =
0.003) and it increased the likelihood that students consumed a whole serving of fruit from
31.6% to 36.6% (p-value = 0.005). For vegetables, the total lunchroom makeover increased the
likelihood that students consumed at least half a serving of vegetables from 33.7% to 42% (p-
value < 0.001) and it increased the likelihood that students consumed a whole serving of
vegetables from 18.7% to 20.5% (p-value = 0.020). It is clear that once we control for
availability of sides, the total lunchroom makeover has a significant impact on fruit and
vegetable consumption and selection.

14
In addition to the impact of the total lunchroom makeover, we are interested in the effect
that available sides have on consumption. In contrast to the result that the total lunchroom
makeover did not have an impact on starchy side consumption, we do find that the availability of
sides did have a significant impact on the consumption of starchy sides. First of all, we find that
the likelihood that students consumed at least half a serving of a starchy side increased from
26.3% when green beans were not offered to 32.5% when they were offered (p-value < 0.001)
and increased from 23% when potatoes were not offered to 25.6% when they were offered (p-
value < 0.001). When we take these results one step further, we find that the likelihood that
students consumed a whole serving of starches increased from 19% when green beans were not
offered to 23% when they were offered (p-value < 0.001) and consumption increased from 16%
when potatoes were not offered to 17.7% when they were offered (p-value < 0.001).
On the flip side, when celery and bananas were offered, consumption of starchy sides
decreased. Specifically, the likelihood that a student consumed at least half a serving of starchy
sides decreased from 26.3% when celery was not offered to 22.3% when it was offered (p-value
< 0.001) and decreased from 27.8% when bananas were not offered to 24.8% when they were (p-
value = 0.004). There is clear evidence that the availability of sides does have an impact on
whether students took and consumed a starchy side.
In terms of fruit selection, we find that the likelihood of consuming at least half a serving
of fruit increased from 41.8% to 46.3% when tomato soup was offered (p-value = 0.016),
increased from 41.8% to 54.7% when applesauce was offered (p-value = 0.010), increased from
42.3% to 46.3% when bananas were offered (p-value = 0.011), increased from 42.2% to 45.2%
when peaches were offered (p-value = 0.10; marginally significant), and increased from 42.3% to
47.7% when potatoes were offered (p-value = 0.055). A sequential step in analysis is to

15
determine which sides have an impact on consumption of a whole serving of fruit. We find that
the likelihood of consuming a whole serving of fruit increased from 34% to 41.3% when
applesauce was offered (p-value = 0.065) and increased from 34.6% to 37.4% when bananas
were offered (p-value = 0.023). This suggests that students enjoy only certain sides enough to
consume the whole serving. It is important to notice, however, that availability of other sides
does encourage at least some consumption of fruit so students are at least trying certain sides.
We also identified side dishes that had a negative impact on fruit consumption. We find
that the likelihood of consuming at least half a serving of fruit decreases from 41.8% to 37.7%
when green beans are offered (p-value = 0.013) and decreases from 41.8% to 36.2% when fruit
cocktail is offered (p-value < 0.001). Fruit cocktail is the only side that had a negative
statistically significant impact on consumption of a whole serving of fruit. We find that the
likelihood of consuming a whole serving of fruit decreased from 34% to 30.8% when fruit
cocktail was offered (p-value = 0.004).
Now that we have identified that sides that affect consumption of fruit, we examine
which sides affect consumption of vegetables. Specifically, the likelihood of consuming at least
half a serving of vegetables increased from 23.5% to 27.4% when green beans were offered (p-
value < 0.001), increased from 23.5% to 33.2% when applesauce was offered (p-value < 0.001),
increased from 23.5% to 25.7% when fruit cocktail was offered (p-value = 0.006), increased
from 28.8% to 30.9% when bananas were offered (p-value = 0.030), increased from 28.8% to
34.8% when peaches were offered (p-value < 0.001), and increased from 28% to 32.9% when
potatoes were offered (p-value = 0.008). These strong results died out when we examined the
impact of side selection on consumption of a whole serving of vegetables. We find that when
green beans were offered the likelihood of consuming a whole serving of vegetables increased
16
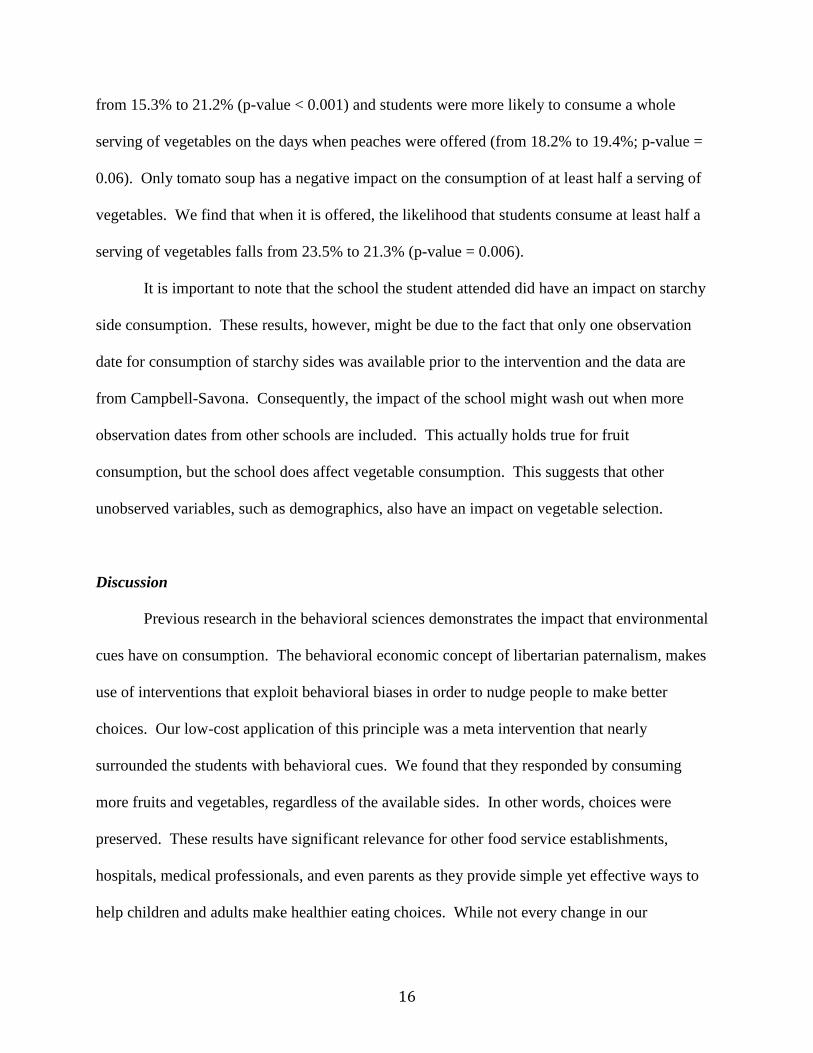
from 15.3% to 21.2% (p-value < 0.001) and students were more likely to consume a whole
serving of vegetables on the days when peaches were offered (from 18.2% to 19.4%; p-value =
0.06). Only tomato soup has a negative impact on the consumption of at least half a serving of
vegetables. We find that when it is offered, the likelihood that students consume at least half a
serving of vegetables falls from 23.5% to 21.3% (p-value = 0.006).
It is important to note that the school the student attended did have an impact on starchy
side consumption. These results, however, might be due to the fact that only one observation
date for consumption of starchy sides was available prior to the intervention and the data are
from Campbell-Savona. Consequently, the impact of the school might wash out when more
observation dates from other schools are included. This actually holds true for fruit
consumption, but the school does affect vegetable consumption. This suggests that other
unobserved variables, such as demographics, also have an impact on vegetable selection.
Discussion
Previous research in the behavioral sciences demonstrates the impact that environmental
cues have on consumption. The behavioral economic concept of libertarian paternalism, makes
use of interventions that exploit behavioral biases in order to nudge people to make better
choices. Our low-cost application of this principle was a meta intervention that nearly
surrounded the students with behavioral cues. We found that they responded by consuming
more fruits and vegetables, regardless of the available sides. In other words, choices were
preserved. These results have significant relevance for other food service establishments,
hospitals, medical professionals, and even parents as they provide simple yet effective ways to
help children and adults make healthier eating choices. While not every change in our

17
experiment is relevant for every locations, the application of libertarian paternalism to an
environment can significantly impact eating behaviors and potentially lead to healthier habits in
the long run.
We also point out that our results demonstrate both that students who already ate fruits
and vegetables increased their consumption, while some who did not eat them prior to the
intervention began to consume some of these items. Since consumption of at least half a serving
of fruits or vegetables means that there was an increase from nothing to something consumed,
students were nudged to at least try a fruit or vegetable. This is in stark contrast to the result that
students consumed 69% fewer carrots when forced to take them, compared to 89% that
consumed them when given an option between carrots and celery (Just and Wansink 2009).
Since we preserved choice, it is likely that students did not feel restricted but the environmental
cues led many to eat fruits and vegetables when they didn’t do so before.
We also find that sweeter fruits offered in the cafeteria–bananas, peaches, and
applesauce–led to greater consumption of fruits and vegetables. We find that when bananas
were offered, students apparently substituted starchy side consumption for fruit and vegetable
consumption. Yet this is likely due to the fact that on the two days when bananas were offered,
no starchy sides were offered. When applesauce and peaches were offered, students did not
consume fewer starchy sides, but they did consume more fruits and vegetables. Students
apparently like the peaches and applesauce, which are sweeter servings of fruit.
Two sides had a big positive impact on starchy side consumption. When green beans
were offered, students took and consumed more starchy sides, less fruit, and consumed more
vegetables. Students actually took fewer vegetables, so it is possible that those who generally
took a non-salad vegetable did not take green beans and substituted towards a starch side, or
18
some students who normally took salad could have taken green beans while others took a starchy
side. Nonetheless, students did consume more of the vegetables they took. Unfortunately,
students substituted fruit consumption for starchy side consumption when green beans were
offered. This is very striking because green beans were offered on days when very popular fruits
were offered–applesauce and bananas.
While our findings are promising, the study does have some limitations. First of all, we
only collected data on fruit, vegetables, and starchy sides consumed instead of specific types of
items consumed. Thus, the analysis was restricted to studying consumption of the fruits,
vegetables, and starchy side groups instead of consumption of specific items. This also limited
the analysis for selection of foods when certain items were available.
Our measurement methodology also has its disadvantages. Since the field researchers
only estimated whether none, half, or all of a side was eaten, we cannot generate accurate
consumption measures from the data. Thus, we rely on studying changes in the likelihood of
consuming fruits or vegetables. The repeated cross section nature of the study does not allow us
to track individual consumption over time. While this is a limitation, it may not be worth the
cost–in terms of experimental design–to track individual consumption.
Conclusion
With childhood obesity on the rise, there is a strong urge for policy makers to enact
legislation that is designed to reverse, or at least slow the trend. Unfortunately, many policies
tend to restrict choices and can lead to a pushback from youth. Recent legislation has placed
restrictions on foods that can be offered in school cafeterias but we propose that children can

19
make healthier choices, even with the unhealthy options, if they are gently nudged in the proper
direction.
We implemented a series of changes in a high school cafeteria based on the principle of
asymmetric paternalism. We find that our set of interventions actually increased consumption of
fruits and vegetables and had no effect on the consumption of starchy sides. These results are
very important because they demonstrate the impact that small behavioral changes can have on
food choices, even when unhealthy options are available.
We also find that availability of certain sides has an impact on consumption of starchy
sides, fruits and vegetables. First of all, without out considering the impact that available food
options have on consumption of starchy sides, it appears that the total lunchroom makeover
would have increased the consumption of starchy sides by well over 100%! When we control,
however, for available food options in a regression analysis, this result vanishes and we find that
the total lunchroom makeover actually has little or no effect on the consumption of starchy sides.
It is the availability of food options, and other unobservable characteristics, that appear to have
an impact on consumption of starchy sides. Furthermore, we find that students substitute
between consumption of starchy sides, fruit, and vegetables when specific sides are offered.

20
References Berning, Joshua P., Hayley H. Chouinard, and Jill J. McCluskey. “Do Positive Nutrition Shelf
Labels Affect Consumer Behavior? Findings From a Field Experiment With Scanner Data.” American Journal of Agricultural Economics 93, no.2 (2010): 364-369.
Caplin, Andrew, and John Leahy. “The Supply of Information by a Concerned Expert.” The
Economic Journal 114 (July 2004): 487-505. Cairns, John, and Marjon van der Pol. “Valuing Future Private and Social Benefits: The
Discounted Utility Model Versus Hyperbolic Discounting Models. Journal of Economic Psychology 21 (2000): 191–205.
Caldwell, Clare, and Sally A. Hibbert. “The Influence of Music Tempo and Musical Preference
on Restaurant Patrons’ Behavior.” Psychology and Marketing 19 (2002): 895–917. Downs, Julie S., George Loewenstein, and Jessica Wisdom. “Strategies for Promoting Healthier
Food Choices.” American Economic Review, 2009; 99(2): 159-164. Faith, Myles S., Kelley S. Scanlon, Leann L. Birch, Lori A. Francis, and Bettylou Sherry.
“Parent-Child Feeding Strategies and Their Relationships to Child Eating and Weight Status.” Obesity Research 12, no. 11 (2004): 1711-1722.
Fisher, Jennifer O., and Leann L. Birch. “Restricting Access to Palatable Foods Affects
Children’s Behavioral Response, Food Selection, and Intake.” The American Journal of Clinical Nutrition 69 (1999): 1264-1272.
Fox, S., A. Meinen, M. Pesik, M. Landis, and P.L. Remington. “Competitive Food Initiatives in
Schools and Overweight in Children: A Review of the Evidence.” Wisconsin Medical Journal-Madson 104, no. 5 (2005): 38-43.
Hanks, Andrew S., David R. Just, Laura E. Smith, and Brian Wansink. "Healthy Convenience:
Nudging Students Toward Healthier Choices in the Lunchroom." Journal of Public Health. Hanks, Andrew S., David R. Just, and Brian Wansink. “Trigger Foods: The Influence of
‘Irrelevant’ Alternatives in School Lunchrooms.” Agricultural and Resource Economics Review, in press.
Harrison, Glenn W., and John A. List. (2004). Field Experiments. Journal of Economics
Literature, 42(4): 1009-1055. “Healthy, Hunger-Free Kids Act of 2010 Fact Sheet,” accessed October 6, 2011,
http://www.whitehouse.gov/sites/default/files/Child_Nutrition_Fact_Sheet_12_10_10.pdf. Hurley, Kristen M., Matthew B. Cross, and Sheryl O. Hughes. “A Systematic Review of
Responsive Feeding and Child Obesity in High-Income Countries.” The Journal of Nutrition (2011): 495-501.

21
Jensen, J.D., H. Hartmann, A. de Mul, A. Schuit, and J. Brug. “Economic Incentives and
Nutritional Behavior of Children in the School Setting: A Systematic Review.” Nutrition Review 69, no. 11 (2011): 660-674.
Johnson, Susan L., and Leann L. Birch. “Parents’ and Children’s Adiposity and Eating Style.”
Pediatrics 94 (1994): 653-661. Just, David R., and Brian Wansink. "Better School Meals on a Budget: Using Behavioral
Economics and Food Psychology to Improve Meal Selection. Choices 24, no.3 (2009): 1-6. ––––––––. “The Flat-Rate Pricing Paradox: Conflicting Effects of ‘All-You-Can-Eat’ Buffet
Pricing.” The Review of Economics and Statistics, February 2011, 93(1): 193-200. Knoferle, K.M., E.R. Spangberg, A. Herrmann, and J.R. Landwehr. “It is all in the Mix: The
Interactive Effect of Music Tempo and Mode on In-Store Sales.” Marketing Letters (2011): 1-13.
Levitt, Steven D., and List, John A. (2009). Experiments in Economics: The Past, the Present,
and the Future. European Economic Review, 53: 1-18. List, John A. (2009). An Introduction to Field Experiments in Economics. Journal of Economics
Behavior and Organization, 70: 439-442. List, John A. 2011. “Why Economists Should Conduct Field Experiments and 14 Tips for
Pulling One Off.” Journal of Economic Perspectives 25(3): 3-16. Loewenstein, George. “Emotions in Economic Theory and Economic Behavior.” The American
Economic Review 2000; 90(2):426-432. Loewenstein, George, Troyen Brennan, and Kevin G. Volpp. “Asymmetric Paternalism to
Improve Health Behaviors.” Journal of the American Medical Association 298, no.20 (2007): 2415-2417.
Lyman B. A Psychology of Food. More Than a Matter of Taste. New York: Van Nostrand-
Reinhold, 1989. Lin, Ingrid Y., and Anna S. Mattila. “Restaurant Servicescape, Service Encounter, and
Perceived Congruency on Customer’s Emotions and Satisfacton.” Journal of Hospitality and Management 9, no. 8 (2010): 819-841.
Massara, F., S.S. Liu, and R.D. Melara. “Adapting to a Retail Environment: Modeling
Consumer-Environment Interactions.” Journal of Business Research 63, no. 71 (2010): 673-681.
North, Adrian C., and David J. Hargreaves. “The Effects of Music on Responses to a Dining

22
Area.” J. Environ. Psychol 24 (1996): 55–64. Price, Joseph, and David R. Just. “Getting Kids to Eat Their Veggies.” Paper presented at the
International Association of Agricultural Economists 27th Triennial Converence, Beijing, China, 2010.
Probart, C., E. McDonnell, T. Hartman, J.E. Welrich, and L. Bailey-Davis. “Factors Associated
with the Offering and Sale of Competitive Foods and School Lunch Participation.” Journal of the American Dietetic Association 106 (2006): 242-247.
Roe, Brian E., and David R. Just. “Internal and External Validity in Economics Research:
Tradeoffs Between Experiments, Field Experiments, Natural Experiments, and Field Data.” American Journal of Agricultural Economics. January 2009.
Rolls, E.T., and J. H. Rolls. “Olfactory Sensory-Specific Satiety in Humans.” Physiology and
Behavior 61 (1997): 461–73. Schwartz, Marlene B. “The Influence of a Verbal Prompt on School Lunch Fruit Consumption:
A Pilot Study.” Journal of Behavioral Nutrition and Physical Activity 4, no. 6 (2007): 1-5. Sommer, Robert. Personal Space. The Behavioral Basis of Design. Englewood Cliff, NJ:
Prentice-Hall, 1969. Stevenson, Richard J., and Robert A. Boakes. “Confusing Tastes and Smells: How Odors Can
Influence the Perception of Sweet and Sour Tastes.” Chemical Senses 24 (1999): 627–35. Thaler, Richard H., and Cass R. Sunstein. Nudge. New York: Knopf, 2008. Turley, L. W., and R. E. Millman. “Atmospheric Effects on Shopping Behavior: A Review of
the Experimental Evidence.” Journal of Business Research 49, no. 2 (2000): 193-211. United States Department of Agriculture Food and Nutrition Service. “Nutrition Standards in
the National School Lunch and School Breakfast Programs.” Federal Register 77, no. 17, Rules and Regulations (2012): 4088-4167.
Wansink, Brian. “Environmental Factors That Increase the Food Intake and Consumption
Volume of Unknowing Consumers.” Annual Review of Nutrition 24 (2004): 455-79. –––––– Collin R. Payne, and Jill North. “Fine as North Dakota Wine: Sensory Expectations and
the Intake of Companion Foods.” Physiology & Behavior 90 (2007): 712-716. –––––– Koert van Ittersum, and James E. Painter. “How Descriptive Food Names Bias Sensory
Perceptions in Restaurants.” Food Quality and Preference 16, no. 5 (2005): 393-400. –––––– David R. Just, and Joe McKendry. “Lunch Line Redesign.” New York Times. October
22, 2010, A10.
23
–––––– and David R. Just. “Healthy Foods First: Students Take the First Lunchroom Food 11%
More Often Than the Third.” Journal of Nutrition Education and Behavior 43 (2011): 4S1, S9.
–––, Laura E. Smith." Move the Fruit: Putting Fruit in New Bowls and New Places Doubles
Lunchroom Sales." Journal of Nutrition Education and Behavior 43 (2011a): 4S1, S1. –––. “What is in a Name? Giving Descriptive Names to Vegetables Increases Lunchroom
Sales.” Journal of Nutrition Education and Behavior 43 (2011b): 4S1, S1. Watanabe, Teresa. “L.A. Schools’ Healthful Lunch Menu Panned by Students.” Los Angeles
Times December 17, 2011. http://articles.latimes.com/print/2011/dec/17/local/la-me-food-lausd-20111218, Accessed Feb 15, 2012.
Zampollo, Francesca, Kevin M. Kniffin, Brian Wansink, and Mitsuru Shimizu. “Food Plating
Preferences of Children: The Importance of Presentation on Desire for Diversity.” ACTA Paediatrica (2011).

24
Figures
Figure 1: From March To Mid-June There Is Little Change In The Probability Of
Selecting A Meal in Control Schools

25
Figures 2(a-b): Unconditional Means Suggest the Total Lunchroom Makeover Has Big
Effects on Starchy Side Consumption
2a.

26
2b.

27
Figures 3(a-b): The Total Lunchroom Makeover Nudged Students To Consume More
Fruits and Vegetables (predicted probabilities)
3a.
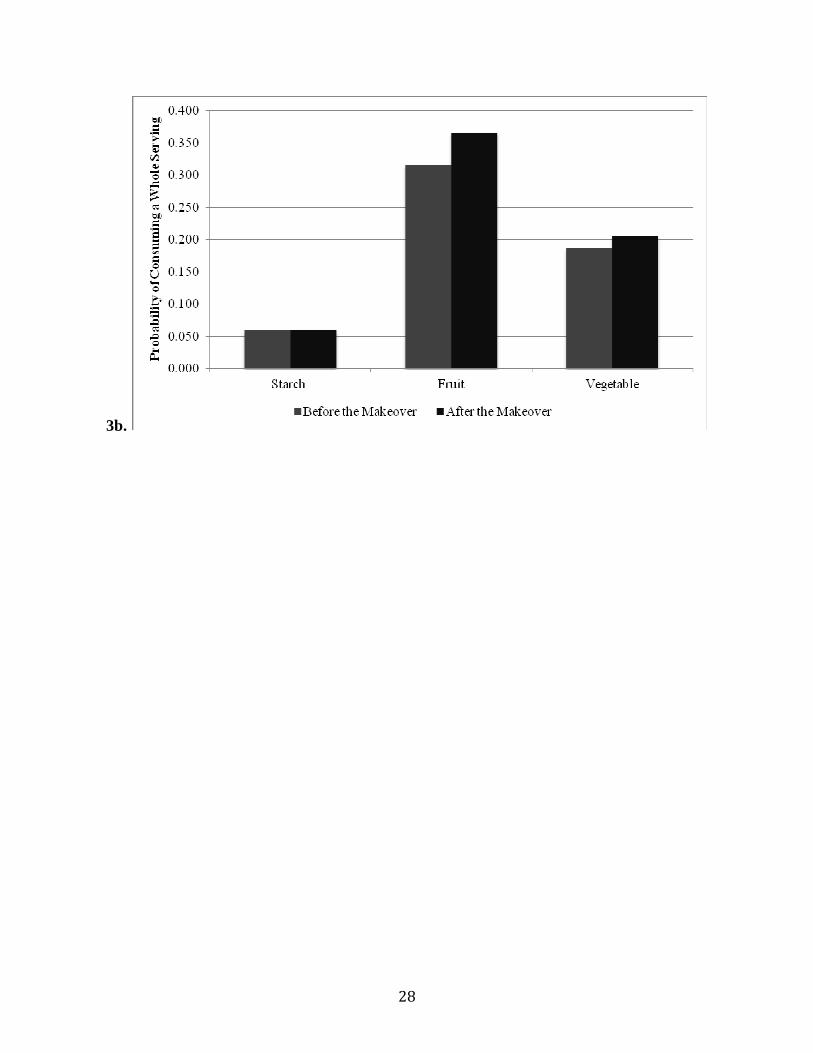
28
3b.

29
Tables
Table 1: Dates and Sample Sizes for Observations at Addison and Campbell-Savona
Central Schools
Addison N Campbell-Savona N
15-Mar-11 379 14-Mar-11 247
17-Mar-11 388 16-Mar-11 251
18-Mar-11 359 21-Mar-11 259
13-May-11 367 19-May-11 242
17-May-11 376 20-May-11 244
8-Jun-11 373 6-Jun-11 283
9-Jun-11 352 9-Jun-11 249
13-Jun-11 371
30
Table 2: Meal and Side Dish Selection Exhibit Very Small but Significant Upward Trends
in Control Schools
Variable Coefficient t-statistic Variable Coefficient t-statistic
Meal Ice Cream
Time Trend 0.0004*** 6.100 Time Trend -0.0002*** -1.790 (0.000) (0.000) (0.000) (0.073) Treatment Period 0.013*** 5.460 Treatment Period -0.003*** -0.560 (0.002) (0.000) (0.006) (0.578) Constant 0.919*** 127.320 Constant 0.167** 15.560 (0.007) (0.000) (0.011) (0.000)
Starchy Side Fruit and Vegetables
Time Trend 0.002*** 32.890 Time Trend 0.018*** 228.450 (0.000) (0.000) (0.000) (0.000) Constant -0.006*** -2.650 Constant -0.251*** -48.070 (0.002) (0.008) (0.005) (0.000)
White Milk Flavored Milk Time Trend 0.002*** 36.820 Time Trend 0.018*** 246.970
(0.000) (0.000) (0.000) (0.000)
Constant -0.002*** -0.520 Constant -0.260*** -48.020 (0.005) (0.602) (0.005) (0.000)
Each set of results corresponds to a regression of the dependent variable on a time trend and the treatment period.
Data are from schools that did not participate in the total lunchroom makeover, i.e., control schools. ** Significant
at the 0.05 level. *** Significant at the 0.01 level.
31
Table 3: Unconditional Means Suggest the Total Lunchroom Makeover Dramatically
Increased the Consumption of Starchy Sides
(standard errors and p-values in parentheses)
Probability of Consuming at Least Half a Serving
Before the Total
Makeover After the Total
Makeover Percent Change
t-statistic of Difference
Starch 0.100 0.334 2.343 18.846*** (0.009) (0.007) (0.000)
Fruit 0.378 0.446 0.181 4.553** (0.010) (0.011) (0.000)
Vegetables 0.279 0.271 -0.029 0.599 (0.009) (0.010) (0.275)
Probability of Consuming a Whole Serving
Before the Total
Makeover After the Total
Makeover Percent Change
t-statistic of Difference
Starch 0.063 0.256 3.055 17.276*** (0.009) (0.006) (0.000)
Fruit 0.300 0.374 0.250 5.192*** (0.010) (0.011) (0.000)
Vegetables 0.161 0.180 0.118 1.649** (0.008) (0.008) (0.050)
*** Significant at the 0.01 level. ** Significant at the 0.05 level. * Significant at the 0.10 level.

32
Table 4: Available Side Dishes Have an Impact on Consumption of Starchy Sides
(standard errors in parentheses)
Consume at Least 1/2 a Serving of a Starchy Side
Consume a Whole Serving of a Starchy Side
Predicted Means Predicted Means
Variable Marginal
Effect Variable
= 0 Variable
= 1 Marginal
Effect Variable
= 0 Variable
= 1
Celery -0.153*** 0.263 0.223 -0.114*** 0.190 0.168
(0.031) (0.091) (0.029) (0.068)
Green Beans 0.239*** 0.263 0.325 0.213*** 0.190 0.230
(0.029) (0.091) (0.029) (0.068)
Fruit Cocktail -0.002 0.263 0.262 0.014 0.190 0.192
(0.038) (0.091) (0.035) (0.068)
Banana -0.106*** 0.278 0.248 -0.083** 0.212 0.194
(0.037) (0.122) (0.033) (0.094)
Potatoes 0.112*** 0.230 0.256 0.106*** 0.160 0.177
(0.023) (0.132) (0.021) (0.097)
Treatment -0.025 0.100 0.097 0.014 0.060 0.061
(0.055) (0.000) (0.049) (0.000)
School -0.330*** 0.100 0.067 -0.242*** 0.060 0.045
(0.040) (0.000) (0.037) (0.000) Each set of three columns includes results from a regression of the choice of consumption of vegetables on available
sides, the total lunchroom makeover treatment, and the school. In the first column, the discrete effects are analogous
to the marginal effects for continuous variables. The second and third columns in each set of three columns represent
the predicted means of the respective dependent variable when the independent variable equals 0 or 1. Standard
errors are in parentheses. * Represents significance at the 0.10 level. ** Represents significance at the 0.05 level.
*** Represents significance at the 0.01 level.
33
Table 5: Available Side Dishes Have an Impact on Consumption of Fruits
(standard errors in parentheses)
Consume at Least 1/2 Serving of
Fruit Consume Whole Serving of Fruit
Predicted Means Predicted Means
Variable Marginal
Effect Variable
= 0 Variable
= 1 Marginal
Effect Variable
= 0 Variable
= 1 Celery -0.036 0.418 0.403 -0.007 0.340 0.337
(0.060) (0.042) (0.057) (0.035)
-0.096** 0.418 0.377 0.045 0.340 0.355 Green Beans
(0.038) (0.042) (0.044) (0.035)
0.109** 0.418 0.463 -0.052 0.340 0.322 Tomato Soup
(0.044) (0.042) (0.037) (0.035) Applesauce 0.309*** 0.418 0.547 0.217* 0.340 0.413
(0.116) (0.042) (0.117) (0.035)
-0.133*** 0.418 0.362 -0.094*** 0.340 0.308 Fruit Cocktail
(0.034) (0.042) (0.033) (0.035) Banana 0.094** 0.423 0.463 0.081** 0.346 0.374
(0.037) (0.061) (0.036) (0.063)
0.067* 0.423 0.452 0.028 0.346 0.355 Peaches (canned)
(0.041) (0.061) (0.040) (0.063) Potatoes 0.130* 0.423 0.477 0.078 0.348 0.375
(0.068) (0.068) (0.066) (0.066)
0.179*** 0.404 0.477 0.158*** 0.316 0.366 Total Lunchroom Makeover (TLM)
(0.064) (0.068) (0.060) (0.061) School -0.048 0.404 0.385 -0.034 0.316 0.305
(0.070) (0.068) (0.067) (0.061) Each set of three columns includes results from a regression of the choice of consumption of vegetables on available
sides, the total lunchroom makeover treatment, and the school. In the first column, the discrete effects are analogous
to the marginal effects for continuous variables. The second and third columns in each set of three columns represent
the predicted means of the respective dependent variable when the independent variable equals 0 or 1. Standard
errors are in parentheses. * Represents significance at the 0.10 level. ** Represents significance at the 0.05 level.
*** Represents significance at the 0.01 level.

34
Table 6: Available Side Dishes Have an Impact on Consumption of Vegetables (standard
errors in parentheses)
Consume at Least 1/2 Serving of Vegetables
Consume Whole Serving of Vegetables
Predicted Means Predicted Means
Variable Marginal
Effect Variable
= 0 Variable
= 1 Marginal
Effect Variable
= 0 Variable
= 1
Celery -0.057 0.235 0.221 -0.032 0.153 0.148
(0.056) (0.068) (0.048) (0.048)
Green Beans 0.166*** 0.235 0.274 0.162*** 0.153 0.212
(0.042) (0.068) (0.040) (0.048)
Tomato Soup -0.092*** 0.235 0.213 -0.045 0.153 0.174
(0.033) (0.068) (0.029) (0.048)
Applesauce 0.415*** 0.235 0.332 0.140 0.153 0.208
(0.106) (0.068) (0.103) (0.048)
Fruit Cocktail 0.093*** 0.235 0.257 0.007 0.153 0.184
(0.034) (0.068) (0.029) (0.048)
Banana 0.076** 0.288 0.309 -0.005 0.182 0.182
(0.035) (0.124) (0.029) (0.058) Peaches (canned)
0.211*** 0.288 0.348 0.065* 0.182 0.194
(0.042) (0.124) (0.035) (0.058)
Potatoes 0.177*** 0.280 0.329 0.061 0.164 0.194
(0.065) (0.126) (0.056) (0.072)
Treatment 0.245*** 0.337 0.420 0.098** 0.187 0.205
(0.050) (0.133) (0.045) (0.085)
School -0.170*** 0.337 0.280 -0.051 0.187 0.173
(0.066) (0.133) (0.056) (0.085) Each set of three columns includes results from a regression of the choice of consumption of vegetables on available
sides, the total lunchroom makeover treatment, and the school. In the first column, the discrete effects are analogous
to the marginal effects for continuous variables. The second and third columns in each set of three columns represent
the predicted means of the respective dependent variable when the independent variable equals 0 or 1. Standard
errors are in parentheses. * Represents significance at the 0.10 level. ** Represents significance at the 0.05 level.
*** Represents significance at the 0.01 level.