tortuosity, mean residence time, and deformation of tritium breakthroughs from soil columns
TRANSCRIPT
Tortuosity, Mean Residence Time, and Deformation of Tritium Breakthroughsfrom Soil Columns
L. Ma and H. M. Selim*
ABSTRACTTritium breakthrough curves (BTCs) are widely used to estimate the
hydrodynamic dispersion coefficient (D) of the convection-dispersionequation (CDE). However, D alone often provides inadequate fit.Therefore, a second parameter is commonly added to describe tritiumBTCs. We tested the validity of describing tritium transport using aneffective path length (L,) or a tortuosity factor (T) in the CDE. Weobtained the dimensionless parameter T from fitted L, and columnlength L such that t = LIL,. Miscible displacement experiments wereused to obtain tritium BTCs for several soils and materials in uniformlypacked columns under water-saturated and steady upward flow. Twotypes of tritium pulses were applied: the first was a small pulse (~ 0.03pore volume) and used to determine mean residence time (/„,) in soilcolumns. The tm values were obtained from the first time moment ofBTCs and were subsequently used to estimate L, and T. The secondtype of input pulse was about one pore volume and used to obtainthe parameters D and Le using the CDE. Tritium results exhibiteddouble peaks and extensive deformations of BTCs for several soils;these were more distinct with increasing pore water velocity. Usingthe principle of superposition, bimodal peaks from large pulse inputswere successfully described based on small-pulse BTCs. In addition,agreements between estimated t using small pulses and fitted T fromlarge pulses support the use of the fitting parameters D and L, in theCDE as an alternative method for describing tracer BTCs in soils.
L. Ma and H.M. Selim, Sturgis Hall, Agronomy Dep., Louisiana StateUniv., Baton Rouge, LA 70803. Contribution from the Louisiana Agric.Exp. Stn., LSU Agric. Center as manuscript no. 93-09-7334. This researchwas supported in part by CSRS Water Quality grant no. 9100657. Received2 July 1993. "-Corresponding author.
Published in Soil Sci. Soc. Am. J. 58:1076-1085 (1994).
SOLUTE TRANSPORT in soils is often studied by examin-ing measured BTCs or effluent concentrations from
miscible displacement experiments. One approach is themoment method, in which BTCs are characterized bytm, variance, skewness, and kurtosis. These parametersare represented by the first, second, third, and fourthtime moment of effluent concentration, respectively (Leijand Dane, 1991). Although the time to peak flow mayalso provide useful information on solute transport andretention (Hamlen and Kachanoski, 1992), the meanresidence time, tm, is a commonly used BTC parameterwhich may be expressed as (Leij and Dane, 1991):
tm =0tC(t)dt
°C(t)dt[1]
where C(t) is solute concentration in the effluent as afunction of time t.
Another approach to BTC analysis is based on thetraditional CDE. The CDE equation is characterizedby an average pore-water velocity v (convection) andhydrodynamic dispersion coefficient D. For a nonreactivetracer (3H2O or 3*C1), the CDE can be written as:
— = D—— - — 121dt dx2 vdxwhere C(x,t) represents tracer concentration (|ig mL~'),Abbreviations: BTC, breakthrough curve; CDE, convection-dispersionequation; TDR, time domain reflectometry.
MA & SELIM: DEFORMATION OF TRITIUM BREAKTHROUGHS FROM SOIL COLUMNS 1077
D is the hydrodynamic dispersion coefficient (cm2 h~')>v is the average pore-water velocity (cm h"1), / is time(h), and x is the spatial coordinate (cm). The followingboundary and initial conditions are commonly appliedwith the above CDE:
vC0 = -
0 = -
ox
dx
t = 0,0<x<Le
+ vC * = 0, t<tp
dx
[3]
[4]
[5]
[6]
where Le is the effective path length for solute transport(cm); 0 is the volumetric water content (cm3 cm"3); tpis the duration of solute pulse input (h); C\ is initialsolute concentration hi the soil column (p,g mLT1); andC0 is solute concentration of the applied pulse (ng mL~').
In a number of miscible displacement studies, themain purpose of a tracer application is to estimate D.A commonly used technique for estimating D is throughcurve fitting of a tracer ETC where 3H2O, 36C1, Br, orother tracers are used. Traditionally, we assume Le =L (column length) and attribute all variations to theparameter D. However, the goodness of fit of tracerBTCs are usually unacceptable when D is the only fittingparameter (Anamosa et al., 1990; Elprince and Day,1977). Thus, two parameters are fitted (D and v) inorder to improve the goodness of fit of tracer BTCs(Jaynes et al., 1988; Andreini and Steenhuis, 1990).Other commonly fitted parameters include tp and a retar-dation factor fl for solute retention (van Genuchten,1981). However, since v can be experimentally measuredunder steady-state flow, it may not be appropriate to fitv to achieve unproved fitting of BTCs. In addition,the best-fit v is often different from that experimentallyestimated (Gamerdinger et al., 1990).
One can also derive the CDE parameters based onthe method of moments (Leij and Dane, 1989, 1991).Hamlen and Kachanoski (1992) calculated v based ontm from the method of moments, that is v = L/tm.Based on calculated v and measured Darcy's flux q, theycalculated an effective moisture content (0T = q/v). Theircalculated 67 was greater than that measured using TDR,9V. However, when 0T was calculated using the timeto peak flow, the differences between 0T and 9V wereconsiderably decreased. On the other hand, Elrick et al.(1992) derived tm from the CDE-fitted parameter v andsoil column length L. They found that calculated tmbased on three different methods (CDE fitting, momentanalysis, and convective lognormal transfer function)were close to one another. Based on these studies, if weuse tm from Eq. [1] and measured v from controlledwater flux, we can obtain an "equivalent column length"Le (=vfm). Such a parameter Le is a measure of theeffective solute transport length.
By defining a set of dimensionless parameters, Eq.[2] can be rewritten as:
dT P dzwhere
= —= L*
~Dx
[7]
[8]
[9]
[10]
The solution to Eq. [7] with initial and boundary condi-tions shown in Eq. [3] through [6] can be expressed as(Brenner, 1962):
d + (Co - C f)A(z,t) 0<t<tp
d + (Co - Ci) A(z,t) - CoA(z, t - tp) t>tp
[H]where
P[fim cos(pmz) + -
?P PT R2
- — - ?
P2 \ / P2f + — + PI I R2 -I- —im -i- i- r i pm -i-
[12]and the eigenvalue Pm is the positive roots of
[B]
For z = 1, we have the effluent concentration C(t)ao =
(C0 - Cf) A( 1 ,t(Co -
0<t<tp
t>tp
[14]where
,0 = 1- Sm = 1
P /P PT R2
[pm cos(pm) + r- sin(pm)]exp ̂ - — - H=
[15]Therefore, C(f) is a function of P and 71, which, in turn,are functions of v, D, and Le. As a result, one can obtainbest-fit estimation of BTCs using either Le or v, sinceit is mathematically equivalent to fit Le and v. However,fitting Le is more physically meaningful than fitting v,
1078 SOIL SCI. SOC. AM. J., VOL. 58, JULY-AUGUST 1994
Table 1. Taxonomic classification and selected properties of soils in this study.
Soil and horizon
Sharkey ApCecil BtEustis ApMahan BDothan ApDothan Bt
Classification
very-fine, montmorillonitic, nonacid, thermic Vertic Haplaqueptclayey, kaolinitic, thermic Typic Kanhapludultsandy, siliceous, thermic Psammentic Paleudultclayey, kaolinitic, thermic Typic Hapludultfine-loamy, siliceious, thermic Plintic Kandiudultfine-loamy, siliceous, thermic Plintic Kandiudult
pH
6.55.44.95.66.46.8
Organicmatter
gkg-1
172.67.1582
Clay
61514
401140
Silt—— % —
36196
10137
Sand
33090507653
because v can be estimated experimentally under steady-state water flux. One advantage of fitting Le is that wecan define a tortuosity factor (t) from the fitted Le andL such that T = L/Le. The other advantage is that Lecan be verified experimentally from measured tm. In fact,T has been widely used in the solute diffusion equation,where T is incorporated into an effective diffusion coeffi-cient (L\) (Porter et al., 1960; Olsen and Kemper, 1968;van Schaik and Kemper, 1966; Gillham et al., 1984;Robin et al., 1987; Sadeghi et al., 1989). Assuming Deas a function of T, Porter et al. (1960) estimated T basedon measured De. A similar approach was used by otherinvestigators. For example, Gillham et al. (1984) andRobin et al. (1987) estimated T from De in bentonite-sand mixtures for Cl diffusion that was subsequentlyused to predict Sr diffusion. Van Schaik and Kemper(1966) estimated T ranging from 0.70 to 0.74 dependingon soil water content and flow pattern. Gillham et al.(1984) calculated T of 0.77 to 0.92 from Cl diffusionand 0.57 to 0.84 from tritium diffusion in bentonite-sand mixtures. They also found that T is higher in puremedia than in mixed media. Porter et al. (1960) estimatedT of 0.39 for a silty clay loam soil under tension of 101kPa. Sadeghi et al. (1989) calculated a value of 0.85for T based on urea diffusion in seven soils. However,based on the above investigations and a literature search,we found that application of the tortuosity concept tomodeling of solute transport in the soil profile is sparse.
Based on the solution given by Eq. [14] for the CDE(Eq. [7]), we can easily show that effluent concentrationC for a pulse having a duration tp is identical to thatderived for a system composed of a series of smaller(successive) input pulses (or impulses) under the sameconditions; i.e., the samel), 6, p, v, etc. In other words,the total sum of the solutions given by Eq. [14] for nsuccessive CDEs having input pulses of different dura-tions, 0<t<ti,ti<t<t2,t2<t<t3, ... ,/•„-! < t <
Table 2. Measured aggregate-size distributions of selected soilsused.
Soil andhorizon
Dothan ApDothan BtMahanBCecil BtEustis ApGlass beadsAcid-washed
sand
1.0-2.0 mm
2.241.871.261.980.000.000.00
0.50-1.0 mm
27.4319.9530.7416.485.%0.000.77
0.25-0.50 mm
a
43.8224.7633.0350.6360.430.00
79.96
0.05-0.25 mm
21.9631.818.3323.6633.6197.2319.23
0-0.05 mm
4.1821.3716.517.160.002.130.00
tn, is identical to that for one single large input pulse ofduration tp provided that tp = tn. This property is calledthe principle of superposition and is true for linear equa-tions such as the CDE given in Eq. [14] (Chapman,1985). Therefore, one concludes that the soil system islinear in terms of solute transport if the superpositionof a number of small pulses yields the identical ETC asa large pulse with the same tf.
Preferential flow is another phenomenon that can beexamined based on ETC analysis. In a field study withthree Swedish soils, Bergstrom (1990) claimed preferen-tial flow path when he detected chlorsulfuron and meta-sulfuron methyl after 70 mm of accumulated drainage,which was considerably smaller than one pore volumefor the soil profile. Omoti and Wild (1979) determinedpreferential flow path by analyzing the cross sectionof dyed soils. Singh and Kanwar (1991) suspected theexistence of rapid flow through macropores if the porevolume to achieve 0.5 relative solute concentration (ClC0) in the effluent was well before one pore volume.McMahon and Thomas (1974) quantified the bypassingflow of water and Cl by the pore volume at which thefirst significant amount of solute was detected in theeffluent. Andreini and Steenhuis (1990) examined prefer-ential flow in a Br study where BTCs from individualcollecting cells at the bottom of a grid lysimeter weremeasured. Of the total 52 cells at the bottom of thelysimeter, only 16 cells demonstrated water flow forno-till soil column and 21 cells for tilled soil column.They also confirmed the presence of preferential flowby examining the flow paths of a dye after dissectingsoil in the lysimeter.
In an attempt to describe the phenomenon of preferen-tial flow in soils, several models have been presentedin the literature. Van Genuchten and Wierenga (1976)proposed a mobile-immobile (two-region) approach toexplain the excessive tailing and early breakthrough un-der preferential flow. Hornberger et al. (1990) applieda time series model to describe Br transport in a forestsoil. Skoppetal. (1981) proposed a two-domain transportmodel to explain early breakthrough and bimodal peaksin solute transport. Utermann et al. (1990) successfullypredicted double peaks using a bimodal probability den-sity function.
In this study, miscible displacement methods wereused to obtain tritium BTCs for several soils and materialsin uniformly packed columns under water-saturated andsteady upward flow conditions. Since a literature searchrevealed that preferential flow was primarily observedin soils in which solute was driven by gravity, one
MA & SELIM: DEFORMATION OF TRITIUM BREAKTHROUGHS FROM SOIL COLUMNS 1079
Table 3. Selected parameters from large tritium pulses with their measured mean residence tune (C), fitted dispersion coefficient (D),fitted transport path length (L,), and calculated tortuosity (T).
Soil and aggregatesize
Sharkey, 4-6 mmSharkey, 4-6 mmEustis, <2 mmCecil, <2 mmCecil, <2 mmCecil, <2 mmCecil, 0.5-1.0 mmMahan, <2 mmMahan, <2 mmMahan, <2 mmDothan Ap, <2 mmDothan Bt, <2 mmAcid-washed sandGlass + sand*
Column
cm1015151515151515151515151515
Watercontent
cm3 cm"3
0.5920.5870.3940.4860.4700.4700.5520.5390.5550.5390.4140.4780.3730.350
Pbtgem"3
1.081.081.611.361.381.381.191.241.201.241.551.381.671.69
Velocity
cmh-'1.751.852.661.072.235.212.052.023.825-292.742.322.923.08
tmh
6.979.836.51
15.938.443.977.259.004.603.486.286.766.065.32
D fitted
cm2 h->9.02 ± 0.43617.66 ± 0.4082.02 ± 0.2132.39 ± 0.2468.32 ± 1.505
20.82 ± 3.0593.71 ± 0.6749.79 ± 1.529
15.86 ± 3.37623.05 ± 5.29111.03 ± 2.06311.07 ± 2.353
1.10 ± 0.0800.73 ± 0.089
L,, fitted
cm12.18 ± 0.14118.39 ± 0.24418.31 ± 0.26818.86 ± 0.42219.34 ± 1.02319.18 ± 0.44316.19 ± 0.61219.37 ± 0.84518.21 ± 1.12618.07 ± 1.16918.24 ± 0.36916.61 ± 0.87917.39 ± 0.10816.62 ± 0.144
RMSJ
0.0094210.0111260.0206860.0213630.0304770.0298200.0374410.0243750.0296790.0338550.0246220.0328580.0106700.016836
L,, calcu-lated!
cm11.6718.2217.3017.0918.8120.7317.2518.1617.5518.4317.2015.6917.7116.35
T, fitted
0.8210.8160.8190.7960.7760.7820.9270.7750.8240.8300.8220.9030.8630.903
T,calculated§
0.8570.8230.8670.8780.7970.7240.8700.8260.8550.8140.8720.9560.8470.917
t Bulk density.$ Root mean squares.§ I, = vf., t = LIL,.1 Values ± 95% confidence interval.# 50% glass and 50% sand by weight.
objective of this work was to investigate preferentialflow and bimodal peaks of tritium in uniformly packedsoils under upward flow condition. The second objectivewas to estimate T from breakthrough results of appliedtritium pulses. The third objective was to test the applica-bility of T and Le in describing tracer transport in soils.
MATERIALS AND METHODSA tritiated 0.005 M Ca(NOa)2 solution was used throughout
all experiments. Five soils (Sharkey, Cecil, Eustis, Dothan,and Mahan) and two uniform materials (glass beads and acid-washed sand) were used. Their characteristics and soil classifi-cations are listed in Table 1. Soil aggregate-size distributionusing the standard dry-sieving method is shown in Table 2.The miscible displacement technique as described by Selim etal. (1992) was followed. Each soil was uniformly packed intoa 10- or 15-cm-long column (6.4-cm i.d.) and purged withCOz to achieve better water saturation. Soil columns weresaturated from the bottom with 0.005 M Ca(NO3)2 solution.Several pore volumes were introduced prior to the introductionof tritium pulses. Steady-state water flux was controlled by apiston pump. For all soil columns, steady upward flow wasmaintained. The effluent was collected using a fraction collectorand analyzed using liquid scintillation counting. Pore-watervelocity was estimated from q and 0 (v = q/Q). A total of 21uniformly packed soil columns was used to obtain the BTCspresented (see Table 3). In addition, we obtained several BTCsfor some columns to examine the reproducibility of ETCresults.
Two types of tritium pulses were applied in each soil column.The first type is referred to as a small-pulse ETC (or impulse)and was used to measure L,. This impulse was generated byintroducing a 0.03 pore volume pulse of tritium into the soilcolumn. The applied tritium pulse was recovered by four porevolumes of tritium-free 0.005 M Ca(NO3)2 solution followingpulse application. The breakthrough results were used to deter-mine the tm based on the first time moment using Eq.[l]. Sincethe impulse was small and lasted for only a few minutes, weassumed that the calculated tm approximates the time for aparticle to travel through a soil column of length L. The valueof L* was then obtained from measured tm and v according toLe = tm v. The second type of tritium ETC was generated in
the same way as the small-pulse ETC except that the inputtritium pulse was much larger (=1 pore volume). The BTCsfrom large pulses were used to obtain the parameters D andLe based on the CDE (Eq. [2]). A numerical finite-differencemethod was applied in solving the CDE (Selim et al., 1990),and a nonlinear least-squares optimization scheme was usedto obtain best-fit estimates for D and L, (van Genuchten, 1981).
0.08
0.06-•
OoO
0.04--
0.02 • •
0.00
Sand — Small Pulse A
v = 2.92 cm h~n
• Exp. Data
tm= 6.06 h«
4 8Time (hours)
12
Sand — Large Pulse B
v = 2.92 cm h~1
• Exp. Data
- - - CDE-Fitted—— Superposition
1 2 3 4Pore Volumes (V/Vo)
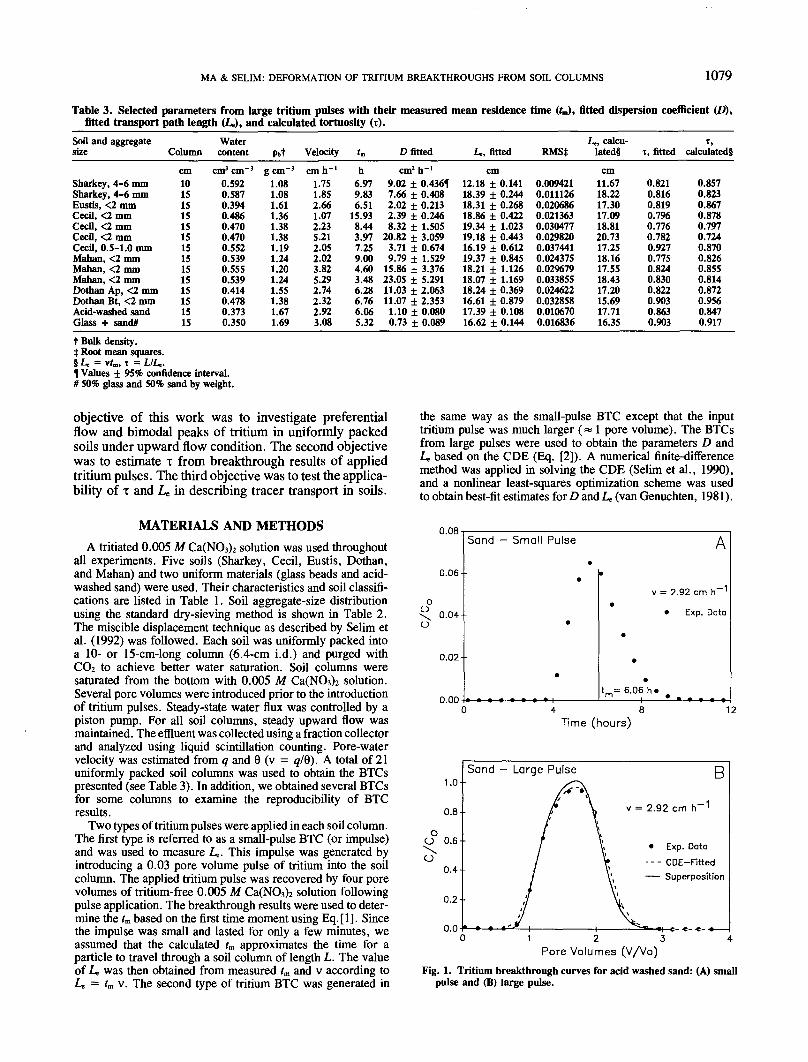
Fig. 1. Tritium breakthrough curves for acid washed sand: (A) smallpulse and (B) large pulse.
1080 SOIL SCI. SOC. AM. J., VOL. 58, JULY-AUGUST 1994
0.04
0.03 • •
0.02-•
0.01-•
0.00
Eustis (<2mm) - Small Pulse
• •!•••
v = 2.66 cm h~1
• Exp. Data
tm=6.51h»——————I——*••«.«.»
0.02-•
5 10Time (hours)
15
Eustis (<2mm) - Large Pulse B
v = 2.66 cm h~1
• Exp. Data• - - CDE-Fitted
Superposition
1.0-
0.8-
O^ 0.6-O
0.4-
0.2-
0.01 2 3 4
Pore Volumes (V/VO)
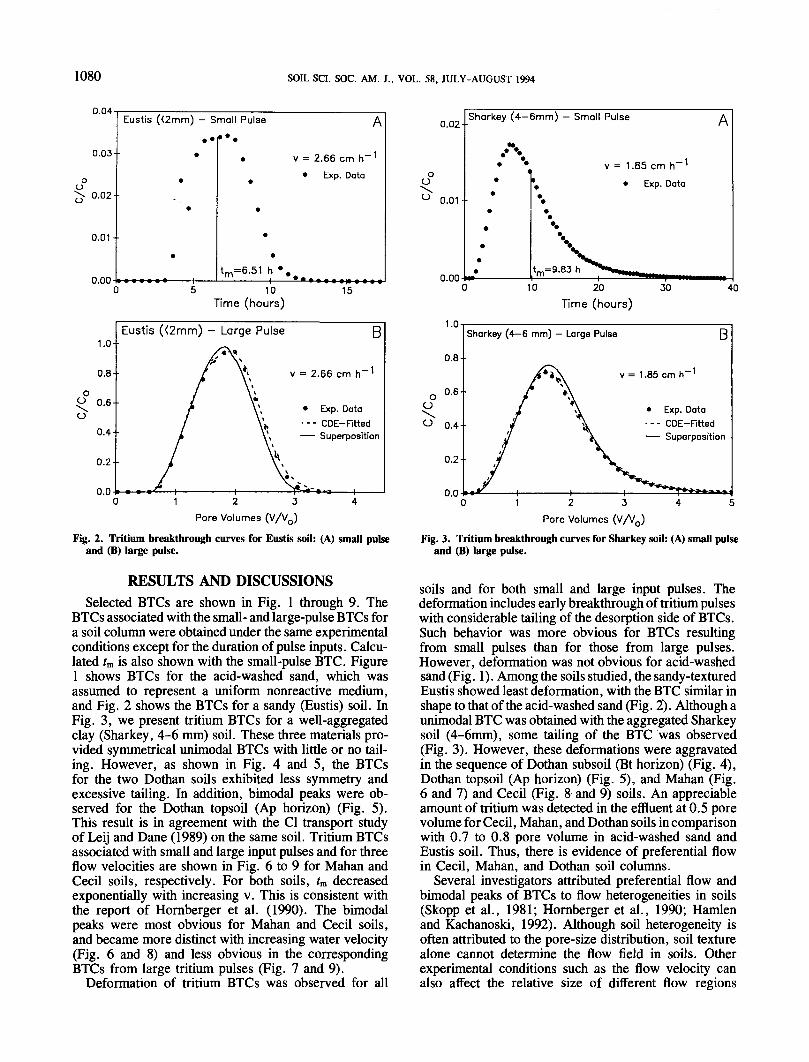
Fig. 2. Tritium breakthrough curves for Eustis soil: (A) small pulseand (B) large pulse.
RESULTS AND DISCUSSIONSSelected BTCs are shown in Fig. 1 through 9. The
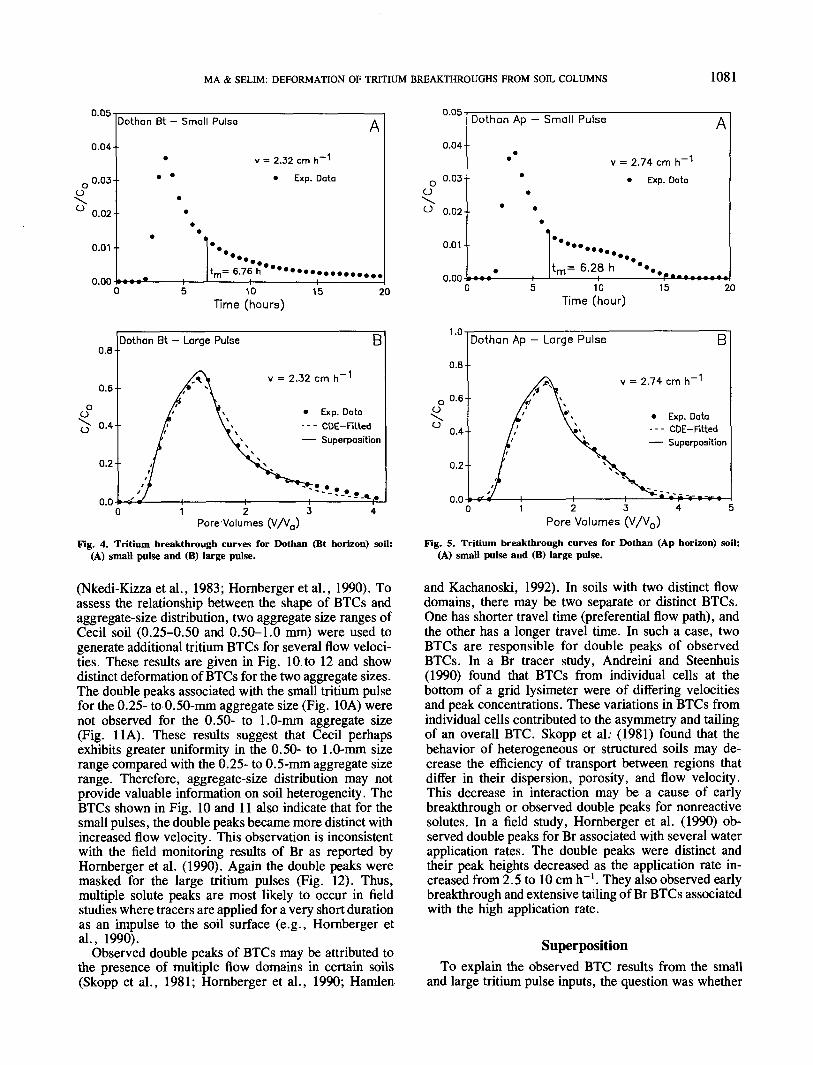
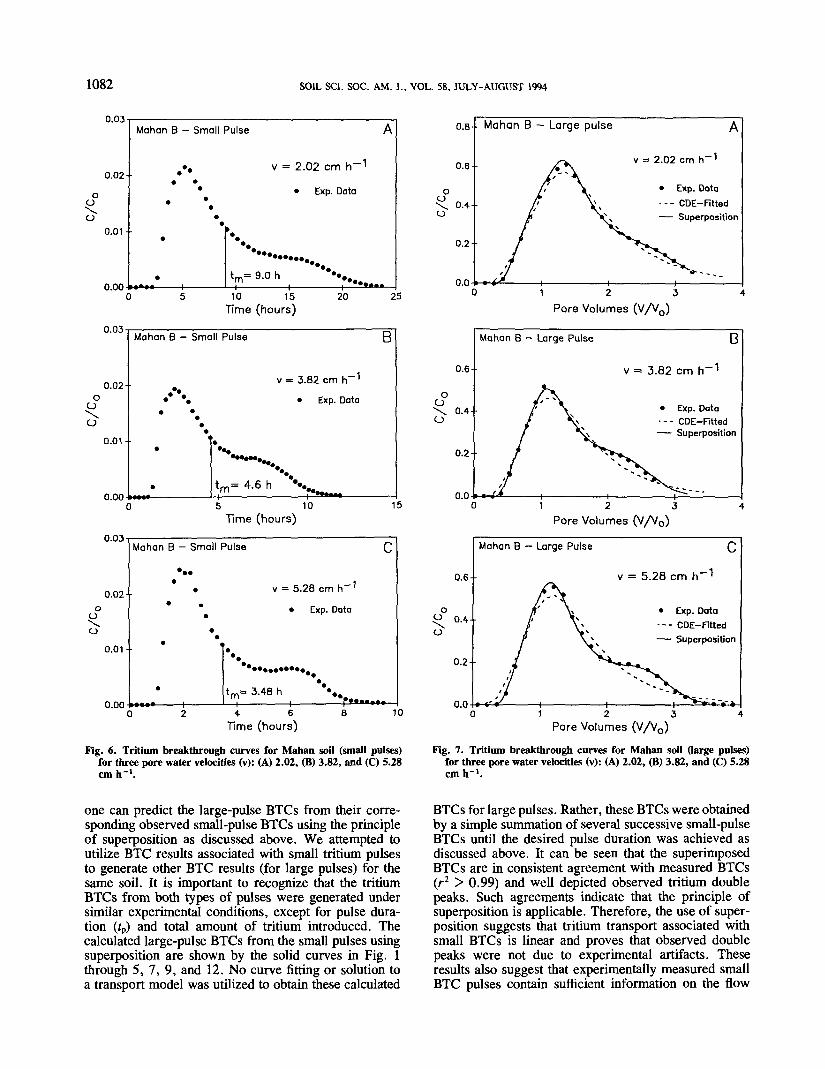
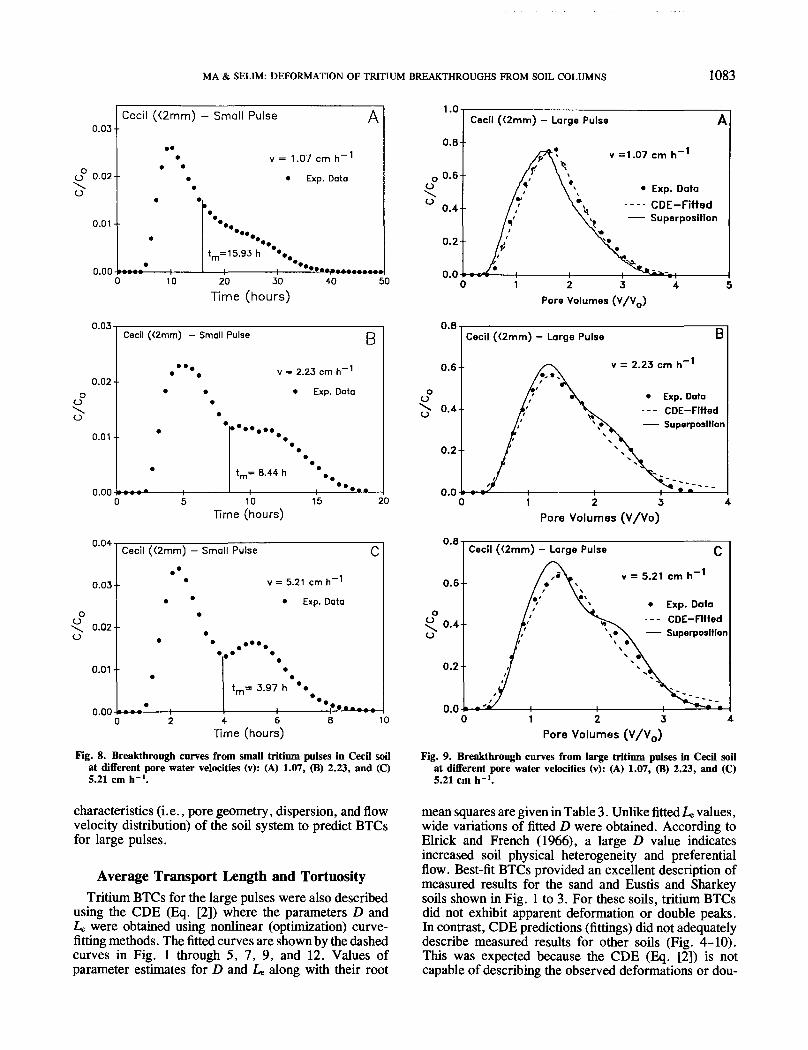
BTCs associated with the small- and large-pulse BTCs fora soil column were obtained under the same experimentalconditions except for the duration of pulse inputs. Calcu-lated tm is also shown with the small-pulse BTC. Figure1 shows BTCs for the acid-washed sand, which wasassumed to represent a uniform nonreactive medium,and Fig. 2 shows the BTCs for a sandy (Eustis) soil. InFig. 3, we present tritium BTCs for a well-aggregatedclay (Sharkey, 4-6 mm) soil. These three materials pro-vided symmetrical unimodal BTCs with little or no tail-ing. However, as shown in Fig. 4 and 5, the BTCsfor the two Dothan soils exhibited less symmetry andexcessive tailing. In addition, bimodal peaks were ob-served for the Dothan topsoil (Ap horizon) (Fig. 5).This result is in agreement with the Cl transport studyof Leij and Dane (1989) on the same soil. Tritium BTCsassociated with small and large input pulses and for threeflow velocities are shown in Fig. 6 to 9 for Mahan andCecil soils, respectively. For both soils, tm decreasedexponentially with increasing v. This is consistent withthe report of Hornberger et al. (1990). The bimodalpeaks were most obvious for Mahan and Cecil soils,and became more distinct with increasing water velocity(Fig. 6 and 8) and less obvious in the correspondingBTCs from large tritium pulses (Fig. 7 and 9).
Deformation of tritium BTCs was observed for all
oCJ
0 0.01-
0.00
Sharkey (4-6mm) - Small Pulse A
v = 1.85 cm h~1
• Exp. Data
10 20
Time (hours)40
oo
Sharkey (4-6 mm) - Large Pulse
• Exp. Data- - - CDE-Fitted— Superposition
2 3
Pore Volumes (V/V0)Fig. 3. Tritium breakthrough curves for Sharkey soil: (A) small pulse
and (B) large pulse.
soils and for both small and large input pulses. Thedeformation includes early breakthrough of tritium pulseswith considerable tailing of the desorption side of BTCs.Such behavior was more obvious for BTCs resultingfrom small pulses than for those from large pulses.However, deformation was not obvious for acid-washedsand (Fig. 1). Among the soils studied, the sandy-texturedEustis showed least deformation, with the BTC similar inshape to that of the acid-washed sand (Fig. 2). Although aunimodal BTC was obtained with the aggregated Sharkeysoil (4-6mm), some tailing of the BTC was observed(Fig. 3). However, these deformations were aggravatedin the sequence of Dothan subsoil (Bt horizon) (Fig. 4),Dothan topsoil (Ap horizon) (Fig. 5), and Mahan (Fig.6 and 7) and Cecil (Fig. 8 and 9) soils. An appreciableamount of tritium was detected in the effluent at 0.5 porevolume for Cecil, Mahan, and Dothan soils in comparisonwith 0.7 to 0.8 pore volume in acid-washed sand andEustis soil. Thus, there is evidence of preferential flowin Cecil, Mahan, and Dothan soil columns.
Several investigators attributed preferential flow andbimodal peaks of BTCs to flow heterogeneities in soils(Skopp et al., 1981; Hornberger et al., 1990; Hamlenand Kachanoski, 1992). Although soil heterogeneity isoften attributed to the pore-size distribution, soil texturealone cannot determine the flow field in soils. Otherexperimental conditions such as the flow velocity canalso affect the relative size of different flow regions
MA & SELIM: DEFORMATION OF TRITIUM BREAKTHROUGHS FROM SOIL COLUMNS 1081
0.05
0.04
Dothan Bt - Small Pulse
oO
0.03-
0.02-
0.01 - •
0.00
—— 1v = 2.32 cm h
• Exp. Data
t = 6.76 !!*•••••••.,.....,
0.05
5 10 15Time (hours)
20
O.B
0.6-
OO
0.4 • •
Dothan Bt - Large Pulse B
v = 2.32 cm h~1
• Exp. Data- - - CDE-Fitted— Superposition
0 1 2 3 4Pore Volumes (V/V0)
Fig. 4. Tritium breakthrough curves for Dothan (Bt horizon) soil:(A) small pulse and (B) large pulse.
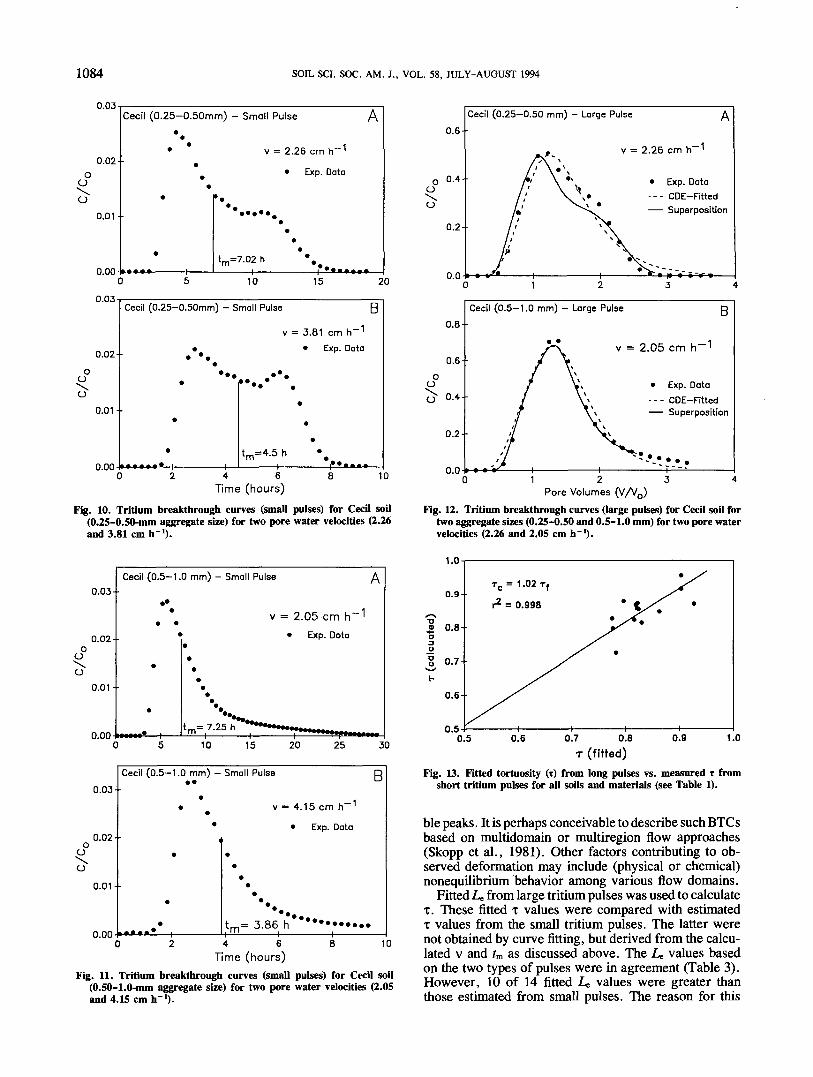
(Nkedi-Kizza et al., 1983; Hornberger et al., 1990). Toassess the relationship between the shape of BTCs andaggregate-size distribution, two aggregate size ranges ofCecil soil (0.25-0.50 and 0.50-1.0 mm) were used togenerate additional tritium BTCs for several flow veloci-ties. These results are given in Fig. 10 to 12 and showdistinct deformation of BTCs for the two aggregate sizes.The double peaks associated with the small tritium pulsefor the 0.25- to 0.50-mm aggregate size (Fig. 10A) werenot observed for the 0.50- to 1.0-mm aggregate size(Fig. 11 A). These results suggest that Cecil perhapsexhibits greater uniformity in the 0.50- to 1.0-mm sizerange compared with the 0.25- to 0.5-mm aggregate si/erange. Therefore, aggregate-size distribution may notprovide valuable information on soil heterogeneity. TheBTCs shown in Fig. 10 and 11 also indicate that for thesmall pulses, the double peaks became more distinct withincreased flow velocity. This observation is inconsistentwith the field monitoring results of Br as reported byHornberger et al. (1990). Again the double peaks weremasked for the large tritium pulses (Fig. 12). Thus,multiple solute peaks are most likely to occur in fieldstudies where tracers are applied for a very short durationas an impulse to the soil surface (e.g., Hornberger etal., 1990).
Observed double peaks of BTCs may be attributed tothe presence of multiple flow domains in certain soils(Skopp et al., 1981; Hornberger et al., 1990; Hamlen
oo
0.04 • •
0.03-•
0.02 • •
0.01 • •
0.00
Dothan Ap - Small Pulse
v = 2.74 cm h~1
• Exp. Data
= 6-28 h10
Time (hour)15 20
Dothan Ap — Large Pulse
• Exp. Data• - - CDE-Fitted• Superposition
0.02 3
Pore Volumes (V/VO)
Fig. 5. Tritium breakthrough curves for Dothan (Ap horizon) soil:(A) small pulse and (B) large pulse.
and Kachanoski, 1992). In soils with two distinct flowdomains, there may be two separate or distinct BTCs.One has shorter travel time (preferential flow path), andthe other has a longer travel time. In such a case, twoBTCs are responsible for double peaks of observedBTCs. In a Br tracer study, Andreini and Steenhuis(1990) found that BTCs from individual cells at thebottom of a grid lysimeter were of differing velocitiesand peak concentrations. These variations in BTCs fromindividual cells contributed to the asymmetry and tailingof an overall BTC. Skopp et al. (1981) found that thebehavior of heterogeneous or structured soils may de-crease the efficiency of transport between regions thatdiffer in their dispersion, porosity, and flow velocity.This decrease in interaction may be a cause of earlybreakthrough or observed double peaks for nonreactivesolutes. In a field study, Hornberger et al. (1990) ob-served double peaks for Br associated with several waterapplication rates. The double peaks were distinct andtheir peak heights decreased as the application rate in-creased from 2.5 to 10 cm h"1. They also observed earlybreakthrough and extensive tailing of Br BTCs associatedwith the high application rate.
SuperpositionTo explain the observed BTC results from the small
and large tritium pulse inputs, the question was whether
1082 SOIL SCI. SOC. AM. J., VOL. 58, JULY-AUGUST 1994
0.03
0.02-
ooo
0.01-
0.00
Mahan B - Small Pulse
v = 2.02 cm h~1
• Exp. Data
tm= 9.0 h
10 15Time (hours)
20 25
0.03
0.02-oo
o0.01-
0.00
Mahan B - Small Pulse B
v = 3.82 cm h~1
• Exp. Data
"•"-•V5 10
Time (hours)
0.03
0.02-o
OO
0.01 -
0.00
Mahan B - Small Pulse
-1v = 5.28 cm h
Exp. Data
tm= 3.48 h
4 6Time (hours)
10
Fig. 6. Tritium breakthrough curves for Mahan soil (small pulses)for three pore water velocities (v): (A) 2.02, (B) 3.82, and (C) 5.28cmh-'.
0.8- Mahan B — Large pulse /\
v = 2.02 cm h~1
• Exp. Data- - - CDE-Fitted—— Superposition
0.01 2 3
Pore Volumes (V/VO)
Mahan B — Large Pulse B
v = 3.82 cm h-1
• Exp. Data- - - CDE-Fitted— Superposition
Pore Volumes (V/VO)
• Exp. Data... CDE-ntted— Superposition
0.01 2 3
Pore Volumes (V/VO)
Fig. 7. Tritium breakthrough curves for Mahan soil Qarge pulses)for three pore water velocities (v): (A) 2.02, (B) 3.82, and (C) 5.28cm h"1.
one can predict the large-pulse BTCs from their corre-sponding observed small-pulse BTCs using the principleof superposition as discussed above. We attempted toutilize ETC results associated with small tritium pulsesto generate other BTC results (for large pulses) for thesame soil. It is important to recognize that the tritiumBTCs from both types of pulses were generated undersimilar experimental conditions, except for pulse dura-tion (tp) and total amount of tritium introduced. Thecalculated large-pulse BTCs from the small pulses usingsuperposition are shown by the solid curves in Fig. 1through 5, 7, 9, and 12. No curve fitting or solution toa transport model was utilized to obtain these calculated
BTCs for large pulses. Rather, these BTCs were obtainedby a simple summation of several successive small-pulseBTCs until the desired pulse duration was achieved asdiscussed above. It can be seen that the superimposedBTCs are in consistent agreement with measured BTCs(r2 > 0.99) and well depicted observed tritium doublepeaks. Such agreements indicate that the principle ofsuperposition is applicable. Therefore, the use of super-position suggests that tritium transport associated withsmall BTCs is linear and proves that observed doublepeaks were not due to experimental artifacts. Theseresults also suggest that experimentally measured smallBTC pulses contain sufficient information on the flow
MA & SELIM: DEFORMATION OF TRITIUM BREAKTHROUGHS FROM SOIL COLUMNS 1083
0.03-
0° 0.02-•O
0.01 • •
0.00
Cecil (<2mm) - Small Pulse A
v = 1.07 cm h~1
• Exp. Data
tm=15.93 h «...———I—————————I———**•»..!.......
10 20 30 40
Time (hours)50
0.03
0.02-oo
CJ
0.01-
0.00
0.04
Cecil (<2mm) - Small Pulse B
v = 2.23 cm h"1
• Exp. Data
10 15Time (hours)
20
0.03-•
ooo
0.02-
0.01 • •
0.00
Cecil (<2mm) - Small Pulse
v = 5.21 cm h-1
Exp. Data
tm=3.97h '.'..———!*•••••«
10Time (hours)
Fig. 8. Breakthrough curves from small tritium pulses in Cecil soilat different pore water velocities (v): (A) 1.07, (B) 2.23, and (C)5.21 cm h-1.
Cecil (<2mm) - Large Pulse
• Exp. Data- - • CDE-Fitted— Superposition
1 2 3 4Pore Volumes (V/VO)
oOO
Cecil (<2mm) - Large Pulse
• Exp. Data• - - CDE-Fltted• Superposition
0.4-
0.2-
Pore Volumes (V/Vo)
Cecil (<2mm) - Large Pulse
• Exp. Data- - - CDE-Fltted—— Superposition
1 2 3Pore Volumes (V/V0)
Fig. 9. Breakthrough curves from large tritium pulses in Cecil soilat different pore water velocities (v): (A) 1.07, (B) 2.23, and (C)5.21 cm h-1.
characteristics (i.e., pore geometry, dispersion, and flowvelocity distribution) of the soil system to predict BTCsfor large pulses.
Average Transport Length and TortuosityTritium BTCs for the large pulses were also described
using the CDE (Eq. [2]) where the parameters D andLe were obtained using nonlinear (optimization) curve-fitting methods. The fitted curves are shown by the dashedcurves in Fig. 1 through 5, 7, 9, and 12. Values ofparameter estimates for D and Le along with their root
mean squares are given in Table 3. Unlike fitted Le values,wide variations of fitted D were obtained. According toElrick and French (1966), a large D value indicatesincreased soil physical heterogeneity and preferentialflow. Best-fit BTCs provided an excellent description ofmeasured results for the sand and Eustis and Sharkeysoils shown in Fig. 1 to 3. For these soils, tritium BTCsdid not exhibit apparent deformation or double peaks.In contrast, CDE predictions (fittings) did not adequatelydescribe measured results for other soils (Fig. 4-10).This was expected because the CDE (Eq. [2]) is notcapable of describing the observed deformations or dou-
1084 SOIL SCI. SOC. AM. J., VOL. 58, JULY-AUGUST 1994
0.02Oo
O0.01
0.00
0.03-
0.02-
OOO
0.01-
0.00- (
Fig. 10. '(0.25-Cand 3.1
0.03-
0.02-o
OO
0.01-
0.00-0
0.03-
0.02-o
O(J
0.01-
Cecil (0.25-0.50mm) - Small Pulse A••
• v = 2.26 cm h~1
• Exp. Data•
• '.^*•••••.
••
tm=7.02h \^
0.6-
o °-4-oo
0.2-
Cecil (0.25-0.50 mm) - Large Pulse f^
f v = 2.26 cm h~1
/!\\n \*\ • EXP- Data
// \^v* """ CDE~ntted
L! ^~^^ —— Superposition/' XI \/ *S-----
5 10 15 ' 20 U.U. . - , i -•3"P"
Cecil (0.25-0.50mm) - Small Pulse B
v = 3.81 cm h~1
• • Exp. Data• ••
' ''>••"'••
• .
tm=4.5 h •.».«»»* | ————————— |— —————— 1 ————————— !*•••«• ——3 2 4 6 8 1
Time (hours)Tritium breakthrough curves (small pulses) for Cecil so.50-mm aggregate size) for two pore water velocities (2.2il cmh-1).
Cecil (0.5-1.0 mm) - Small Pulse /\
••v = 2.05 cm h~ 1
• •• • Exp. Data••
• •••
•
• . m . " ^"••••>j«i
5 10 15 20 25 3
Cecil (0.5-1.0 mm) - Small Pulse D• • "-"
• f v = 4 .15cmh~ 1
• • Exp. Data4
• •
•
••
'•«...
tm= 3.86 h '•••••......
0.8-
0.6-O
O0" 0.4-
0.2-
Cecil (0.5-1.0 mm) - Large Pulse Q
A\ v = 2.05 cm h~1
/ V, • Exp. Data/ V» - - - CDE-Rtted
f \\ — Superposition
,'/ '•-•-•.••0.0 IP • • " ———— i ————————— i ————————— i ————————— i3 0 1 2 3 4Pore Volumes (V/VO)
il Fig. 12. Tritium breakthrough curves (large pulses) for Cecil soil fo6 two aggregate sizes (0.25-0.50 and 0.5-1.0 mm) for two pore wate
velocities (2.26 and 2.05 cm h~').
r (c
alcu
ated
)3
O
O
O
O
-n
01
~J
bo
10 i
T 0 =1.02T f !̂
r2 = 0.998 * t/\ *
\/**
stT «
0.5 0.6 0.7 0.8 0.9 1.T (fitted)
Fig. 13.short
ble pealbased {(Skoppservednonequ
Fitte<T. ThesT value
°-00o 2 4 6 B 10 notobbTime (hours) lated V
Fig. 11. Tritium breakthrough curves (small pulses) for Cecil soil 9? e
(0.50-1.0-mm aggregate size) for two pore water velocities (2.05 MOWCVand 4.15 cm hT1). those &
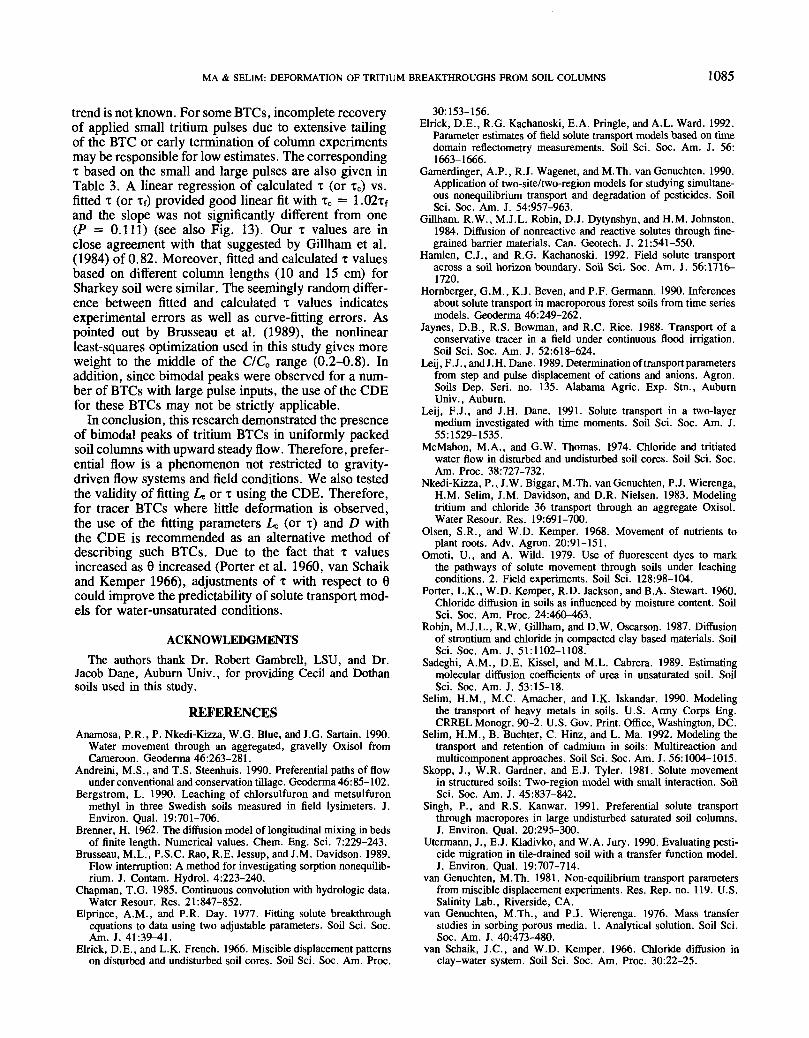
Fitted tortuosity (T) from long pulses vs. measured T frontritium pulses for all soils and materials (see Table 1).
cs . It is perhaps conceivable to describe such ETCm multidomain or multiregion flow approacheet al., 1981). Other factors contributing to obdeformation may include (physical or chemicalilibrium behavior among various flow domainsi Le from large tritium pulses was used to calculate,e fitted T values were compared with estimatecs from the small tritium pulses. The latter wenlined by curve fitting, but derived from the calcuand /m as discussed above. The I* values basecwo types of pulses were in agreement (Table 3)er, 10 of 14 fitted Le values were greater thaistimated from small pulses. The reason for thi
MA & SELIM: DEFORMATION OF TRITIUM BREAKTHROUGHS FROM SOIL COLUMNS 1085
trend is not known. For some BTCs, incomplete recoveryof applied small tritium pulses due to extensive tailingof the BTC or early termination of column experimentsmay be responsible for low estimates. The correspondingT based on the small and large pulses are also given inTable 3. A linear regression of calculated T (or TC) vs.fitted T (or Tf) provided good linear fit with TC = 1.02Tfand the slope was not significantly different from one(P = 0.111) (see also Fig. 13). Our T values are inclose agreement with that suggested by Gillham et al.(1984) of 0.82. Moreover, fitted and calculated T valuesbased on different column lengths (10 and 15 cm) forSharkey soil were similar. The seemingly random differ-ence between fitted and calculated t values indicatesexperimental errors as well as curve-fitting errors. Aspointed out by Brusseau et al. (1989), the nonlinearleast-squares optimization used in this study gives moreweight to the middle of the C/C0 range (0.2-0.8). Inaddition, since bimodal peaks were observed for a num-ber of BTCs with large pulse inputs, the use of the CDEfor these BTCs may not be strictly applicable.
In conclusion, this research demonstrated the presenceof bimodal peaks of tritium BTCs in uniformly packedsoil columns with upward steady flow. Therefore, prefer-ential flow is a phenomenon not restricted to gravity-driven flow systems and field conditions. We also testedthe validity of fitting Le or T using the CDE. Therefore,for tracer BTCs where little deformation is observed,the use of the fitting parameters Le (or T) and D withthe CDE is recommended as an alternative method ofdescribing such BTCs. Due to the fact that T valuesincreased as 6 increased (Porter et al. 1960, van Schaikand Kemper 1966), adjustments of T with respect to Qcould improve the predictability of solute transport mod-els for water-unsaturated conditions.
ACKNOWLEDGMENTSThe authors thank Dr. Robert Gambrell, LSU, and Dr.
Jacob Dane, Auburn Univ., for providing Cecil and Dothansoils used in this study.