top trends for uae real estate in 2014
TRANSCRIPT

1
T
E
O
D
P
T R
N S
trends Top for UAE
Real Estate in 2014

2
Presentation Outline
Mega Trends
Influencing
UAE
Real Estate
in 2014
Implications
for Major
Markets Q & A
1 2 3 4
Review
Of
2013
Trends

6
trends Mega
Influencing UAE
Real Estate in 2014

7
Jones Lang LaSalle’s – Top Trends for 2013
Return of confidence impacts the Dubai market 01
Funding constraints will apply a natural brake to development activity 02
Increased involvement from Chinese and the Global South 03
Significant supply levels could offset improved sentiment 04
Greater attention to operating costs and property management 05
Sustainability – more talk than action 06
Government Initiatives will influence market conditions 07
Return of confidence impacts the Dubai market 01
Increased involvement from Chinese and the Global South 03
Greater attention to operating costs and property management 05
Government Initiatives will influence market conditions 07
Significant supply levels could offset improved sentiment 04
Sustainability – more talk than action 06
Funding constraints will apply a natural brake to development activity 02
Correct Partially correct Incorrect

8
Improving Macro Economic Climate
Brighter prospects for 2014
• Global Economic
Situation has improved
• Regional geopolitical
situation remains mixed
2.5
3
2.5
4
3.9
4.3
UAE outperforms global economy in 2013
Global
Middle East
UAE
Real GDP Growth (%)

9
Jones Lang LaSalle’s – Top Trends for 2014
Avoiding another bubble 1
More measured mega developments 2
Future directions of growth 3
Expo 2020. Limited impact in 2014 4
Varied approaches to finance real estate 5
Two speed investment market 6
Workplace transformation as corporate
activity increases 7
More hotel investment sales 8
Sustainability – From talk to action 9
Improved valuation and
measurement standards 10

10
-30%
-20%
-10%
0%
10%
20%
30%
40%
50%
0
50
100
150
200
250
300
350
400
Dec
-05
Jun-
06
Dec
-06
Jun-
07
Dec
-07
Jun-
08
Dec
-08
Jun-
09
Dec
-09
Jun-
10
Dec
-10
Jun-
11
Dec
-11
Jun-
12
Dec
-12
Jun-
13
Dec
-13
% c
hang
e Y
-o-Y
Inde
x, J
an 2
003=
100
Dubai Residential Sale Price Index
Sale Price Index % change Y-o-Y
Worrying signs of over heating
Unsustainable price growth in
residential market
Increasing cost pressures / resource
constraints
Return of speculative activity
Land sales on generous
financial terms
Expo 2020 causing
irrational exuberance
1: Avoiding another bubble in Dubai – Smarter the 2nd time around
10

11
Differences this time around
Significant levels of new
supply
Larger projects are being
phased in line with demand
More caution from investors
Less reliance on pre-sales
and sub developers
Better regulations – aimed at
calming the market
1: Avoiding another bubble in Dubai – Smarter the 2nd time around
11
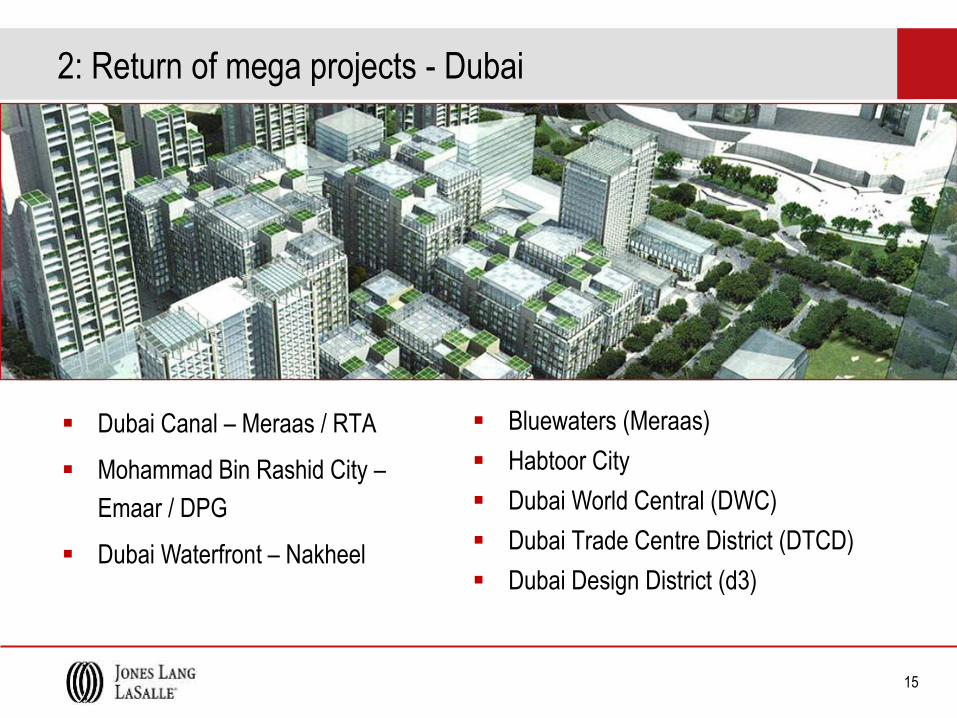
15
Dubai Canal – Meraas / RTA
Mohammad Bin Rashid City –
Emaar / DPG
Dubai Waterfront – Nakheel
Bluewaters (Meraas)
Habtoor City
Dubai World Central (DWC)
Dubai Trade Centre District (DTCD)
Dubai Design District (d3)
2: Return of mega projects - Dubai
15

16
Zayed City (Capital District)
UPC
Saadiyat Island / TDIC
Yas Island / Aldar
Masdar (Mubadala)
Al Maryah Island (Mubadala)
2: Return of mega projects – Abu Dhabi
16

17
Resumption of previously stalled projects
More awareness of need to phase projects in line with demand
More co-operation between master developers
Reduced role for sub developers
Improved regulations on pace of development
2: More measured mega projects – Key Messages
17

18
3: Future Growth : Dubai
1 Dubai Industrial City 3 JAFZA 5 JLT 7 Dubiotech 9 Dubai Maritime City 11 DAFZA 13 Academic City 15 Dubai World Central
2 TechnoPark 4 IMPZ 6 TECOM 8 DIFC 10 DHCC 12 Dubai Silicon Oasis 14 Dubai Outsource Zone
4
5 6
7
9
8
10
11
12
13 14
3
15
Free Zone
1
2
E311 Sheikh Zayed Road
E311 Sheikh Mohamed Bin Zayed Road
E311 Emirates Road

19
3: Future Growth : Dubai
E311 Sheikh Zayed Road
E311 Sheikh Mohamed Bin Zayed Road
E311 Emirates Road
1 CBD 3 TECOM A & B 5 JLT
2 Business Bay 4 TECOM C 6 Jebel Ali
Commercial District
1
2
3
4
5
6

20
3: Future Growth : Dubai
4 5
3 2
1
1 Business Bay 3 Mohamed Bin Rashed City 5 Dubai Land
2 Lagoons 4 Dubai World Central
High Priority
Low Priority
E311 Sheikh Zayed Road
E311 Sheikh Mohamed Bin Zayed Road
E311 Emirates Road

21
3: Future Growth : Dubai
Infill – filling in the gaps South – towards
Abu Dhabi
E311 Sheikh Zayed Road
E311 Sheikh Mohamed Bin Zayed Road
E311 Emirates Road

22 Source: Jones Lang LaSalle
Saadiyat
Yas Island
Reem Island
Shams
Naimat
Raha Beach
Masdar
BMC
Arzanah
Rawdhat
Capital Centre
Danet
Al Reef
Saraya
Bateen Peninsulas
Hydra Village Mina Zaved
Lulu
Airport City
Capital District
Hudayriat
ICT
1 Horizontal + Vertical Development
Al Maryah
2 Master Planning and / or infrastructure stage
3: Future Growth : Abu Dhabi
23
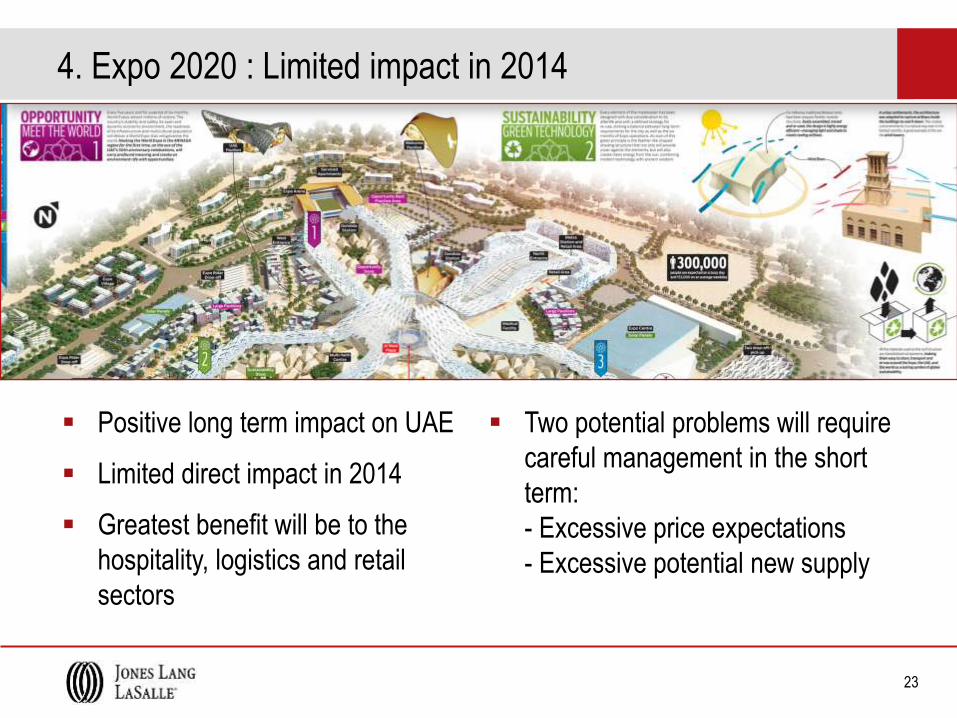
Positive long term impact on UAE
Limited direct impact in 2014
Greatest benefit will be to the
hospitality, logistics and retail
sectors
4. Expo 2020 : Limited impact in 2014
Two potential problems will require
careful management in the short
term:
- Excessive price expectations
- Excessive potential new supply
23

24
Focus on equity rather than debt
Pre-sales remain important in residential market
Sale and leasebacks
Pre leases / build to suit
Limited use of IPO’s and bonds
Last mile financing
REIT’s
Banks remain cautious
5: Varied approaches to finance real estate
24

25
Limited Interest from Western
institutions
Constrained by lack of investment
grade product
More ME institutions looking in
Dubai Strategic relationships
Chinese investment in the Pearl
is Government backed means of
selling expertise
Increased interest from
debt investors
6: Two Speed Investment Market
26

26
6: Two Speed Investment Market
Strong interest from private
investors
DLD report transactions of AED162
billion in 2013
Sales to more than 120 nationalities
Most sales either land or individual
homes / units
26

27
Increasing Demand from Corporate
Occupiers
Overall market is improving – more
corporates now growing again
Mixed implications for the real estate
market
Continued two tier market
2014 will remain primarily a tenants
market, with no decline in excessive
overall vacancy
7: Workplace Transformation as Corporate Activity Increases
26

28
Key Drivers and business objectives
driving work place transformation:-
Reducing property costs
Improving business performance
Attracting and retaining staff
Merging of organizations
Consolidations
7: Workplace Transformation as Corporate Activity Increases
27

29
A larger number of operating hotels
Loan maturities
Current diversity of players
Specialization on core activities
(real estate developers vs hoteliers)
• Hotels perceived as ‘income
generating’ assets
• More professional asset
management places greater
emphasis on financial performance
8: More investment sales in hotel sector across UAE
28
30
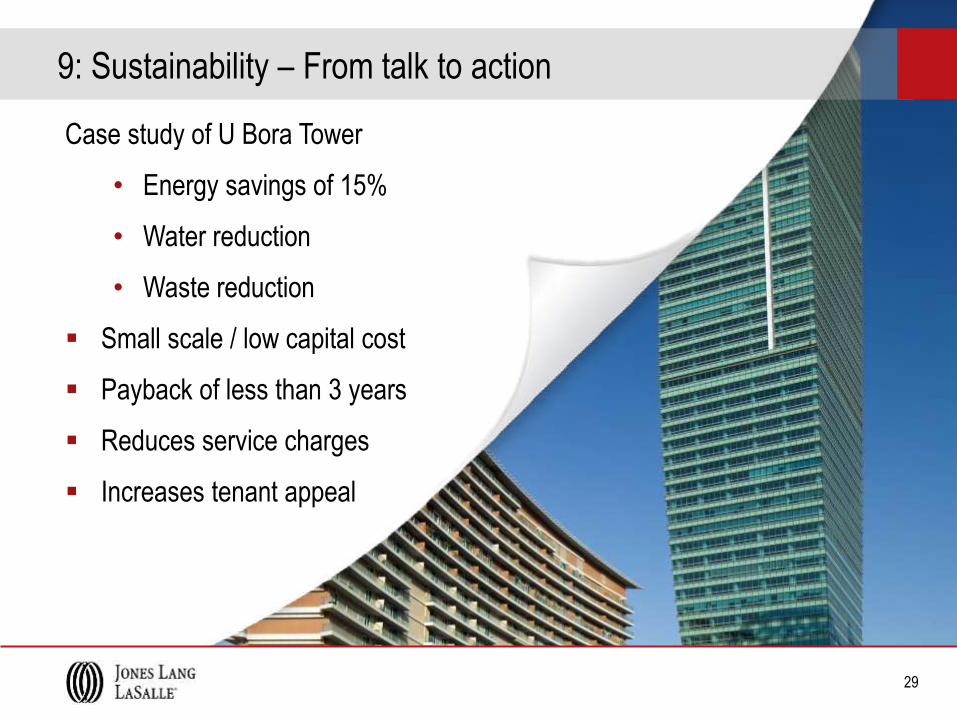
9: Sustainability – From talk to action
Case study of U Bora Tower
• Energy savings of 15%
• Water reduction
• Waste reduction
Small scale / low capital cost
Payback of less than 3 years
Reduces service charges
Increases tenant appeal
29

31
Increased awareness of
importance of sustainability
Abu Dhabi continues to lead the
way
Dubai introduces new regulations
Emergence of a ‘sustainability premium’
More focus on small scale
initiatives that can be retrofitted
9: Sustainability – From talk to action
29

32
Measurement standards
10: Improved valuation & measurement standards
Could impact measured areas and
therefore values by 25%
Quote all projects in sq m rather than sq ft
Standard approach to convert BUA (supply
data) into GLA (demand).
Plans to introduce global measurement
standards
Variety of standards currently used in
UAE causes confusion and inhibits
transparency
30

33
10: Improved valuation & measurement standards
Better Quality - All Valuations will have to adhere to International Valuation
Standards
Better Transparency - Levels of openness and transparency laid down in IVS
Better Local Knowledge and skills - Valuers required to have expertise in both
the relevant asset class and geography.
Valuation standards
31

34
trends Mega
Implications
for Major Markets

35
Market Directions - Dubai - Prime Rental Clock
Q4 2012
Rental Growth
Slowing
Rents
Falling
Rental Growth
Accelerating
Rents
Bottoming Out
Retail
Residential
* Hotel
Office
*Hotel clock reflects the movement of RevPAR. Note: The property clock illustrates where Jones Lang LaSalle estimates each prime market is within its individual rental cycle as at end of the relevant quarter. Source: Jones Lang LaSalle

36
Market Directions - Dubai - Prime Rental Clock
Q4 2013
Rental Growth
Slowing
Rents
Falling
Rental Growth
Accelerating
Rents
Bottoming Out
Retail
Residential
Office
* Hotel
*Hotel clock reflects the movement of RevPAR. Note: The property clock illustrates where Jones Lang LaSalle estimates each prime market is within its individual rental cycle as at end of the relevant quarter. Source: Jones Lang LaSalle

37
Market Directions - Dubai - Prime Rental Clock
Q4 2014
Rental Growth
Slowing
Rents
Falling
Rental Growth
Accelerating
Rents
Bottoming Out
Retail
Residential
Office
* Hotel
*Hotel clock reflects the movement of RevPAR. Note: The property clock illustrates where Jones Lang LaSalle estimates each prime market is within its individual rental cycle as at end of the relevant quarter. Source: Jones Lang LaSalle

38
Market Directions - Abu Dhabi - Prime Rental Clock
Q4 2012
Rental Growth
Slowing
Rents
Falling
Rental Growth
Accelerating
Rents
Bottoming Out
Retail
Residential
* Hotel
Office
*Hotel clock reflects themovement of RevPAR. Note: The property clock illustrates where Jones Lang LaSalle estimates each prime market is within its individual rental cycle as at end of the relevant quarter. Source: Jones Lang LaSalle

39
Market Directions - Abu Dhabi - Prime Rental Clock
Q4 2013
Rental Growth
Slowing
Rents
Falling
Rental Growth
Accelerating
Rents
Bottoming Out
Retail
Residential
Office * Hotel
*Hotel clock reflects the movement of RevPAR. Note: The property clock illustrates where Jones Lang LaSalle estimates each prime market is within its individual rental cycle as at end of the relevant quarter. Source: Jones Lang LaSalle

40
Market Directions - Abu Dhabi - Prime Rental Clock
Q4 2014
Rental Growth
Slowing
Rents
Falling
Rental Growth
Accelerating
Rents
Bottoming Out
Retail
Residential
Office * Hotel
*Hotel clock reflects the movement of RevPAR. Note: The property clock illustrates where Jones Lang LaSalle estimates each prime market is within its individual rental cycle as at end of the relevant quarter. Source: Jones Lang LaSalle

46
Jones Lang LaSalle’s – Top Trends for 2014
Avoiding another bubble 1
More measured mega developments 2
Future directions of growth 3
Expo 2020. Limited impact in 2014 4
Varied approaches to finance real estate 5
Two speed investment market 6
Workplace transformation as corporate
activity increases 7
More hotel investment sales 8
Sustainability – From talk to action 9
Improved valuation and
measurement standards 10

47
Question and Answers

48
Alan Robertson
CEO, MENA [email protected]
David Dudley
Director of MENA
Operations
Chiheb Ben Mahmoud
Head of Hotels & Hospitality [email protected]
Graham Howat
Head of Asset & Property
Management
Andrew Rotteveel
Head of Project and
Development Services
Deepak Jain
Head of Strategic
Consulting
Gaurav Shivpuri
Head of Capital Markets
Fadi Moussalli
Regional Director – ICG
Craig Plumb
Head of Research
Simon Brand
Head of Valuation Advisory [email protected]
Dana Williamson
Head of Agency
Andrew Williamson
Head of Retail

49
Thank you
joneslanglasalleblog.com/
EMEAResearch
linkedin.com/company/
jones-lang-lasalle
twitter.com/
JLLMENA
youtube.com/
joneslanglasalle