tools measure sustainability: life cycle assessment...life cycle assessment life cycle assessment...
TRANSCRIPT
Tools to Measure Sustainability:
Life Cycle AssessmentMay 25, 2011
Dr. Anahita Williamson, DirectorKate Winnebeck NYSP2I Senior EngineerKate Winnebeck, NYSP2I Senior Engineer
New York State Pollution Prevention Institute at RIT
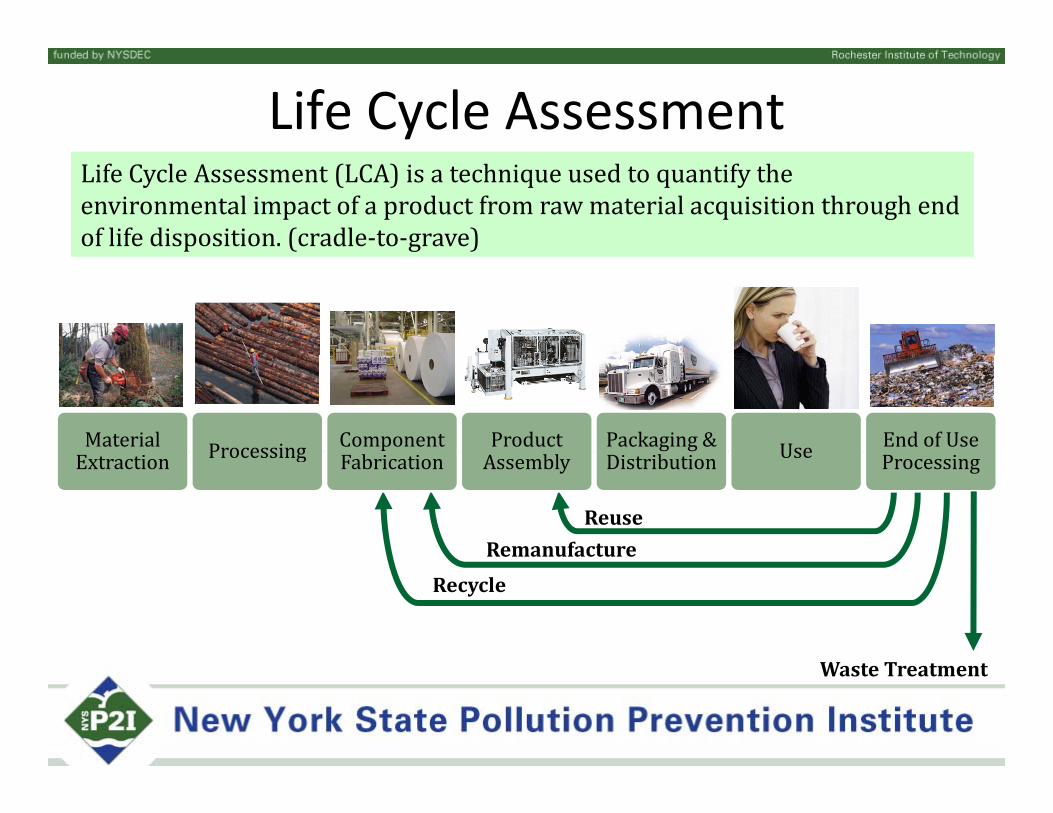
Life Cycle AssessmentLifeCycleAssessment(LCA)isatechniqueusedtoquantifytheenvironmentalimpactofaproductfromrawmaterialacquisitionthroughendoflifedisposition.(cradle‐to‐grave)
MaterialE t ti Processing Component
F b i tiProductA bl
Packaging&Di t ib ti Use EndofUse
P i
RemanufactureReuse
Extraction g Fabrication Assembly Distribution Processing
Recycle
W TWasteTreatment
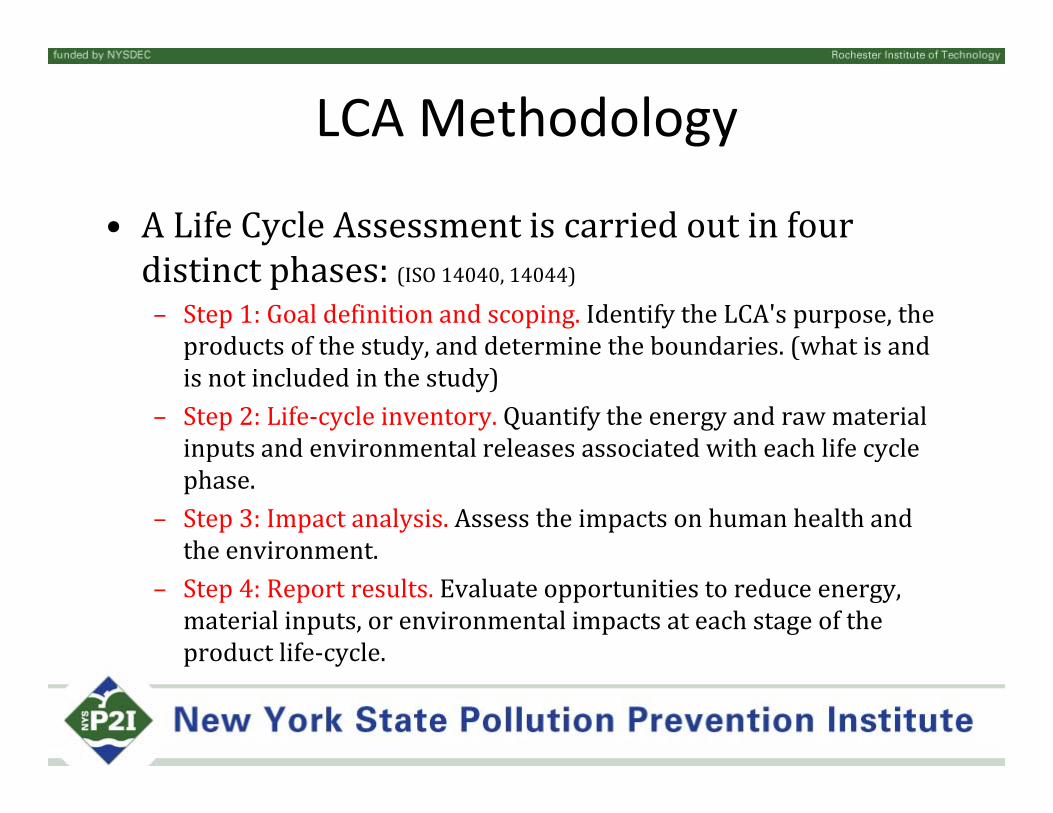
LCA Methodology
• ALifeCycleAssessmentiscarriedoutinfourdistinctphases:(ISO14040,14044)– Step1:Goaldefinitionandscoping.IdentifytheLCA'spurpose,theproductsofthestudy,anddeterminetheboundaries.(whatisandp y, (isnotincludedinthestudy)
– Step2:Life‐cycleinventory.Quantifytheenergyandrawmaterialinputsandenvironmentalreleasesassociatedwitheachlifecyclep yphase.
– Step3:Impactanalysis.Assesstheimpactsonhumanhealthandtheenvironment.
– Step4:Reportresults.Evaluateopportunitiestoreduceenergy,materialinputs,orenvironmentalimpactsateachstageoftheproductlife‐cycle.p y

Benefits of LCA• QuantifyenvironmentalbenefitsofproductsP id dibl id f k ti l i• Providecredibleevidenceformarketingclaims
• Identifyopportunitiestoimprovetheenvironmentalperformanceofproductsatvariouspointsintheirlifep p pcycle
• Informdecision‐makersinindustry,governmentornon‐l i igovernmentalorganizations
• Selectrelevantindicatorsofenvironmentalperformance,including measurement techniquesincludingmeasurementtechniques
• Validateproductmarketingclaims• Instilllifecyclethinkingwithinbusinesses
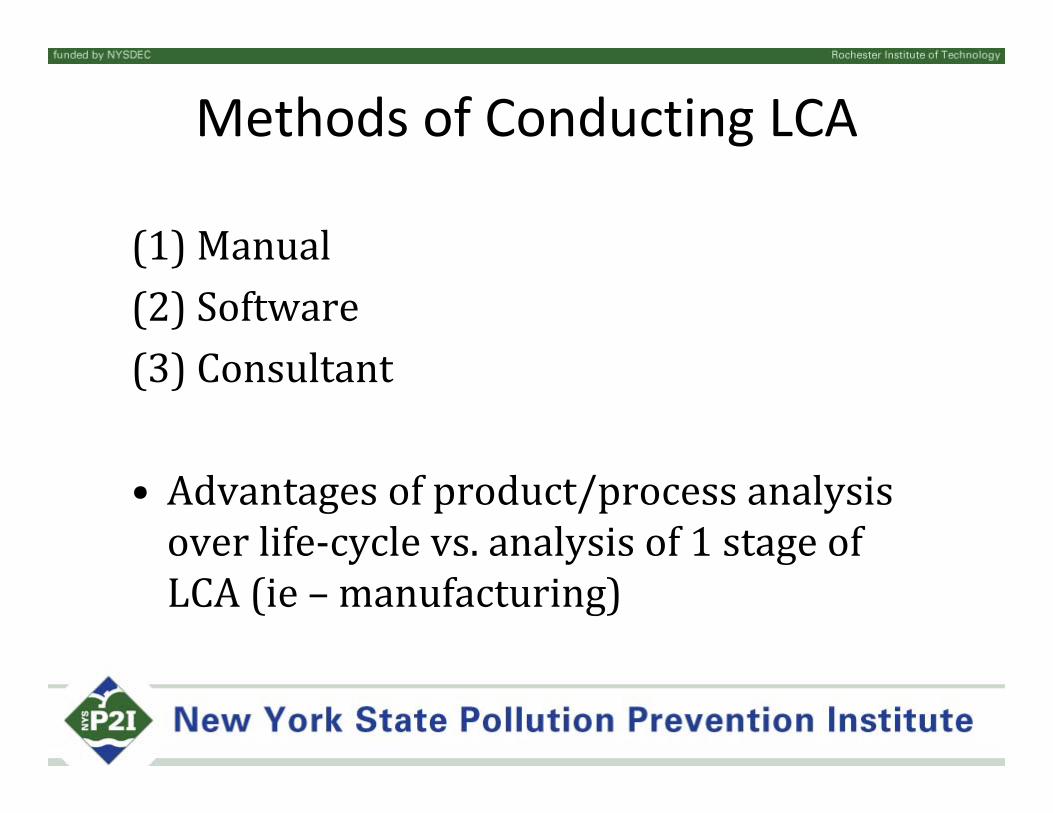
Methods of Conducting LCA
(1) Manual(1)Manual(2)Software(3) C l(3)Consultant
• Advantagesofproduct/processanalysisoverlife‐cyclevs.analysisof1stageofy y gLCA(ie– manufacturing)
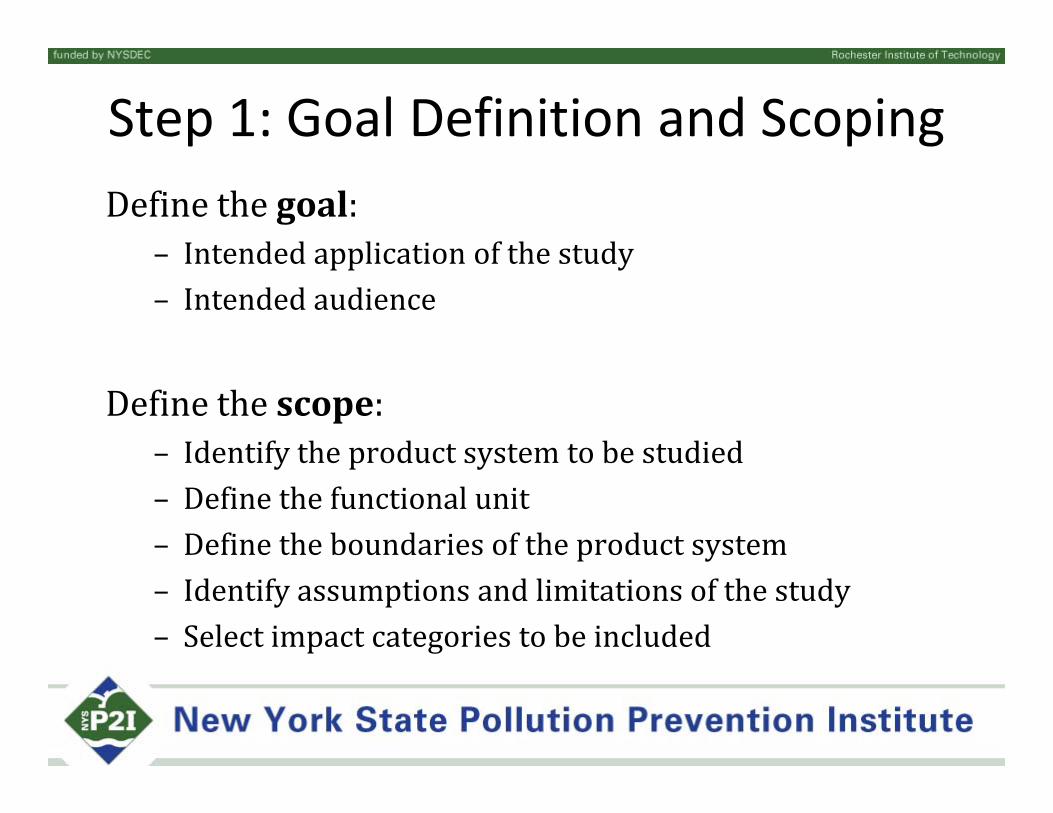
Step 1: Goal Definition and ScopingDefinethegoal:
Intended application of the study– Intendedapplicationofthestudy– Intendedaudience
Definethescope:– Identify the product system to be studiedIdentifytheproductsystemtobestudied– Definethefunctionalunit– Definetheboundariesoftheproductsystemp y– Identifyassumptionsandlimitationsofthestudy– Selectimpactcategoriestobeincluded
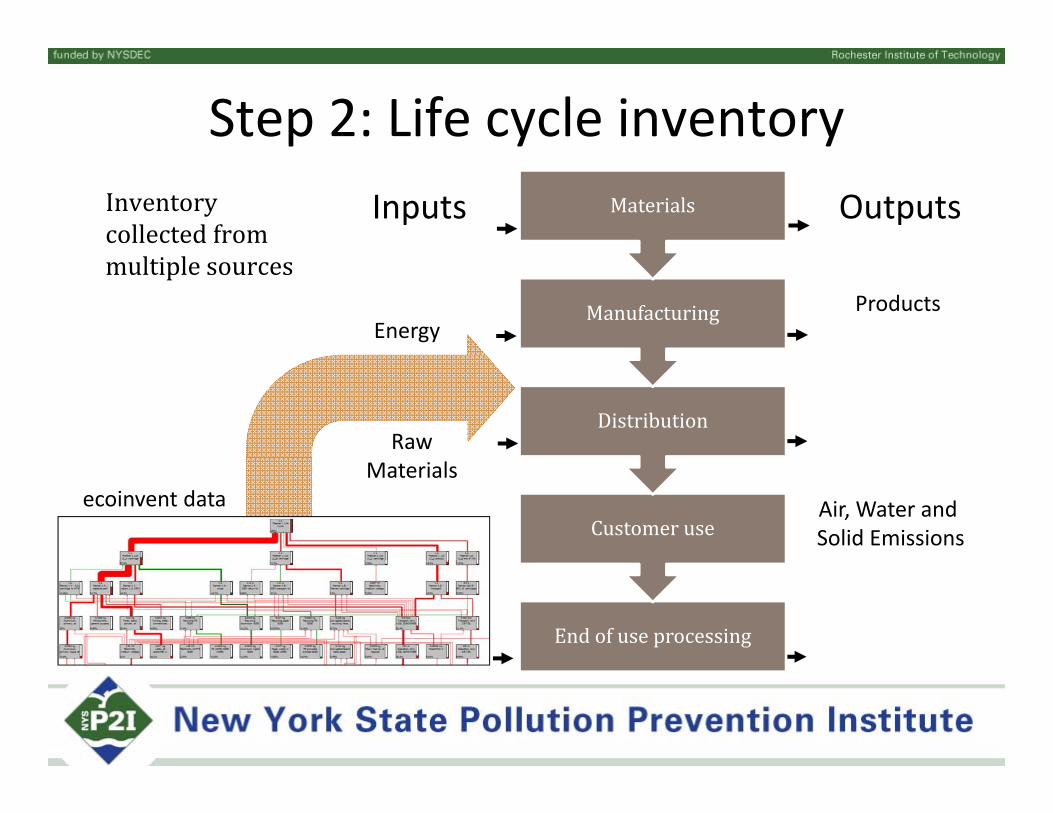
Step 2: Life cycle inventoryOutputsInputs MaterialsInventory
collectedfrom
ProductsEnergy
Manufacturing
multiplesources
Raw Distribution
Air, Water and Solid Emissions
Materials
Customeruseecoinvent data
Endofuseprocessing
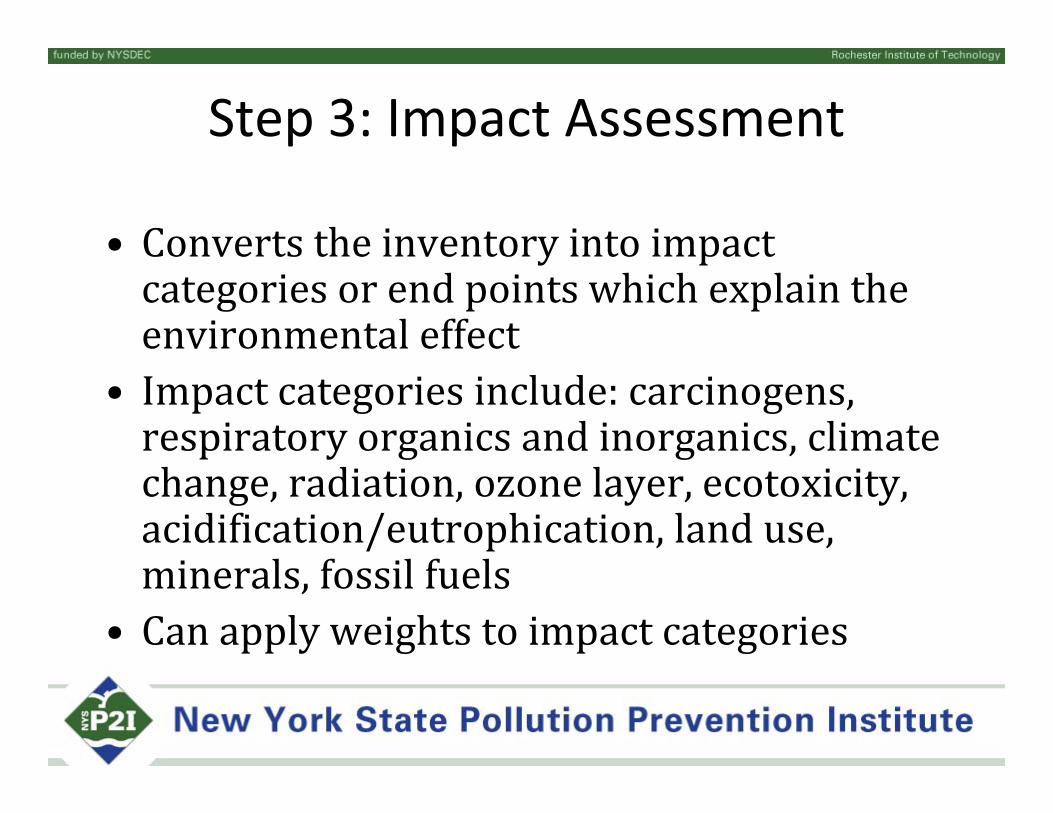
Step 3: Impact Assessment
• Converts the inventory into impactConvertstheinventoryintoimpactcategoriesorendpointswhichexplaintheenvironmentaleffect
• Impactcategoriesinclude:carcinogens,respiratoryorganicsandinorganics,climatep y g gchange,radiation,ozonelayer,ecotoxicity,acidification/eutrophication,landuse,i l f il f lminerals,fossilfuels
• Canapplyweightstoimpactcategories
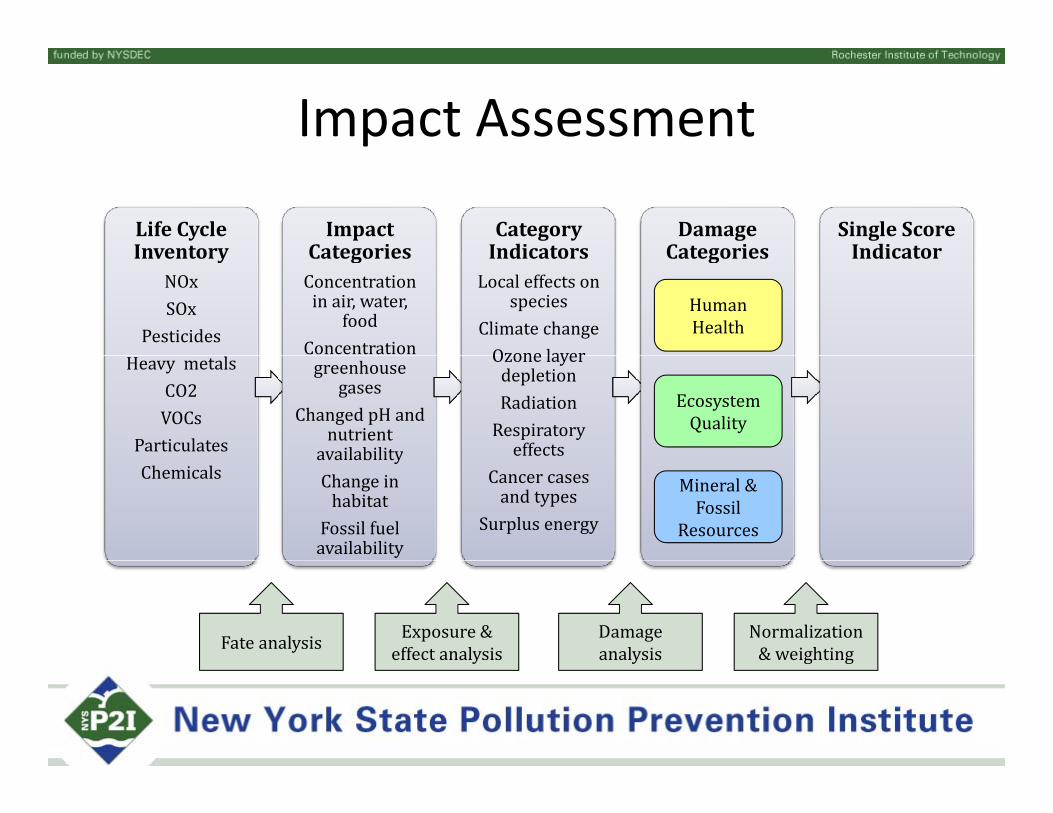
Impact Assessment
LifeCycleInventory
ImpactCategories
CategoryIndicators
DamageCategories
SingleScoreIndicatorInventory
NOxSOx
Pesticides
CategoriesConcentrationinair,water,
foodConcentration
IndicatorsLocaleffectson
speciesClimatechangeOzone layer
Categories Indicator
HumanHealth
HeavymetalsCO2VOCs
Particulates
greenhousegases
ChangedpHandnutrientavailability
OzonelayerdepletionRadiationRespiratoryeffects
EcosystemQuality
ChemicalsavailabilityChangeinhabitatFossilfuelavailability
Cancercasesandtypes
Surplusenergy
Mineral&Fossil
Resources
Fateanalysis Exposure&effectanalysis
Damageanalysis
Normalization&weightingy y g g
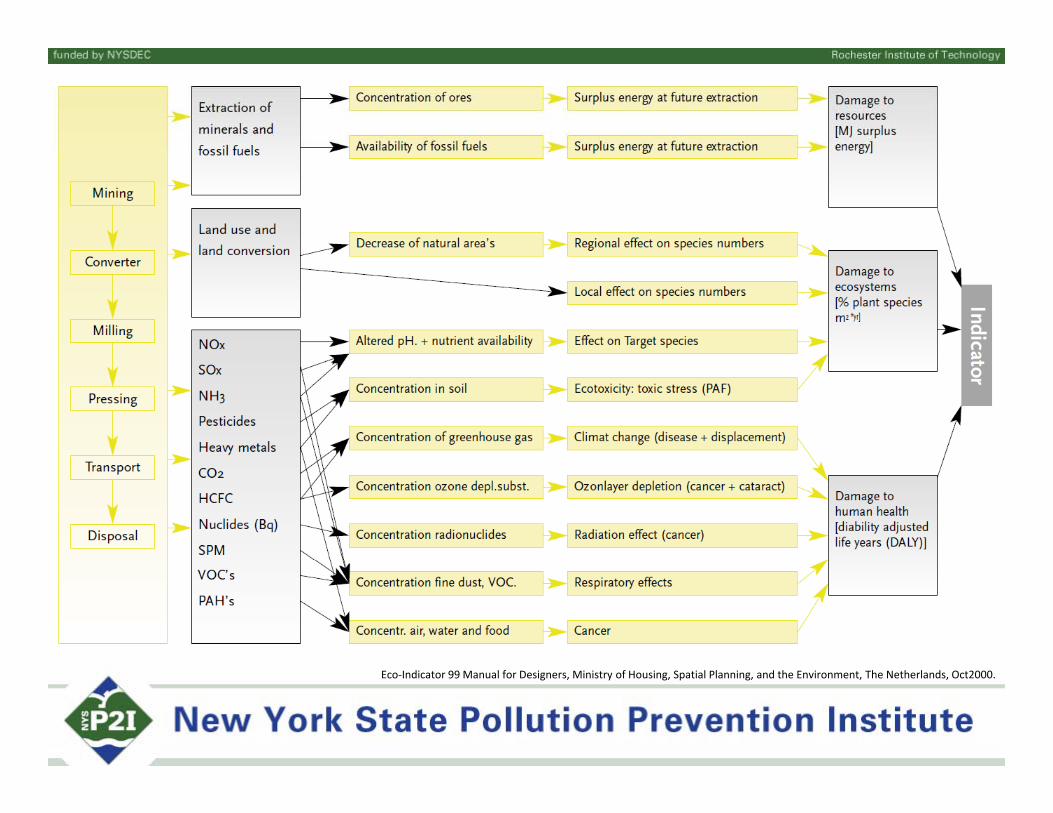
Eco‐Indicator 99 Manual for Designers, Ministry of Housing, Spatial Planning, and the Environment, The Netherlands, Oct2000.
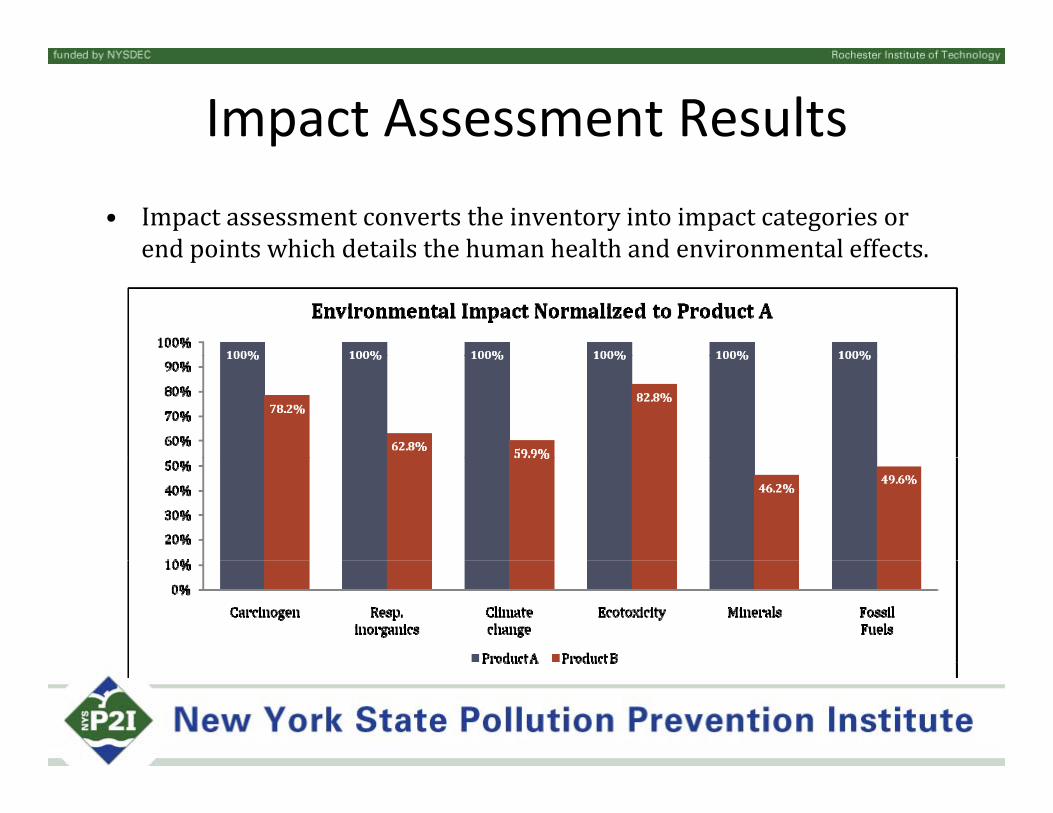
Impact Assessment Results• Impactassessmentconvertstheinventoryintoimpactcategoriesor
end points which details the human health and environmental effectsendpointswhichdetailsthehumanhealthandenvironmentaleffects.
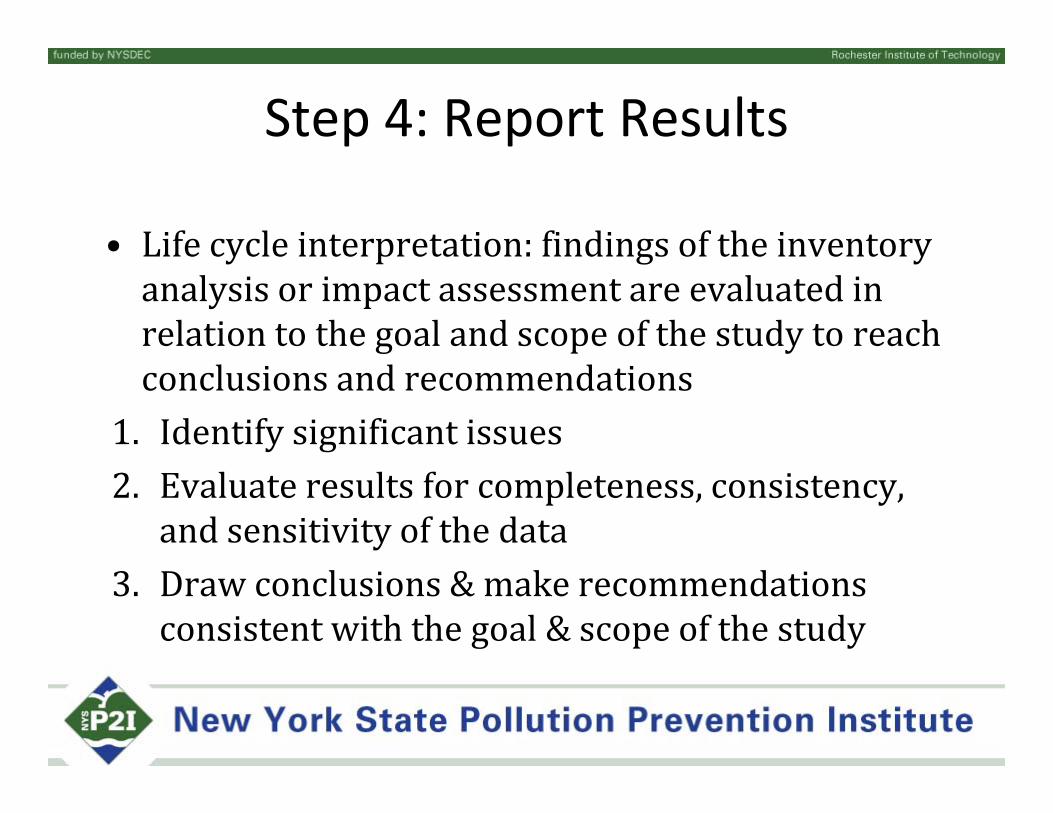
Step 4: Report Results
• Life cycle interpretation: findings of the inventoryLifecycleinterpretation:findingsoftheinventoryanalysisorimpactassessmentareevaluatedinrelationtothegoalandscopeofthestudytoreachconclusionsandrecommendations
1. Identifysignificantissues2. Evaluateresultsforcompleteness,consistency,
andsensitivityofthedata3. Drawconclusions&makerecommendations
consistentwiththegoal&scopeofthestudy
Manual Calculations
Manual Calculations
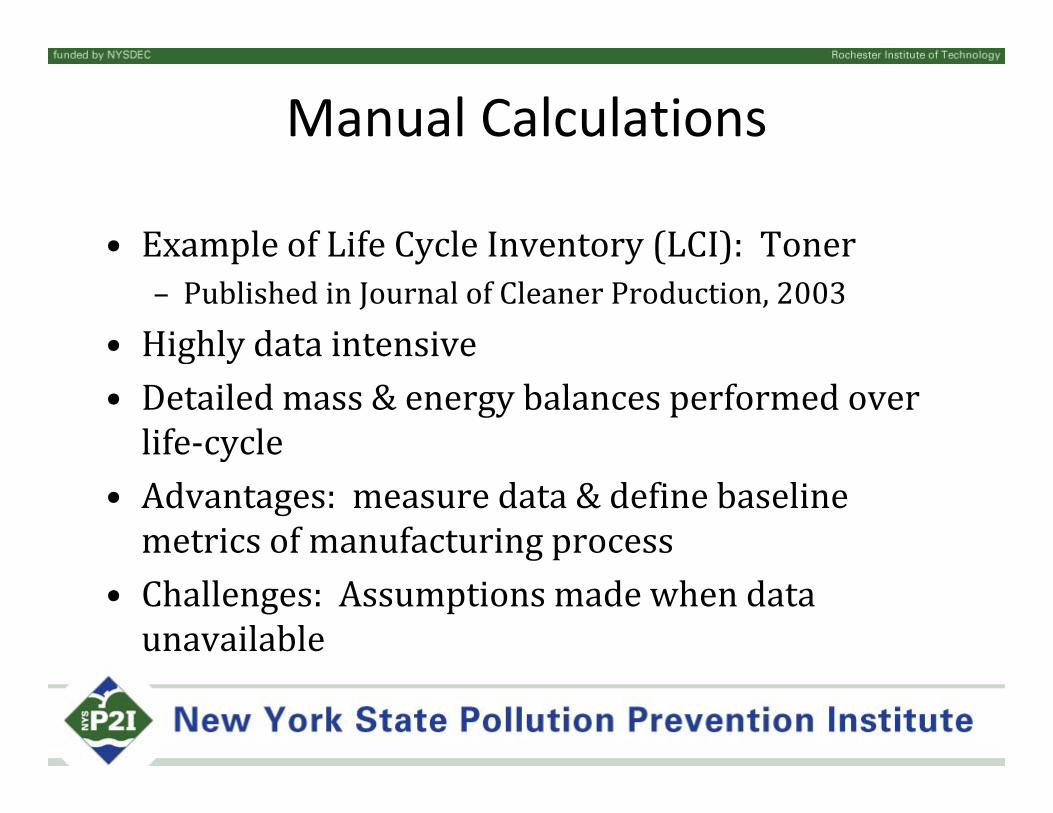
• Example of Life Cycle Inventory (LCI): TonerExampleofLifeCycleInventory(LCI):Toner– PublishedinJournalofCleanerProduction,2003
• Highly data intensiveHighlydataintensive• Detailedmass&energybalancesperformedoverlife‐cycley
• Advantages:measuredata&definebaselinemetricsofmanufacturingprocessg
• Challenges:Assumptionsmadewhendataunavailable
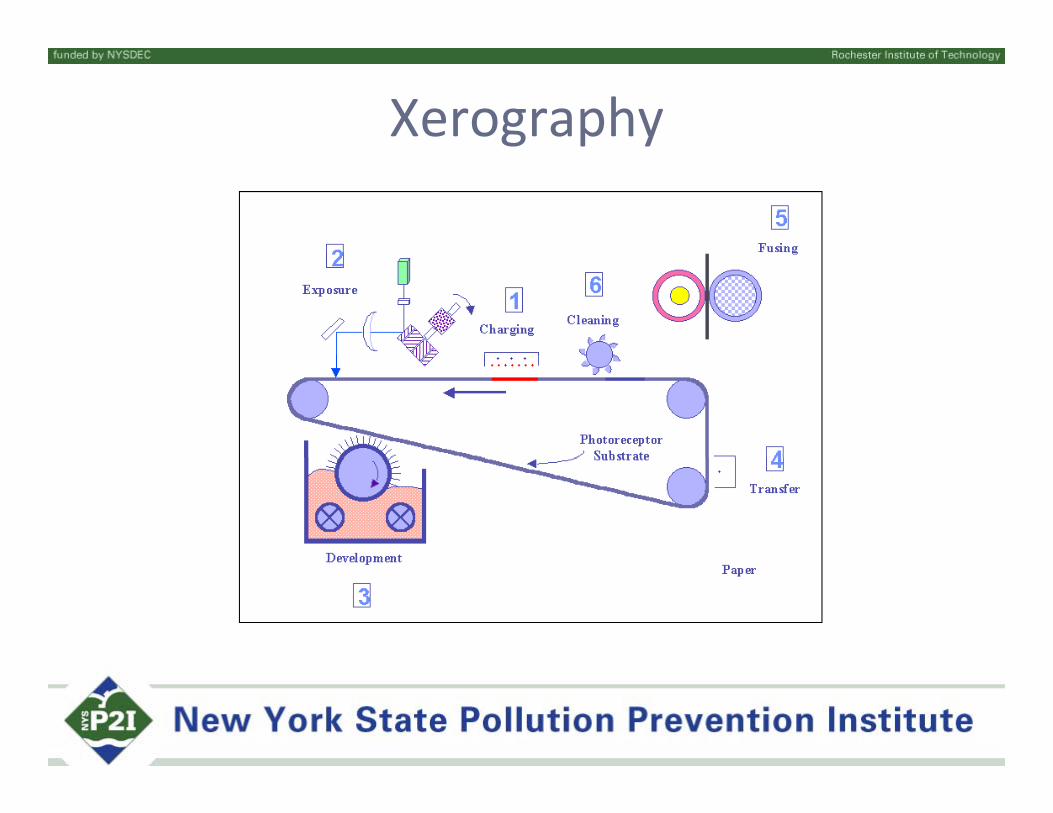
Xerography
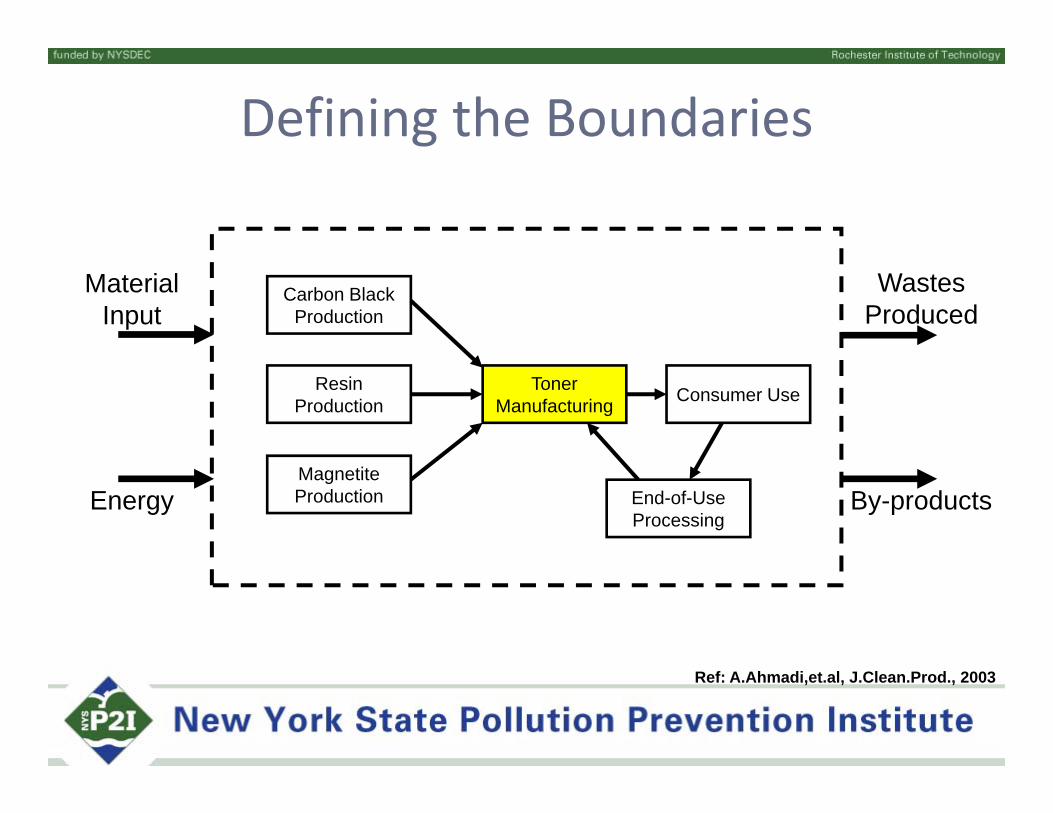
Defining the Boundaries
MaterialInput
Carbon Black Production
WastesProduced
Toner Manufacturing
Resin Production Consumer Use
EnergyMagnetite Production End-of-Use
ProcessingBy-products
Ref: A.Ahmadi,et.al, J.Clean.Prod., 2003
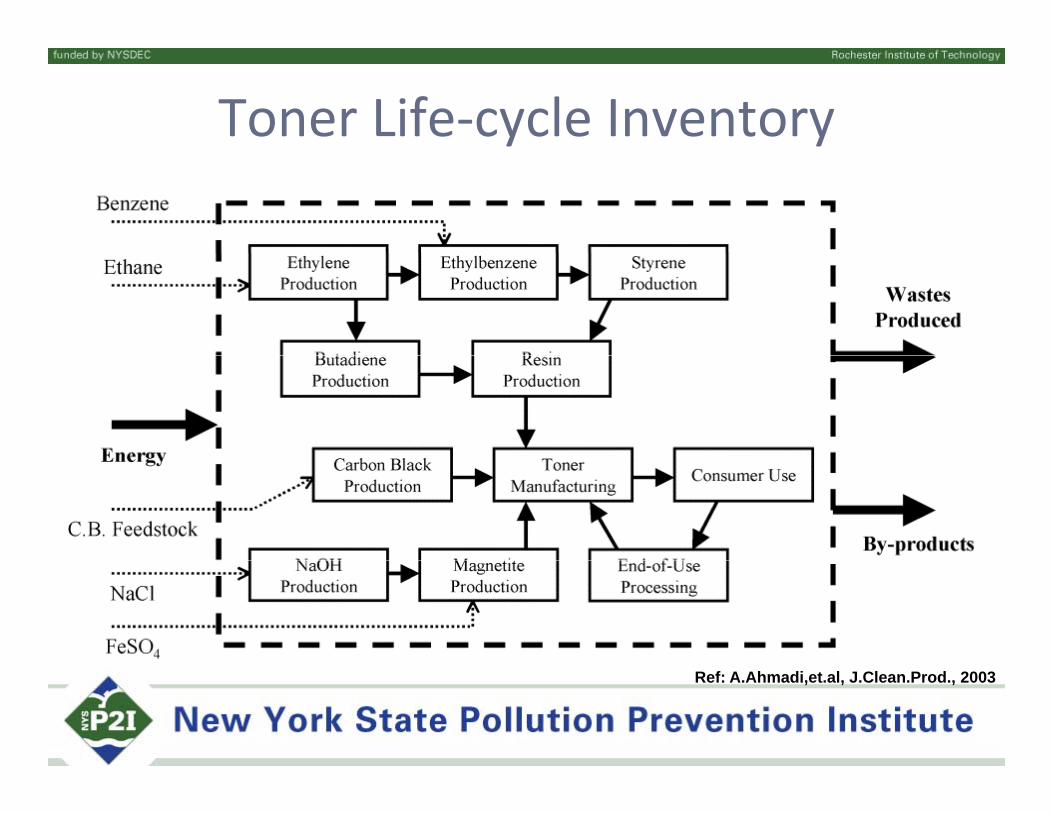
Toner Life‐cycle Inventory
Ref: A.Ahmadi,et.al, J.Clean.Prod., 2003
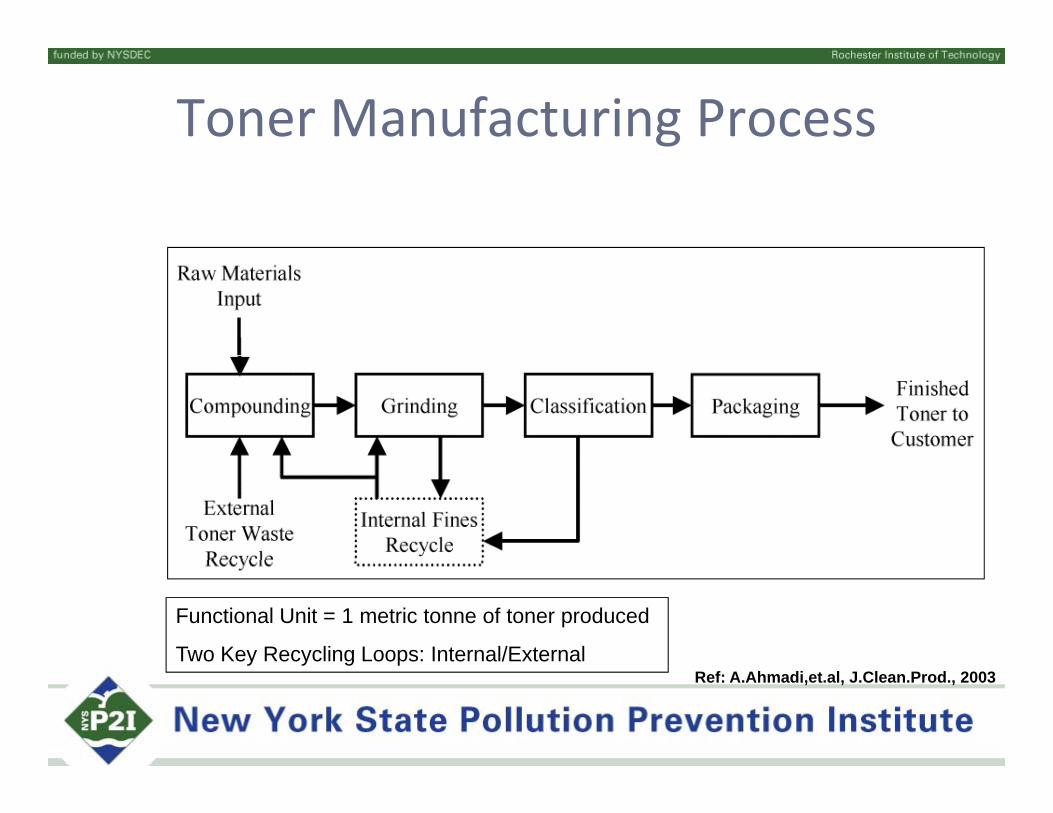
Toner Manufacturing Process
Functional Unit = 1 metric tonne of toner produced
Two Key Recycling Loops: Internal/Externaly y g pRef: A.Ahmadi,et.al, J.Clean.Prod., 2003
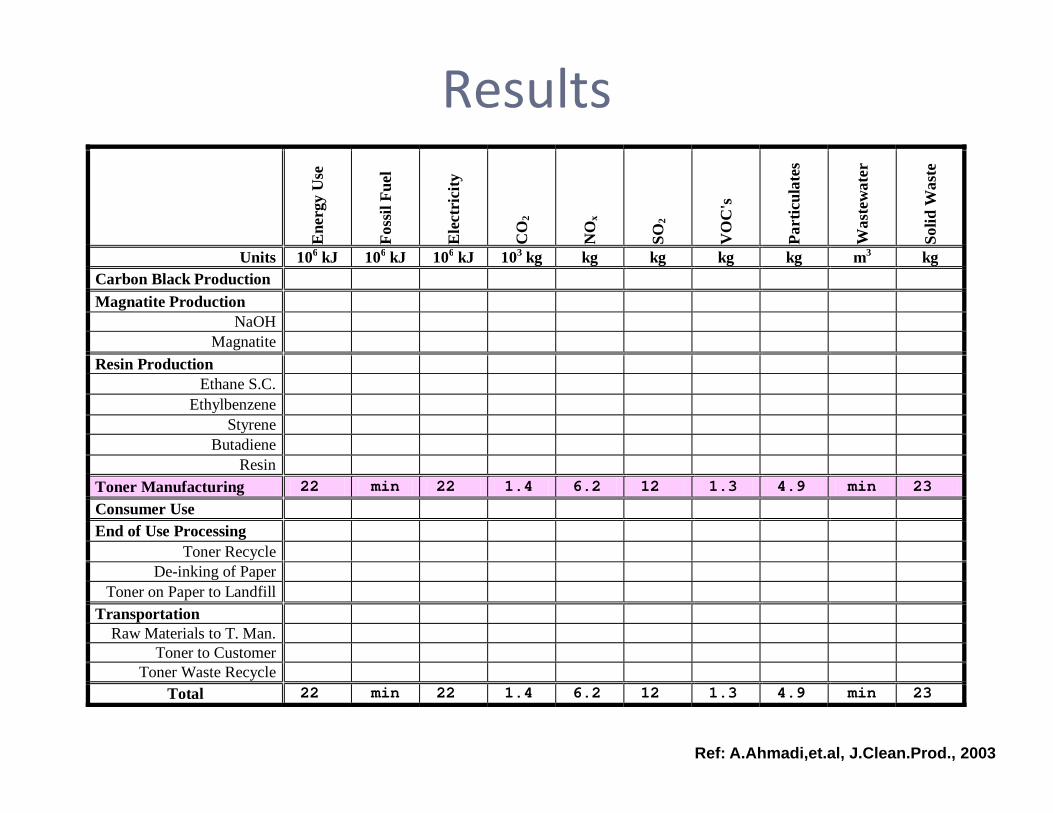
Results
Ene
rgy
Use
Foss
il Fu
el
Ele
ctri
city
CO
2
NO
x
SO2
VO
C's
Part
icul
ates
Was
tew
ater
Solid
Was
te
U it 106 kJ 106 kJ 106 kJ 103 k k k k k 3 kUnits 106 kJ 106 kJ 106 kJ 103 kg kg kg kg kg m3 kgCarbon Black Production
Magnatite Production NaOH
Magnatite
Resin Production Ethane S.C.
Ethylbenzene Styrene
Butadiene Resin
Toner Manufacturing 22 min 22 1.4 6.2 12 1.3 4.9 min 23 Consumer Use End of Use Processing
Toner Recycle De-inking of Paper
Toner on Paper to Landfill Transportation
Raw Materials to T. Man. Toner to Customer
Toner Waste Recycle Total 22 min 22 1.4 6.2 12 1.3 4.9 min 23
Ref: A.Ahmadi,et.al, J.Clean.Prod., 2003
Results
Ene
rgy
Use
Foss
il Fu
el
Ele
ctri
city
CO
2
NO
x
SO2
VO
C's
Part
icul
ates
Was
tew
ater
Solid
Was
te
U it 106 kJ 106 kJ 106 kJ 103 k k k k k 3 kUnits 106 kJ 106 kJ 106 kJ 103 kg kg kg kg kg m3 kgCarbon Black Production
Magnatite Production NaOH
Magnatite
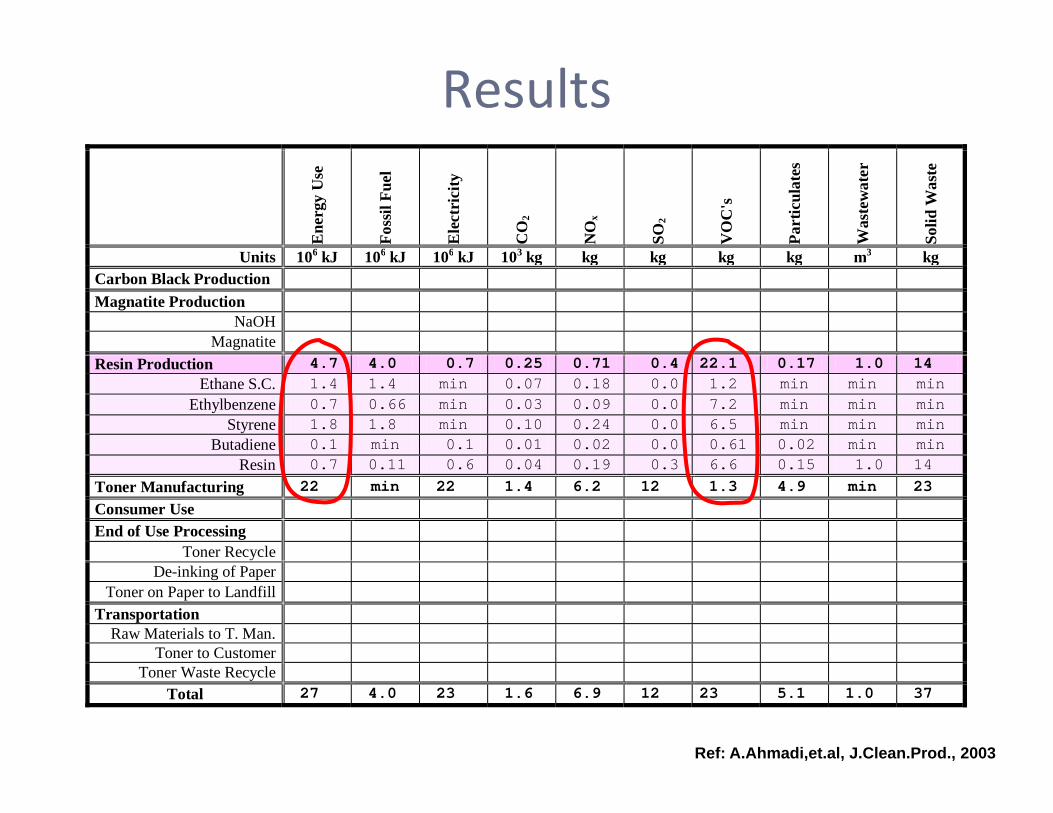
Resin Production 4.7 4.0 0.7 0.25 0.71 0.4 22.1 0.17 1.0 14Ethane S.C. 1.4 1.4 min 0.07 0.18 0.0 1.2 min min min
Ethylbenzene 0.7 0.66 min 0.03 0.09 0.0 7.2 min min min Styrene 1.8 1.8 min 0.10 0.24 0.0 6.5 min min min
Butadiene 0.1 min 0.1 0.01 0.02 0.0 0.61 0.02 min min Resin 0.7 0.11 0.6 0.04 0.19 0.3 6.6 0.15 1.0 14
Toner Manufacturing 22 min 22 1.4 6.2 12 1.3 4.9 min 23 Consumer Use End of Use Processing
Toner Recycle De-inking of Paper
Toner on Paper to Landfill Transportation
Raw Materials to T. Man. Toner to Customer
Toner Waste Recycle Total 27 4.0 23 1.6 6.9 12 23 5.1 1.0 37
Ref: A.Ahmadi,et.al, J.Clean.Prod., 2003
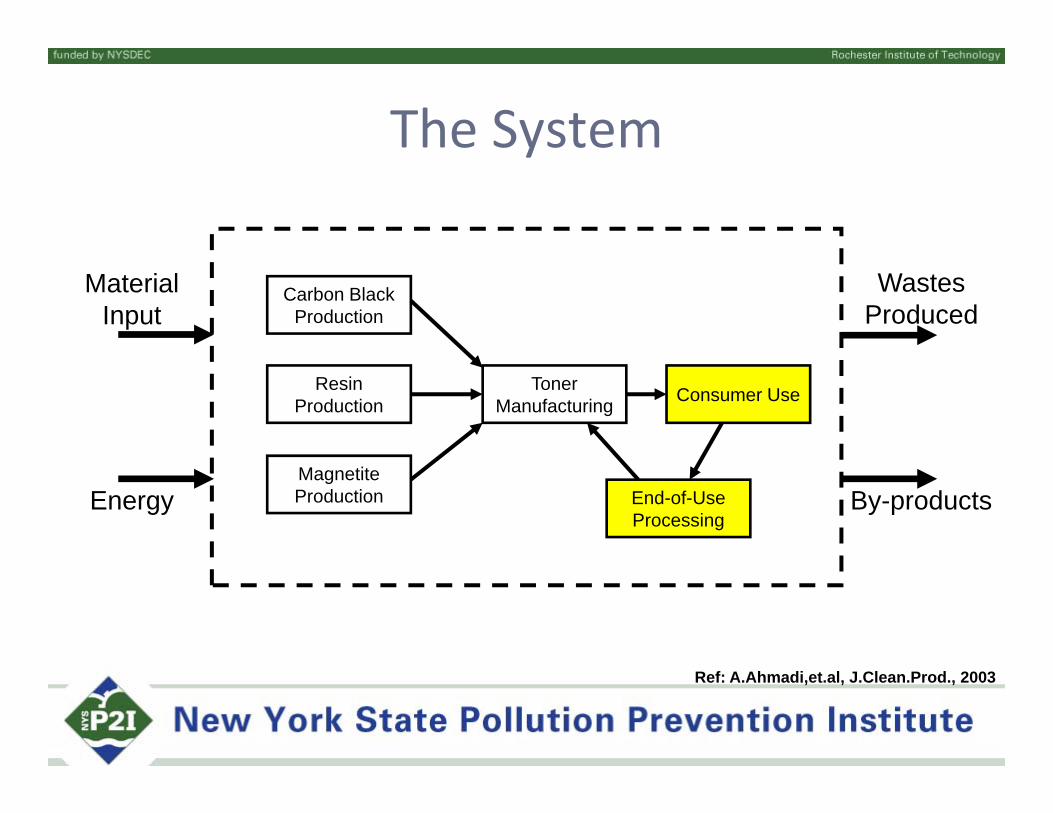
The Systemy
MaterialInput
Carbon Black Production
WastesProduced
Toner Manufacturing
Resin Production Consumer Use
EnergyMagnetite Production End-of-Use
ProcessingBy-products
Ref: A.Ahmadi,et.al, J.Clean.Prod., 2003
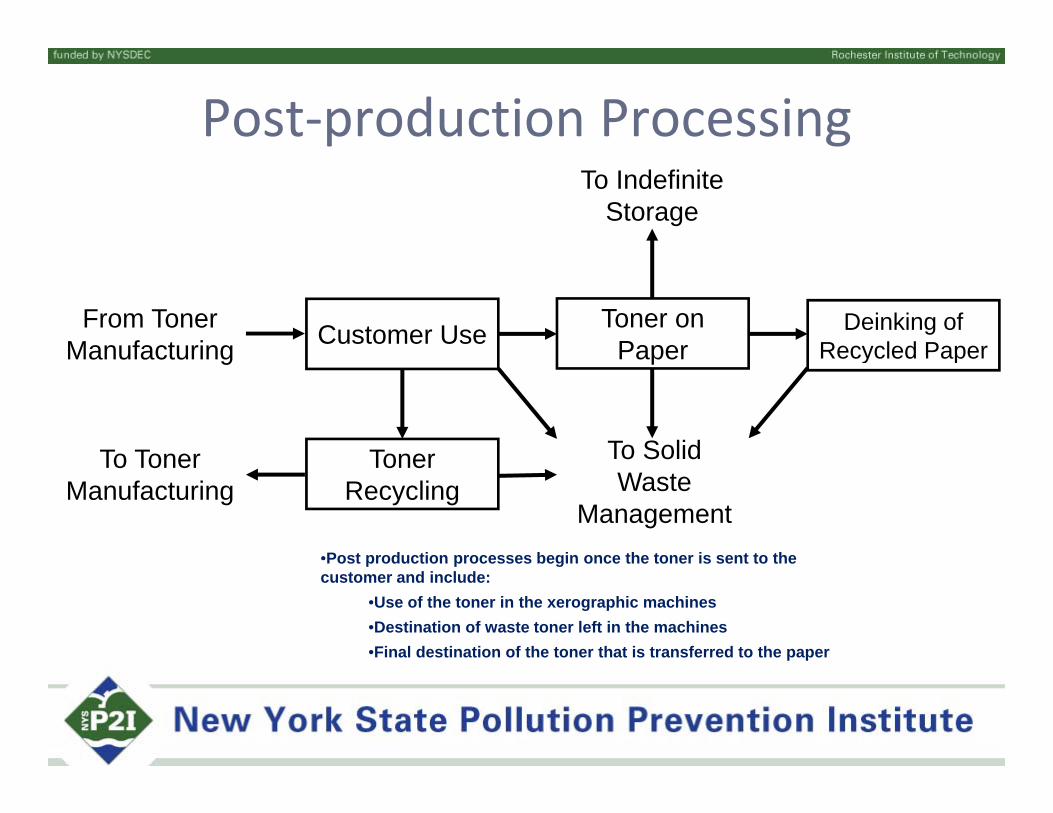
Post‐production ProcessingTo Indefinite
Storage
Toner on PaperCustomer UseFrom Toner
ManufacturingDeinking of
Recycled Paper
To Toner
Paper
Toner
Manufacturing Recycled Paper
To SolidTo Toner Manufacturing
Toner Recycling
To Solid Waste
Management •Post production processes begin once the toner is sent to thePost production processes begin once the toner is sent to the customer and include:
•Use of the toner in the xerographic machines•Destination of waste toner left in the machines•Final destination of the toner that is transferred to the paper
Results
Ene
rgy
Use
Foss
il Fu
el
Ele
ctri
city
CO
2
NO
x
SO2
VO
C's
Part
icul
ates
Was
tew
ater
Solid
Was
te
U it 106 kJ 106 kJ 106 kJ 103 k k k k k 3 kUnits 106 kJ 106 kJ 106 kJ 103 kg kg kg kg kg m3 kgCarbon Black Production 1.5 1.5 min 0.06 0.12 1.1 0.10 0.07 min min
Magnatite Production 2.9 1.6 1.4 0.17 0.59 0.7 0.08 0.56 1.5 min NaOH 1.2 0.1 1.1 0.08 0.33 0.6 0.06 0.23 min min
Magnatite 1.7 1.4 0.3 0.09 0.26 0.1 0.02 0.34 1.5 min
Resin Production 4.7 4.0 0.7 0.25 0.71 0.4 22.1 0.17 1.0 14Ethane S.C. 1.4 1.4 min 0.07 0.18 0.0 1.2 min min min
Ethylbenzene 0.7 0.66 min 0.03 0.09 0.0 7.2 min min min Styrene 1.8 1.8 min 0.10 0.24 0.0 6.5 min min min
Butadiene 0.1 min 0.1 0.01 0.02 0.0 0.61 0.02 min min Resin 0.7 0.11 0.6 0.04 0.19 0.3 6.6 0.15 1.0 14
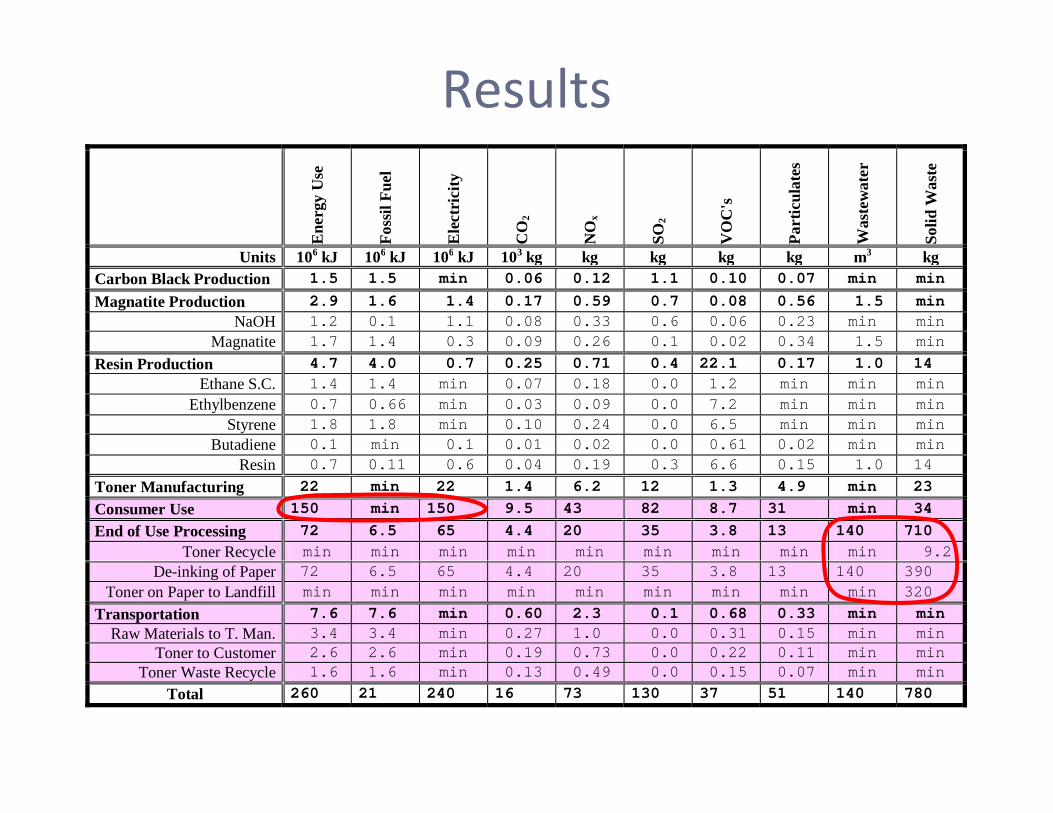
Toner Manufacturing 22 min 22 1.4 6.2 12 1.3 4.9 min 23 Consumer Use 150 min 150 9.5 43 82 8.7 31 min 34 End of Use Processing 72 6.5 65 4.4 20 35 3.8 13 140 710
Toner Recycle min min min min min min min min min 9.2 De-inking of Paper 72 6.5 65 4.4 20 35 3.8 13 140 390
Toner on Paper to Landfill min min min min min min min min min 320 Transportation 7.6 7.6 min 0.60 2.3 0.1 0.68 0.33 min min
Raw Materials to T. Man. 3.4 3.4 min 0.27 1.0 0.0 0.31 0.15 min min Toner to Customer 2.6 2.6 min 0.19 0.73 0.0 0.22 0.11 min min
Toner Waste Recycle 1.6 1.6 min 0.13 0.49 0.0 0.15 0.07 min min Total 260 21 240 16 73 130 37 51 140 780
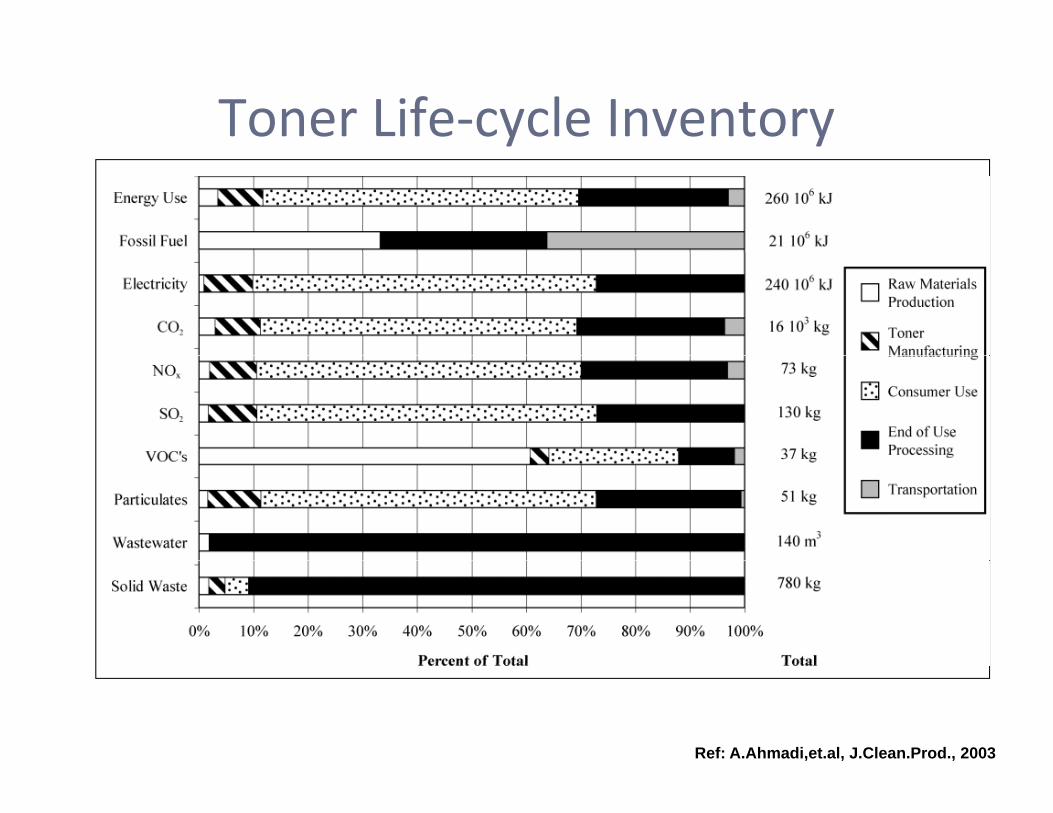
Toner Life‐cycle Inventory
Ref: A.Ahmadi,et.al, J.Clean.Prod., 2003
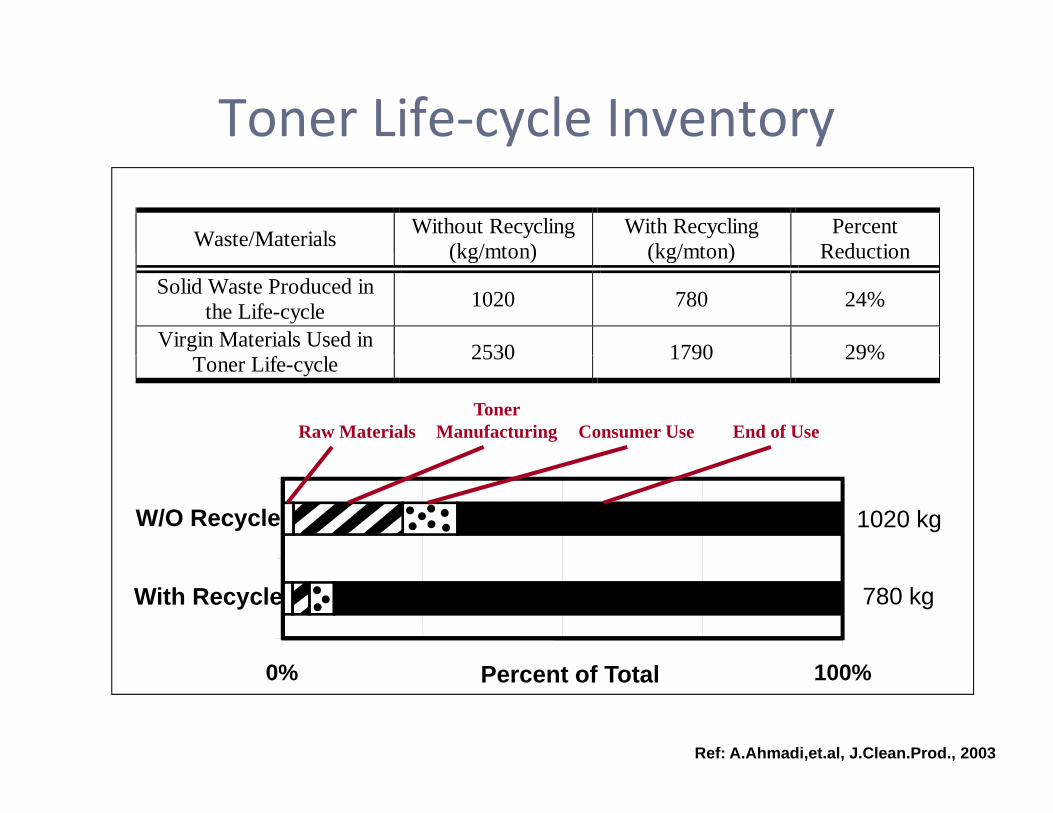
Toner Life‐cycle Inventory
Waste/Materials Without Recycling (kg/mton)
With Recycling (kg/mton)
Percent Reduction(kg/mton) (kg/mton) Reduction
Solid Waste Produced in the Life-cycle 1020 780 24%
Virgin Materials Used in 2530 1790 29%Toner Life-cycle 2530 1790 29%
Raw Materials
Toner Manufacturing Consumer Use End of Use
1020 kgW/O Recycle
780 kgWith Recycle
0% 100%Percent of Total
Ref: A.Ahmadi,et.al, J.Clean.Prod., 2003
Software Calculations
Software Calculations
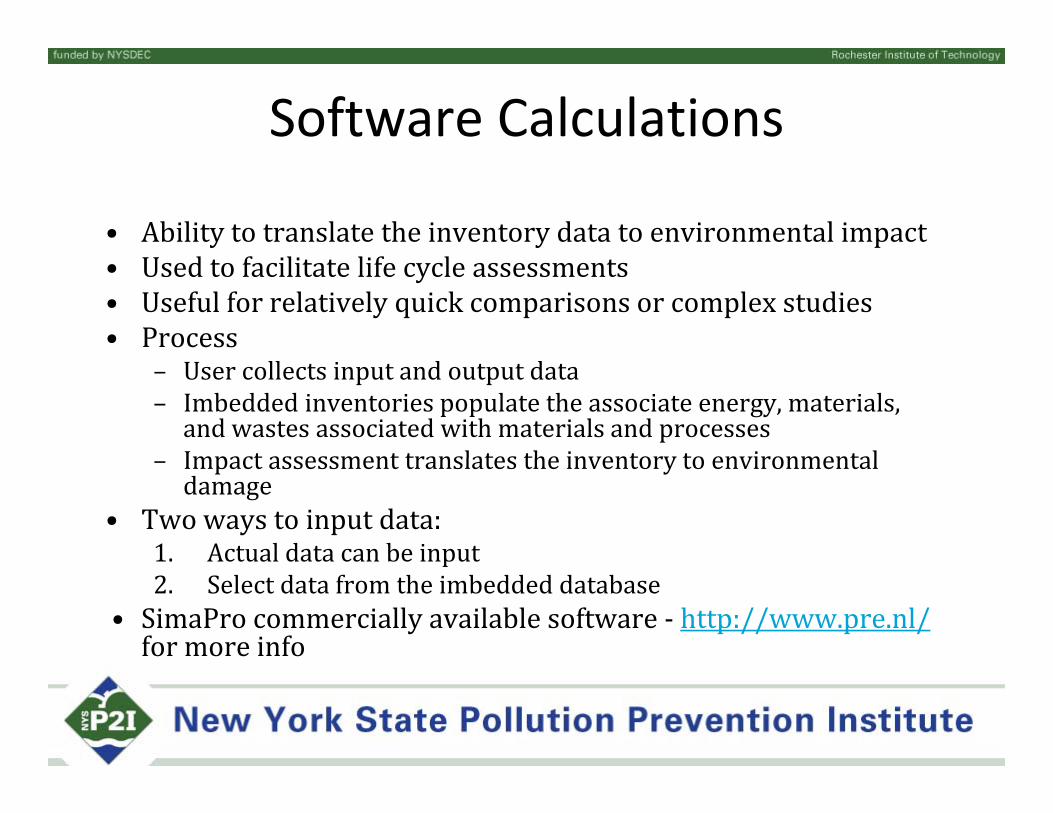
• Abilitytotranslatetheinventorydatatoenvironmentalimpact• Usedtofacilitatelifecycleassessments• Usefulforrelativelyquickcomparisonsorcomplexstudies• Process
– Usercollectsinputandoutputdata– Imbeddedinventoriespopulatetheassociateenergy,materials,andwastesassociatedwithmaterialsandprocessesImpact assessment translates the inventory to environmental– Impactassessmenttranslatestheinventorytoenvironmentaldamage
• Twowaystoinputdata:1. Actual data can be input1. Actualdatacanbeinput2. Selectdatafromtheimbeddeddatabase
• SimaPro commerciallyavailablesoftware‐ http://www.pre.nl/formoreinfo
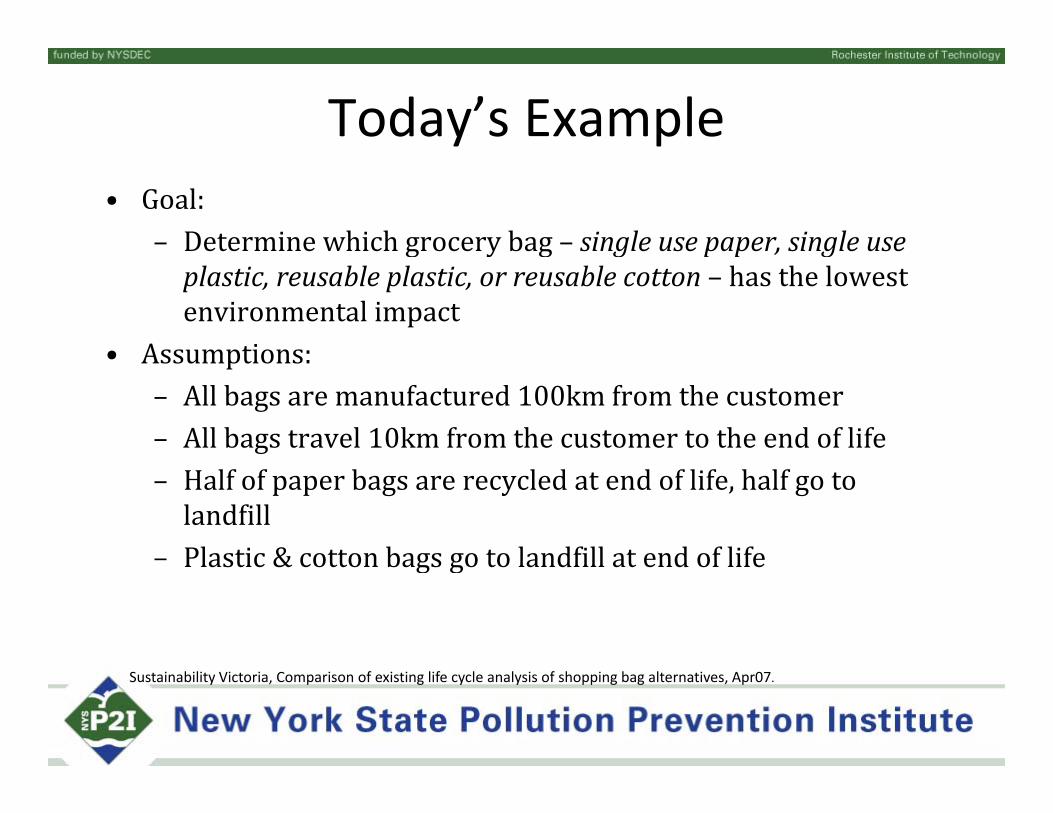
Today’s Example• Goal:
– Determinewhichgrocerybag– singleusepaper,singleuseg y g g p p , gplastic,reusableplastic,orreusablecotton– hasthelowestenvironmentalimpact
• Assumptions:• Assumptions:– Allbagsaremanufactured100kmfromthecustomer– Allbagstravel10kmfromthecustomertotheendoflife– Halfofpaperbagsarerecycledatendoflife,halfgotolandfill
– Plastic & cotton bags go to landfill at end of lifePlastic&cottonbagsgotolandfillatendoflife
Sustainability Victoria, Comparison of existing life cycle analysis of shopping bag alternatives, Apr07.
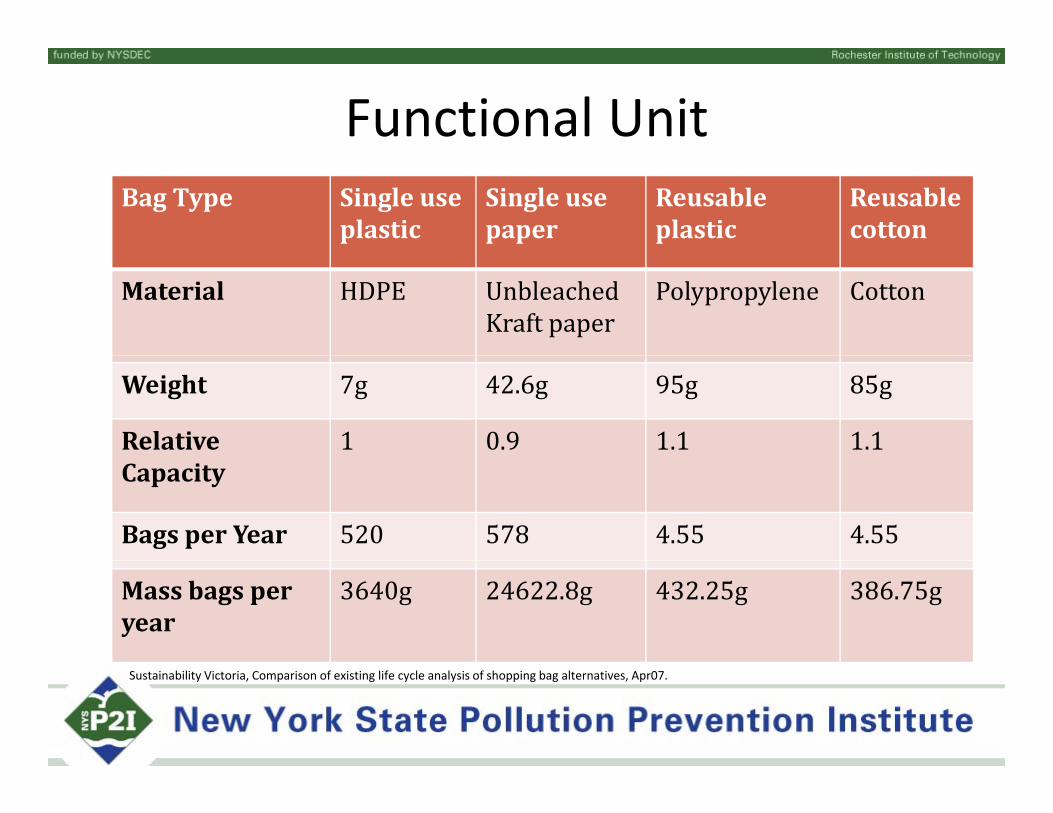
Functional UnitBagType Single use
plasticSingleusepaper
Reusableplastic
Reusablecotton
Material HDPE UnbleachedKraftpaper
Polypropylene Cotton
Weight 7g 42.6g 95g 85g
Relative 1 0.9 1.1 1.1Capacity
BagsperYear 520 578 4.55 4.55
Massbagsperyear
3640g 24622.8g 432.25g 386.75g
Sustainability Victoria, Comparison of existing life cycle analysis of shopping bag alternatives, Apr07.
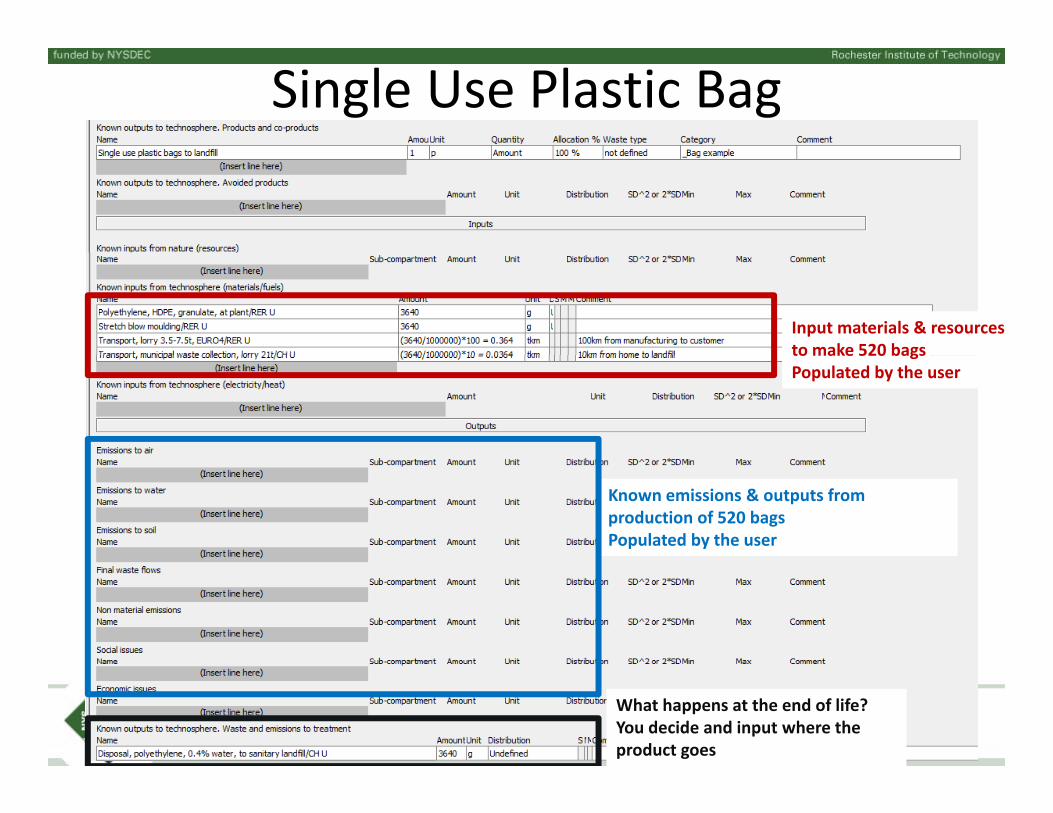
Single Use Plastic Bag
Input materials & resources to make 520 bagsto make 520 bagsPopulated by the user
Known emissions & outputs from production of 520 bagsPopulated by the user
What happens at the end of life? You decide and input where the product goes
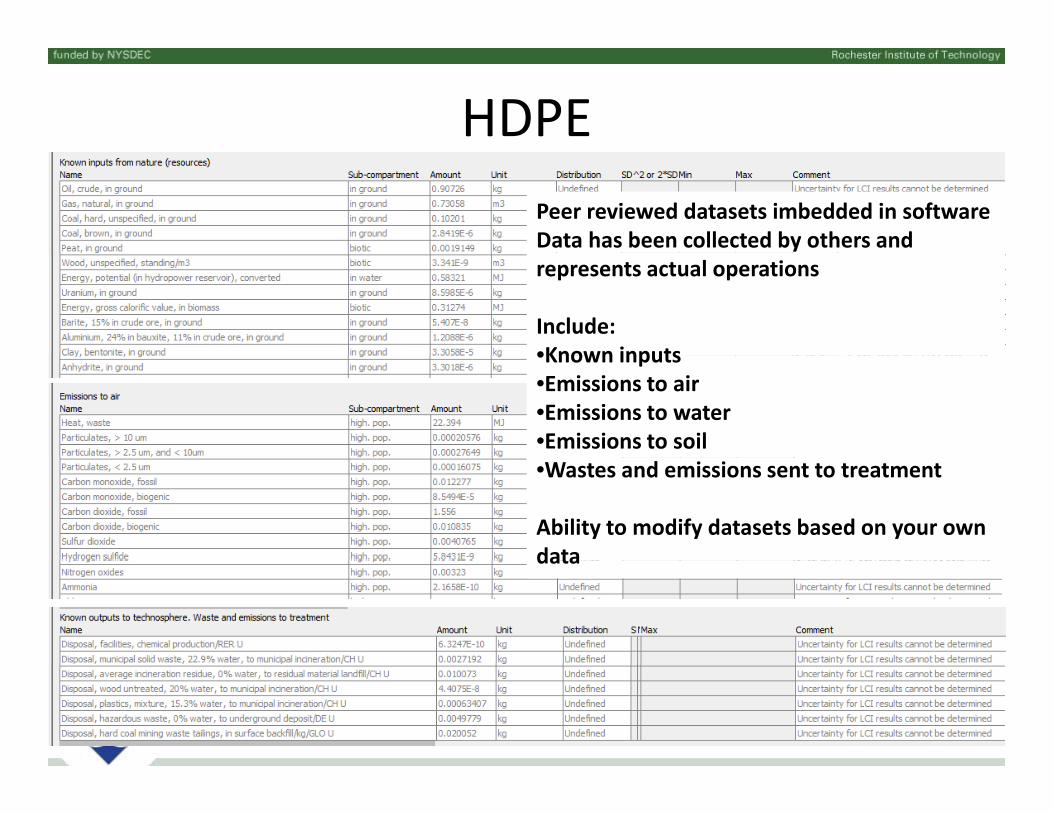
HDPEPeer reviewed datasets imbedded in softwareData has been collected by others and represents actual operations
Include:•Known inputs•Known inputs•Emissions to air•Emissions to water•Emissions to soil•Wastes and emissions sent to treatment
Ability to modify datasets based on your own datadata
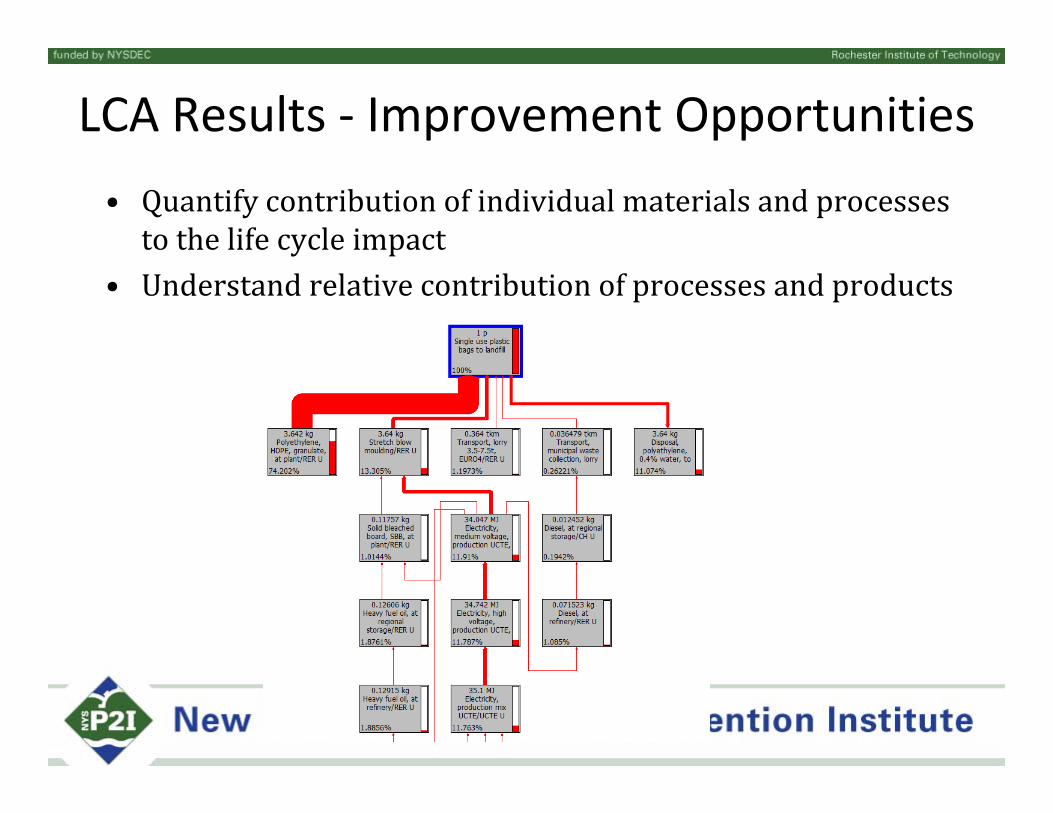
LCA Results ‐ Improvement Opportunities• Quantifycontributionofindividualmaterialsandprocessestothelifecycleimpacty p
• Understandrelativecontributionofprocessesandproducts
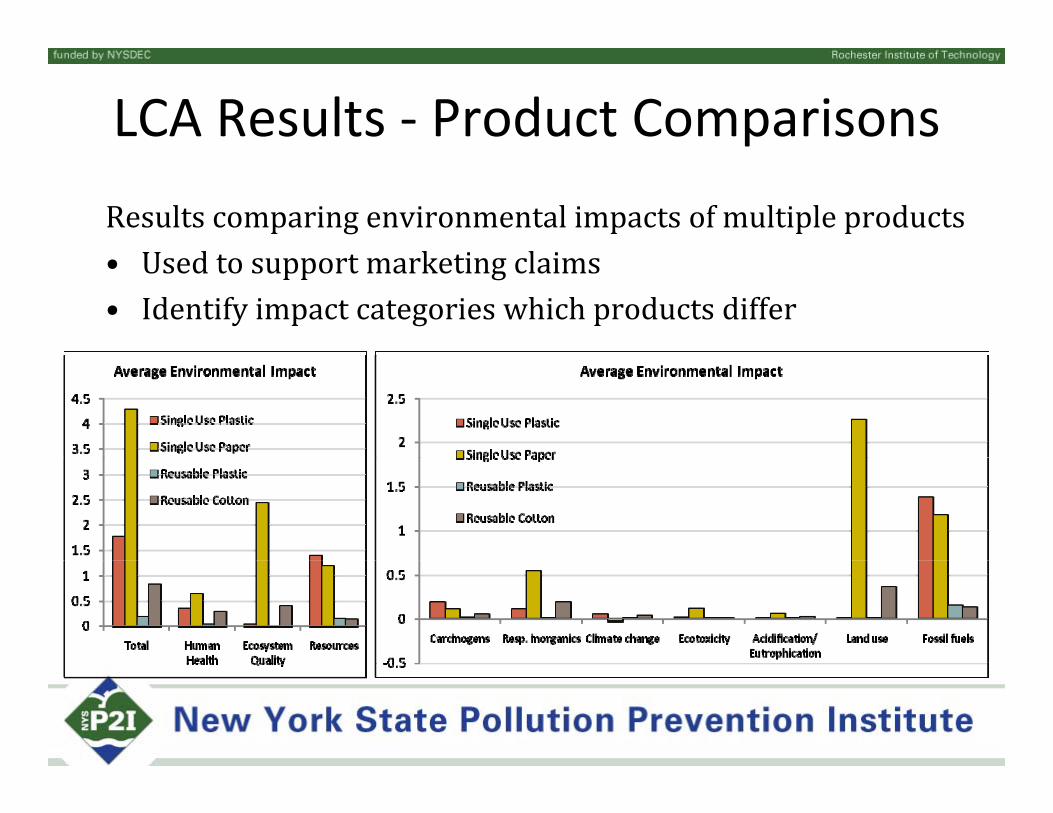
LCA Results ‐ Product ComparisonsResultscomparingenvironmentalimpactsofmultipleproductsU d k i l i• Usedtosupportmarketingclaims
• Identifyimpactcategorieswhichproductsdiffer
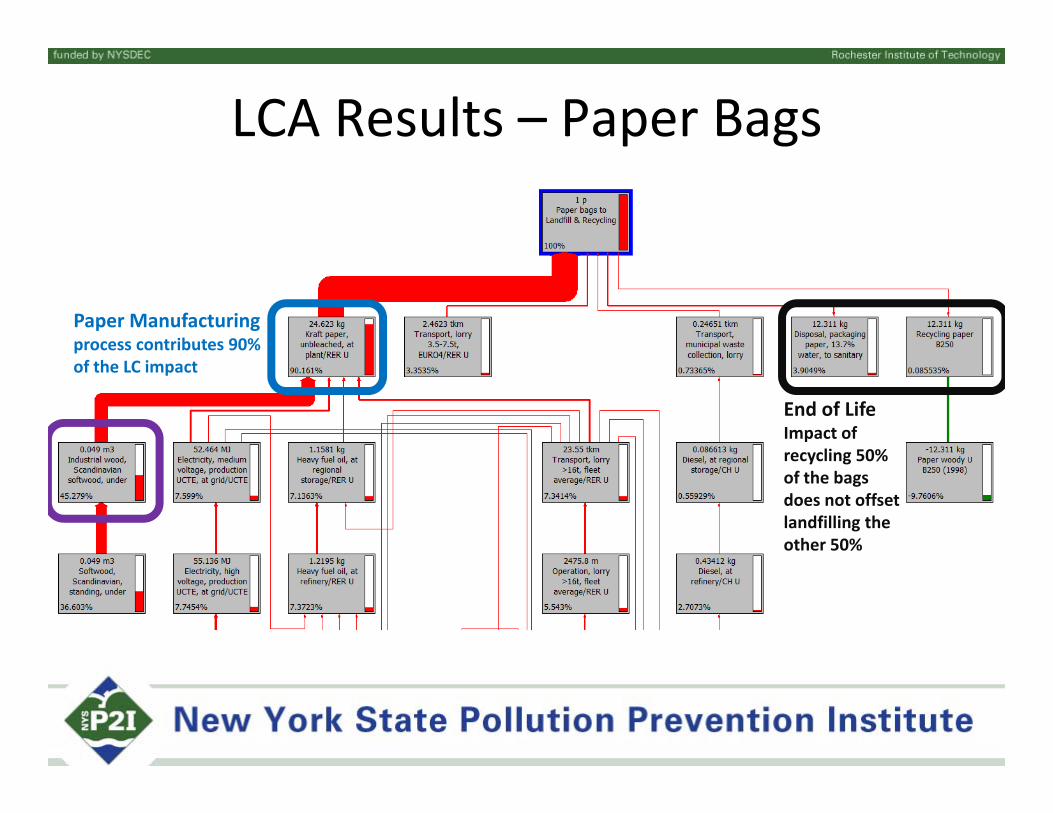
LCA Results – Paper Bags
Paper Manufacturingprocess contributes 90%
End of LifeImpact of recycling 50%
of the LC impact
recycling 50% of the bags does not offset landfilling the other 50%
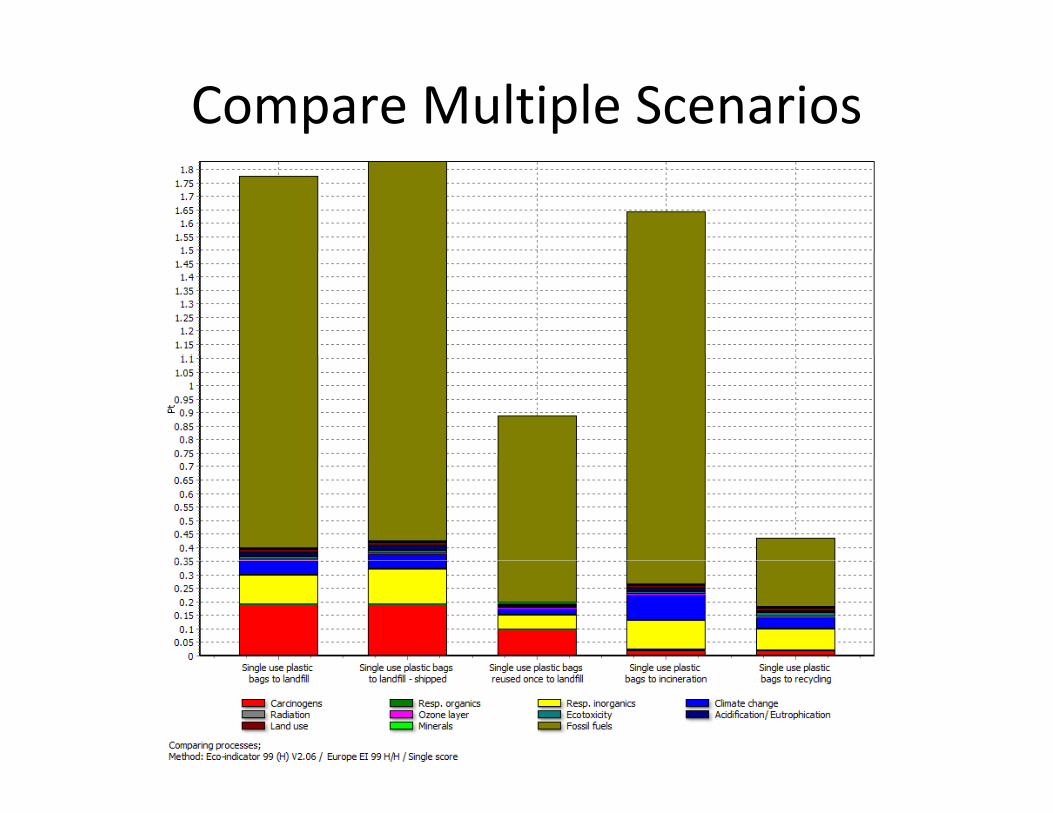
Compare Multiple Scenarios
Company Examples
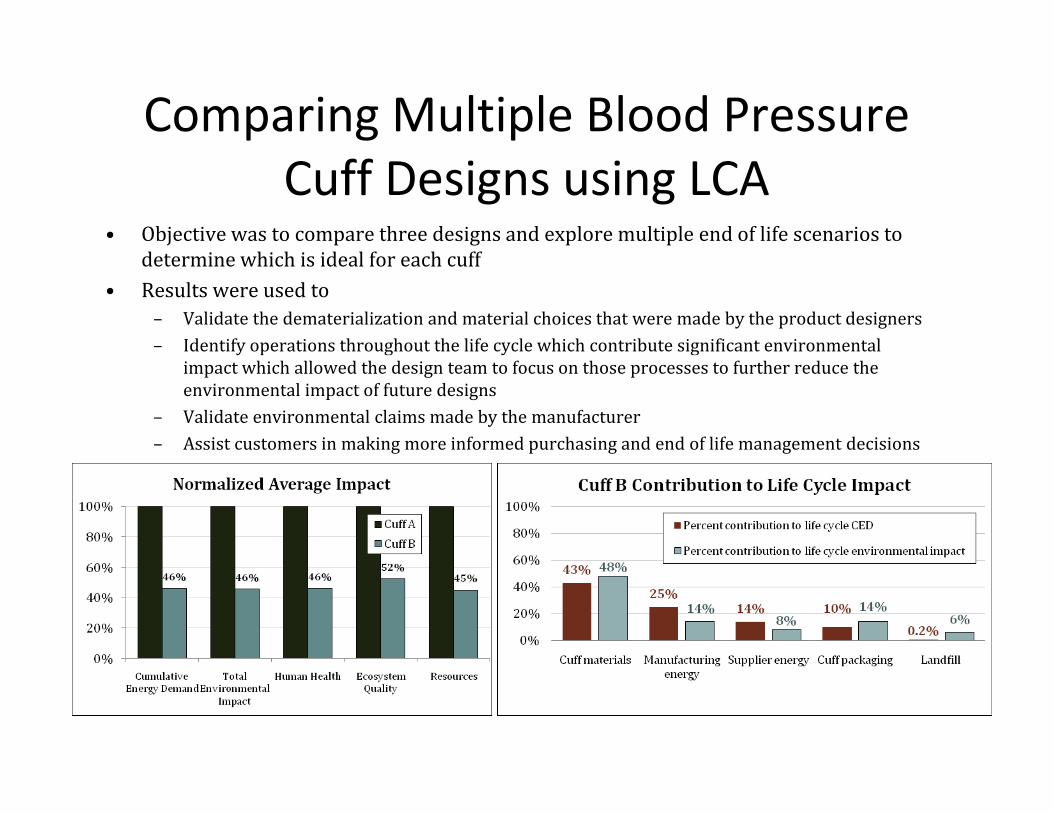
Comparing Multiple Blood Pressure Cuff Designs using LCA
• Objectivewastocomparethreedesignsandexploremultipleendoflifescenariostod i hi h i id l f h ffdeterminewhichisidealforeachcuff
• Resultswereusedto– Validatethedematerializationandmaterialchoicesthatweremadebytheproductdesigners– Identifyoperationsthroughoutthelifecyclewhichcontributesignificantenvironmental
impactwhichallowedthedesignteamtofocusonthoseprocessestofurtherreducetheenvironmentalimpactoffuturedesigns
– Validateenvironmentalclaimsmadebythemanufacturer– Assistcustomersinmakingmoreinformedpurchasingandendoflifemanagementdecisions
Comparing Remanufacturing & Recycling Toner Cartridges using LCA
• Objectivewastodeterminetheoptimalendoflifescenarioj p(recyclingorremanufacturing)andpinpointopportunitiestofurtherimprovetheenvironmentalfootprintofthecartridges
• Resultshighlightprocessesthatcontributesignificantlytoenergyg g p g y gyandenvironmentalimpactwhichthecompanywasunaware– Presentadesignroadmapforproductdesignersandsupplychain
managerswhichpinpointthoseprocesseswhichcontributesignificantlytothetotalenvironmentalimpacttofurtheradvanceenvironmentalperformance
– Thecompanyhasusedtheresultstocommunicatetheenvironmentalf t i t f th i d t t t i d f t t kfootprintoftheirproductstocustomers,inorderforcustomerstomakemoreinformedpurchasingdecisions.
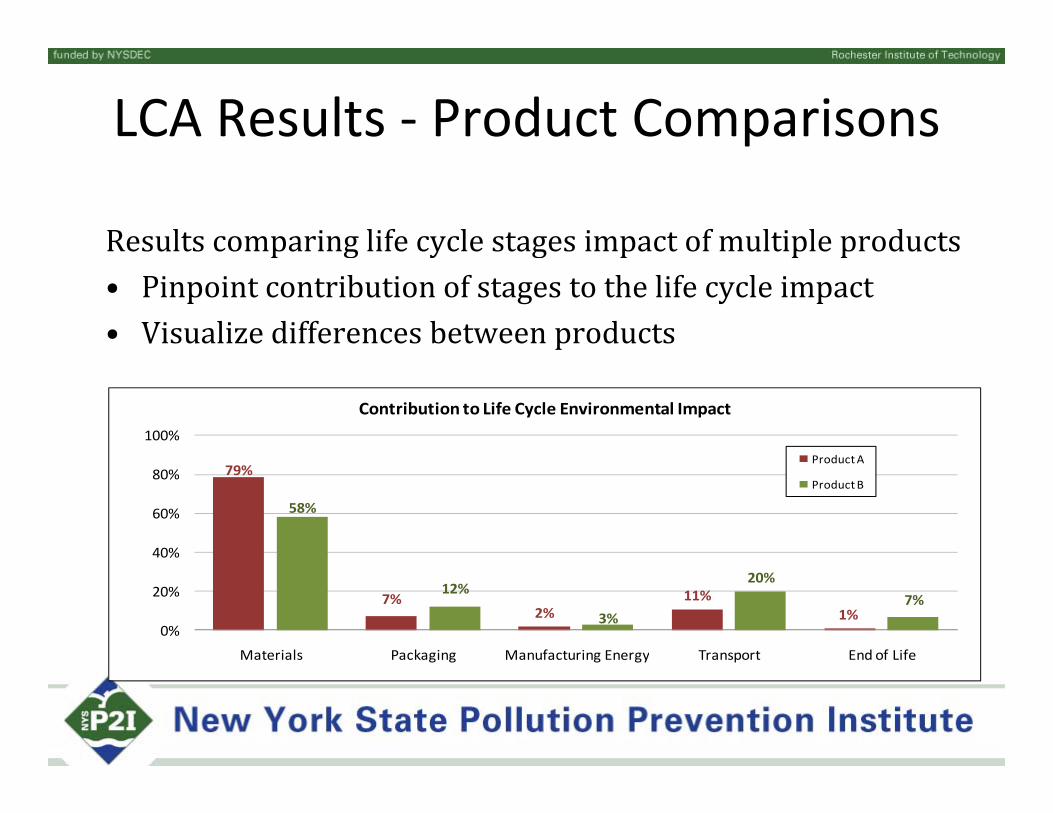
LCA Results ‐ Product Comparisons
Resultscomparinglifecyclestagesimpactofmultipleproductsp g y g p p p• Pinpointcontributionofstagestothelifecycleimpact• Visualizedifferencesbetweenproducts
100%
Contribution to Life Cycle Environmental Impact
ProductA79%
58%
40%
60%
80%Product A
Product B
7%2%
11%1%
12%
3%
20%7%
0%
20%
Materials Packaging Manufacturing Energy Transport End of Life
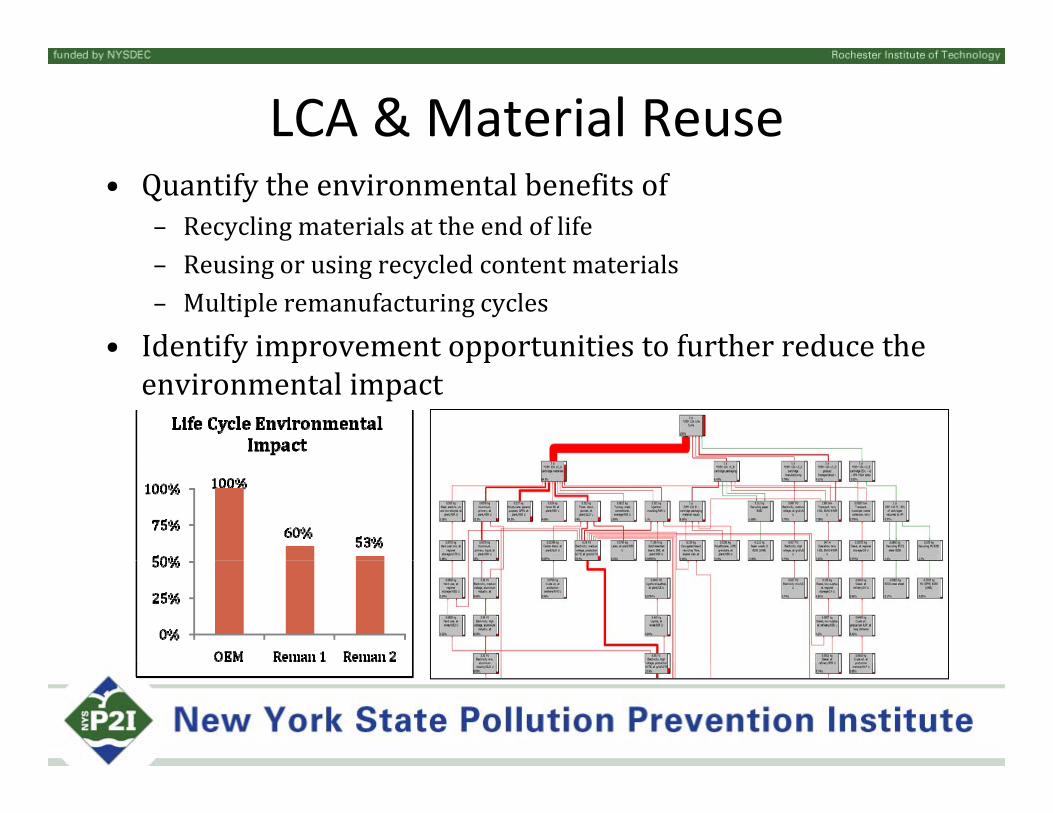
LCA & Material Reuse• Quantifytheenvironmentalbenefitsof
– Recyclingmaterialsattheendoflife– Reusingorusingrecycledcontentmaterials– Multipleremanufacturingcycles
• Identify improvement opportunities to further reduce theIdentifyimprovementopportunitiestofurtherreducetheenvironmentalimpact
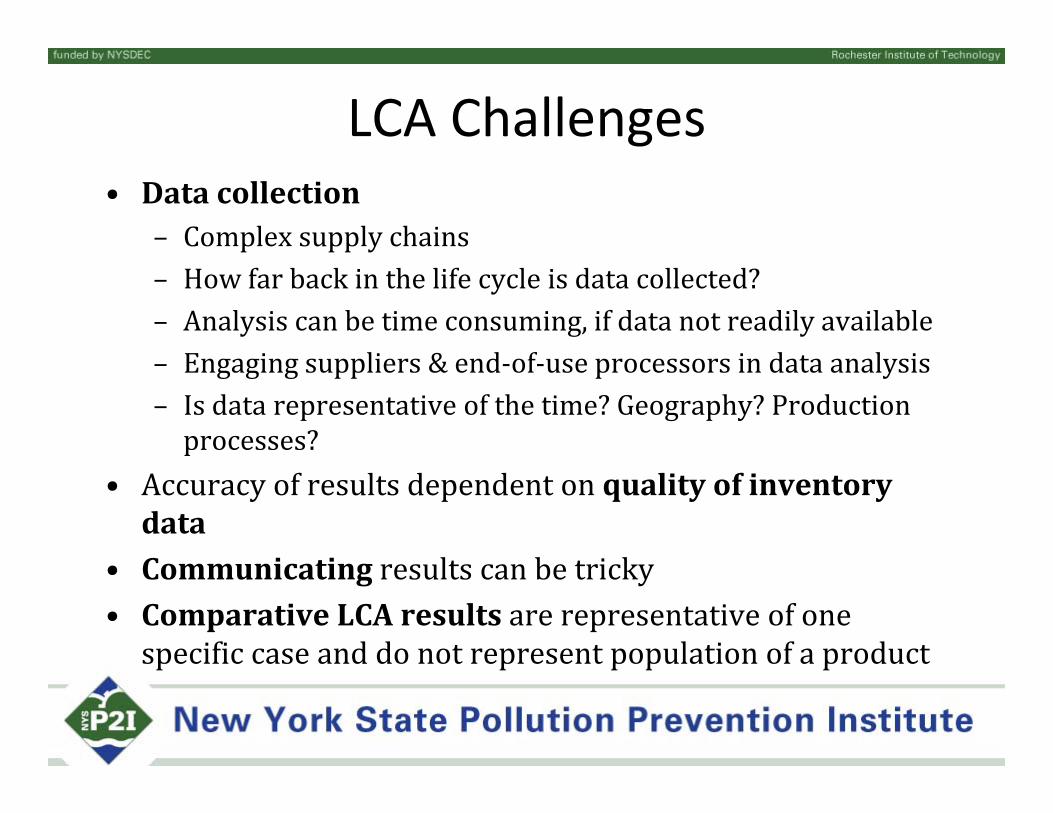
LCA Challenges• Datacollection
– Complexsupplychains– Howfarbackinthelifecycleisdatacollected?– Analysiscanbetimeconsuming,ifdatanotreadilyavailableE i li & d f i d t l i– Engagingsuppliers&end‐of‐useprocessorsindataanalysis
– Isdatarepresentativeofthetime?Geography?Productionprocesses?
• AccuracyofresultsdependentonqualityofinventorydataC i ti l b i k• Communicatingresultscanbetricky
• ComparativeLCAresultsarerepresentativeofonespecific case and do not represent population of a productspecificcaseanddonotrepresentpopulationofaproduct
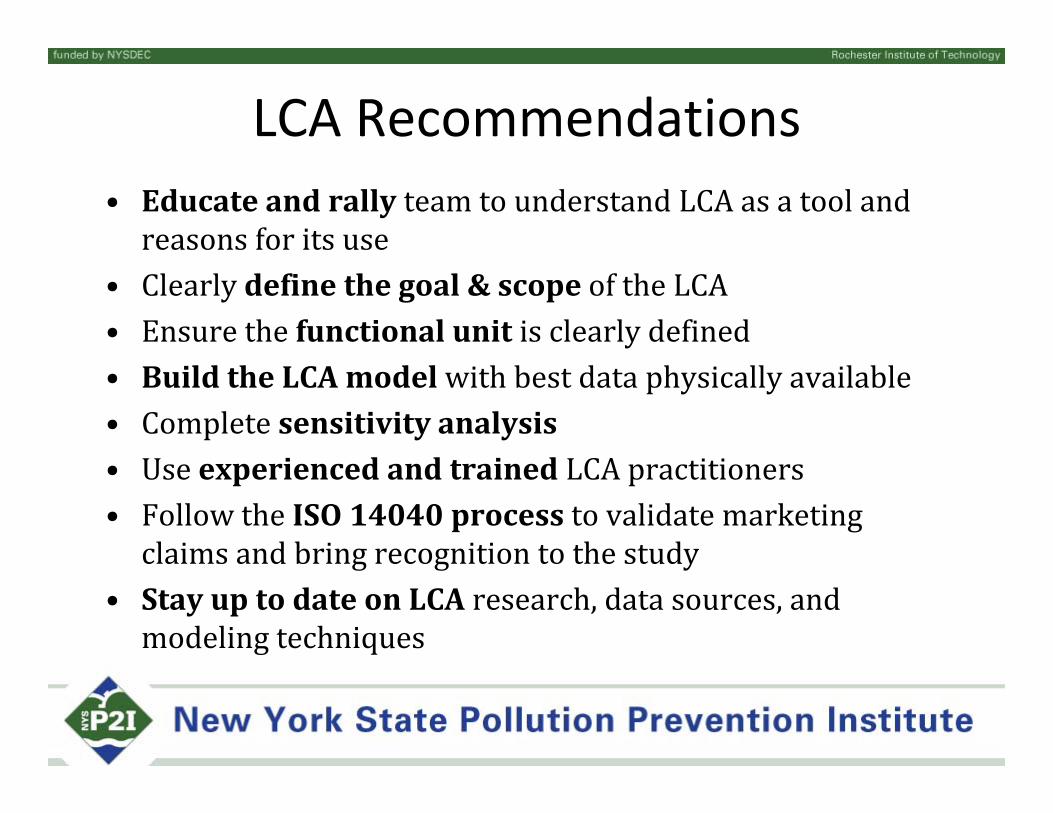
LCA Recommendations• Educate andrallyteamtounderstandLCAasatoolandreasonsforitsuse
• Clearlydefinethegoal&scopeoftheLCA• Ensurethefunctionalunitisclearlydefined• BuildtheLCAmodelwithbestdataphysicallyavailable• Completesensitivityanalysis
i d d i d CA• UseexperiencedandtrainedLCApractitioners• FollowtheISO14040processtovalidatemarketingclaims and bring recognition to the studyclaimsandbringrecognitiontothestudy
• StayuptodateonLCAresearch,datasources,andmodelingtechniques
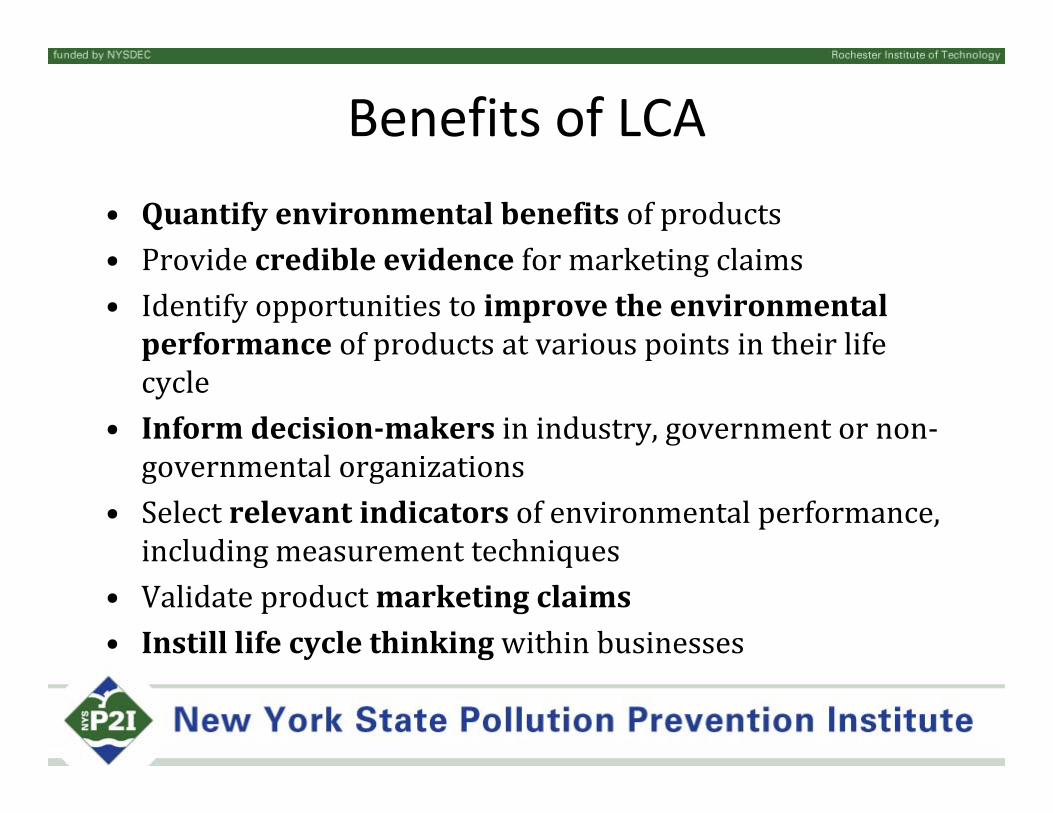
Benefits of LCA• QuantifyenvironmentalbenefitsofproductsP id dibl id f k ti l i• Providecredibleevidenceformarketingclaims
• Identifyopportunitiestoimprovetheenvironmentalperformanceofproductsatvariouspointsintheirlifep p pcycle
• Informdecision‐makersinindustry,governmentornon‐l i igovernmentalorganizations
• Selectrelevantindicatorsofenvironmentalperformance,including measurement techniquesincludingmeasurementtechniques
• Validateproductmarketingclaims• Instilllifecyclethinkingwithinbusinesses
Thankyou
Dr.AnahitaWilliamson585‐475‐4561,[email protected]
KateWinnebeck585‐475‐5390,[email protected]