tonotopic variations of calcium signalling in turtle auditory hair cells
TRANSCRIPT

Hair cells of the turtle cochlea are frequency tuned through
the gating of large-conductance Ca¥-dependent K¤ (BKCa)
channels that are activated by Ca¥ influx through voltage-
dependent L-type Ca¥ channels (Art & Fettiplace, 1987).
The resonant frequency of a hair cell is correlated with its
complement of Ca¥ and BKCa channels, cells tuned to higher
frequencies possessing more channels of both types (Wu et
al. 1995). To achieve local Ca¥ concentrations of sufficient
magnitude to activate the BKCa, the Ca¥ and BKCa channels
are thought to be co-localized in clusters of high channel
density proposed to coincide with the synaptic release sites
(Roberts et al. 1990). The multiple hotspots of Ca¥ entry
observed with confocal microscopy (Issa & Hudspeth, 1994;
Tucker & Fettiplace, 1995; Hall et al. 1997) are consistent
with the clustered arrangement of Ca¥ channels on the
basolateral aspect of hair cells. With such an arrangement,
how are the numbers of Ca¥ channels regulated with
changes in the cell’s resonant frequency? For example, an
increase in resonant frequency might be associated with
either a higher Ca¥ channel density in a cluster or an
enlargement of the membrane area devoted to the clusters.
In support of the latter hypothesis, there is evidence in both
turtle (Sneary, 1988) and chicken (Martinez-Dunst et al.
1997) that the number of hair cell transmitter release sites
and, by implication, Ca¥-channel clusters, increases along
the tonotopic axis of the cochlea.
Both the amplitude and timing of Ca¥ excursions at the
BKCa channel will depend on the microstructure of the
clusters, especially the density of the two channel types.
Local Ca¥ gradients will also be accentuated by the
concentration and kinetics of the mobile intracellular calcium
buffers (Stern, 1992; Roberts, 1994; Naraghi & Neher,
1997). Depending on the overall channel density and the
buffer concentration, each BKCa channel might be influenced
by all Ca¥ channels in the cluster or by only a few nearest
neighbours. To approach this problem we have examined the
effects of exogenous calcium buffers on the activation of the
IBK(Ca) and the hair cell’s tuning properties. Comparison
Journal of Physiology (2000), 524.2, pp.423—436 423
Tonotopic variations of calcium signalling
in turtle auditory hair cells
A. J. Ricci, M. Gray-Keller and R. Fettiplace
Department of Physiology, University of Wisconsin Medical School, Madison,
WI 53706, USA
(Received 12 October 1999; accepted after revision 13 January 2000)
1. Turtle cochlear hair cells are electrically tuned by a voltage-dependent Ca¥ current and a
Ca¥-dependent K¤ current (IBK(Ca)). The effects of intracellular calcium buffering on
electrical tuning were studied in hair cells at apical and basal cochlear locations tuned to 100
and 300 Hz, respectively.
2. Increasing the intracellular BAPTA concentration changed the hair cell’s resonant frequency
little, but optimized tuning at more depolarized membrane potentials due to a positive shift
in the half-activation voltage (V½) of the IBK(Ca).
3. The shift in V½ depended similarly on BAPTA concentration in basal and apical hair cells
despite a 2·4-fold difference in the size of the Ca¥ current at the two positions. The Ca¥
current amplitude increased exponentially with distance along the cochlea.
4. Comparison of V½ values and tuning properties using different BAPTA concentrations with
values measured in perforated-patch recordings gave the endogenous calcium buffer as
equivalent to 0·21 mÒ BAPTA in low-frequency cells, and 0·46 mÒ BAPTA in high-
frequency cells.
5. High conductance Ca¥-activated K¤ (BKCa) channels recorded in inside-out membrane
patches were 2-fold less Ca¥ sensitive in high-frequency than in low-frequency cells.
6. Confocal Ca¥ imaging using the fluorescent indicator Calcium Green-1 revealed about twice
as many hotspots of Ca¥ entry during depolarization in high-frequency compared to low-
frequency hair cells.
7. We suggest that each BKCa channel is gated by Ca¥ entry through a few nearby Ca¥
channels, and that Ca¥ and BKCa channels occupy, at constant channel density, a greater
fraction of the membrane area in high-frequency cells than in low-frequency cells.
0220
Keywords:

with results derived from perforated-patch recordings have
allowed us to estimate the effective concentration of
endogenous calcium buffer (Zhou & Neher, 1993; Roberts,
1993; Tucker & Fettiplace, 1996; Ricci et al. 1998). We have
collected data from hair cells at two cochlear locations,
enabling us to study cells with different magnitudes of Ca¥
current. Our results suggest that each BKCa channel is gated
by Ca¥ entry through a few adjacent Ca¥ channels, and
that an increase in channel numbers is accomplished by
augmentation of clusters at constant channel density.
METHODS
Preparation
The preparation and methods of hair cell recording in the intact
basilar papilla have been described previously (Ricci & Fettiplace,
1997). Turtles (Trachemys scripta elegans, carapace length
75—100 mm) were decapitated and the cochlea dissected out using
procedures approved by the Animal Care Committee at the
University of Wisconsin (protocol number A3368-01). The tectorial
membrane was removed following 20 min incubation in turtle saline,
composition (mÒ): NaCl, 125; KCl, 4; CaClµ, 2·8; MgClµ, 2·2;
sodium pyruvate, 2; glucose, 8; NaHepes, 10 (pH 7·6) containing
up to 50 ìg ml¢ of protease (Sigma type XXIV). The preparation
was transferred to a recording chamber on the stage of a Zeiss
Axioskop FS microscope and viewed through a ² 63 water
immersion objective (NA 0·9) and a Hamamatsu C2400 CCD camera.
The chamber was continuously perfused with turtle saline. For
voltage-clamp measurements at the low-frequency location, 1 mÒ
4-aminopyridine and 0·1 ìÒ apamin (Calbiochem, San Diego, CA,
USA) were added to the saline to block K¤ channels other than the
large-conductance BKCa channel. Other K¤ channels are known to
occur in low frequency hair cells (Goodman & Art, 1996), and their
presence complicates the analysis of the Ca¥ currents and IBK(Ca).
Whole-cell currents were measured with a List EPC_7 amplifier
attached to a borosilicate patch electrode that was advanced from
the abneural edge of the basilar papilla to seal on to the basolateral
membrane of a hair cell (Ricci & Fettiplace, 1997). Recordings
usually came from cells in the middle of the papilla two to three
cells in from the abneural edge. Hair cell location and total length
of the basilar papilla were documented at the end of an experiment.
Most recordings came from cells in two regions, at about 0·3 (the
apical location) or 0·6 (the basal location) of the distance along the
cochlea from the low-frequency end. Measurements are given as
means ± 1 standard error of the mean (s.e.m.). Membrane currents
were stored on a Sony PCM108 recorder at a bandwidth of
0—20 kHz. Experiments were performed at 21—23°C.
Electrical recordings
Whole-cell electrodes were normally filled with a solution
containing (mÒ): KCl, 125; NaµATP, 3; MgClµ, 2; KHepes, 10,
adjusted to pH 7·2 with KOH, with the addition of various
concentrations (0·1—30 mÒ) of the calcium buffers BAPTA, nitro-
BAPTA, (Molecular Probes, Eugene, OR, USA) or EGTA (Fluka,
Ronkonkoma, NY, USA). With 10 or 30 mÒ calcium buffer, the
KCl concentration was reduced to maintain constant osmolarity. To
measure voltage-dependent Ca¥ currents, Cs¤ was substituted for
K¤ as the major monovalent ion (see below). After applying up to
50% series resistance compensation, electrode access resistances
were 3—10 MÙ, giving recording time constants of 30—150 ìs.
Membrane potentials were corrected for the uncompensated series
resistance and junction potential.
The method of perforated-patch recording was identical to that
used previously (Horn & Marty, 1988; Ricci et al. 1998). The
electrode solution contained (mÒ): potassium aspartate, 110; KCl,
15; MgClµ, 2; KÚBAPTA, 0·1 or 1; Hepes, 10; neutralized to pH 7·2
with KOH. For each experiment, 2·4 mg nystatin (Calbiochem, San
Diego, CA, USA) was dissolved in 10 ìl dry dimethyl sulphoxide
and diluted 1:1000 in the stock intracellular solution. The patch
pipette was tip filled with antibiotic-free stock solution, and back-
filled with the nystatin solution to prevent the antibiotic leaking
into the bath during penetration of the papilla and sealing to the
membrane. In general it took at least 15 min from sealing to
achieve a stable low-resistance patch perforation, after which time
the recordings were stable for at least a further 30 min. During this
period there was no evidence of either run down in the currents or
Ca¥ loading. Although the perforated-patch recordings did not
allow wash in of ATP, the Ca¥-ATPase was clearly functional,
since there was never any indication during repeated depolarizations
of the slow component of the IK(Ca) tail current that appeared when
the Ca¥-ATPase was blocked with vanadate (see Results). Series
resistances for the perforated-patch recordings were 7—20 MÙ after
applying up to 40% series resistance compensation. Potentials were
adjusted for a 10 mV junction potential between the potassium
aspartate solution and the external saline.
The amplitude of the Ca¥ current in a given hair cell showed up to
a 2-fold increase during the first 5 min after attaining the whole-
cell configuration. A time-dependent growth of the IK(Ca) was also
observed in both whole-cell and perforated-patch measurements,
which may reflect the augmentation of the Ca¥ current. However,
the variations in IK(Ca) size were not accompanied by any significant
shift in the channel’s activation curve. For example, 6 of the 11 cells
recorded in perforated-patch mode showed a 35% mean increase in
IK(Ca) during the course of the recording, but less than 1 mV mean
shift in the half-activating voltage (V½, see eqn (1)). It was difficult
to study the phenomenon systematically due to the time required
for equilibration of the patch electrode solution with the cytoplasm
in whole-cell recording, and the time to achieve low-resistance
access in perforated-patch mode. However, measurements were not
normally taken until the current amplitude had stabilized, and the
activation curve parameters quoted in the Results are those
obtained when a steady state had been reached.
Macropatch recordings
IK(Ca) were measured in inside-out membrane macropatches excised
from hair cells at known locations (Art et al. 1995). Electrodes
(resistance 0·5—1 MÙ), connected to an Axopatch 200 amplifier,
were filled with a solution (mÒ): KCl, 130; K2EGTA, 5; KHepes,
10; pH 7·4. The intracellular face of the patch was exposed to
solutions (mÒ): KCl, 130; KÚdibromo BAPTA, 2 (Molecular Probes,
Eugene, OR, USA); dithiothreitol, 1; KHepes, 10, pH 7·4, with
different amounts of CaClµ added to yield free Ca¥concentrations
from 0·3—20 ìÒ. Solutions with free Ca¥ greater than 20 ìÒ
contained no dibromoBAPTA. Ca¥ activities in all samples were
measured with a MI-600 Ca¥ electrode (Microelectrodes Inc.,
Londonderry, NH, USA) calibrated in a series of standard Ca¥
buffer solutions (WPI, Sarasota, FL, USA). Leak currents,
measured in a nominally zero-Ca¥ solution containing 10 mÒ
EGTA, were subtracted from all traces. Current responses were
filtered with an eight-pole Bessel filter at 5 kHz prior to digitization
and analysis.
Confocal imaging
The composition of the patch-electrode solution, both for imaging
and for measuring voltage-dependent Ca¥ currents, was (mÒ):
CsCl, 110; NaµATP, 3; MgClµ, 2; NaµGTP, 0·3; creatine
A. J. Ricci, M. Gray-Keller and R. Fettiplace J. Physiol. 524.2424

phosphate, 5; ascorbic acid, 1; EGTA (or BAPTA), 1; Hepes, 10;
adjusted to pH 7·2 with CsOH. Spatial distributions of intracellular
Ca¥ transients were measured with 0·1 mÒ KÚ Calcium Green-1 as
the 3000 Da—dextran conjugate (Molecular Probes, Eugene, OR,
USA) in the patch-electrode solution. Cells were illuminated with
the 488 nm line of an argon laser and fluorescence images, passed
through a 515 nm long pass filter, were collected with an Odyssey
real-time laser scanning confocal microscope (Noran Instruments,
Middleton, WI, USA) attached to the TV port of the Axioskop FS.
Images were stored on an S-VHS videocassette recorder (Sony SVO
9500 MD) or an optical disc recorder (Panasonic TQ 3031F). Images
were later analysed with Metamorph software (Universal Imaging,
Calcium buffers in hair cellsJ. Physiol. 524.2 425
Figure 1. Tonotopic organization of the turtle basilar papilla
Left, surface view of the basilar papilla during an experiment showing the epithelial strip of hair cells on
the right-hand side, apical (lagenar) end at the top and basal (saccular) end at the bottom. Scale bar,
100 ìm. Fractional distance (d) from lagena end shown on left. Most of the measurements of the buffer
effects were taken at values of d of approximately 0·3 or 0·6. Right, examples of electrical resonance
recorded in hair cells at the locations indicated. Each record is the response to 25 presentations of a small
depolarizing current step evoking oscillations in membrane potential at the start and end of the step.
Recordings were obtained with electrodes containing 0·1 or 1 mÒ BAPTA as the calcium buffer. For some
of the cells, the resting potential was about −70 mV, and thus the current step was superimposed on a
standing current to depolarize the cell into the range where tuning was optimal. Resonant frequencies are
given next to traces. Membrane potentials prior to current step: −51 mV (63 Hz), −47 mV (97 Hz),
−47 mV (124 Hz), −39 mV (254 Hz), −44 mV (345 Hz) and −44 mV (400 Hz).

West Chester, PA, USA) on a Pentium computer equipped with a
Matrox LC image board. Other details about the confocal microscope
and method of analysis are given in Tucker & Fettiplace (1995).
RESULTS
Map of the voltage-dependent Ca¥ current along the
tonotopic axis
Recording in the isolated basilar papilla allows the ionic
properties of a hair cell to be measured in cells of known
location. The turtle basilar papilla is tonotopically organized
with a hair cell’s resonant frequency increasing along the
long axis of the papilla. Figure 1 shows examples of the
tuning properties of hair cells, the resonant frequency being
deduced from the period of oscillations at the onset of an
injected current step. The inferred tonotopic map is similar
to that described in the turtle half-head (Crawford &
Fettiplace, 1980). Figure 2 shows that the magnitude of the
voltage-dependent Ca¥ current increased in parallel with
the cell’s resonant frequency. To construct the plot, results
from cells within each 100 ìm length of the papilla were
pooled, giving mean values that show an exponential
increase in current size with fractional distance along the
papilla from the low-frequency end (Fig. 2C). The value of
0·35 for the space constant ë, is similar to the average value
of ë for the frequency map (0·37; Wu & Fettiplace, 1996),
indicating that the hair cell Ca¥ current increases in
proportion to resonant frequency. For subsequent analysis of
IBK(Ca), we compared measurements at two locations with
mean fractional distances along the papilla of 0·29 ± 0·05
(low frequency) and 0·6 ± 0·04 (high frequency). The peak
Ca¥ current was 0·30 nA at the low-frequency location and
0·72 nA at the high-frequency location. The Ca¥ current
activation curve was similar for 1 and 10 mÒ BAPTA intra-
cellular calcium buffer (Fig. 2B).
Effects of calcium buffers on activation of the BKCa
channel
Ca¥ influx via the voltage-dependent Ca¥ channel serves
the dual function in hair cells of gating the BKCa channel
involved in frequency tuning (Art & Fettiplace, 1987;
Roberts et al. 1990), and controlling exocytosis of neuro-
A. J. Ricci, M. Gray-Keller and R. Fettiplace J. Physiol. 524.2426
Figure 2. Variations in peak Ca¥ current with hair cell location
A, voltage-dependent Ca¥ currents in hair cells at a low-frequency position (d, the distance along
papilla, 0·3) and a high-frequency position (d = 0·6). Average currents recorded with Cs¤-filled electrodes
for depolarizations from −80 mV, 1 mÒ intracellular BAPTA. Membrane potentials during steps were (mV):
−55, −50, −45, −42, −40, −31, −21 (low-frequency cell) and −51, −49, −40, −38, −33, −20, −10 (high-
frequency cell). Each current response is the average of 5—25 stimuli. B, examples of steady-state
current—voltage relationships for the Ca¥ current in three other cells with different internal BAPTA
concentration, currents scaled to peak values. Peak currents and cochlear location, d: ±, 1 mÒ BAPTA,
0·44 nA, d = 0·35; þ, 1 mÒ BAPTA, 0·78 nA, d = 0·59; &, 10 mÒ BAPTA, 1·04 nA, d = 0·64. C, plot of
the peak Ca¥ current (ICa) against hair cell distance (d) from the apical end of the papilla. Each point is the
mean ± 1 s.e.m of at least nine measurements in a 100 ìm long region. Smooth curve:
ICa = ICa(0) exp(dÏë), with ICa(0) = 0·13 nA and ë = 0·35, where ë is the space constant.

transmitter (Parsons et al. 1994). The effects of intracellular
calcium buffering on the BKCa channel was assessed from
shifts in the channel’s voltage-activation curve obtained
from tail current measurements. The procedure is
illustrated in Fig. 3A for perforated-patch recordings where
the cells retain their native mobile buffer. The results
demonstrate differences in BKCa channel performance at the
two papillar locations. IBK(Ca) were approximately 2-fold
larger and faster at the high-frequency location (Fig. 3A). At
a holding potential of −60 mV, the maximum tail currents
and time constants of deactivation for perforated-patch
were 0·46 ± 0·04 nA and 1·45 ± 0·06 ms (n = 6) and
0·96 ± 0·08 nA and 0·65 ± 0·03 ms (n = 5) at the low-
frequency and high-frequency locations, respectively. Thus
cells tuned to higher frequencies possess larger and faster
IBK(Ca), which agrees with previous observations on isolated
hair cells (Art & Fettiplace, 1987; Art et al. 1993). Figure 3B
shows plots of the tail current I, against membrane
potential V, which have been fitted with the Boltzmann
equation:
I = ImaxÏ(1 + exp((V½ − V )ÏVS)), (1)
where Imax is the maximum tail current, V½ is the half-
activation voltage and VS is the slope factor. V½ and VS had
mean values of −46 ± 0·8 mV and 1·8 ± 0·2 mV (n = 6; low-
frequency location) and −42 ± 1·0 mV and 2·3 ± 0·5 mV
(n = 5; high-frequency location).
IK(Ca) activation was similarly characterized with exogenous
calcium buffers in whole-cell recording (Fig. 3C). At both
Calcium buffers in hair cellsJ. Physiol. 524.2 427
Figure 3. BKCa channel currents under different calcium buffering conditions
A, families of tail currents obtained with perforated-patch recordings for 25 ms depolarizing voltage steps
of increasing amplitude from a holding potential of −60 mV. The top family was obtained for a high-
frequency location (d = 0·63) and the bottom family from a low-frequency location (d = 0·31). Note that the
tail currents, representing deactivation of the BKCa channel, are larger and faster in the high-frequency
hair cell. Each trace is the average of 5—25 presentations. B, activation curves of the IBK(Ca) current
obtained from plots of the tail current (I), against membrane potential (V), during the voltage step for the
two cells shown in A. The smooth curves are fits to eqn (1) with values of maximum current (Imax), half-
activation voltage (V½) and slope factor (VS) of: high frequency, 1·22 nA, −41 mV, 1·4 mV (þ); low
frequency, 0·58 nA, −46 mV, 2·1 mV (1). C, average IBK(Ca) in three different cells recorded with 0·1, 10
and 30 mÒ intracellular BAPTA. The membrane potential during the voltage step is given above each trace,
holding potential −60 mV. Note that more depolarization is needed to activate the outward current in
higher concentrations of BAPTA. In 30 mÒ BAPTA, the smallest depolarizations elicit only inward Ca¥
current. Each trace is the average of 5—25 presentations.

papillar locations, raising the BAPTA concentration from 1
to 10 mÒ shifted the current activation to more depolarized
potentials (Fig. 4). Values of VS from whole cell
measurements were similar to those obtained in perforated-
patch recordings (Fig. 4D). The V½ values were independent
of the size of the maximum current, but there was an
•4 mV difference between the V½ values at the low- and
high-frequency locations for all BAPTA concentrations. A
possible reason for this disparity is examined later. The
effective concentration of endogenous mobile buffer can be
estimated by comparison with the V½ values obtained in the
perforated-patch recordings. Interpolation from the plots in
Fig. 4C gave the endogenous buffer as equivalent to
0·20 mÒ BAPTA at the low-frequency location and 0·47 mÒ
BAPTA at the high-frequency location. The results suggest
an increase in endogenous buffer concentration towards the
high-frequency end of the cochlea.
The effect of buffer concentration most probably stems from
the mobile buffer restricting the spread of Ca¥ away from
its source, the Ca¥ channel. Thus greater depolarization is
needed to achieve the same concentration of Ca¥ at its
binding site on the BKCa channel. With up to 10 mÒ BAPTA,
A. J. Ricci, M. Gray-Keller and R. Fettiplace J. Physiol. 524.2428
Figure 4. Effects of intracellular calcium buffer on IBK(Ca) activation
A, example of activation curves obtained from tail current measurements as in Fig. 3A, for cells at a high-
frequency location (d = 0·62). Intracellular calcium buffer: 0·1 mÒ BAPTA (1); 1 mÒ BAPTA (9); 10 mÒ
BAPTA (&) and perforated-patch measurements (PP) for endogenous buffer (þ). B, activation curves
obtained from tail current measurements for cells at a low-frequency location (d = 0·32). Symbols as in A.
For each set of points in A and B, the tail current has been normalized to its maximum value and fitted
with a Boltzmann equation (eqn (1)) to obtain half-activation voltage V½, and slope factor VS, for each
condition. C, half-activation voltage V½, plotted against BAPTA concentration. Each point is the
mean ± 1 s.e.m. for the low-frequency location (1) and the high-frequency location (0), the number of
measurements averaged being given beside each point. The construction lines are interpolations to derive
the endogenous buffer from V½ values of −42 mV (high frequency) and −46 mV (low frequency) obtained
with perforated-patch recording (see text). D, slope factor VS, plotted against BAPTA concentration for the
low-frequency location (1) and the high-frequency location (0). Perforated-patch values for VS were
1·8 ± 0·2 mV (low frequency) and 2·3 ± 0·5 mV (high frequency).
it was possible to activate fully the IBK(Ca) by suitable
depolarization. However, when the BAPTA concentration
was raised to 30 mÒ, the IBK(Ca) could not be completely
activated with depolarization, even to the peak of the Ca¥
current at −20 mV, and the smallest depolarizations evoked
only inward Ca¥ current (Fig. 3C). V½ values were
measured for two other calcium buffers, the slow buffer
EGTA and the low-affinity buffer nitroBAPTA. At the high-
frequency location, the mean V½ value was −41 ± 1·0 mV
(n = 11) for 10 mÒ EGTA, and −40 ± 0·7 mV (n = 7) for
1 mÒ nitroBAPTA. These results indicate that nitroBAPTA
has a comparable efficacy to BAPTA but EGTA is about
15_fold less effective. NitroBAPTA, although having a low
Ca¥ affinity (Kd 40 ìÒ), has the same forward rate constant
as BAPTA, whereas EGTA has a similar affinity to BAPTA
(Kd •0·2 ìÒ) but binds Ca¥ at least 100-fold slower
(Naraghi, 1997). Our results agree with those of Roberts
(1993), arguing for the importance of the forward rate
constant rather than the buffer affinity in influencing Ca¥
activation of the hair cell BKCa channel. The results also
imply, based on the analysis of Naraghi & Neher (1997), that
the two channels must be close neighbours.
Ca¥ accumulation near the BKCa channel
Ca¥ entering through the voltage-dependent channels will
be rapidly bound by cytoplasmic buffers and then extruded
on a slower time scale by a Ca¥-ATPase (Tucker &
Fettiplace 1995). During a prolonged depolarization, Ca¥
might be expected to accumulate beneath the membrane, its
concentration growing due to diffusion from neighbouring
channels. The BKCa channel-activation curves in Fig. 4 were
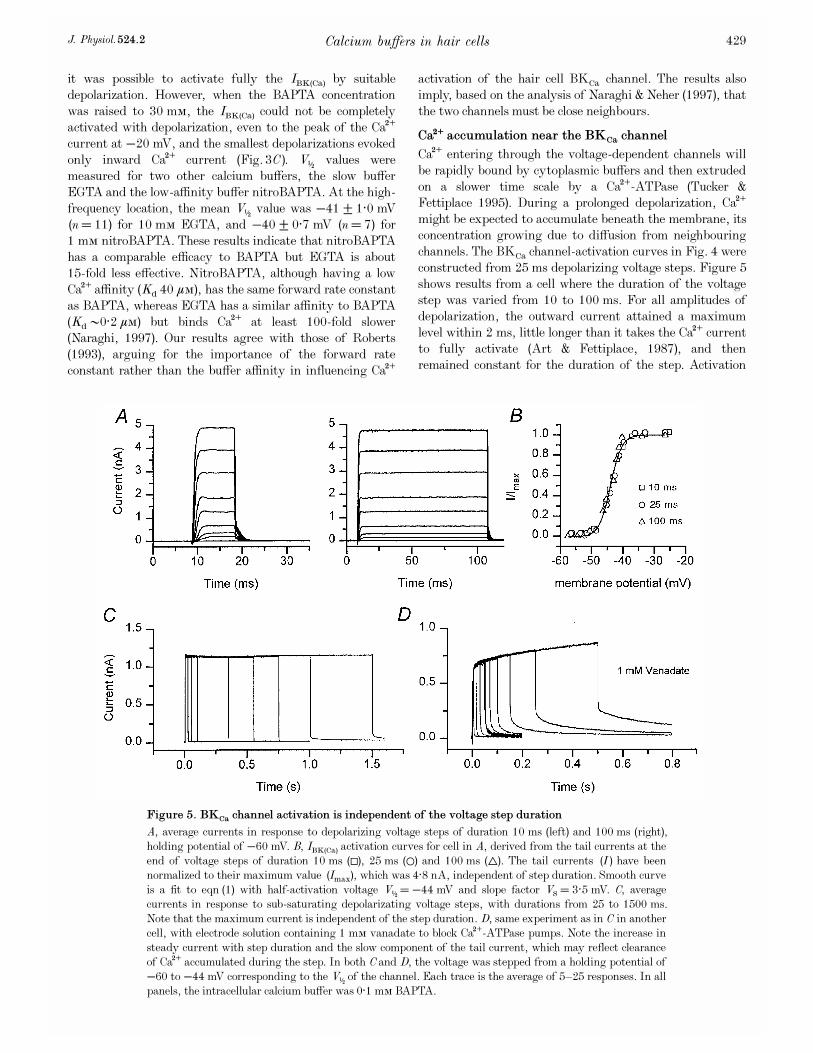
constructed from 25 ms depolarizing voltage steps. Figure 5
shows results from a cell where the duration of the voltage
step was varied from 10 to 100 ms. For all amplitudes of
depolarization, the outward current attained a maximum
level within 2 ms, little longer than it takes the Ca¥ current
to fully activate (Art & Fettiplace, 1987), and then
remained constant for the duration of the step. Activation
Calcium buffers in hair cellsJ. Physiol. 524.2 429
Figure 5. BKCa channel activation is independent of the voltage step duration
A, average currents in response to depolarizing voltage steps of duration 10 ms (left) and 100 ms (right),
holding potential of −60 mV. B, IBK(Ca) activation curves for cell in A, derived from the tail currents at the
end of voltage steps of duration 10 ms (±), 25 ms (1) and 100 ms (9). The tail currents (I) have been
normalized to their maximum value (Imax), which was 4·8 nA, independent of step duration. Smooth curve
is a fit to eqn (1) with half-activation voltage V½ = −44 mV and slope factor VS = 3·5 mV. C, average
currents in response to sub-saturating depolarizating voltage steps, with durations from 25 to 1500 ms.
Note that the maximum current is independent of the step duration. D, same experiment as in C in another
cell, with electrode solution containing 1 mÒ vanadate to block Ca¥-ATPase pumps. Note the increase in
steady current with step duration and the slow component of the tail current, which may reflect clearance
of Ca¥ accumulated during the step. In both C and D, the voltage was stepped from a holding potential of
−60 to −44 mV corresponding to the V½ of the channel. Each trace is the average of 5—25 responses. In all
panels, the intracellular calcium buffer was 0·1 mÒ BAPTA.

curves deduced from tail currents were identical for different
stimulus durations (Fig. 5B). In other experiments (not
illustrated), including a perforated-patch recording, the
amplitude of the IK(Ca) was found to be invariant with
duration of the voltage step between 2 ms and more than
1000 ms. These results suggest that the time course of free
Ca¥ at the BKCa channel resembles that of the Ca¥ current
itself, and implies that each Ca¥ channel influences only
nearby BKCa channels.
Rapid equilibration of Ca¥ in the vicinity of its target the
BKCa channel, must partly depend on fast diffusion away
from the source without local saturation of the calcium
buffer. A constant IBK(Ca) was found for sub-maximal
stimulation even with the lowest buffer concentration,
0·1 mÒ BAPTA. However, when the Ca¥ extrusion
mechanism was blocked by adding 1 mÒ vanadate to the
internal solution, the current acquired a secondary growth
phase and a slow component of the tail current on
A. J. Ricci, M. Gray-Keller and R. Fettiplace J. Physiol. 524.2430
Figure 6. Effects of intracellular calcium buffer on electrical tuning
A, hair cell resonant frequencies plotted against concentration of BAPTA in electrode solution. The
resonant frequency was obtained from the period of the oscillations at the onset of a current step that
produced the sharpest tuning (the largest quality factor). The membrane potential at which tuning was
sharpest is referred to as the ‘best resonant voltage’. Each point is the mean ± 1 s.e.m of measurements at
the low-frequency location (1) and at the high-frequency location (0). The number of values averaged is
given beside each point, the same numbers apply also to the measurements in B and C. B, maximal quality
factors of electrical tuning plotted against concentration of BAPTA in electrode solution, conventions as in
A. Definition of quality factor is given in text. The small changes in Fï and Q with increasing BAPTA
concentration were not statistically significant using a one-way ANOVA test at the 0·01 confidence level.
C, the membrane potential at which the quality factor was maximal (best resonant voltage) plotted against
internal concentration of BAPTA for cells at the low-frequency location (1) and at the high-frequency
location (0). Construction lines are interpolations to derive the endogenous buffer from the ‘best resonant
voltages’ of −40·2 and −46 mV measured with perforated-patch recording at the high- and low-frequency
locations, respectively. D, the half-activation voltage of the BKCa channel (V½) is plotted against ‘best
resonant voltage’ for all buffering conditions. The straight line is the least squares fit, slope 0·7 and
regression coefficient, r = 0·85.

repolarization (Fig. 5D). Both features are symptomatic of
lack of clearance of Ca¥ in the absence of an extrusion
process, implying that the Ca¥-ATPase is vital for
maintaining intracellular gradients away from the channel
cluster to prevent local buffer saturation and accumulation
of Ca¥. Slow components of the tail current were never seen
in control recordings, either whole cell or perforated patch,
suggesting that in those recordings, Ca¥ extrusion via the
Ca¥-ATPase was fully operational.
Effects of the calcium buffer on hair cell tuning
Calcium buffer effects on electrical tuning were studied in
current-clamp conditions, where under-damped voltage
resonance could be evoked by injection of small current
pulses (Fig. 1). Both the frequency of the voltage oscillations
(Fï) and their time constant of decay (ô) depend on
membrane potential, (Crawford & Fettiplace, 1981).
Therefore a hair cell’s resonant frequency was defined as
that frequency at which the quality factor (Q) was maximal.
Q is given by ((ðFïô)Â + 0·25)½
, where ô is the decay time
constant of the oscillations (Crawford & Fettiplace, 1981).
The membrane potential for maximal Q, referred to as the
best resonant voltage, became systematically more
depolarized with higher BAPTA concentrations. The best
resonant voltage correlated with the V½ for the BKCa
channel (Fig. 6D), which reflects the balance between the
inward Ca¥ current and the outward K¤ current needed to
achieve optimal tuning. As with the V½ values, there was an
•5 mV difference between the best resonant voltages in the
low- and high-frequency cells.
With perforated-patch recordings, the best resonant
voltages for the low-frequency and high-frequency locations
were −45·8 ± 1·0 mV (Fï = 97 ± 27 Hz; n = 5) and
−40·2 ± 2·3 mV (Fï = 265 ± 14 Hz; n = 6). Using values
for the best resonant voltage at the two locations, it was also
possible to obtain a second estimate of the endogenous
calcium buffer (Fig. 6C). Expressed as an equivalent BAPTA
concentration, the mobile buffer was 0·22 mÒ in the low-
frequency cells and 0·45 mÒ in the high-frequency cells. The
concentrations are similar to those deduced from half-
activation voltages for the IBK(Ca), supporting the notion of a
cochlear gradient of endogenous calcium buffer. Owing to the
correlation between the best resonant voltage and the V½ for
the BKCa channel (Fig. 6D), the two methods for estimating
endogenous buffer concentration are not independent.
Tuning was assessed during a period of several minutes in
current clamp when the cell was depolarized to membrane
potentials between −50 and −40 mV. Usually, in the
absence of mechanotransduction, it was necessary to impose
a holding current to bias the cell into the range where it was
optimally tuned (Art & Fettiplace, 1987). On return to
voltage clamp we observed a consistent increase in membrane
capacitance that may reflect exocytosis of synaptic vesicles
(Parsons et al. 1994). The cells initially had an average
capacitance of approximately 12 pF, and responded to the
period in current clamp with an increase of 2—3 pF. For those
cells showing a capacitance increase, the magnitude of the
change varied with cochlear location and was 1·9 ± 0·2 pF
in 12 low-frequency cells and 2·9 ± 0·3 in 10 high-frequency
cells. The likelihood of observing the capacitance increasing
also depended on the nature of the exogenous calcium buffer.
The fraction of cells showing an increase was 0·75 (0·1
BAPTA; nT = 8), 0·56 (1·0 mÒ BAPTA; nT = 18), 0·17
(10 mÒ BAPTA; nT = 12) and 0·70 (10 mÒ EGTA;
nT = 13) where nT is the total number of cells in each group.
Thus the capacitance change displayed a similar dependence
on calcium buffer concentration to BKCa channel activation.
BAPTA at 10 mÒ was needed to attenuate it significantly,
but 10 mÒ EGTA had little effect. In 11 perforated-patch
recordings, no increase in capacitance was observed
(−0·2 ± 0·09 pF), which may be due to concurrent
re_uptake of exocytosed membrane, a property lost in whole
cell recordings from hair cells (Parsons et al. 1994). Our
results lack the temporal resolution to distinguish between
different pools of exocytosed vesicles which may possess
different dependencies on calcium buffer concentration.
Nevertheless, they suggest a component of the transmitter-
release apparatus experiences a Ca¥ signal comparable to
that activating the BKCa channel.
Ca¥ sensitivity of the BKCa channel
Figure 4 demonstrated that the IBK(Ca) activates at more
depolarized potentials in high-frequency hair cells compared
to low-frequency cells. One factor that might contribute to
this disparity is a difference in the Ca¥ sensitivity of the
BKCa channel. To test for this possibility, IK(Ca) were
recorded in inside-out membrane macro patches from hair
cells at two locations with fractional distances along the
papilla of 0·34 ± 0·03 (low frequency) and 0·60 ± 0·01 (high
frequency). Data were obtained on seven hair cells at each
location with maximal patch currents of 0·12—0·68 nA (low
frequency) and 0·2—1·4 nA (high frequency) at −50 mV.
These currents correspond approximately to 10—100 BKCa
channel per patch. Each patch was exteriorized from the
hair cell epithelium so that its intracellular face could be
exposed to a range of Ca¥ concentrations between 1 and
1000 ìÒ, and IBK(Ca) were evoked with depolarizing voltage
steps from −50 to +50 mV. Figure 7 illustrates the major
differences observed in BKCa channels at the two positions.
These were most conspicuous at −50 mV, where the high-
frequency channels were less Ca¥ sensitive and deactivated
more rapidly. For each patch, the current at −50 mV,
normalized to its maximum value, was plotted against Ca¥
concentration (Fig. 7C). Fits to the Hill equation gave a half-
saturating Ca¥ concentration (Ca½) of 5·8 ± 0·6 ìÒ (low-
frequency position) and 10·3 ± 0·6 ìÒ (high-frequency
position) with mean Hill coefficients of 2·9 and 1·9 at the low-
and high-frequency positions, respectively. The deactivation
of the currents at −50 mV in 2·5 ìÒ Ca¥ could be fitted
with a single exponential decay with a time constant of
2·4 ± 0·4 ms in low-frequency and 0·74 ± 0·05 ms in high-
frequency cells.
Calcium buffers in hair cellsJ. Physiol. 524.2 431

Further evidence supporting location-dependent variations
in Ca¥ sensitivity of the BKCa channel was obtained from
voltage-activation curves in a fixed Ca¥ concentration. For
one patch at each position, it was possible to obtain a
complete activation curve in 5 ìÒ Ca¥ (Fig. 7D), from
which a half-activation voltage of −68 mV was inferred for
the low-frequency patch and −26 mV for the high-
frequency patch. Owing to the combined Ca¥ and voltage
dependence of the channels, the need for greater
depolarization to activate the high-frequency channels is
consistent with them being less Ca¥ sensitive. The reported
Ca¥ sensitivities and deactivation time constants are both
within the range of values previously reported for single
BKCa channels in turtle isolated hair cells (Art et al. 1995).
However, in the earlier measurements it was not possible to
demonstrate a correlation between the two parameters. Such
a correlation would fit with the notion that hair cells at
different locations express distinct variants of the BKCa
channels (Jones et al. 1999). Indeed, the alternatively spliced
variants cloned from turtle hair cells possess the property
that those with faster kinetics are less Ca¥ sensitive, which
accords with the present results on the native channels.
Hotspots of Ca¥ influx
In isolated turtle hair cells, Ca¥ influx via voltage-gated
channels occurs over small regions or ‘hotspots’ confined to
the basal half of the cell (Tucker & Fettiplace, 1995). The
ability to record from hair cells at specific papillar locations
allowed us to examine whether the structure of the hotspots
varied with location to reflect the difference in maximum
Ca¥ current. Regions of Ca¥ elevation were defined using
the fluorescent dye Calcium Green-1. Following attachment
of the whole-cell electrode, the cell was drawn onto its side
in order to optimize spatial resolution in the confocal images.
Figure 8A—C shows single images of a high-frequency hair
cell captured before and during a 200 ms depolarization to
A. J. Ricci, M. Gray-Keller and R. Fettiplace J. Physiol. 524.2432
Figure 7. BKCa channel properties in inside out patches
A, average currents recorded in an inside-out membrane patch detached from a low-frequency hair cell
(d = 0·3) for voltage steps from −50 to +50 mV in the presence of Ca¥ concentrations from 2·2 to 470 ìÒ.
Dashed line denotes zero current level. B, currents recorded in an inside-out patch from a high-frequency
hair cell (d = 0·6) for voltage steps from −50 to +50 mV in Ca¥ concentrations from 2·2 to 1000 ìÒ. Each
trace in A and B is the average of between 100 and 250 responses. C, IBK(Ca) (I) scaled to its maximum value
(Imax) is plotted against Ca¥ concentration in low-frequency (0) and high-frequency (1) hair cells. Each
point is the mean ± 1 s.e.m of measurement on seven inside-out patches; for most of the points the s.e.m. is
less than the symbol size. Smooth curves are fits to the Hill equation, IÏImax = 1Ï(1 + (Ca½ÏCa)nH
), with
Ca½ and Hill coefficient (nH), respectively, of 5·8 ìÒ and 2·9 (0) and 10·3 ìÒ and 1·9 (1). D, BKCa channel
activation curves for channels in a low-frequency hair cell (d = 0·33; 0) and a high-frequency hair cell
(d = 0·61; 1), derived from tail-current measurements (I) from a holding potential of −80 mV. Smooth
curves are fits to eqn (1) with values of V½ and VS, respectively, of −68 and 27 mV (low frequency) and −26
and 24 mV (high frequency).

−20 mV designed to maximally activate the Ca¥ current.
The increase in intracellular Ca¥ was distributed over a ring
around the nucleus, but there was evidence of punctate
regions or ‘hotspots’ of fluorescence.
The lack of temporal resolution imposed by the frame rate
hinders an accurate determination of the number of
hotspots. To approach this problem, the time course of the
fluorescence changes was characterized by constructing
around the hotspots contours to correspond to a fixed Ca¥
level (Tucker & Fettiplace, 1995, 1996). Contours were
initially drawn starting with the areas of bright fluorescence
evident in the first image, and the fluorescence change
mapped over several seconds. For example, at least seven
regions are discernable in Fig. 8B, and their associated time
courses are given in Fig. 8D. Two pieces of evidence were
used to support the enumeration of hotspots. Firstly, all
hotspots should demonstrate a similar time course. If the
contour was not appropriately centred, or if it covered two
spots, the fluorescence change would rise more slowly or
with a delay. Secondly the size of the maximal fluorescence
change should be comparable for all spots. In some cells,
where the contours were initially incorrectly contrived, the
magnitude of the peak fluorescence exhibited ‘quantization’,
so that some spots had two or three times larger peaks than
the average, suggesting that they encompassed multiple
sites of Ca¥ entry. Applying these procedures showed that
each high frequency hair cell possessed between five and
eight hotspots. As previously reported, the maximum
number of spots was visible in a central section through the
cell, and few extra spots appeared de novo on focusing
Calcium buffers in hair cellsJ. Physiol. 524.2 433
Figure 8. Hotspots of Ca¥ influx in a high-frequency hair cell
Confocal images of a hair cell filled with Calcium Green_1 before (A) and during (B and C) a 200 ms
depolarizing current step to −20 mV. Times at which the images were captured are shown as arrows above
the Ca¥ current (inset). Pseudocolour scale on left corresponds to pixel intensities from 0 to 255. D, time
course of the fluorescence changes in seven regions in response to the depolarization. Different traces
correspond to the regions of the same colour shown in the schematic hair cell on the left. Orange region may
contain multiple hotspots, but was judged to be a single spot on the criteria given in the text.

through the cell, even though such focusing sometimes
improved the sharpness of a given spot.
Measurements on cells at the two papilla locations
demonstrated that the mean number of Ca¥ hotspots in
high-frequency hair cells was 1·8 times that in low-
frequency cells (Fig. 9B). As an alternative method of
comparing cells, the total area occupied by the hotspots was
calculated from the sum of the areas encompassed by the
contours. These areas were normalized to the total cross-
sectional area of the cell, which was similar for the two
positions (154 ± 16 ìm in four low-frequency cells and
151 ± 14 ìm in six high-frequency cells). This method of
analysis avoided the difficulty in hotspot counting of
distinguishing between closely spaced spots, but confirmed
that twice the cell area was occupied by hotspots in high-
frequency compared to low-frequency cells (Fig. 9C). The
fluorescence hotspots require Ca¥ entry through voltage-
dependent channels (Tucker & Fettiplace, 1995). The
imaging results therefore suggest that Ca¥ channels are
distributed over twice the membrane area in high-frequency
cells compared to low-frequency cells. Since cells at the
high-frequency location possess 2·4 times the number of
Ca¥ channels, these results are consistent with Ca¥ channels
being present at a constant density irrespective of location.
DISCUSSION
The endogenous buffer
By recording in the intact papilla, we have been able to
compare the properties of hair cells at two specific locations
tuned to approximately 100 and 300 Hz. We have provided
evidence about Ca¥ entry, buffering and action at one
target, the large-conductance Ca¥-activated K¤ channel
BKCa, in the soma of auditory hair cells. All aspects of this
pathway were found to vary with the cochlear location of
the hair cell, and hence the frequency to which it was tuned.
The concentration of mobile endogenous calcium buffer in
the hair cell soma was estimated as 0·21 mÒ BAPTA at the
low-frequency location, and 0·46 mÒ BAPTA at the high
frequency location (means of the values in Fig. 4 and 6).
These values are in good agreement with estimates of buffer
in the hair bundle of 0·1 mÒ BAPTA at the same low-
frequency position and 0·4 mÒ BAPTA at the high-
frequency location (Ricci et al. 1998). Taken together the
results suggest that the calcium buffer has a uniform
concentration throughout the cell, and that this
concentration increases along the cochlea’s tonotopic axis.
The variation in buffer concentration is consistent with the
gradient in the expression of calbindin-28k, a likely
candidate for the endogenous buffer (Navaratnam et al.
A. J. Ricci, M. Gray-Keller and R. Fettiplace J. Physiol. 524.2434
Figure 9. Comparison of Ca¥ hotspots in high-frequency and low-frequency hair cells
A, examples of hotspots of Ca¥ elevation in a high-frequency hair cell (left) and a low-frequency hair cell
(right). Each image was acquired at the end of a 200 ms depolarization to −20 mV, and has had the
background prior to the stimulus subtracted. B, numbers (left) and relative areas (right) of hotspots in low-
frequency and high-frequency cells. Bars represent the mean ± 1 s.e.m of measurements on four low-
frequency and six high-frequency cells. For each cell, contours were drawn around every hotspot visible at
the end of a 200 ms depolarization to −20 mV. The criteria for constructing the contours are described in
the text, the same criteria being applied to cells at both locations. The number of spots was counted and the
total area enclosed by the contours was summed and normalized to the cell’s total area in the image. The
total area was 154 ± 16 ìm in the low-frequency cells and 151 ± 14 ìm in the high-frequency cells. Note
that there are 1·8 times as many hotspots in high-frequency cells and the hotspots occupy approximately
twice the area as low-frequency cells.

1995), found in the chick cochlea. A larger value of 0·9 mÒ
BAPTA for the endogenous buffer was previously measured
in isolated turtle hair cells using the small conductance
Ca¥-activated K¤ (SK) channel as the Ca¥ sensor (Tucker &
Fettiplace, 1996). The cochlear origin of those cells was
unknown, but their properties, including size of Ca¥
current, suggest they were tuned to high frequencies.
Roberts (1993) estimated the native calcium buffer in
isolated frog saccular hair cells to be in excess of 1 mÒ
BAPTA, though he also did not distinguish the epithelial
location or frequency specificity of the cells.
Ca¥ and BKCa channel interactions
Both the insensitivity of the BKCa channel activation to
BAPTA (Fig. 4) and the lack of accumulation of Ca¥ near
the BKCa channel (Fig. 5) argue for the BKCa channels being
in close proximity to the Ca¥ channels. At least 10 mÒ
BAPTA was required to alter significantly the activation
range of the BKCa channel. Since the voltage-activation
curve for the channel was independent of pulse duration,
the BAPTA effect must approximate the steady-state
condition. Naraghi & Neher (1997) have estimated that, for a
steady-state Ca¥ gradient, 2 mÒ BAPTA would have a
space constant of 28 nm, indicative of its buffering range
near a Ca¥ source. For 10 mÒ BAPTA, the space constant
would be roughly halved. Thus it is likely that each Ca¥
channel influences only its immediate neighbouring BKCa
channels. Since the Ca¥ and BKCa channels maintain a
constant stoichiometry in cells tuned across the spectrum,
(Art et al. 1993), it is conceivable that the two channel types
are assembled into a single complex in the membrane. The
proximity of the Ca¥ channel to its target ensures that the
rate of BKCa channel activation is limited solely by intrinsic
channel kinetics and not by Ca¥ diffusion.
There was a difference of 4 mV between the half-activation
voltage (V½) for the BKCa channels at the low- and high
frequency locations and at least part of this difference may
be due to the lower Ca¥ sensitivity of BKCa channels at the
high-frequency location (Fig. 7). Assuming that the Ca¥
current activation increases e-fold in 6·7 mV (Art &
Fettiplace, 1987), the fraction of the total Ca¥ current
required to half-activate the BKCa channels in high-
frequency cells is 1·8 (= exp(4Ï6·7)) that in low-frequency
cells. This is close to the ratio of the Ca¥ sensitivities of the
BKCa channels in detached patches, which was
1·78 (= 10·3Ï5·8). After correction for the 4 mV difference,
the V½ values at the two locations (Fig. 4C) possess an
identical dependence on BAPTA concentration. Such a result
would be expected if each BKCa channel is influenced by the
same number of Ca¥ channels in cells at both cochlear
locations.
Structure of the Ca¥ microdomains
Hair cells tuned to the higher frequency had approximately
twice the number of Ca¥ channels and also twice the
number of Ca¥ entry zones or ‘hotspots’. The number of
hotspots is less than the number of sites of transmitter
release in turtle hair cells (at least 17; Sneary, 1988). It is
possible that the number of ‘hotspots’ was underestimated
due to the limited temporal resolution of the imaging
experiments causing neighbouring Ca¥ microdomains to
fuse. However, the area of the hotspots also differed by the
same 2-fold ratio between the two locations. This suggests
that the Ca¥ channels that cluster to form the hotspots are
present at a constant density in both high-frequency and
low-frequency cells. An increase in the number of channels
per cell is then accomplished by addition of clusters at
constant channel density.
If the Ca¥ and BKCa channels are aggregated at synaptic
release sites (Roberts et al. 1990; Issa & Hudspeth, 1994),
changes in intracellular Ca¥ by influx through Ca¥
channels will regulate exocytosis as well as BKCa channel
activation. Similar elevations in Ca¥ may be required to
control the two processes, both of which must be fast and
continuously graded from the resting potential near
−50 mV, to −20 mV. The need for multiple clusters of Ca¥
channels is most likely linked to their role in exocytosis. The
maximum size of each cluster may then be constrained by
the area of membrane adjacent to the synaptic body,
allowing the release site to be rapidly replenished with
vesicles. The synaptic body in frog hair cells has a mean
diameter of about 0·5 ìm (Lenzi et al. 1999). An increase in
the hair cell’s complement of Ca¥ channels may therefore
serve a dual role in signalling. In conjunction with changes
in the BKCa channels, it will augment the electrical resonant
frequency. The increased number of release sites may also
enhance the temporal fidelity of synaptic transmission by
allowing the release sites to be used asynchronously, one site
being refilled while another discharges.
Art, J. J. & Fettiplace, R. (1987). Variation of membrane propertiesin hair cells isolated from the turtle cochlea. Journal of Physiology
385, 207—242.
Art, J. J., Fettiplace, R. & Wu, Y.-C. (1993). The effects of lowcalcium on the voltage-dependent conductances involved in tuningof turtle hair cells. Journal of Physiology 470, 109—123.
Art, J. J., Wu, Y.-C. & Fettiplace, R. (1995). The calcium-activatedpotassium channels of turtle hair cells. Journal of General
Physiology 105, 49—72.
Crawford, A. C. & Fettiplace, R. (1980). The frequency selectivityof auditory nerve fibres and hair cells in the cochlea of the turtle.Journal of Physiology 306, 79—125.
Crawford, A. C. & Fettiplace, R. (1981). An electrical tuningmechanism in turtle cochlear hair cells. Journal of Physiology 312,377—412.
Goodman, M. B. & Art, J. J. (1996). Variations in the ensemble ofpotassium currents underlying resonance in turtle hair cells. Journalof Physiology 497, 395—412.
Hall, J. D., Betarbet, S. & Jaramillo, F. (1997). Endogenousbuffers limit spread of free calcium in hair cells. Biophysical Journal73, 1243—1252.
Calcium buffers in hair cellsJ. Physiol. 524.2 435

Horn, R. & Marty, A. (1988). Muscarinic activation of ionic currentsmeasured with a new whole-cell recording method. Journal of
General Physiology 92, 145—159.
Issa, N. & Hudspeth, A. J. (1994). Clustering of Ca¥ channels andCa¥ -activated K¤ channels at fluorescently-labeled presynapticactive zones of hair cells. Proceedings of the National Academy of
Sciences of the USA 91, 7578—7582.
Jones, E. M. C., Gray-Keller, M. & Fettiplace, R. (1999). Therole of Ca¥-activated K¤ channel splice variants in the tonotopicorganization of the turtle cochlea. Journal of Physiology 518,653—665.
Lenzi, D., Runyeon, J. W., Crum, J., Ellisman, M. H. & Roberts,
W. M. (1999). Synaptic vesicle populations in saccular hair cellsreconstructed by electron tomography. Journal of Neuroscience 19,119—132.
Martinez-Dunst, C., Michaels, R. L. & Fuchs, P. A. (1997).Release sites and calcium channels in hair cells of the chick’s cochlea.Journal of Neuroscience 17, 9133—9144.
Naraghi, M. (1997). T-jump study of calcium binding kinetics ofcalcium chelators. Cell Calcium 22, 255—268.
Naraghi, M. & Neher, E. (1997). Linearized buffered Ca¥ diffusionin microdomains and its implications for calculations of [Ca¥] at themouth of a calcium channel. Journal of Neuroscience 17,6961—6973.
Navaratnam, D. S., Escobar, L., Covarrubias, M. & Oberholtzer,
J. C. (1995). Permeation properties and differential expression acrossthe auditory receptor epithelium of an inward rectifier Ca¥ channelcloned from the chick inner ear. Journal of Biological Chemistry
270, 19238—19245.
Parsons, T. D., Lenzi, D., Almers, W. & Roberts, W. M. (1994).Calcium-triggered exocytosis and endocytosis in an isolatedpresynaptic cell: capacitance measurements in saccular hair cells.Neuron 13, 875—883.
Ricci, A. J. & Fettiplace, R. (1997). The effects of calcium bufferingand cyclic AMP on mechano-electrical transduction in turtleauditory hair cells. Journal of Physiology 501, 111—124.
Ricci, A. J., Wu, Y.-C. & Fettiplace, R. (1998). The endogenousCa¥ buffer and the time course of transducer adaptation in auditoryhair cells. Journal of Neuroscience 18, 8261—8277.
Roberts, W. M. (1993). Spatial calcium buffering in saccular haircells. Nature 363, 74—76.
Roberts, W. M. (1994). Localization of calcium signals by a mobilecalcium buffer in frog saccular hair cells. Journal of Neuroscience
14, 3246—3262.
Roberts, W. M., Jacobs, R. A. & Hudspeth, A. J. (1990).Colocalization of ion channels involved in frequency selectivity andsynaptic transmission at presynaptic active zones of hair cells.Journal of Neuroscience 10, 3664—3684.
Sneary, M. (1988). Auditory receptor of the red-eared turtle: II.Afferent and efferent synapses and innervation patterns. Journal ofComparative Neurology 276, 588—606.
Stern, M. D. (1992). Buffering of calcium in the vicinity of a channelpore. Cell Calcium 13, 183—192.
Tucker, T. & Fettiplace, R. (1995). Confocal imaging of calciummicrodomains and calcium extrusion in turtle hair cells. Neuron 15,1323—1335.
Tucker, T. & Fettiplace, R. (1996). Monitoring calcium in turtlehair cells with a calcium-activated potassium channel. Journal of
Physiology 494, 613—626.
Wu, Y.-C., Art, J. J., Goodman, M. B. & Fettiplace, R. (1995). Akinetic description of the calcium-activated potassium channel andits application to electrical tuning of hair cells. Progress in
Biophysics and Molecular Biology 63, 131—158.
Wu, Y.-C. & Fettiplace, R. (1996). A developmental model forgenerating frequency maps in the reptilian and avian cochleas.Biophysical Journal 70, 2557—2570.
Zhou, Z. & Neher, E. (1993). Mobile and immobile calcium buffers inbovine adrenal chromaffin cells. Journal of Physiology 469,245—273.
Acknowledgements
The work was supported by NIH grants RO1 DC01362 to R.F. and
RO1-DC03896 to A.J.R. and a Deafness Research Foundation
grant to A.J.R.
Corresponding author
R. Fettiplace: 185 Medical Sciences Building, 1300 University
Avenue, Madison, WI 53706, USA.
Email: [email protected]
Author’s present address
A. J. Ricci: Neuroscience Center for Excellence, Louisiana State
University Medical Center, 2020 Gravier Street, New Orleans, LA
70112, USA.
A. J. Ricci, M. Gray-Keller and R. Fettiplace J. Physiol. 524.2436