tonga tonga millennium development goals report acknowledgements the government of tonga gratefully...
TRANSCRIPT
i
Tonga
Status and Progress between 1990-2010Ministry of Finance and National Planning
September 2010
2nd National Millennium Development Goals Report

T O N G A M i l l e n n i u m D e v e l o p m e n t G o a l s R e p o r tii
Photos courtesy of: Government of Tonga and Ms. Marloucha Louina
T O N G A M i l l e n n i u m D e v e l o p m e n t G o a l s R e p o r t i
PrefaceThe Government of Tonga is proud to present its second National Millennium Development Goal Report, following its first report published in 2005. This report details the status of progress under the MDG framework as revised in 2008 by the United Nations. The document was prepared through a broad consultative and participatory process which included the Government of Tonga, civil society organizations, the private sector, donors and partners, and United Nations agencies.
This final version was produced by the Ministry of Finance and the Prime Minister’s Office. Special thanks are extended to UNDP for its technical and financial assistance in support of the MDG report in Tonga. The valuable leadership of Tonga’s MDG Taskforce and Technical Committee is also appreciated. This second report comes at a particularly critical time for Tonga, as the country has felt the repercussions of the global economic and financial crisis, climate change concerns, and natural disasters such as the 2009 Tsunami which hit Niuatoputapu resulting in loss of life and physical damage.
Year 2010 is an important year for Tonga’s socio-economic development with the introduction of the historical constitutional and electoral reforms which will see elections under a new system of governance. The Executive will continue on the implementation of the 2009/10 – 2011/12 National Strategic Planning Framework, the Government Ministries Corporate Plans and the Ha’apai Master Plan. The comprehensive review of MDG progress will help renew and revitalize efforts to achieve the goals in Tonga and contribute to the development of national strategies and plans to promote a model of socio-economic development that is both equitable and sustainable.
While there is no extreme poverty in Tonga, we will continue efforts on combating basic needs poverty and to provide employment, in particular for youth. Tonga has achieved great success under MDG2 in providing universal access to primary education, and we are looking to address other challenges in secondary and vocational education. We have achieved gender parity in education and women have full right to participate in parliament through parliamentary election. Tonga is doing well in the health-related MDGs, namely in child and maternal health, but our urgent priority is the reduction in prevalence and impact of non-communicable diseases. Tonga is very committed to a sustainable environment, in particular through our new Ministry of Environment and Climate Change. MDG8 calls for a global partnership, and I take this opportunity to commend the Tonga Energy Road Map team who has created a world first in developing a sector strategy that is signed and committed to by over twenty donor partners.
This report represents a crucial opportunity to review and renew the Tonga Governments commitment to human development in general and the MDGs in particular. It is hoped that this report will contribute to inform policy dialogue in Tonga, and pave the way for the changes that are required to meet the MDGs by 2015.
’Otenifi Afu’alo MatotoMinister for Finance and National Planning
T O N G A M i l l e n n i u m D e v e l o p m e n t G o a l s R e p o r tii
AcknowledgementsThe government of Tonga gratefully acknowledges the financial and technical support provided by the United Nations Development Program for the completion of Tonga’s second MDG status report.
The National MDG Taskforce particularly acknowledges the commitment of its Chairman, Mr. Va’inga Tone, Secretary of Foreign Affairs, who steered the MDG reporting process with proven leadership and dedication. The Honorable Dr. Viliami Tau Tangi, Acting Prime Minister and Minister of Health, is also acknowledged for his commitment to the MDGs, in particular through his support for the National MDG Workshop. Thanks are also extended to Tonga’s National MDG Taskforce and Technical Committee represented by the following organizations:
Ministry of Foreign Affairs (Chair); Ministry of Finance and National Planning (Secretary); Statistics Department; Ministry of Agriculture, Forestry and Food; Ministry of Education; Office of Women Affairs; Ministry of Environment and Climate Change; Ministry of Health; and Langafonua ‘a Fafine Tonga.
The MDG report wouldn’t have been possible without the valuable work of many contributors who are gratefully recognized and appreciated: Dr. Siale ‘Akauola, Dr. MalakaiAke, Mr. ‘Ata’ata Finau, Dr Viliami Fukofuka, Ms Lucy Moala Mafi, Ms Polotu Fakafanua Paunga’, Mr. Sione Hufanga, Ms. Siale Ilolahia, Ms ‘Aloma Johnasen, Mrs. Fuiva Kavaliku, Ms ‘Aina Kavaliku, Mr. Sione Lolohea, Dr. Viliami Manu, Mrs Lupe Matoto, Mr. Emanuele Mo’ale, Mrs. Kalolaine Moeaki, Mr. Asipeli Palaki, Mrs. Natalia Palu, Ms Keasi Pongi, and Ms Tupe Samani.
Special thanks are extended to the MDG Secretariat as well as implementing partner. Ms. Lesieli Tufui Faletau, Deputy Secretary/Ministry of Finance and National Planning, gracefully provided the necessary guidance and continued support for this important work. The MDG Project Manager, Mr. ‘Onetoto ‘Anisi was instrumental in keeping the work on track, organizing the National MDG workshop, and provided excellent liaison with all the stakeholders involved in the research, preparation, and writing of this report. Mrs. ‘Ana Lotuma Falefehi Ika also provided great help throughout the reporting process.
A diverse range of stakeholders were involved in the production of this report, including from civil society, private sector, donors, foreign aid programs, and United Nations agencies. This represents a strong collaborative effort which is duly acknowledged here. Many took the time to participate, read, comment, and help strengthen the report. Institutionally, these groups include: Civil Society Forum of Tonga, TANGO, Tonga Trust, Ma’a Fafine Tonga, Tonga Red Cross, Tonga National Youth Congress, Tonga Health Project, Tonga Family Health Association, the Tonga Chamber of Commerce, AusAid, NZAid, the Embassy of Japan, TA-to-NAC EU office, the European Union mission, the Peace Corps, WHO, UNFPA, ESCAP, ADB/World Bank, UNICEF, UNIFEM, and UNDP.
Last, but not least, all Tongans are acknowledged for their role in making Tonga a better place to live and bring up their children. This report is for the Tongan people and it is hoped that all who have participated have given back by producing a report that shows Tonga’s successes and the goals ahead for the nation.
Malo’aupito
T O N G A M i l l e n n i u m D e v e l o p m e n t G o a l s R e p o r t iii
Table of ContentPreface i
Acknowledgements ii
AnOverview v
MDGBackground v
ReportPreparation:Stakeholders,Consultations,ResearchandWriting v
MeasuringStatusandProgress:MethodologyandData v
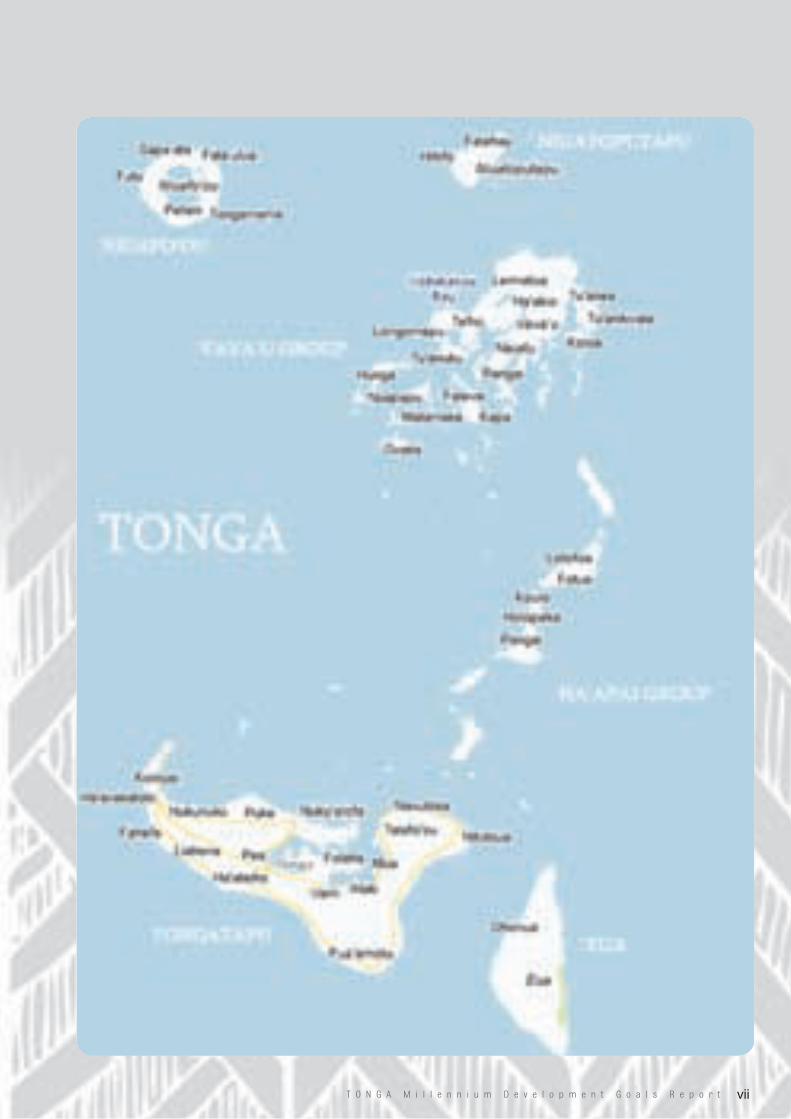
Map vii
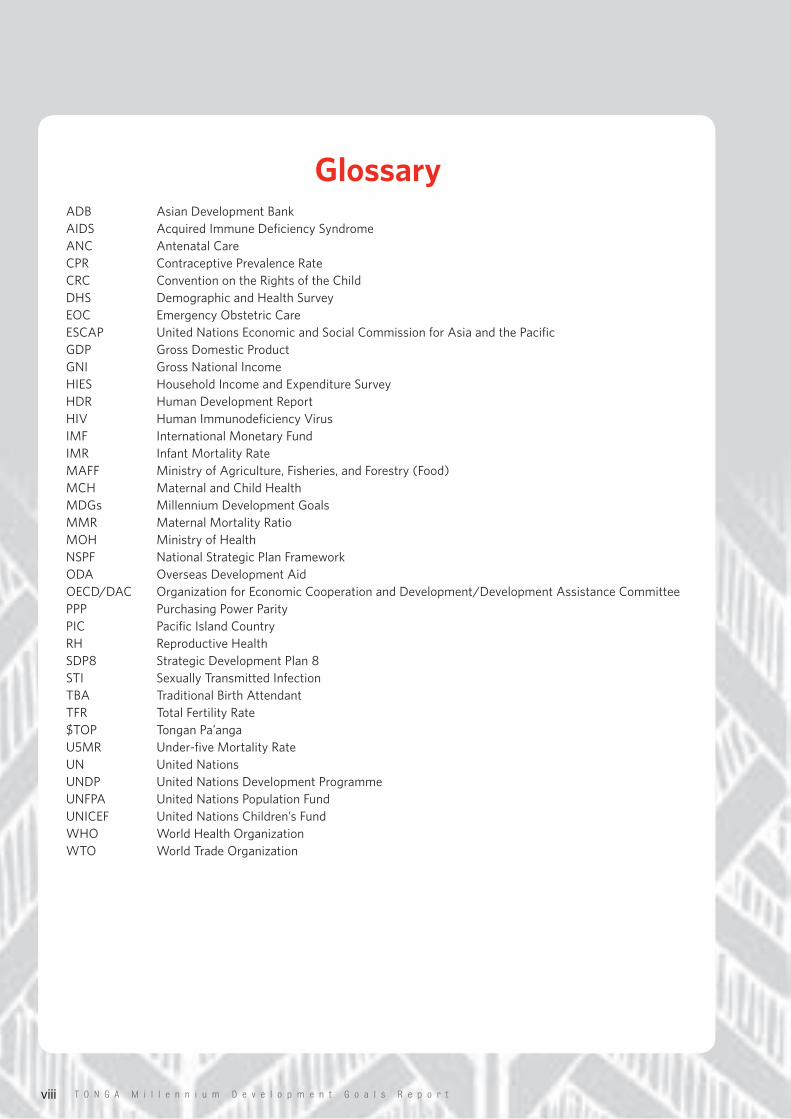
Glossary viii
TheMDGs:TargetsandIndicatorsforTonga ix
MDG xi
StateofProgressScale xi
StateofNationalSupportScale xi
AchievabilityScale xi
Tonga’sContext xii
GOAL1.ERADICATEEXTREMEPOVERTYANDHUNGER 1
GOAL2.PRIMARYEDUCATIONACHIEVEUNIVERSAL 19
GOAL3.PROMOTEGENDEREQUALITYANDEMPOWERWOMEN 25
GOAL4.REDUCECHILDMORTALITY 35
GOAL5.IMPROVEMATERNALHEALTH 41
GOAL6.COMBATHIV/AIDS,TB,ANDNON-COMMUNICABLEDISEASES 49
GOAL7.ENSUREENVIRONMENTALSUSTAINABILITY 61
GOAL8.DEVELOPAGLOBALPARTNERSHIPFORDEVELOPMENT 67
GOODGOVERNANCE 76
NEWCHALLENGES 80
TheGlobalEconomicCrisis 80
ClimateChangeandImpact 81
Appendix 83
REFERENCES 84
ListofTables
Table1IncidenceofAbsolutePoverty2001and2009 3
Table2BasicNeedsPovertyLines2001and2009 4
Table3DistributionofExpenditures2001and2009 5
Table4ProportionofOwnProductioninFoodConsumptionin2001and2009 18
Table5EducationShareofGovernmentSpending,2004-2010 23
Table6DonorSpendinginTotalEducationSpending2004-2010 24
Table7FemaleParticipationinFirms 28
Table8DeliveriesbyAttendantandPlaceofBirth,2008 43
T O N G A M i l l e n n i u m D e v e l o p m e n t G o a l s R e p o r tiv
Table9ContraceptivePrevalenceRatebyIslandGroup 45
Table10CausesofComplaintsDuringPregnancy 46
Table11ProportionofMotorVehiclesper1,000Population,TotalPopulation,
andLandAreasinSelectedPacificIslandCountries 55
Table12FunctionalClassificationofNCDServices,2005/06 57
Table13NationalNCDStrategyTargetsbyYear2015 59
Table14ProjectedImpactsofClimateChangeandNaturalDisastersonCriticalSectorsinTonga 82
Table15MDGMonitoringandEvaluationCapacity 83
ListofFigures
Figure1ProportionofPopulationbelowBNPL,2001and2009 4
Figure2PovertyGapIndex,2001and2009 5
Figure3TouristsArrivalsandReceipts,2000–2009 7
Figure4TouristReceipts&Remittances-2000/01-2009/2010 9
Figure5EmployedWorkers;Paid&SubsistenceWorkersbyGender&GeographicLocation 12
Figure6EmployedWorkersbyIndustry,2006 13
Figure7UnemploymentbyDefinition,Sex,andRural/UrbanResidence,2006 14
Figure8Populationaged15andOlderbySex,Urban-RuralResidence 15
Figure9EmployedWorkersbyOccupation,2006 27
Figure10TNCWC/WCCCTotalClients2005-April2010 31
Figure11GlobalCausesofChildDeaths 38
Figure12STIsbyAgeGroupattheTFHAClinic 51
Figure13MajorSurgeryperCategory 54
Figure14Populationaged6andOlderthatSmokesonaDailyBasis,Tonga,2006 56
Figure15UsesofHealthFunds,2005/06 57
Figure16UseofDonorFunds(%)2003/04and2005/2006 58
Figure17TotalGovernmentDebtinPercentofGDP 72
Figure18TotalDebtasinPercentofGDP 72
Figure19CostofPeakMobilePhoneCalls:SelectedCountries,inUScentsperminute 75
Figure20GoodGovernanceIndicators 76
Figure21Remittances&ofGDP,2001-2008 80
Figure22Remittances,CountryofOrigin 80
T O N G A M i l l e n n i u m D e v e l o p m e n t G o a l s R e p o r t v
An OverviewMDGBackground
In 2000, 189 nations committed themselves to achieving substantial progress in basic areas of human development through the realization of eight overarching Millennium Development Goals (MDGs). This engagement would form the backbone of poverty alleviation, and pave the way for a better future for people all over the world.
The eight goals are time-bound, quantitative targets that aim for results by year 2015. The MDGs include: eradicating extreme poverty and hunger, achieving universal primary education, promoting gender equality and empowering women, reducing child mortality, improving maternal health, combating HIV/AIDS, malaria and other diseases, ensuring environmental sustainability, and developing a global partnership for development.
The Kingdom of Tonga is a signatory to the 2000 Millennium Declaration, the fundamental charter that unites nations on the MDGs. Tonga produced its first MDG status report in 2005, in order to provide, public information and the impetus for social mobilization necessary for the attainment of the MDGs.
ReportPreparation:Stakeholders,Consultations,ResearchandWriting
This second status report reviews progress, according to the updated guidelines on MDG reporting formulated in the 2009 Addendum on MDG reporting. To the extent possible, a trend analysis was carried out to highlight status and progress on the MDGs. The report intends to offer an analytical perspective of Tonga’s progress to date; including an analysis of what is working and what isn’t, taking into account new challenges such as the global economic and financial crises.
This effort was spearheaded by the national MDG Taskforce and the MDG Technical Committee, with support of national and international consultants. The MDG Taskforce provided the necessary leadership to catalyze action and direction of the work presented. The Technical Committee was responsible for data collection among official sources, and in particular among line ministries.
A national workshop gathering relevant stakeholders (including government representatives, civil society organizations, the private sector, and donors) was held on August 4th 2010 in Nuku’alofa to present the preliminary findings of the report. The report was circulated beforehand to the MDG Taskforce to provide the necessary time for comments. Following the workshop, another round of consultations took place (including with United Nations agencies) to ensure broad participation.
The national consultant will provide follow-up to the report for a period of at least two years to ensure that awareness of the MDGs among various stakeholders and the public at large remains in place beyond the reporting exercise. A fundamental aspect of the MDGs process is that it’s neither bottom-up nor top-down, but a constant participation from all in the betterment of the lives of all Tongans. Hence, advocacy, alliance building, and renewed political commitments will be crucial to keep the momentum going.
MeasuringStatusandProgress:MethodologyandData
The evaluation was established against the MDG framework updated in 2008, which includes a new target under MDG 1 on decent work for all, a new target under MDG5 to analyze status and progress in achieving universal access to reproductive health, and new targets under Goal 7 for a sustainable environment and biodiversity management.
Measuring progress requires quality and up-to-date data. The main quantitative instruments used in this report are the population censuses of 1986, 1996, and 2006, as well as Household Income and Expenditure Survey (HIES)for 2001, and the preliminary results for the 2009 HIES, with additional data from line Ministries. To date, Tonga has never undertaken a Demographic and Health Survey (DHS) which would provide in-depth data to assess true progress in many areas of human development and provide population-based data. UNFPA is providing assistance to start work on the first DHS in the near future.
T O N G A M i l l e n n i u m D e v e l o p m e n t G o a l s R e p o r tvi
Disaggregated data were sought, but not always obtained, which highlights the need for Tonga to better integrate the MDGs in its national statistics. It is worth noting that a current initiative, the SPC/Paris21 project is supporting Tonga to strengthen the national statistical system. It is hoped that the project will improve the availability and quality of data by strengthening the coordination between the production and use of statistics.
The definition of rural/urban can also be problematic in a small country such as Tonga, with the main criterion used for the distinction being population size, i.e. urban areas are considered to have a population of at least 5,000 (per Statistics Department).
Causation was ascribed with caution, as patterns and movements in the data can’t always be attributed to underlying events, but sometimes to changes in definitions or methods. Tonga, as many other countries, faces some challenges with data such as discrepancy in the same numbers from different statistical sources, and differences between national and standardized international data. However, efforts were made to seek data nationally.
From a policy perspective, data limitations, clearly illustrate how the lack of disaggregated data undermine the formulation of evidence-based policies that reach the poor more effectively. However, data are seen as a platform for evidence-based policies and reaching the most vulnerable communities, easing hardship, and improving the lives of all Tongans.
T O N G A M i l l e n n i u m D e v e l o p m e n t G o a l s R e p o r t vii
T O N G A M i l l e n n i u m D e v e l o p m e n t G o a l s R e p o r tviii
GlossaryADB AsianDevelopmentBankAIDS AcquiredImmuneDeficiencySyndromeANC AntenatalCareCPR ContraceptivePrevalenceRateCRC ConventionontheRightsoftheChildDHS DemographicandHealthSurveyEOC EmergencyObstetricCareESCAP UnitedNationsEconomicandSocialCommissionforAsiaandthePacificGDP GrossDomesticProductGNI GrossNationalIncomeHIES HouseholdIncomeandExpenditureSurveyHDR HumanDevelopmentReportHIV HumanImmunodeficiencyVirusIMF InternationalMonetaryFundIMR InfantMortalityRateMAFF MinistryofAgriculture,Fisheries,andForestry(Food)MCH MaternalandChildHealthMDGs MillenniumDevelopmentGoalsMMR MaternalMortalityRatioMOH MinistryofHealthNSPF NationalStrategicPlanFrameworkODA OverseasDevelopmentAidOECD/DAC OrganizationforEconomicCooperationandDevelopment/DevelopmentAssistanceCommitteePPP PurchasingPowerParityPIC PacificIslandCountryRH ReproductiveHealthSDP8 StrategicDevelopmentPlan8STI SexuallyTransmittedInfectionTBA TraditionalBirthAttendantTFR TotalFertilityRate$TOP TonganPa’angaU5MR Under-fiveMortalityRateUN UnitedNationsUNDP UnitedNationsDevelopmentProgrammeUNFPA UnitedNationsPopulationFundUNICEF UnitedNationsChildren’sFundWHO WorldHealthOrganizationWTO WorldTradeOrganization
T O N G A M i l l e n n i u m D e v e l o p m e n t G o a l s R e p o r t ix
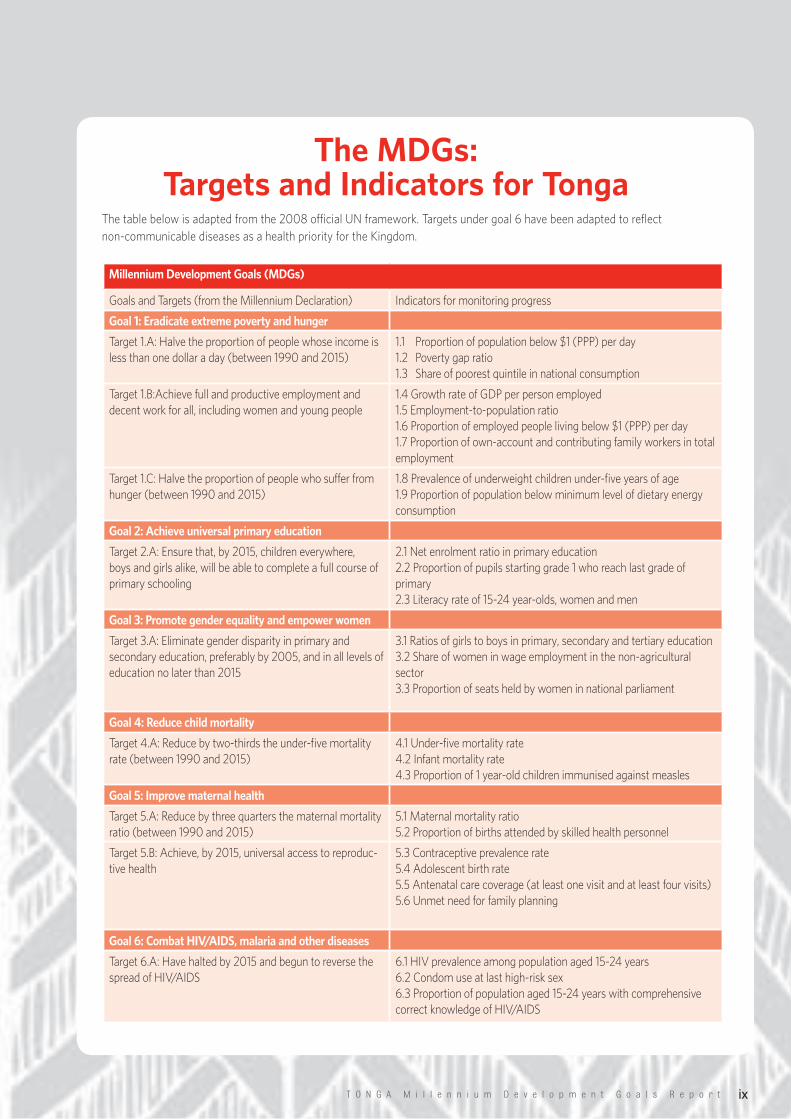
The MDGs: Targets and Indicators for Tonga
The table below is adapted from the 2008 official UN framework. Targets under goal 6 have been adapted to reflect non-communicable diseases as a health priority for the Kingdom.
Millennium Development Goals (MDGs)
Goals and Targets (from the Millennium Declaration) Indicators for monitoring progress
Goal 1: Eradicate extreme poverty and hunger
Target 1.A: Halve the proportion of people whose income is less than one dollar a day (between 1990 and 2015)
1.1 Proportion of population below $1 (PPP) per day1.2 Poverty gap ratio1.3 Share of poorest quintile in national consumption
Target 1.B:Achieve full and productive employment and decent work for all, including women and young people
1.4 Growth rate of GDP per person employed1.5 Employment-to-population ratio1.6 Proportion of employed people living below $1 (PPP) per day1.7 Proportion of own-account and contributing family workers in total employment
Target 1.C: Halve the proportion of people who suffer from hunger (between 1990 and 2015)
1.8 Prevalence of underweight children under-five years of age1.9 Proportion of population below minimum level of dietary energy consumption
Goal 2: Achieve universal primary education
Target 2.A: Ensure that, by 2015, children everywhere, boys and girls alike, will be able to complete a full course of primary schooling
2.1 Net enrolment ratio in primary education2.2 Proportion of pupils starting grade 1 who reach last grade of primary2.3 Literacy rate of 15-24 year-olds, women and men
Goal 3: Promote gender equality and empower women
Target 3.A: Eliminate gender disparity in primary and secondary education, preferably by 2005, and in all levels of education no later than 2015
3.1 Ratios of girls to boys in primary, secondary and tertiary education3.2 Share of women in wage employment in the non-agricultural sector3.3 Proportion of seats held by women in national parliament
Goal 4: Reduce child mortality
Target 4.A: Reduce by two-thirds the under-five mortality rate (between 1990 and 2015)
4.1 Under-five mortality rate4.2 Infant mortality rate4.3 Proportion of 1 year-old children immunised against measles
Goal 5: Improve maternal health
Target 5.A: Reduce by three quarters the maternal mortality ratio (between 1990 and 2015)
5.1 Maternal mortality ratio5.2 Proportion of births attended by skilled health personnel
Target 5.B: Achieve, by 2015, universal access to reproduc-tive health
5.3 Contraceptive prevalence rate5.4 Adolescent birth rate5.5 Antenatal care coverage (at least one visit and at least four visits)5.6 Unmet need for family planning
Goal 6: Combat HIV/AIDS, malaria and other diseases
Target 6.A: Have halted by 2015 and begun to reverse the spread of HIV/AIDS
6.1 HIV prevalence among population aged 15-24 years6.2 Condom use at last high-risk sex6.3 Proportion of population aged 15-24 years with comprehensive correct knowledge of HIV/AIDS
T O N G A M i l l e n n i u m D e v e l o p m e n t G o a l s R e p o r tx
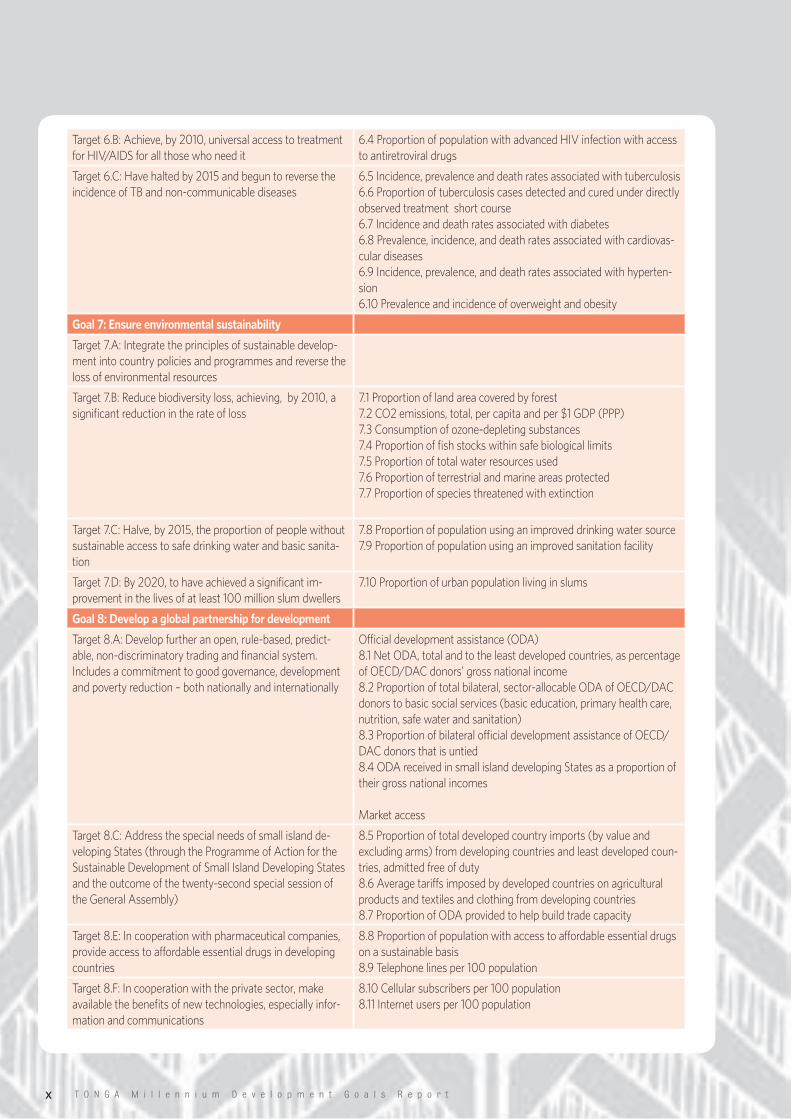
Target 6.B: Achieve, by 2010, universal access to treatment for HIV/AIDS for all those who need it
6.4 Proportion of population with advanced HIV infection with access to antiretroviral drugs
Target 6.C: Have halted by 2015 and begun to reverse the incidence of TB and non-communicable diseases
6.5 Incidence, prevalence and death rates associated with tuberculosis6.6 Proportion of tuberculosis cases detected and cured under directly observed treatment short course6.7 Incidence and death rates associated with diabetes6.8 Prevalence, incidence, and death rates associated with cardiovas-cular diseases6.9 Incidence, prevalence, and death rates associated with hyperten-sion6.10 Prevalence and incidence of overweight and obesity
Goal 7: Ensure environmental sustainability
Target 7.A: Integrate the principles of sustainable develop-ment into country policies and programmes and reverse the loss of environmental resources
Target 7.B: Reduce biodiversity loss, achieving, by 2010, a significant reduction in the rate of loss
7.1 Proportion of land area covered by forest7.2 CO2 emissions, total, per capita and per $1 GDP (PPP)7.3 Consumption of ozone-depleting substances7.4 Proportion of fish stocks within safe biological limits7.5 Proportion of total water resources used7.6 Proportion of terrestrial and marine areas protected7.7 Proportion of species threatened with extinction
Target 7.C: Halve, by 2015, the proportion of people without sustainable access to safe drinking water and basic sanita-tion
7.8 Proportion of population using an improved drinking water source7.9 Proportion of population using an improved sanitation facility
Target 7.D: By 2020, to have achieved a significant im-provement in the lives of at least 100 million slum dwellers
7.10 Proportion of urban population living in slums
Goal 8: Develop a global partnership for development
Target 8.A: Develop further an open, rule-based, predict-able, non-discriminatory trading and financial system. Includes a commitment to good governance, development and poverty reduction – both nationally and internationally
Official development assistance (ODA)8.1 Net ODA, total and to the least developed countries, as percentage of OECD/DAC donors’ gross national income8.2 Proportion of total bilateral, sector-allocable ODA of OECD/DAC donors to basic social services (basic education, primary health care, nutrition, safe water and sanitation)8.3 Proportion of bilateral official development assistance of OECD/DAC donors that is untied8.4 ODA received in small island developing States as a proportion of their gross national incomes
Market access
Target 8.C: Address the special needs of small island de-veloping States (through the Programme of Action for the Sustainable Development of Small Island Developing States and the outcome of the twenty-second special session of the General Assembly)
8.5 Proportion of total developed country imports (by value and excluding arms) from developing countries and least developed coun-tries, admitted free of duty8.6 Average tariffs imposed by developed countries on agricultural products and textiles and clothing from developing countries8.7 Proportion of ODA provided to help build trade capacity
Target 8.E: In cooperation with pharmaceutical companies, provide access to affordable essential drugs in developing countries
8.8 Proportion of population with access to affordable essential drugs on a sustainable basis8.9 Telephone lines per 100 population
Target 8.F: In cooperation with the private sector, make available the benefits of new technologies, especially infor-mation and communications
8.10 Cellular subscribers per 100 population8.11 Internet users per 100 population
T O N G A M i l l e n n i u m D e v e l o p m e n t G o a l s R e p o r t xi
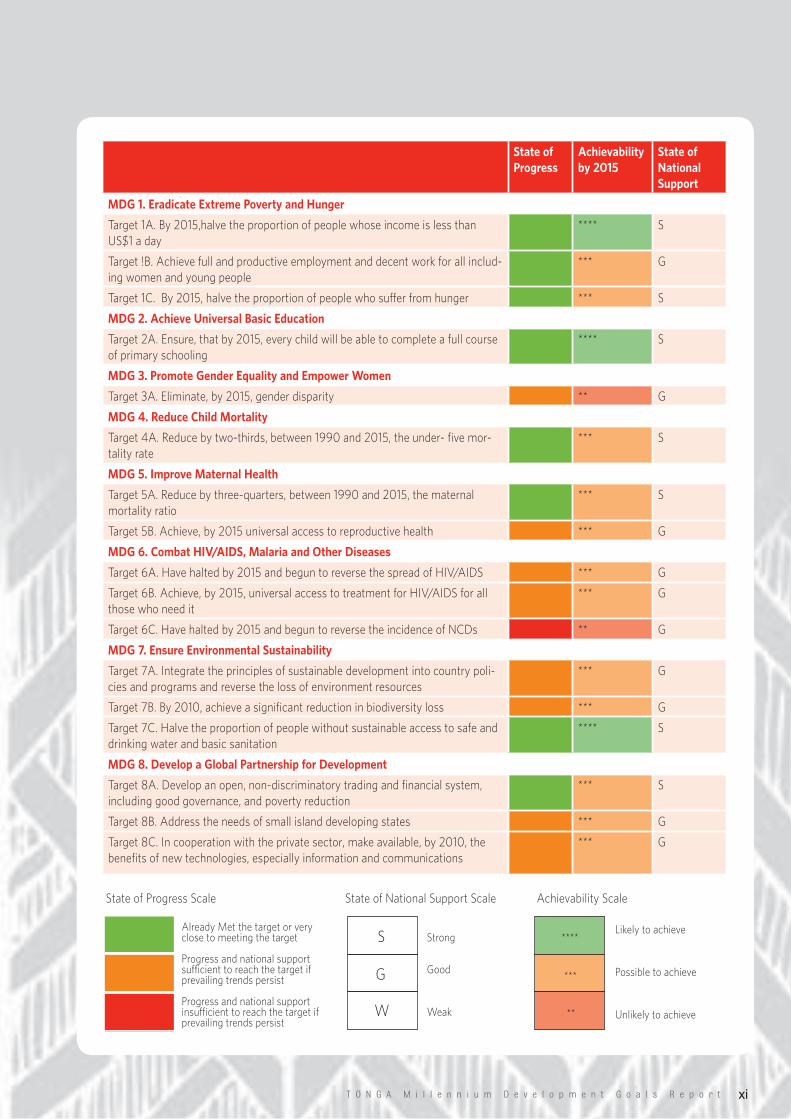
State of Progress
Achievability by 2015
State of National Support
MDG 1. Eradicate Extreme Poverty and Hunger
Target 1A. By 2015,halve the proportion of people whose income is less than US$1 a day
**** S
Target !B. Achieve full and productive employment and decent work for all includ-ing women and young people
*** G
Target 1C. By 2015, halve the proportion of people who suffer from hunger *** S
MDG 2. Achieve Universal Basic Education
Target 2A. Ensure, that by 2015, every child will be able to complete a full course of primary schooling
**** S
MDG 3. Promote Gender Equality and Empower Women
Target 3A. Eliminate, by 2015, gender disparity ** G
MDG 4. Reduce Child Mortality
Target 4A. Reduce by two-thirds, between 1990 and 2015, the under- five mor-tality rate
*** S
MDG 5. Improve Maternal Health
Target 5A. Reduce by three-quarters, between 1990 and 2015, the maternal mortality ratio
*** S
Target 5B. Achieve, by 2015 universal access to reproductive health *** G
MDG 6. Combat HIV/AIDS, Malaria and Other Diseases
Target 6A. Have halted by 2015 and begun to reverse the spread of HIV/AIDS *** G
Target 6B. Achieve, by 2015, universal access to treatment for HIV/AIDS for all those who need it
*** G
Target 6C. Have halted by 2015 and begun to reverse the incidence of NCDs ** G
MDG 7. Ensure Environmental Sustainability
Target 7A. Integrate the principles of sustainable development into country poli-cies and programs and reverse the loss of environment resources
*** G
Target 7B. By 2010, achieve a significant reduction in biodiversity loss *** G
Target 7C. Halve the proportion of people without sustainable access to safe and drinking water and basic sanitation
**** S
MDG 8. Develop a Global Partnership for Development
Target 8A. Develop an open, non-discriminatory trading and financial system, including good governance, and poverty reduction
*** S
Target 8B. Address the needs of small island developing states *** G
Target 8C. In cooperation with the private sector, make available, by 2010, the benefits of new technologies, especially information and communications
*** G
State of Progress Scale State of National Support Scale Achievability Scale
Already Met the target or very close to meeting the target
Progress and national support sufficient to reach the target if prevailing trends persist
Progress and national support insufficient to reach the target if prevailing trends persist
Strong
Good
Weak
S
G
W
Likely to achieve
Possible to achieve
Unlikely to achieve
****
***
**
T O N G A M i l l e n n i u m D e v e l o p m e n t G o a l s R e p o r txii M i l l e n n i u m D e v e l o p m e n t G o a l sxii
Tonga’s ContextThe Kingdom of Tonga is a Polynesian archipelago in the South Pacific with approximately 718 sq km of land area scattered over 170 islands, of which 36 are inhabited. The country consists of 4 main island groups including Tongatapu seat of the capital city Nuku’alofa, and including, Vava’u, Hapa’ai, and the more remote islands in the Niuas.
Tonga is the only country in the South Pacific that has never been formally colonized, although it was a British protectorate until the 4th of June 1970. Tonga is also the only monarchy in the region.
Over the years, Tonga has undergone social, cultural, economic, political and demographic changes. As with many other Pacific islands, Tonga’s small size and isolation present challenges for development.
Over recent years, Tonga’s population has remained at around 100,000 people, with a high rate of out-migration helping stabilize demographic trends. In the 1996-2006 inter-censal periods, the population growth rate was 0.4% per annum. The country is predominantly rural; with about 25% of the population living in urban areas. Tonga has a young population with a median age of 21 years. More than one-third (38%) of the population is under15 years of age, with 8% 60 years and older. Life expectancy is considered high at 70.2 overall (67.3 for males and 73.0 for females).
The World Bank classifies Tonga as a lower middle income country. In 2009, the Gross National Income per capita stood at US$2,561. In 2009, Tonga’s economy contracted by 0.4%, a result mainly due to falling remittances of expatriate Tongan, as a result of the global economic crisis. Thus Government revenues have fallen, and the economic downturn is expected to continue at least through 2011. Tonga’s economy is still agricultural-based, with a narrow export base.
The economy is traditionally redistributive in Tonga, and is based on three core values: ‘ofa (love), faka’apa’apa (respect) and fuakavenga (responsibility). Family groups rely on traditional economic cooperation to raise money for important occasions such as weddings, funerals, and so forth. Tongans who migrate overseas (a community of over 150,000 members in New Zealand, Australia, and the United States) regularly remit money to family members in Tonga. Nonetheless, family and community ties are still a dominant cultural and societal trait today.
T O N G A M i l l e n n i u m D e v e l o p m e n t G o a l s R e p o r t 1
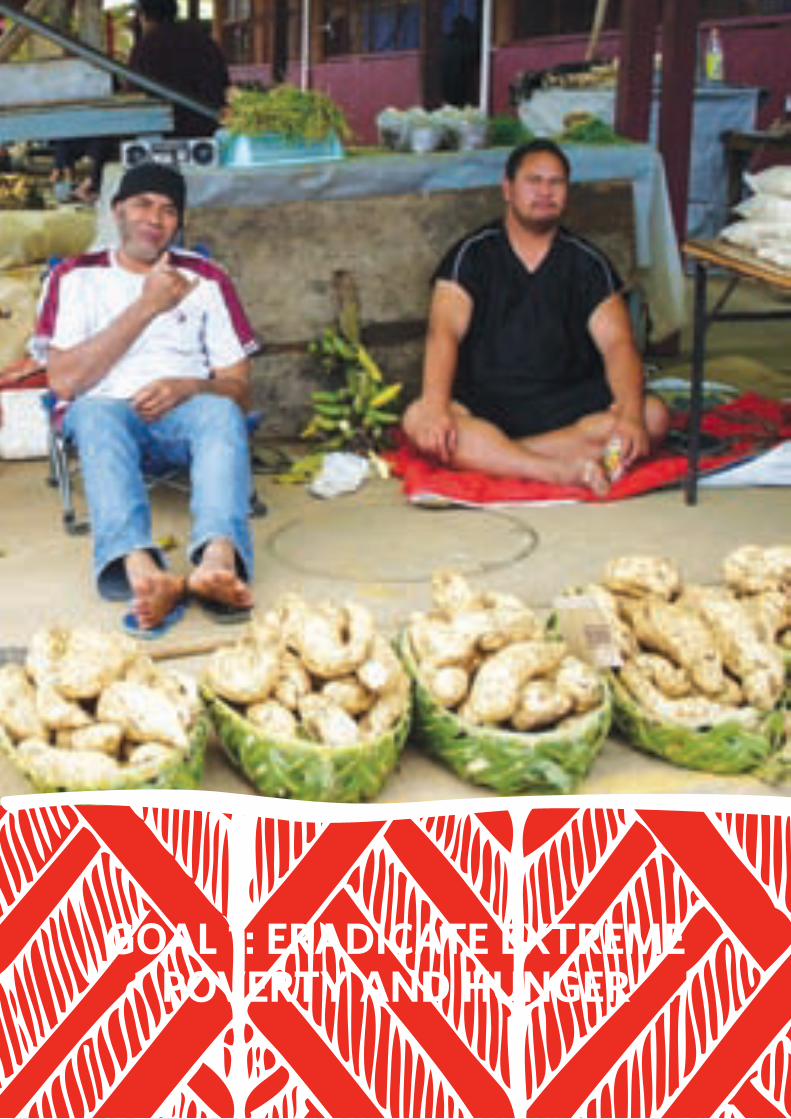
GOAL 1: ERADICATE EXTREME POVERTY AND HUNGER
T O N G A M i l l e n n i u m D e v e l o p m e n t G o a l s R e p o r t2
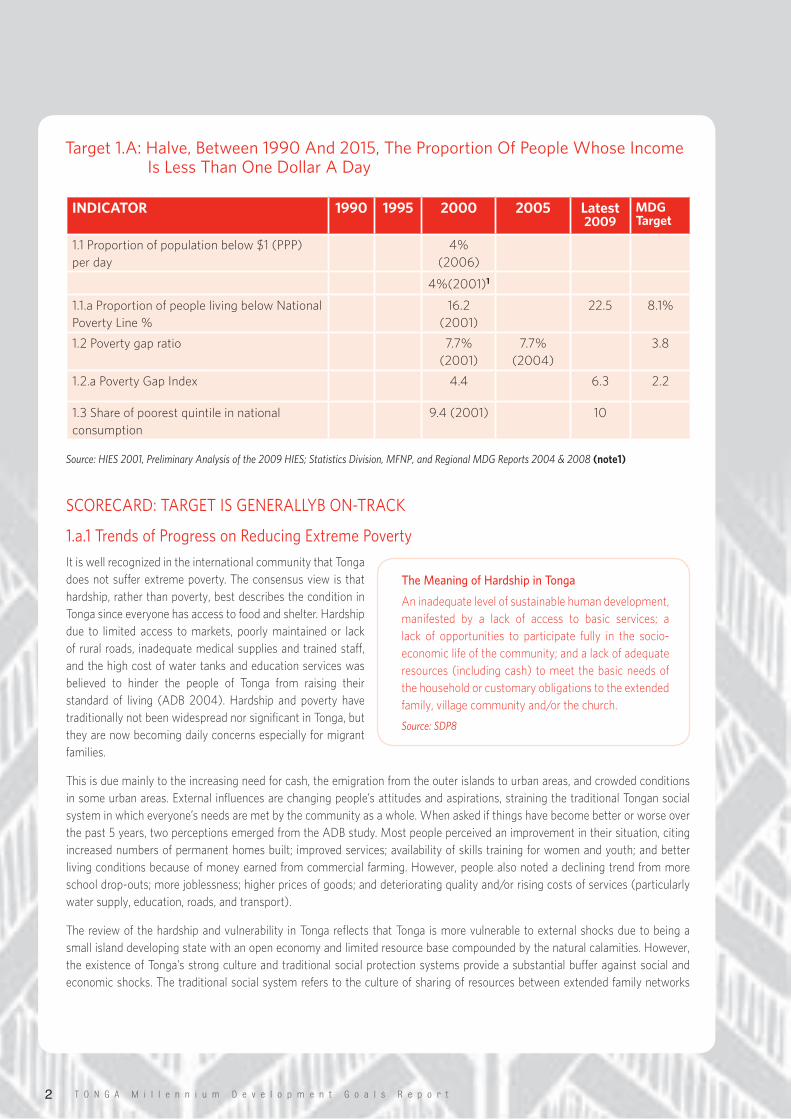
Target1.A:Halve,Between1990And2015,TheProportionOfPeopleWhoseIncomeIsLessThanOneDollarADay
INDICATOR 1990 1995 2000 2005 Latest2009
MDG Target
1.1 Proportion of population below $1 (PPP) per day
4% (2006)
4%(2001)1
1.1.a Proportion of people living below National Poverty Line %
16.2 (2001)
22.5 8.1%
1.2 Poverty gap ratio 7.7% (2001)
7.7% (2004)
3.8
1.2.a Poverty Gap Index 4.4 6.3 2.2
1.3 Share of poorest quintile in national consumption
9.4 (2001) 10
Source: HIES 2001, Preliminary Analysis of the 2009 HIES; Statistics Division, MFNP, and Regional MDG Reports 2004 & 2008 (note1)
SCORECARD:TARGETISGENERALLYBON-TRACK
1.a.1TrendsofProgressonReducingExtremePoverty
It is well recognized in the international community that Tonga does not suffer extreme poverty. The consensus view is that hardship, rather than poverty, best describes the condition in Tonga since everyone has access to food and shelter. Hardship due to limited access to markets, poorly maintained or lack of rural roads, inadequate medical supplies and trained staff, and the high cost of water tanks and education services was believed to hinder the people of Tonga from raising their standard of living (ADB 2004). Hardship and poverty have traditionally not been widespread nor significant in Tonga, but they are now becoming daily concerns especially for migrant families.
This is due mainly to the increasing need for cash, the emigration from the outer islands to urban areas, and crowded conditions in some urban areas. External influences are changing people’s attitudes and aspirations, straining the traditional Tongan social system in which everyone’s needs are met by the community as a whole. When asked if things have become better or worse over the past 5 years, two perceptions emerged from the ADB study. Most people perceived an improvement in their situation, citing increased numbers of permanent homes built; improved services; availability of skills training for women and youth; and better living conditions because of money earned from commercial farming. However, people also noted a declining trend from more school drop-outs; more joblessness; higher prices of goods; and deteriorating quality and/or rising costs of services (particularly water supply, education, roads, and transport).
The review of the hardship and vulnerability in Tonga reflects that Tonga is more vulnerable to external shocks due to being a small island developing state with an open economy and limited resource base compounded by the natural calamities. However, the existence of Tonga’s strong culture and traditional social protection systems provide a substantial buffer against social and economic shocks. The traditional social system refers to the culture of sharing of resources between extended family networks
The Meaning of Hardship in Tonga
An inadequate level of sustainable human development, manifested by a lack of access to basic services; a lack of opportunities to participate fully in the socio-economic life of the community; and a lack of adequate resources (including cash) to meet the basic needs of the household or customary obligations to the extended family, village community and/or the church.
Source: SDP8
T O N G A M i l l e n n i u m D e v e l o p m e n t G o a l s R e p o r t 3
and communities; commitment to building the country’s stock of human capital, providing male’s access to land to support their families, and existence of strong flows of remittances. The traditional system is getting weak due to the adverse impacts of global and domestic economic situation and it is no longer sufficient in helping Tongans to alleviate economic hardship.
The latest 2009 Household Income and Expenditure Surveys (HIES) has identified hardship faced by Tongans. The results of the survey reveal that the depth of hardship has increased, meaning that more people are facing hardship in Tonga, as more people were experiencing more severe hardship in 2009, compared with the situation in 2001. It should be noted that 2009 saw Tonga suffering from the effects of the Global Economic Crisis (GEC). Remittances were at their lowest level. Since this would significantly affect reported income levels in the HIES, if the HIES had been undertaken in a different year, the hardship results may have been significantly different.
Proportion of Population below a $1.25 per day
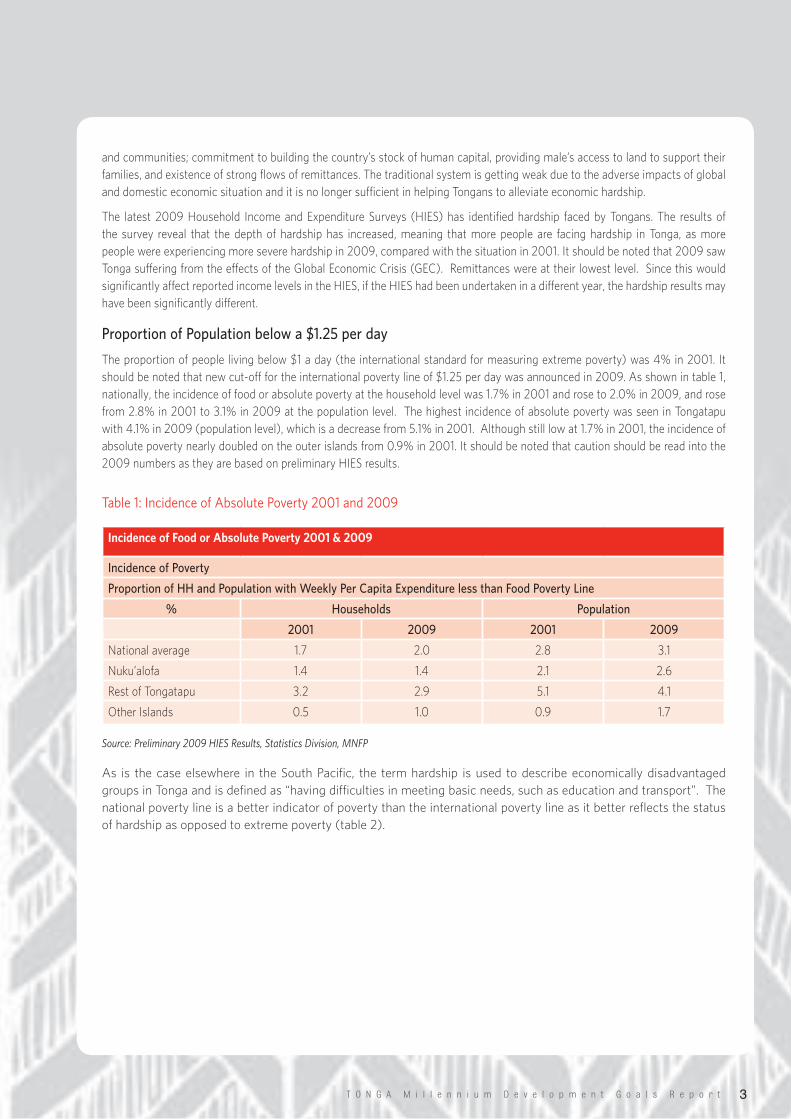
The proportion of people living below $1 a day (the international standard for measuring extreme poverty) was 4% in 2001. It should be noted that new cut-off for the international poverty line of $1.25 per day was announced in 2009. As shown in table 1, nationally, the incidence of food or absolute poverty at the household level was 1.7% in 2001 and rose to 2.0% in 2009, and rose from 2.8% in 2001 to 3.1% in 2009 at the population level. The highest incidence of absolute poverty was seen in Tongatapu with 4.1% in 2009 (population level), which is a decrease from 5.1% in 2001. Although still low at 1.7% in 2001, the incidence of absolute poverty nearly doubled on the outer islands from 0.9% in 2001. It should be noted that caution should be read into the 2009 numbers as they are based on preliminary HIES results.
Table1:IncidenceofAbsolutePoverty2001and2009
Source: Preliminary 2009 HIES Results, Statistics Division, MNFP
As is the case elsewhere in the South Pacific, the term hardship is used to describe economically disadvantaged groups in Tonga and is defined as “having difficulties in meeting basic needs, such as education and transport”. The national poverty line is a better indicator of poverty than the international poverty line as it better reflects the status of hardship as opposed to extreme poverty (table 2).
Incidence of Food or Absolute Poverty 2001 & 2009
Incidence of Poverty
Proportion of HH and Population with Weekly Per Capita Expenditure less than Food Poverty Line
% Households Population
2001 2009 2001 2009
National average 1.7 2.0 2.8 3.1
Nuku’alofa 1.4 1.4 2.1 2.6
Rest of Tongatapu 3.2 2.9 5.1 4.1
Other Islands 0.5 1.0 0.9 1.7
T O N G A M i l l e n n i u m D e v e l o p m e n t G o a l s R e p o r t4
Table2:BasicNeedsPovertyLines2001and2009
Source: Preliminary results, 2009 HIES, Statistics Division, MFNP
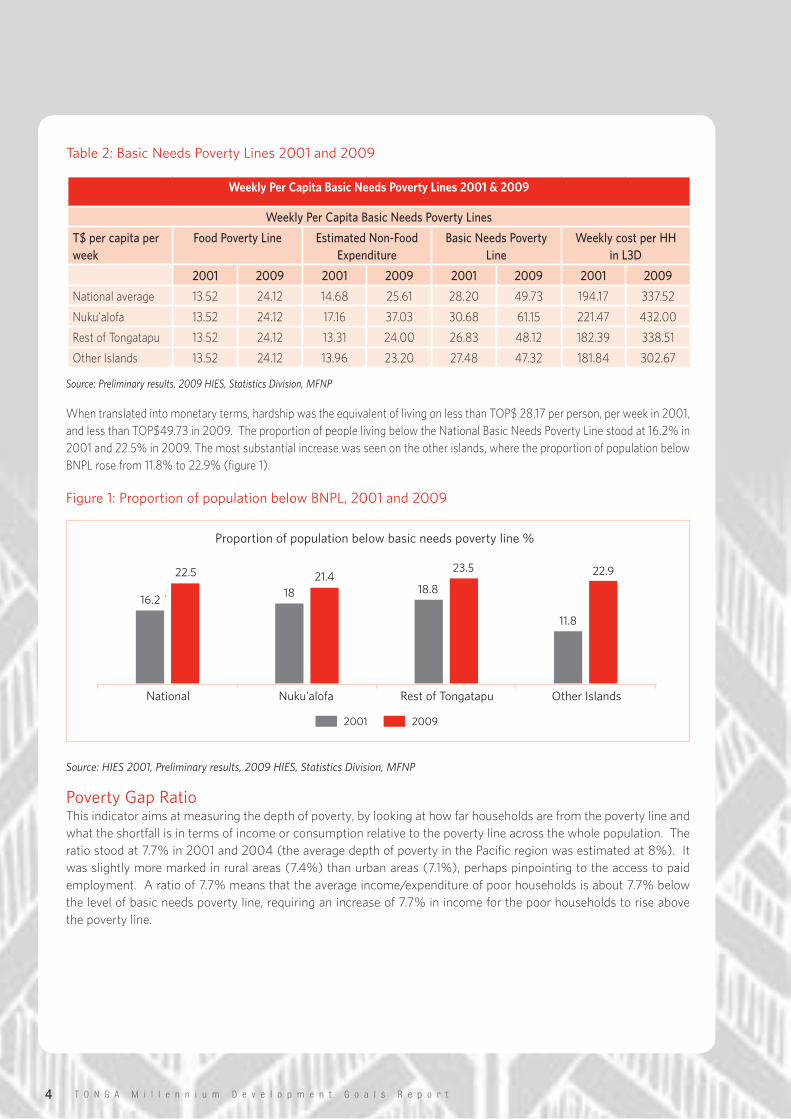
When translated into monetary terms, hardship was the equivalent of living on less than TOP$ 28.17 per person, per week in 2001, and less than TOP$49.73 in 2009. The proportion of people living below the National Basic Needs Poverty Line stood at 16.2% in 2001 and 22.5% in 2009. The most substantial increase was seen on the other islands, where the proportion of population below BNPL rose from 11.8% to 22.9% (figure 1).
Figure1:ProportionofpopulationbelowBNPL,2001and2009
Source: HIES 2001, Preliminary results, 2009 HIES, Statistics Division, MFNP
PovertyGapRatioThis indicator aims at measuring the depth of poverty, by looking at how far households are from the poverty line and what the shortfall is in terms of income or consumption relative to the poverty line across the whole population. The ratio stood at 7.7% in 2001 and 2004 (the average depth of poverty in the Pacific region was estimated at 8%). It was slightly more marked in rural areas (7.4%) than urban areas (7.1%), perhaps pinpointing to the access to paid employment. A ratio of 7.7% means that the average income/expenditure of poor households is about 7.7% below the level of basic needs poverty line, requiring an increase of 7.7% in income for the poor households to rise above the poverty line.
Weekly Per Capita Basic Needs Poverty Lines 2001 & 2009
Weekly Per Capita Basic Needs Poverty Lines
T$ per capita per week
Food Poverty Line Estimated Non-Food Expenditure
Basic Needs Poverty Line
Weekly cost per HH in L3D
2001 2009 2001 2009 2001 2009 2001 2009
National average 13.52 24.12 14.68 25.61 28.20 49.73 194.17 337.52
Nuku'alofa 13.52 24.12 17.16 37.03 30.68 61.15 221.47 432.00
Rest of Tongatapu 13.52 24.12 13.31 24.00 26.83 48.12 182.39 338.51
Other Islands 13.52 24.12 13.96 23.20 27.48 47.32 181.84 302.67
2001 2009
National Nuku’alofa RestofTongatapu OtherIslands
16.218 18.8
11.8
22.5 21.423.5 22.9
Proportionofpopulationbelowbasicneedspovertyline%
T O N G A M i l l e n n i u m D e v e l o p m e n t G o a l s R e p o r t 5
Figure2:PovertyGapIndex,2001and2009
Source: HIES 2001, Preliminary Results HIES 2009, Statistics Division, MNFP
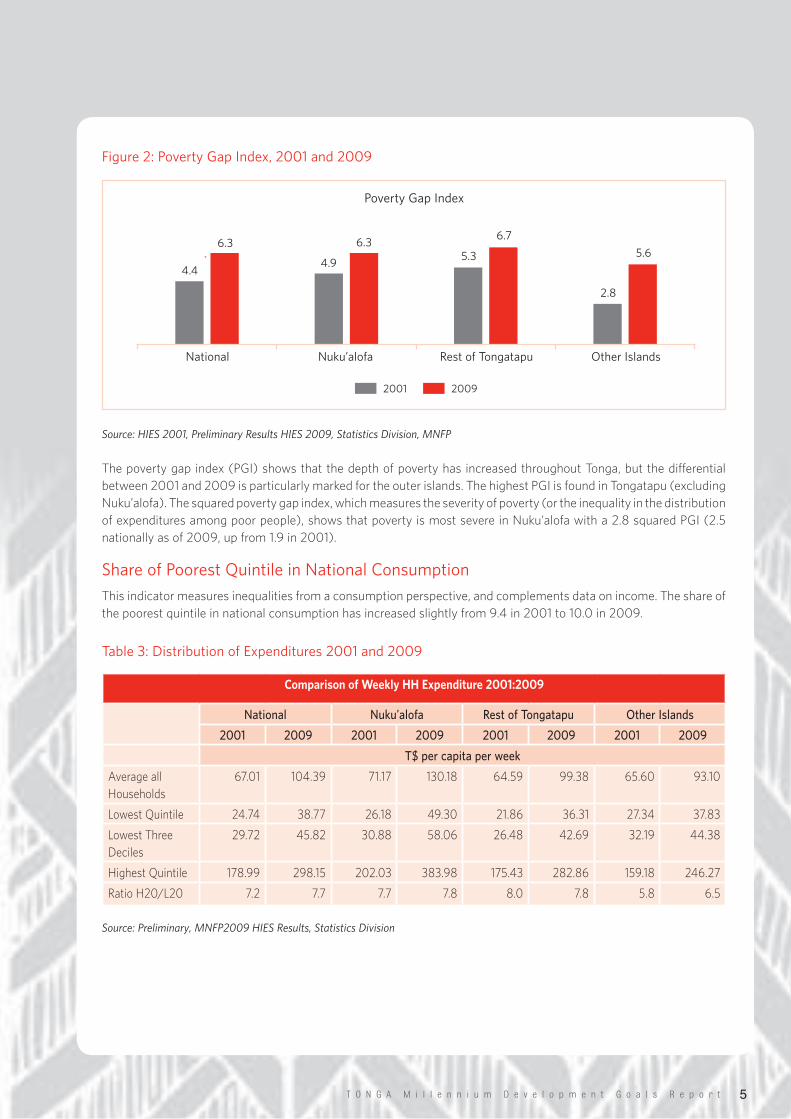
The poverty gap index (PGI) shows that the depth of poverty has increased throughout Tonga, but the differential between 2001 and 2009 is particularly marked for the outer islands. The highest PGI is found in Tongatapu (excluding Nuku’alofa). The squared poverty gap index, which measures the severity of poverty (or the inequality in the distribution of expenditures among poor people), shows that poverty is most severe in Nuku’alofa with a 2.8 squared PGI (2.5 nationally as of 2009, up from 1.9 in 2001).
ShareofPoorestQuintileinNationalConsumption
This indicator measures inequalities from a consumption perspective, and complements data on income. The share of the poorest quintile in national consumption has increased slightly from 9.4 in 2001 to 10.0 in 2009.
Table3:DistributionofExpenditures2001and2009
Source: Preliminary, MNFP2009 HIES Results, Statistics Division
Comparison of Weekly HH Expenditure 2001:2009
National Nuku’alofa Rest of Tongatapu Other Islands
2001 2009 2001 2009 2001 2009 2001 2009
T$ per capita per week
Average all Households
67.01 104.39 71.17 130.18 64.59 99.38 65.60 93.10
Lowest Quintile 24.74 38.77 26.18 49.30 21.86 36.31 27.34 37.83
Lowest Three Deciles
29.72 45.82 30.88 58.06 26.48 42.69 32.19 44.38
Highest Quintile 178.99 298.15 202.03 383.98 175.43 282.86 159.18 246.27
Ratio H20/L20 7.2 7.7 7.7 7.8 8.0 7.8 5.8 6.5
2001 2009
National Nuku’alofa RestofTongatapu OtherIslands
4.44.9
5.3
2.8
6.3 6.36.7
5.6
PovertyGapIndex
T O N G A M i l l e n n i u m D e v e l o p m e n t G o a l s R e p o r t6
1.a.2 Inequalities
Geographic inequalities in the distribution of hardship exist. However, because seventy-one percent of the population lives on Tongatapu, the differences might be explained by the skewed population distribution. The 2001 HIES showed that the 10% of households with the lowest income levels received 1.6% of the total household income, whereas the 10% of households with the highest income levels received 30.9%.
Based on the 2001 HIES survey, the bottom quintile’s share of income was approximately 5%, while the top 20% quintile had slightly above 40%. The large differential seen between lowest and top quintiles is similar to other Pacific countries.
The preliminary results of the 2009 HIES show that the consumption patterns of the wealthiest households was nearly seven times that of the poorest households, and this was fairly consistent throughout Tonga. The ratio of household expenditure of the highest quintile to the lowest quintile remained fairly similar in 2001 and 2009.
The main island of Tongatapu has the highest GDP per capita, approximately 15 per cent above the national average. The Ha’apai island group is one of the least developed regions in Tonga, with a GDP about 40 per cent below the national average. Many inhabitants have emigrated to Nuku’alofa in search of work and further education.
Poor communities living on the outer islands of ‘Eua, Ha’apai, the Niuas, and the outlying islands of Vava’u face additional challenges as they live on far-flung islands from the main island group. Access to basic goods and services is more limited, as are marketing opportunities for local produce and products, and transportation. (IFAD, 2010)
1.a.3 Human Development
The Human Development Index (HDI) is a composite measure taking into account life expectancy, education, and income. In 2005, Tonga ranked 54th out of 177 countries and, ranked first among Pacific Island nations. In 2007, Tonga ranked 99th out of 182 countries. Two possible explanations can be put forward to explain this decline in ranking: it is possible that while the situation in Tonga has remained stable other countries may have made better progress, surpassing Tonga. Since life expectancy and educational attainments have remained fairly stable from 2005 to 2007, a decline in income could explain the variation, with mainly a decline in GDP per capita. This could potentially indicate that inequalities have widened in Tonga. Tonga’s GDP per capita ranking stands at 120 out of 182 countries.
1.a.4 Challenges
Hardship is exacerbated by low and negative economic growth. Structural impediments to economic growth have been identified, including:• The Government’s domination in the economy• Wages and salaries dominate over operations and investment• The economy’s dependence on remittances and foreign aid• Rising unemployment and inflation • Limited opportunities for young people
A notable problem for Tonga is also the under employment of the population. SDP8 took the unprecedented step of conducting extensive consultations throughout Tonga, called People’s perspective on Development. Tongans themselves identified infrastructure and service delivery as the main impediments to their development.
1.a.5 Key Sectors for Better Growth and Reduced Hardship
The National Strategic Planning Framework (NSPF) identified tourism, agriculture, and fisheries as key sectors to boost economic growth, which is necessary to address hardship and ensure a more equitable growth. A survey of successful economic growth in small states indicated that three models are possible, including revenues from natural resources (limited for Tonga), a tourism-based economy (highly possible in Tonga), and a service-based economy (NZAID, 2008). Tourism can also potentially stimulate agriculture, construction, and transport.
T O N G A M i l l e n n i u m D e v e l o p m e n t G o a l s R e p o r t 7
Tourism
In most Pacific countries, tourism is a leading industry, and is shown to contribute to poverty alleviation and MDG1 (Tourism, the Millennium Development Goals and Climate Change in the South Pacific Islands, 2009).Tonga has a very narrow domestic market, and its share of external markets and exports is limited. Tourism appears to be a main source of potential revenues and employment generation that needs to be further developed. The predominant role of remittances, compared to revenues from tourism is also marked throughout the period, with a decrease observed from 2008 onwards. While services contributed 55% of GDP in 2007/08, hotels and restaurants contributed only 2.5%.
Figure3:TouristsArrivalsandReceipts,2000–2009
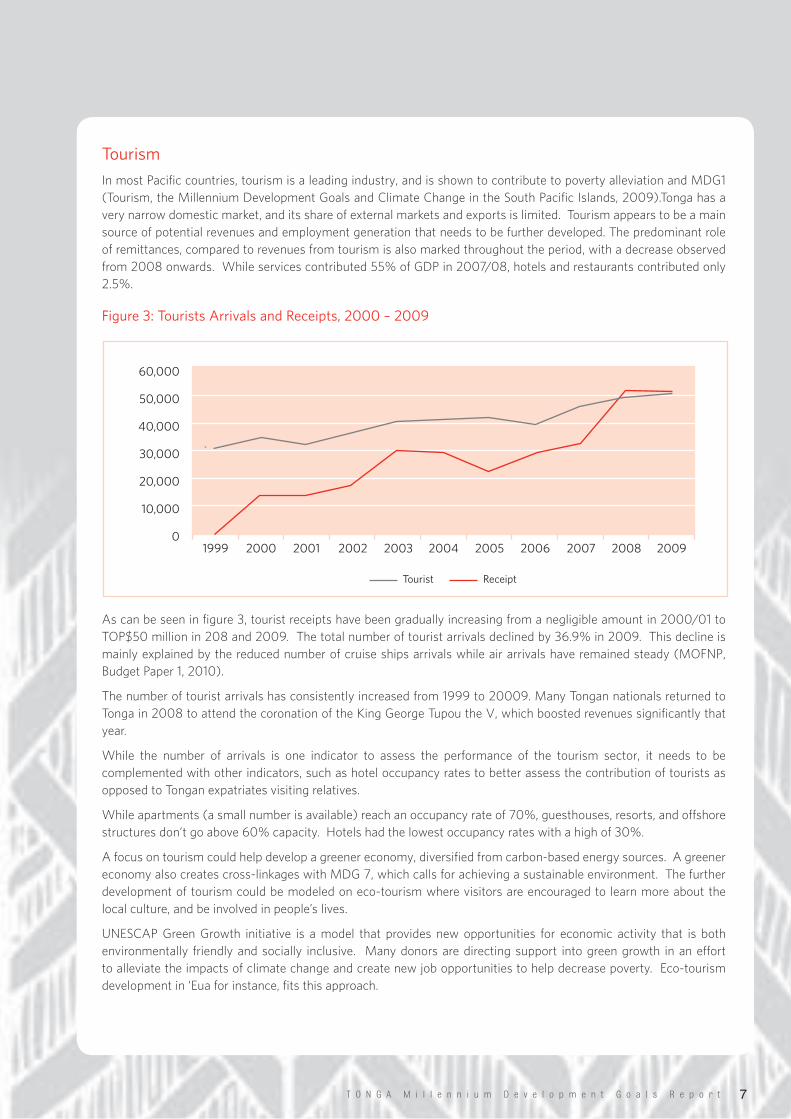
As can be seen in figure 3, tourist receipts have been gradually increasing from a negligible amount in 2000/01 to TOP$50 million in 208 and 2009. The total number of tourist arrivals declined by 36.9% in 2009. This decline is mainly explained by the reduced number of cruise ships arrivals while air arrivals have remained steady (MOFNP, Budget Paper 1, 2010).
The number of tourist arrivals has consistently increased from 1999 to 20009. Many Tongan nationals returned to Tonga in 2008 to attend the coronation of the King George Tupou the V, which boosted revenues significantly that year.
While the number of arrivals is one indicator to assess the performance of the tourism sector, it needs to be complemented with other indicators, such as hotel occupancy rates to better assess the contribution of tourists as opposed to Tongan expatriates visiting relatives.
While apartments (a small number is available) reach an occupancy rate of 70%, guesthouses, resorts, and offshore structures don’t go above 60% capacity. Hotels had the lowest occupancy rates with a high of 30%.
A focus on tourism could help develop a greener economy, diversified from carbon-based energy sources. A greener economy also creates cross-linkages with MDG 7, which calls for achieving a sustainable environment. The further development of tourism could be modeled on eco-tourism where visitors are encouraged to learn more about the local culture, and be involved in people’s lives.
UNESCAP Green Growth initiative is a model that provides new opportunities for economic activity that is both environmentally friendly and socially inclusive. Many donors are directing support into green growth in an effort to alleviate the impacts of climate change and create new job opportunities to help decrease poverty. Eco-tourism development in ‘Eua for instance, fits this approach.
60,000
50,000
40,000
30,000
20,000
10,000
01999 2000 2001 2002 2003 2004 2005 2006 2007 2008 2009
Tourist Receipt
T O N G A M i l l e n n i u m D e v e l o p m e n t G o a l s R e p o r t8
AgricultureandFisheriesTonga’s very low export to GDP ratio means that strong growth in exports of primary products will not make a significant difference to the overall rate of economic growth. This doesn’t mean that the importance of agriculture is diminished. Moreover, with regards to alleviate hardship to subsistence farming and the ability to produce food locally is extremely important.
The share of agriculture declined from 29% of GDP in 1993-94 to 23% in 2009/10.This reflects significant decline in export of squash a developing economy where the tertiary sector (in particular services) has become increasingly important.
Infrastructure,Transport,andEnergy
Natural disasters seriously impact infrastructure development and Tonga is one of the most vulnerable countries in the world to natural disasters.
The high cost of imported fuels for transport and electricity generation remains a fundamental obstacle to improving standards of living and business profitability. The cost of doing business needs to be reduced by addressing the issue of costly utilities and poor infrastructure. Because of Tonga’s high dependence on imported fuel the country faced significant price volatility in 2008-09. High food and oil prices resulted in inflation peaking at 12.6% in May 2008, but this had reduced back to 2.5% in March 2009. At the time of the peak oil prices the Government subsidized electricity for consumers, and oil for the fishing industry to mitigate the impacts.
The Government supported by twenty donor partners is addressing this issue through the Tonga Energy Road Map which focuses on increasing energy efficiency, minimizing the costs of imported fuels, and investing in renewable sources of energy such as solar and wind.
1.a.6 Support Mechanisms
GovernmentVisionandNationalPlanning
The NSPF highlights the government of Tonga’s vision of development which is “To create a society in which all Tongans enjoy higher living standards and a better quality of life through good governance, equitable and environmentally sustainable private sector-led economic growth, improved education and health standards, and cultural development”.
To support the policy development necessary to carry out this vision, several elements relevant to MDG1 have been identified, including:• Private sector-led growth• Infrastructure development to improve everyday lives• Improve Technical Training, Vocational Education to better match the needs in services and infrastructure
development and maintenance• Community development with the involvement of district/village communities
Pro-poorPolicies
There is no specific policy on hardship reduction, but a group of sectoral policies to improve the overall standard of living for the population. The government is focusing on creating an environment for sustainable economic growth as it is only through job creation that it can best alleviate hardship. The government is committed to reducing hardship and alleviating suffering, in particular on the outer islands. Pro-poor initiatives in service delivery have been identified, in particular to address service delivery deficiencies in health and education.
Although hardship is felt, the resilience of families and communities offers a mitigating safety net throughout the country. Family ties, and a strong sense of community favors a culture where caring and sharing is widely practiced
T O N G A M i l l e n n i u m D e v e l o p m e n t G o a l s R e p o r t 9
TheParticularRoleofRemittances
Remittances support consumption and investment in assets and education, as well as significantly improving average incomes of the poorest households. Traditional values and culture underpin the country’s commitment to education and to personal development needed to build the country’s stock of human capital. They also underpin much of Tonga’s economic activity by providing a large flow of remittances from overseas-based Tongans and an overseas market for traditional Tongan produce (e.g., handicrafts). Communities readily mobilize to contribute labor, construction materials, money, and food for local projects. People in the community voluntarily raise funds so that local children are able to afford to attend school. However, the onset of the global economic crisis put increasing stress on this important Tongan safety net mechanism.
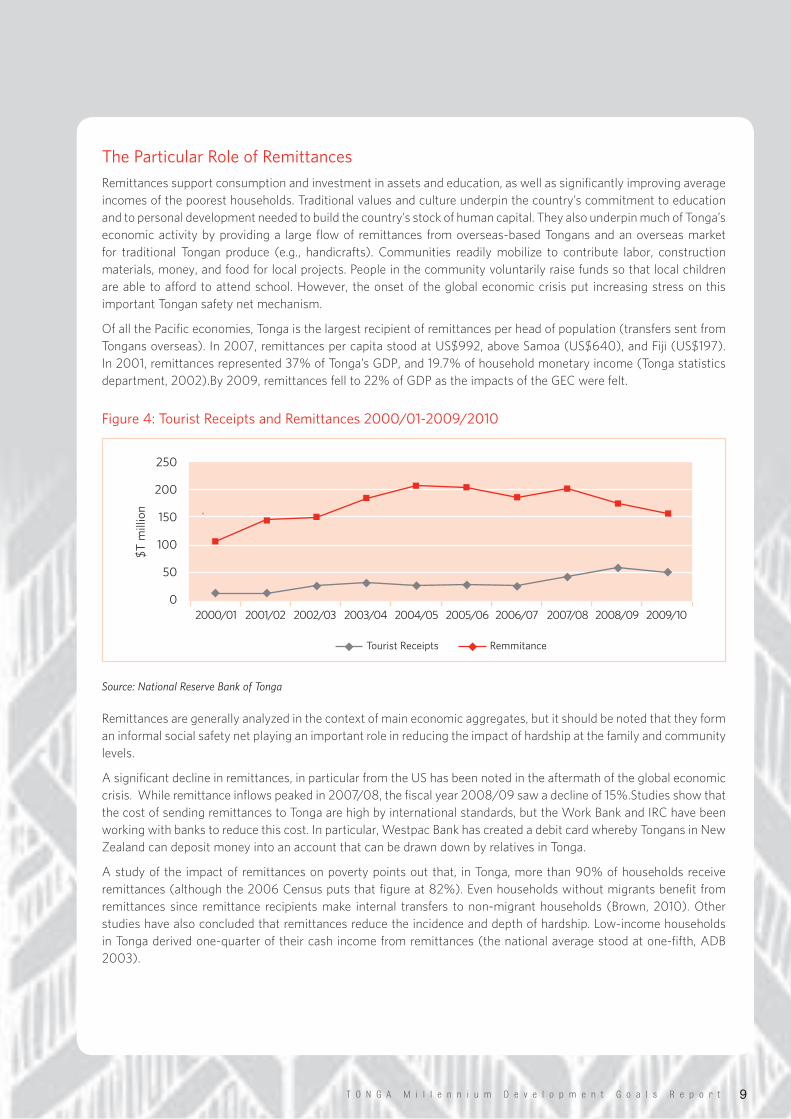
Of all the Pacific economies, Tonga is the largest recipient of remittances per head of population (transfers sent from Tongans overseas). In 2007, remittances per capita stood at US$992, above Samoa (US$640), and Fiji (US$197). In 2001, remittances represented 37% of Tonga’s GDP, and 19.7% of household monetary income (Tonga statistics department, 2002).By 2009, remittances fell to 22% of GDP as the impacts of the GEC were felt.
Figure4:TouristReceiptsandRemittances2000/01-2009/2010
Source: National Reserve Bank of Tonga
Remittances are generally analyzed in the context of main economic aggregates, but it should be noted that they form an informal social safety net playing an important role in reducing the impact of hardship at the family and community levels.
A significant decline in remittances, in particular from the US has been noted in the aftermath of the global economic crisis. While remittance inflows peaked in 2007/08, the fiscal year 2008/09 saw a decline of 15%.Studies show that the cost of sending remittances to Tonga are high by international standards, but the Work Bank and IRC have been working with banks to reduce this cost. In particular, Westpac Bank has created a debit card whereby Tongans in New Zealand can deposit money into an account that can be drawn down by relatives in Tonga.
A study of the impact of remittances on poverty points out that, in Tonga, more than 90% of households receive remittances (although the 2006 Census puts that figure at 82%). Even households without migrants benefit from remittances since remittance recipients make internal transfers to non-migrant households (Brown, 2010). Other studies have also concluded that remittances reduce the incidence and depth of hardship. Low-income households in Tonga derived one-quarter of their cash income from remittances (the national average stood at one-fifth, ADB 2003).
250
200
150
100
50
0
$Tm
illion
2000/01 2001/02 2002/03 2003/04 2004/05 2005/06 2006/07 2007/08 2008/09 2009/10
TouristReceipts Remmitance
T O N G A M i l l e n n i u m D e v e l o p m e n t G o a l s R e p o r t10
The largest share of remittances goes to expenditures on food, with a notable increase on the spending of processed foods in recent times. Also, considerable portions of remittances are specifically earmarked for community uses, mostly for church and school activities, to raise the status of the family within the community.
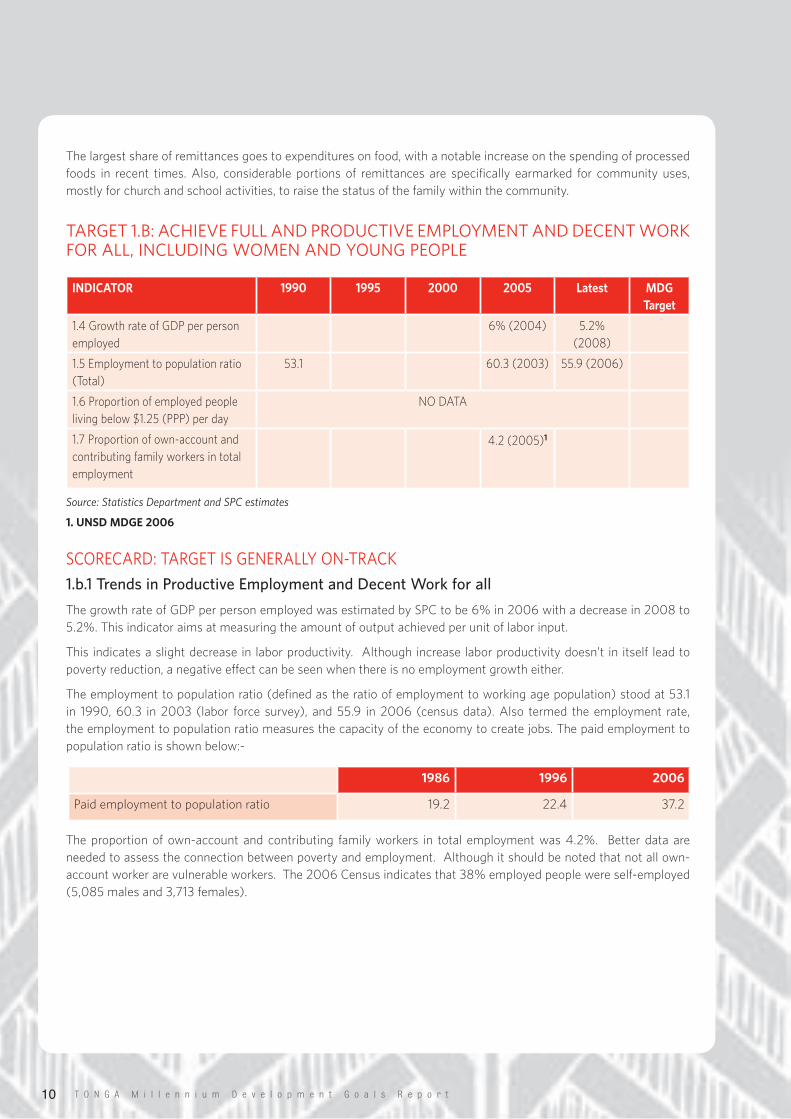
TARGET1.B:ACHIEVEFULLANDPRODUCTIVEEMPLOYMENTANDDECENTWORKFORALL,INCLUDINGWOMENANDYOUNGPEOPLE
Source: Statistics Department and SPC estimates
1. UNSD MDGE 2006
SCORECARD:TARGETISGENERALLYON-TRACK
1.b.1 Trends in Productive Employment and Decent Work for all
The growth rate of GDP per person employed was estimated by SPC to be 6% in 2006 with a decrease in 2008 to 5.2%. This indicator aims at measuring the amount of output achieved per unit of labor input.
This indicates a slight decrease in labor productivity. Although increase labor productivity doesn’t in itself lead to poverty reduction, a negative effect can be seen when there is no employment growth either.
The employment to population ratio (defined as the ratio of employment to working age population) stood at 53.1 in 1990, 60.3 in 2003 (labor force survey), and 55.9 in 2006 (census data). Also termed the employment rate, the employment to population ratio measures the capacity of the economy to create jobs. The paid employment to population ratio is shown below:-
The proportion of own-account and contributing family workers in total employment was 4.2%. Better data are needed to assess the connection between poverty and employment. Although it should be noted that not all own-account worker are vulnerable workers. The 2006 Census indicates that 38% employed people were self-employed (5,085 males and 3,713 females).
1986 1996 2006
Paid employment to population ratio 19.2 22.4 37.2
INDICATOR 1990 1995 2000 2005 Latest MDG Target
1.4 Growth rate of GDP per person employed
6% (2004) 5.2%(2008)
1.5 Employment to population ratio (Total)
53.1 60.3 (2003) 55.9 (2006)
1.6 Proportion of employed people living below $1.25 (PPP) per day
NO DATA
1.7 Proportion of own-account and contributing family workers in total employment
4.2 (2005)1
T O N G A M i l l e n n i u m D e v e l o p m e n t G o a l s R e p o r t 11
1.b.2 Inequality Analysis
Tonga’s economy is facing particular challenges, with a negative GDP growth in 2005, 2007, and 2009, signaling persisting contractions in the economy, and further reductions in the ability to create employment. Deterioration of export growth has been consistent since 2006 and is especially pronounced in 2009.
Labor force participation rates were higher for males than for females, and also higher for rural than urban populations. In line with this, the employment–population ratio was higher for the urban population than for rural populations.
No extensive labor surveys have been conducted since 2003. In the absence of updated and specific labor data, the 2006 census provide the majority of references for the analysis of employment in Tonga.
LaborData:CensusMethodologyandDefinitions
Work was defined in three categories with:• Work for pay (someone who worked for wages, salary, commission, or had contract, or was operating a
business)• Work to support the household by producing goods mainly for sale (farming, gardening, fishing, producing
handicrafts)• Work to support household by producing goods mainly for own consumption (farming, gardening, fishing,
handicrafts for own consumption). These are subsistence workers
Unemployment consists of those who did not work those who looked for work, and were available to work if a job was offered.
OverallLaborForce
Although 57% of Tonga’s population aged 15 and older was economically active, only 37% received a regular paid income; with 45%males and 29% females receiving regular paid income. Tonga being an isolated group of scattered islands with a limited resource base has restricted opportunities for salaried employment. There were considerably more male employed workers than females in all work categories.
Most subsistence workers are smallholder farmers practicing a mixed subsistence and cash crop production. A typical rural farming household produces root crops (taro, yam and sweet potato), sometimes supplemented by plantains and bananas. Other than farming and fishing, the rural poor lack alternative sources of income. Subsistence work (growing or gathering produce, and fishing) was the main activity of 17% of Tonga’s males and 19% females aged 15 and older. Twenty-one percent of rural residents were subsistence workers compared with 9% in the urban center.
T O N G A M i l l e n n i u m D e v e l o p m e n t G o a l s R e p o r t12
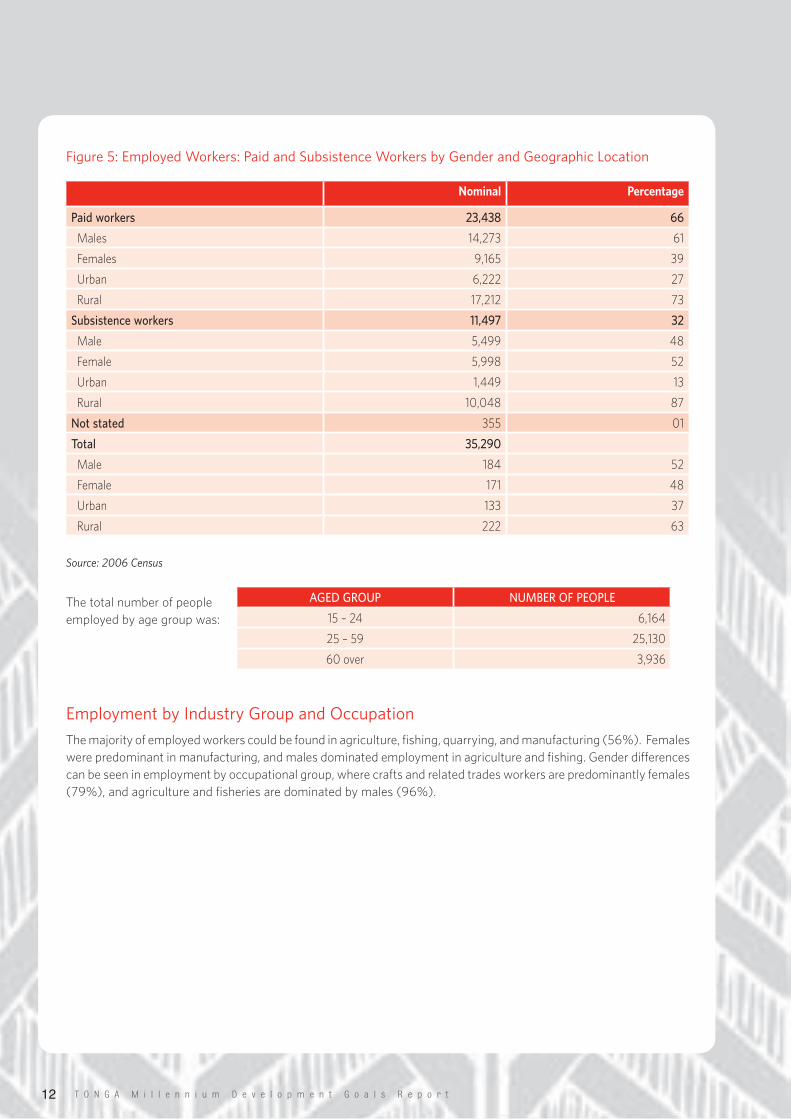
Figure5:EmployedWorkers:PaidandSubsistenceWorkersbyGenderandGeographicLocation
Source: 2006 Census
The total number of people employed by age group was:
EmploymentbyIndustryGroupandOccupation
The majority of employed workers could be found in agriculture, fishing, quarrying, and manufacturing (56%). Females were predominant in manufacturing, and males dominated employment in agriculture and fishing. Gender differences can be seen in employment by occupational group, where crafts and related trades workers are predominantly females (79%), and agriculture and fisheries are dominated by males (96%).
AGED GROUP NUMBER OF PEOPLE
15 – 24 6,164
25 – 59 25,130
60 over 3,936
Nominal Percentage
Paid workers 23,438 66
Males 14,273 61
Females 9,165 39
Urban 6,222 27
Rural 17,212 73
Subsistence workers 11,497 32
Male 5,499 48
Female 5,998 52
Urban 1,449 13
Rural 10,048 87
Not stated 355 01
Total 35,290
Male 184 52
Female 171 48
Urban 133 37
Rural 222 63
T O N G A M i l l e n n i u m D e v e l o p m e n t G o a l s R e p o r t 13
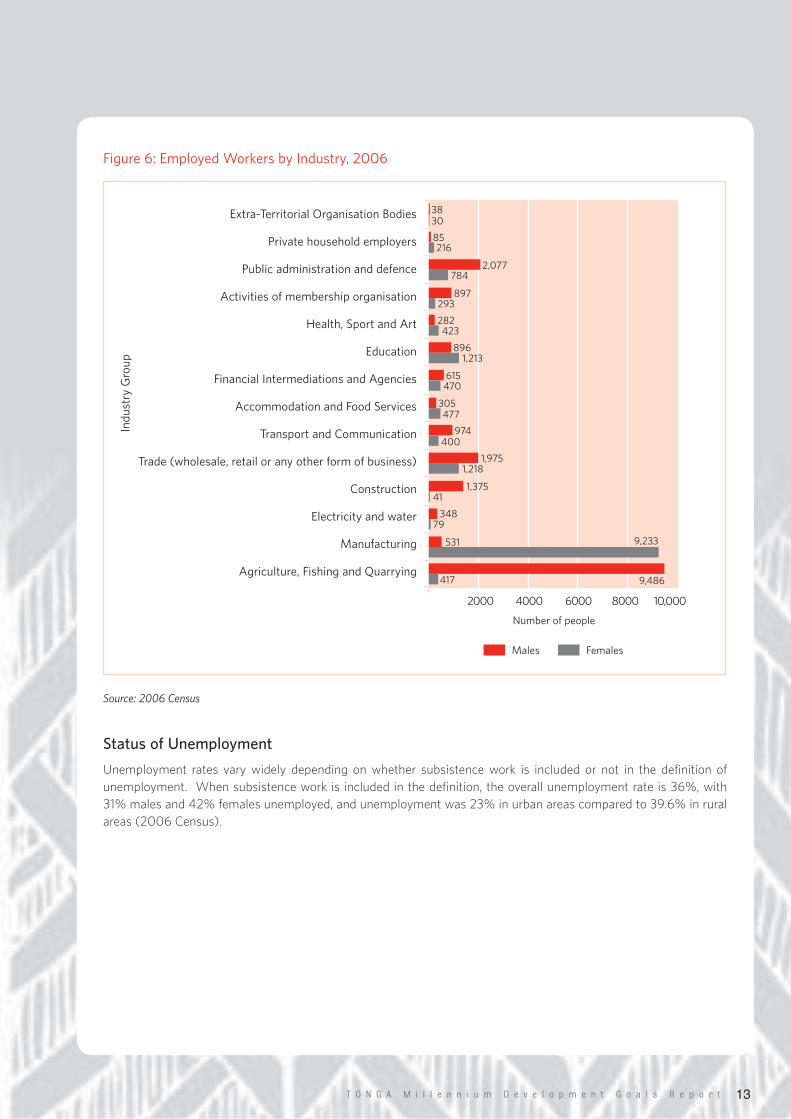
Figure6:EmployedWorkersbyIndustry,2006
Source: 2006 Census
Status of Unemployment
Unemployment rates vary widely depending on whether subsistence work is included or not in the definition of unemployment. When subsistence work is included in the definition, the overall unemployment rate is 36%, with 31% males and 42% females unemployed, and unemployment was 23% in urban areas compared to 39.6% in rural areas (2006 Census).
2000 4000 6000 8000 10,000
Extra-TerritorialOrganisationBodies
Privatehouseholdemployers
Publicadministrationanddefence
Activitiesofmembershiporganisation
Health,SportandArt
Education
FinancialIntermediationsandAgencies
AccommodationandFoodServices
TransportandCommunication
Trade(wholesale,retailoranyotherformofbusiness)
Construction
Electricityandwater
Manufacturing
Agriculture,FishingandQuarrying
Indu
stryG
roup
38
85
2,077
897
282
896
615
305
974
1,975
1,375
348
531
9,486
30
216
784
293
423
1,213
470
477
400
1,218
41
79
9,233
417
Males Females
Numberofpeople
T O N G A M i l l e n n i u m D e v e l o p m e n t G o a l s R e p o r t14
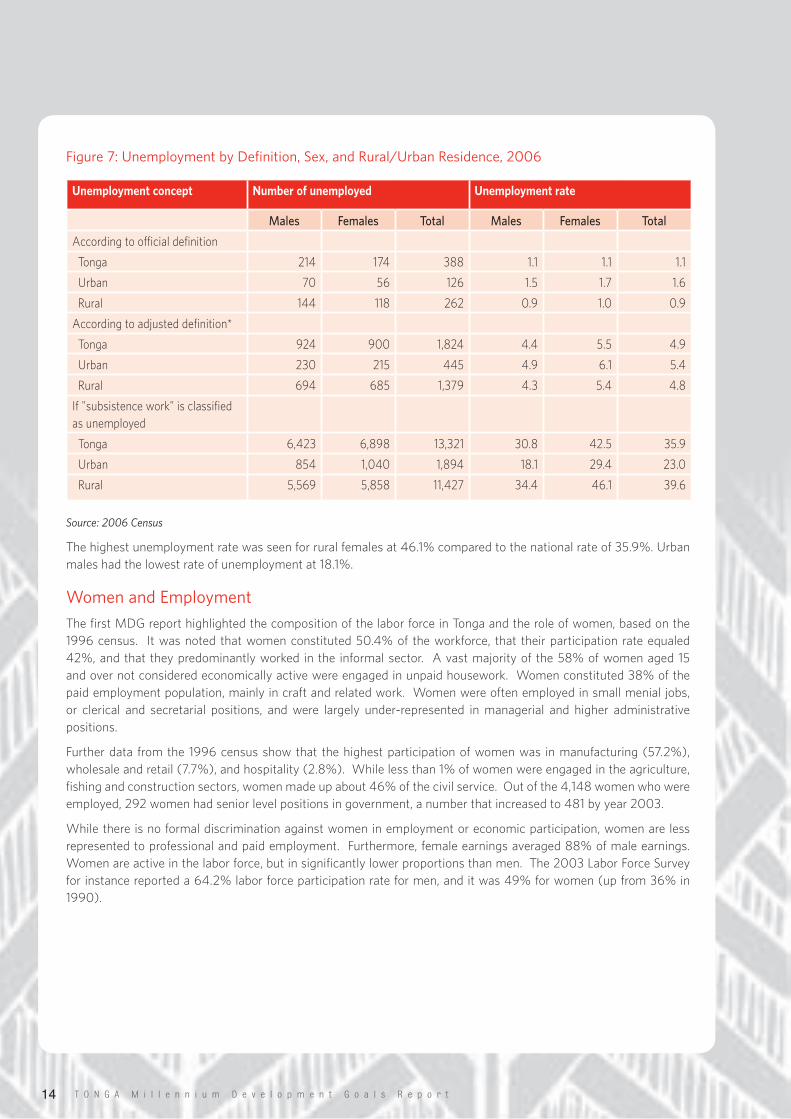
Figure7:UnemploymentbyDefinition,Sex,andRural/UrbanResidence,2006
Source: 2006 Census
The highest unemployment rate was seen for rural females at 46.1% compared to the national rate of 35.9%. Urban males had the lowest rate of unemployment at 18.1%.
WomenandEmployment
The first MDG report highlighted the composition of the labor force in Tonga and the role of women, based on the 1996 census. It was noted that women constituted 50.4% of the workforce, that their participation rate equaled 42%, and that they predominantly worked in the informal sector. A vast majority of the 58% of women aged 15 and over not considered economically active were engaged in unpaid housework. Women constituted 38% of the paid employment population, mainly in craft and related work. Women were often employed in small menial jobs, or clerical and secretarial positions, and were largely under-represented in managerial and higher administrative positions.
Further data from the 1996 census show that the highest participation of women was in manufacturing (57.2%), wholesale and retail (7.7%), and hospitality (2.8%). While less than 1% of women were engaged in the agriculture, fishing and construction sectors, women made up about 46% of the civil service. Out of the 4,148 women who were employed, 292 women had senior level positions in government, a number that increased to 481 by year 2003.
While there is no formal discrimination against women in employment or economic participation, women are less represented to professional and paid employment. Furthermore, female earnings averaged 88% of male earnings. Women are active in the labor force, but in significantly lower proportions than men. The 2003 Labor Force Survey for instance reported a 64.2% labor force participation rate for men, and it was 49% for women (up from 36% in 1990).
Unemployment concept Number of unemployed Unemployment rate
Males Females Total Males Females Total
According to official definition
Tonga 214 174 388 1.1 1.1 1.1
Urban 70 56 126 1.5 1.7 1.6
Rural 144 118 262 0.9 1.0 0.9
According to adjusted definition*
Tonga 924 900 1,824 4.4 5.5 4.9
Urban 230 215 445 4.9 6.1 5.4
Rural 694 685 1,379 4.3 5.4 4.8
If "subsistence work" is classified as unemployed
Tonga 6,423 6,898 13,321 30.8 42.5 35.9
Urban 854 1,040 1,894 18.1 29.4 23.0
Rural 5,569 5,858 11,427 34.4 46.1 39.6
T O N G A M i l l e n n i u m D e v e l o p m e n t G o a l s R e p o r t 15
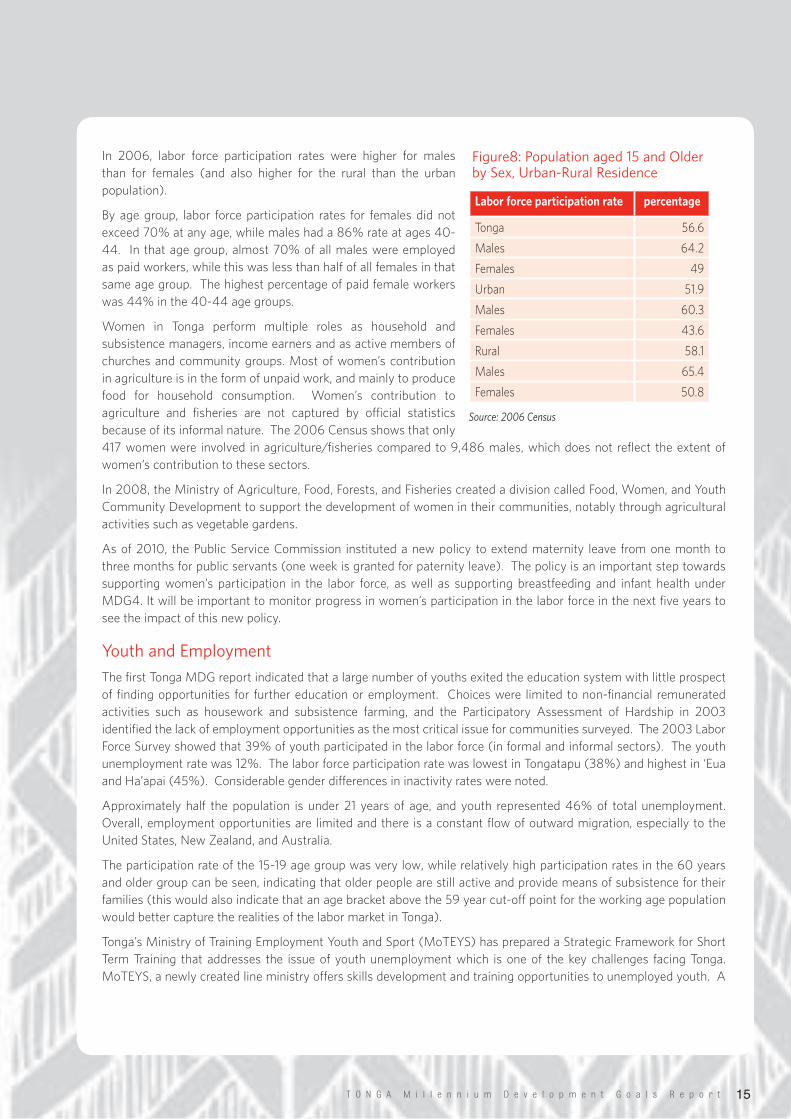
In 2006, labor force participation rates were higher for males than for females (and also higher for the rural than the urban population).
By age group, labor force participation rates for females did not exceed 70% at any age, while males had a 86% rate at ages 40-44. In that age group, almost 70% of all males were employed as paid workers, while this was less than half of all females in that same age group. The highest percentage of paid female workers was 44% in the 40-44 age groups.
Women in Tonga perform multiple roles as household and subsistence managers, income earners and as active members of churches and community groups. Most of women’s contribution in agriculture is in the form of unpaid work, and mainly to produce food for household consumption. Women’s contribution to agriculture and fisheries are not captured by official statistics because of its informal nature. The 2006 Census shows that only 417 women were involved in agriculture/fisheries compared to 9,486 males, which does not reflect the extent of women’s contribution to these sectors.
In 2008, the Ministry of Agriculture, Food, Forests, and Fisheries created a division called Food, Women, and Youth Community Development to support the development of women in their communities, notably through agricultural activities such as vegetable gardens.
As of 2010, the Public Service Commission instituted a new policy to extend maternity leave from one month to three months for public servants (one week is granted for paternity leave). The policy is an important step towards supporting women’s participation in the labor force, as well as supporting breastfeeding and infant health under MDG4. It will be important to monitor progress in women’s participation in the labor force in the next five years to see the impact of this new policy.
YouthandEmployment
The first Tonga MDG report indicated that a large number of youths exited the education system with little prospect of finding opportunities for further education or employment. Choices were limited to non-financial remunerated activities such as housework and subsistence farming, and the Participatory Assessment of Hardship in 2003 identified the lack of employment opportunities as the most critical issue for communities surveyed. The 2003 Labor Force Survey showed that 39% of youth participated in the labor force (in formal and informal sectors). The youth unemployment rate was 12%. The labor force participation rate was lowest in Tongatapu (38%) and highest in ‘Eua and Ha’apai (45%). Considerable gender differences in inactivity rates were noted.
Approximately half the population is under 21 years of age, and youth represented 46% of total unemployment. Overall, employment opportunities are limited and there is a constant flow of outward migration, especially to the United States, New Zealand, and Australia.
The participation rate of the 15-19 age group was very low, while relatively high participation rates in the 60 years and older group can be seen, indicating that older people are still active and provide means of subsistence for their families (this would also indicate that an age bracket above the 59 year cut-off point for the working age population would better capture the realities of the labor market in Tonga).
Tonga’s Ministry of Training Employment Youth and Sport (MoTEYS) has prepared a Strategic Framework for Short Term Training that addresses the issue of youth unemployment which is one of the key challenges facing Tonga. MoTEYS, a newly created line ministry offers skills development and training opportunities to unemployed youth. A
Labor force participation rate percentage
Tonga 56.6
Males 64.2
Females 49
Urban 51.9
Males 60.3
Females 43.6
Rural 58.1
Males 65.4
Females 50.8
Source: 2006 Census
Figure8:Populationaged15andOlderbySex,Urban-RuralResidence
T O N G A M i l l e n n i u m D e v e l o p m e n t G o a l s R e p o r t16
2008 survey conducted by MoTEYS noted critical skills shortages and gaps in the current workforce, in particular in management, customer service, policy development and analysis, advanced computer skills and information technology. The NSPR report emphasizes that vocational education and training needs to focus on key industries for growth such as tourism, agriculture, maritime sector, marine resources and fishing industry.
MoTEYS promotes employment registration to the public, and in particular to youth. In 2008, 506 clients registered as job seekers with the Center (42.8% were males and 57.2% were females). Most of the job seekers registered with MoTEYS looked for office work, while employment availability was predominantly in hospitality, tourism, and customer service. The Center also serves as an employment referral, as MoTEYS maintain contacts with businesses and employers.
A pilot project of ADB, the Tonga Youth Micro-Enterprise Development Project seeks to help youth participate in micro-enterprise. According to the Youth and Mental Health Situation Analysis Tonga Report (2009), unemployment has remained the number one priority of the Tonga National Youth Congress.
LaborStandardsandLaws
Outside of the public sector, labor market regulations are minimal, and private sector workers enjoy little formal protection. The 2006 Employment Relations Bill includes prohibition of gender bias in terms of remuneration, among many other provisions to try and increase protection in the labor sector.
SocialSafetyNet
Tonga’s strong culture and traditional sector provides a substantial buffer against social and economic shocks. Tonga’s proud culture of sharing of resources between extended family networks and communities has done much to minimize disadvantages.
Although there is a traditional social safety net system it is getting weak now due to the economic impacts of the GEC. Many families cannot afford to take in extra or additional family members and this is particularly true of lower socio-economic families. Hence, the traditional social safety net is proving to be less effective in addressing shocks that affect entire communities or the whole country such as natural disaster events or economic recession. Also, informal safety nets can weaken over time with successive shocks such as the recent episode of high food and oil prices followed by economic downturn, as the dependency burden grows, and there is less wealth to share.
The tight bonding of family and community has come under increasing pressure as Tongans adapt to the changes in their way of living and locality. Increasing urbanization combined with the influences brought from overseas is gradually distancing people from their traditional commitments. The central roles of traditional and church based communities are weakening. In some cases, albeit as yet rare, individuals and families are pursuing their personal interests with little regard to community imperatives.
While universal access to basic health and education is guaranteed, there are no formal social protection and safety programs in Tonga, beyond programs available to public servants. Outside of the public sector, only churches and NGOs support the needy. The predominant form of social protection comes from the extended family networks, and the particular role of remittances.
Retirement age for civil servants is 60 years old. Civil servants have access to a pension fund, hence the existence of an official retirement age. However, there is no national retirement fund, and those employed outside of the civil service do not have access to this type of social protection. Private sector employers have the discretion to set their own policies in regards to retirement age in absence of a national cut-off age.
The prospect of reaching the target of employment for all remains particularly elusive for Tonga, unless concerted efforts are made to stimulate job creation. However the importance of subsistence activity in the economy should not be under-estimated. It is the main contributor to the lack of poverty and hunger in Tonga.
T O N G A M i l l e n n i u m D e v e l o p m e n t G o a l s R e p o r t 17
There is a need to strengthening overall social protection legislative environment in the country. Social policies and legislation such as the Employment Relations Bill and legislation to prevent gender discrimination, if passed and enforced, will reduce the vulnerability of large sections of the community, namely workers and women. Review of existing social protection policy and legislations is recommended for future improvement.
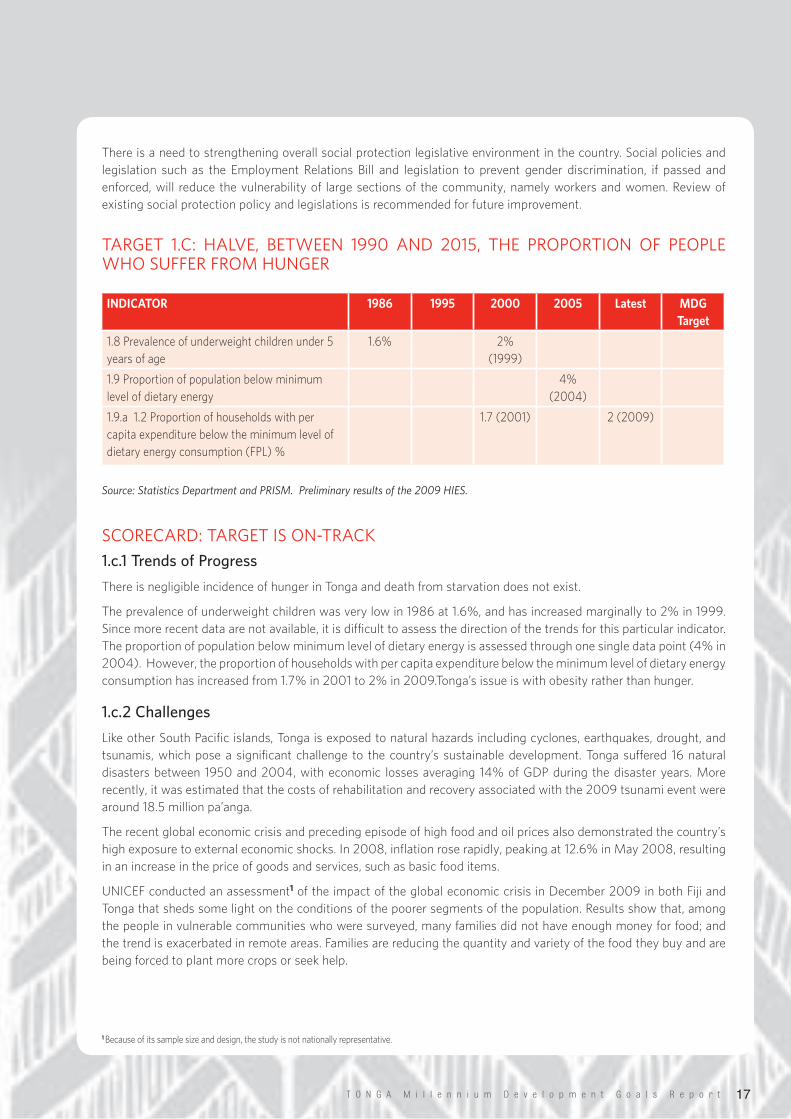
TARGET 1.C: HALVE, BETWEEN 1990 AND 2015, THE PROPORTION OF PEOPLEWHOSUFFERFROMHUNGER
Source: Statistics Department and PRISM. Preliminary results of the 2009 HIES.
SCORECARD:TARGETISON-TRACK
1.c.1 Trends of Progress
There is negligible incidence of hunger in Tonga and death from starvation does not exist.
The prevalence of underweight children was very low in 1986 at 1.6%, and has increased marginally to 2% in 1999. Since more recent data are not available, it is difficult to assess the direction of the trends for this particular indicator. The proportion of population below minimum level of dietary energy is assessed through one single data point (4% in 2004). However, the proportion of households with per capita expenditure below the minimum level of dietary energy consumption has increased from 1.7% in 2001 to 2% in 2009.Tonga’s issue is with obesity rather than hunger.
1.c.2 Challenges
Like other South Pacific islands, Tonga is exposed to natural hazards including cyclones, earthquakes, drought, and tsunamis, which pose a significant challenge to the country’s sustainable development. Tonga suffered 16 natural disasters between 1950 and 2004, with economic losses averaging 14% of GDP during the disaster years. More recently, it was estimated that the costs of rehabilitation and recovery associated with the 2009 tsunami event were around 18.5 million pa’anga.
The recent global economic crisis and preceding episode of high food and oil prices also demonstrated the country’s high exposure to external economic shocks. In 2008, inflation rose rapidly, peaking at 12.6% in May 2008, resulting in an increase in the price of goods and services, such as basic food items.
UNICEF conducted an assessment1 of the impact of the global economic crisis in December 2009 in both Fiji and Tonga that sheds some light on the conditions of the poorer segments of the population. Results show that, among the people in vulnerable communities who were surveyed, many families did not have enough money for food; and the trend is exacerbated in remote areas. Families are reducing the quantity and variety of the food they buy and are being forced to plant more crops or seek help.
INDICATOR 1986 1995 2000 2005 Latest MDG Target
1.8 Prevalence of underweight children under 5 years of age
1.6% 2% (1999)
1.9 Proportion of population below minimum level of dietary energy
4% (2004)
1.9.a 1.2 Proportion of households with per capita expenditure below the minimum level of dietary energy consumption (FPL) %
1.7 (2001) 2 (2009)
1 Because of its sample size and design, the study is not nationally representative.
T O N G A M i l l e n n i u m D e v e l o p m e n t G o a l s R e p o r t18
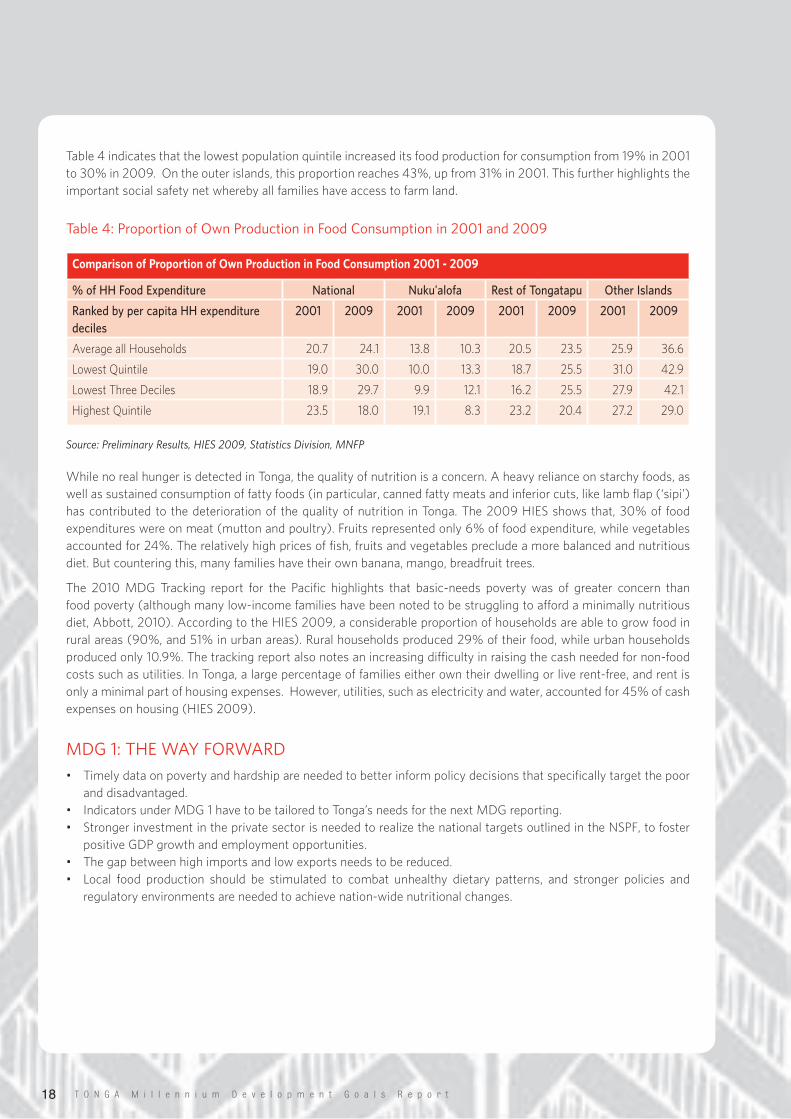
Table 4 indicates that the lowest population quintile increased its food production for consumption from 19% in 2001 to 30% in 2009. On the outer islands, this proportion reaches 43%, up from 31% in 2001. This further highlights the important social safety net whereby all families have access to farm land.
Table4:ProportionofOwnProductioninFoodConsumptionin2001and2009
Source: Preliminary Results, HIES 2009, Statistics Division, MNFP
While no real hunger is detected in Tonga, the quality of nutrition is a concern. A heavy reliance on starchy foods, as well as sustained consumption of fatty foods (in particular, canned fatty meats and inferior cuts, like lamb flap (‘sipi’) has contributed to the deterioration of the quality of nutrition in Tonga. The 2009 HIES shows that, 30% of food expenditures were on meat (mutton and poultry). Fruits represented only 6% of food expenditure, while vegetables accounted for 24%. The relatively high prices of fish, fruits and vegetables preclude a more balanced and nutritious diet. But countering this, many families have their own banana, mango, breadfruit trees.
The 2010 MDG Tracking report for the Pacific highlights that basic-needs poverty was of greater concern than food poverty (although many low-income families have been noted to be struggling to afford a minimally nutritious diet, Abbott, 2010). According to the HIES 2009, a considerable proportion of households are able to grow food in rural areas (90%, and 51% in urban areas). Rural households produced 29% of their food, while urban households produced only 10.9%. The tracking report also notes an increasing difficulty in raising the cash needed for non-food costs such as utilities. In Tonga, a large percentage of families either own their dwelling or live rent-free, and rent is only a minimal part of housing expenses. However, utilities, such as electricity and water, accounted for 45% of cash expenses on housing (HIES 2009).
MDG1:THEWAYFORWARD
• Timely data on poverty and hardship are needed to better inform policy decisions that specifically target the poor and disadvantaged.
• Indicators under MDG 1 have to be tailored to Tonga’s needs for the next MDG reporting.• Stronger investment in the private sector is needed to realize the national targets outlined in the NSPF, to foster
positive GDP growth and employment opportunities.• The gap between high imports and low exports needs to be reduced. • Local food production should be stimulated to combat unhealthy dietary patterns, and stronger policies and
regulatory environments are needed to achieve nation-wide nutritional changes.
Comparison of Proportion of Own Production in Food Consumption 2001 - 2009
% of HH Food Expenditure National Nuku’alofa Rest of Tongatapu Other Islands
Ranked by per capita HH expenditure deciles
2001 2009 2001 2009 2001 2009 2001 2009
Average all Households 20.7 24.1 13.8 10.3 20.5 23.5 25.9 36.6
Lowest Quintile 19.0 30.0 10.0 13.3 18.7 25.5 31.0 42.9
Lowest Three Deciles 18.9 29.7 9.9 12.1 16.2 25.5 27.9 42.1
Highest Quintile 23.5 18.0 19.1 8.3 23.2 20.4 27.2 29.0
T O N G A M i l l e n n i u m D e v e l o p m e n t G o a l s R e p o r t 19
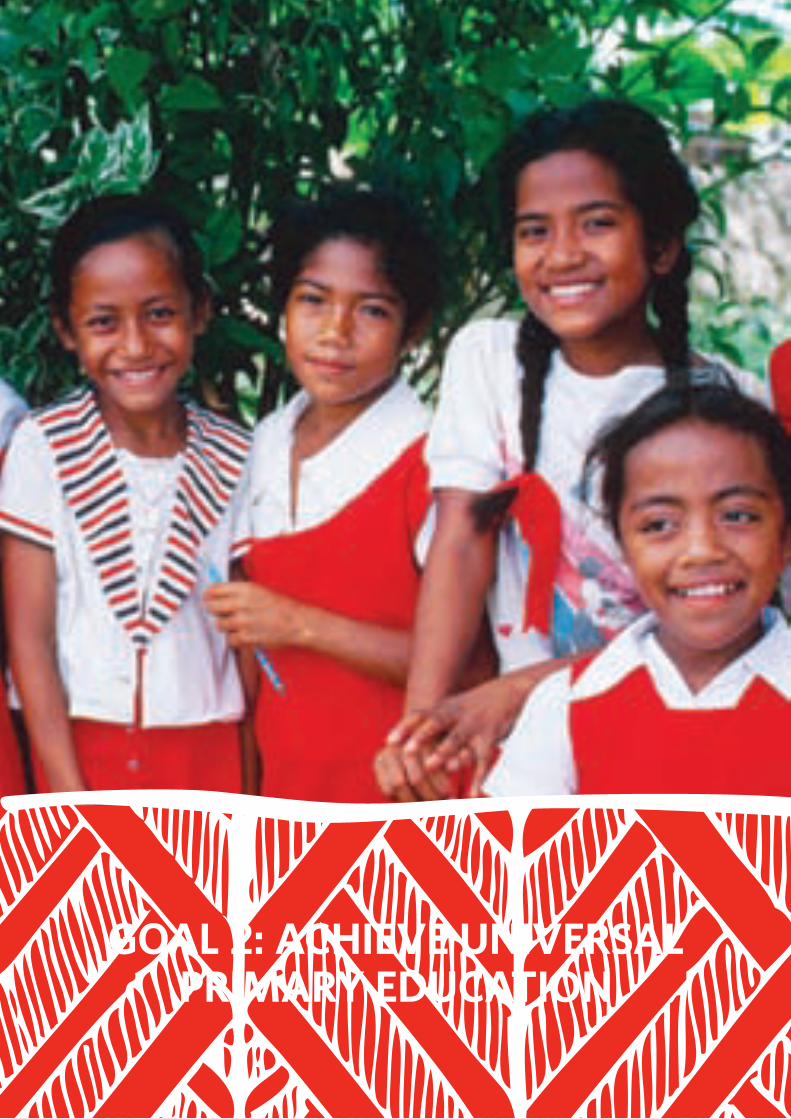
GOAL 2: ACHIEVE UNIVERSAL PRIMARY EDUCATION
T O N G A M i l l e n n i u m D e v e l o p m e n t G o a l s R e p o r t20
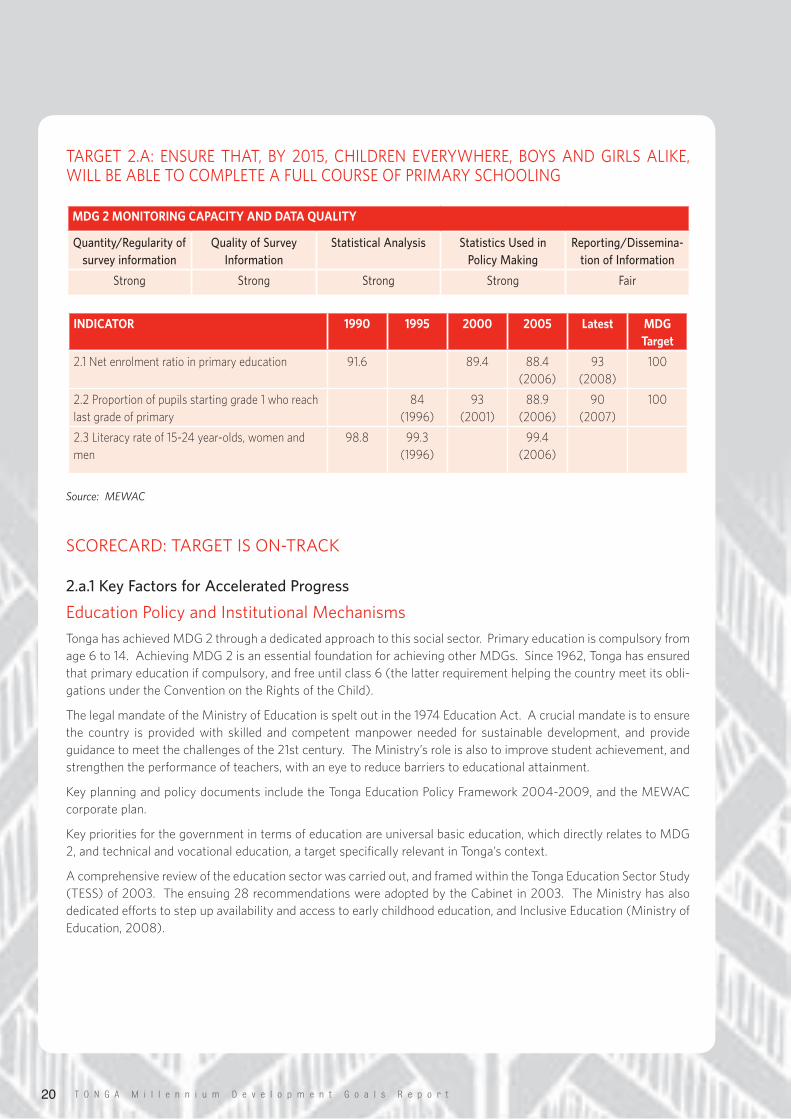
TARGET2.A: ENSURETHAT,BY2015,CHILDRENEVERYWHERE, BOYSANDGIRLSALIKE,WILLBEABLETOCOMPLETEAFULLCOURSEOFPRIMARYSCHOOLING
Source: MEWAC
SCORECARD:TARGETISON-TRACK
2.a.1 Key Factors for Accelerated Progress
EducationPolicyandInstitutionalMechanisms
Tonga has achieved MDG 2 through a dedicated approach to this social sector. Primary education is compulsory from age 6 to 14. Achieving MDG 2 is an essential foundation for achieving other MDGs. Since 1962, Tonga has ensured that primary education if compulsory, and free until class 6 (the latter requirement helping the country meet its obli-gations under the Convention on the Rights of the Child).
The legal mandate of the Ministry of Education is spelt out in the 1974 Education Act. A crucial mandate is to ensure the country is provided with skilled and competent manpower needed for sustainable development, and provide guidance to meet the challenges of the 21st century. The Ministry’s role is also to improve student achievement, and strengthen the performance of teachers, with an eye to reduce barriers to educational attainment.
Key planning and policy documents include the Tonga Education Policy Framework 2004-2009, and the MEWAC corporate plan.
Key priorities for the government in terms of education are universal basic education, which directly relates to MDG 2, and technical and vocational education, a target specifically relevant in Tonga’s context.
A comprehensive review of the education sector was carried out, and framed within the Tonga Education Sector Study (TESS) of 2003. The ensuing 28 recommendations were adopted by the Cabinet in 2003. The Ministry has also dedicated efforts to step up availability and access to early childhood education, and Inclusive Education (Ministry of Education, 2008).
MDG 2 MONITORING CAPACITY AND DATA QUALITY
Quantity/Regularity of survey information
Quality of Survey Information
Statistical Analysis Statistics Used in Policy Making
Reporting/Dissemina-tion of Information
Strong Strong Strong Strong Fair
INDICATOR 1990 1995 2000 2005 Latest MDG Target
2.1 Net enrolment ratio in primary education 91.6 89.4 88.4 (2006)
93 (2008)
100
2.2 Proportion of pupils starting grade 1 who reach last grade of primary
84 (1996)
93 (2001)
88.9 (2006)
90 (2007)
100
2.3 Literacy rate of 15-24 year-olds, women and men
98.8 99.3 (1996)
99.4 (2006)
T O N G A M i l l e n n i u m D e v e l o p m e n t G o a l s R e p o r t 21
It is recognized that the quality of education, even at the primary level, must be strengthened. Three Strategic Goals have been delineated to ensure quality education:1. To improve equitable access to and quality of universal basic education for all children in Tonga up to Year 8
(Form 2)2. To improve access to and quality post-basic education and training to cater to the different abilities and needs of
students3. To improve the administration of education and training so that the quality of education performance is en-
hanced
SchoolNetwork
The government runs 89% of primary schools in Tonga (a total of 112), and the rest are mostly operated by churches. Forty-six percent of schools are in Tongatapu, 5% in ‘Eua, 17% in Ha’apai, 28% in Vava’u, and 4% in the Niuas. In 2008, 90.1% of students attended government-run primary schools.
PTAs
Throughout the school system in Tonga, Parent Teacher Associations are in place to strengthen the role of the com-munity in the education sector. The main goal is to improve the learning conditions in schools. In particular they assist with renovations, maintenance, cost of utilities, and learning and teaching resources. PTAs help bridge the gap in funding resources. Although this participation constitutes a hardship for some families (the extent of which is unknown as there is no survey).
Scholarships
The aim of the Scholarship Program of the Government of Tonga is to support education overseas for those who need it. NZAID and AusAID are the main donors to support this program. In 2008, 22 males and 21 females received sup-port. In terms of fields of study, the largest share of awards supported Management and Administration, and health studies, while in 2008, Science and Technology, as well as commerce were predominant fields. Moreover, the NZAID Tonga In-Country Awards support students at post-secondary institutes in Tonga to meet the development needs of Tonga in terms of human resources.
DonorsandDevelopmentPartners
The Education Sector is supported by many donors, including NZAid, AUSAid, the Government of China, the Govern-ment of Japan, the World Bank, the European Union, PRIDE, and UNESCO.
2.a.2 Trends of Progress on Universal Primary Education
The net enrolment ratio in primary education has progressed upwards over the period 1990-2008, with a high start-ing point at 91.6% in 1990, and remains high at 93% in 2008, indicating near universal access to primary education. The gains made in education were sustained throughout the MDG assessment period.
Although the proportion of pupils who start Grade 1 and who go on to the last grade of primary is high, there is room for improvement. This suggests that school drop-out rates can be decreased further with increased investments in education to ensure that all students have adequate academic foundations to benefit from higher levels of schooling. The literacy rate is universal in Tonga among men and women age 15-24 years old, and this is observed throughout the MDG reporting period. The high literacy rate also confirms the good access to basic education in Tonga.
T O N G A M i l l e n n i u m D e v e l o p m e n t G o a l s R e p o r t22
2.a.3 Inequality Analysis
Although primary education is free in Tonga, there are growing concerns about how well the education sector reaches every segment of society. More disadvantaged sections of the population face increased difficulty in meeting the payment of extra fees that are necessary to ensure the functioning of schools (parents pay for school supplies for instance).
Inequalities in access to secondary education exist in the urban/rural differential, as educational levels were higher in the urban area than in rural areas. The proportion of the population aged 15 and older with a secondary educational qualification was 27%females, and 25% males, indicating slightly better results for females. While only 2–3% had a tertiary qualification, more than 60% had no qualification at all. About 8% had a vocational/professional qualification. Populations in the urban area had better qualifications than those in rural areas (2006 Census), reflecting access to qualified jobs.
Quality
Tonga’s education levels are high by international standards and in the Pacific region in particular. However, concerns about the quality of education are acknowledged by the Government (MEWAC), educators, teachers associations, donors and development partners.
To improve the quality of education in Tonga, the Ministry has set up a Quality and Assurance Control Office which monitors improvements in education through the Minimum Service Standards for Schools. The MSS sets standards and benchmarks that schools must meet in areas such as teaching methods, student achievements, learning environ-ments, and teaching and management capacity.
The Friendly Island Teachers Association (FITA)is concerned about the status of teachers, and their capacity to de-liver quality education.
At its 2010 annual meeting, FITA raised the following concerns:• Teachers not properly equipped to use technology in the classroom effectively• Recurring assessment of teachers that is not matched by proper training if shortfalls are identified• Inadequate mechanisms to encourage school drop-outs to return to school• Lack of in-service training systems for teachers to keep abreast of professional development
2.a.4
In the census, literacy was measured as the proportion of population aged 15–24 who are able to read and write a simple sentence. Almost everyone older than 10 years of age was literate in Tongan. Literacy in English was almost equally high as Tongan language skills for youth aged 10–14 years of age. It gradually declines after that, and is below 90% of the population at age 40–44 years, and further decrease by age. (Statistics Department, 2006)
In 2009/2010, the Tongan Ministry of Education undertook an Early Grade Reading Assessment (EGRA) which has clearly noted room for improvement in relation to the achievement of literacy primary school aged children. The results from the EGRA are being utilized to develop relevant literacy interventions for children in the early primary years.
2.a.5 Key Challenges in Education
In education, challenges are identified beyond primary education, in particular inequitable access to quality education in the secondary, and the link between educational outcomes and employment.
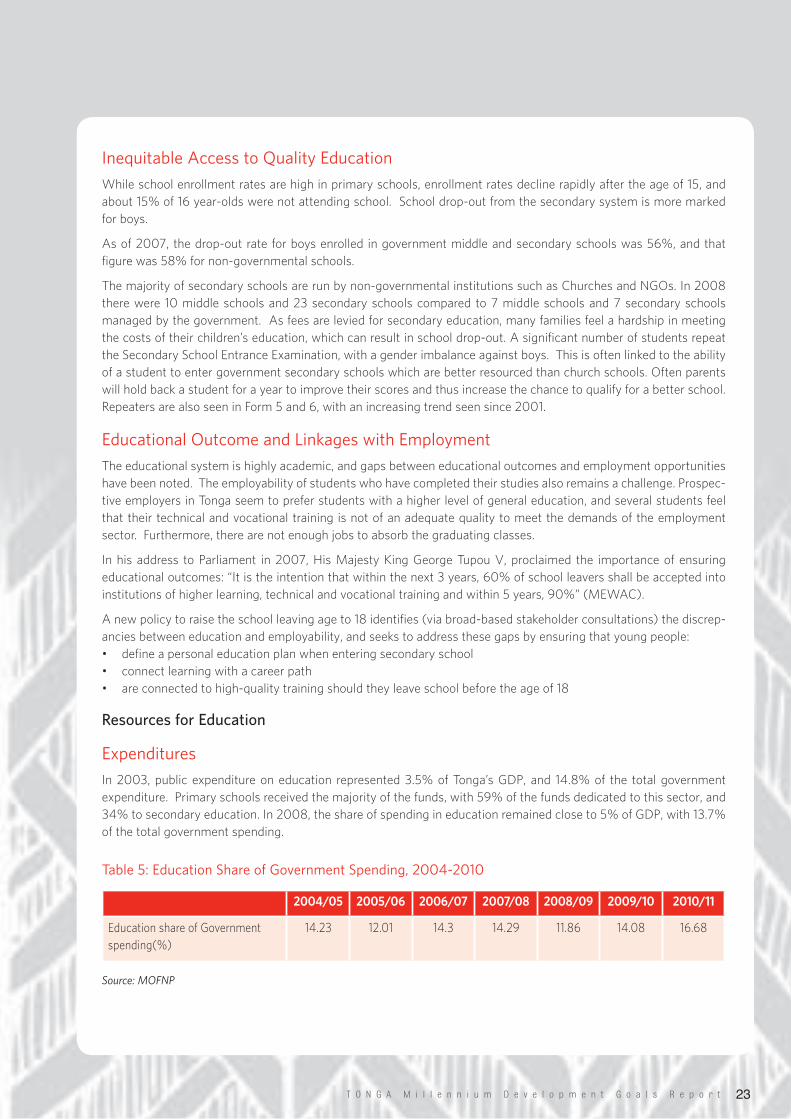
T O N G A M i l l e n n i u m D e v e l o p m e n t G o a l s R e p o r t 23
InequitableAccesstoQualityEducation
While school enrollment rates are high in primary schools, enrollment rates decline rapidly after the age of 15, and about 15% of 16 year-olds were not attending school. School drop-out from the secondary system is more marked for boys.
As of 2007, the drop-out rate for boys enrolled in government middle and secondary schools was 56%, and that figure was 58% for non-governmental schools.
The majority of secondary schools are run by non-governmental institutions such as Churches and NGOs. In 2008 there were 10 middle schools and 23 secondary schools compared to 7 middle schools and 7 secondary schools managed by the government. As fees are levied for secondary education, many families feel a hardship in meeting the costs of their children’s education, which can result in school drop-out. A significant number of students repeat the Secondary School Entrance Examination, with a gender imbalance against boys. This is often linked to the ability of a student to enter government secondary schools which are better resourced than church schools. Often parents will hold back a student for a year to improve their scores and thus increase the chance to qualify for a better school. Repeaters are also seen in Form 5 and 6, with an increasing trend seen since 2001.
EducationalOutcomeandLinkageswithEmployment
The educational system is highly academic, and gaps between educational outcomes and employment opportunities have been noted. The employability of students who have completed their studies also remains a challenge. Prospec-tive employers in Tonga seem to prefer students with a higher level of general education, and several students feel that their technical and vocational training is not of an adequate quality to meet the demands of the employment sector. Furthermore, there are not enough jobs to absorb the graduating classes.
In his address to Parliament in 2007, His Majesty King George Tupou V, proclaimed the importance of ensuring educational outcomes: “It is the intention that within the next 3 years, 60% of school leavers shall be accepted into institutions of higher learning, technical and vocational training and within 5 years, 90%” (MEWAC).
A new policy to raise the school leaving age to 18 identifies (via broad-based stakeholder consultations) the discrep-ancies between education and employability, and seeks to address these gaps by ensuring that young people:• define a personal education plan when entering secondary school• connect learning with a career path• are connected to high-quality training should they leave school before the age of 18
Resources for Education
Expenditures
In 2003, public expenditure on education represented 3.5% of Tonga’s GDP, and 14.8% of the total government expenditure. Primary schools received the majority of the funds, with 59% of the funds dedicated to this sector, and 34% to secondary education. In 2008, the share of spending in education remained close to 5% of GDP, with 13.7% of the total government spending.
Table5:EducationShareofGovernmentSpending,2004-2010
Source: MOFNP
2004/05 2005/06 2006/07 2007/08 2008/09 2009/10 2010/11
Education share of Governmentspending(%)
14.23 12.01 14.3 14.29 11.86 14.08 16.68
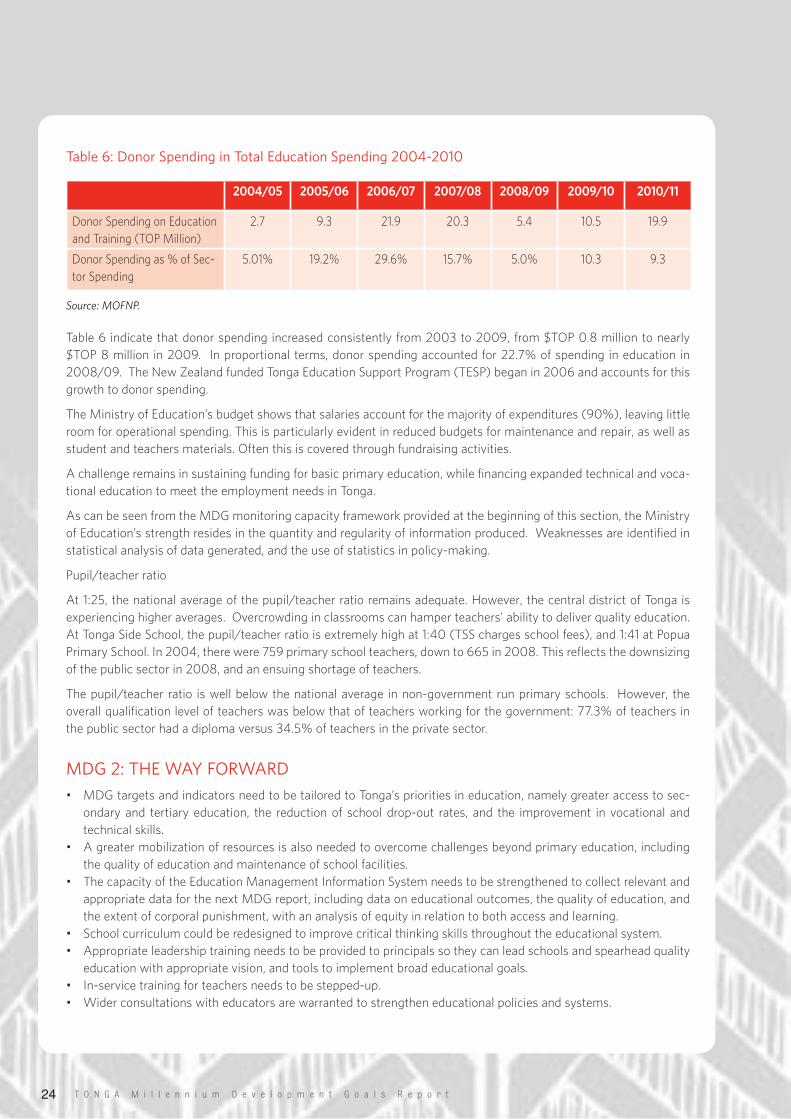
T O N G A M i l l e n n i u m D e v e l o p m e n t G o a l s R e p o r t24
Table6:DonorSpendinginTotalEducationSpending2004-2010
Source: MOFNP.
Table 6 indicate that donor spending increased consistently from 2003 to 2009, from $TOP 0.8 million to nearly $TOP 8 million in 2009. In proportional terms, donor spending accounted for 22.7% of spending in education in 2008/09. The New Zealand funded Tonga Education Support Program (TESP) began in 2006 and accounts for this growth to donor spending.
The Ministry of Education’s budget shows that salaries account for the majority of expenditures (90%), leaving little room for operational spending. This is particularly evident in reduced budgets for maintenance and repair, as well as student and teachers materials. Often this is covered through fundraising activities.
A challenge remains in sustaining funding for basic primary education, while financing expanded technical and voca-tional education to meet the employment needs in Tonga.
As can be seen from the MDG monitoring capacity framework provided at the beginning of this section, the Ministry of Education’s strength resides in the quantity and regularity of information produced. Weaknesses are identified in statistical analysis of data generated, and the use of statistics in policy-making.
Pupil/teacher ratio
At 1:25, the national average of the pupil/teacher ratio remains adequate. However, the central district of Tonga is experiencing higher averages. Overcrowding in classrooms can hamper teachers’ ability to deliver quality education. At Tonga Side School, the pupil/teacher ratio is extremely high at 1:40 (TSS charges school fees), and 1:41 at Popua Primary School. In 2004, there were 759 primary school teachers, down to 665 in 2008. This reflects the downsizing of the public sector in 2008, and an ensuing shortage of teachers.
The pupil/teacher ratio is well below the national average in non-government run primary schools. However, the overall qualification level of teachers was below that of teachers working for the government: 77.3% of teachers in the public sector had a diploma versus 34.5% of teachers in the private sector.
MDG2:THEWAYFORWARD
• MDG targets and indicators need to be tailored to Tonga’s priorities in education, namely greater access to sec-ondary and tertiary education, the reduction of school drop-out rates, and the improvement in vocational and technical skills.
• A greater mobilization of resources is also needed to overcome challenges beyond primary education, including the quality of education and maintenance of school facilities.
• The capacity of the Education Management Information System needs to be strengthened to collect relevant and appropriate data for the next MDG report, including data on educational outcomes, the quality of education, and the extent of corporal punishment, with an analysis of equity in relation to both access and learning.
• School curriculum could be redesigned to improve critical thinking skills throughout the educational system.• Appropriate leadership training needs to be provided to principals so they can lead schools and spearhead quality
education with appropriate vision, and tools to implement broad educational goals.• In-service training for teachers needs to be stepped-up.• Wider consultations with educators are warranted to strengthen educational policies and systems.
2004/05 2005/06 2006/07 2007/08 2008/09 2009/10 2010/11
Donor Spending on Education and Training (TOP Million)
2.7 9.3 21.9 20.3 5.4 10.5 19.9
Donor Spending as % of Sec-tor Spending
5.01% 19.2% 29.6% 15.7% 5.0% 10.3 9.3
T O N G A M i l l e n n i u m D e v e l o p m e n t G o a l s R e p o r t 25
GOAL 3: PROMOTE GENDER EQUALITY AND EMPOWER WOMEN
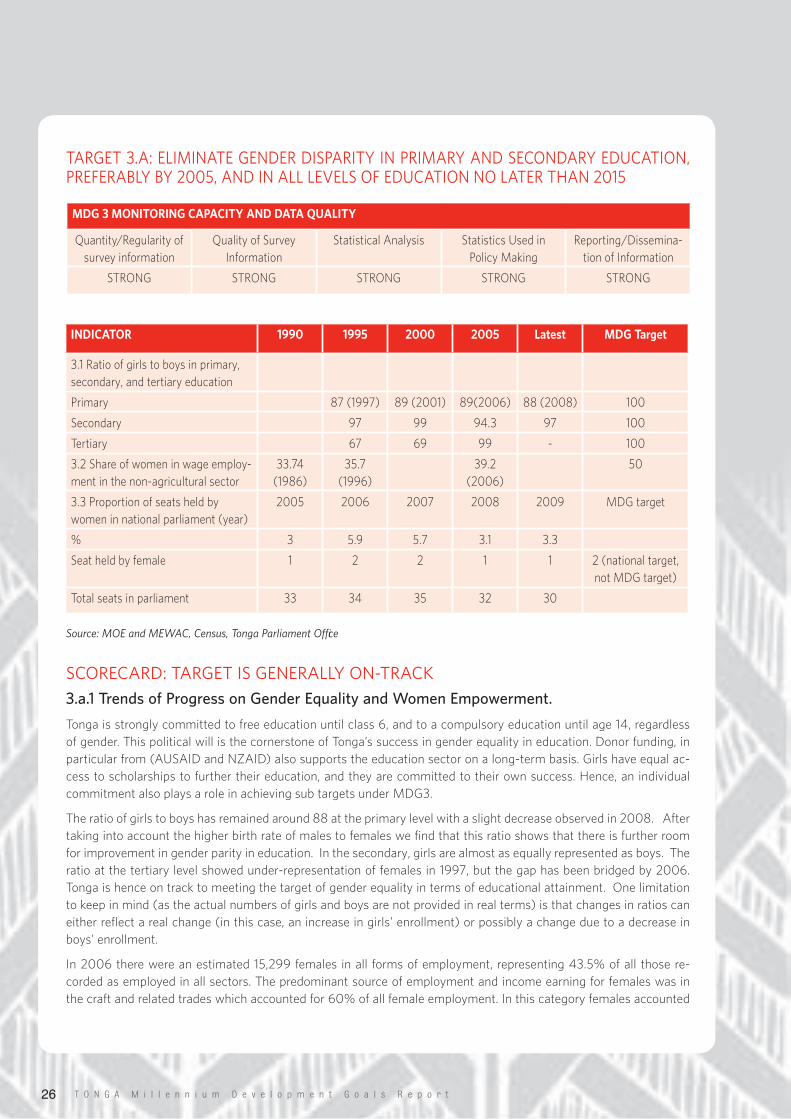
T O N G A M i l l e n n i u m D e v e l o p m e n t G o a l s R e p o r t26
TARGET3.A:ELIMINATEGENDERDISPARITYINPRIMARYANDSECONDARYEDUCATION,PREFERABLYBY2005,ANDINALLLEVELSOFEDUCATIONNOLATERTHAN2015
Source: MOE and MEWAC, Census, Tonga Parliament Office
SCORECARD:TARGETISGENERALLYON-TRACK
3.a.1 Trends of Progress on Gender Equality and Women Empowerment.
Tonga is strongly committed to free education until class 6, and to a compulsory education until age 14, regardless of gender. This political will is the cornerstone of Tonga’s success in gender equality in education. Donor funding, in particular from (AUSAID and NZAID) also supports the education sector on a long-term basis. Girls have equal ac-cess to scholarships to further their education, and they are committed to their own success. Hence, an individual commitment also plays a role in achieving sub targets under MDG3.
The ratio of girls to boys has remained around 88 at the primary level with a slight decrease observed in 2008. After taking into account the higher birth rate of males to females we find that this ratio shows that there is further room for improvement in gender parity in education. In the secondary, girls are almost as equally represented as boys. The ratio at the tertiary level showed under-representation of females in 1997, but the gap has been bridged by 2006. Tonga is hence on track to meeting the target of gender equality in terms of educational attainment. One limitation to keep in mind (as the actual numbers of girls and boys are not provided in real terms) is that changes in ratios can either reflect a real change (in this case, an increase in girls’ enrollment) or possibly a change due to a decrease in boys’ enrollment.
In 2006 there were an estimated 15,299 females in all forms of employment, representing 43.5% of all those re-corded as employed in all sectors. The predominant source of employment and income earning for females was in the craft and related trades which accounted for 60% of all female employment. In this category females accounted
MDG 3 MONITORING CAPACITY AND DATA QUALITY
Quantity/Regularity of survey information
Quality of Survey Information
Statistical Analysis Statistics Used in Policy Making
Reporting/Dissemina-tion of Information
STRONG STRONG STRONG STRONG STRONG
INDICATOR 1990 1995 2000 2005 Latest MDG Target
3.1 Ratio of girls to boys in primary, secondary, and tertiary education
Primary 87 (1997) 89 (2001) 89(2006) 88 (2008) 100
Secondary 97 99 94.3 97 100
Tertiary 67 69 99 - 100
3.2 Share of women in wage employ-ment in the non-agricultural sector
33.74 (1986)
35.7 (1996)
39.2 (2006)
50
3.3 Proportion of seats held by women in national parliament (year)
2005 2006 2007 2008 2009 MDG target
% 3 5.9 5.7 3.1 3.3
Seat held by female 1 2 2 1 1 2 (national target, not MDG target)
Total seats in parliament 33 34 35 32 30
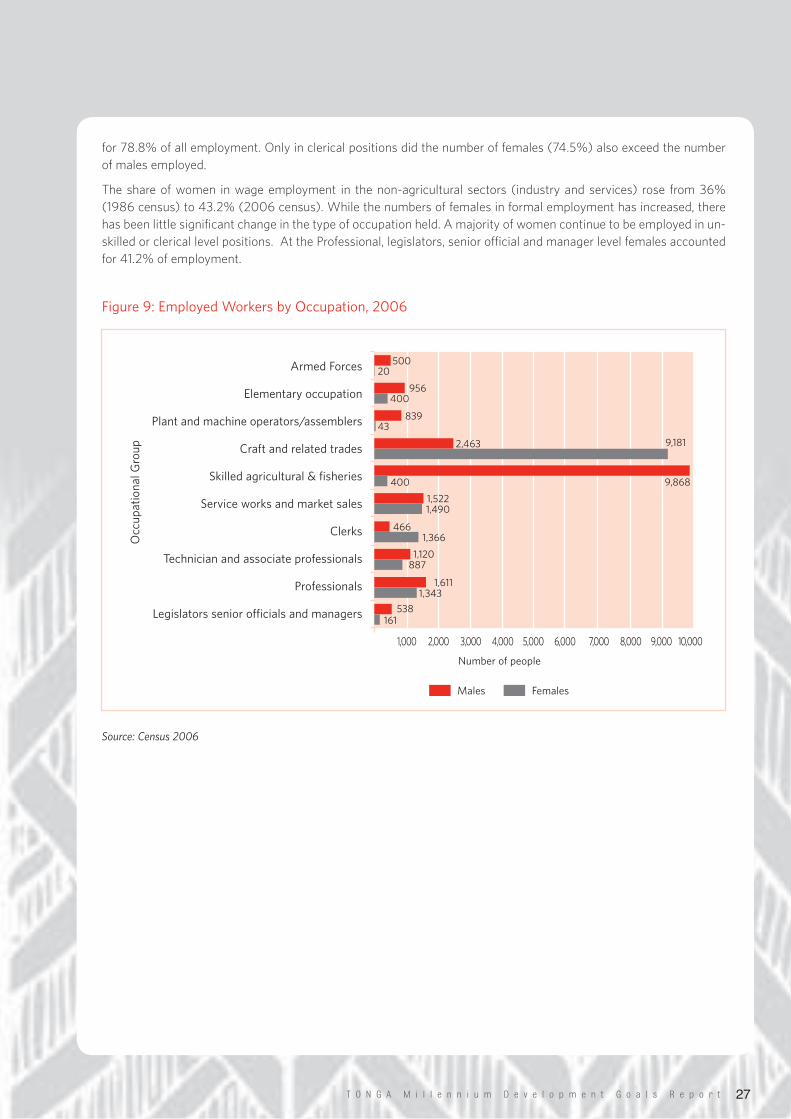
T O N G A M i l l e n n i u m D e v e l o p m e n t G o a l s R e p o r t 27
for 78.8% of all employment. Only in clerical positions did the number of females (74.5%) also exceed the number of males employed.
The share of women in wage employment in the non-agricultural sectors (industry and services) rose from 36% (1986 census) to 43.2% (2006 census). While the numbers of females in formal employment has increased, there has been little significant change in the type of occupation held. A majority of women continue to be employed in un-skilled or clerical level positions. At the Professional, legislators, senior official and manager level females accounted for 41.2% of employment.
Figure9:EmployedWorkersbyOccupation,2006
Source: Census 2006
1,000 2,000 3,000 7,0004,000 8,0005,000 9,0006,000 10,000
ArmedForces
Elementaryoccupation
Plantandmachineoperators/assemblers
Craftandrelatedtrades
Skilledagricultural&fisheries
Serviceworksandmarketsales
Clerks
Technicianandassociateprofessionals
Professionals
Legislatorsseniorofficialsandmanagers
Occ
upationa
lGroup
500
956
839
2,463
9,868
1,522
466
1,120
1,611
538
20
400
43
9,181
400
1,490
1,366
887
1,343
161
Males Females
Numberofpeople
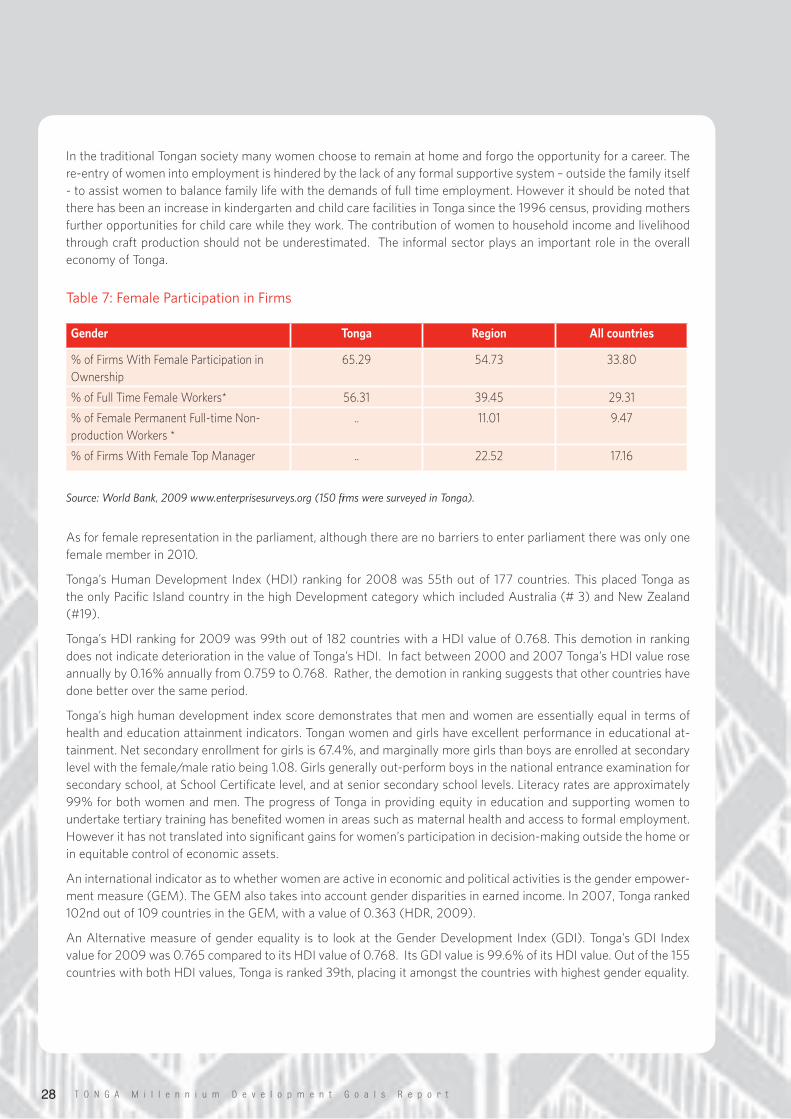
T O N G A M i l l e n n i u m D e v e l o p m e n t G o a l s R e p o r t28
In the traditional Tongan society many women choose to remain at home and forgo the opportunity for a career. The re-entry of women into employment is hindered by the lack of any formal supportive system – outside the family itself - to assist women to balance family life with the demands of full time employment. However it should be noted that there has been an increase in kindergarten and child care facilities in Tonga since the 1996 census, providing mothers further opportunities for child care while they work. The contribution of women to household income and livelihood through craft production should not be underestimated. The informal sector plays an important role in the overall economy of Tonga.
Table7:FemaleParticipationinFirms
Source: World Bank, 2009 www.enterprisesurveys.org (150 firms were surveyed in Tonga).
As for female representation in the parliament, although there are no barriers to enter parliament there was only one female member in 2010.
Tonga’s Human Development Index (HDI) ranking for 2008 was 55th out of 177 countries. This placed Tonga as the only Pacific Island country in the high Development category which included Australia (# 3) and New Zealand (#19).
Tonga’s HDI ranking for 2009 was 99th out of 182 countries with a HDI value of 0.768. This demotion in ranking does not indicate deterioration in the value of Tonga’s HDI. In fact between 2000 and 2007 Tonga’s HDI value rose annually by 0.16% annually from 0.759 to 0.768. Rather, the demotion in ranking suggests that other countries have done better over the same period.
Tonga’s high human development index score demonstrates that men and women are essentially equal in terms of health and education attainment indicators. Tongan women and girls have excellent performance in educational at-tainment. Net secondary enrollment for girls is 67.4%, and marginally more girls than boys are enrolled at secondary level with the female/male ratio being 1.08. Girls generally out-perform boys in the national entrance examination for secondary school, at School Certificate level, and at senior secondary school levels. Literacy rates are approximately 99% for both women and men. The progress of Tonga in providing equity in education and supporting women to undertake tertiary training has benefited women in areas such as maternal health and access to formal employment. However it has not translated into significant gains for women’s participation in decision-making outside the home or in equitable control of economic assets.
An international indicator as to whether women are active in economic and political activities is the gender empower-ment measure (GEM). The GEM also takes into account gender disparities in earned income. In 2007, Tonga ranked 102nd out of 109 countries in the GEM, with a value of 0.363 (HDR, 2009).
An Alternative measure of gender equality is to look at the Gender Development Index (GDI). Tonga’s GDI Index value for 2009 was 0.765 compared to its HDI value of 0.768. Its GDI value is 99.6% of its HDI value. Out of the 155 countries with both HDI values, Tonga is ranked 39th, placing it amongst the countries with highest gender equality.
Gender Tonga Region All countries
% of Firms With Female Participation in Ownership
65.29 54.73 33.80
% of Full Time Female Workers* 56.31 39.45 29.31
% of Female Permanent Full-time Non-production Workers *
.. 11.01 9.47
% of Firms With Female Top Manager .. 22.52 17.16
T O N G A M i l l e n n i u m D e v e l o p m e n t G o a l s R e p o r t 29
3.a.2 Key Bottlenecks Constraining Progress to Gender Equality and Empowerment
LegalFramework
In 1951, Her Majesty Queen Salote Tupou III amended the Constitution to grant women the right to vote and stand as candidates. The law thus doesn’t bar women from voting or running for office.
Since 1951, only four women have been elected to Parliament. This was started by H.R.H Princess Siu’ilikutapu (1975 -1977), followed by Papiloa Foliaki (1978-1980), ‘Ofa Fusitu’a (1993-1995) and Lepolo Taunisila (2005-2007). In 2006 a woman was appointed for the first time a Cabinet Minister, ‘Alisi Taumoepeau as Minister of Justice. No women were elected representatives in the 2008 elections, but there was one King-appointed female Minister hold-ing the Justice Portfolio. Currently, Hon. ‘Eseta Fusitu’a, is appointed Minister for Information and Communication. The ministerial appointment confers the right to sit in parliament.
Langafonua ‘a Fafine coordinated a consultative process with funding from WAC to submit a request for a quota system to reserve three seats for women in parliament. The coalition of NGOs submitted a petition to this effect; however, the request was not supported by the communities during the public consultation. The Tongan Women’s National Congress held a workshop in 2009 to review and discuss options for Temporary Special Measures to be introduced for the 2010 elections. A petition of more than 700 signatures was presented by male and female gender advocates (the minimum needed was 200) to present a submission for 30 percent of the seats in Parliament and 30 percent of the Cabinet positions to be reserved for women, with Temporary Affirmative Measures to be put in place for four terms. The request was declined.
It should be noted that there is no freehold land in Tonga and that land is inalienable. The highest form of property rights that one holds in Tonga is a life interest. By entrenching succession to registered family land holdings, (which are in effect life-long leases) through the oldest male child and prohibiting its alienability, Tonga virtually guarantees that the registered family lands remain in Tongan hands in perpetuity.
It should also be noted that although Tonga’s laws governing succession to family land holdings may seem to be discriminating against women, in the same vein it can be deemed to be discriminating against younger male siblings. However it should be emphasized that women have the same rights as men to lease land, and lease holdings are definitely a more attractive alternative for both women and men, because they are not legally obliged to bequeath the lease to the oldest male child, but are free to transfer it to a daughter, even if there are male heirs.
CEDAW
In September 2009, Tonga’s Legislative Assembly voted as to the ratification of CEDAW. The main reason for the decision not to ratify CEDAW is because Tonga wants to reserve the right not to apply provisions of Article 2 of CE-DAW to the succession to the Tongan Throne and succession to Nobility and hereditary titles, and succession in our land laws.
If we were to ratify CEDAW Tonga would have to amend clause 32 of its Constitution which specifies that succession to the throne shall be to the eldest male child and the heirs of his body, so as to allow the female child to ascend to the Throne if she is the eldest.
Similar amendments would have to be made to clause 111 of Tonga constitution and Section 82 of the land Act to enable the female child to inherit hereditary titles and estates as well as registered tax and town allotments, if she is the oldest child.
There have been suggestions that Tonga can go ahead and ratify CEDAW with reservations. Unfortunately the key Articles on which Tonga has reservations, viz Article 2 and Article 16, have been held by the committee on the Elimi-nation of Discrimination Against Women as central to the object and purpose of CEDAW, and states very clearly that any “reservations on them are “impermissible” under Article 28 (2) which states very clearly that any “…reservation incompatible with the object and purpose of the present Convention shall not be permitted.”
T O N G A M i l l e n n i u m D e v e l o p m e n t G o a l s R e p o r t30
It should be emphasized that the fact that Tonga has made a decision not to ratify CEDAW should not be misinter-preted as Tonga refusing to recognize, promote and protect women’s rights. In 2007 Tonga amended its Nationality Act to allow Tongan women who marry non-Tonga citizens, and their children, to retain their Tongan nationality. In 2010 the Tonga Government made a policy decision to amend its lands laws so as to allow the oldest female child in situations where there is no male heir to register the family allotment and to pass that on to her oldest male child when he comes of age.
These examples attest to the fact that the legislative Assembly and the Government supports women’s rights and are doing something about it.
Socio-CulturalBarriers
At the community level, women are very engaged in leading, organizing and implementing activities, playing an im-portant leadership role. Women have taken up work outside of the home, and many are head of households. While many women can be found in the civil service workforce, women in leadership positions are lacking in Tonga (Khan, 2009).
The traditional view that decision-making and politics is a man’s job is predominant in Tonga, reducing opportunities for women to compete in politics. As, with most countries strong societal norms exist where women are the primary care-givers in the home. This negatively affects women’s ability to realize that other options are available to them and to seek other paths, including political involvement (Nelson, 2008).
A result of conservative views about women’s roles is that women themselves don’t support other women standing for elections, compounding difficulties to raise campaign funds, building momentum for campaigns, and obtaining women’s actual votes (Langafonua ‘a Fafine, 2005).
DomesticViolence
Although domestic violence is not an official indicator of gender empowerment, it underpins and exacerbates gender inequalities, acting as a key constraint to progress forward.
In 2008, Ma’aFafinemo e Famili conducted a national survey on domestic violence.2 The study included Tongatapu, ‘Eua, Ha’apai, and Vava’u. The study set out to estimate the prevalence of physical, sexual, and emotional violence against women (which is the WHO definition of domestic violence against women). The study reports the following results for prevalence of domestic violence nationally:
• For ever-partnered women, the lifetime prevalence of physical violence by an intimate partner was 33%.• Ever-partnered women reported 11% moderate physical violence and 23% severe physical violence.• The lifetime prevalence of sexual violence by an intimate partner was 17%.• The lifetime prevalence of physical or sexual violence, or both by an intimate partner was 40%. • The lifetime prevalence of emotional partner violence was 24%.• The lifetime prevalence of non partner violence was 68%.• Experience of sexual violence before the age of 15 was 4%.• For ever-partnered women experiencing physical violence, 26% reported that they were ever injured.• 22% of women experiencing physical violence were beaten while pregnant.• Only 12% of ever-partnered women seek out help.
The study concluded that the main cause of domestic violence nationally was founded on the shifting values of ex-tended family life. But the major contributing factors for violence in Tongatapu included excessive consumption of al-cohol, extra-marital affairs, and changing kinship relationships. On the outer islands, these factors are also found, with the addition of economic factors. The most common form of violence against women in Tonga is physical beating.
2 The survey was funded by AusAID . The quantitative component of the study was based on the WHO methodology of the Multi-Country Study on violence against women and their health, and a qualitative study based on Tongan methodology of Talanoa moeNofo. The study sampled six percent of the female population aged 15-49 (reproductive age), with a total of 1,000 women from all island groups, but only 83% completed the Household Interview. The number of ever-partnered women was 455. The qualitative study included 38 participants. The study was conducted from the women’s perspective only.
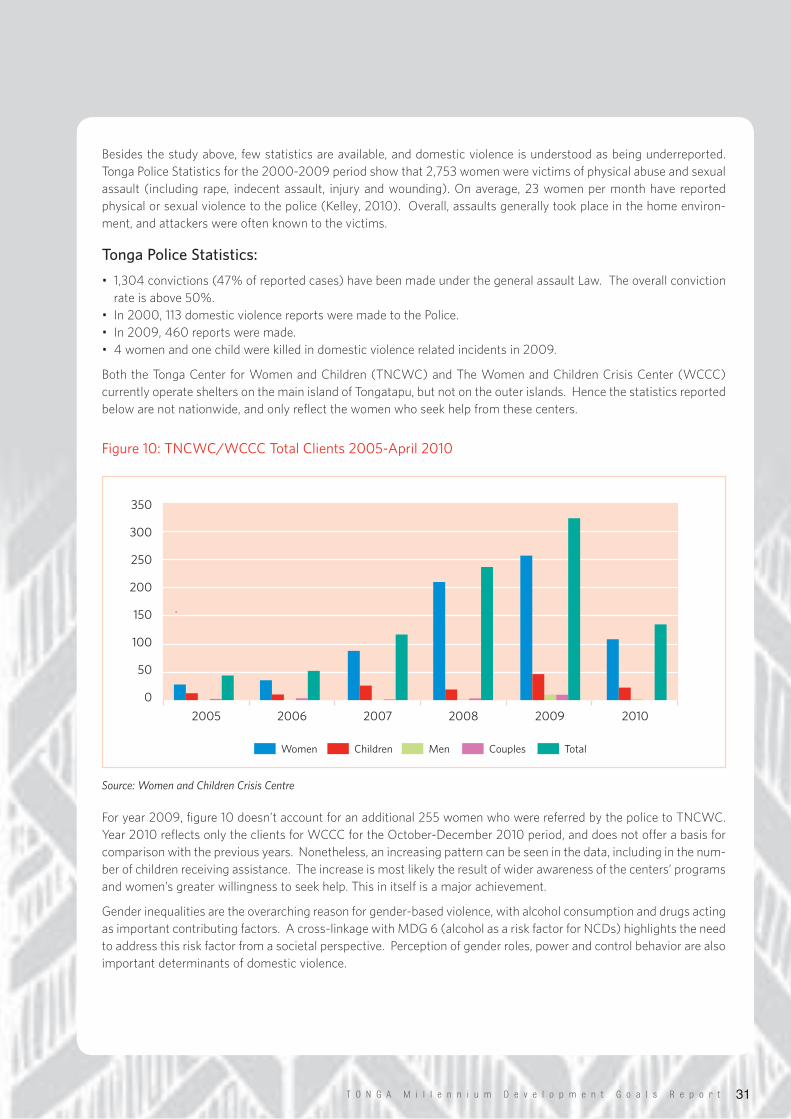
T O N G A M i l l e n n i u m D e v e l o p m e n t G o a l s R e p o r t 31
Besides the study above, few statistics are available, and domestic violence is understood as being underreported. Tonga Police Statistics for the 2000-2009 period show that 2,753 women were victims of physical abuse and sexual assault (including rape, indecent assault, injury and wounding). On average, 23 women per month have reported physical or sexual violence to the police (Kelley, 2010). Overall, assaults generally took place in the home environ-ment, and attackers were often known to the victims.
Tonga Police Statistics:
• 1,304 convictions (47% of reported cases) have been made under the general assault Law. The overall conviction rate is above 50%.
• In 2000, 113 domestic violence reports were made to the Police. • In 2009, 460 reports were made.• 4 women and one child were killed in domestic violence related incidents in 2009.
Both the Tonga Center for Women and Children (TNCWC) and The Women and Children Crisis Center (WCCC) currently operate shelters on the main island of Tongatapu, but not on the outer islands. Hence the statistics reported below are not nationwide, and only reflect the women who seek help from these centers.
Figure10:TNCWC/WCCCTotalClients2005-April2010
Source: Women and Children Crisis Centre
For year 2009, figure 10 doesn’t account for an additional 255 women who were referred by the police to TNCWC. Year 2010 reflects only the clients for WCCC for the October-December 2010 period, and does not offer a basis for comparison with the previous years. Nonetheless, an increasing pattern can be seen in the data, including in the num-ber of children receiving assistance. The increase is most likely the result of wider awareness of the centers’ programs and women’s greater willingness to seek help. This in itself is a major achievement.
Gender inequalities are the overarching reason for gender-based violence, with alcohol consumption and drugs acting as important contributing factors. A cross-linkage with MDG 6 (alcohol as a risk factor for NCDs) highlights the need to address this risk factor from a societal perspective. Perception of gender roles, power and control behavior are also important determinants of domestic violence.
350
300
250
200
150
100
50
0
2005 2006 2007 2008 2009 2010
Women Children Couples TotalMen
T O N G A M i l l e n n i u m D e v e l o p m e n t G o a l s R e p o r t32
Gender-Mainstreaming
While the census provides basic gender disaggregation, overall, as seen throughout this second MDG report, sta-tistics could be better disaggregated to mainstream a gender perspective into data, policy decisions, programs, and implementation activities. There is a need to better understand how gender-based factors affect men and women in how they access resources, how their social conditions or economic activities are affected.
The Ministry of Education has indicated that gender mainstreaming would be integrated in the school curriculum as part of curriculum reform. Tonga Police are looking to introduce an anti-violence curriculum in schools over the next two years to raise awareness in schools on gender violence. NGOs are also discussing the integration of gender mainstreaming into national planning tools.
Overall, gender is not incorporated as a budget analysis variable to reflect gender gaps and needs. Also, donors do not necessarily include gender dimensions in their programs, or in high-level policy discussions, reflecting that gender disparities are not seen as significant in Tonga and therefore the Government and donors do not need in general to highlight gender in their programs.
3.a.3 Efforts and Responses
Legal and Policy Framework
Gender
A National Policy on Gender and Development was initiated in 2002 to ensure women’s rights in the overall develop-ment process. The policy intends to guide Strategic Development Plans, Corporate and Annual Management Plans of Governments and NGOs.
The policy requires the establishment of Gender Focal points in government and non-government organizations. This was approved by a Cabinet Decision in July 1999, and amended in 2009 to include key Stakeholder Ministries and Organizations.
Gender-BasedViolence
Weaknesses in the current legislation to address violence against women are noted, in particular:• Rape is still limited to penile penetration with any other form of sexual violence falling under the offence of indecent
assault which attracts a lesser penalty• Abolition of the requirement for corroboration in rape cases through case law only and not through legislation• Marital rape is not criminalized - 1999 amendment to section 118(2) of the Criminal Offenses Act
However, some policies exist to respond to gender-based violence. In 2007, the Police Domestic Violence Unit (DVU) was established and is overseen by the Tonga Police National Domestic Violence Committee. A specialist Domestic Violence Officer has been appointed in every police district in Tonga.
The DVU implements a No Drop Policy, meaning that it is not possible to reconcile or drop charges at the police station once charges have been filed. Cases must progress to a judicial hearing and be settled in court, which institu-tionalizes the mechanisms for dealing with domestic violence.
A Domestic Violence Response Policy is being drafted by the Police, with broad opportunities for feedback. The policy’s purpose is to “allow all members of all communities to live in a violence-free environment”. It also aims to strengthen police officers’ skills to respond to gender-based violence.
Moreover, in May 2010, the Ministry of Education, Women’s Affairs and culture and the Secretariat of the Pacific Community initiated a joint project where a Country Focal Officer is based at the Women’s Affairs division. This proj-ect includes advocacy and lobbying on violence against women as well as policy and legislation reviews.
T O N G A M i l l e n n i u m D e v e l o p m e n t G o a l s R e p o r t 33
Institutional Mechanisms
Government
The Office of Women Affairs within the Ministry of Education is the main institutional mechanism overseeing gender issues. The Office has undertaken consultations with key stakeholders and has delineated the following priorities in respect to MDG 3:• Women in high decision-making levels• Women’s economic empowerment
In November 2009, Tonga hosted the Secretariat for the Pacific Community CEDAW Regional Workshop for Non-Ratifying countries in the Pacific. A comparison exercise was carried out to analyze CEDAW articles in view of the current Tongan legislation. The division also works to promote equal access and participation in decision-making at work, home, and in society.
The following activities aim at supporting this goal:• Awareness training of Tonga’s political system and the importance of voting for men and women• Training for potential parliamentary women candidates in politics and good governance• Advocacy to support women in decision-making levels
Another objective of Women’s Affairs is to improve the collection and dissemination of information on women and gender issues.
CivilSociety
Langafonua ‘a Fafine (meaning “nation building by women”) is an umbrella group for women’s groups in Tonga to work on development and gender issues.
In 2004, Langafonua launched a program to increase women’s participation in governance in Tonga, with a focus on voter education (funded by UNIFEM and the Prime Minister’s office) and promoting women to run as candidates in the 2005 elections (funded by AusAID). Voter education targeted both men and women, as there was little aware-ness about the importance of voting. Even though no women were elected to parliament in 2005 and 2008, voters became more aware of women running for parliament, their ability to run effective campaigns understand Tonga’s issues and needs.
Several organizations address the more specific issue of gender-based violence, and child abuse. These include the Tonga National Center for Women and Children, the Women and Children Crisis Center, and the Catholic Women’s League of Tonga. These organizations have identified cultural attitudes towards women as one of the greatest barriers impeding gender equality.
The Tonga National Center for Women and Children was created in the mid-nineties. The Legal Literacy Project of the Catholic Women’s League was instrumental in establishing the center and the safe house for women, and the center became a national center in 2000. The center also conducts many outreach activities in communities to raise aware-ness on domestic violence, provides counseling, and visits to victims of abuse. TNCWC is in part financially supported by the Government of Tonga, through the Office of Women Affairs.
Another NGO, the Ma’a Fafine mo e Famili (For Women and Families) is also the product of the Catholic Women’s League and Legal Literacy Project. They aim at empowering women’s knowledge of their Human Rights to improving their economic, social and political knowledge, skills, health and status in society.
WCCC has initiated a program called The Inspiring Young Emerging Leaders (I-YEL), a one year training program aimed at forming advocates for human rights with a focus on children’s rights, environmental and social change, and the elimination of violence against women and children. The programs intend to provide leadership skills, a platform to explore career options, and goal setting.
T O N G A M i l l e n n i u m D e v e l o p m e n t G o a l s R e p o r t34
Tongan Male Advocates for Gender
“First, we ourselves have to be role models and to lead by example so we are respected as male advocates who also walk the talk.” ‘Usaia Hemaloto, WCCC
“I will tell my brothers and sisters about the negative impact of domestic violence. Male advocacy should start at home.” Tito Kivalu, Probation Officer, Tonga
Source: Pacific Women’s Network Against Violence Against Women, Vol. 13, June 2010
An important aspect of civil society work in gender equality and empowerment is the involvement of men. TNCWC has initiated consultations and workshops to encourage male advocacy. Working through the Pacific Women’s Net-work Against Violence Against Women program, WCCC helped Tongan men undertake three rounds of training. The advocacy program is currently producing a handbook to help men better communicate gender issues, in particular in response to religious and cultural beliefs.
MDG3:THEWAYFORWARD
• Obtaining better sex-disaggregated data and mainstream the results for better policy-making• Making a better use of data in policy development on gender• Mainstreaming gender in the national planning process and budgeting• Stepping up the prevention of gender-based and domestic violence • Adopting specific legislation to combat violence against women and children to strengthen the legal environment
beyond policies. There is a need for a national, multi-sectoral gender-based violence/violence against women policy as a police policy is insufficient to deal with these issues.
T O N G A M i l l e n n i u m D e v e l o p m e n t G o a l s R e p o r t 35
GOAL 4: REDUCE CHILD MORTALITY
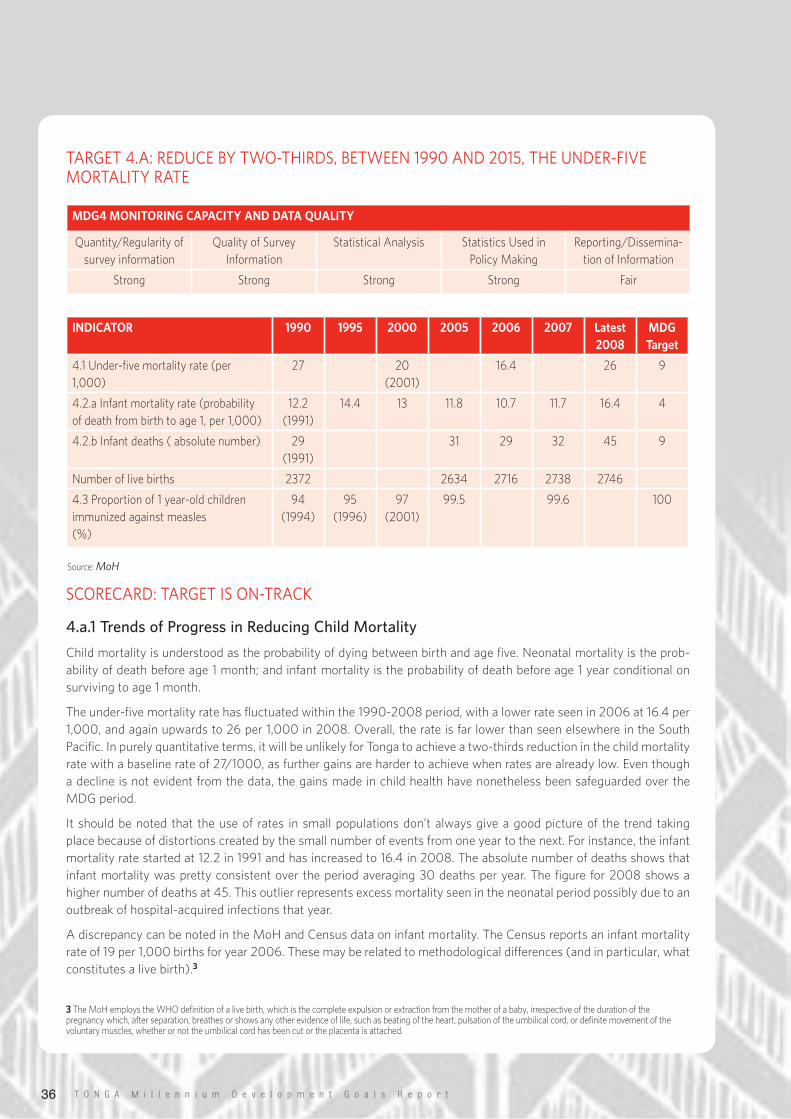
T O N G A M i l l e n n i u m D e v e l o p m e n t G o a l s R e p o r t36
MDG4 MONITORING CAPACITY AND DATA QUALITY
Quantity/Regularity of survey information
Quality of Survey Information
Statistical Analysis Statistics Used in Policy Making
Reporting/Dissemina-tion of Information
Strong Strong Strong Strong Fair
SCORECARD:TARGETISON-TRACK
4.a.1 Trends of Progress in Reducing Child Mortality
Child mortality is understood as the probability of dying between birth and age five. Neonatal mortality is the prob-ability of death before age 1 month; and infant mortality is the probability of death before age 1 year conditional on surviving to age 1 month.
The under-five mortality rate has fluctuated within the 1990-2008 period, with a lower rate seen in 2006 at 16.4 per 1,000, and again upwards to 26 per 1,000 in 2008. Overall, the rate is far lower than seen elsewhere in the South Pacific. In purely quantitative terms, it will be unlikely for Tonga to achieve a two-thirds reduction in the child mortality rate with a baseline rate of 27/1000, as further gains are harder to achieve when rates are already low. Even though a decline is not evident from the data, the gains made in child health have nonetheless been safeguarded over the MDG period.
It should be noted that the use of rates in small populations don’t always give a good picture of the trend taking place because of distortions created by the small number of events from one year to the next. For instance, the infant mortality rate started at 12.2 in 1991 and has increased to 16.4 in 2008. The absolute number of deaths shows that infant mortality was pretty consistent over the period averaging 30 deaths per year. The figure for 2008 shows a higher number of deaths at 45. This outlier represents excess mortality seen in the neonatal period possibly due to an outbreak of hospital-acquired infections that year.
A discrepancy can be noted in the MoH and Census data on infant mortality. The Census reports an infant mortality rate of 19 per 1,000 births for year 2006. These may be related to methodological differences (and in particular, what constitutes a live birth).3
TARGET4.A:REDUCEBYTWO-THIRDS,BETWEEN1990AND2015,THEUNDER-FIVEMORTALITYRATE
3 The MoH employs the WHO definition of a live birth, which is the complete expulsion or extraction from the mother of a baby, irrespective of the duration of the pregnancy which, after separation, breathes or shows any other evidence of life, such as beating of the heart, pulsation of the umbilical cord, or definite movement of the voluntary muscles, whether or not the umbilical cord has been cut or the placenta is attached.
INDICATOR 1990 1995 2000 2005 2006 2007 Latest2008
MDG Target
4.1 Under-five mortality rate (per 1,000)
27 20 (2001)
16.4 26 9
4.2.a Infant mortality rate (probability of death from birth to age 1, per 1,000)
12.2 (1991)
14.4 13 11.8 10.7 11.7 16.4 4
4.2.b Infant deaths ( absolute number) 29(1991)
31 29 32 45 9
Number of live births 2372 2634 2716 2738 2746
4.3 Proportion of 1 year-old children immunized against measles (%)
94 (1994)
95 (1996)
97 (2001)
99.5 99.6 100
Source: MoH
T O N G A M i l l e n n i u m D e v e l o p m e n t G o a l s R e p o r t 37
The strength of the health system and the country’s commitment to MDG 4 can also be seen in the consistently high proportion of 1-year olds immunized against measles, with universal coverage in 2007. The immunization program is very strong in Tonga, and has enabled wide gains in reducing vaccine-preventable diseases. The achievements made in maintaining a low rate of child mortality over the period relate to socioeconomic development, various child survival interventions, women’s literacy, and reduced maternal mortality under MDG 5.
4.a.2 Inequality Analysis
The under-five mortality and infant mortality rates are not disaggregated by region or sex, hence it is not possible to offer perspectives on potential pockets of inequality. A full understanding of the causes of child and infant mortality is however necessary to achieve further reduction in mortality (with the caveat outlined above).
Globally, the leading cause of death in children under-five were infectious diseases, especially pneumonia, diarrhea, and malaria, with pre-term birth complications being the single most important causes. This cause distribution of deaths is also seen in Tonga. Per the Ministry of Health Annual Report 2008, the prenatal mortality rate was 20 per 1000, and the neonatal mortality rate was 10.6. The prenatal mortality rate shows that further gains could be made if interventions target this particular age group.
For Tonga, a Lancet study reports a total of 56 deaths under five years of age (25 cases in the 0-27 days age group, and 31 in the 1-59 months group).Four deaths were due to diarrhea, 9 due to pneumonia, 7 to other infections, 11 to preterm birth complications, 5 to birth asphyxia, 1 to neonatal sepsis, 9 to congenital abnormalities, 7 to other non-communicable diseases, and 4 to injury.
4.a.3 Key Bottlenecks Constraining Progress on MDG 4
The vital registration system could be improved to reduce, or perhaps eliminate, bias errors. However, a true assess-ment of the vital registration system requires more complete data and disaggregation.
Data quality on child mortality, although improved, remains somewhat problematic. The School of Public Health at the University of Queensland is collaborating with the Health Information Unit of the Ministry of Health to improve data quality and gain a better understanding of underlying causes of child and infant mortality.4 For instance, discrep-ancies can be found between mortality figures in the census and Ministry of Health figures.
Although Tonga codes mortality well, some under-reporting within the MoH data and in the civil registries has been detected. Overall, as seen above, there is no real change in mortality figures, and most of the variation seen is due to single-year estimates. One of the recommendations of the School of Public health is for Tonga to undertake data aggregation in the form of 5-year windows to reduce stochastic variation (i.e., to reduce the change that is not true change).
In the last few years, the MoH has made substantial efforts to improve data collection, reporting, and making a better use of data, but this area still needs strengthening. Nurses are not allowed to complete death certificates, which is the responsibility of medical doctors. All death certificates are coded and searchable. Community nurses complete forms that they attach to their reports, and these are centrally processed.
One of the central issues for MDG 4 is unraveling the extent of underreporting, and the variations that occur (by age, sex, and location) to provide the necessary responses.
4 Communication with Karen Carter. Strengthening Mortality and Cause of Death Reporting in Pacific Island Health Information Systems, project conducted by Professor Richard Taylor. School of Public Health, the University of Queensland. June 2010.
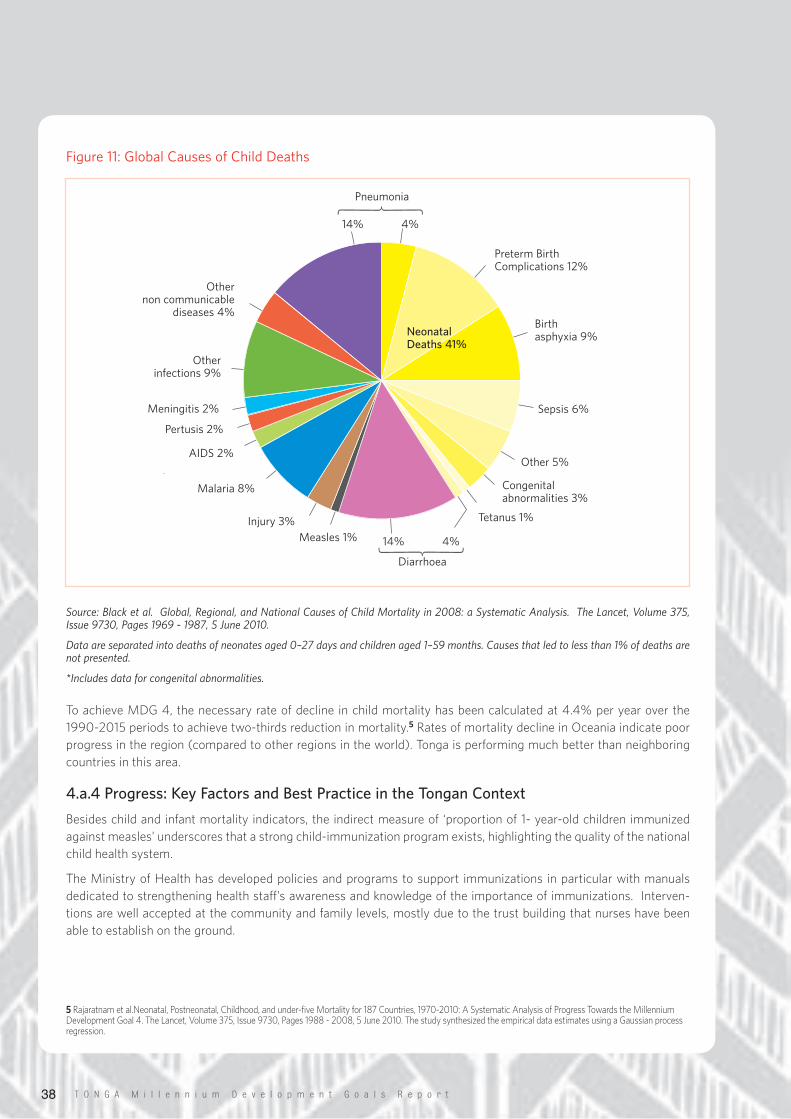
T O N G A M i l l e n n i u m D e v e l o p m e n t G o a l s R e p o r t38
Figure11:GlobalCausesofChildDeaths
Source: Black et al. Global, Regional, and National Causes of Child Mortality in 2008: a Systematic Analysis. The Lancet, Volume 375, Issue 9730, Pages 1969 - 1987, 5 June 2010.
Data are separated into deaths of neonates aged 0–27 days and children aged 1–59 months. Causes that led to less than 1% of deaths are not presented.
*Includes data for congenital abnormalities.
To achieve MDG 4, the necessary rate of decline in child mortality has been calculated at 4.4% per year over the 1990-2015 periods to achieve two-thirds reduction in mortality.5 Rates of mortality decline in Oceania indicate poor progress in the region (compared to other regions in the world). Tonga is performing much better than neighboring countries in this area.
4.a.4 Progress: Key Factors and Best Practice in the Tongan Context
Besides child and infant mortality indicators, the indirect measure of ‘proportion of 1- year-old children immunized against measles’ underscores that a strong child-immunization program exists, highlighting the quality of the national child health system.
The Ministry of Health has developed policies and programs to support immunizations in particular with manuals dedicated to strengthening health staff’s awareness and knowledge of the importance of immunizations. Interven-tions are well accepted at the community and family levels, mostly due to the trust building that nurses have been able to establish on the ground.
Pneumonia
NeonatalDeaths 41%
Diarrhoea
PretermBirthComplications12%
Birthasphyxia9%
Sepsis6%
Other5%
Congenitalabnormalities3%
Tetanus1%
Measles1%Injury3%
Malaria8%
AIDS2%
Pertusis2%
Meningitis2%
Otherinfections9%
14%
14%
4%
4%
Othernoncommunicable
diseases4%
5 Rajaratnam et al.Neonatal, Postneonatal, Childhood, and under-five Mortality for 187 Countries, 1970-2010: A Systematic Analysis of Progress Towards the Millennium Development Goal 4. The Lancet, Volume 375, Issue 9730, Pages 1988 - 2008, 5 June 2010. The study synthesized the empirical data estimates using a Gaussian process regression.
T O N G A M i l l e n n i u m D e v e l o p m e n t G o a l s R e p o r t 39
The MDGs are interrelated goals, and Tonga’s achievements in child health are the result of achievements seen in other sectors such as education, and access to water and sanitation among others. The good results achieved under MDG 5 (improve maternal health) are also correlated to the gains made in child health.
Breastfeeding is actively encouraged and supported in Tonga as seen by the high rates of breastfeeding, including high rates of exclusive breastfeeding, which follows WHO recommendations on infant nutrition. These data however are based on mothers interviewed by community nurses. Rates of exclusive breastfeeding significantly drop by age 4 months, which shows room for improvement. Breastfeeding is internationally acknowledged as a key intervention to promote infant health. The quality of nutrition later in life remains a concern however, and this will be discussed more in depth under MDG 6 and non-communicable diseases.
As of 2010, the Public Service Commission instituted a new policy to extend maternity leave from one month to three months for public servants (one week is granted for paternity leave). Although it is too early to assess any impact the policy has had on breastfeeding rates or infant health, the policy represents an important step forward under MDG 1 and MDG 4.
MDG4:THEWAYFORWARD
• Data need to be disaggregated to reflect child status at 1st week, 28 days, and one year to better direct effort at reducing child mortality
• A further reduction in neonatal/prenatal mortality is warranted, as they represent the most prevalent deaths in children under five.
• Adequate resources must be maintained to safeguard progress made on MDG 4• Nutritional education at young ages must be imparted

T O N G A M i l l e n n i u m D e v e l o p m e n t G o a l s R e p o r t40
T O N G A M i l l e n n i u m D e v e l o p m e n t G o a l s R e p o r t 41
GOAL 5: IMPROVE MATERNAL HEALTH
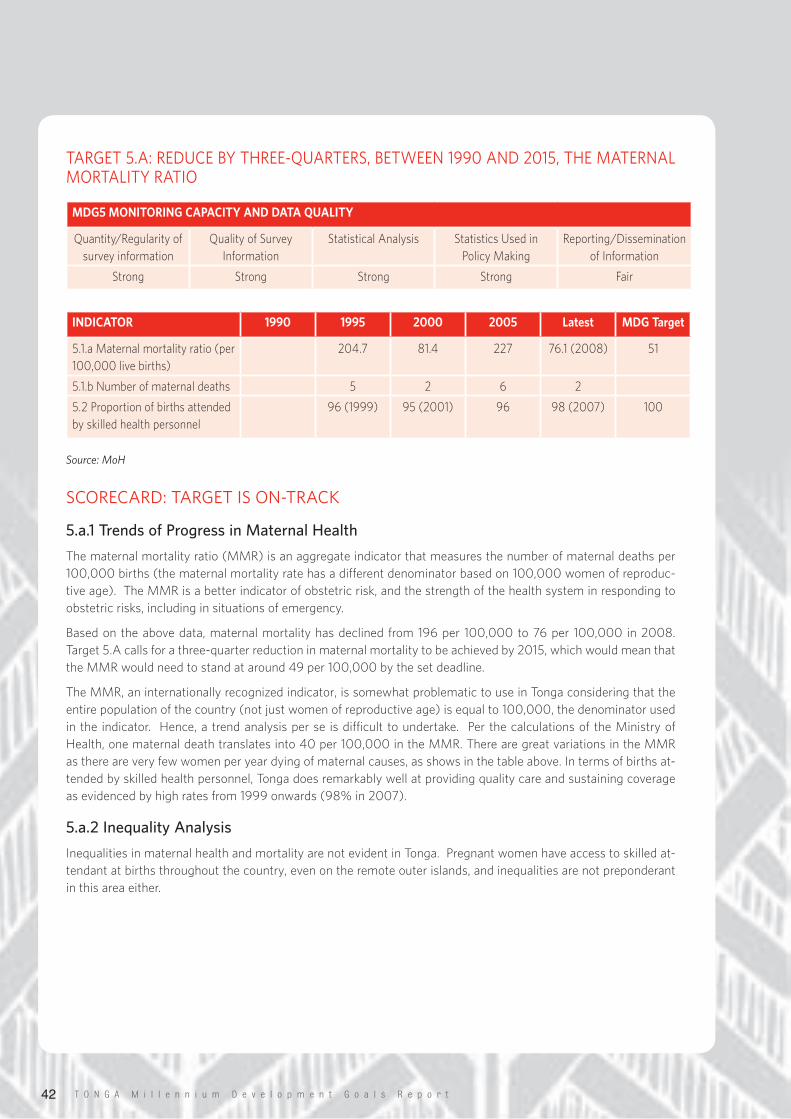
T O N G A M i l l e n n i u m D e v e l o p m e n t G o a l s R e p o r t42
TARGET5.A:REDUCEBYTHREE-QUARTERS,BETWEEN1990AND2015,THEMATERNALMORTALITYRATIO
Source: MoH
SCORECARD:TARGETISON-TRACK
5.a.1 Trends of Progress in Maternal Health
The maternal mortality ratio (MMR) is an aggregate indicator that measures the number of maternal deaths per 100,000 births (the maternal mortality rate has a different denominator based on 100,000 women of reproduc-tive age). The MMR is a better indicator of obstetric risk, and the strength of the health system in responding to obstetric risks, including in situations of emergency.
Based on the above data, maternal mortality has declined from 196 per 100,000 to 76 per 100,000 in 2008. Target 5.A calls for a three-quarter reduction in maternal mortality to be achieved by 2015, which would mean that the MMR would need to stand at around 49 per 100,000 by the set deadline.
The MMR, an internationally recognized indicator, is somewhat problematic to use in Tonga considering that the entire population of the country (not just women of reproductive age) is equal to 100,000, the denominator used in the indicator. Hence, a trend analysis per se is difficult to undertake. Per the calculations of the Ministry of Health, one maternal death translates into 40 per 100,000 in the MMR. There are great variations in the MMR as there are very few women per year dying of maternal causes, as shows in the table above. In terms of births at-tended by skilled health personnel, Tonga does remarkably well at providing quality care and sustaining coverage as evidenced by high rates from 1999 onwards (98% in 2007).
5.a.2 Inequality Analysis
Inequalities in maternal health and mortality are not evident in Tonga. Pregnant women have access to skilled at-tendant at births throughout the country, even on the remote outer islands, and inequalities are not preponderant in this area either.
MDG5 MONITORING CAPACITY AND DATA QUALITY
Quantity/Regularity of survey information
Quality of Survey Information
Statistical Analysis Statistics Used in Policy Making
Reporting/Dissemination of Information
Strong Strong Strong Strong Fair
INDICATOR 1990 1995 2000 2005 Latest MDG Target
5.1.a Maternal mortality ratio (per 100,000 live births)
204.7 81.4 227 76.1 (2008) 51
5.1.b Number of maternal deaths 5 2 6 2
5.2 Proportion of births attended by skilled health personnel
96 (1999) 95 (2001) 96 98 (2007) 100
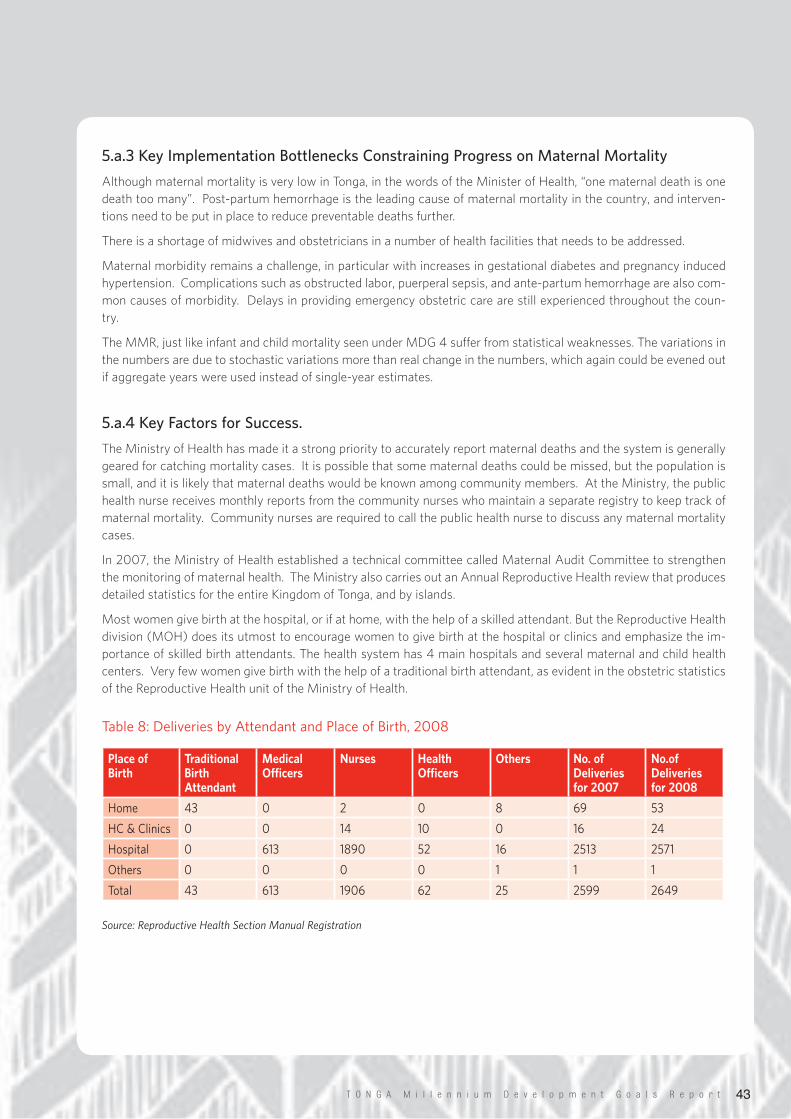
T O N G A M i l l e n n i u m D e v e l o p m e n t G o a l s R e p o r t 43
5.a.3 Key Implementation Bottlenecks Constraining Progress on Maternal Mortality
Although maternal mortality is very low in Tonga, in the words of the Minister of Health, “one maternal death is one death too many”. Post-partum hemorrhage is the leading cause of maternal mortality in the country, and interven-tions need to be put in place to reduce preventable deaths further.
There is a shortage of midwives and obstetricians in a number of health facilities that needs to be addressed.
Maternal morbidity remains a challenge, in particular with increases in gestational diabetes and pregnancy induced hypertension. Complications such as obstructed labor, puerperal sepsis, and ante-partum hemorrhage are also com-mon causes of morbidity. Delays in providing emergency obstetric care are still experienced throughout the coun-try.
The MMR, just like infant and child mortality seen under MDG 4 suffer from statistical weaknesses. The variations in the numbers are due to stochastic variations more than real change in the numbers, which again could be evened out if aggregate years were used instead of single-year estimates.
5.a.4 Key Factors for Success.
The Ministry of Health has made it a strong priority to accurately report maternal deaths and the system is generally geared for catching mortality cases. It is possible that some maternal deaths could be missed, but the population is small, and it is likely that maternal deaths would be known among community members. At the Ministry, the public health nurse receives monthly reports from the community nurses who maintain a separate registry to keep track of maternal mortality. Community nurses are required to call the public health nurse to discuss any maternal mortality cases.
In 2007, the Ministry of Health established a technical committee called Maternal Audit Committee to strengthen the monitoring of maternal health. The Ministry also carries out an Annual Reproductive Health review that produces detailed statistics for the entire Kingdom of Tonga, and by islands.
Most women give birth at the hospital, or if at home, with the help of a skilled attendant. But the Reproductive Health division (MOH) does its utmost to encourage women to give birth at the hospital or clinics and emphasize the im-portance of skilled birth attendants. The health system has 4 main hospitals and several maternal and child health centers. Very few women give birth with the help of a traditional birth attendant, as evident in the obstetric statistics of the Reproductive Health unit of the Ministry of Health.
Table8:DeliveriesbyAttendantandPlaceofBirth,2008
Source: Reproductive Health Section Manual Registration
Place of Birth
Traditional Birth Attendant
Medical Officers
Nurses Health Officers
Others No. of Deliveries for 2007
No.of Deliveries for 2008
Home 43 0 2 0 8 69 53
HC&Clinics 0 0 14 10 0 16 24
Hospital 0 613 1890 52 16 2513 2571
Others 0 0 0 0 1 1 1
Total 43 613 1906 62 25 2599 2649
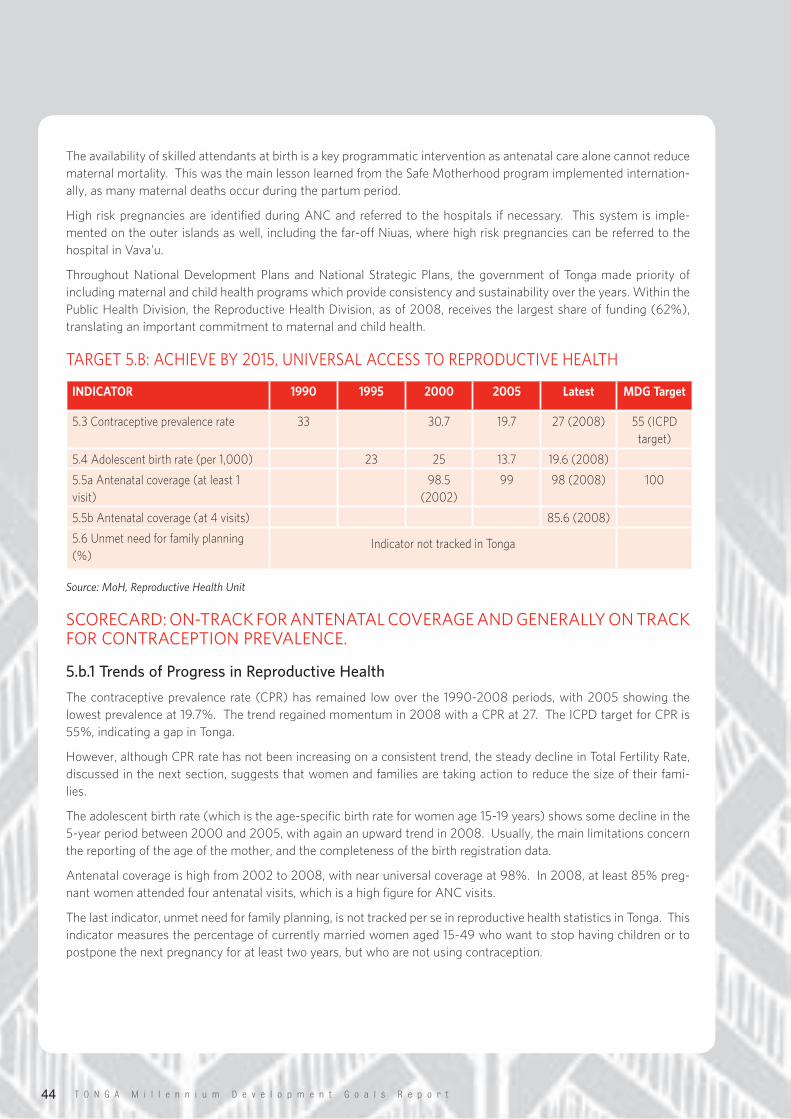
T O N G A M i l l e n n i u m D e v e l o p m e n t G o a l s R e p o r t44
The availability of skilled attendants at birth is a key programmatic intervention as antenatal care alone cannot reduce maternal mortality. This was the main lesson learned from the Safe Motherhood program implemented internation-ally, as many maternal deaths occur during the partum period.
High risk pregnancies are identified during ANC and referred to the hospitals if necessary. This system is imple-mented on the outer islands as well, including the far-off Niuas, where high risk pregnancies can be referred to the hospital in Vava’u.
Throughout National Development Plans and National Strategic Plans, the government of Tonga made priority of including maternal and child health programs which provide consistency and sustainability over the years. Within the Public Health Division, the Reproductive Health Division, as of 2008, receives the largest share of funding (62%), translating an important commitment to maternal and child health.
TARGET5.B:ACHIEVEBY2015,UNIVERSALACCESSTOREPRODUCTIVEHEALTH
Source: MoH, Reproductive Health Unit
SCORECARD:ON-TRACKFORANTENATALCOVERAGEANDGENERALLYONTRACKFORCONTRACEPTIONPREVALENCE.
5.b.1 Trends of Progress in Reproductive Health
The contraceptive prevalence rate (CPR) has remained low over the 1990-2008 periods, with 2005 showing the lowest prevalence at 19.7%. The trend regained momentum in 2008 with a CPR at 27. The ICPD target for CPR is 55%, indicating a gap in Tonga.
However, although CPR rate has not been increasing on a consistent trend, the steady decline in Total Fertility Rate, discussed in the next section, suggests that women and families are taking action to reduce the size of their fami-lies.
The adolescent birth rate (which is the age-specific birth rate for women age 15-19 years) shows some decline in the 5-year period between 2000 and 2005, with again an upward trend in 2008. Usually, the main limitations concern the reporting of the age of the mother, and the completeness of the birth registration data.
Antenatal coverage is high from 2002 to 2008, with near universal coverage at 98%. In 2008, at least 85% preg-nant women attended four antenatal visits, which is a high figure for ANC visits.
The last indicator, unmet need for family planning, is not tracked per se in reproductive health statistics in Tonga. This indicator measures the percentage of currently married women aged 15-49 who want to stop having children or to postpone the next pregnancy for at least two years, but who are not using contraception.
INDICATOR 1990 1995 2000 2005 Latest MDG Target
5.3 Contraceptive prevalence rate 33 30.7 19.7 27 (2008) 55 (ICPD target)
5.4 Adolescent birth rate (per 1,000) 23 25 13.7 19.6 (2008)
5.5a Antenatal coverage (at least 1 visit)
98.5 (2002)
99 98 (2008) 100
5.5b Antenatal coverage (at 4 visits) 85.6 (2008)
5.6 Unmet need for family planning (%)
Indicator not tracked in Tonga
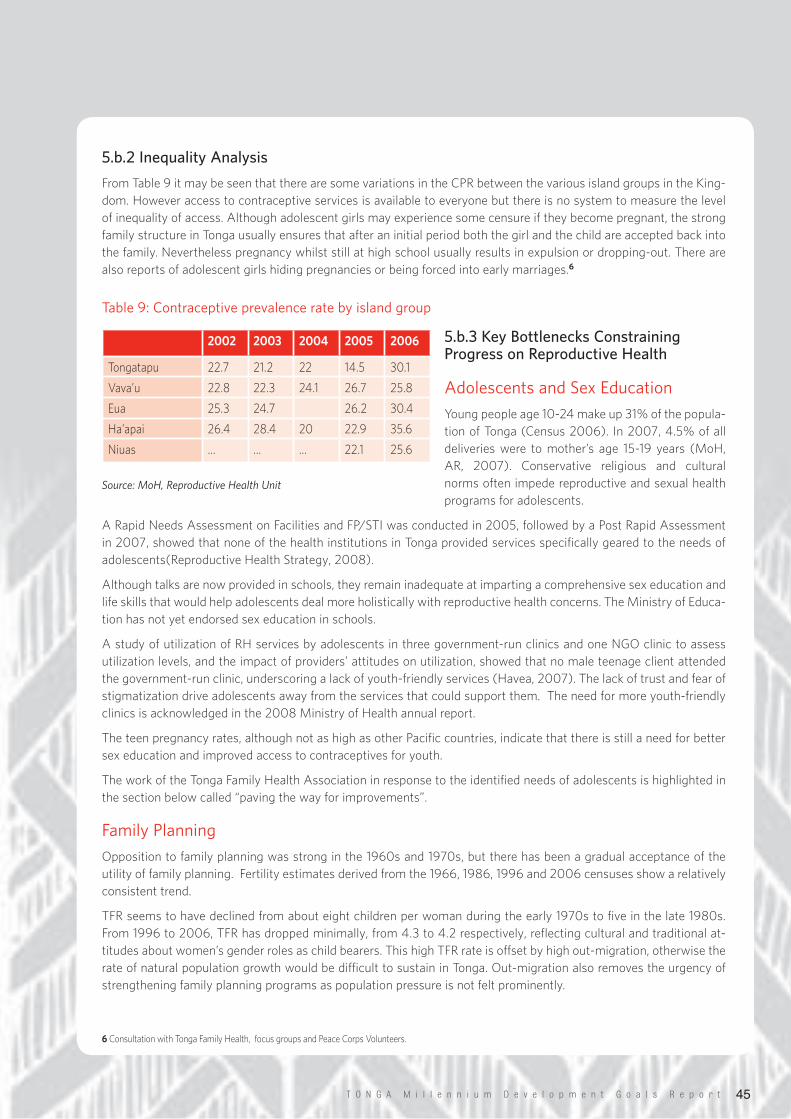
T O N G A M i l l e n n i u m D e v e l o p m e n t G o a l s R e p o r t 45
5.b.2 Inequality Analysis
From Table 9 it may be seen that there are some variations in the CPR between the various island groups in the King-dom. However access to contraceptive services is available to everyone but there is no system to measure the level of inequality of access. Although adolescent girls may experience some censure if they become pregnant, the strong family structure in Tonga usually ensures that after an initial period both the girl and the child are accepted back into the family. Nevertheless pregnancy whilst still at high school usually results in expulsion or dropping-out. There are also reports of adolescent girls hiding pregnancies or being forced into early marriages.6
Table9:Contraceptiveprevalenceratebyislandgroup
5.b.3 Key Bottlenecks Constraining Progress on Reproductive Health
AdolescentsandSexEducation
Young people age 10-24 make up 31% of the popula-tion of Tonga (Census 2006). In 2007, 4.5% of all deliveries were to mother’s age 15-19 years (MoH, AR, 2007). Conservative religious and cultural norms often impede reproductive and sexual health programs for adolescents.
A Rapid Needs Assessment on Facilities and FP/STI was conducted in 2005, followed by a Post Rapid Assessment in 2007, showed that none of the health institutions in Tonga provided services specifically geared to the needs of adolescents(Reproductive Health Strategy, 2008).
Although talks are now provided in schools, they remain inadequate at imparting a comprehensive sex education and life skills that would help adolescents deal more holistically with reproductive health concerns. The Ministry of Educa-tion has not yet endorsed sex education in schools.
A study of utilization of RH services by adolescents in three government-run clinics and one NGO clinic to assess utilization levels, and the impact of providers’ attitudes on utilization, showed that no male teenage client attended the government-run clinic, underscoring a lack of youth-friendly services (Havea, 2007). The lack of trust and fear of stigmatization drive adolescents away from the services that could support them. The need for more youth-friendly clinics is acknowledged in the 2008 Ministry of Health annual report.
The teen pregnancy rates, although not as high as other Pacific countries, indicate that there is still a need for better sex education and improved access to contraceptives for youth.
The work of the Tonga Family Health Association in response to the identified needs of adolescents is highlighted in the section below called “paving the way for improvements”.
FamilyPlanning
Opposition to family planning was strong in the 1960s and 1970s, but there has been a gradual acceptance of the utility of family planning. Fertility estimates derived from the 1966, 1986, 1996 and 2006 censuses show a relatively consistent trend.
TFR seems to have declined from about eight children per woman during the early 1970s to five in the late 1980s. From 1996 to 2006, TFR has dropped minimally, from 4.3 to 4.2 respectively, reflecting cultural and traditional at-titudes about women’s gender roles as child bearers. This high TFR rate is offset by high out-migration, otherwise the rate of natural population growth would be difficult to sustain in Tonga. Out-migration also removes the urgency of strengthening family planning programs as population pressure is not felt prominently.
2002 2003 2004 2005 2006
Tongatapu 22.7 21.2 22 14.5 30.1
Vava’u 22.8 22.3 24.1 26.7 25.8
Eua 25.3 24.7 26.2 30.4
Ha’apai 26.4 28.4 20 22.9 35.6
Niuas … … … 22.1 25.6
Source: MoH, Reproductive Health Unit
6 Consultation with Tonga Family Health, focus groups and Peace Corps Volunteers.
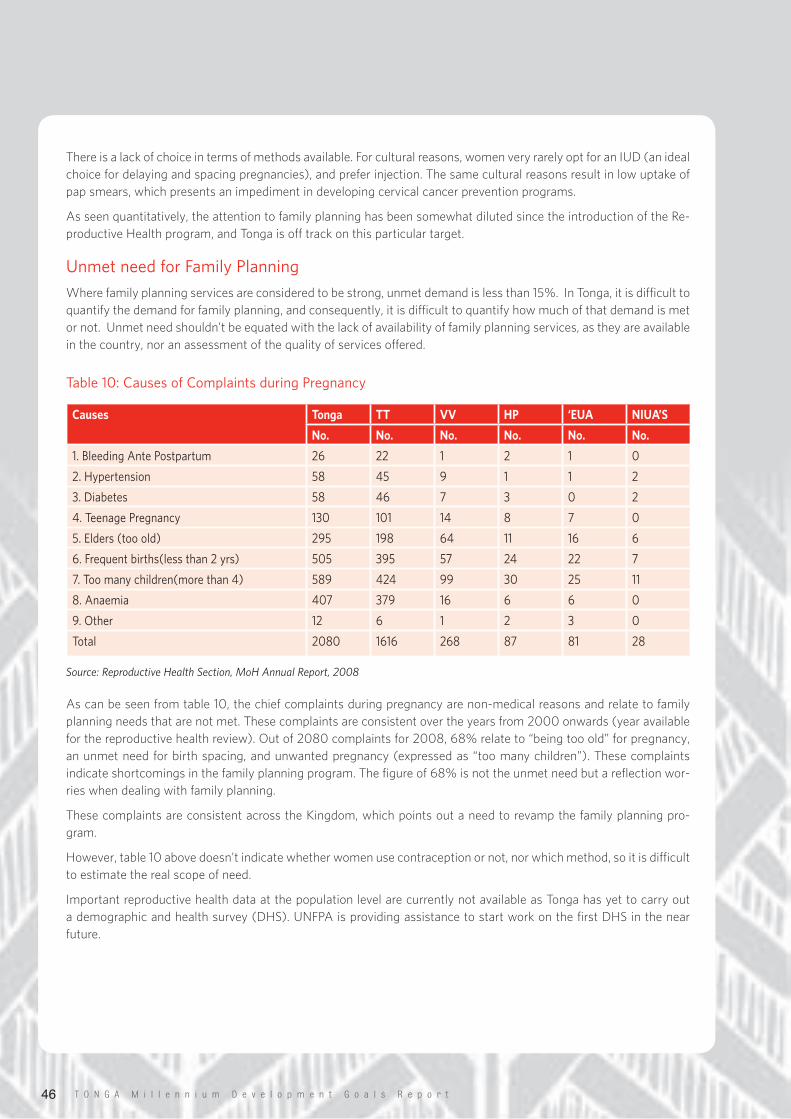
T O N G A M i l l e n n i u m D e v e l o p m e n t G o a l s R e p o r t46
There is a lack of choice in terms of methods available. For cultural reasons, women very rarely opt for an IUD (an ideal choice for delaying and spacing pregnancies), and prefer injection. The same cultural reasons result in low uptake of pap smears, which presents an impediment in developing cervical cancer prevention programs.
As seen quantitatively, the attention to family planning has been somewhat diluted since the introduction of the Re-productive Health program, and Tonga is off track on this particular target.
UnmetneedforFamilyPlanning
Where family planning services are considered to be strong, unmet demand is less than 15%. In Tonga, it is difficult to quantify the demand for family planning, and consequently, it is difficult to quantify how much of that demand is met or not. Unmet need shouldn’t be equated with the lack of availability of family planning services, as they are available in the country, nor an assessment of the quality of services offered.
Table10:CausesofComplaintsduringPregnancy
Source: Reproductive Health Section, MoH Annual Report, 2008
As can be seen from table 10, the chief complaints during pregnancy are non-medical reasons and relate to family planning needs that are not met. These complaints are consistent over the years from 2000 onwards (year available for the reproductive health review). Out of 2080 complaints for 2008, 68% relate to “being too old” for pregnancy, an unmet need for birth spacing, and unwanted pregnancy (expressed as “too many children”). These complaints indicate shortcomings in the family planning program. The figure of 68% is not the unmet need but a reflection wor-ries when dealing with family planning.
These complaints are consistent across the Kingdom, which points out a need to revamp the family planning pro-gram.
However, table 10 above doesn’t indicate whether women use contraception or not, nor which method, so it is difficult to estimate the real scope of need.
Important reproductive health data at the population level are currently not available as Tonga has yet to carry out a demographic and health survey (DHS). UNFPA is providing assistance to start work on the first DHS in the near future.
Causes Tonga TT VV HP ‘EUA NIUA’S
No. No. No. No. No. No.
1.BleedingAntePostpartum 26 22 1 2 1 0
2.Hypertension 58 45 9 1 1 2
3.Diabetes 58 46 7 3 0 2
4.TeenagePregnancy 130 101 14 8 7 0
5.Elders(tooold) 295 198 64 11 16 6
6.Frequentbirths(lessthan2yrs) 505 395 57 24 22 7
7.Toomanychildren(morethan4) 589 424 99 30 25 11
8.Anaemia 407 379 16 6 6 0
9.Other 12 6 1 2 3 0
Total 2080 1616 268 87 81 28
T O N G A M i l l e n n i u m D e v e l o p m e n t G o a l s R e p o r t 47
ReproductiveRights
Abortion is illegal in Tonga, but permitted to save the life of the mother. Wealthy women who want to have an abor-tion usually travel overseas to have access to abortion services. There are no data to quantify abortions in the country or outside.
Tonga’s legislation states that marital rape is only illegal if the parties are separated divorced, or where consent has been withdrawn through the process of law.
Women need their husband’s written and signed consent if they seek sterilization, but men do not need the consent of their spouse to obtain the procedure. The Ministry of Health is reviewing this policy to allow greater reproductive health freedom for women and to make informed decisions.
5.b.4 Paving the Way for Improvements
ReproductiveHealthPolicy
In 2008, with the support of UNFPA, a reproductive health policy was produced for the first time in Tonga, bridging a long-standing gap in reproductive health. The document also sets forth a reproductive health strategy for the 2008-2011 periods. The document is comprehensive in scope and breadth, and creates linkages to MDGs 4, 5, and 6 to provide a more solid foundation for the fulfillment of the goals in the national programs, recognizing the importance of reproductive health in attaining those health-related MDGs.
The policy specifically acknowledges the following areas for improvement: low contraceptive prevalence rate, STIs, maternal deaths, adolescent pregnancy, increased gender-based violence, and cervical cancer (the uptake for pap smears is extremely low in Tonga, mostly due to cultural attitudes and the reluctance of being nude in front of medical providers).
CivilSociety
The Tonga Family Health Association (TFHA) was established in 1975 to complement the work of the Ministry of Health. TFHA plays an important role in preventive programs against sexually transmitted infections, including HIV and has clinics in Tongatapu and Vava’u. Services include family planning and counseling, sexual reproductive health training and education, adolescent sexual reproductive health services, an STI clinic in Tongatapu, and antenatal care, among others.
TFHA, after identifying gaps in service provision to adolescent, has developed its niche in adolescent reproductive health education and services. TFHA provides a safety net to adolescents who would otherwise shy away from using reproductive health services. Many of the clients are male and school drop-outs (predominantly young boys in the 15 to 19 age group). Girls who seek services tend to be older, from 20 to 24 years of age.
TFHA 2008-2012 strategic plan aims to have 75% of high schools involved in sexuality life skills training for students from form 1 to form 7 by 2013; to have established district networks to provide sexual/reproductive health informa-tion to out of school adolescents; and to increase the number of community-based educational activities for parents and leaders. In the area of HIV prevention, the goal is to increase condom use to 50% by 2013; increase access to information and education. TFHA also aims at increasing the government’s and donors’ financial investment in sexual and reproductive health.
T O N G A M i l l e n n i u m D e v e l o p m e n t G o a l s R e p o r t48
MDG5:THEWAYFORWARD
• A demographic and health survey is urgently needed to obtain quantitative, population-based data on reproduc-tive health.
• Family planning programs need increased attention and resources.• Step up advocacy programs, address sexual and reproductive health issues in curricula and information cam-
paigns, and provide quality youth-friendly reproductive health services, including family planning, with adequate supplies and resources.
T O N G A M i l l e n n i u m D e v e l o p m e n t G o a l s R e p o r t 49
GOAL 6: COMBAT HIV/AIDS, TB, AND NON-COMMUNICABLE
DISEASES
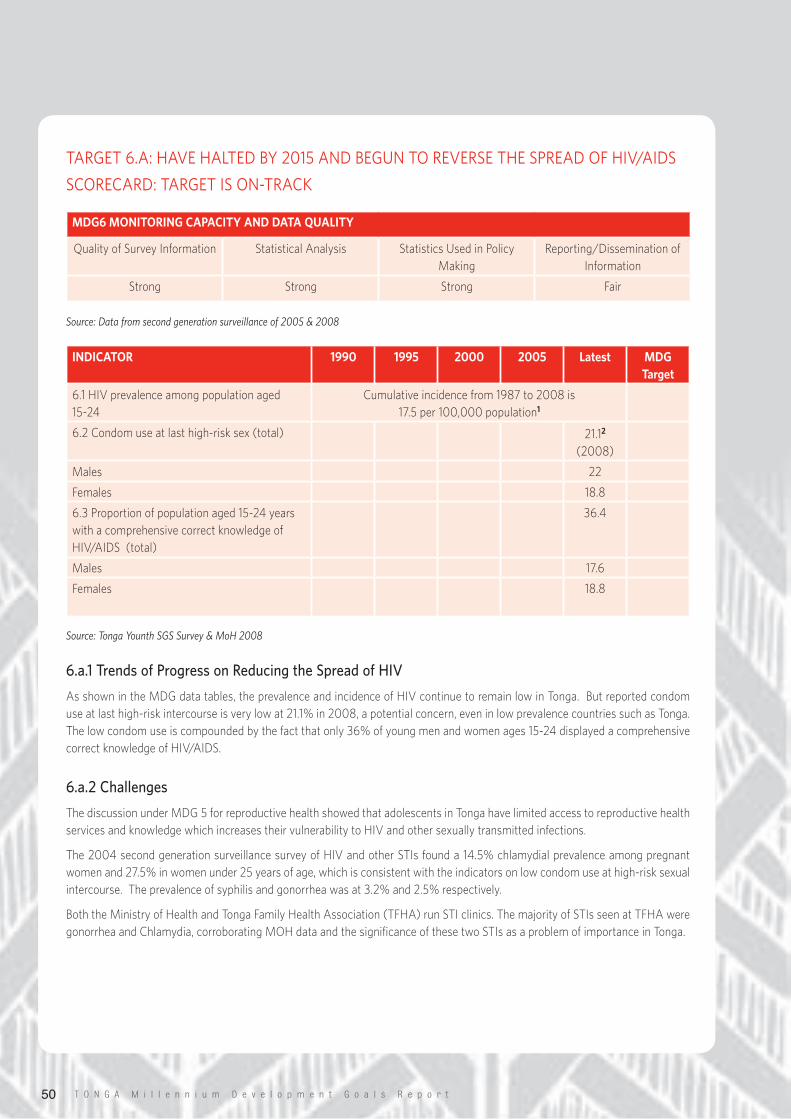
T O N G A M i l l e n n i u m D e v e l o p m e n t G o a l s R e p o r t50
TARGET6.A:HAVEHALTEDBY2015ANDBEGUNTOREVERSETHESPREADOFHIV/AIDS
SCORECARD:TARGETISON-TRACK
Source: Data from second generation surveillance of 2005 & 2008
Source: Tonga Younth SGS Survey & MoH 2008
6.a.1 Trends of Progress on Reducing the Spread of HIV
As shown in the MDG data tables, the prevalence and incidence of HIV continue to remain low in Tonga. But reported condom use at last high-risk intercourse is very low at 21.1% in 2008, a potential concern, even in low prevalence countries such as Tonga. The low condom use is compounded by the fact that only 36% of young men and women ages 15-24 displayed a comprehensive correct knowledge of HIV/AIDS.
6.a.2 Challenges
The discussion under MDG 5 for reproductive health showed that adolescents in Tonga have limited access to reproductive health services and knowledge which increases their vulnerability to HIV and other sexually transmitted infections.
The 2004 second generation surveillance survey of HIV and other STIs found a 14.5% chlamydial prevalence among pregnant women and 27.5% in women under 25 years of age, which is consistent with the indicators on low condom use at high-risk sexual intercourse. The prevalence of syphilis and gonorrhea was at 3.2% and 2.5% respectively.
Both the Ministry of Health and Tonga Family Health Association (TFHA) run STI clinics. The majority of STIs seen at TFHA were gonorrhea and Chlamydia, corroborating MOH data and the significance of these two STIs as a problem of importance in Tonga.
INDICATOR 1990 1995 2000 2005 Latest MDG Target
6.1 HIV prevalence among population aged 15-24
Cumulative incidence from 1987 to 2008 is 17.5 per 100,000 population1
6.2 Condom use at last high-risk sex (total) 21.12 (2008)
Males 22
Females 18.8
6.3 Proportion of population aged 15-24 years with a comprehensive correct knowledge of HIV/AIDS (total)
36.4
Males 17.6
Females 18.8
MDG6 MONITORING CAPACITY AND DATA QUALITY
Quality of Survey Information Statistical Analysis Statistics Used in Policy Making
Reporting/Dissemination of Information
Strong Strong Strong Fair
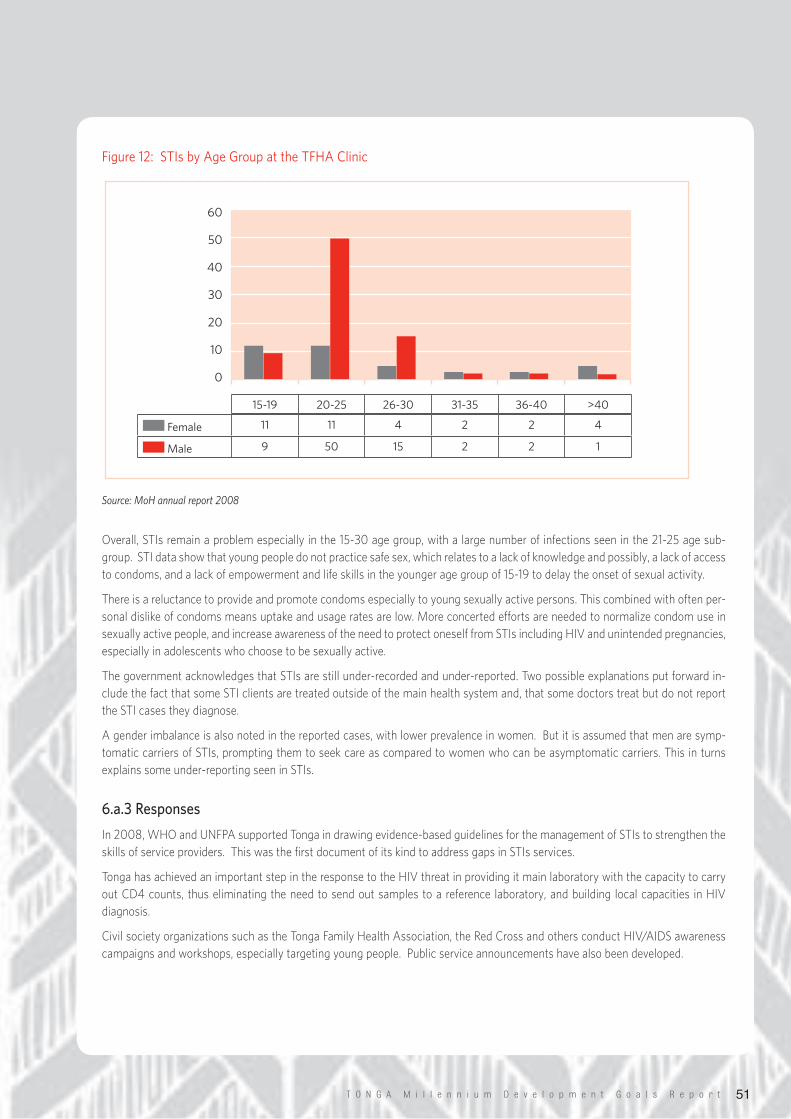
T O N G A M i l l e n n i u m D e v e l o p m e n t G o a l s R e p o r t 51
Figure12:STIsbyAgeGroupattheTFHAClinic
Source: MoH annual report 2008
Overall, STIs remain a problem especially in the 15-30 age group, with a large number of infections seen in the 21-25 age sub-group. STI data show that young people do not practice safe sex, which relates to a lack of knowledge and possibly, a lack of access to condoms, and a lack of empowerment and life skills in the younger age group of 15-19 to delay the onset of sexual activity.
There is a reluctance to provide and promote condoms especially to young sexually active persons. This combined with often per-sonal dislike of condoms means uptake and usage rates are low. More concerted efforts are needed to normalize condom use in sexually active people, and increase awareness of the need to protect oneself from STIs including HIV and unintended pregnancies, especially in adolescents who choose to be sexually active.
The government acknowledges that STIs are still under-recorded and under-reported. Two possible explanations put forward in-clude the fact that some STI clients are treated outside of the main health system and, that some doctors treat but do not report the STI cases they diagnose.
A gender imbalance is also noted in the reported cases, with lower prevalence in women. But it is assumed that men are symp-tomatic carriers of STIs, prompting them to seek care as compared to women who can be asymptomatic carriers. This in turns explains some under-reporting seen in STIs.
6.a.3 Responses
In 2008, WHO and UNFPA supported Tonga in drawing evidence-based guidelines for the management of STIs to strengthen the skills of service providers. This was the first document of its kind to address gaps in STIs services.
Tonga has achieved an important step in the response to the HIV threat in providing it main laboratory with the capacity to carry out CD4 counts, thus eliminating the need to send out samples to a reference laboratory, and building local capacities in HIV diagnosis.
Civil society organizations such as the Tonga Family Health Association, the Red Cross and others conduct HIV/AIDS awareness campaigns and workshops, especially targeting young people. Public service announcements have also been developed.
60
50
40
30
20
10
0
Female 11 11 4 2 2 4
Male 9 50 15 2 2 1
15-19 20-25 26-30 31-35 36-40 >40
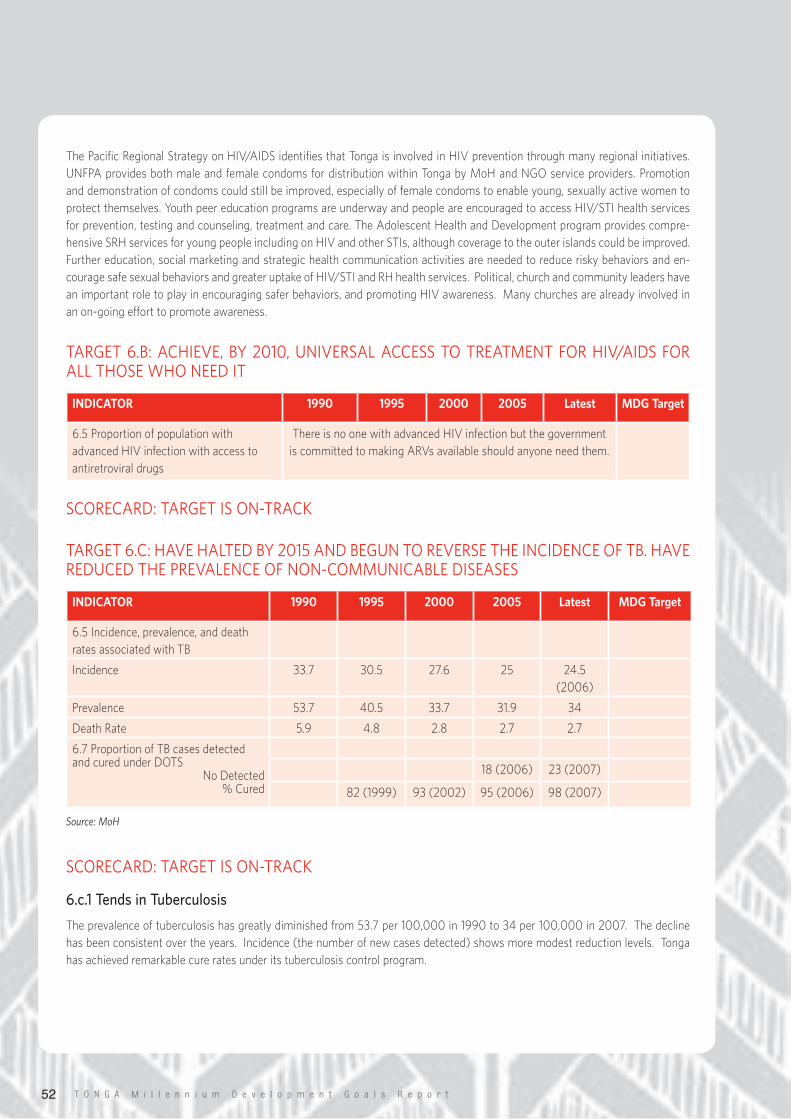
T O N G A M i l l e n n i u m D e v e l o p m e n t G o a l s R e p o r t52
The Pacific Regional Strategy on HIV/AIDS identifies that Tonga is involved in HIV prevention through many regional initiatives. UNFPA provides both male and female condoms for distribution within Tonga by MoH and NGO service providers. Promotion and demonstration of condoms could still be improved, especially of female condoms to enable young, sexually active women to protect themselves. Youth peer education programs are underway and people are encouraged to access HIV/STI health services for prevention, testing and counseling, treatment and care. The Adolescent Health and Development program provides compre-hensive SRH services for young people including on HIV and other STIs, although coverage to the outer islands could be improved. Further education, social marketing and strategic health communication activities are needed to reduce risky behaviors and en-courage safe sexual behaviors and greater uptake of HIV/STI and RH health services. Political, church and community leaders have an important role to play in encouraging safer behaviors, and promoting HIV awareness. Many churches are already involved in an on-going effort to promote awareness.
TARGET6.B:ACHIEVE,BY2010,UNIVERSALACCESSTOTREATMENTFORHIV/AIDSFORALLTHOSEWHONEEDIT
SCORECARD:TARGETISON-TRACK
TARGET6.C:HAVEHALTEDBY2015ANDBEGUNTOREVERSETHEINCIDENCEOFTB.HAVEREDUCEDTHEPREVALENCEOFNON-COMMUNICABLEDISEASES
Source: MoH
SCORECARD:TARGETISON-TRACK
6.c.1 Tends in Tuberculosis
The prevalence of tuberculosis has greatly diminished from 53.7 per 100,000 in 1990 to 34 per 100,000 in 2007. The decline has been consistent over the years. Incidence (the number of new cases detected) shows more modest reduction levels. Tonga has achieved remarkable cure rates under its tuberculosis control program.
INDICATOR 1990 1995 2000 2005 Latest MDG Target
6.5 Proportion of population with advanced HIV infection with access to antiretroviral drugs
There is no one with advanced HIV infection but the government is committed to making ARVs available should anyone need them.
INDICATOR 1990 1995 2000 2005 Latest MDG Target
6.5 Incidence, prevalence, and death rates associated with TB
Incidence 33.7 30.5 27.6 25 24.5 (2006)
Prevalence 53.7 40.5 33.7 31.9 34
Death Rate 5.9 4.8 2.8 2.7 2.7
6.7 Proportion of TB cases detected and cured under DOTS
No Detected% Cured
18 (2006) 23 (2007)
82 (1999) 93 (2002) 95 (2006) 98 (2007)
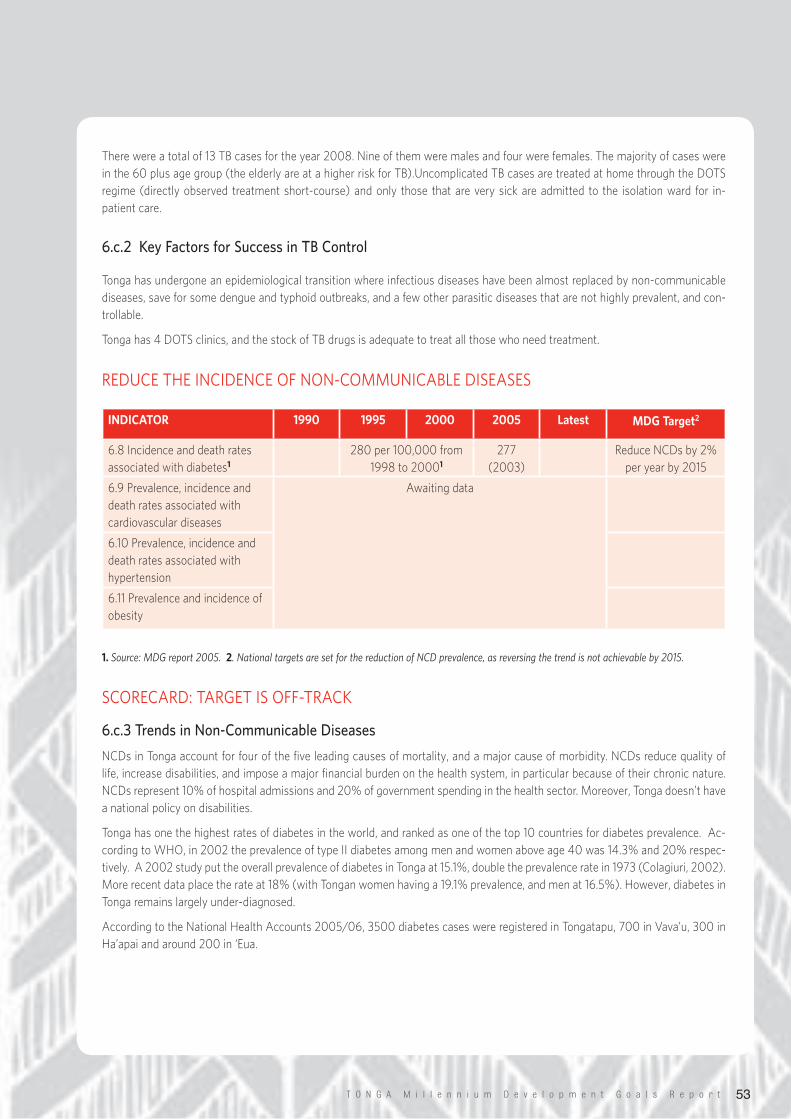
T O N G A M i l l e n n i u m D e v e l o p m e n t G o a l s R e p o r t 53
There were a total of 13 TB cases for the year 2008. Nine of them were males and four were females. The majority of cases were in the 60 plus age group (the elderly are at a higher risk for TB).Uncomplicated TB cases are treated at home through the DOTS regime (directly observed treatment short-course) and only those that are very sick are admitted to the isolation ward for in-patient care.
6.c.2 Key Factors for Success in TB Control
Tonga has undergone an epidemiological transition where infectious diseases have been almost replaced by non-communicable diseases, save for some dengue and typhoid outbreaks, and a few other parasitic diseases that are not highly prevalent, and con-trollable.
Tonga has 4 DOTS clinics, and the stock of TB drugs is adequate to treat all those who need treatment.
REDUCETHEINCIDENCEOFNON-COMMUNICABLEDISEASES
1. Source: MDG report 2005. 2. National targets are set for the reduction of NCD prevalence, as reversing the trend is not achievable by 2015.
SCORECARD:TARGETISOFF-TRACK
6.c.3 Trends in Non-Communicable Diseases
NCDs in Tonga account for four of the five leading causes of mortality, and a major cause of morbidity. NCDs reduce quality of life, increase disabilities, and impose a major financial burden on the health system, in particular because of their chronic nature. NCDs represent 10% of hospital admissions and 20% of government spending in the health sector. Moreover, Tonga doesn’t have a national policy on disabilities.
Tonga has one the highest rates of diabetes in the world, and ranked as one of the top 10 countries for diabetes prevalence. Ac-cording to WHO, in 2002 the prevalence of type II diabetes among men and women above age 40 was 14.3% and 20% respec-tively. A 2002 study put the overall prevalence of diabetes in Tonga at 15.1%, double the prevalence rate in 1973 (Colagiuri, 2002). More recent data place the rate at 18% (with Tongan women having a 19.1% prevalence, and men at 16.5%). However, diabetes in Tonga remains largely under-diagnosed.
According to the National Health Accounts 2005/06, 3500 diabetes cases were registered in Tongatapu, 700 in Vava’u, 300 in Ha’apai and around 200 in ‘Eua.
INDICATOR 1990 1995 2000 2005 Latest MDG Target2
6.8 Incidence and death rates associated with diabetes1
280 per 100,000 from 1998 to 20001
277 (2003)
Reduce NCDs by 2% per year by 2015
6.9 Prevalence, incidence and death rates associated with cardiovascular diseases
Awaiting data
6.10 Prevalence, incidence and death rates associated with hypertension
6.11 Prevalence and incidence of obesity
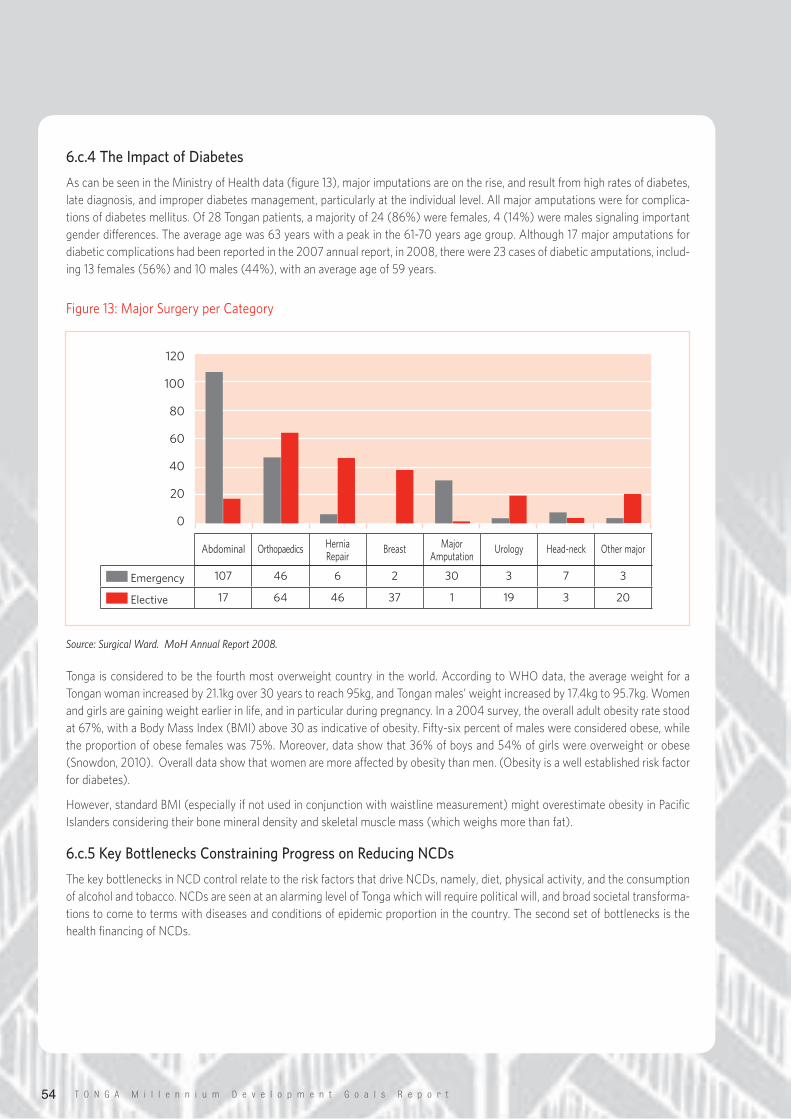
T O N G A M i l l e n n i u m D e v e l o p m e n t G o a l s R e p o r t54
6.c.4 The Impact of Diabetes
As can be seen in the Ministry of Health data (figure 13), major imputations are on the rise, and result from high rates of diabetes, late diagnosis, and improper diabetes management, particularly at the individual level. All major amputations were for complica-tions of diabetes mellitus. Of 28 Tongan patients, a majority of 24 (86%) were females, 4 (14%) were males signaling important gender differences. The average age was 63 years with a peak in the 61-70 years age group. Although 17 major amputations for diabetic complications had been reported in the 2007 annual report, in 2008, there were 23 cases of diabetic amputations, includ-ing 13 females (56%) and 10 males (44%), with an average age of 59 years.
Figure13:MajorSurgeryperCategory
Source: Surgical Ward. MoH Annual Report 2008.
Tonga is considered to be the fourth most overweight country in the world. According to WHO data, the average weight for a Tongan woman increased by 21.1kg over 30 years to reach 95kg, and Tongan males’ weight increased by 17.4kg to 95.7kg. Women and girls are gaining weight earlier in life, and in particular during pregnancy. In a 2004 survey, the overall adult obesity rate stood at 67%, with a Body Mass Index (BMI) above 30 as indicative of obesity. Fifty-six percent of males were considered obese, while the proportion of obese females was 75%. Moreover, data show that 36% of boys and 54% of girls were overweight or obese (Snowdon, 2010). Overall data show that women are more affected by obesity than men. (Obesity is a well established risk factor for diabetes).
However, standard BMI (especially if not used in conjunction with waistline measurement) might overestimate obesity in Pacific Islanders considering their bone mineral density and skeletal muscle mass (which weighs more than fat).
6.c.5 Key Bottlenecks Constraining Progress on Reducing NCDs
The key bottlenecks in NCD control relate to the risk factors that drive NCDs, namely, diet, physical activity, and the consumption of alcohol and tobacco. NCDs are seen at an alarming level of Tonga which will require political will, and broad societal transforma-tions to come to terms with diseases and conditions of epidemic proportion in the country. The second set of bottlenecks is the health financing of NCDs.
Emergency 107 46 6 2 30 3 7 3
Elective 17 64 46 37 1 19 3 20
Abdominal Orthopaedics HerniaRepair
Breast MajorAmputation
Urology Head-neck Othermajor
120
100
80
60
40
20
0
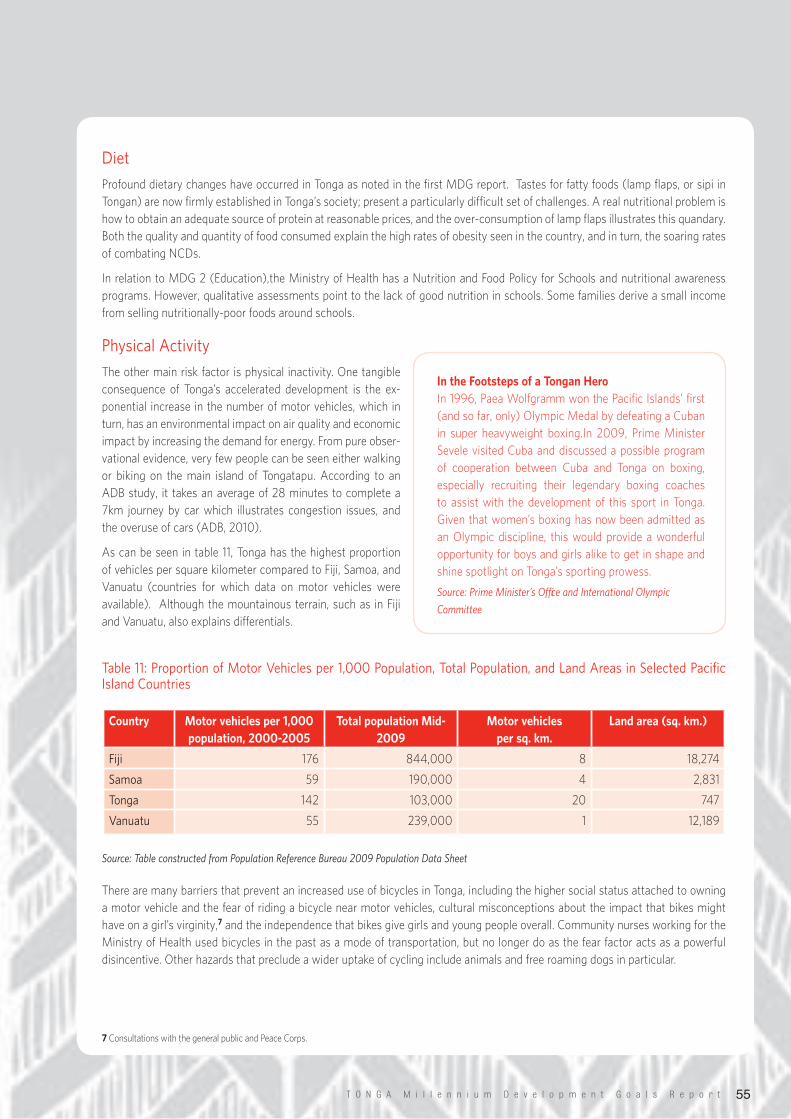
T O N G A M i l l e n n i u m D e v e l o p m e n t G o a l s R e p o r t 55
Diet
Profound dietary changes have occurred in Tonga as noted in the first MDG report. Tastes for fatty foods (lamp flaps, or sipi in Tongan) are now firmly established in Tonga’s society; present a particularly difficult set of challenges. A real nutritional problem is how to obtain an adequate source of protein at reasonable prices, and the over-consumption of lamp flaps illustrates this quandary. Both the quality and quantity of food consumed explain the high rates of obesity seen in the country, and in turn, the soaring rates of combating NCDs.
In relation to MDG 2 (Education),the Ministry of Health has a Nutrition and Food Policy for Schools and nutritional awareness programs. However, qualitative assessments point to the lack of good nutrition in schools. Some families derive a small income from selling nutritionally-poor foods around schools.
PhysicalActivity
The other main risk factor is physical inactivity. One tangible consequence of Tonga’s accelerated development is the ex-ponential increase in the number of motor vehicles, which in turn, has an environmental impact on air quality and economic impact by increasing the demand for energy. From pure obser-vational evidence, very few people can be seen either walking or biking on the main island of Tongatapu. According to an ADB study, it takes an average of 28 minutes to complete a 7km journey by car which illustrates congestion issues, and the overuse of cars (ADB, 2010).
As can be seen in table 11, Tonga has the highest proportion of vehicles per square kilometer compared to Fiji, Samoa, and Vanuatu (countries for which data on motor vehicles were available). Although the mountainous terrain, such as in Fiji and Vanuatu, also explains differentials.
Table11:ProportionofMotorVehiclesper1,000Population,TotalPopulation,andLandAreasinSelectedPacificIslandCountries
Source: Table constructed from Population Reference Bureau 2009 Population Data Sheet
There are many barriers that prevent an increased use of bicycles in Tonga, including the higher social status attached to owning a motor vehicle and the fear of riding a bicycle near motor vehicles, cultural misconceptions about the impact that bikes might have on a girl’s virginity,7 and the independence that bikes give girls and young people overall. Community nurses working for the Ministry of Health used bicycles in the past as a mode of transportation, but no longer do as the fear factor acts as a powerful disincentive. Other hazards that preclude a wider uptake of cycling include animals and free roaming dogs in particular.
Country Motor vehicles per 1,000 population, 2000-2005
Total population Mid-2009
Motor vehicles per sq. km.
Land area (sq. km.)
Fiji 176 844,000 8 18,274
Samoa 59 190,000 4 2,831
Tonga 142 103,000 20 747
Vanuatu 55 239,000 1 12,189
In the Footsteps of a Tongan HeroIn 1996, Paea Wolfgramm won the Pacific Islands’ first (and so far, only) Olympic Medal by defeating a Cuban in super heavyweight boxing.In 2009, Prime Minister Sevele visited Cuba and discussed a possible program of cooperation between Cuba and Tonga on boxing, especially recruiting their legendary boxing coaches to assist with the development of this sport in Tonga. Given that women’s boxing has now been admitted as an Olympic discipline, this would provide a wonderful opportunity for boys and girls alike to get in shape and shine spotlight on Tonga’s sporting prowess.
Source: Prime Minister’s Office and International Olympic
Committee
7 Consultations with the general public and Peace Corps.
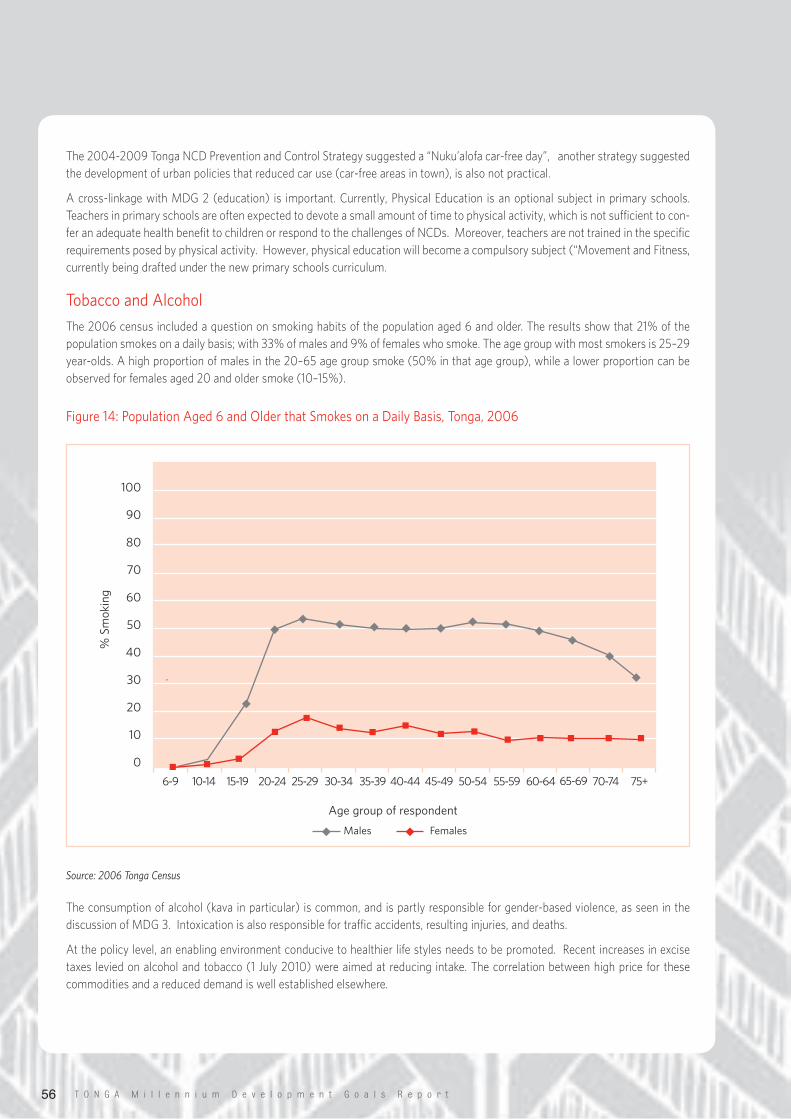
T O N G A M i l l e n n i u m D e v e l o p m e n t G o a l s R e p o r t56
The 2004-2009 Tonga NCD Prevention and Control Strategy suggested a “Nuku’alofa car-free day”, another strategy suggested the development of urban policies that reduced car use (car-free areas in town), is also not practical.
A cross-linkage with MDG 2 (education) is important. Currently, Physical Education is an optional subject in primary schools. Teachers in primary schools are often expected to devote a small amount of time to physical activity, which is not sufficient to con-fer an adequate health benefit to children or respond to the challenges of NCDs. Moreover, teachers are not trained in the specific requirements posed by physical activity. However, physical education will become a compulsory subject (“Movement and Fitness, currently being drafted under the new primary schools curriculum.
TobaccoandAlcohol
The 2006 census included a question on smoking habits of the population aged 6 and older. The results show that 21% of the population smokes on a daily basis; with 33% of males and 9% of females who smoke. The age group with most smokers is 25–29 year-olds. A high proportion of males in the 20–65 age group smoke (50% in that age group), while a lower proportion can be observed for females aged 20 and older smoke (10–15%).
Figure14:PopulationAged6andOlderthatSmokesonaDailyBasis,Tonga,2006
Source: 2006 Tonga Census
The consumption of alcohol (kava in particular) is common, and is partly responsible for gender-based violence, as seen in the discussion of MDG 3. Intoxication is also responsible for traffic accidents, resulting injuries, and deaths.
At the policy level, an enabling environment conducive to healthier life styles needs to be promoted. Recent increases in excise taxes levied on alcohol and tobacco (1 July 2010) were aimed at reducing intake. The correlation between high price for these commodities and a reduced demand is well established elsewhere.
100
90
80
70
60
50
40
30
20
10
0
%Smok
ing
Agegroupofrespondent
6-9 10-14 15-19 20-24 25-29 30-34 35-39 40-44 45-49 50-54 55-59 60-64 65-69 70-74 75+
Males Females
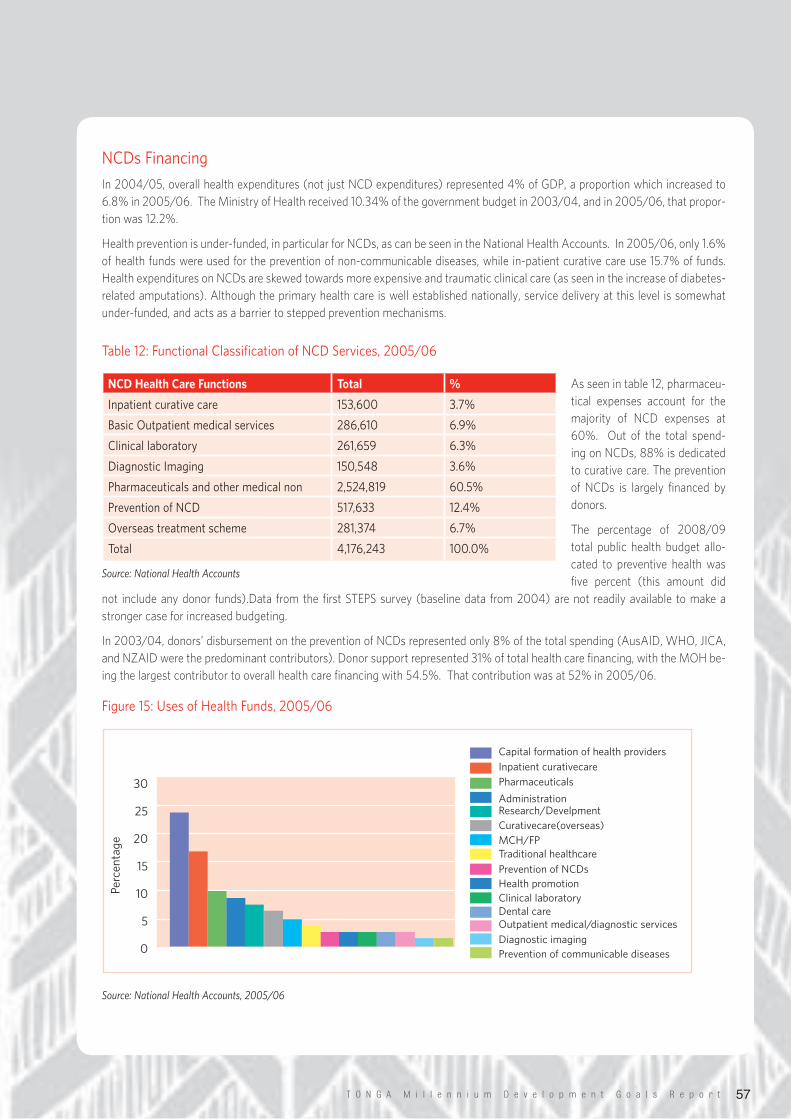
T O N G A M i l l e n n i u m D e v e l o p m e n t G o a l s R e p o r t 57
NCDsFinancing
In 2004/05, overall health expenditures (not just NCD expenditures) represented 4% of GDP, a proportion which increased to 6.8% in 2005/06. The Ministry of Health received 10.34% of the government budget in 2003/04, and in 2005/06, that propor-tion was 12.2%.
Health prevention is under-funded, in particular for NCDs, as can be seen in the National Health Accounts. In 2005/06, only 1.6% of health funds were used for the prevention of non-communicable diseases, while in-patient curative care use 15.7% of funds. Health expenditures on NCDs are skewed towards more expensive and traumatic clinical care (as seen in the increase of diabetes-related amputations). Although the primary health care is well established nationally, service delivery at this level is somewhat under-funded, and acts as a barrier to stepped prevention mechanisms.
Table12:FunctionalClassificationofNCDServices,2005/06
As seen in table 12, pharmaceu-tical expenses account for the majority of NCD expenses at 60%. Out of the total spend-ing on NCDs, 88% is dedicated to curative care. The prevention of NCDs is largely financed by donors.
The percentage of 2008/09 total public health budget allo-cated to preventive health was five percent (this amount did
not include any donor funds).Data from the first STEPS survey (baseline data from 2004) are not readily available to make a stronger case for increased budgeting.
In 2003/04, donors’ disbursement on the prevention of NCDs represented only 8% of the total spending (AusAID, WHO, JICA, and NZAID were the predominant contributors). Donor support represented 31% of total health care financing, with the MOH be-ing the largest contributor to overall health care financing with 54.5%. That contribution was at 52% in 2005/06.
Figure15:UsesofHealthFunds,2005/06
Source: National Health Accounts, 2005/06
30
25
20
15
10
5
0
CapitalformationofhealthprovidersInpatientcurativecarePharmaceuticals
AdministrationResearch/DevelpmentCurativecare(overseas)MCH/FPTraditionalhealthcarePreventionofNCDsHealthpromotionClinicallaboratoryDentalcareOutpatientmedical/diagnosticservicesDiagnosticimagingPreventionofcommunicablediseases
Percen
tage
NCD Health Care Functions Total %
Inpatientcurativecare 153,600 3.7%
BasicOutpatientmedicalservices 286,610 6.9%
Clinicallaboratory 261,659 6.3%
DiagnosticImaging 150,548 3.6%
Pharmaceuticalsandothermedicalnon 2,524,819 60.5%
PreventionofNCD 517,633 12.4%
Overseastreatmentscheme 281,374 6.7%
Total 4,176,243 100.0%
Source: National Health Accounts
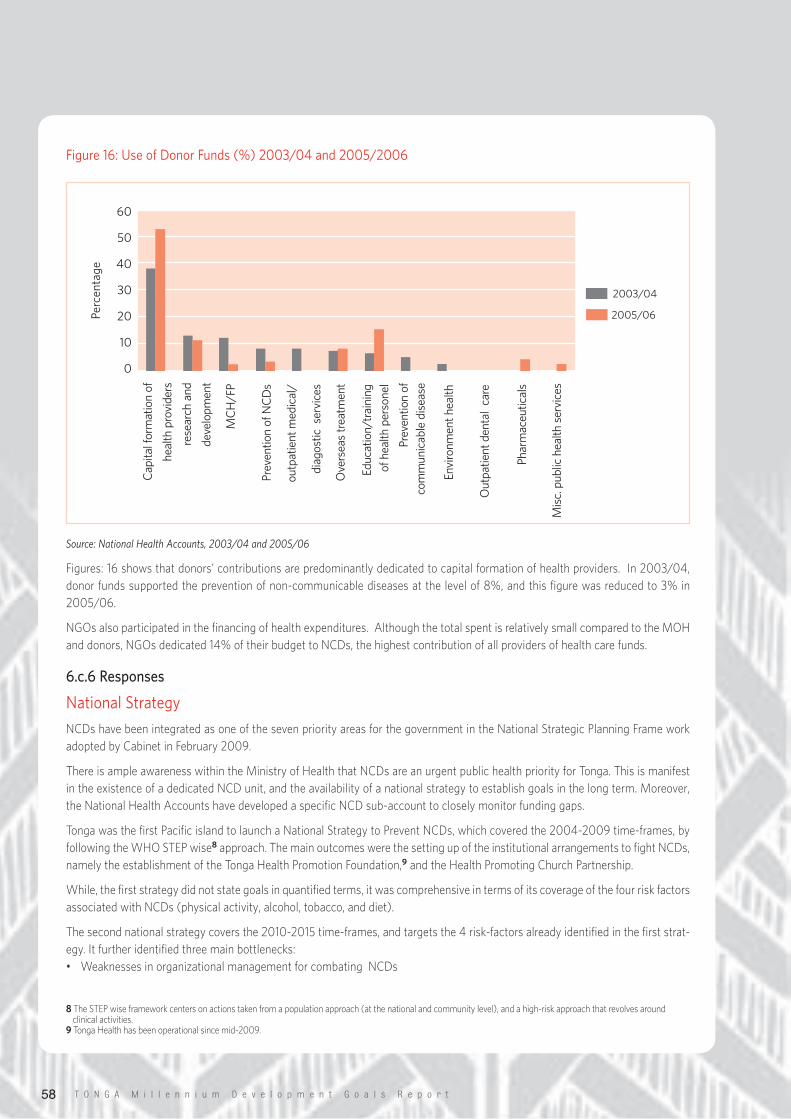
T O N G A M i l l e n n i u m D e v e l o p m e n t G o a l s R e p o r t58
Figure16:UseofDonorFunds(%)2003/04and2005/2006
Source: National Health Accounts, 2003/04 and 2005/06
Figures: 16 shows that donors’ contributions are predominantly dedicated to capital formation of health providers. In 2003/04, donor funds supported the prevention of non-communicable diseases at the level of 8%, and this figure was reduced to 3% in 2005/06.
NGOs also participated in the financing of health expenditures. Although the total spent is relatively small compared to the MOH and donors, NGOs dedicated 14% of their budget to NCDs, the highest contribution of all providers of health care funds.
6.c.6 Responses
NationalStrategy
NCDs have been integrated as one of the seven priority areas for the government in the National Strategic Planning Frame work adopted by Cabinet in February 2009.
There is ample awareness within the Ministry of Health that NCDs are an urgent public health priority for Tonga. This is manifest in the existence of a dedicated NCD unit, and the availability of a national strategy to establish goals in the long term. Moreover, the National Health Accounts have developed a specific NCD sub-account to closely monitor funding gaps.
Tonga was the first Pacific island to launch a National Strategy to Prevent NCDs, which covered the 2004-2009 time-frames, by following the WHO STEP wise8 approach. The main outcomes were the setting up of the institutional arrangements to fight NCDs, namely the establishment of the Tonga Health Promotion Foundation,9 and the Health Promoting Church Partnership.
While, the first strategy did not state goals in quantified terms, it was comprehensive in terms of its coverage of the four risk factors associated with NCDs (physical activity, alcohol, tobacco, and diet).
The second national strategy covers the 2010-2015 time-frames, and targets the 4 risk-factors already identified in the first strat-egy. It further identified three main bottlenecks:• Weaknesses in organizational management for combating NCDs
8 The STEP wise framework centers on actions taken from a population approach (at the national and community level), and a high-risk approach that revolves around clinical activities.9 Tonga Health has been operational since mid-2009.
Percen
tage
2003/04
2005/06
60
50
40
30
20
10
0
Cap
italformationof
healthprovide
rs
research
and
developm
ent
Preven
tionofN
CDs
outpatientm
edical/
diag
ostic
services
Educ
ation/
training
ofhea
lthperso
nel
Preven
tionof
commun
icab
ledisea
se
Environm
enth
ealth
Outpa
tientden
talcare
Pharmaceu
ticals
Misc.pub
lichea
lthservices
MCH/F
P
Oversea
strea
tmen
t
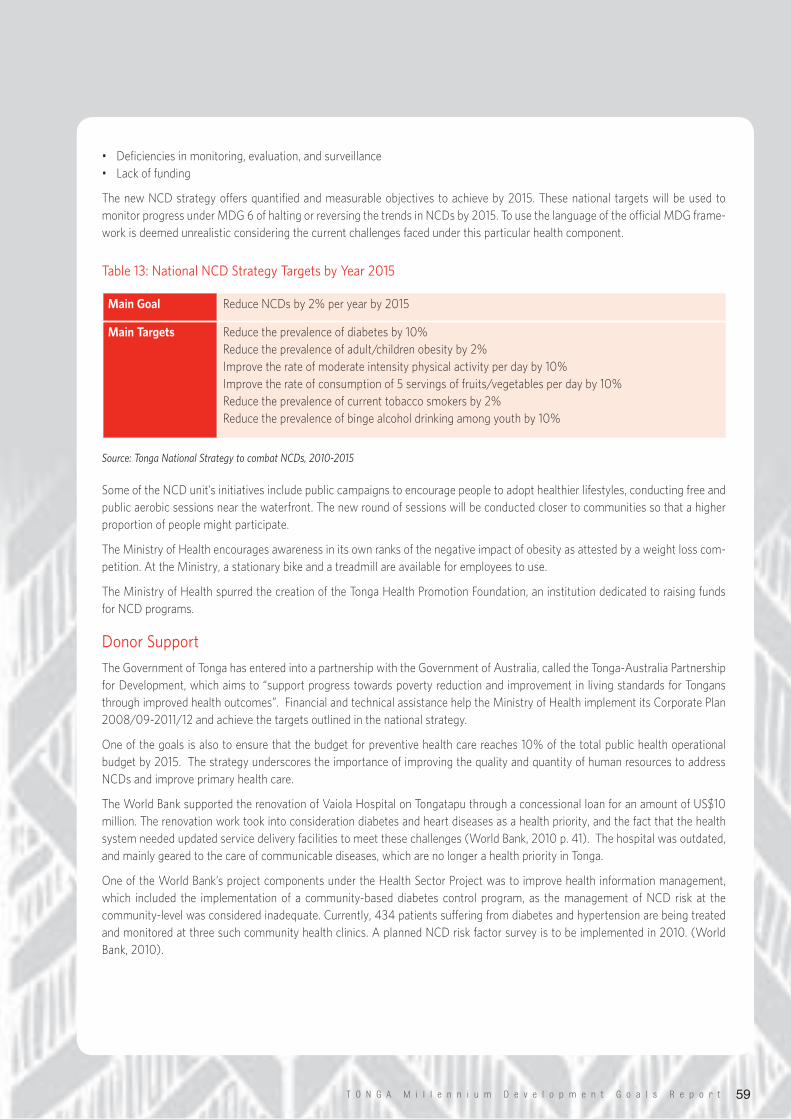
T O N G A M i l l e n n i u m D e v e l o p m e n t G o a l s R e p o r t 59
• Deficiencies in monitoring, evaluation, and surveillance• Lack of funding
The new NCD strategy offers quantified and measurable objectives to achieve by 2015. These national targets will be used to monitor progress under MDG 6 of halting or reversing the trends in NCDs by 2015. To use the language of the official MDG frame-work is deemed unrealistic considering the current challenges faced under this particular health component.
Table13:NationalNCDStrategyTargetsbyYear2015
Source: Tonga National Strategy to combat NCDs, 2010-2015
Some of the NCD unit’s initiatives include public campaigns to encourage people to adopt healthier lifestyles, conducting free and public aerobic sessions near the waterfront. The new round of sessions will be conducted closer to communities so that a higher proportion of people might participate.
The Ministry of Health encourages awareness in its own ranks of the negative impact of obesity as attested by a weight loss com-petition. At the Ministry, a stationary bike and a treadmill are available for employees to use.
The Ministry of Health spurred the creation of the Tonga Health Promotion Foundation, an institution dedicated to raising funds for NCD programs.
DonorSupport
The Government of Tonga has entered into a partnership with the Government of Australia, called the Tonga-Australia Partnership for Development, which aims to “support progress towards poverty reduction and improvement in living standards for Tongans through improved health outcomes”. Financial and technical assistance help the Ministry of Health implement its Corporate Plan 2008/09-2011/12 and achieve the targets outlined in the national strategy.
One of the goals is also to ensure that the budget for preventive health care reaches 10% of the total public health operational budget by 2015. The strategy underscores the importance of improving the quality and quantity of human resources to address NCDs and improve primary health care.
The World Bank supported the renovation of Vaiola Hospital on Tongatapu through a concessional loan for an amount of US$10 million. The renovation work took into consideration diabetes and heart diseases as a health priority, and the fact that the health system needed updated service delivery facilities to meet these challenges (World Bank, 2010 p. 41). The hospital was outdated, and mainly geared to the care of communicable diseases, which are no longer a health priority in Tonga.
One of the World Bank’s project components under the Health Sector Project was to improve health information management, which included the implementation of a community-based diabetes control program, as the management of NCD risk at the community-level was considered inadequate. Currently, 434 patients suffering from diabetes and hypertension are being treated and monitored at three such community health clinics. A planned NCD risk factor survey is to be implemented in 2010. (World Bank, 2010).
Main Goal Reduce NCDs by 2% per year by 2015
Main Targets Reduce the prevalence of diabetes by 10%Reduce the prevalence of adult/children obesity by 2%Improve the rate of moderate intensity physical activity per day by 10%Improve the rate of consumption of 5 servings of fruits/vegetables per day by 10%Reduce the prevalence of current tobacco smokers by 2%Reduce the prevalence of binge alcohol drinking among youth by 10%
T O N G A M i l l e n n i u m D e v e l o p m e n t G o a l s R e p o r t60
Vaiola hospital operates a diabetes clinic, which offers counseling on diabetes risk-factors, and follow-up for diabetic patients. The National Centre for Diabetes and Cardiovascular diseases is responsible for delivering health services and outreach programs for all inpatients and outpatients suffering from diabetes.
MDG6:THEWAYFORWARD
• The Ministry of Health cannot, alone, spur radical changes in the prevalence and incidence of NCDs as these are fundamental societal issues that require a multi-sectoral input and strong policy support.
• Resources must be mobilized to fund the primary prevention of NCDs.• Timely, comprehensive, and disaggregated data on NCDs are required to inform the policy and decision-making process, includ-
ing budgetary exercises.• The National Health Accounts should aim at providing disaggregated data on health financing for each major non-communica-
ble disease.• Measurements better adapted to Pacific Islanders are required to gauge the extent of obesity prevalence as BMI alone is not a
good indicator. Indicators that pinpoint to the proportion of body fat in Pacific Islanders are warranted.• Stronger awareness of sexually transmitted diseases must be raised within the younger age groups, including life skills for em-
powerment and prevention purposes.
T O N G A M i l l e n n i u m D e v e l o p m e n t G o a l s R e p o r t 61
GOAL 7: ENSURE ENVIRONMENTAL SUSTAINABILITY
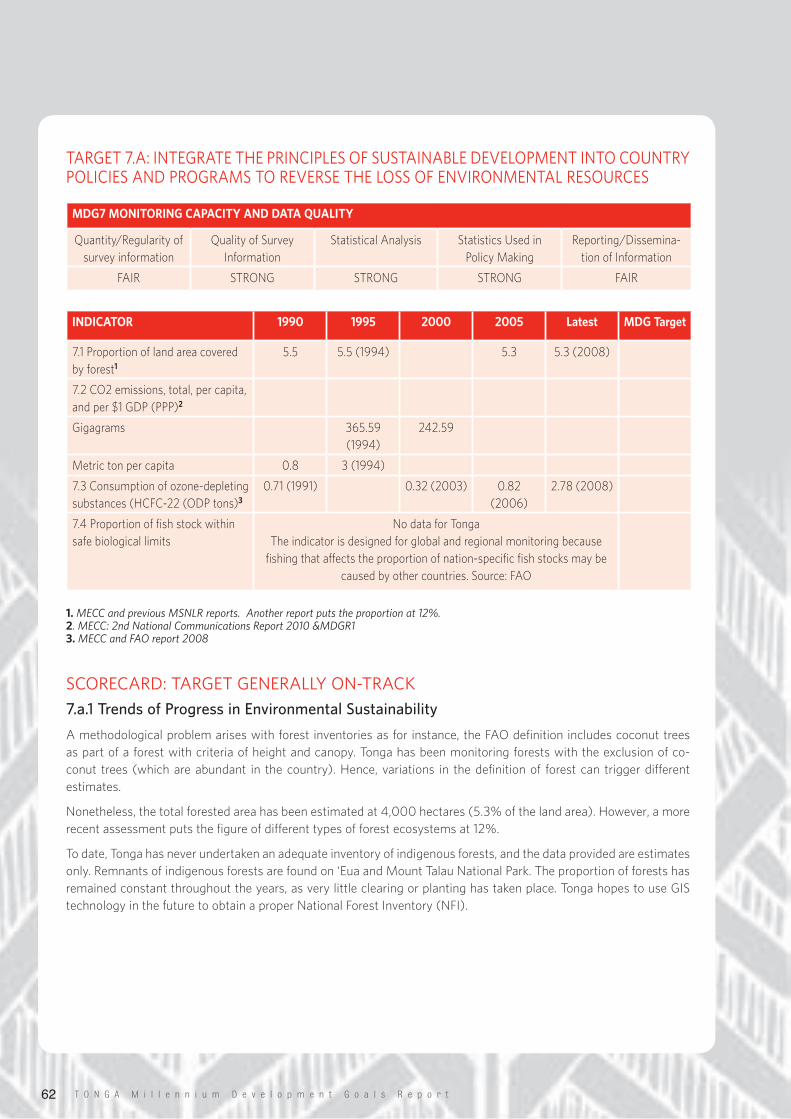
T O N G A M i l l e n n i u m D e v e l o p m e n t G o a l s R e p o r t62
TARGET7.A:INTEGRATETHEPRINCIPLESOFSUSTAINABLEDEVELOPMENTINTOCOUNTRYPOLICIESANDPROGRAMSTOREVERSETHELOSSOFENVIRONMENTALRESOURCES
1. MECC and previous MSNLR reports. Another report puts the proportion at 12%.2. MECC: 2nd National Communications Report 2010 &MDGR13. MECC and FAO report 2008
SCORECARD:TARGETGENERALLYON-TRACK
7.a.1 Trends of Progress in Environmental Sustainability
A methodological problem arises with forest inventories as for instance, the FAO definition includes coconut trees as part of a forest with criteria of height and canopy. Tonga has been monitoring forests with the exclusion of co-conut trees (which are abundant in the country). Hence, variations in the definition of forest can trigger different estimates.
Nonetheless, the total forested area has been estimated at 4,000 hectares (5.3% of the land area). However, a more recent assessment puts the figure of different types of forest ecosystems at 12%.
To date, Tonga has never undertaken an adequate inventory of indigenous forests, and the data provided are estimates only. Remnants of indigenous forests are found on ‘Eua and Mount Talau National Park. The proportion of forests has remained constant throughout the years, as very little clearing or planting has taken place. Tonga hopes to use GIS technology in the future to obtain a proper National Forest Inventory (NFI).
MDG7 MONITORING CAPACITY AND DATA QUALITY
Quantity/Regularity of survey information
Quality of Survey Information
Statistical Analysis Statistics Used in Policy Making
Reporting/Dissemina-tion of Information
FAIR STRONG STRONG STRONG FAIR
INDICATOR 1990 1995 2000 2005 Latest MDG Target
7.1 Proportion of land area covered by forest1
5.5 5.5 (1994) 5.3 5.3 (2008)
7.2 CO2 emissions, total, per capita, and per $1 GDP (PPP)2
Gigagrams 365.59 (1994)
242.59
Metric ton per capita 0.8 3 (1994)
7.3 Consumption of ozone-depleting substances (HCFC-22 (ODP tons)3
0.71 (1991) 0.32 (2003) 0.82 (2006)
2.78 (2008)
7.4 Proportion of fish stock within safe biological limits
No data for TongaThe indicator is designed for global and regional monitoring because
fishing that affects the proportion of nation-specific fish stocks may be caused by other countries. Source: FAO
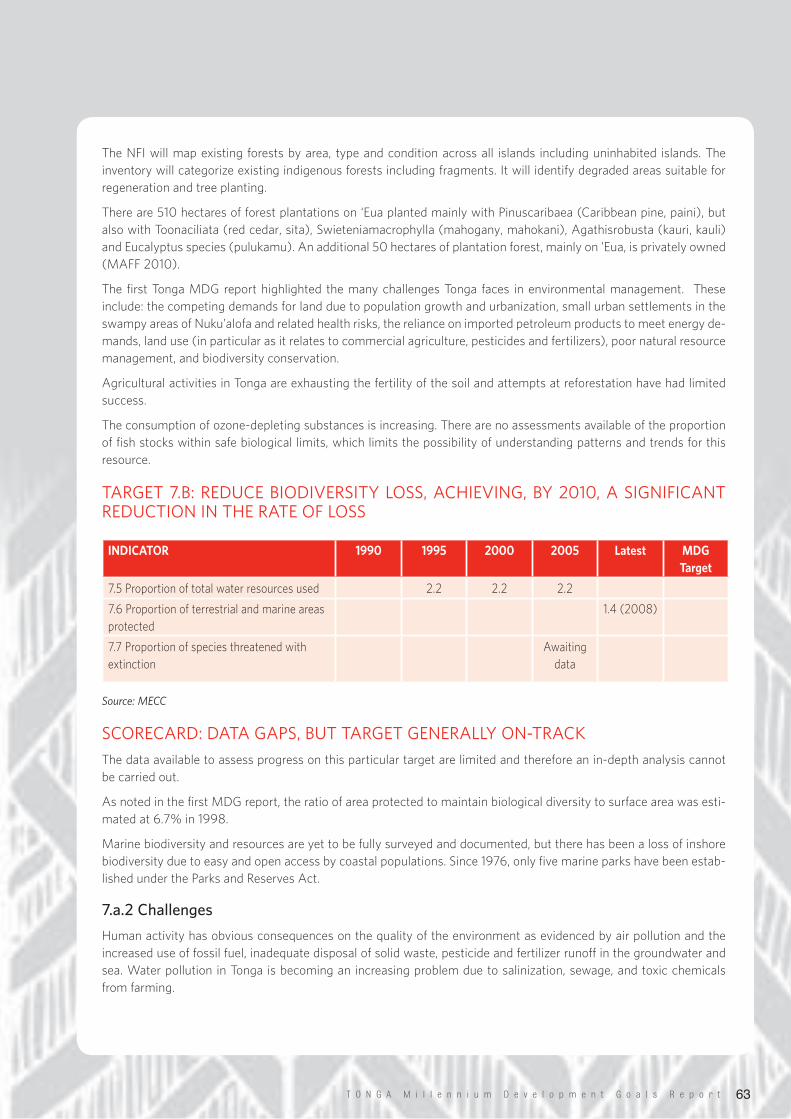
T O N G A M i l l e n n i u m D e v e l o p m e n t G o a l s R e p o r t 63
The NFI will map existing forests by area, type and condition across all islands including uninhabited islands. The inventory will categorize existing indigenous forests including fragments. It will identify degraded areas suitable for regeneration and tree planting.
There are 510 hectares of forest plantations on ‘Eua planted mainly with Pinuscaribaea (Caribbean pine, paini), but also with Toonaciliata (red cedar, sita), Swieteniamacrophylla (mahogany, mahokani), Agathisrobusta (kauri, kauli) and Eucalyptus species (pulukamu). An additional 50 hectares of plantation forest, mainly on ’Eua, is privately owned (MAFF 2010).
The first Tonga MDG report highlighted the many challenges Tonga faces in environmental management. These include: the competing demands for land due to population growth and urbanization, small urban settlements in the swampy areas of Nuku’alofa and related health risks, the reliance on imported petroleum products to meet energy de-mands, land use (in particular as it relates to commercial agriculture, pesticides and fertilizers), poor natural resource management, and biodiversity conservation.
Agricultural activities in Tonga are exhausting the fertility of the soil and attempts at reforestation have had limited success.
The consumption of ozone-depleting substances is increasing. There are no assessments available of the proportion of fish stocks within safe biological limits, which limits the possibility of understanding patterns and trends for this resource.
TARGET7.B:REDUCEBIODIVERSITYLOSS,ACHIEVING,BY2010,ASIGNIFICANTREDUCTIONINTHERATEOFLOSS
Source: MECC
SCORECARD:DATAGAPS,BUTTARGETGENERALLYON-TRACK
The data available to assess progress on this particular target are limited and therefore an in-depth analysis cannot be carried out.
As noted in the first MDG report, the ratio of area protected to maintain biological diversity to surface area was esti-mated at 6.7% in 1998.
Marine biodiversity and resources are yet to be fully surveyed and documented, but there has been a loss of inshore biodiversity due to easy and open access by coastal populations. Since 1976, only five marine parks have been estab-lished under the Parks and Reserves Act.
7.a.2 Challenges
Human activity has obvious consequences on the quality of the environment as evidenced by air pollution and the increased use of fossil fuel, inadequate disposal of solid waste, pesticide and fertilizer runoff in the groundwater and sea. Water pollution in Tonga is becoming an increasing problem due to salinization, sewage, and toxic chemicals from farming.
INDICATOR 1990 1995 2000 2005 Latest MDG Target
7.5 Proportion of total water resources used 2.2 2.2 2.2
7.6 Proportion of terrestrial and marine areas protected
1.4 (2008)
7.7 Proportion of species threatened with extinction
Awaiting data
T O N G A M i l l e n n i u m D e v e l o p m e n t G o a l s R e p o r t64
7.a.3 Efforts to Date
GovernmentalInstitutions
In October 2009, a new Ministry of Environment and Climate Change (MECC) was instituted, highlighting the gov-ernment’s commitment to tackling climate change, and a way of addressing the lack of coordination on environmental activities. MECC has a mandate to promote environment sustainability and act as a focal point for the South Pacific Regional Environment Program. In addition, MECC is the focal point for the Global Environment Facility (GEF), the global mechanism that funds the implementation of climate change, biodiversity, international water and renewable energy. The main GEF grants are managed by MECC while and the Civil Society Forum of Tonga manages the small GEF grants.
MECC established a thematic working group which undertook a greenhouse gas inventory. There were four main source categories of emissions identified in Tonga; namely energy, land use change & forestry, agriculture and water sectors.
The National Strategic Planning Framework affirms government commitment to environmental sustainability. It is one of the seven key outcome objectives.
MECC has submitted its first Communication Report on Climate Change, and is currently in the process of finalizing its second report. Tonga has also produced its fourth national report on biodiversity.
LegislativeFramework
The legislative framework consists of the following;• Environmental Impact Assessment Act of 2003• A Pesticides Act has been passed• An Environment Management Bill (EMB) has been drafted and submitted to the Law Reform Committee for con-
sideration • A Marine Pollution Bill was developed by the Ministry of Marine and Ports • An Ozone Bill and a Bio-Safety Bill have also been drafted
Environmental educational programs are carried out to engage communities and empower them to find solutions to environmental problems. These activities include live dramas, TV shows and advertisements. The “Environment Week” which takes place in the first week of June and coincides with “World Environment Day” is also promoted.
Overall, the environmental legislative framework is dynamic and many institutional mechanisms are in place to ensure the planning of environmental activities. However, the actual implementation of programs and enforcement of legisla-tion are weaknesses that need to be addressed to improve progress on MDG 7.
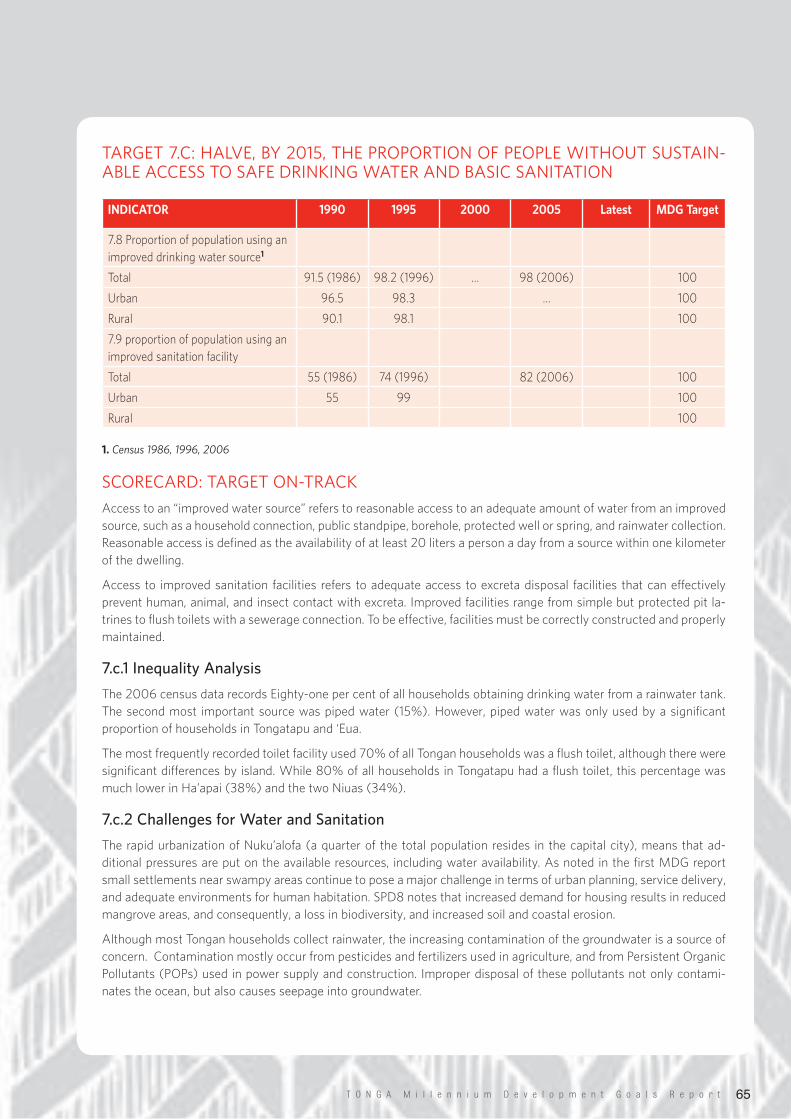
T O N G A M i l l e n n i u m D e v e l o p m e n t G o a l s R e p o r t 65
TARGET7.C:HALVE,BY2015,THEPROPORTIONOFPEOPLEWITHOUTSUSTAIN-ABLEACCESSTOSAFEDRINKINGWATERANDBASICSANITATION
1. Census 1986, 1996, 2006
SCORECARD:TARGETON-TRACK
Access to an “improved water source” refers to reasonable access to an adequate amount of water from an improved source, such as a household connection, public standpipe, borehole, protected well or spring, and rainwater collection. Reasonable access is defined as the availability of at least 20 liters a person a day from a source within one kilometer of the dwelling.
Access to improved sanitation facilities refers to adequate access to excreta disposal facilities that can effectively prevent human, animal, and insect contact with excreta. Improved facilities range from simple but protected pit la-trines to flush toilets with a sewerage connection. To be effective, facilities must be correctly constructed and properly maintained.
7.c.1 Inequality Analysis
The 2006 census data records Eighty-one per cent of all households obtaining drinking water from a rainwater tank. The second most important source was piped water (15%). However, piped water was only used by a significant proportion of households in Tongatapu and ‘Eua.
The most frequently recorded toilet facility used 70% of all Tongan households was a flush toilet, although there were significant differences by island. While 80% of all households in Tongatapu had a flush toilet, this percentage was much lower in Ha’apai (38%) and the two Niuas (34%).
7.c.2 Challenges for Water and Sanitation
The rapid urbanization of Nuku’alofa (a quarter of the total population resides in the capital city), means that ad-ditional pressures are put on the available resources, including water availability. As noted in the first MDG report small settlements near swampy areas continue to pose a major challenge in terms of urban planning, service delivery, and adequate environments for human habitation. SPD8 notes that increased demand for housing results in reduced mangrove areas, and consequently, a loss in biodiversity, and increased soil and coastal erosion.
Although most Tongan households collect rainwater, the increasing contamination of the groundwater is a source of concern. Contamination mostly occur from pesticides and fertilizers used in agriculture, and from Persistent Organic Pollutants (POPs) used in power supply and construction. Improper disposal of these pollutants not only contami-nates the ocean, but also causes seepage into groundwater.
INDICATOR 1990 1995 2000 2005 Latest MDG Target
7.8 Proportion of population using an improved drinking water source1
Total 91.5 (1986) 98.2 (1996) … 98 (2006) 100
Urban 96.5 98.3 … 100
Rural 90.1 98.1 100
7.9 proportion of population using an improved sanitation facility
Total 55 (1986) 74 (1996) 82 (2006) 100
Urban 55 99 100
Rural 100
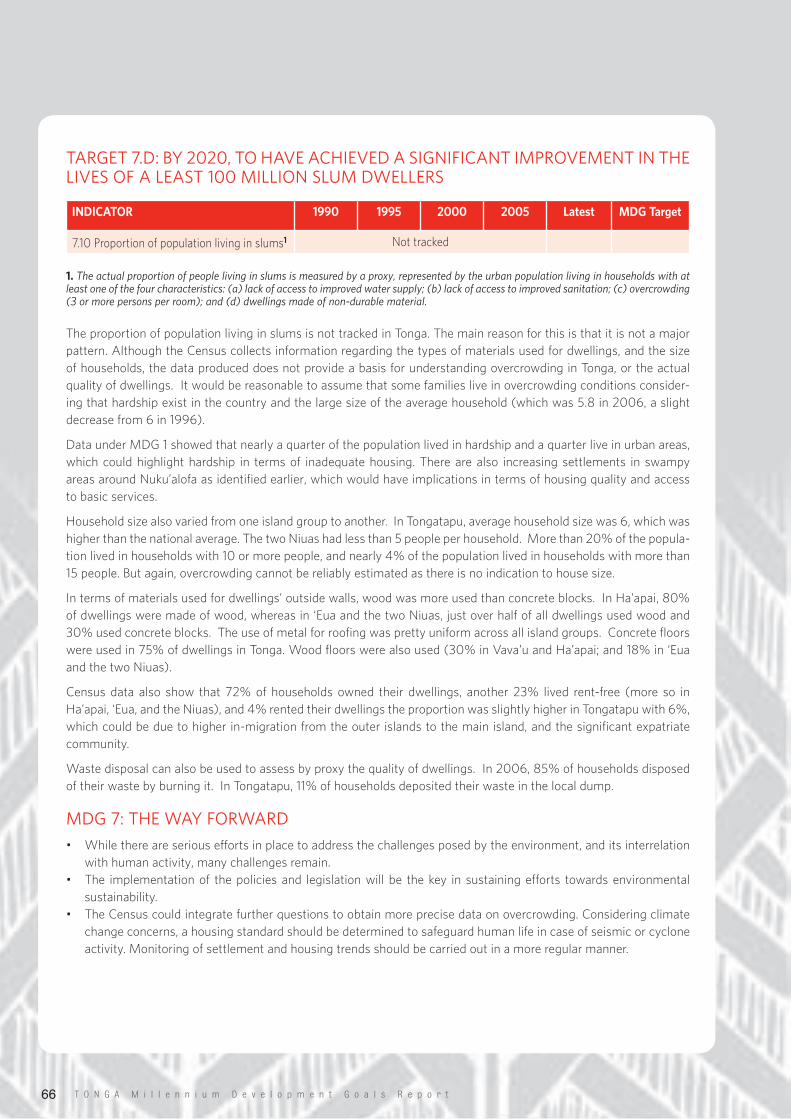
T O N G A M i l l e n n i u m D e v e l o p m e n t G o a l s R e p o r t66
TARGET7.D:BY2020,TOHAVEACHIEVEDASIGNIFICANTIMPROVEMENTINTHELIVESOFALEAST100MILLIONSLUMDWELLERS
1. The actual proportion of people living in slums is measured by a proxy, represented by the urban population living in households with at least one of the four characteristics: (a) lack of access to improved water supply; (b) lack of access to improved sanitation; (c) overcrowding (3 or more persons per room); and (d) dwellings made of non-durable material.
The proportion of population living in slums is not tracked in Tonga. The main reason for this is that it is not a major pattern. Although the Census collects information regarding the types of materials used for dwellings, and the size of households, the data produced does not provide a basis for understanding overcrowding in Tonga, or the actual quality of dwellings. It would be reasonable to assume that some families live in overcrowding conditions consider-ing that hardship exist in the country and the large size of the average household (which was 5.8 in 2006, a slight decrease from 6 in 1996).
Data under MDG 1 showed that nearly a quarter of the population lived in hardship and a quarter live in urban areas, which could highlight hardship in terms of inadequate housing. There are also increasing settlements in swampy areas around Nuku’alofa as identified earlier, which would have implications in terms of housing quality and access to basic services.
Household size also varied from one island group to another. In Tongatapu, average household size was 6, which was higher than the national average. The two Niuas had less than 5 people per household. More than 20% of the popula-tion lived in households with 10 or more people, and nearly 4% of the population lived in households with more than 15 people. But again, overcrowding cannot be reliably estimated as there is no indication to house size.
In terms of materials used for dwellings’ outside walls, wood was more used than concrete blocks. In Ha’apai, 80% of dwellings were made of wood, whereas in ‘Eua and the two Niuas, just over half of all dwellings used wood and 30% used concrete blocks. The use of metal for roofing was pretty uniform across all island groups. Concrete floors were used in 75% of dwellings in Tonga. Wood floors were also used (30% in Vava’u and Ha’apai; and 18% in ‘Eua and the two Niuas).
Census data also show that 72% of households owned their dwellings, another 23% lived rent-free (more so in Ha’apai, ‘Eua, and the Niuas), and 4% rented their dwellings the proportion was slightly higher in Tongatapu with 6%, which could be due to higher in-migration from the outer islands to the main island, and the significant expatriate community.
Waste disposal can also be used to assess by proxy the quality of dwellings. In 2006, 85% of households disposed of their waste by burning it. In Tongatapu, 11% of households deposited their waste in the local dump.
MDG7:THEWAYFORWARD
• While there are serious efforts in place to address the challenges posed by the environment, and its interrelation with human activity, many challenges remain.
• The implementation of the policies and legislation will be the key in sustaining efforts towards environmental sustainability.
• The Census could integrate further questions to obtain more precise data on overcrowding. Considering climate change concerns, a housing standard should be determined to safeguard human life in case of seismic or cyclone activity. Monitoring of settlement and housing trends should be carried out in a more regular manner.
INDICATOR 1990 1995 2000 2005 Latest MDG Target
7.10 Proportion of population living in slums1 Not tracked
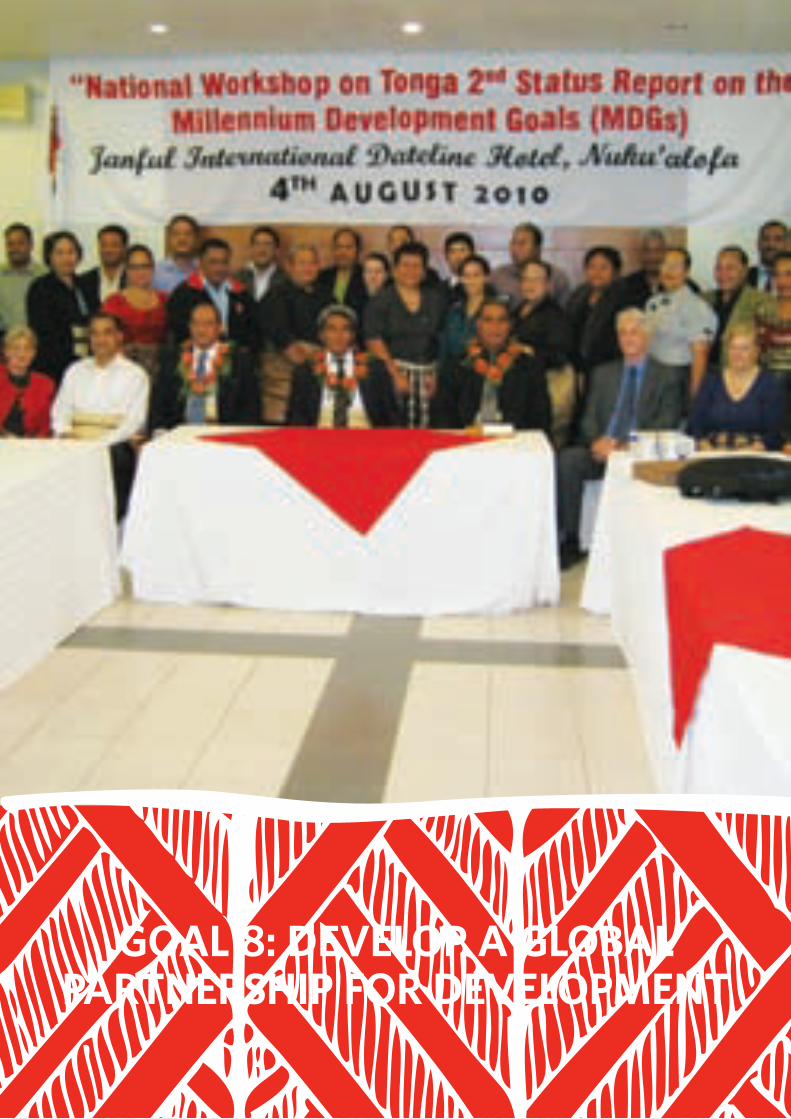
T O N G A M i l l e n n i u m D e v e l o p m e n t G o a l s R e p o r t 67
GOAL 8: DEVELOP A GLOBAL PARTNERSHIP FOR DEVELOPMENT
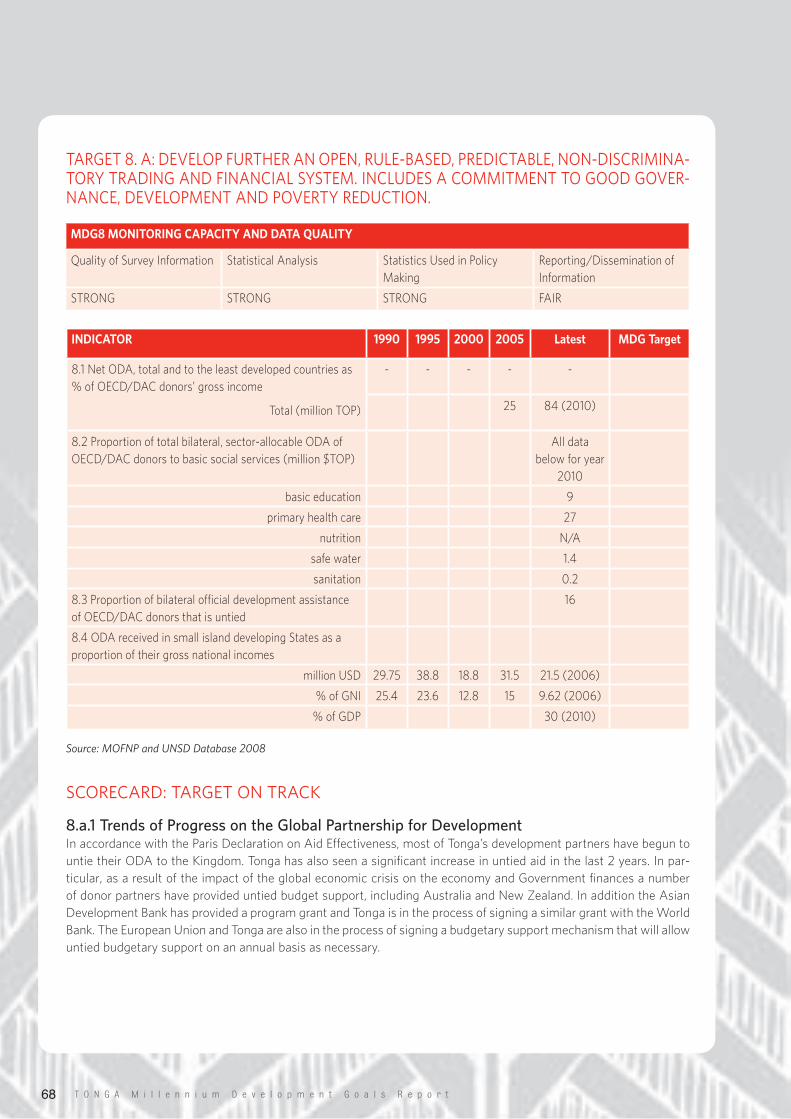
T O N G A M i l l e n n i u m D e v e l o p m e n t G o a l s R e p o r t68
TARGET8.A:DEVELOPFURTHERANOPEN,RULE-BASED,PREDICTABLE,NON-DISCRIMINA-TORYTRADINGANDFINANCIALSYSTEM.INCLUDESACOMMITMENTTOGOODGOVER-NANCE,DEVELOPMENTANDPOVERTYREDUCTION.
Source: MOFNP and UNSD Database 2008
SCORECARD:TARGETONTRACK
8.a.1 Trends of Progress on the Global Partnership for DevelopmentIn accordance with the Paris Declaration on Aid Effectiveness, most of Tonga’s development partners have begun to untie their ODA to the Kingdom. Tonga has also seen a significant increase in untied aid in the last 2 years. In par-ticular, as a result of the impact of the global economic crisis on the economy and Government finances a number of donor partners have provided untied budget support, including Australia and New Zealand. In addition the Asian Development Bank has provided a program grant and Tonga is in the process of signing a similar grant with the World Bank. The European Union and Tonga are also in the process of signing a budgetary support mechanism that will allow untied budgetary support on an annual basis as necessary.
MDG8 MONITORING CAPACITY AND DATA QUALITY
Quality of Survey Information Statistical Analysis Statistics Used in Policy Making
Reporting/Dissemination of Information
STRONG STRONG STRONG FAIR
INDICATOR 1990 1995 2000 2005 Latest MDG Target
8.1 Net ODA, total and to the least developed countries as % of OECD/DAC donors’ gross income Total (million TOP)
- - - - -
25 84 (2010)
8.2 Proportion of total bilateral, sector-allocable ODA of OECD/DAC donors to basic social services (million $TOP)
All data below for year
2010
basic education 9
primary health care 27
nutrition N/A
safe water 1.4
sanitation 0.2
8.3 Proportion of bilateral official development assistance of OECD/DAC donors that is untied
16
8.4 ODA received in small island developing States as a proportion of their gross national incomes
million USD 29.75 38.8 18.8 31.5 21.5 (2006)
% of GNI 25.4 23.6 12.8 15 9.62 (2006)
% of GDP 30 (2010)
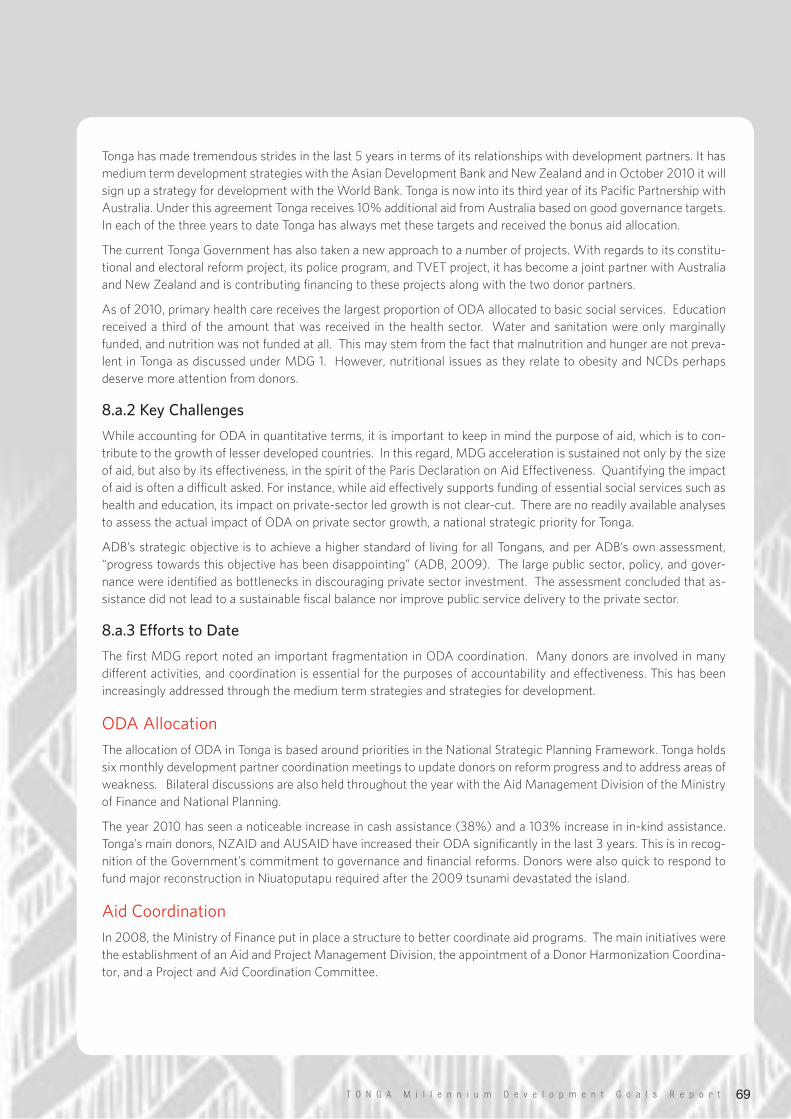
T O N G A M i l l e n n i u m D e v e l o p m e n t G o a l s R e p o r t 69
Tonga has made tremendous strides in the last 5 years in terms of its relationships with development partners. It has medium term development strategies with the Asian Development Bank and New Zealand and in October 2010 it will sign up a strategy for development with the World Bank. Tonga is now into its third year of its Pacific Partnership with Australia. Under this agreement Tonga receives 10% additional aid from Australia based on good governance targets. In each of the three years to date Tonga has always met these targets and received the bonus aid allocation.
The current Tonga Government has also taken a new approach to a number of projects. With regards to its constitu-tional and electoral reform project, its police program, and TVET project, it has become a joint partner with Australia and New Zealand and is contributing financing to these projects along with the two donor partners.
As of 2010, primary health care receives the largest proportion of ODA allocated to basic social services. Education received a third of the amount that was received in the health sector. Water and sanitation were only marginally funded, and nutrition was not funded at all. This may stem from the fact that malnutrition and hunger are not preva-lent in Tonga as discussed under MDG 1. However, nutritional issues as they relate to obesity and NCDs perhaps deserve more attention from donors.
8.a.2 Key Challenges
While accounting for ODA in quantitative terms, it is important to keep in mind the purpose of aid, which is to con-tribute to the growth of lesser developed countries. In this regard, MDG acceleration is sustained not only by the size of aid, but also by its effectiveness, in the spirit of the Paris Declaration on Aid Effectiveness. Quantifying the impact of aid is often a difficult asked. For instance, while aid effectively supports funding of essential social services such as health and education, its impact on private-sector led growth is not clear-cut. There are no readily available analyses to assess the actual impact of ODA on private sector growth, a national strategic priority for Tonga.
ADB’s strategic objective is to achieve a higher standard of living for all Tongans, and per ADB’s own assessment, “progress towards this objective has been disappointing” (ADB, 2009). The large public sector, policy, and gover-nance were identified as bottlenecks in discouraging private sector investment. The assessment concluded that as-sistance did not lead to a sustainable fiscal balance nor improve public service delivery to the private sector.
8.a.3 Efforts to Date
The first MDG report noted an important fragmentation in ODA coordination. Many donors are involved in many different activities, and coordination is essential for the purposes of accountability and effectiveness. This has been increasingly addressed through the medium term strategies and strategies for development.
ODAAllocation
The allocation of ODA in Tonga is based around priorities in the National Strategic Planning Framework. Tonga holds six monthly development partner coordination meetings to update donors on reform progress and to address areas of weakness. Bilateral discussions are also held throughout the year with the Aid Management Division of the Ministry of Finance and National Planning.
The year 2010 has seen a noticeable increase in cash assistance (38%) and a 103% increase in in-kind assistance. Tonga’s main donors, NZAID and AUSAID have increased their ODA significantly in the last 3 years. This is in recog-nition of the Government’s commitment to governance and financial reforms. Donors were also quick to respond to fund major reconstruction in Niuatoputapu required after the 2009 tsunami devastated the island.
AidCoordination
In 2008, the Ministry of Finance put in place a structure to better coordinate aid programs. The main initiatives were the establishment of an Aid and Project Management Division, the appointment of a Donor Harmonization Coordina-tor, and a Project and Aid Coordination Committee.
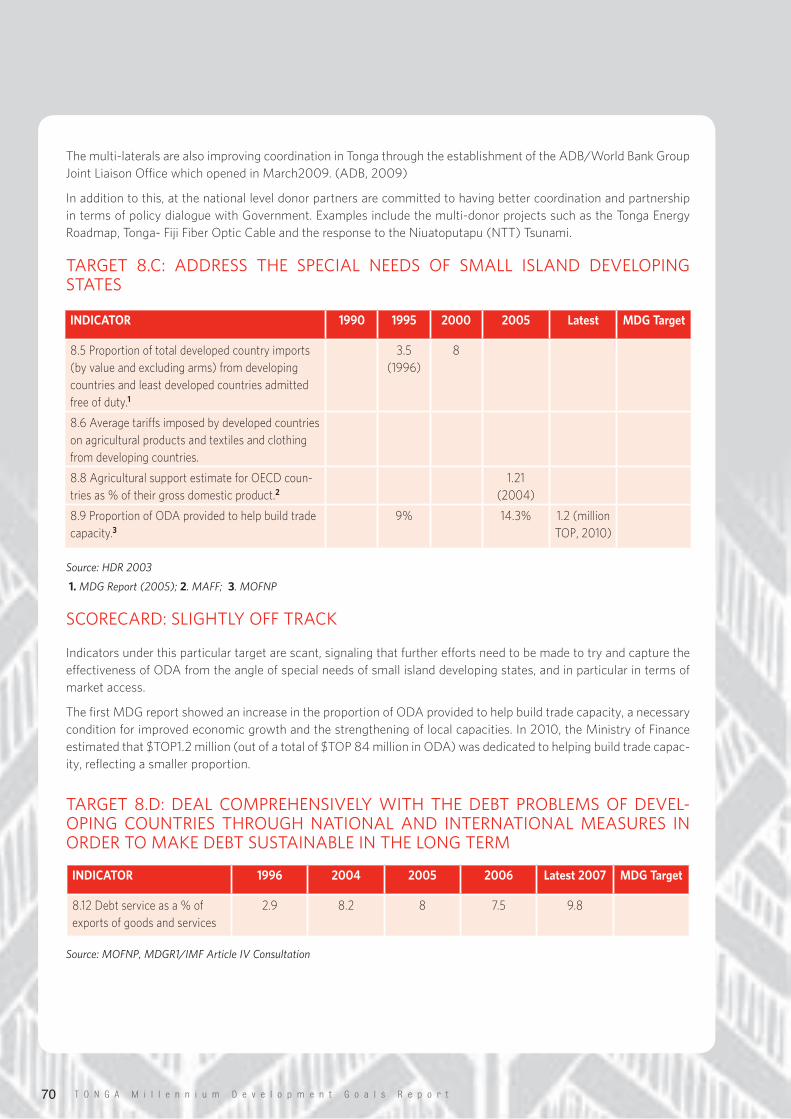
T O N G A M i l l e n n i u m D e v e l o p m e n t G o a l s R e p o r t70
The multi-laterals are also improving coordination in Tonga through the establishment of the ADB/World Bank Group Joint Liaison Office which opened in March2009. (ADB, 2009)
In addition to this, at the national level donor partners are committed to having better coordination and partnership in terms of policy dialogue with Government. Examples include the multi-donor projects such as the Tonga Energy Roadmap, Tonga- Fiji Fiber Optic Cable and the response to the Niuatoputapu (NTT) Tsunami.
TARGET 8.C: ADDRESS THE SPECIAL NEEDS OF SMALL ISLAND DEVELOPINGSTATES
Source: HDR 2003
1. MDG Report (2005); 2. MAFF; 3. MOFNP
SCORECARD:SLIGHTLYOFFTRACK
Indicators under this particular target are scant, signaling that further efforts need to be made to try and capture the effectiveness of ODA from the angle of special needs of small island developing states, and in particular in terms of market access.
The first MDG report showed an increase in the proportion of ODA provided to help build trade capacity, a necessary condition for improved economic growth and the strengthening of local capacities. In 2010, the Ministry of Finance estimated that $TOP1.2 million (out of a total of $TOP 84 million in ODA) was dedicated to helping build trade capac-ity, reflecting a smaller proportion.
TARGET8.D:DEALCOMPREHENSIVELYWITHTHEDEBTPROBLEMSOFDEVEL-OPINGCOUNTRIESTHROUGHNATIONALAND INTERNATIONALMEASURES INORDERTOMAKEDEBTSUSTAINABLEINTHELONGTERM
Source: MOFNP, MDGR1/IMF Article IV Consultation
INDICATOR 1990 1995 2000 2005 Latest MDG Target
8.5 Proportion of total developed country imports (by value and excluding arms) from developing countries and least developed countries admitted free of duty.1
3.5 (1996)
8
8.6 Average tariffs imposed by developed countries on agricultural products and textiles and clothing from developing countries.
8.8 Agricultural support estimate for OECD coun-tries as % of their gross domestic product.2
1.21 (2004)
8.9 Proportion of ODA provided to help build trade capacity.3
9% 14.3% 1.2 (million TOP, 2010)
INDICATOR 1996 2004 2005 2006 Latest 2007 MDG Target
8.12 Debt service as a % of exports of goods and services
2.9 8.2 8 7.5 9.8
T O N G A M i l l e n n i u m D e v e l o p m e n t G o a l s R e p o r t 71
SCORECARD:TARGETISON-TRACK
8.d.1 Trends of Tonga’s Debt
Although target 8.D mainly focuses on highly indebted countries (Tonga is not officially ranked as such), a discussion of Tonga’s debt level is relevant here.
The annual debt sustainability analysis carried out by the IMF Article IV for 2010 confirms that external debt levels will continue to rise and to remain above exports and GDP sustainability thresholds. At 30 June 2010, it is estimated that external debt accounts for 36% of GDP. In an effort by Government to maintain sovereign debt within levels that are sustainable over time, a Sustainable Debt Policy was approved in May 2009 by Cabinet. Explicit debt targets are based on the IMF’s sustainable debt indicators. The targets are modified to reflect the unique aspects of the Tongan economy, namely the low formal export base and the large remittances flows.
The IMF in its review of the Tonga economy determined that debt was currently sustainable but this could easily change if Tonga was subject to any one of a number of adverse shocks. Specific risks included interest rate move-ments or declines in either export performance or remittances. To minimize this risk IMF recommended all new debt only be entered into if it can be obtained at highly concessional rates and does not seriously impact on the sustain-ability of overall debt levels.
The Government of Tonga clearly followed this policy recommendation when it signed up to its latest Roads loan as this is at concessional rates with a 5 year grace period on repayments. Therefore, the government felt Tonga has 5 years to recover from the current economic crisis and to bring the debt levels within the sustainable target rate.
Furthermore, the debt policy recognizes that in times of extreme economic conditions there may be periods when the government is required to incur further debt and operate outside of these targets for short periods of time to provide a fiscal stimulus to the economy. The size and duration of the periods of departure from this policy will need to be determined on a case by case basis depending on the specific economic conditions facing Tonga at the time.
When considering the 2010 Roads loan, the government felt that losing over 30% of remittances in an 18 month period was extreme and some fiscal stimulus was required for the economy. The roads program presented such an opportunity. It was also felt that the departure from the policy target was for a period of less than 5 years and was therefore manageable.
Regular monthly reporting is provided internally by the Debt Management Division of the Ministry of Finance and Na-tional Planning and quarterly to the Expenditure Review Committee. Information covers status of the sovereign debt portfolio, including the debt sustainability indicator levels and debt service projections on a short to long term basis. Debt data is captured mainly on the CS-DRMS (Commonwealth Secretariat Debt Recording Management System) and debt payments are also captured on the SUN (accounting) System.
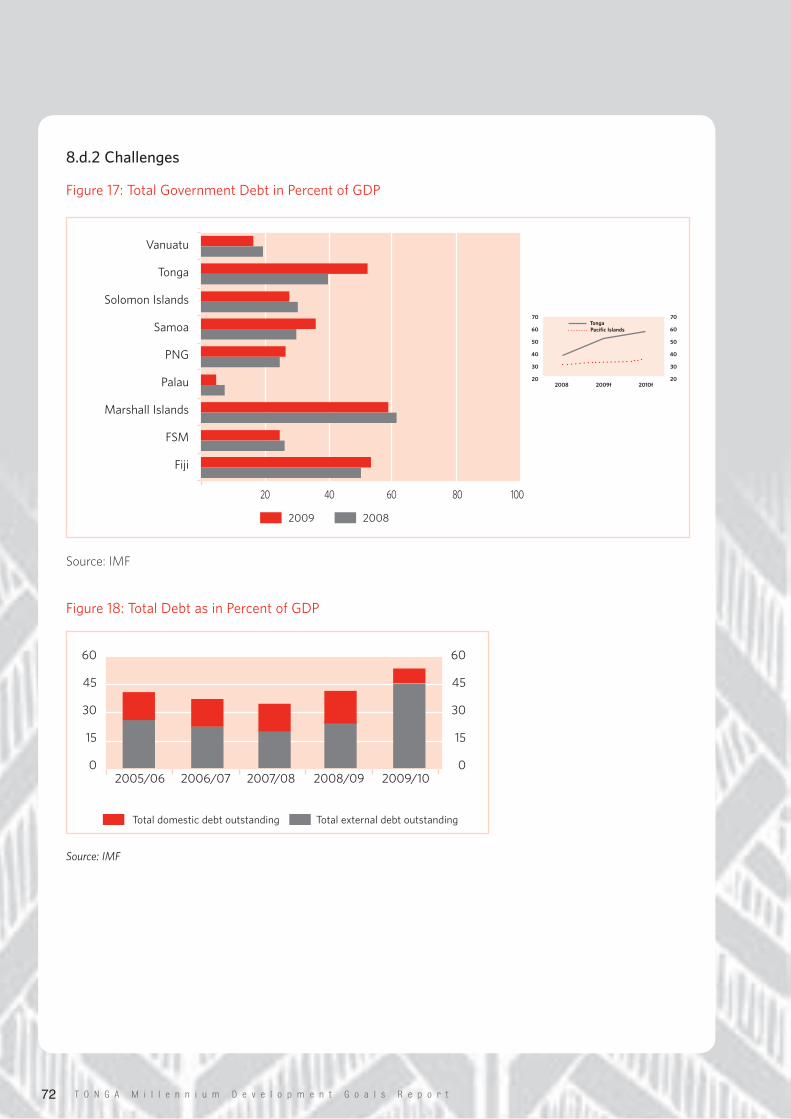
T O N G A M i l l e n n i u m D e v e l o p m e n t G o a l s R e p o r t72
8.d.2 Challenges
Figure17:TotalGovernmentDebtinPercentofGDP
Source: IMF
Figure18:TotalDebtasinPercentofGDP
Source: IMF
20 40 8060 100
Vanuatu
Tonga
SolomonIslands
Samoa
PNG
Palau
MarshallIslands
FSM
Fiji
2009 2008
70
60
50
40
30
202008
TongaPacific Islands
2009f 2010f
70
60
50
40
30
20
60
45
30
15
02005/06 2006/07 2007/08 2008/09 2009/10
60
45
30
15
0
Totaldomesticdebtoutstanding Totalexternaldebtoutstanding
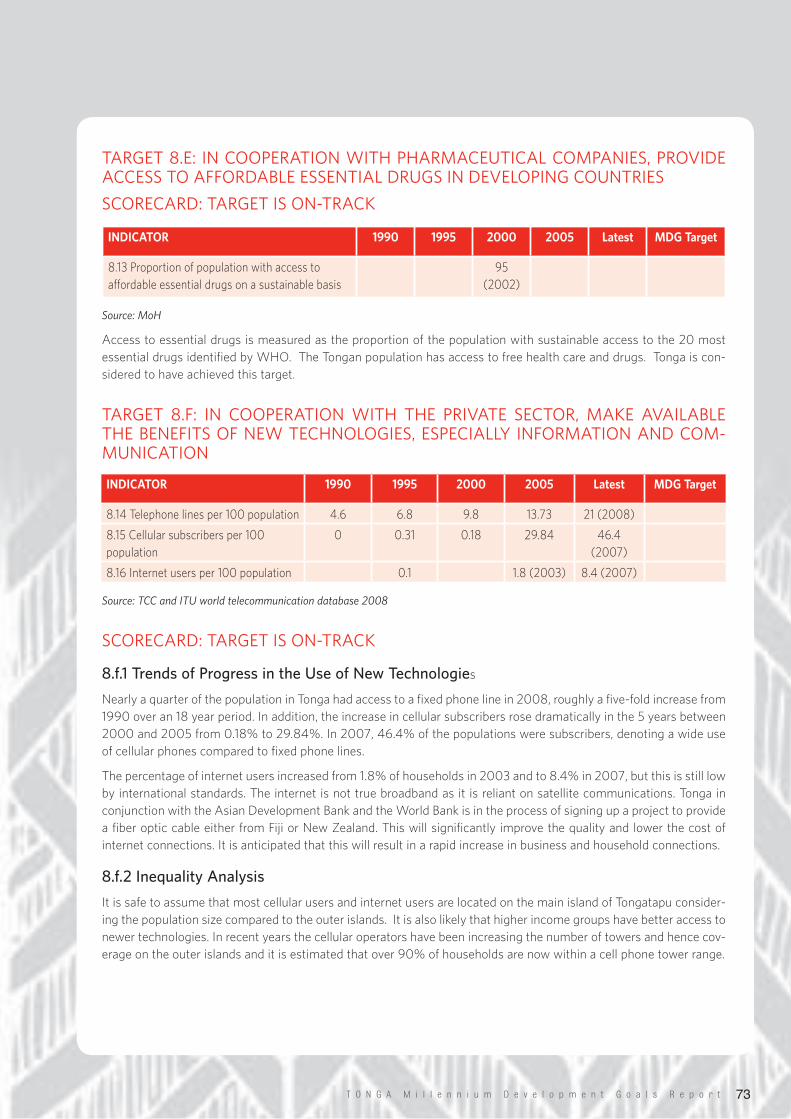
T O N G A M i l l e n n i u m D e v e l o p m e n t G o a l s R e p o r t 73
INDICATOR 1990 1995 2000 2005 Latest MDG Target
8.13 Proportion of population with access to affordable essential drugs on a sustainable basis
95 (2002)
INDICATOR 1990 1995 2000 2005 Latest MDG Target
8.14 Telephone lines per 100 population 4.6 6.8 9.8 13.73 21 (2008)
8.15 Cellular subscribers per 100 population
0 0.31 0.18 29.84 46.4 (2007)
8.16 Internet users per 100 population 0.1 1.8 (2003) 8.4 (2007)
TARGET8.E:INCOOPERATIONWITHPHARMACEUTICALCOMPANIES,PROVIDEACCESSTOAFFORDABLEESSENTIALDRUGSINDEVELOPINGCOUNTRIES
SCORECARD:TARGETISON-TRACK
Source: MoH
Access to essential drugs is measured as the proportion of the population with sustainable access to the 20 most essential drugs identified by WHO. The Tongan population has access to free health care and drugs. Tonga is con-sidered to have achieved this target.
TARGET 8.F: IN COOPERATIONWITH THE PRIVATE SECTOR,MAKE AVAILABLETHEBENEFITSOFNEWTECHNOLOGIES,ESPECIALLYINFORMATIONANDCOM-MUNICATION
Source: TCC and ITU world telecommunication database 2008
SCORECARD:TARGETISON-TRACK
8.f.1 Trends of Progress in the Use of New Technologies
Nearly a quarter of the population in Tonga had access to a fixed phone line in 2008, roughly a five-fold increase from 1990 over an 18 year period. In addition, the increase in cellular subscribers rose dramatically in the 5 years between 2000 and 2005 from 0.18% to 29.84%. In 2007, 46.4% of the populations were subscribers, denoting a wide use of cellular phones compared to fixed phone lines.
The percentage of internet users increased from 1.8% of households in 2003 and to 8.4% in 2007, but this is still low by international standards. The internet is not true broadband as it is reliant on satellite communications. Tonga in conjunction with the Asian Development Bank and the World Bank is in the process of signing up a project to provide a fiber optic cable either from Fiji or New Zealand. This will significantly improve the quality and lower the cost of internet connections. It is anticipated that this will result in a rapid increase in business and household connections.
8.f.2 Inequality Analysis
It is safe to assume that most cellular users and internet users are located on the main island of Tongatapu consider-ing the population size compared to the outer islands. It is also likely that higher income groups have better access to newer technologies. In recent years the cellular operators have been increasing the number of towers and hence cov-erage on the outer islands and it is estimated that over 90% of households are now within a cell phone tower range.
T O N G A M i l l e n n i u m D e v e l o p m e n t G o a l s R e p o r t74
8.f.3 Key Challenges
As seen above, challenges in more equitable access to technologies persist. There are also challenges in diversifying the use of these technologies, in particular in relation to the internet. The internet is an under-utilized resource mainly as a result of the pricing issue. Expanding the scope of benefits that this technology could bring is important. For instance, students in secondary schools are being taught to use the internet as a research tool; however students in primary schools do not, or rarely, have access to this technology. The internet is mainly used by the general population for email access, and for social networking.
The internet is somewhat under-utilized within Government ministries. Some ministries for instance post their annual reports online on their websites and others don’t. Doing so on a systematic basis could facilitate access to information and ensure increased transparency.
As noted above, the introduction of the fiber optic cable will significantly address these key challenges.
8.f.4 Key Factors that Contributed to Accelerated Progress
RegulatoryReformsandCompetitionintheMobileMarket
The government is committed to establishing and supporting competition in the communication sector. Although the government remains the sole shareholder of the Tonga Communications Corporation (TCC), the sole operator of landline telephones, there is current provision for shareholding by the private sector. Under the Tonga Participation Scheme, up to 10% of shares would be made available to local and overseas-based Tongans.
TCC operates Kalianet, the main internet service provider on the island, and U-Call Mobile GSM network. A second carrier, Digicel (an Irish-based company) purchased mobile and TV operator TONFON in 2008. The regulatory re-forms with the introduction of TONFON in 2002 enabled a 200% decline in tariffs, enabling a wider access from a price perspective (Paul Budde Communication Pty Ltd, 2008). The competition reduced mobile phone tariffs as can be seen in the figure below, placing Tonga as the most competitive country in the Pacific in terms of mobile phone rates.
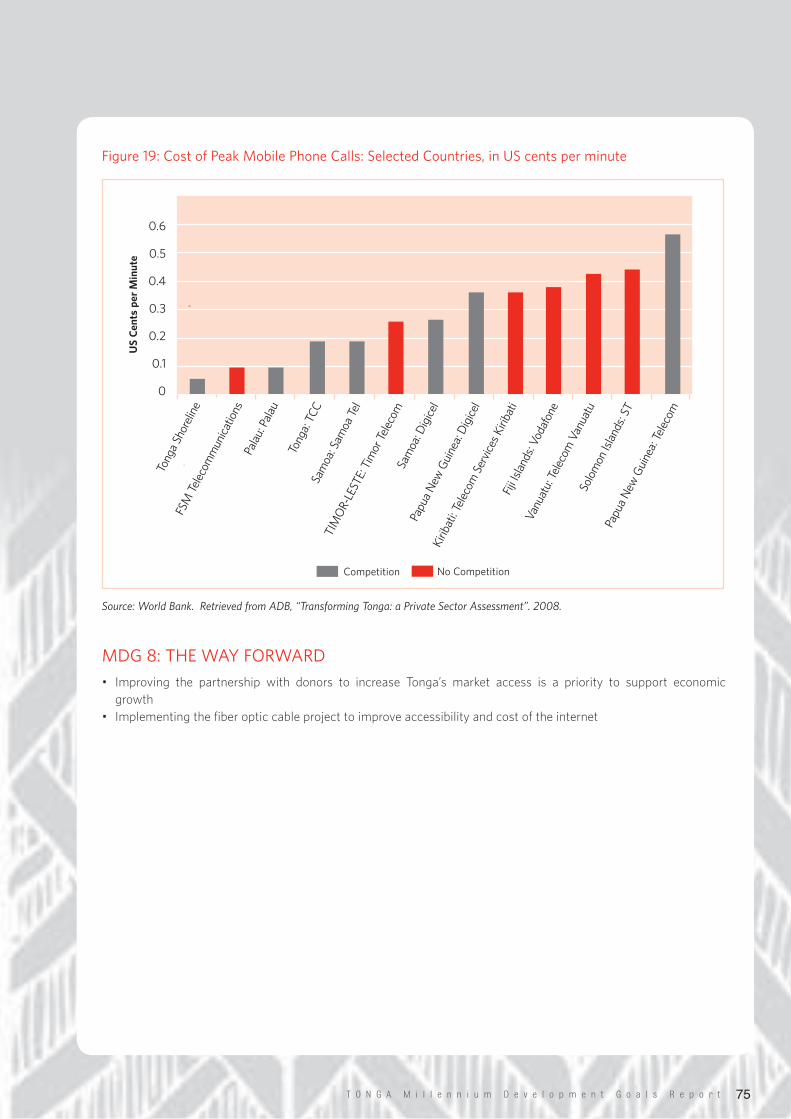
T O N G A M i l l e n n i u m D e v e l o p m e n t G o a l s R e p o r t 75
Figure19:CostofPeakMobilePhoneCalls:SelectedCountries,inUScentsperminute
Source: World Bank. Retrieved from ADB, “Transforming Tonga: a Private Sector Assessment”. 2008.
MDG8:THEWAYFORWARD
• Improving the partnership with donors to increase Tonga’s market access is a priority to support economic growth
• Implementing the fiber optic cable project to improve accessibility and cost of the internet
Competition NoCompetition
US
Cen
ts p
er M
inut
e
0.6
0.5
0.4
0.3
0.2
0.1
0
TongaShoreline
FSMTelecom
munications
Palau:Palau
Tonga:TCC
Samoa:Sam
oaTel
TIMOR-LESTE:TimorTelecom
Samoa:D
igicel
PapuaNew
Guinea:Digicel
Kiribati:TelecomServicesKiribati
FijiIslands:Vo
dafone
Vanuatu:Telecom
Vanuatu
SolomonIslands:ST
PapuaNew
Guinea:Telecom
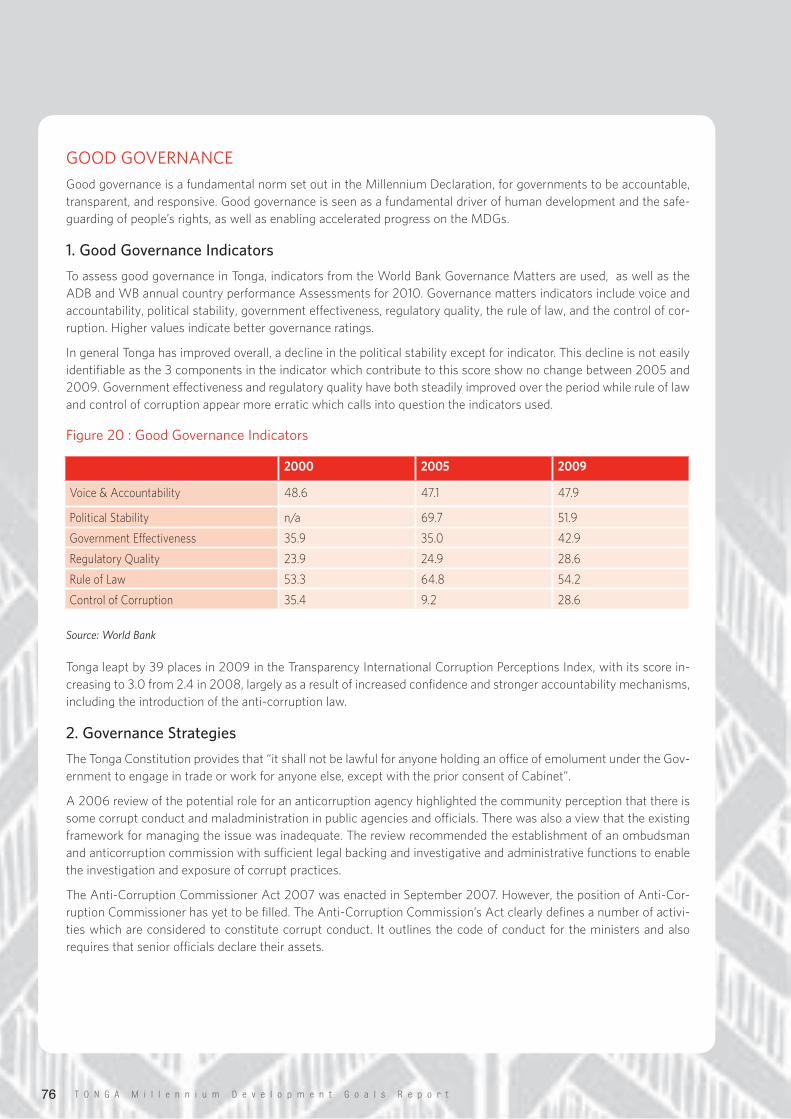
T O N G A M i l l e n n i u m D e v e l o p m e n t G o a l s R e p o r t76
GOODGOVERNANCE
Good governance is a fundamental norm set out in the Millennium Declaration, for governments to be accountable, transparent, and responsive. Good governance is seen as a fundamental driver of human development and the safe-guarding of people’s rights, as well as enabling accelerated progress on the MDGs.
1. Good Governance Indicators
To assess good governance in Tonga, indicators from the World Bank Governance Matters are used, as well as the ADB and WB annual country performance Assessments for 2010. Governance matters indicators include voice and accountability, political stability, government effectiveness, regulatory quality, the rule of law, and the control of cor-ruption. Higher values indicate better governance ratings.
In general Tonga has improved overall, a decline in the political stability except for indicator. This decline is not easily identifiable as the 3 components in the indicator which contribute to this score show no change between 2005 and 2009. Government effectiveness and regulatory quality have both steadily improved over the period while rule of law and control of corruption appear more erratic which calls into question the indicators used.
Figure20:GoodGovernanceIndicators
Source: World Bank
Tonga leapt by 39 places in 2009 in the Transparency International Corruption Perceptions Index, with its score in-creasing to 3.0 from 2.4 in 2008, largely as a result of increased confidence and stronger accountability mechanisms, including the introduction of the anti-corruption law.
2. Governance Strategies
The Tonga Constitution provides that “it shall not be lawful for anyone holding an office of emolument under the Gov-ernment to engage in trade or work for anyone else, except with the prior consent of Cabinet”.
A 2006 review of the potential role for an anticorruption agency highlighted the community perception that there is some corrupt conduct and maladministration in public agencies and officials. There was also a view that the existing framework for managing the issue was inadequate. The review recommended the establishment of an ombudsman and anticorruption commission with sufficient legal backing and investigative and administrative functions to enable the investigation and exposure of corrupt practices.
The Anti-Corruption Commissioner Act 2007 was enacted in September 2007. However, the position of Anti-Cor-ruption Commissioner has yet to be filled. The Anti-Corruption Commission’s Act clearly defines a number of activi-ties which are considered to constitute corrupt conduct. It outlines the code of conduct for the ministers and also requires that senior officials declare their assets.
2000 2005 2009
Voice & Accountability 48.6 47.1 47.9
Political Stability n/a 69.7 51.9
Government Effectiveness 35.9 35.0 42.9
Regulatory Quality 23.9 24.9 28.6
Rule of Law 53.3 64.8 54.2
Control of Corruption 35.4 9.2 28.6
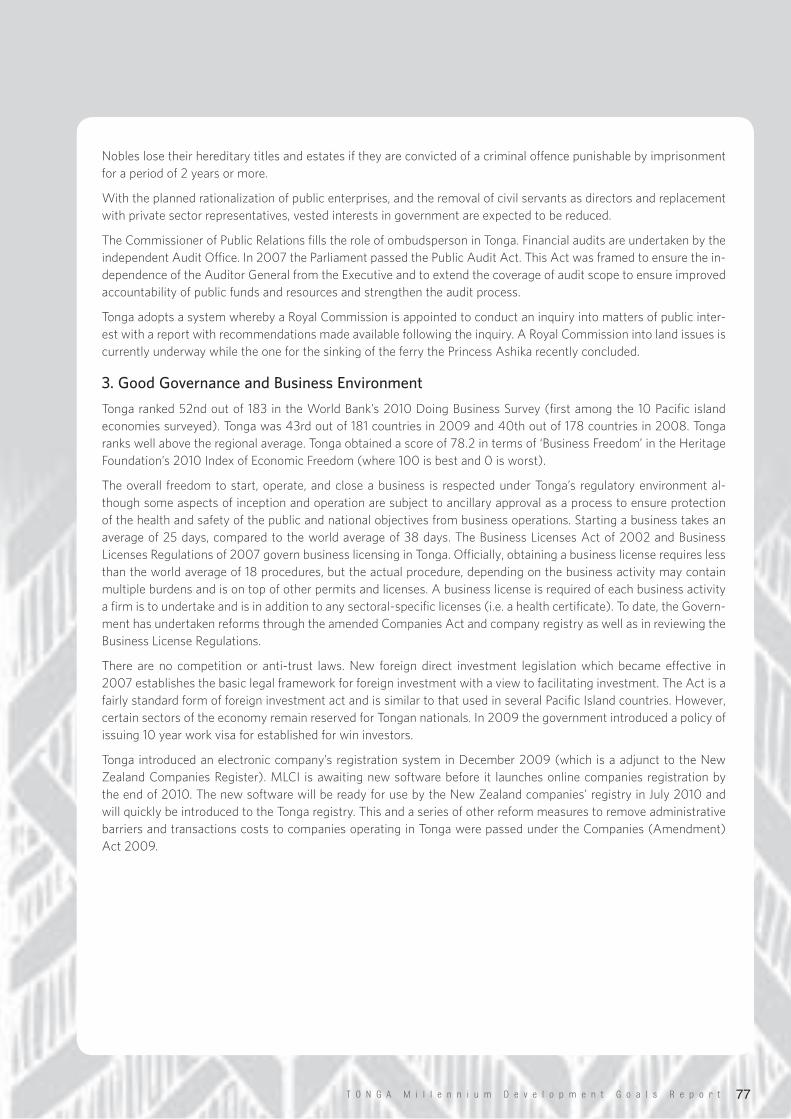
T O N G A M i l l e n n i u m D e v e l o p m e n t G o a l s R e p o r t 77
Nobles lose their hereditary titles and estates if they are convicted of a criminal offence punishable by imprisonment for a period of 2 years or more.
With the planned rationalization of public enterprises, and the removal of civil servants as directors and replacement with private sector representatives, vested interests in government are expected to be reduced.
The Commissioner of Public Relations fills the role of ombudsperson in Tonga. Financial audits are undertaken by the independent Audit Office. In 2007 the Parliament passed the Public Audit Act. This Act was framed to ensure the in-dependence of the Auditor General from the Executive and to extend the coverage of audit scope to ensure improved accountability of public funds and resources and strengthen the audit process.
Tonga adopts a system whereby a Royal Commission is appointed to conduct an inquiry into matters of public inter-est with a report with recommendations made available following the inquiry. A Royal Commission into land issues is currently underway while the one for the sinking of the ferry the Princess Ashika recently concluded.
3. Good Governance and Business Environment
Tonga ranked 52nd out of 183 in the World Bank’s 2010 Doing Business Survey (first among the 10 Pacific island economies surveyed). Tonga was 43rd out of 181 countries in 2009 and 40th out of 178 countries in 2008. Tonga ranks well above the regional average. Tonga obtained a score of 78.2 in terms of ‘Business Freedom’ in the Heritage Foundation’s 2010 Index of Economic Freedom (where 100 is best and 0 is worst).
The overall freedom to start, operate, and close a business is respected under Tonga’s regulatory environment al-though some aspects of inception and operation are subject to ancillary approval as a process to ensure protection of the health and safety of the public and national objectives from business operations. Starting a business takes an average of 25 days, compared to the world average of 38 days. The Business Licenses Act of 2002 and Business Licenses Regulations of 2007 govern business licensing in Tonga. Officially, obtaining a business license requires less than the world average of 18 procedures, but the actual procedure, depending on the business activity may contain multiple burdens and is on top of other permits and licenses. A business license is required of each business activity a firm is to undertake and is in addition to any sectoral-specific licenses (i.e. a health certificate). To date, the Govern-ment has undertaken reforms through the amended Companies Act and company registry as well as in reviewing the Business License Regulations.
There are no competition or anti-trust laws. New foreign direct investment legislation which became effective in 2007 establishes the basic legal framework for foreign investment with a view to facilitating investment. The Act is a fairly standard form of foreign investment act and is similar to that used in several Pacific Island countries. However, certain sectors of the economy remain reserved for Tongan nationals. In 2009 the government introduced a policy of issuing 10 year work visa for established for win investors.
Tonga introduced an electronic company’s registration system in December 2009 (which is a adjunct to the New Zealand Companies Register). MLCI is awaiting new software before it launches online companies registration by the end of 2010. The new software will be ready for use by the New Zealand companies’ registry in July 2010 and will quickly be introduced to the Tonga registry. This and a series of other reform measures to remove administrative barriers and transactions costs to companies operating in Tonga were passed under the Companies (Amendment) Act 2009.
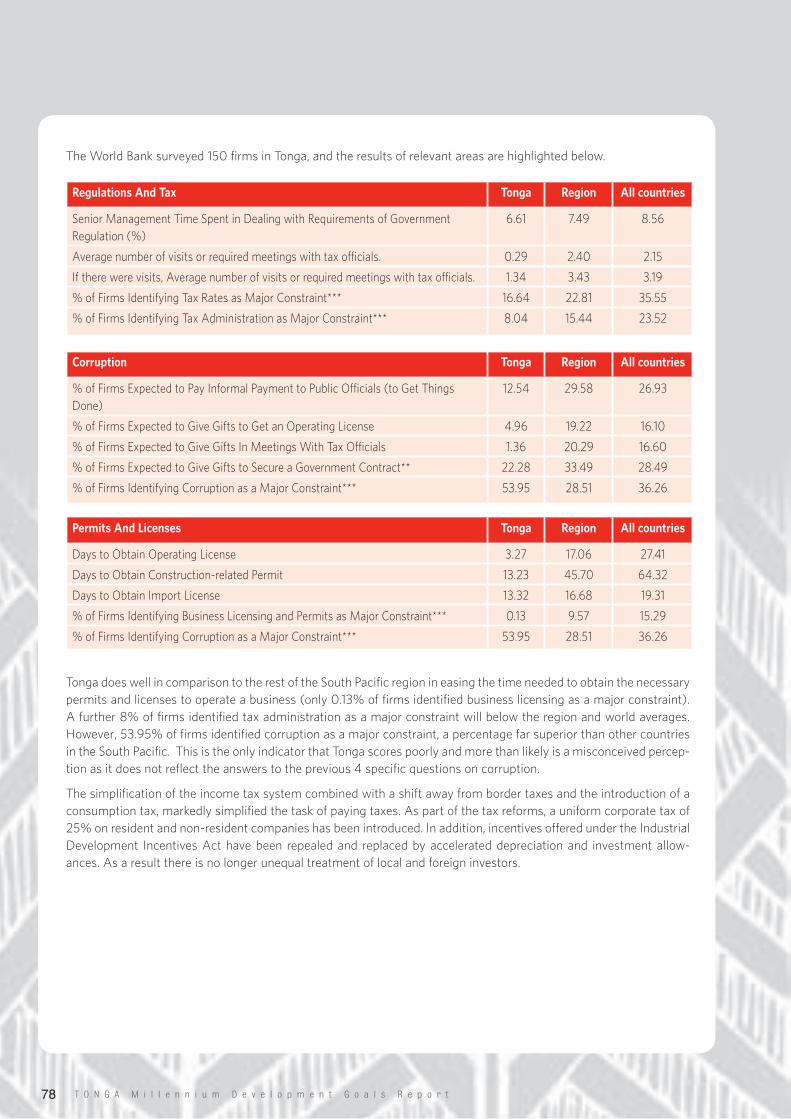
T O N G A M i l l e n n i u m D e v e l o p m e n t G o a l s R e p o r t78
The World Bank surveyed 150 firms in Tonga, and the results of relevant areas are highlighted below.
Tonga does well in comparison to the rest of the South Pacific region in easing the time needed to obtain the necessary permits and licenses to operate a business (only 0.13% of firms identified business licensing as a major constraint). A further 8% of firms identified tax administration as a major constraint will below the region and world averages. However, 53.95% of firms identified corruption as a major constraint, a percentage far superior than other countries in the South Pacific. This is the only indicator that Tonga scores poorly and more than likely is a misconceived percep-tion as it does not reflect the answers to the previous 4 specific questions on corruption.
The simplification of the income tax system combined with a shift away from border taxes and the introduction of a consumption tax, markedly simplified the task of paying taxes. As part of the tax reforms, a uniform corporate tax of 25% on resident and non-resident companies has been introduced. In addition, incentives offered under the Industrial Development Incentives Act have been repealed and replaced by accelerated depreciation and investment allow-ances. As a result there is no longer unequal treatment of local and foreign investors.
Regulations And Tax Tonga Region All countries
Senior Management Time Spent in Dealing with Requirements of Government Regulation (%)
6.61 7.49 8.56
Average number of visits or required meetings with tax officials. 0.29 2.40 2.15
If there were visits, Average number of visits or required meetings with tax officials. 1.34 3.43 3.19
% of Firms Identifying Tax Rates as Major Constraint*** 16.64 22.81 35.55
% of Firms Identifying Tax Administration as Major Constraint*** 8.04 15.44 23.52
Corruption Tonga Region All countries
% of Firms Expected to Pay Informal Payment to Public Officials (to Get Things Done)
12.54 29.58 26.93
% of Firms Expected to Give Gifts to Get an Operating License 4.96 19.22 16.10
% of Firms Expected to Give Gifts In Meetings With Tax Officials 1.36 20.29 16.60
% of Firms Expected to Give Gifts to Secure a Government Contract** 22.28 33.49 28.49
% of Firms Identifying Corruption as a Major Constraint*** 53.95 28.51 36.26
Permits And Licenses Tonga Region All countries
Days to Obtain Operating License 3.27 17.06 27.41
Days to Obtain Construction-related Permit 13.23 45.70 64.32
Days to Obtain Import License 13.32 16.68 19.31
% of Firms Identifying Business Licensing and Permits as Major Constraint*** 0.13 9.57 15.29
% of Firms Identifying Corruption as a Major Constraint*** 53.95 28.51 36.26
T O N G A M i l l e n n i u m D e v e l o p m e n t G o a l s R e p o r t 79
There is still state intervention in the goods market. For example, there are price controls for 15 stable food items and 2 energy source products namely ‘petroleum and liquid petroleum gas’. While the control of prices is an archaic means of regulating the market, it is relevant to safeguard the public’s interest, particularly the more vulnerable in the com-munities. Price control sets a maximum mark-up price on selected items ranging from 7.5% to 15%. The controlled items are subject to regular review by the Competent Authority with the Ministry of Labour, Commerce and Industry providing executive and secretarial support.
The Public Enterprises Act 2002 provides a generally sound legislative framework for corporate governance of public enterprises. Amendments to the Public Enterprise Act were approved by Parliament during its September 2010 sit-ting and provide an improved governance framework for public enterprises.
4. Good Governance and Civil Society
An important aspect of good governance is the freedom allowed in the civil society sector to enhance contributions to human development from outside of the public sector, and to provide a source of accountability for the government.
Civil society organizations are vibrant in Tonga, and make a vast array of contributions to the development of the country. The Civil Society Forum of Tonga (CSFT) is an umbrella organization dedicated to strengthening the capac-ity of CSOs, and provides a range of services accordingly. CSOs have also brought to the forefront the need for wide consultations in the country before government decisions are made.
5. Democratization
In the current form of government, the king is head of state and government and as such he appoints the prime minister and the members of Cabinet. However, pro-democracy voices have been heard throughout Tonga calling for more democratic reforms. In 2005, a large swath of civil servants entered a six-week strike to obtain pay rises. In 2006 riots took place in the center of Nuku’alofa and have left many visible scars in the business district, which is still undergoing reconstruction. Eight people lost their lives, and many businesses burned down.
In November 2009, the Constitutional and Electoral Commission presented its recommendations for constitutional and electoral reforms. One key outcome of these recommendations is the increase in the proportion of people’s rep-resentatives in Tonga’s assembly (from 9 to 17). The number of noble’s representatives remains unchanged, with nine seats.
On November 25th, 2010, the Tongan people will cast a historic vote to elect the majority of members of parliament for the first time. Tonga will transition to a constitutional monarchy, where the prime minister will be the head of government and elected by the Assembly (instead of appointed by the King), and will select 10 Cabinet Members. The King will still select members of the Privy Council, which will take on an advisory role.
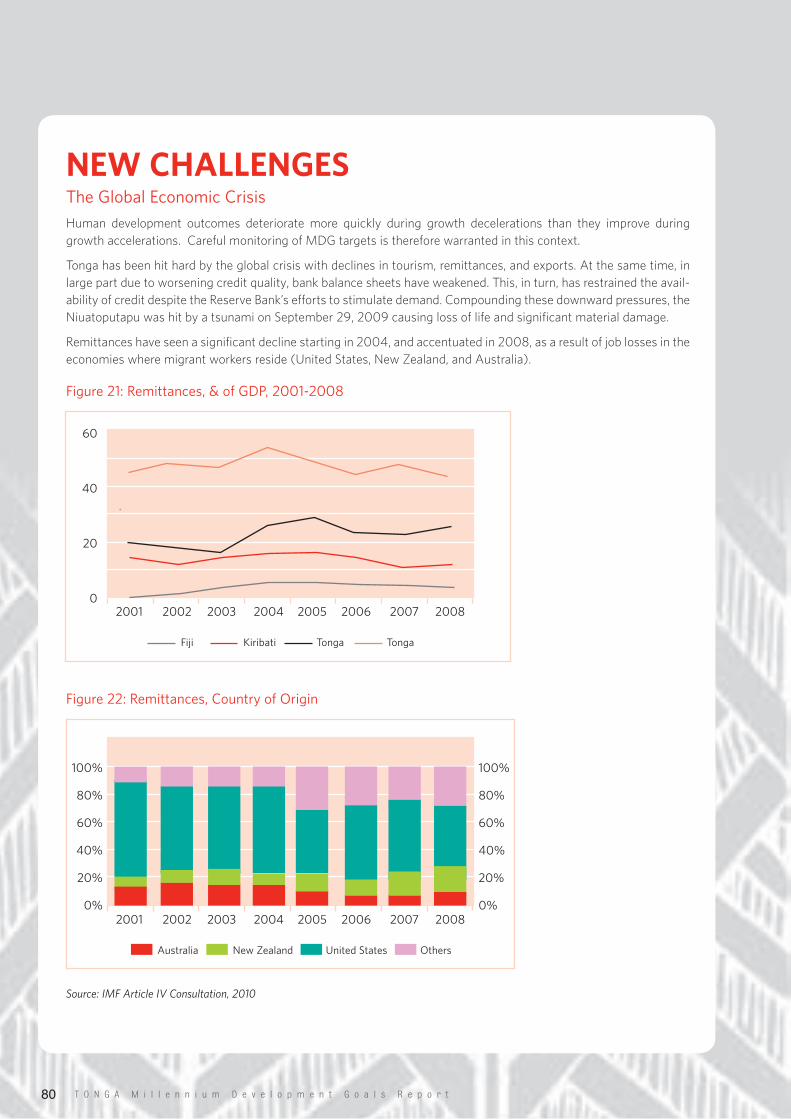
T O N G A M i l l e n n i u m D e v e l o p m e n t G o a l s R e p o r t80
NEW CHALLENGESTheGlobalEconomicCrisis
Human development outcomes deteriorate more quickly during growth decelerations than they improve during growth accelerations. Careful monitoring of MDG targets is therefore warranted in this context.
Tonga has been hit hard by the global crisis with declines in tourism, remittances, and exports. At the same time, in large part due to worsening credit quality, bank balance sheets have weakened. This, in turn, has restrained the avail-ability of credit despite the Reserve Bank’s efforts to stimulate demand. Compounding these downward pressures, the Niuatoputapu was hit by a tsunami on September 29, 2009 causing loss of life and significant material damage.
Remittances have seen a significant decline starting in 2004, and accentuated in 2008, as a result of job losses in the economies where migrant workers reside (United States, New Zealand, and Australia).
Figure21:Remittances,&ofGDP,2001-2008
Figure22:Remittances,CountryofOrigin
Source: IMF Article IV Consultation, 2010
60
40
20
02001 2002 2003 2004 2005 2006 2007 2008
Fiji Kiribati Tonga Tonga
100%
80%
60%
40%
20%
0%
100%
80%
60%
40%
20%
0%2001 2002 2003 2004 2005 2006 2007 2008
Australia NewZealand UnitedStates Others
T O N G A M i l l e n n i u m D e v e l o p m e n t G o a l s R e p o r t 81
The Asia-Pacific region is connected to the global economy through multiple channels, including trade, tourism, for-eign direct investment (FDI), official development assistance (ODA) and remittances. Tonga ranks high in terms of exposure because it depends significantly on flows of ODA and remittances. Remittances are 39% of GDP, ODA is 12 % of GDP; and FDI is 11% of GDP (UNDP, 2010 Pacific MDG Report).
The contraction in merchandise export opportunities associated with global recession has had negative impact on GDP. (World Bank, 2010). Decline in prices for some major commodity exports slowed agricultural sector growth, leading to contraction in agricultural output.
The most negative impact of the global crisis on an aggregate level is felt on the government’s finances. Tonga has to grapple with a fiscal deficit that adds to the public debt.
While economic growth is expected to pick up later in 2010, employment doesn’t necessarily follow. Food prices remain above historical averages.
Impact at the Household Level
Survey results from Tonga conducted in December 2009 showed that up to 60 percent of those interviewed reported experiencing more difficulty in paying school-related expenses compared to the previous year. Up to 77 percent of households surveyed also reported having more difficulty meeting daily expenses. In order to cope with difficult times, upto 75 percent of the households surveyed turned to friends and relatives for help; and about a quarter of them drew down on assets such as savings or selling household assets in order to meet expenses (Patel and Thapa, 2010:9).
The dependence of domestic economy on imports makes Tonga vulnerable to global price rises. Inflation peak was 6% in mid-2008 in Tonga, considerably lower than other Pacific islands (18.5% in Samoa, and Kiribati, and 12% in Vanuatu, (World Bank, 2010). Inflation will have more impact on those who participate in the cash economy com-pared to those who live off subsistence activities.
Tonga like other Pacific islands is vulnerable to the volatility of fuel prices. Inter-island transportation is vital to link people to markets and for access to food and other commodities. However, Tonga is not on UNICEF’ list of 10 high/medium priority countries for responses to the global economic crisis, which signals that Tonga is faring better than most in the region (UNICEF, 2010).
ClimateChangeandImpact
International and national round tables reaffirmed that global warming and sea-level rise were among the most seri-ous threats to the Pacific region and the survival of some island states.
UNDP supported Tonga in preparing its first national communication to the Conference of Parties of UNFCCC. This project involves establishing an inventory of greenhouse gases, assessment of potential impacts of climate change and its adverse effects, and the preparation of the first national communication. Tonga is now preparing its second report.
MECC conducted a vulnerability assessment on climate change in Tonga to better understand areas of vulnerability. The thematic group has identified the following vulnerable sectors: coastal areas, water resources, agriculture, and natural disasters, health, and fisheries sectors.
The vulnerability assessment, situation analysis, and various consultations, identified the following key issues in terms of climate change (Ministry of Environment and Climate Change, 2010)
• Increased average temperature (magnitude);• Reduced overall rainfall;• Higher occurrences of heavy rainfall;• Increased sea level;• Increased frequency and intensity of tropical cyclones
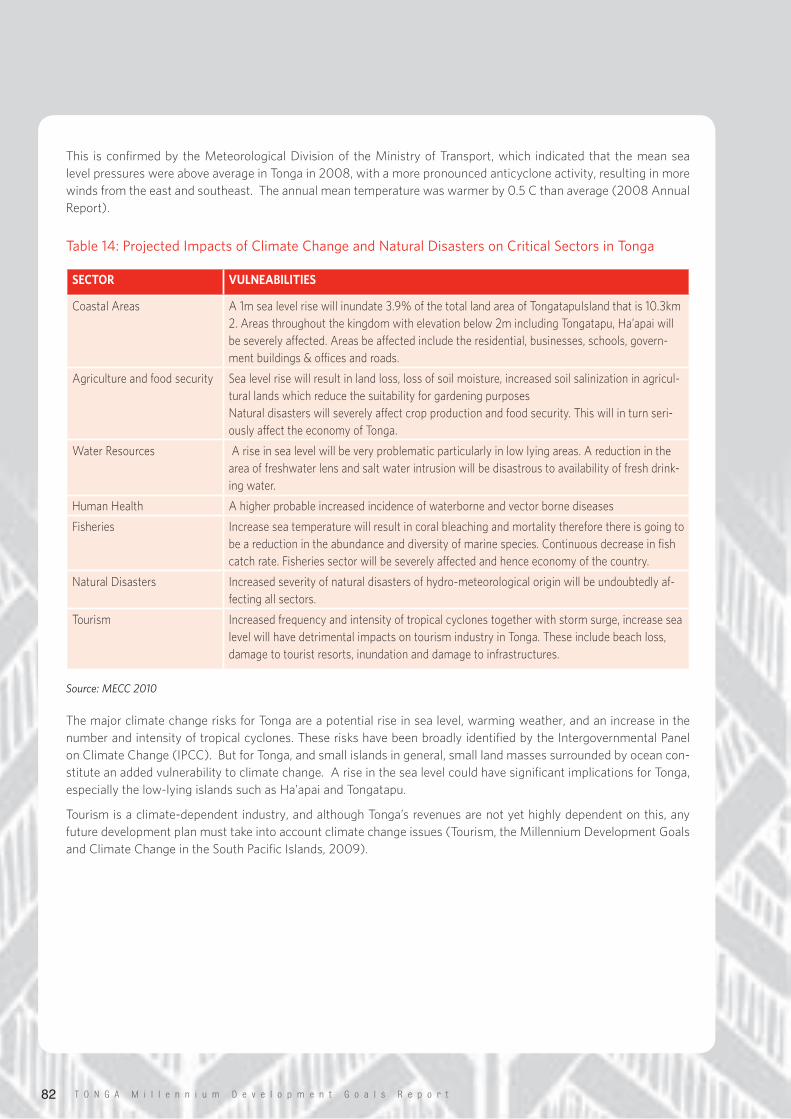
T O N G A M i l l e n n i u m D e v e l o p m e n t G o a l s R e p o r t82
This is confirmed by the Meteorological Division of the Ministry of Transport, which indicated that the mean sea level pressures were above average in Tonga in 2008, with a more pronounced anticyclone activity, resulting in more winds from the east and southeast. The annual mean temperature was warmer by 0.5 C than average (2008 Annual Report).
Table14:ProjectedImpactsofClimateChangeandNaturalDisastersonCriticalSectorsinTonga
Source: MECC 2010
The major climate change risks for Tonga are a potential rise in sea level, warming weather, and an increase in the number and intensity of tropical cyclones. These risks have been broadly identified by the Intergovernmental Panel on Climate Change (IPCC). But for Tonga, and small islands in general, small land masses surrounded by ocean con-stitute an added vulnerability to climate change. A rise in the sea level could have significant implications for Tonga, especially the low-lying islands such as Ha’apai and Tongatapu.
Tourism is a climate-dependent industry, and although Tonga’s revenues are not yet highly dependent on this, any future development plan must take into account climate change issues (Tourism, the Millennium Development Goals and Climate Change in the South Pacific Islands, 2009).
SECTOR VULNEABILITIES
Coastal Areas A 1m sea level rise will inundate 3.9% of the total land area of TongatapuIsland that is 10.3km 2. Areas throughout the kingdom with elevation below 2m including Tongatapu, Ha’apai will be severely affected. Areas be affected include the residential, businesses, schools, govern-ment buildings & offices and roads.
Agriculture and food security Sea level rise will result in land loss, loss of soil moisture, increased soil salinization in agricul-tural lands which reduce the suitability for gardening purposesNatural disasters will severely affect crop production and food security. This will in turn seri-ously affect the economy of Tonga.
Water Resources A rise in sea level will be very problematic particularly in low lying areas. A reduction in the area of freshwater lens and salt water intrusion will be disastrous to availability of fresh drink-ing water.
Human Health A higher probable increased incidence of waterborne and vector borne diseases
Fisheries Increase sea temperature will result in coral bleaching and mortality therefore there is going to be a reduction in the abundance and diversity of marine species. Continuous decrease in fish catch rate. Fisheries sector will be severely affected and hence economy of the country.
Natural Disasters Increased severity of natural disasters of hydro-meteorological origin will be undoubtedly af-fecting all sectors.
Tourism Increased frequency and intensity of tropical cyclones together with storm surge, increase sea level will have detrimental impacts on tourism industry in Tonga. These include beach loss, damage to tourist resorts, inundation and damage to infrastructures.
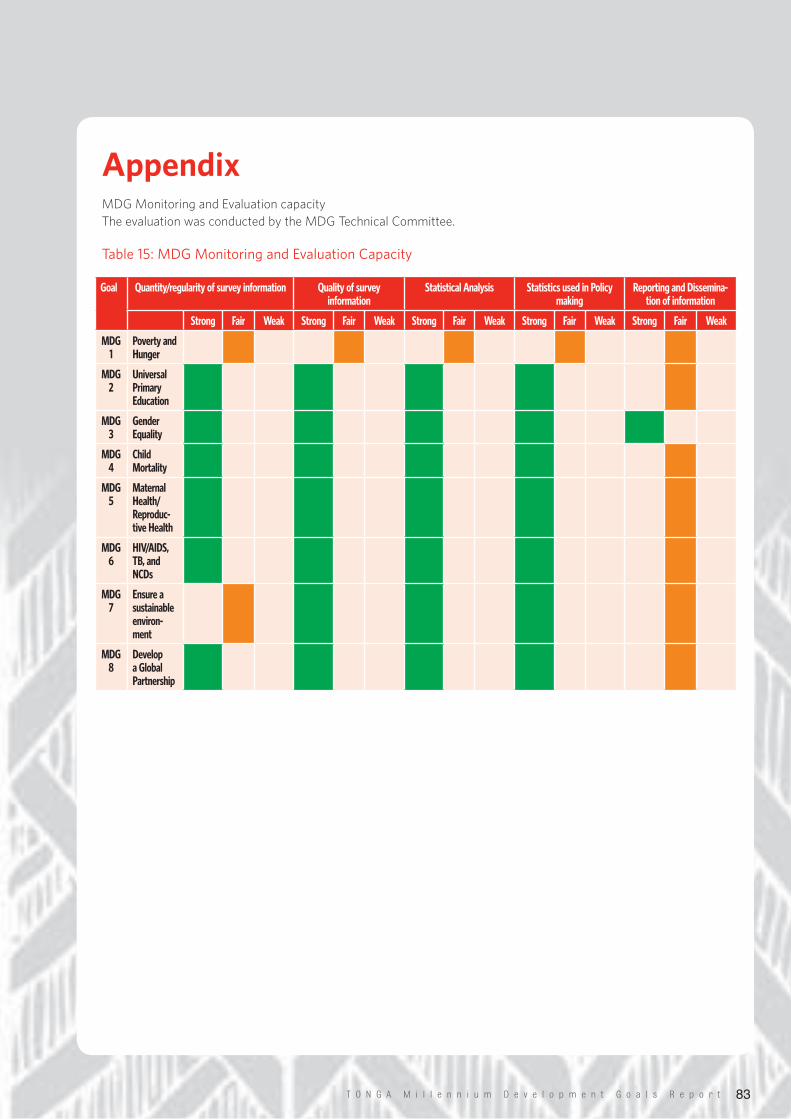
T O N G A M i l l e n n i u m D e v e l o p m e n t G o a l s R e p o r t 83
AppendixMDG Monitoring and Evaluation capacityThe evaluation was conducted by the MDG Technical Committee.
Table15:MDGMonitoringandEvaluationCapacity
Goal Quantity/regularity of survey information Quality of survey information
Statistical Analysis Statistics used in Policy making
Reporting and Dissemina-tion of information
Strong Fair Weak Strong Fair Weak Strong Fair Weak Strong Fair Weak Strong Fair Weak
MDG 1
Poverty and Hunger
MDG 2
Universal Primary Education
MDG 3
Gender Equality
MDG 4
Child Mortality
MDG 5
Maternal Health/ Reproduc-tive Health
MDG 6
HIV/AIDS, TB, and NCDs
MDG 7
Ensure a sustainable environ-ment
MDG 8
Develop a Global Partnership
T O N G A M i l l e n n i u m D e v e l o p m e n t G o a l s R e p o r t84
REFERENCESAbbott, David. 2010 MDG Tracking Report.
Abbott, David. Macroeconomic Assessment of Poverty and Hardship in the Pacific: Lessons, Challenges and Policy Responses for Achieving the MDGs Regional Macroeconomic and Poverty Reduction Advisor, UNDP Pacific Centre, Suva, Fiji.
Abbott, D., and Pollard, S. Hardship and Poverty in the Pacific: Strengthening Poverty Analysis and Strategies in the Pacific, Asian Development Bank, Pacific Department. 2004.
Asian Development Bank. Asian Development Outlook, 2008.
Asian Development Bank. Country Operations Business Plan. Tonga: 2011-2013. 2010.
Asian Development Bank. Priorities of the People: Hardship in Tonga, 2003.
Asian Development Bank. The Use and Impact of Remittances.
Asian Development Bank. Tonga Fact Sheet, December 2009.
Asian Development Bank. Transforming Tonga: A Private Sector Assessment. 2008.
AusAID. Partnership for Development Between the Government of Australia and the Government of Tonga, Pacific 2020: Chal-lenges and Opportunities for Growth.
AusAID. Partnership for Development between the Government of Australia and the Government of Tonga.
Black, Robert et al. Regional and National Causes of Child Mortality in 2008: A Systematic Analysis. The Lancet, 2010.
Budde, Paul. Tonga: Telecoms Market Overview and Statistics, Communication Pty Ltd, 2008.
Catherwoood, Vince for the Ministry of Education: Tonga Education Policy Framework, 2004-2019. April 2004.
Civil Society Forum of Tonga. GEF Small Grants Programme. Tonga.
Colagiuri S, Colagiuri R, Na’ati S, Muimuiheata S, Hussain Z, Palu T. The Prevalence of Diabetes in the Kingdom of Tonga. Diabe-tes Care 2002; 25: 1378–83.
David J. McKenzie, HalahinganoLotolua , John Gibson, How Cost-elastic are Remittances? Estimates from Tongan Migrants in New Zealand, Revised December 14, 2005.
European Union. Country Strategy Paper and National Indicative Programme, for the Period 2008-2013
Fua Seu’ula Johansson; Moa Sela, ‘Ilolahia Gabriella, National Study on Domestic Violence in Tonga. Forthcoming. 2010.
Sela MoaFAO. Asia and the Pacific National Forestry Programmes: update 34. Tonga Country Profile. 2000. Accessed online: http://www.fao.org/docrep/003/x6900e/x6900e0w.htm
Friendly Islands Teachers Association and Credit Union, Annual General Meeting, 25th of June 2010, Nuku’alofa, Tonga.
Global Initiative to End All Corporal Punishment of Children. The Nature and Extent of Corporal Punishment – Prevalence and Attitudinal Research in East Asia and the Pacific. March 2008.
Global Initiative to End All Corporal Punishment of Children. Briefing for the Human Rights Council Universal Periodic Review, 2nd Session, 2008.
Government of Tonga/SPC, Tonga 2006 Census of Population and Housing. Volume 2: Analytical Report.
Guttenbeil-Likiliki, Ofa-Ki-Levuka. TONGA: Youth Microenterprise Development Project. March 2009.
Hagan et al. “Maternal Mortality for 181 countries, 1980-2008: A Systematic analysis of Progress Towards Millennium Develop-ment Goal 5,” The Lancet, 2010.
T O N G A M i l l e n n i u m D e v e l o p m e n t G o a l s R e p o r t 85
Havea, Iemaina. “Exploring Factors to Strengthen Existing Reproductive Health Services for Young People in Tonga,” UNFPA, 2007.
IMF. Report for the 2010 Article IV Consultation, and reports for previous years.
IMF. Preserving Debt Sustainability in Low-income Countries in the Wake of the Global Crisis. April 1, 2010.
Ivarature, Henry. “ Family Planning and Contraception in Tongaleleka Village, Kingdom of Tonga”, Pacific
Ivarature, Henry. “The Institutionalization and “Medicalization” of Family Planning in Tonga”, Asia-Pacific Population Journal, June 2000.
January 2008 Revised Official MDG Framework, accessed online http://siteresources.worldbank.org/DATASTATISTICS/Re-sources/MDGsOfficialList2008.pdf
Jiang, Min et al. Tourism, the MillenniumDevelopment Goals andClimate Change in the South Pacific Islands.
JICA. Country Gender Profile: The Kingdom of Tonga, February 2010, accessed online, http://www.jica.go.jp/activities/issues/gender/pdf/e09ton.pdf
Khan, Adil. Evaluation of the Process of Compiling National MDG Reports in Pacific Island Countries and Capacity to Measure and Monitor Development Performance. CONSOLIDATED COUNTRY ASSESSMENTS REPORT. Fiji Multi-Country Overview. September 2009.
Kelley, Chris. Opening Address at the Tonga National Consultation of Advocacy Strategies for Advancing Legislative Change to Address Violence Against Women. May 17th 2010. Tonga.
Langafonua ‘a Fafine, Increasing Women’s Participation in Governance and Decision Making, Tonga, 2005.
Mendoza, Ronald. Inclusive Crises, Exclusive Recoveries, and Policies to Prevent a Double Whammy for the Poor. UNICEF, May 2010.
Ministry of Education. Annual Report. 2008. Tonga
Ministry of Finance and National Planning, At A Glance Fact Sheets
Ministry of Finance. Annual Report. 2008. Tonga.
Ministry of Finance. Budget Statement for Year Ending 30th June 2011. Budget Paper 1: Review of the Tongan Economy & Out-look 2010/11. Tonga, 2010.
Ministry of Finance. Budget Statement for Year Ending 30th of June 2011. Budget Paper 2: Fiscal Analysis and Outlook. Tonga, 2010.
Ministry of Finance. Kingdom of Tonga, Strategic Development Plan Eight: 2006/07-2008/09,Tonga.
Ministry of Finance. Tonga First National Status Report, Millennium Development Goals, Today and Tomorrow, National MDG Taskforce, March 2005.
Ministry of Finance. Tonga National Infrastructure Investment Plan. Unpublished. 2010.
Ministry of Health, Evidence-Based Guidelines in Family Planning for Health Care Providers, Tonga, 2009.
Ministry of Health, Kingdom of Tonga Immunization Handbook, Second Edition, Tonga, 2005.
Ministry of Health, National Strategy to Prevent and Control Non-Communicable Diseases: 2004-2009. In collaboration with SPC, WHO, AusAID, and NZAID.
Ministry of Health, Reproductive Health Policy: 2008. Reproductive Health Strategy: 2008-2011, 2009, Tonga.
Ministry of Health, Tonga National Strategy to Prevent and Control Non-Communicable Diseases: 2010-2015. In collaboration with AusAID, SPC, and WHO.
Ministry of Health. Annual Report. 2008, Tonga.
T O N G A M i l l e n n i u m D e v e l o p m e n t G o a l s R e p o r t86
Ministry of Health. National Health Accounts FY 2003/04; NHA FY 2005/2006.
Ministry of Police. Annual Report. Tonga
Ministry of Lands, Survey, Natural Resources &Environment. The State of Forests in Tonga.
Ministry of Lands, Survey, Natural Resources & Environment. Annual Report 2008.
Nelson, Gayle. Gender Profiles of Asian Development Bank’s Pacific Developing Member Countries. ADB. June 2008.
New Zealand Agency for International Development. Annual program performance report for Tonga 2007–08
Office of the United Nations High Commissioner for Human Rights, Convention on the Rights of the Child. Accessed online: http://www2.ohchr.org/english/law/crc.htm
Pacific Women Against Violence, New Center for Women and Children in Tonga, Vol. 13, Issue3/4, June 2010.
Peace Corps. A Peace Corps Publication for New Volunteers. May 2010.
Prime Minister’s Office. National Strategic Planning Framework, February 2009.
Rajaratnam, “Neonatal, Postneonatal, Childhood, and Under Five Mortality for 187 countries, 1970-2010: A Systematic Analysis of Progress Towards the Millennium Development Goal 4”. The Lancet, 2010.
Renewable Energy and Energy Efficiency Partnership. Policy Details: Kingdom of Tonga. Accessed online: http://www.reeep.org/index.php?id=9353&text=policy&special=viewitem&cid=74
Smith B, Phongsavan P, Havea D et al. (2007) Body Mass Index, Physical Activity and Dietary Behaviours among adolescents in the Kingdom of Tonga. Public Health Nutrition 10, 137–144.
Snowdon, Wendy et al. Evidence-informed Process to Identify Policies that will Promote a Healthy Food Environment in the Pacific Islands. Public Health Nutrition: 13(6), 886–892, 2010.
SPC/WHO. Second Generation Surveillance Surveys of HIV, other STIs and Risk Behaviours in 6 Pacific Island Countries (2004-2005). 2006.
Statistics Department. Household Income and Expenditure Survey 2000/01. Tonga.
Statistics Department. Household Income and Expenditure Survey 2009, Tonga.
Statistics Department. Population Census 1986, 1996, and 2006. Tonga.
Statistics Department. Tonga Labor Force Survey 1990, 1993/94, and 2003.
The Convention on the Elimination of All Forms of Discrimination against Women (CEDAW).
The International Fund for Agricultural Development (IFAD). Rural Poverty in Tonga, accessed http://www.ruralpovertyportal.org/web/guest/country/home/tags/tonga
The Official UN Website for the MDGs Indicators, http://mdgs.un.org/unsd/mdg/Host.aspx?Content=Indicators/Handbook.htm
The World Bank Development Research Group, Macroeconomics and Growth Team, Policy Research Working Paper, Governance Matters VIII, Aggregate and Individual Governance Indicators, 1996–2008; June 2009.
Tonga Family Health Association, Strategic Plan 2008-2012, June 2007.
Tonga Family Health Association. Country Report 2009. Tonga.
Tonga Visitors Bureau. Hotel occupancy Rates. 20008. Tonga.
Tukunga, Tevita, Experience with PV Lighting Systems and the adoption of Incorporated Society Model in Tonga. National Paper for CSD 14/15.
UN General Assembly, “Keeping the promise: a forward-looking review to promote an agreed action agenda to achieve the Mil-lennium Development Goals by 2015”, Report of the Secretary-General, New York, February 2010.
T O N G A M i l l e n n i u m D e v e l o p m e n t G o a l s R e p o r t 87
UNDG, Indicators for Policy Management: A Guide for Enhancing the Statistical Capacity of Policy-makers for Effective Monitoring of the MDGs at the Country Level, 2005 United Nations.
UNDP. Common Country Assessment.
UNDP, Pacific MDG Report, 2010
UNDP. 2010 MDG Goal-Base summary tables SPC update MDG1-6, 30 April 2010
UNDP. Achieving the Millennium Development Goals in an Era of Global Uncertainty, Asia-Pacific Regional Report 2009/10.
UNDP. Human Development Reports 1990-2010
UNDP. MDG Breakthrough Strategy: Accelerate and Sustain MDG Progress, New York, May 2010.
UNDP. MDG-Plus: A Case Study of Thailand.
UNDP. Sub-Regional Workshop on MDG-Based Planning, Costing, and Budgeting for the Polynesian Countries. 26-29 May 2008, Rarotoga, Cook Islands.
UNDP. UN Development Assistance Framework (UNDAF).
UNDP Tonga Country Program Action Plan 2008-2012
UNESCO. Education for All Global Monitoring Report ,2009.
UNFPA. Renewing the Commitment to MDGs: Clarifying Linkages between ICPD Goals & MDGs, Annette Sachs Robertson, UNFPA CST Pacific, Programme Management Workshop. Suva, Fiji , May 29-June 2, 2006 (Power Point presentation)
UNFPA/WHO, Evidence Informed Guidelines for the Management of Sexually Transmitted Infections, Tonga, 2008.
UNICEF Pacific. The State of Health Behaviour and Lifestyle of Pacific Youth. Kingdom of Tonga Report. Suva, Fiji: UNICEF Pacific, 2004.
UNICEF. Government of Tonga/UNICEF, A Situation Analysis of Women, Children, and Youth, 2006.
UNICEF. The State of Health Behaviour and Lifestyle of Pacific Youth. 2001.
UNIFEM. CEDAW +30 Anniversary Contest. Promoting Gender Equality & Women’s Human Rights: “From National Commit-ments to Real Change”. Tell us the story of how women’s lives have changed in your country/community in photos or essays. Deadline 3 September, 2010.
UNIFEM. Press Release: Three Decades of Progress on Women’s Rights, but Major Obstacles to Equality Persist. UN marks 30th anniversary of key international treaty on eliminating discrimination against women. 2 December 2009.
UNITED NATIONS DEVELOPMENT GROUP, Country Reporting on the Millennium Development Goals, Second Guidance Note, October 2003.
United Nations, 2009 Millennium Development Goals Report.
United Nations. 2009 Global Assessment Report on Disaster Risk Reduction: Risk and Poverty in a Changing Climate.
United Nations. Rethinking Poverty: Report on the World Social Situation 2010 (United Nations, 2010).
United Nations. The Millennium Declaration, New York, 2000
United Nations. Tonga Country Profile. Johannesburg Summit 2002.
Utter J, et al. Lifestyle and Obesity in South Pacific Youth: Baseline Results from the Pacific Obesity Prevention in Communities (OPIC) Project in New Zealand, Fiji, Tonga, and Australia. Auckland: University of Auckland, 2008.
Vandemoortele, Jan. Taking the MDGs Beyond 2015: Hasten Slowly, May 2009 accessed online http://www.eadi.org/filead-min/MDG_2015_Publications/Vandemoortele_PAPER.pdf
T O N G A M i l l e n n i u m D e v e l o p m e n t G o a l s R e p o r t88
WHO. Statistical Tables. Country Health Information Profiles.
WHO. Tonga Profile. Accessed online http://www.wpro.who.int/countries/2009/ton/
Women and Children Crisis Center. Statistics 2010. Tonga.
World Bank. East Asia and Pacific Economic Update 2010, vol. I: Small Pacific Islands
World Bank. Global Economic Prospects 2010
World Bank. Governance Matters, 2009. Worldwide Governance Indicators, 1996-2008
World Bank. Implementation Completion and Results Report (IDA-3814) on a Credit in the Amount of SDR 8.0 Million (US$10.94 Million Equivalent) to the Kingdom of Tonga for a Health Sector Support Project, January 20, 2010. Health, Nutrition and Population, Human Development Sector Unit, East Asia and Pacific Region.
World Bank. Project Appraisal Document on a Proposed Credit in the Amount of SDR 8.0 Million to the Kingdom of Tonga for a Health Sector Support Project, June 2003.
World Bank. Reproductive Health Action Plan 2010-2015; accessed online; http://web.worldbank.org/WBSITE/EXTERNAL/NEWS/0,,contentMDK:22576512~pagePK:64257043~piPK:437376~theSitePK:4607,00.html?utm_source=MHTF+Subscribers&utm_campaign=1e0187d3bd-MH_BUZZ5_25_2010&utm_medium=email
World Bank. The Pacific Infrastructure Challenge: a Review of Obstacles and Opportunities for Improving Performance in the Pacific Islands. January 2006.
World Bank. World Development Report 2010: Development and Climate Change.
World Bank. Enterprise Surveys, Tonga Profile 2009, accessed online http://www.enterprisesurveys.org/ExploreEconomies/?economyid=188&year=2009
World Bank. The Millennium Development Goals, website http://ddp-ext.worldbank.org/ext/GMIS/gdmis.do?siteId=2&menuId=LNAV01 Including Online Atlas of the MDGs.

T O N G A M i l l e n n i u m D e v e l o p m e n t G o a l s R e p o r t 89

T O N G A M i l l e n n i u m D e v e l o p m e n t G o a l s R e p o r t90