tomorrow s energy . . . today project finance … tour v2.pdf · tomorrow™s energy . . . today...
TRANSCRIPT

Tomorrow�s Energy . . . Today
Project Finance TutorialEnergy x-Po, Hancock, MI
Sigma Capital Group, Inc.Bruce Woodry, Chairman and CEO
September, 2007
id11159296 pdfMachine by Broadgun Software - a great PDF writer! - a great PDF creator! - http://www.pdfmachine.com http://www.broadgun.com

1
Sigma Capital Group, Inc.
Who we are:� Sigma Capital is a boutique investment bank, providing advisory and
representative investment banking services on $5-250M transactions� Primarily to energy and renewable energy project finance.
My focus:� Project finance (private equity and debt) for BTP, BTL, CTL, ethanol
and integrated agri-energy projects
Today, Primer on Renewable Energy Project finance:� Comparison to Growth Funding� Some things to consider when reviewing a renewable energy project
finance transaction
2
QUICK ENERGY OVERVIEW

3
Energy: Changing industry
� World oil peaked circa 2000, no major discoveries, existing wells on decline curve
� U.S. Oil� Production peak in 1970� Today, United States consumes 20 MBBL/day, 76 % imported (2004) going to 25
MBBL/day, (86%) imported (2025)� China, #2 at 9MBBL/Day is growing at 9%, competing for scarce supplies
� US Natural Gas� Price from $1.5 to $14 MCF over past several years� Summer/winter shortage
� Concerns over price, supply
US Oil SUPPLY AND DEM AND
1949 TO 2025
0
20
40
60
80
100
120
140
1960 1970 1980 1990 2000 2010 2025
DEMAND
US OIL US NATURAL GAS WORLD OIL
SUPPLY

4
Future of oil �vs. Climate
CO2 Levels are growing dangerously high
5
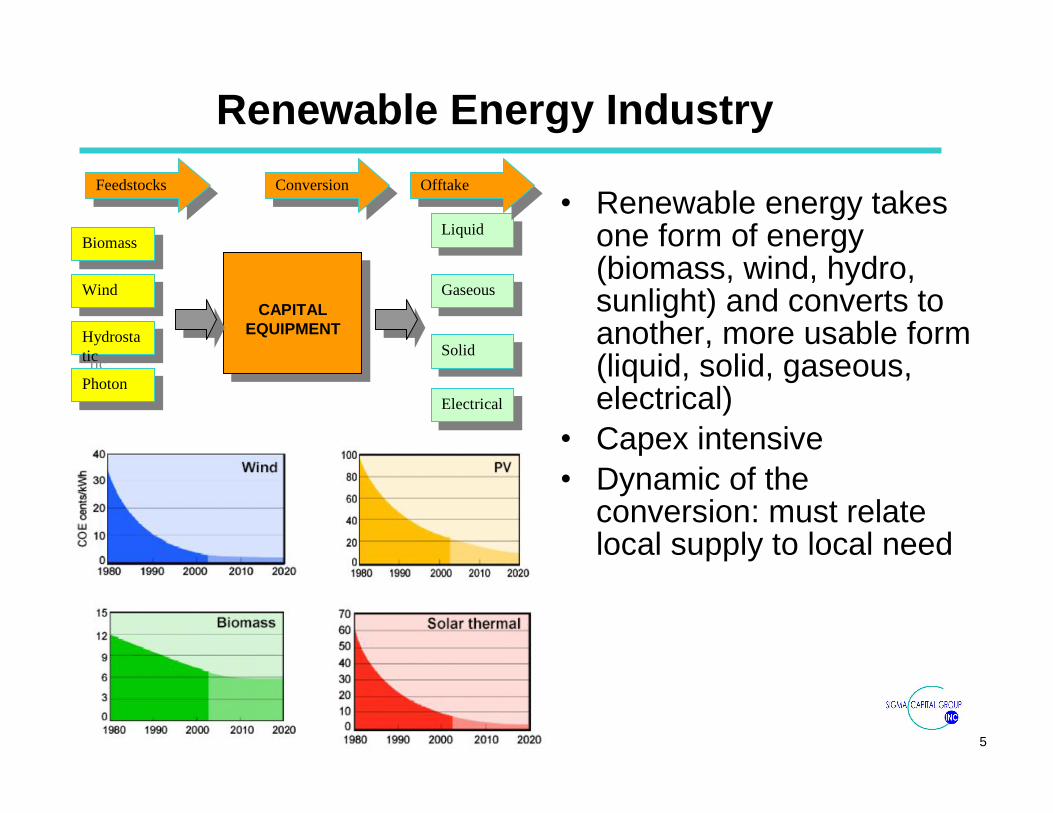
Renewable Energy Industry
� Renewable energy takes one form of energy (biomass, wind, hydro, sunlight) and converts to another, more usable form (liquid, solid, gaseous, electrical)
� Capex intensive� Dynamic of the
conversion: must relate local supply to local need
BiomassBiomass
WindWind
Hydrostatic
Hydrostatic
PhotonPhoton
CAPITAL EQUIPMENT
CAPITAL EQUIPMENT
LiquidLiquid
GaseousGaseous
SolidSolid
ElectricalElectrical
FeedstocksFeedstocks ConversionConversion OfftakeOfftake

6
State and Federal Drivers
� Energy policy act of 2005� PTCs By Technology: 1.9
cents/kwh for 10-year period beginning on date facility is placed in service for Wind, Closed-loop biomass, Geothermal, Solar
� Generally must be put in service between 2007 and 2008
� State policies augment federal policies- Renewable portfolio standards
in 21 states & District of Columbia
- Requires 2%-24% of electricity to be generated by renewables
- Expected to be 32,000 MW by 2017, California, New York, Texas will lead

7
Wisconsin & Michigan Wind Speed

8
Wind Power, Installed Base vs. Cost
� Wind received 72% of U.S. energy asset investment in 2005
� Average deal size 75 million� $4 billion for 65 wind parks� Buyouts: 25 in 2005 for $3
billion (global), mostly in Spain
+ Wind plants are economically viable�costs have dropped from 50 ¢/kWh to under 5 ¢/kWh since 1980
+ 9149 MW in the United States+ Cost of generation is almost
comparable with fossil fuels
- Low capacity factors (6-37%)- 2 MPH change in average wind
speed can make the difference between investment-grade returns, or not
- 66% of total project returns attributed to tax credits

9
Converting Biomass into Efficient Fuel
� Biomass Advantages� Abundant � Accessible � Renewable
� Biomass Disadvantages� Inefficient to store and
transport� Low energy density
(8000 vs 18.000 BTU/LB) � Low energy efficiency
� Negative environmental impact if not treated
�Region not as competitive as ag biomass
�Still opportunity for early processing of bio-mass
�Enhancing technology gaps for mixed feedstock would be beneficial
�Figuring out bio-conversion of wood is vital
�Better models associated with forest preservation for sustainability
Need to understand Solutions (Conversion of Biomass to�.?)
Energy density (storable/transportable), energy efficiency (liquid fuel), yields, compatibility with existing fuel infrastructure
Need to understand Solutions (Conversion of Biomass to�.?)
Energy density (storable/transportable), energy efficiency (liquid fuel), yields, compatibility with existing fuel infrastructure
UP & N. LP MichiganBiomass MSU Study

10
Application is critical for project economics
The inter-relation between feedstocks, conversion, end products, transport (incoming and outgoing) and CapEx determine project economics
The inter-relation between feedstocks, conversion, end products, transport (incoming and outgoing) and CapEx determine project economics

11
Environmental Waste Conversions
Considerations� Optimal Sizing� Optimal
Technology � Optimal Products� Optimal Hauling
Radius� CapEx per Ton=?
Raw materialdm%
odm% dm
average gas yield
l/kg of odm
Biogasm3/t of substrateApple pulp 3 95 500 14
Apple marc 25 86 700 151
Brewing dregs 25 65 700 116
Biological waste 40 50 615 123
Blood meal 90 80 900 648Grease trap
residues30 95 1000 285
Vegetable waste 15 76 615 70
Chicken manure 15 77 465 54
Farm/AG Manufacturing Waste
CA MSW TOTAL 6,172,200 100.00%Breakdown for Waste Procesing:
Total suitable for RDF 68.51%Metal 6.64%Inerts for construction bedding 19.23%Landfill disposal 5.46%Batteries 0.15%
Municipal Solid Waste
Need to understand relationship between capex and energy densityto offset and hauling (fuel shed radius)?
Need to understand relationship between capex and energy densityto offset and hauling (fuel shed radius)?

12
Forest Waste Conversions
� Collection key to cost
� Densification of energy required
� High (and growing) transport costs force distributed densification
GlucanXylanGalactanArabinanMannanUronicAcetylLigninAsh
Red mapleSugar mapleYellow birchWhite birch
BeechAmerican sycamoreEastern cottonwood
Quaking aspenSouthern red oak
0 20 40 60 80 100Percentage of total dry weight
Need to understand relationship between capex and energy densityto offset and hauling (fuel shed radius)?
Need to understand relationship between capex and energy densityto offset and hauling (fuel shed radius)?
Hardwoods
Wood and Ag residues Pretreatment
Extraction
Extraction
LigninExtractives/Acetic Acid Sugars
Cellulose Depolymerization
Processingto highervalue products

13
Size matters
1 MGPY
3 MGPY
5 MGPY
10 M
GPY
15 M
GPY
20 M
GPY
30 M
GPY
HighLow
$/Gal Capex
Need rigorous qualification optimize scale for community systemNeed rigorous qualification optimize scale for community system
Economy of Scale VS. Logistics and Hedging
MSU Study
?
1
2
3
4
5
6
7
8
9
10
$0 -
$20
$20
- $40
$40
- $60
$60
- $80
$80
- $10
0
$100
- $1
50
$150
- $2
00
Integrated Logging Cost Per BDT
Milli
on B
DT0%
10%
20%
30%
40%
50%
60%
70%
80%
90%
100%
Cum
ulat
ive
% o
f Vol
.
1
2
3
4
5
6
7
8
< 10
10-2
0
20-3
0
30-4
0
40-5
0
50-6
0
60-7
0
70-8
0
80-9
0
90-1
00
100-
110
110-
120
120+
Haul Mileage
Mill
ion
BD
T
0%
10%
20%
30%
40%
50%
60%
70%
80%
90%
100%
Cum
ulat
ive
% o
f Vol
.

14
QUICK FINANCE TUTORIAL
15
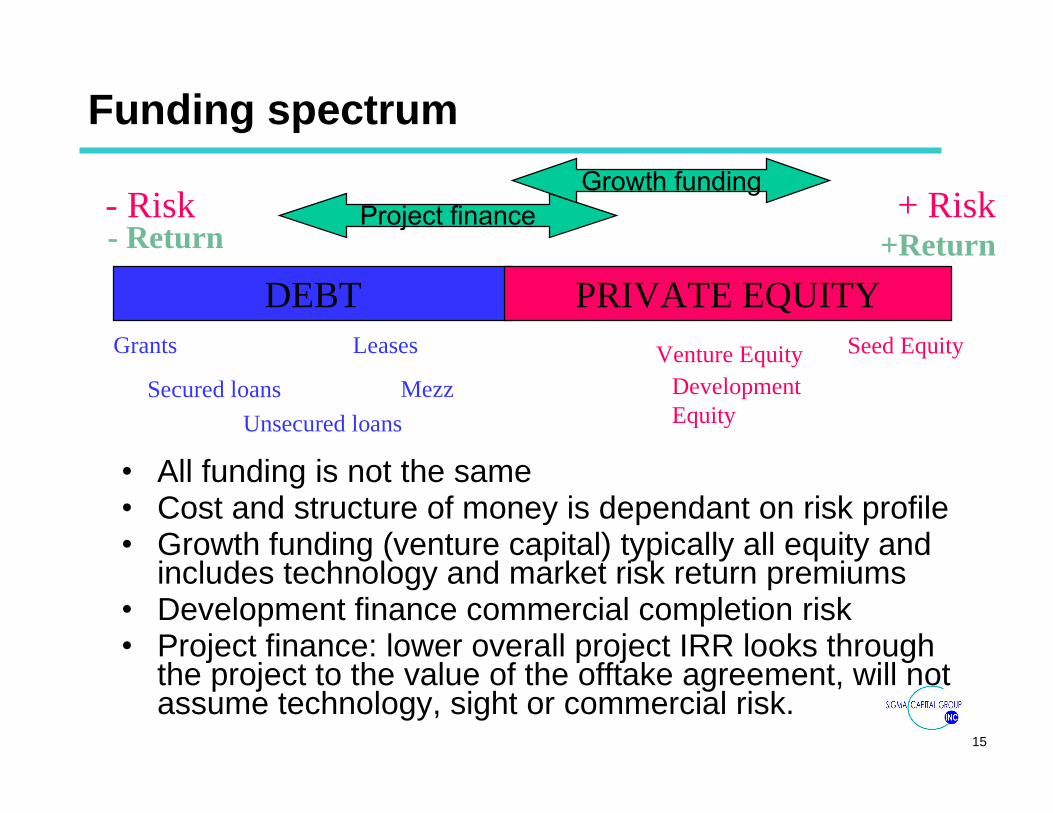
Funding spectrum
� All funding is not the same� Cost and structure of money is dependant on risk profile� Growth funding (venture capital) typically all equity and
includes technology and market risk return premiums� Development finance commercial completion risk� Project finance: lower overall project IRR looks through
the project to the value of the offtake agreement, will not assume technology, sight or commercial risk.
+ Risk+Return
DEBT PRIVATE EQUITYGrants Leases
Secured loans
Seed EquityVenture Equity
Unsecured loans
- Risk- Return
Project financeGrowth funding
Mezz DevelopmentEquity

16
Renewable Technologies: Dual Challenge
� Must link development of new renewable energy technology companies with fuels development
� Commercialization of both required in parallel� Different management, business models and financing
� Must link development of new renewable energy technology companies with fuels development
� Commercialization of both required in parallel� Different management, business models and financing
Fuels: Project Development Pathway
BenchBench PilotPilot CommercializationCommercializationtime
valuation
Products: Growth Company Pathway
ResearchResearch DevelopmentDevelopment ManufacturingManufacturing Strategicsale
IPO
time
valuation
Two Commercialization Pathways Required

17
Growth Company finance
� Immature sector� Growth funding is
driven by VC investment, which may not be a good fit.
� Many/most early stage energy technology companies have not delivered investment grade returns
� Few IPOs, with some underperformers (Clipper & Capstone)
� BUT: great long term market potential if the right companies and fundmentals are selected

18
PROJECT FINANCE
19
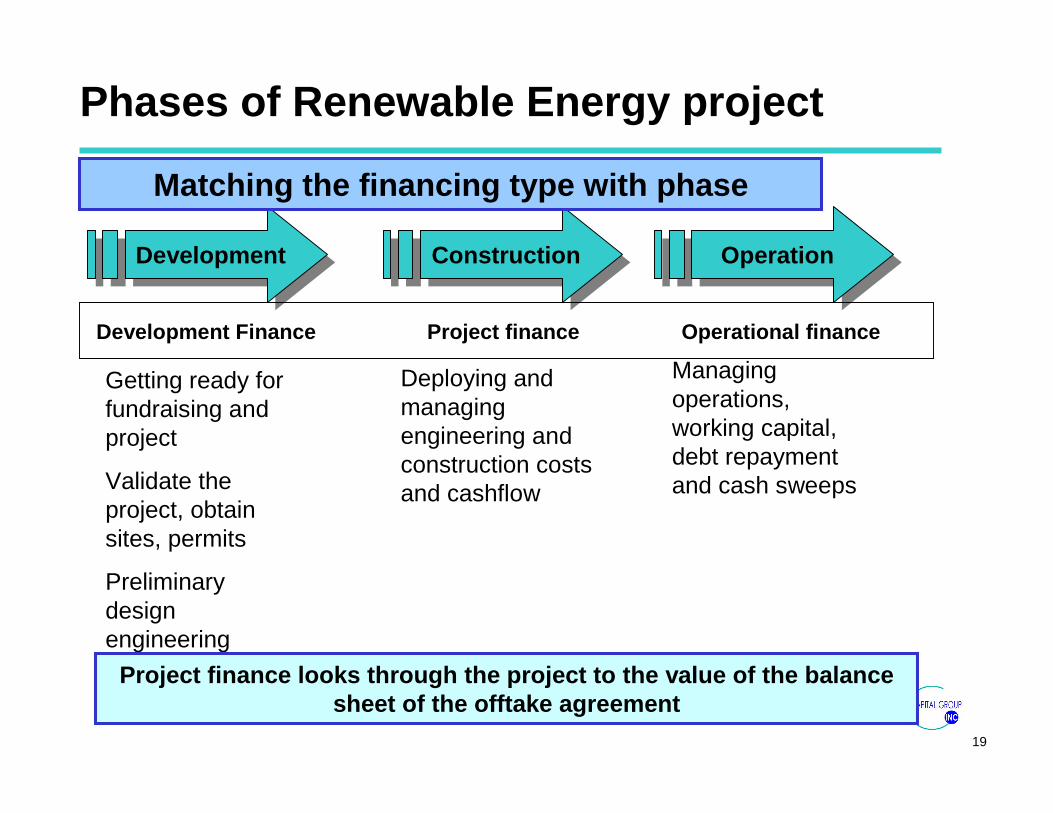
Phases of Renewable Energy project
DevelopmentDevelopment ConstructionConstruction OperationOperation
Getting ready for fundraising and project
Validate the project, obtain sites, permits
Preliminary design engineering
Deploying and managing engineering and construction costs and cashflow
Managing operations, working capital, debt repayment and cash sweeps
Matching the financing type with phase
Development Finance Project finance Operational finance
Project finance looks through the project to the value of the balance sheet of the offtake agreement

20
Project Timing
� Timing varies widely, but typically 18-24 months from project inception
� Development funding should be sufficient to last through the development.
� Fundraising may take 4-6 months after finalized �package�, depending on complexity and structure
FUNDRAISING
DevelopmentDevelopment ConstructionConstruction
Dev funding
D P
Project Finance
Seed funding
S

21
Development finance
� Seed: a few $100K for feasibility studies, etc.
� Development: Depending on size, development costs range from 2-10% of total project,
� Highest risk funding� Highest rate of return
money (30%-50%++)� Development funding
may be complimented with grants, loans
0
2
4
6
8
10
12
$1M
$10M
$50M
$100
M
$500
m
Dev Cost (% of Project Total)

22
Project Finance, what to look for�� The risk/return profile and valuation are consistent with the financial
markets and company expectations� Management team has the experience and capability for the project
undertaken� The project is realistic and major risks are mitigated
� Feedstock agreements� Offtake agreements (Merchant vs. contract)� Creditworthiness of Offtake purchasers� Technology risk/obsolescence� Performance bonding/ Construction risk
PlantFeedstocks
Favorable Long Term Contracts
Offtake
Favorable Long Term Contracts
Demonstrated yields and costs
Project finance looks through the project to the value and balance sheet
of the offtake agreement

23
Project Finance
Debt� Construction� Permanent Finance
� Bonds (taxable and exempt)� Equipment / Operational Lease� Mezzanine (limited)� Grants & government loans
Equity� Private-accredited� Institutional� Socially Responsible
Investors� Strategic & Vender
Finances� Tax investors
Proper structuring to balance debt and equity can reduce risk & improve returns
The larger the project, the more complexity & possibilities of improvement through structuring

24
Renewable Energy Project Finance Gap
(unsophisticated?) Developer� Investors should invest in
my project because it is the socially responsible thing to do
� Let�s get going, will fill in the details later
� Don�t look over my shoulder, I want a �silent partner�
� I give you slightly better than prime rate, so I can keep the majority of �my project�
� I�ll offer you 5% of the project for $80 million
(unsophisticated?)Investor/ Lender� I want 40% ++ with no risk� Get me out next year with an IPO� I will give you $ 3 million Pre-money
valuation
(unsophisticated?)Investor/ Lender� I want 40% ++ with no risk� Get me out next year with an IPO� I will give you $ 3 million Pre-money
valuation
INVESTOR�SDESIRES
DEVELOPER�S DESIRES
+ Risk- Risk
- Return
+ Return

25
What really happens
� Valuation of the project increases with the amount of work done to build the project to financial close
� Typically the developer invest seed funding of $100-500 K
� Typically, developer receives additional development funding to meet the 1-10% of the project development funding total
� At the end of project finance, the project finance investor owns the vast majority of the project, typically around 80% (depending on the amount of investment by the investor, project financials, etc.)Seed Development Project
Developer
Development investor
Project finance investor
20%
PROJECT VALUE
TIME

26
Financial structures summary
MechanismProject Capital
Financing Structure
Same as investor flip, but developer uses outside debt in exchange for equity in project
All equity, but developer has outside debt
Back Leveraged
Sameness investor flip, but adds that financing. Loan size is based on amortization/cash flow/creditconsiderations
Equity and Debt
Cash Leveraged
Investor finances much of the project, injecting some equity upfront and additional equity overtime
All EquityPay as you go
Investor contributes almost all of equity, receives almost all of cash & tax benefit prior to return based flip in allocations
All EquityInvestor Flip
Corporate/strategic and the developed projects and finances all cost, receives all tax benefits
All EquityCorporate

27
Financial Structure: pick the one that fits
Back leveredNoYesYesYesLimitedNo6
Cash leveragedNoYesNoYeslimitedNo5
Pay-as-you-goYesN/AyesYesYesNo4
Investor flipNoNoYesYesLimitedNo3
Strategic/Corporate
NoNoNoYesYesYes2
Sell project�s strategic investor
NoN/AyesNoNoNo1
Most suitable financing strategy
Project already exists: refinancing/acquisition
Developer has low projected IRR
Developer wants early cash distribution
Developer wants to retain stake in project
Developer can fund project cost
Developer can use tax benefit
scenario
Depending on the structure, and the amount of development funding required, developer financial wherewithal, and developer needs, a variety of scenarios are possible

28
Flip example
� Initial (3-5 years) depreciation in excess of project�s ability to use it
� �Sell� the majority of the project to investor who can tax losses against passive gains
� �Flip� back to the developer (ratio reversed) after investor returns are realized
� Complex structures, requiring legal and accounting professionals skilled in the issues
OWNERSHIP PERCENTAGE
TIME
Investor
ACCELERATED DEPRECIATION
Developer �Flip�

29
Size vs complexity
� Larger transactions: (ethanol, wind, biomass power generation) more complex, require substantial structuring
� Smaller transactions: (bio diesel, anaerobic digesters) less complex, require little or no structuring
� Investment banking generally required to structure larger transactions
� Investment in smaller transactions better suited to aggregation
$ Million
0
5
10
50
100
200
300
DIGESTORS
BIODIE
SEL
BIOM
ASS
WIN
D
ETAHNOL
Development financeProject finance
AGGREGATIONREQUIRED
PROJECTFINANCE
COMPLEXITY

30
What Does It All Mean?
� Financial markets: frothy� Unknowledgeable investors will fall into failed deals?� What happens in the overbuilt over hyped short/medium term:
Dot.Bomb shakeout coming?� Credit Crunch: Terms and rates currently unfavorable� Long term prospect: Overall, excellent, returns will improve as oil
prices continue to increase and developers mature
BIOMASS
BIOMASS
WINDWIND
+ Risk- Risk- Return
ETHANOLETHANOL
+ Return
BIODIESEL
BIODIESEL
Commodity Pressure

Sigma Capital Group
TURNING RENEWABLES INTO SHAREHOLDER VALUE
Sigma Capital Group, Inc.Bruce Woodry, Chairman and CEO
Phone: (906) 483-0406 [email protected]
www.sigmacapital.net