toc bottleneck examples
TRANSCRIPT
Identifying the BottleneckIdentifying the Bottleneck
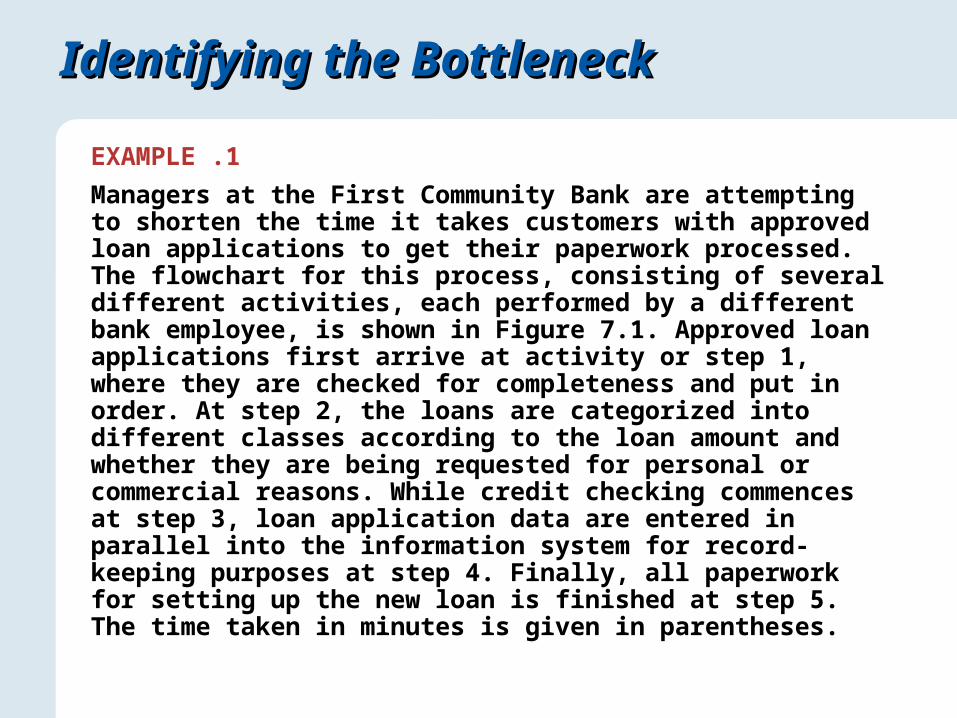
EXAMPLE .1
Managers at the First Community Bank are attempting to shorten the time it takes customers with approved loan applications to get their paperwork processed. The flowchart for this process, consisting of several different activities, each performed by a different bank employee, is shown in Figure 7.1. Approved loan applications first arrive at activity or step 1, where they are checked for completeness and put in order. At step 2, the loans are categorized into different classes according to the loan amount and whether they are being requested for personal or commercial reasons. While credit checking commences at step 3, loan application data are entered in parallel into the information system for record-keeping purposes at step 4. Finally, all paperwork for setting up the new loan is finished at step 5. The time taken in minutes is given in parentheses.
Complete paperwork for new loan
(10 min)
Identifying the BottleneckIdentifying the Bottleneck
Check for credit rating (15 min)
Enter loan application into the system
(12 min)
Categorize loans (20 min)
Check loan documents and put them order
(15 min)
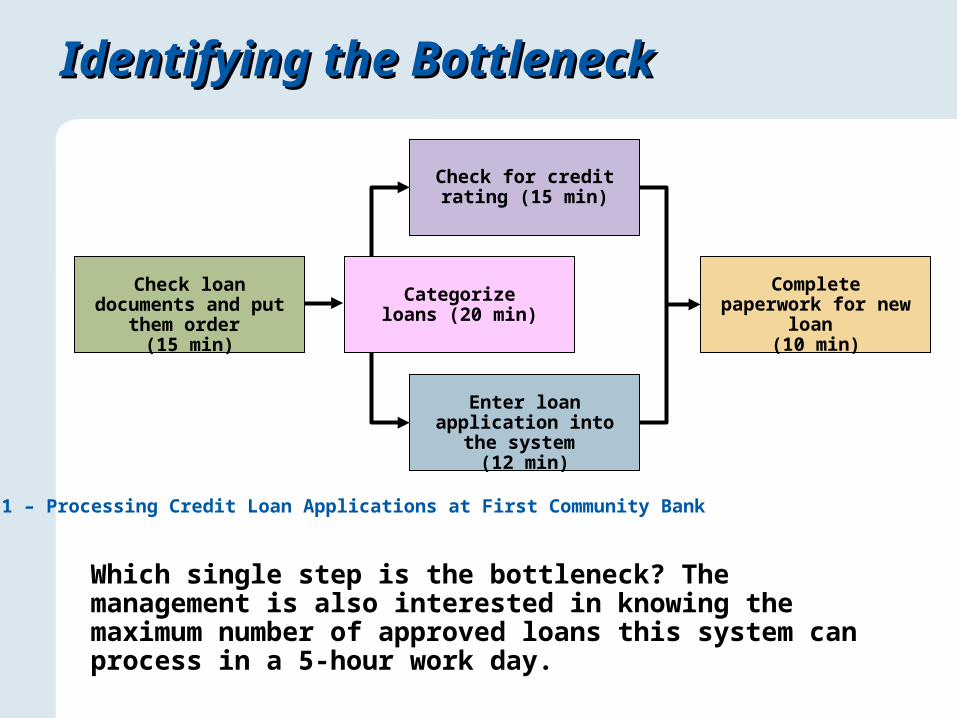
Figure 1 – Processing Credit Loan Applications at First Community Bank
Which single step is the bottleneck? The management is also interested in knowing the maximum number of approved loans this system can process in a 5-hour work day.
Identifying the BottleneckIdentifying the Bottleneck
SOLUTION
We define the bottleneck as step 2, where a single-minute reduction in its time reduces the average throughput time of the entire loan approval process. The throughput time to complete an approved loan application is 15 + 20 + max(15, 12) + 10 = 60 minutes. Although we assume no waiting time in front of any step, in practice such a smooth process flow is not always the case. So the actual time taken for completing an approved loan will be longer than 60 minutes due to nonuniform arrival of applications, variations in actual processing times, and the related factors.
The capacity for loan completions is derived by translating the “minutes per customer” at the bottleneck step to “customer per hour.” At First Community Bank, it is 3 customers per hour because the bottleneck step 2 can process only 1 customer every 20 minutes (60/3).

Identifying the BottleneckIdentifying the Bottleneck
Services may not have simple line flows and demand may vary considerably
Bottlenecks can be identified by using average utilization
Variability creates floating bottlenecks
Variability increases complexity
Application 1Application 1
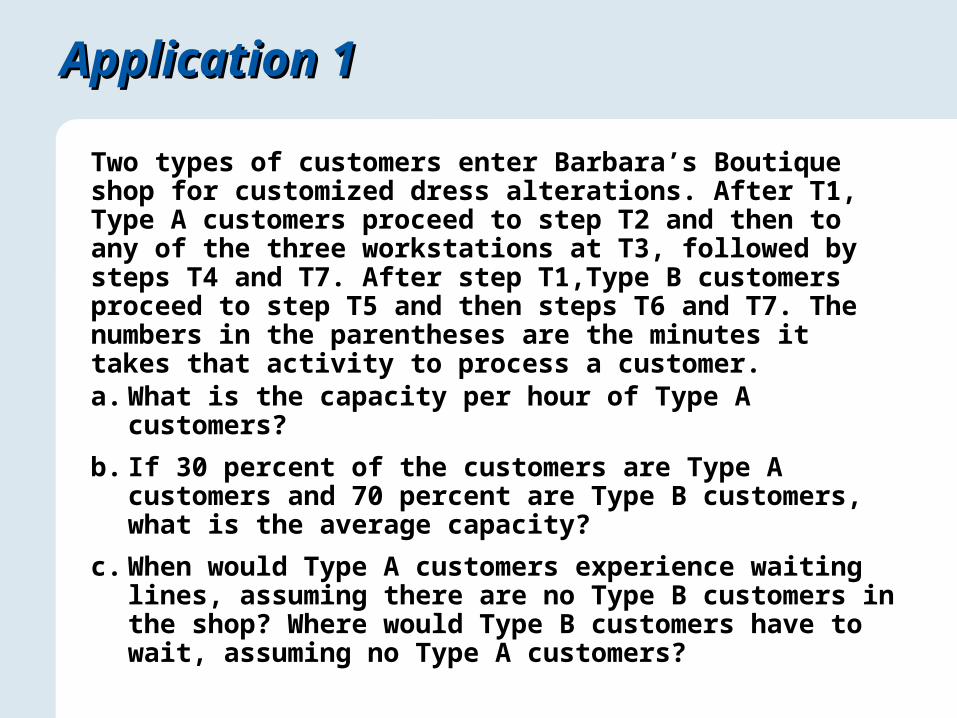
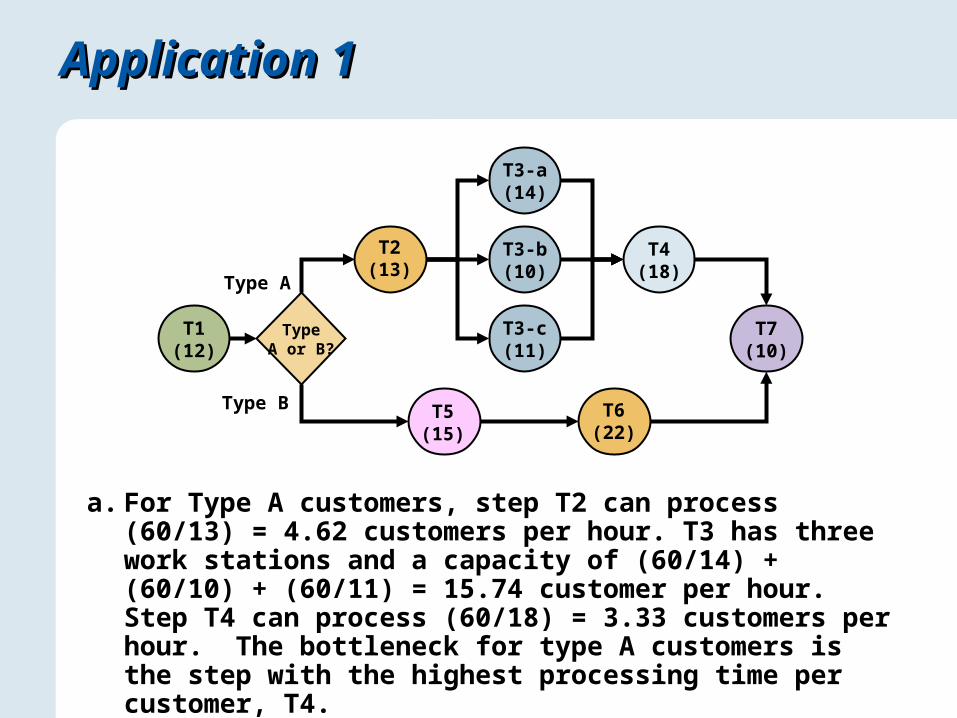
Two types of customers enter Barbara’s Boutique shop for customized dress alterations. After T1, Type A customers proceed to step T2 and then to any of the three workstations at T3, followed by steps T4 and T7. After step T1,Type B customers proceed to step T5 and then steps T6 and T7. The numbers in the parentheses are the minutes it takes that activity to process a customer.
a. What is the capacity per hour of Type A customers?
b. If 30 percent of the customers are Type A customers and 70 percent are Type B customers, what is the average capacity?
c. When would Type A customers experience waiting lines, assuming there are no Type B customers in the shop? Where would Type B customers have to wait, assuming no Type A customers?
Application 1Application 1
a. For Type A customers, step T2 can process (60/13) = 4.62 customers per hour. T3 has three work stations and a capacity of (60/14) + (60/10) + (60/11) = 15.74 customer per hour. Step T4 can process (60/18) = 3.33 customers per hour. The bottleneck for type A customers is the step with the highest processing time per customer, T4.
T1(12)
T7(10)
T4(18)
T3-a(14)
T3-c(11)
T3-b(10)
TypeA or B?
Type A
Type B
T2(13)
T6(22)
T5(15)
Application 1Application 1
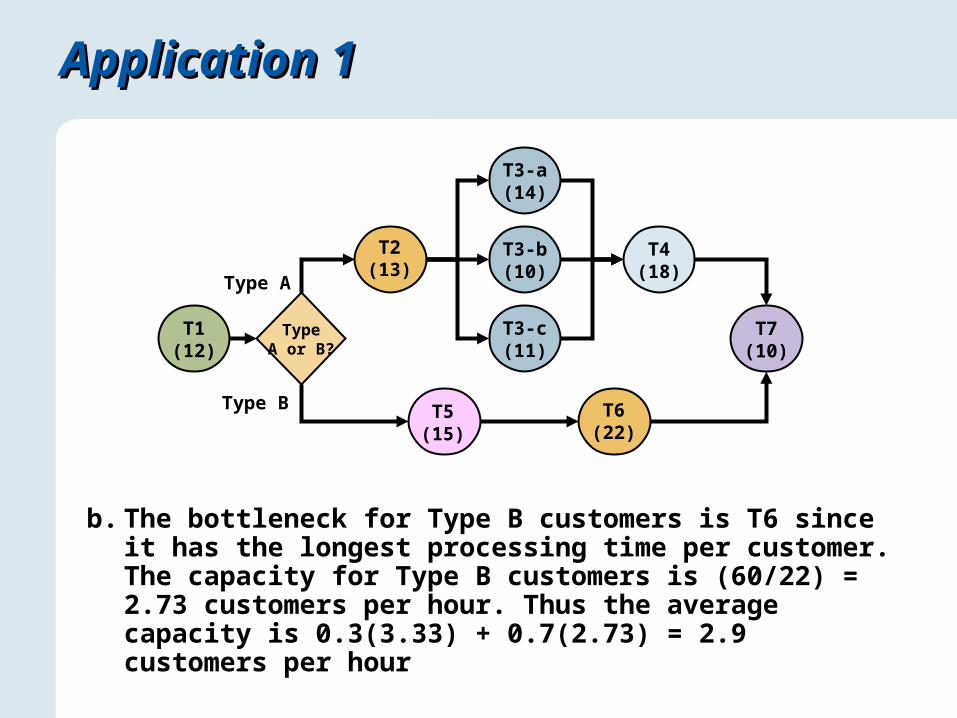
b. The bottleneck for Type B customers is T6 since it has the longest processing time per customer. The capacity for Type B customers is (60/22) = 2.73 customers per hour. Thus the average capacity is 0.3(3.33) + 0.7(2.73) = 2.9 customers per hour
T1(12)
T7(10)
T4(18)
T3-a(14)
T3-c(11)
T3-b(10)
TypeA or B?
Type A
Type B
T2(13)
T6(22)
T5(15)
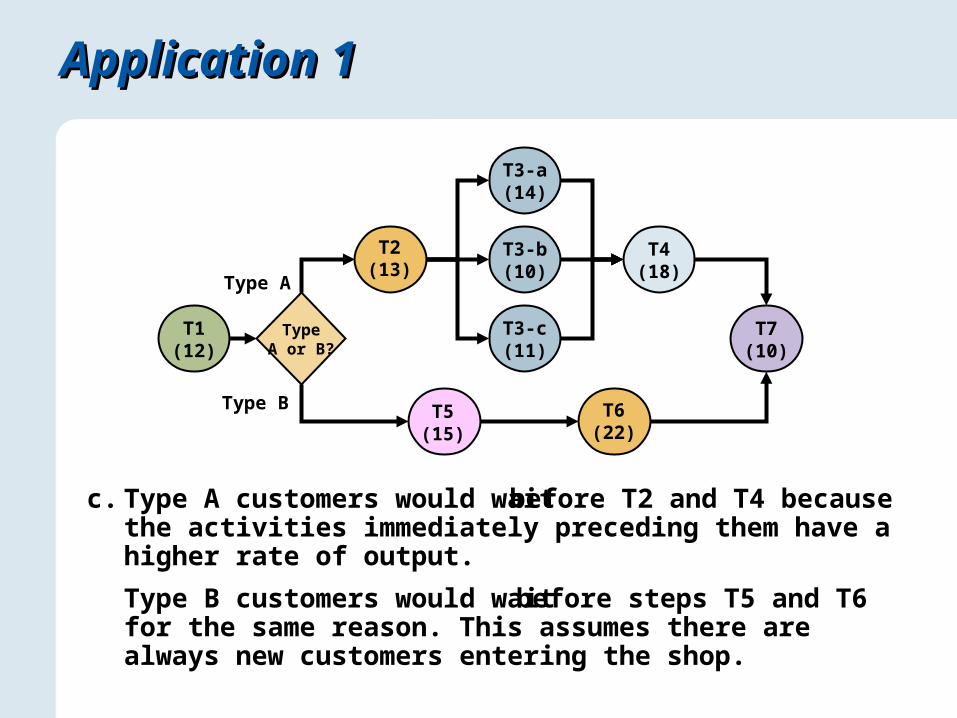
before T2 and T4 because the activities immediately preceding them have a higher rate of output.
c. Type A customers would wait
Application 1Application 1
before steps T5 and T6 for the same reason. This assumes there are always new customers entering the shop.
Type B customers would wait
T1(12)
T7(10)
T4(18)
T3-a(14)
T3-c(11)
T3-b(10)
TypeA or B?
Type A
Type B
T2(13)
T6(22)
T5(15)
Identifying the BottleneckIdentifying the Bottleneck
EXAMPLE 2
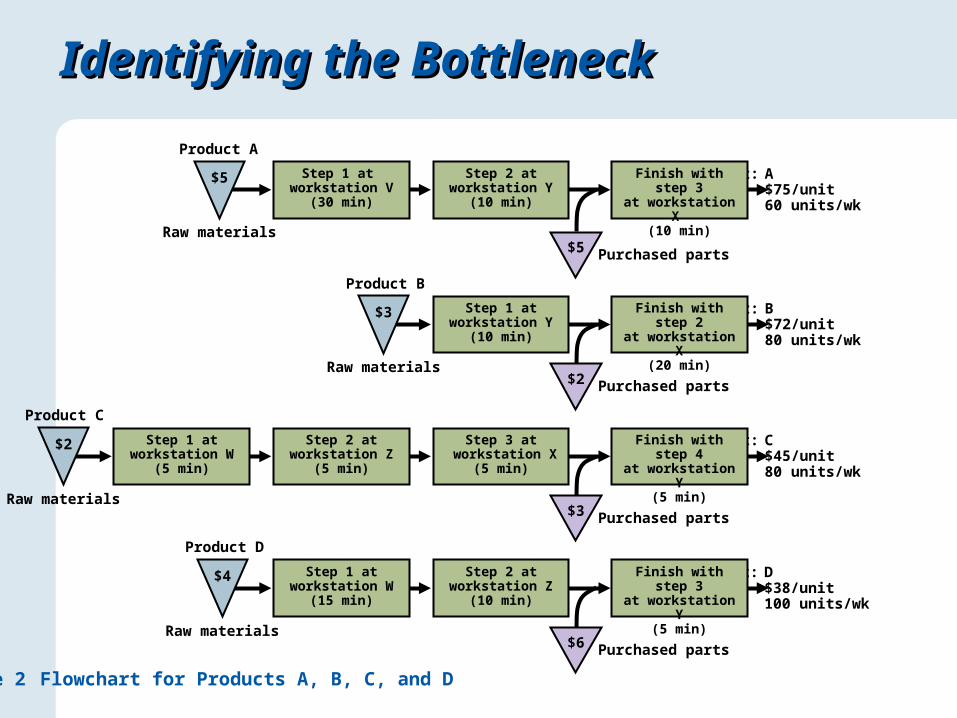
Diablo Electronics manufactures four unique products (A, B, C, and D) that are fabricated and assembled in five different workstations (V, W, X, Y, and Z) using a small batch process. Each workstation is staffed by a worker who is dedicated to work a single shift per day at an assigned workstation. Batch setup times have been reduced to such an extent that they can be considered negligible. Figure 7.2 is a flowchart of the manufacturing process. Diablo can make and sell up to the limit of its demand per week, and no penalties are incurred for not being able to meet all the demand.
Which of the five workstations (V, W, X, Y, or Z) has the highest utilization, and thus serves as the bottleneck for Diablo Electronics?
Identifying the BottleneckIdentifying the Bottleneck
Product A
$5Raw materials
Purchased parts
Product: APrice: $75/unitDemand: 60 units/wk
Step 1 at workstation V
(30 min)
Finish with step 3at workstation X
(10 min)
Step 2 atworkstation Y
(10 min)
$5
Product C
Raw materialsPurchased parts
Product: CPrice: $45/unitDemand: 80 units/wk
Finish with step 4at workstation Y
(5 min)
Step 2 atworkstation Z
(5 min)
Step 3 at workstation X
(5 min)
Step 1 atworkstation W
(5 min)
$2
$3
Product B
Raw materialsPurchased parts
Product: BPrice: $72/unitDemand: 80 units/wk
Finish with step 2at workstation X
(20 min)
Step 1 atworkstation Y
(10 min)
$3
$2
Product D
Raw materialsPurchased parts
Product: DPrice: $38/unitDemand: 100 units/wk
$4 Step 2 atworkstation Z
(10 min)
Finish with step 3at workstation Y
(5 min)
Step 1 atworkstation W
(15 min)
$6
Figure 2 Flowchart for Products A, B, C, and D
Identifying the BottleneckIdentifying the Bottleneck
SOLUTION
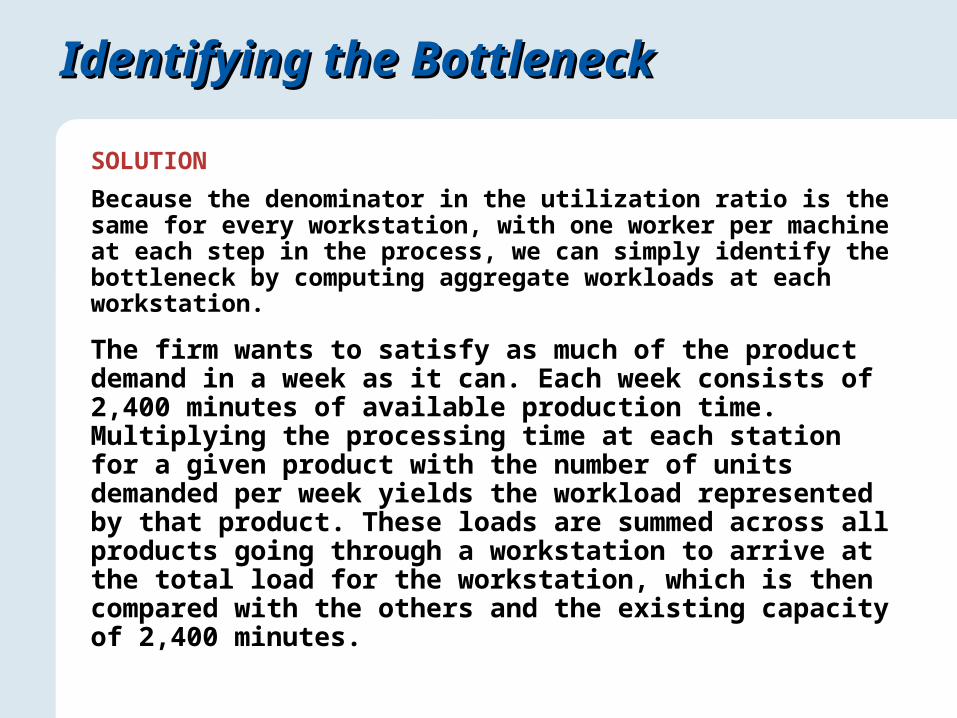
Because the denominator in the utilization ratio is the same for every workstation, with one worker per machine at each step in the process, we can simply identify the bottleneck by computing aggregate workloads at each workstation.
The firm wants to satisfy as much of the product demand in a week as it can. Each week consists of 2,400 minutes of available production time. Multiplying the processing time at each station for a given product with the number of units demanded per week yields the workload represented by that product. These loads are summed across all products going through a workstation to arrive at the total load for the workstation, which is then compared with the others and the existing capacity of 2,400 minutes.
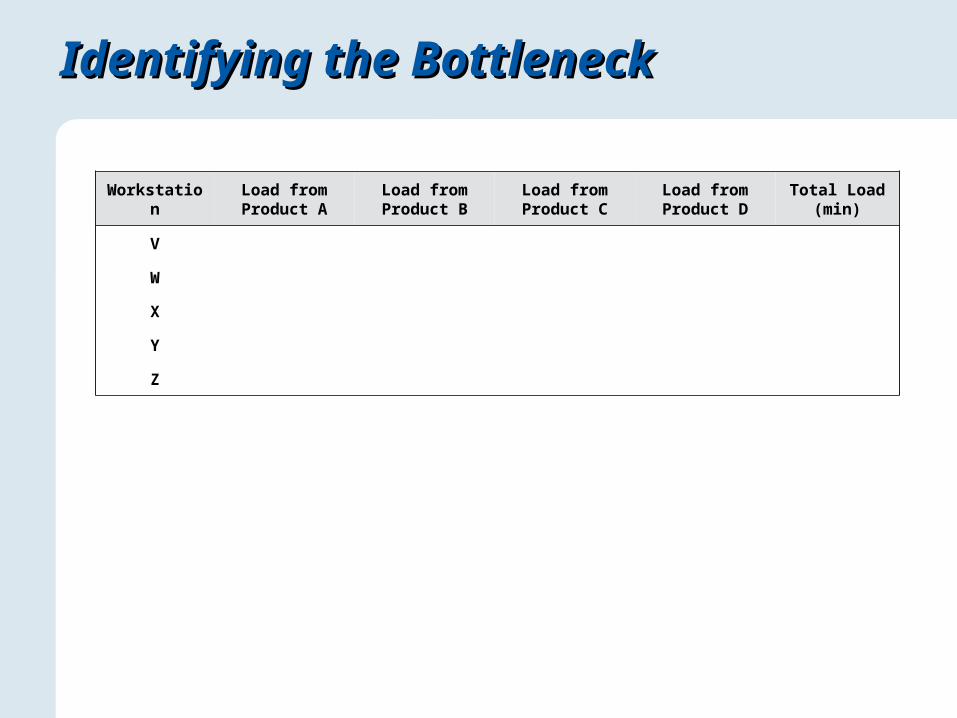
WorkstationLoad from Product A
Load from Product B
Load from Product C
Load from Product D
Total Load (min)
V
W
X
Y
Z
Identifying the BottleneckIdentifying the Bottleneck
Identifying the BottleneckIdentifying the Bottleneck
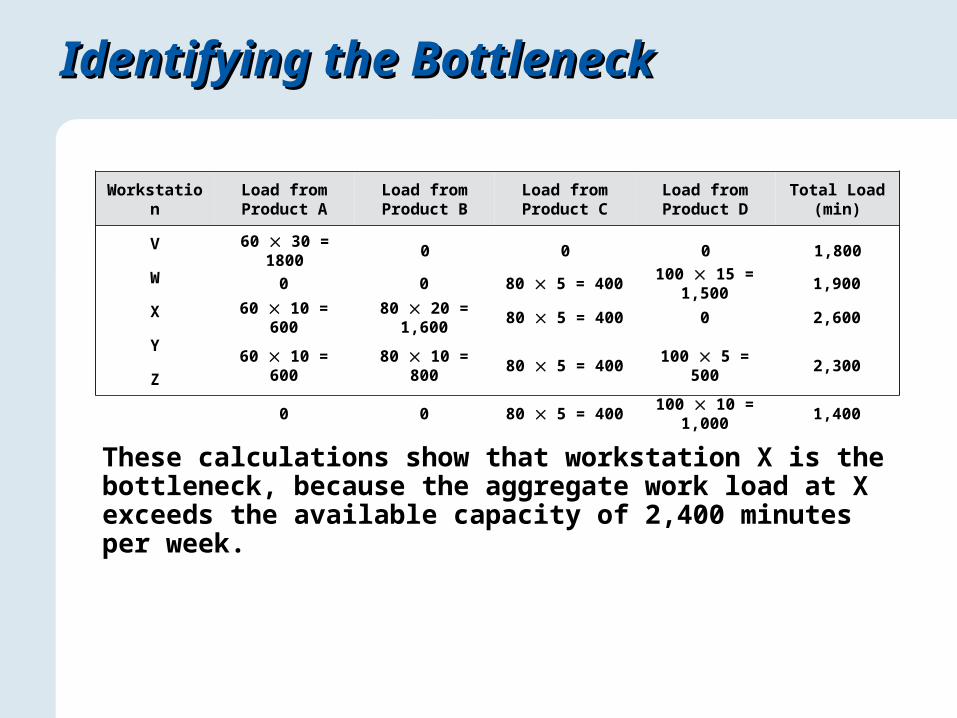
These calculations show that workstation X is the bottleneck, because the aggregate work load at X exceeds the available capacity of 2,400 minutes per week.
60 30 = 1800 0 0 0 1,800
0 0 80 5 = 400100 15 =
1,5001,900
60 10 = 600 80 20 = 1,600 80 5 = 400 0 2,600
60 10 = 600 80 10 = 800 80 5 = 400 100 5 = 500 2,300
0 0 80 5 = 400100 10 =
1,0001,400
WorkstationLoad from Product A
Load from Product B
Load from Product C
Load from Product D
Total Load (min)
V
W
X
Y
Z
Application 2Application 2
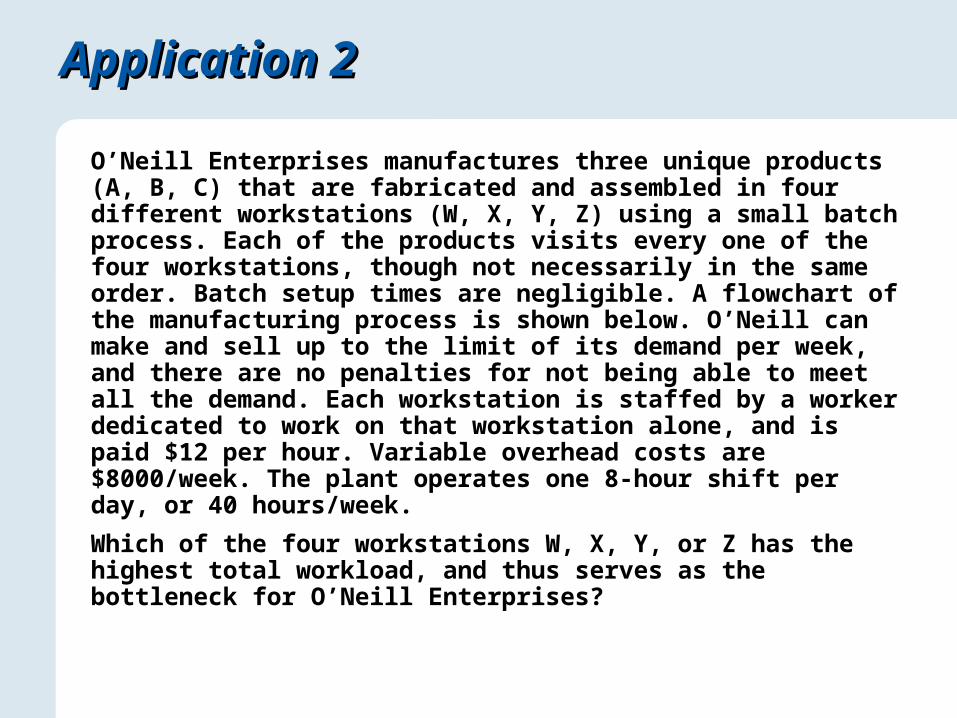
O’Neill Enterprises manufactures three unique products (A, B, C) that are fabricated and assembled in four different workstations (W, X, Y, Z) using a small batch process. Each of the products visits every one of the four workstations, though not necessarily in the same order. Batch setup times are negligible. A flowchart of the manufacturing process is shown below. O’Neill can make and sell up to the limit of its demand per week, and there are no penalties for not being able to meet all the demand. Each workstation is staffed by a worker dedicated to work on that workstation alone, and is paid $12 per hour. Variable overhead costs are $8000/week. The plant operates one 8-hour shift per day, or 40 hours/week.
Which of the four workstations W, X, Y, or Z has the highest total workload, and thus serves as the bottleneck for O’Neill Enterprises?
Application 2Application 2
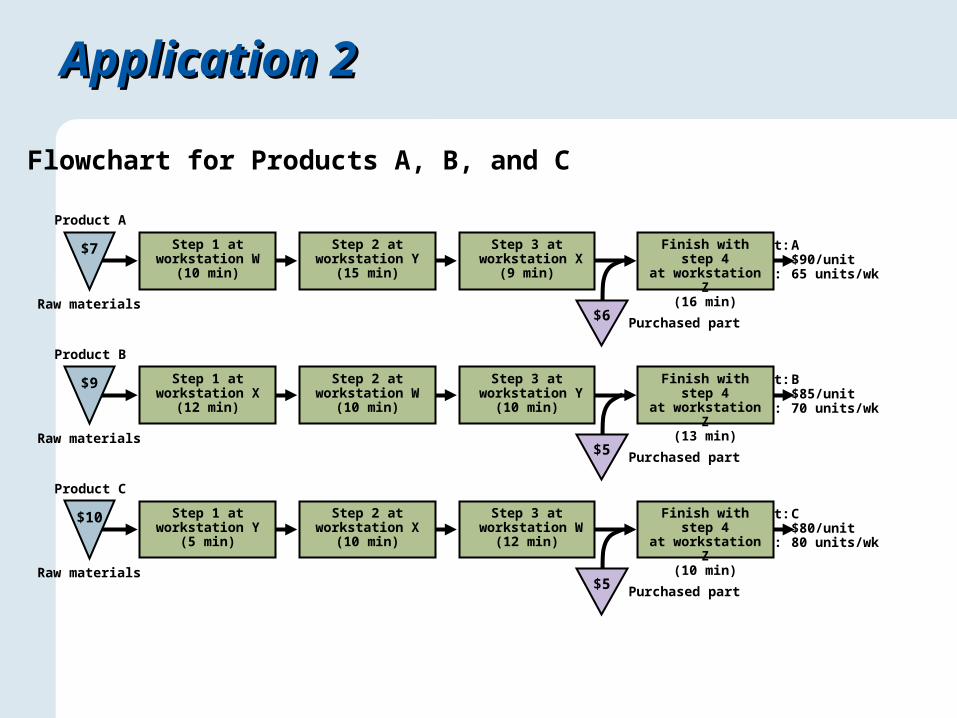
Product B
Raw materials
Purchased part
Product: BPrice: $85/unitDemand: 70 units/wk
Finish with step 4at workstation Z
(13 min)
Step 2 atworkstation W
(10 min)
Step 3 at workstation Y
(10 min)
Step 1 atworkstation X
(12 min)
$9
$5
Product A
Raw materials
Purchased part
Product: APrice: $90/unitDemand: 65 units/wk
Finish with step 4at workstation Z
(16 min)
Step 2 atworkstation Y
(15 min)
Step 3 at workstation X
(9 min)
Step 1 atworkstation W
(10 min)
$7
$6
Product C
Raw materials
Purchased part
Product: CPrice: $80/unitDemand: 80 units/wk
Finish with step 4at workstation Z
(10 min)
Step 2 atworkstation X
(10 min)
Step 3 at workstation W
(12 min)
Step 1 atworkstation Y
(5 min)
$10
$5
Flowchart for Products A, B, and C
Application 2Application 2
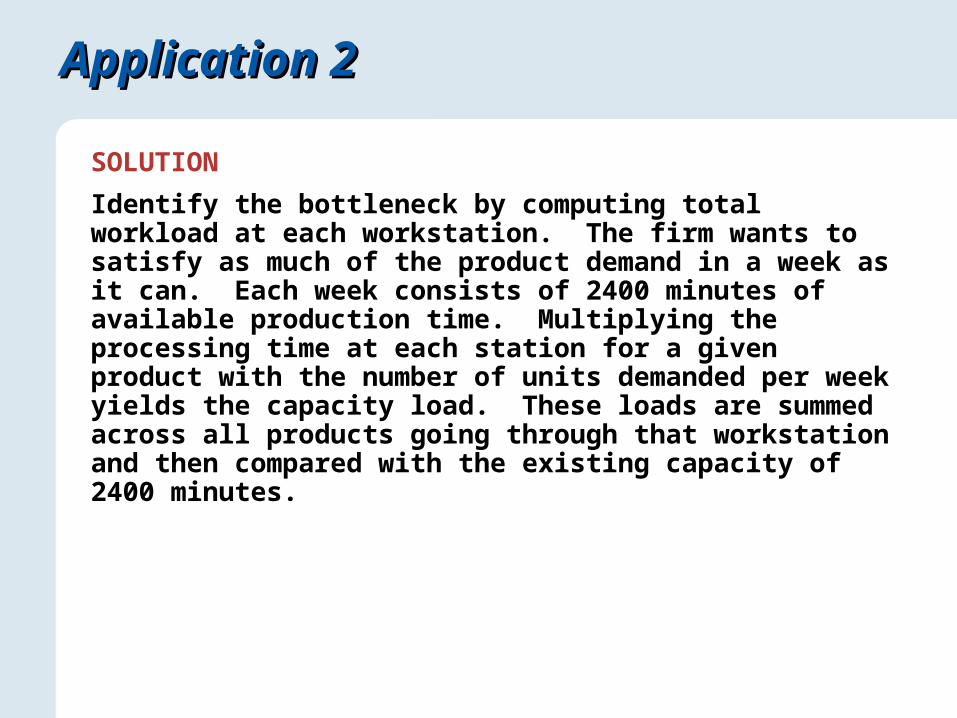
SOLUTION
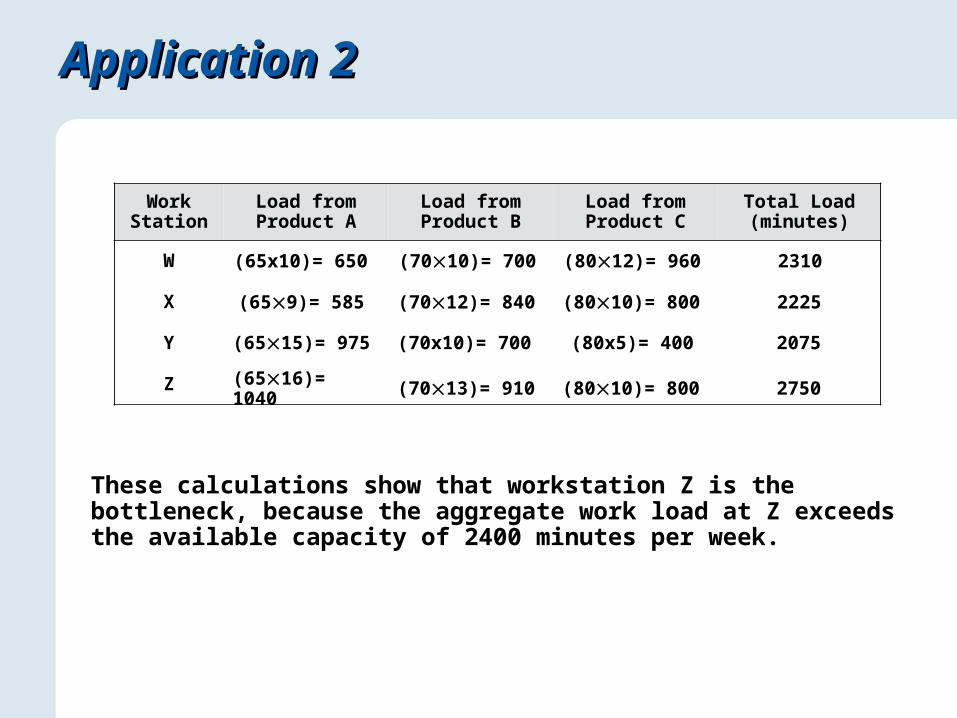
Identify the bottleneck by computing total workload at each workstation. The firm wants to satisfy as much of the product demand in a week as it can. Each week consists of 2400 minutes of available production time. Multiplying the processing time at each station for a given product with the number of units demanded per week yields the capacity load. These loads are summed across all products going through that workstation and then compared with the existing capacity of 2400 minutes.
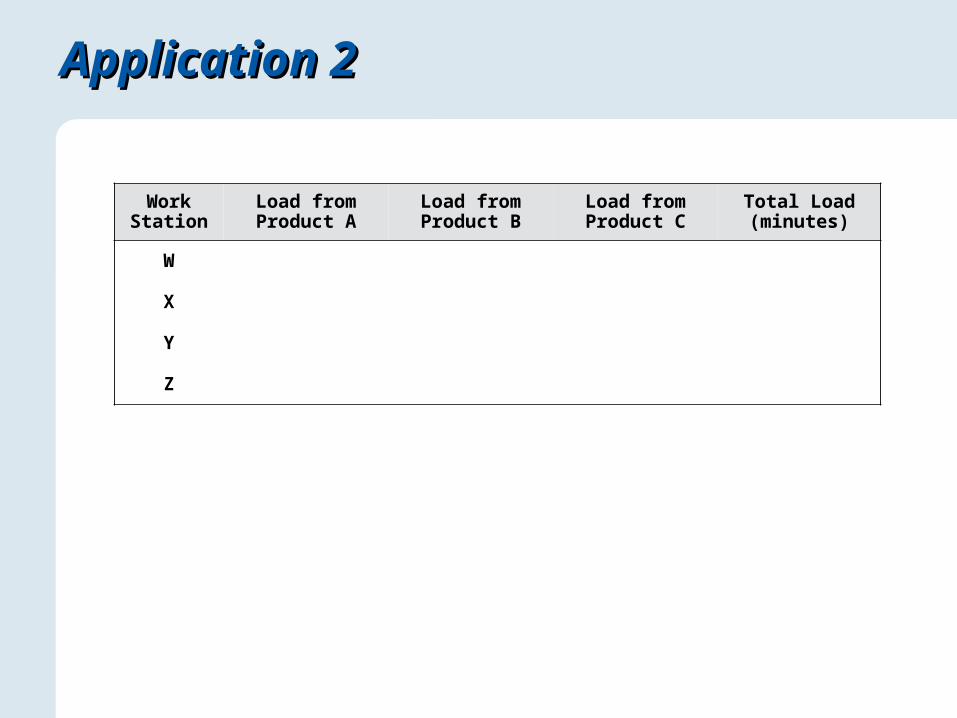
Work Station
Load from Product A
Load from Product B
Load from Product C
Total Load (minutes)
W
X
Y
Z
Application 2Application 2
Application 2Application 2
These calculations show that workstation Z is the bottleneck, because the aggregate work load at Z exceeds the available capacity of 2400 minutes per week.
(65x10)= 650 (7010)= 700 (8012)= 960 2310
(659)= 585 (7012)= 840 (8010)= 800 2225
(6515)= 975 (70x10)= 700 (80x5)= 400 2075
(6516)= 1040 (7013)= 910 (8010)= 800 2750
Work Station
Load from Product A
Load from Product B
Load from Product C
Total Load (minutes)
W
X
Y
Z
Determining the Product MixDetermining the Product Mix
EXAMPLE 3
The senior management at Diablo Electronics (see Exercise 7.2) wants to improve profitability by accepting the right set of orders, and so collected some additional financial data. Variable overhead costs are $8,500 per week. Each worker is paid $18 per hour and is paid for an entire week, regardless of how much the worker is used. Consequently, labor costs are fixed expenses. The plant operates one 8-hour shift per day, or 40 hours each week. Currently, decisions are made using the traditional method, which is to accept as much of the highest contribution margin product as possible (up to the limit of its demand), followed by the next highest contribution margin product, and so on until no more capacity is available.
Determining the Product MixDetermining the Product Mix
Pedro Rodriguez, the newly hired production supervisor, is knowledgeable about the theory of constraints and bottleneck-based scheduling. He believes that profitability can indeed be improved if bottleneck resources were exploited to determine the product mix. What is the change in profits if, instead of the traditional method used by Diablo Electronics, the bottleneck method advocated by Pedro is used to select the product mix?
SOLUTION
Decision Rule 1: Traditional Method
Select the best product mix according to the highest overall contribution margin of each product.
Determining the Product MixDetermining the Product Mix
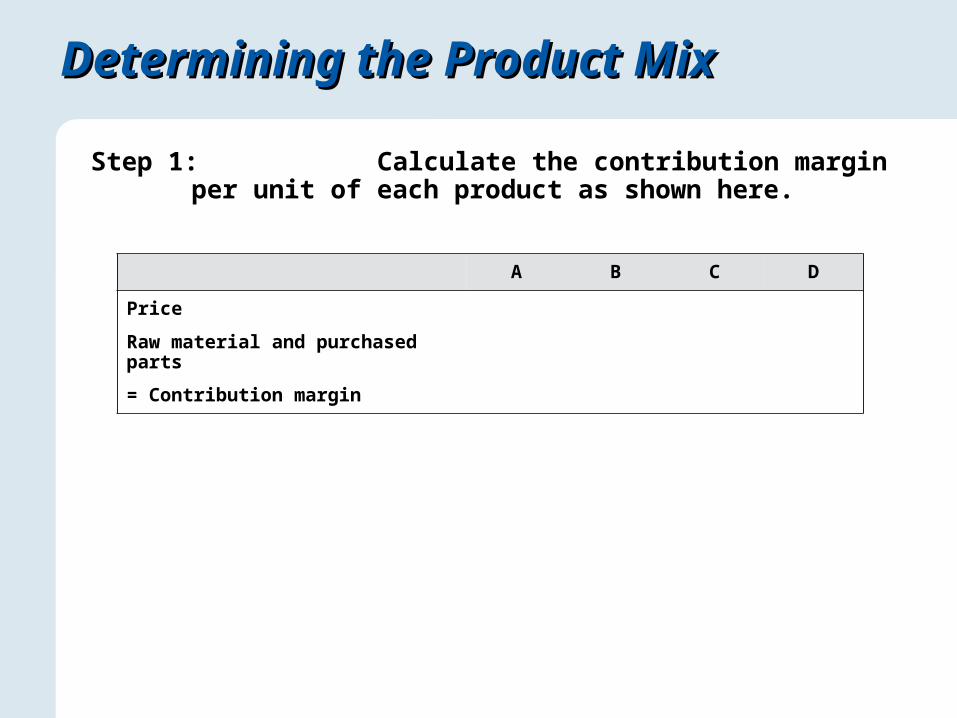
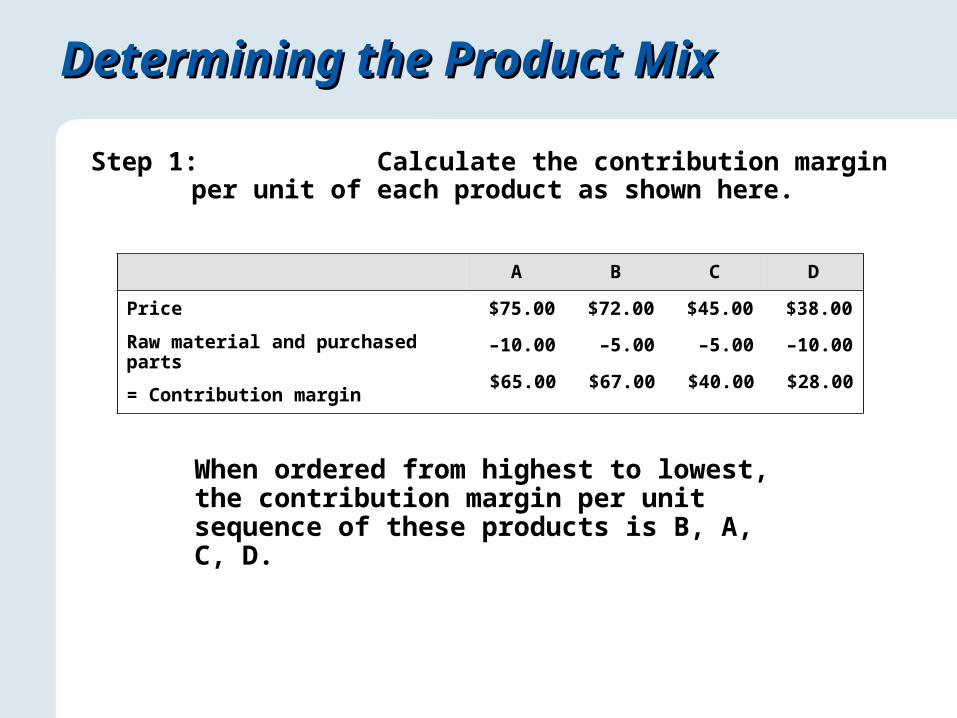
Step 1: Calculate the contribution margin per unit of each product as shown here.
A B C D
Price
Raw material and purchased parts
= Contribution margin
Determining the Product MixDetermining the Product Mix
Step 1: Calculate the contribution margin per unit of each product as shown here.
When ordered from highest to lowest, the contribution margin per unit sequence of these products is B, A, C, D.
$75.00 $72.00 $45.00 $38.00
–10.00 –5.00 –5.00 –10.00
$65.00 $67.00 $40.00 $28.00
A B C D
Price
Raw material and purchased parts
= Contribution margin
Determining the Product MixDetermining the Product Mix
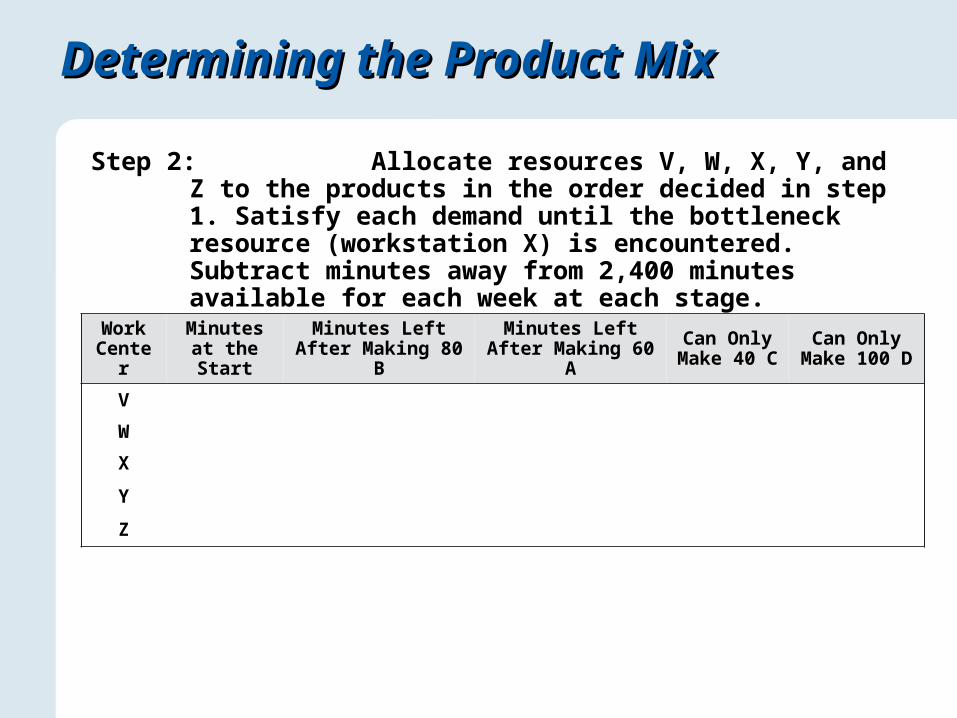
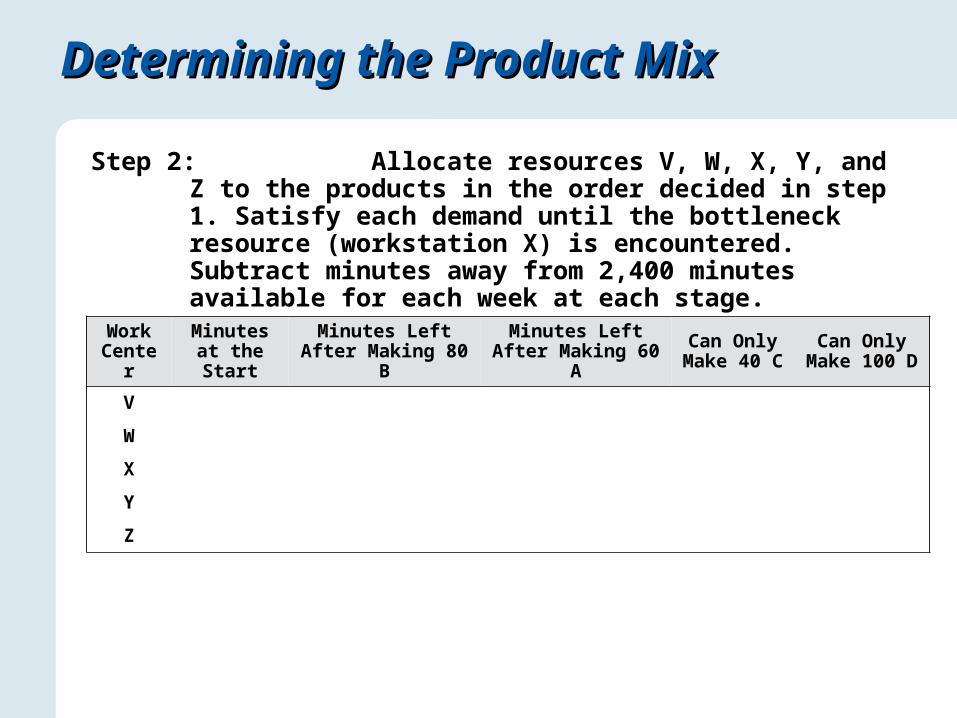
Step 2: Allocate resources V, W, X, Y, and Z to the products in the order decided in step 1. Satisfy each demand until the bottleneck resource (workstation X) is encountered. Subtract minutes away from 2,400 minutes available for each week at each stage.
Work Center
Minutes at the Start
Minutes Left After Making 80 B
Minutes Left After Making 60 A
Can Only Make 40 C
Can Only Make 100 D
V
W
X
Y
Z
Determining the Product MixDetermining the Product Mix
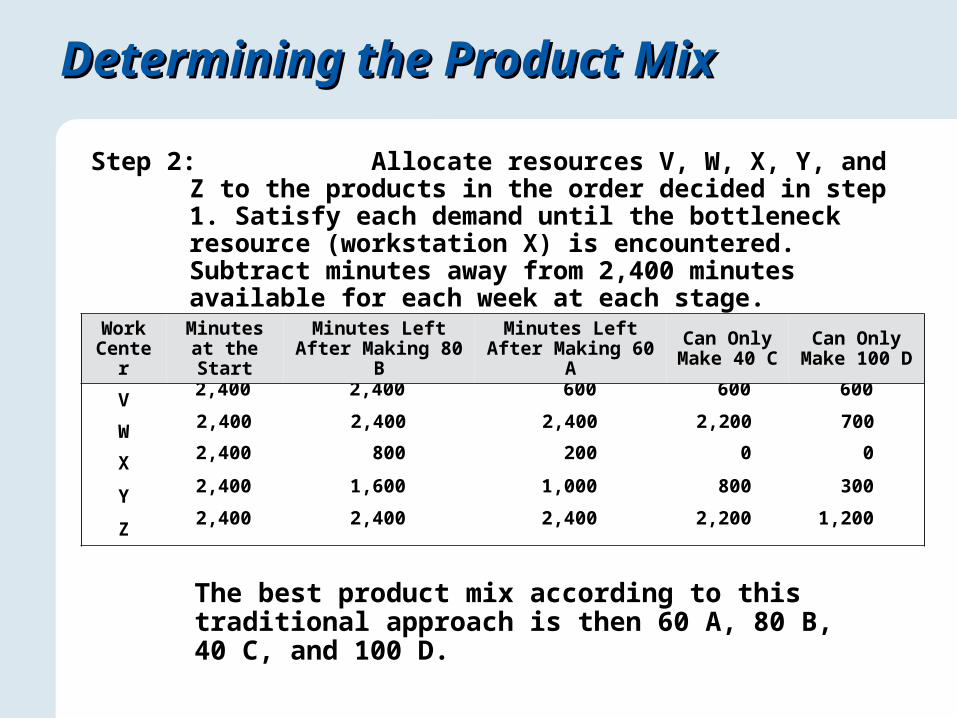
Step 2: Allocate resources V, W, X, Y, and Z to the products in the order decided in step 1. Satisfy each demand until the bottleneck resource (workstation X) is encountered. Subtract minutes away from 2,400 minutes available for each week at each stage.
The best product mix according to this traditional approach is then 60 A, 80 B, 40 C, and 100 D.
2,400 2,400 600 600 600
2,400 2,400 2,400 2,200 700
2,400 800 200 0 0
2,400 1,600 1,000 800 300
2,400 2,400 2,400 2,200 1,200
Work Center
Minutes at the Start
Minutes Left After Making 80 B
Minutes Left After Making 60 A
Can Only Make 40 C
Can Only Make 100 D
V
W
X
Y
Z
Determining the Product MixDetermining the Product Mix
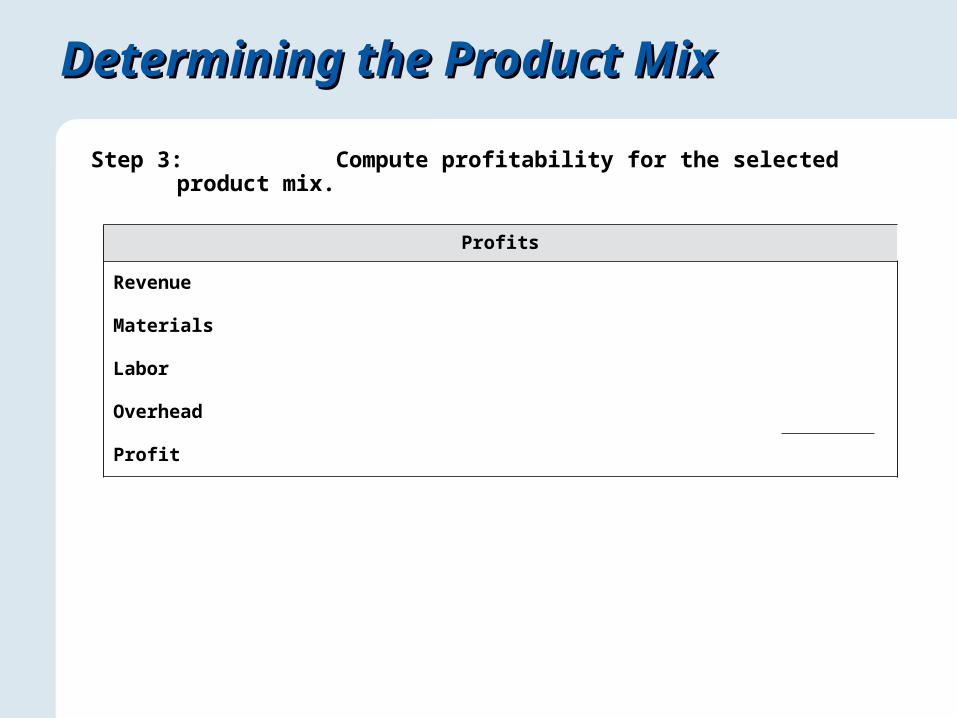
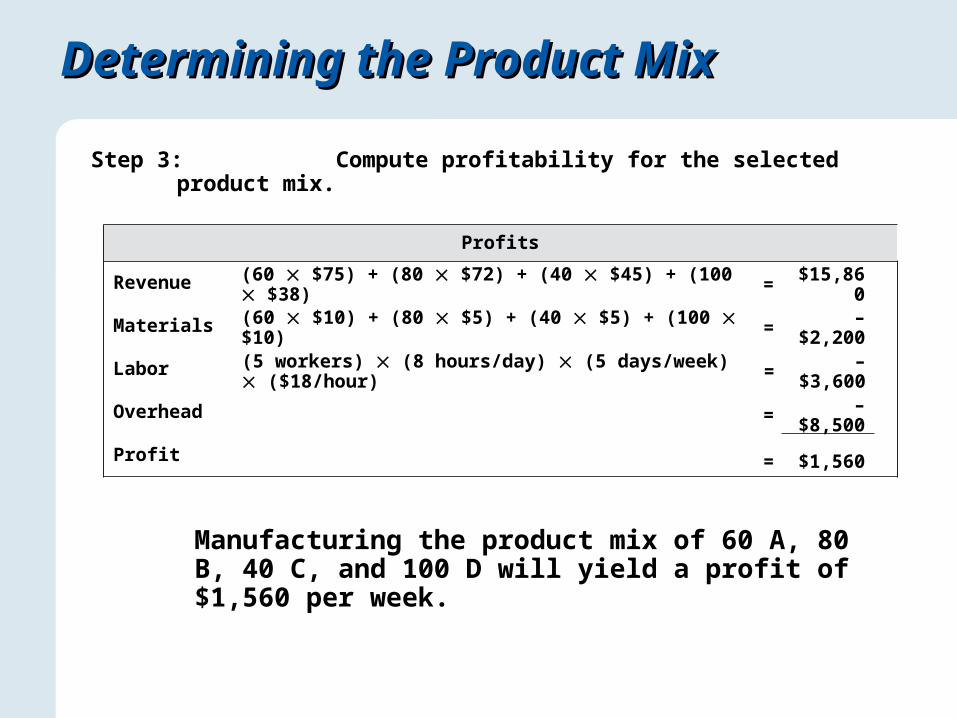
Step 3: Compute profitability for the selected product mix.
Profits
Revenue
Materials
Labor
Overhead
Profit
Determining the Product MixDetermining the Product Mix
Step 3: Compute profitability for the selected product mix.
Manufacturing the product mix of 60 A, 80 B, 40 C, and 100 D will yield a profit of $1,560 per week.
(60 $75) + (80 $72) + (40 $45) + (100 $38) = $15,860
Profits
Revenue
Materials
Labor
Overhead
Profit
(60 $10) + (80 $5) + (40 $5) + (100 $10) = –$2,200
(5 workers) (8 hours/day) (5 days/week) ($18/hour) = –$3,600
= –$8,500
= $1,560
Determining the Product MixDetermining the Product Mix
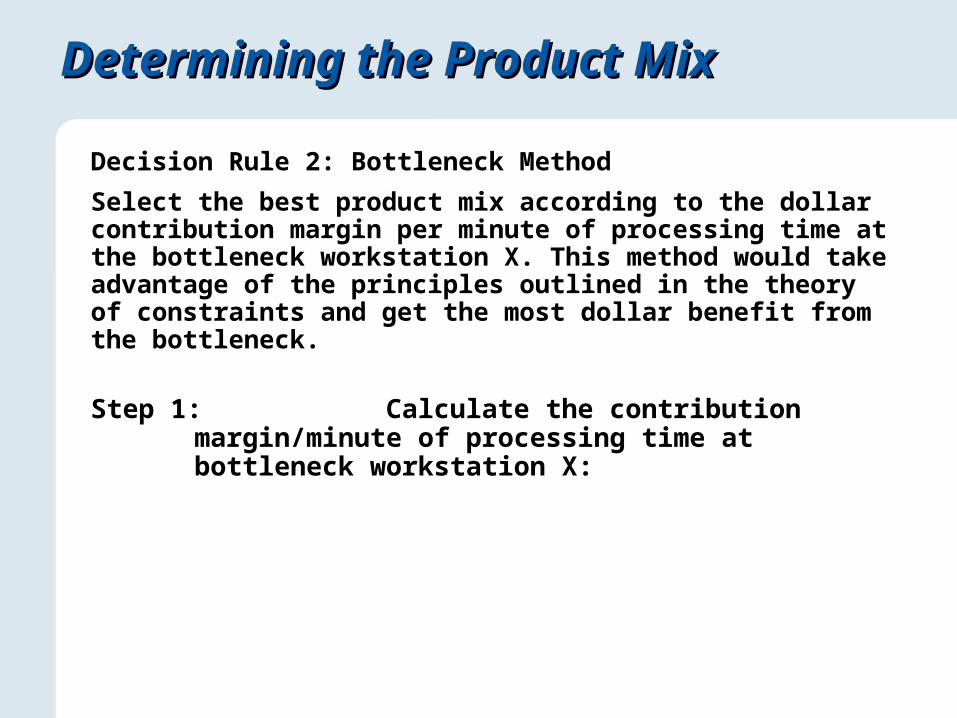
Decision Rule 2: Bottleneck Method
Select the best product mix according to the dollar contribution margin per minute of processing time at the bottleneck workstation X. This method would take advantage of the principles outlined in the theory of constraints and get the most dollar benefit from the bottleneck.
Step 1: Calculate the contribution margin/minute of processing time at bottleneck workstation X:
Determining the Product MixDetermining the Product Mix
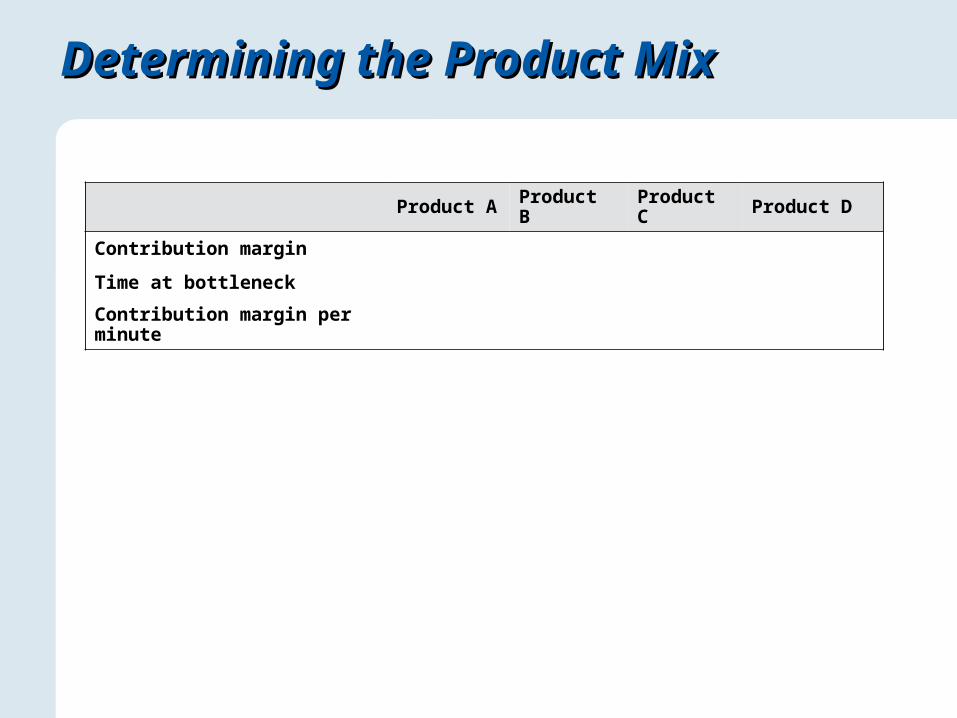
Product A Product B Product C Product D
Contribution margin
Time at bottleneck
Contribution margin per minute
Determining the Product MixDetermining the Product Mix
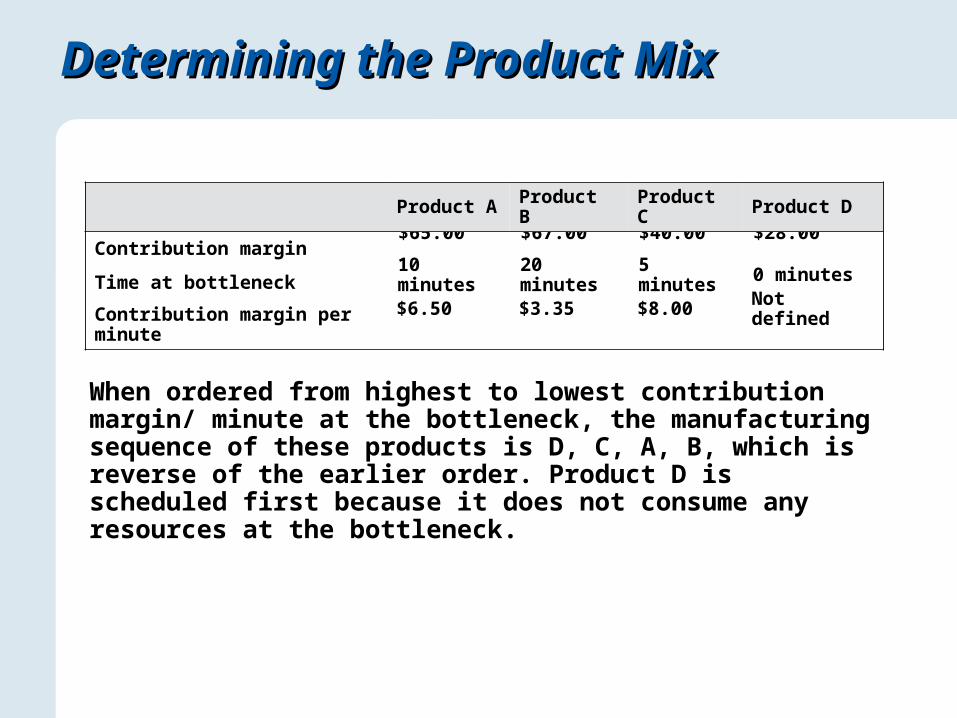
When ordered from highest to lowest contribution margin/ minute at the bottleneck, the manufacturing sequence of these products is D, C, A, B, which is reverse of the earlier order. Product D is scheduled first because it does not consume any resources at the bottleneck.
$65.00 $67.00 $40.00 $28.00
10 minutes 20 minutes 5 minutes 0 minutes
$6.50 $3.35 $8.00 Not defined
Product A Product B Product C Product D
Contribution margin
Time at bottleneck
Contribution margin per minute
Determining the Product MixDetermining the Product Mix
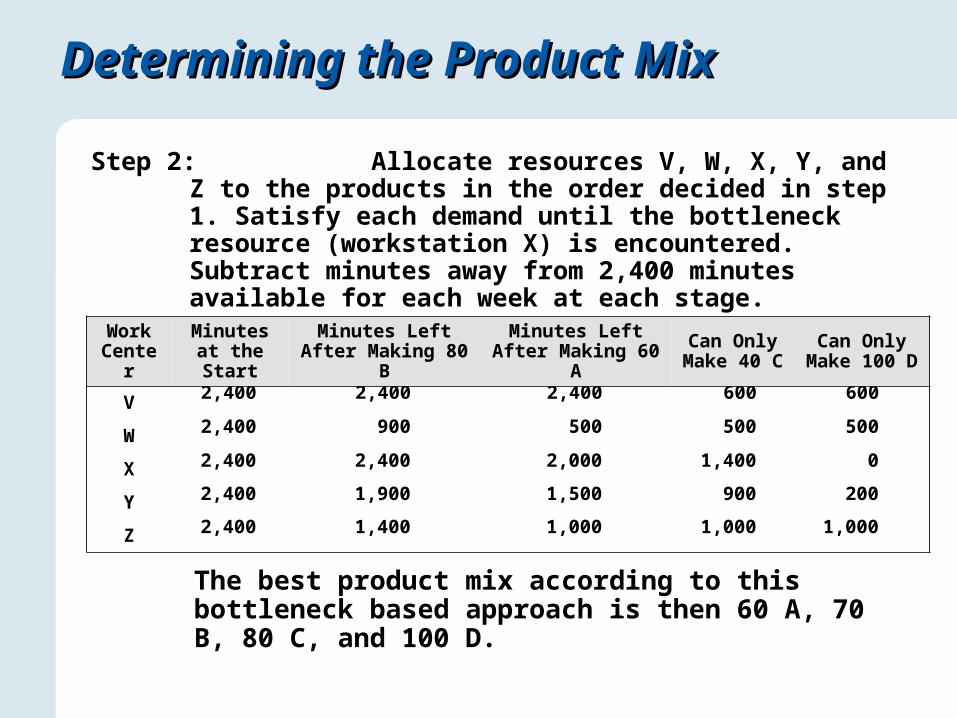
Step 2: Allocate resources V, W, X, Y, and Z to the products in the order decided in step 1. Satisfy each demand until the bottleneck resource (workstation X) is encountered. Subtract minutes away from 2,400 minutes available for each week at each stage.
Work Center
Minutes at the Start
Minutes Left After Making 80 B
Minutes Left After Making 60 A
Can Only Make 40 C
Can Only Make 100 D
V
W
X
Y
Z
Determining the Product MixDetermining the Product Mix
Step 2: Allocate resources V, W, X, Y, and Z to the products in the order decided in step 1. Satisfy each demand until the bottleneck resource (workstation X) is encountered. Subtract minutes away from 2,400 minutes available for each week at each stage.
The best product mix according to this bottleneck based approach is then 60 A, 70 B, 80 C, and 100 D.
2,400 2,400 2,400 600 600
2,400 900 500 500 500
2,400 2,400 2,000 1,400 0
2,400 1,900 1,500 900 200
2,400 1,400 1,000 1,000 1,000
Work Center
Minutes at the Start
Minutes Left After Making 80 B
Minutes Left After Making 60 A
Can Only Make 40 C
Can Only Make 100 D
V
W
X
Y
Z
Determining the Product MixDetermining the Product Mix
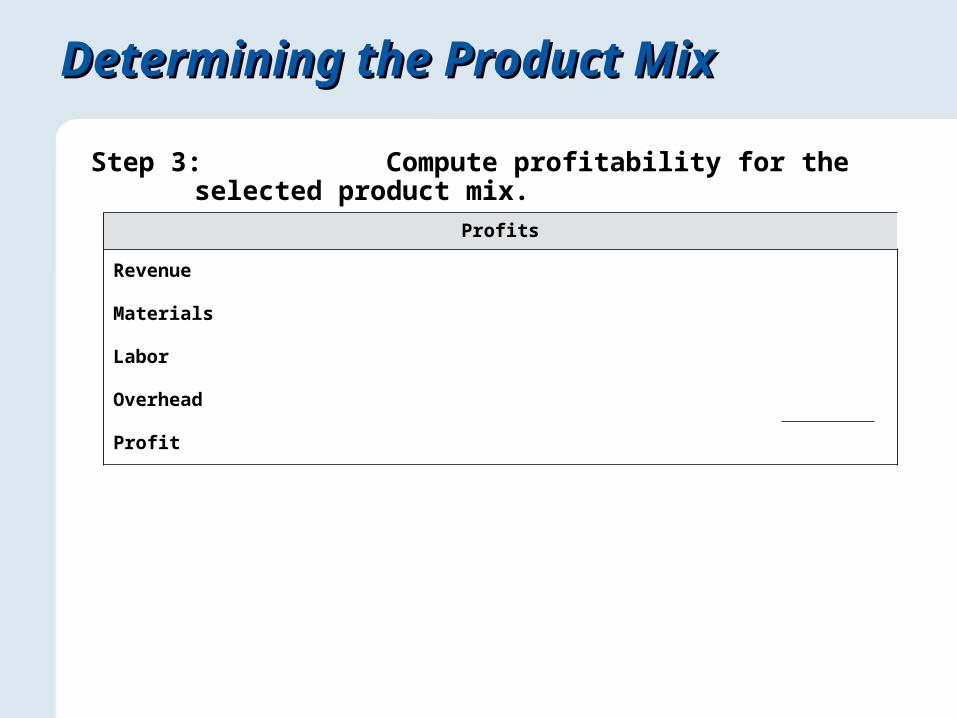
Step 3: Compute profitability for the selected product mix.
Profits
Revenue
Materials
Labor
Overhead
Profit
Determining the Product MixDetermining the Product Mix
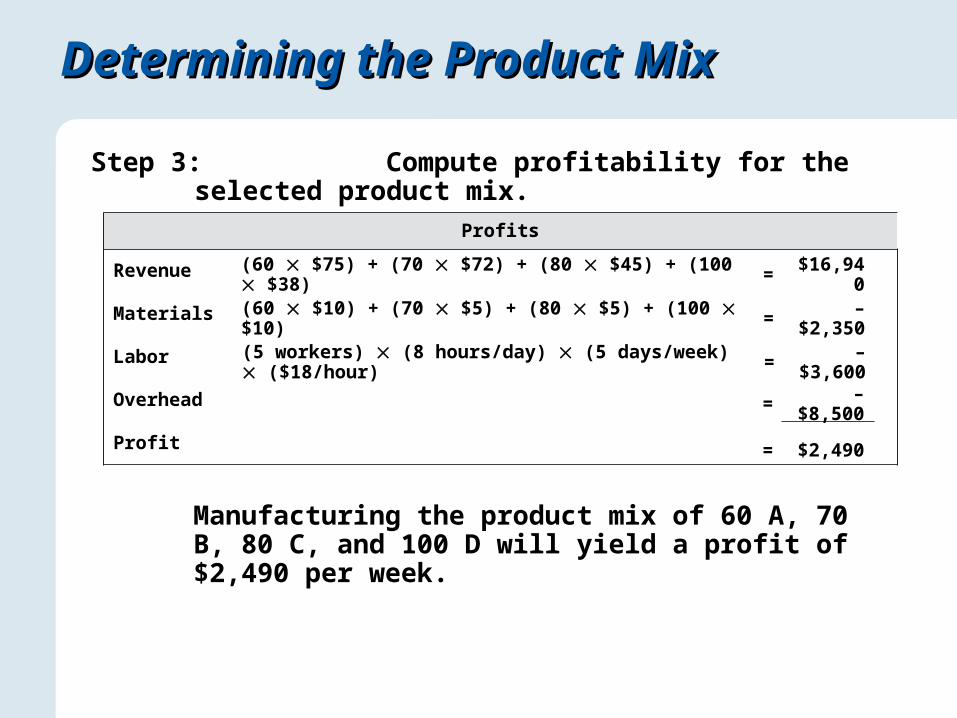
Step 3: Compute profitability for the selected product mix.
Manufacturing the product mix of 60 A, 70 B, 80 C, and 100 D will yield a profit of $2,490 per week.
(60 $75) + (70 $72) + (80 $45) + (100 $38) = $16,940
(60 $10) + (70 $5) + (80 $5) + (100 $10) = –$2,350
(5 workers) (8 hours/day) (5 days/week) ($18/hour) = –$3,600
Profits
Revenue
Materials
Labor
Overhead
Profit
= –$8,500
= $2,490
Application 3Application 3
The senior management at O’Neill Enterprises wants to improve the profitability of the firm by accepting the right set of orders. Currently, decisions are made to accept as much of the highest contribution margin product as possible (up to the limit of its demand), followed by the next highest contribution margin product, and so on until no more capacity is available. Since the firm cannot satisfy all the demand, the product mix must be chosen carefully. Jane Hathaway, the newly hired production supervisor, is knowledgeable about the theory of constraints and bottleneck based scheduling. She believes that profitability can indeed be approved if bottleneck resources were exploited to determine the product mix. What is the change in profits if instead of the traditional method that O’Neill has used thus far; a bottleneck based approach advocated by Jane is used instead for selecting the product mix?
Application 3Application 3
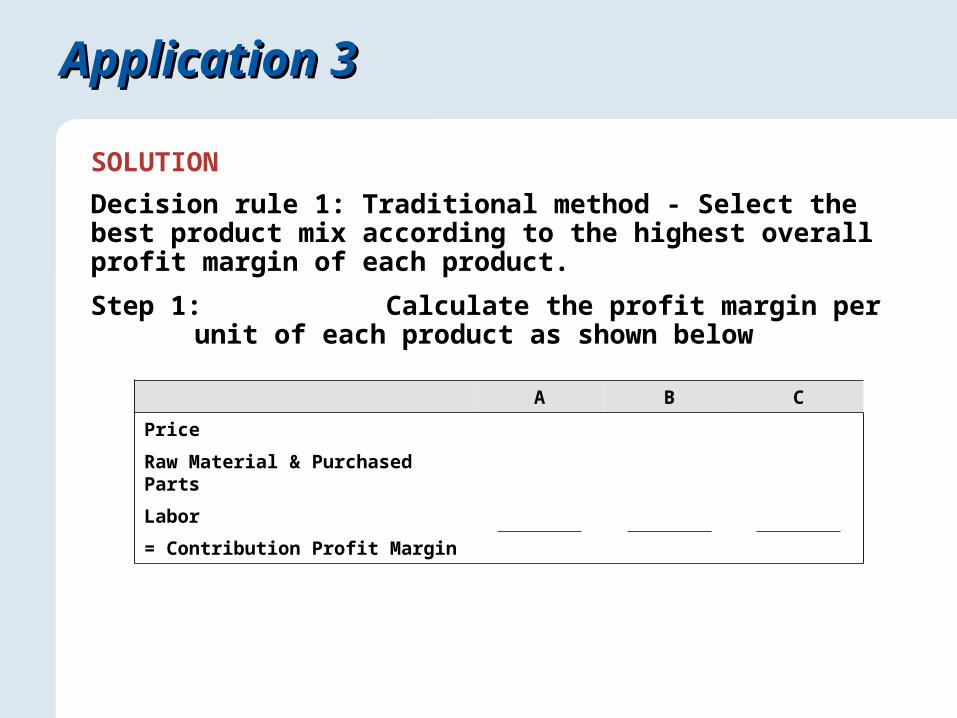
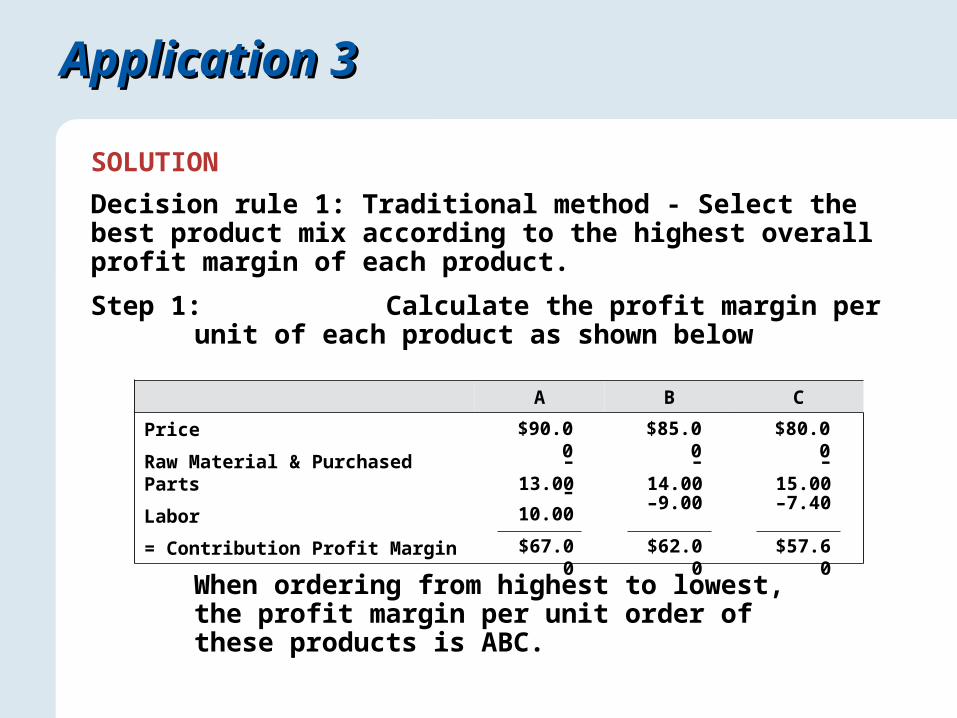
SOLUTION
Decision rule 1: Traditional method - Select the best product mix according to the highest overall profit margin of each product.
Step 1: Calculate the profit margin per unit of each product as shown below
A B C
Price
Raw Material & Purchased Parts
Labor
= Contribution Profit Margin
Application 3Application 3
SOLUTION
Decision rule 1: Traditional method - Select the best product mix according to the highest overall profit margin of each product.
Step 1: Calculate the profit margin per unit of each product as shown below
When ordering from highest to lowest, the profit margin per unit order of these products is ABC.
$90.00 $85.00 $80.00
–13.00 –14.00 –15.00
A B C
Price
Raw Material & Purchased Parts
Labor
= Contribution Profit Margin
–10.00 –9.00 –7.40
$67.00 $62.00 $57.60
Application 3Application 3
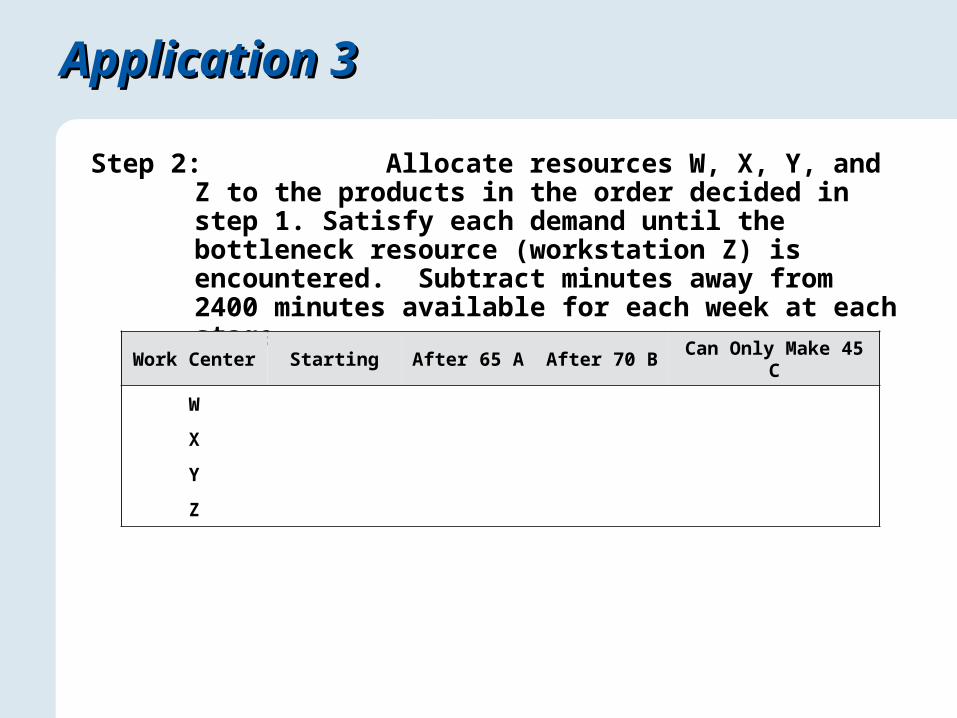
Step 2: Allocate resources W, X, Y, and Z to the products in the order decided in step 1. Satisfy each demand until the bottleneck resource (workstation Z) is encountered. Subtract minutes away from 2400 minutes available for each week at each stage.
Work Center Starting After 65 A After 70 B Can Only Make 45 C
W
X
Y
Z

Application 3Application 3
Step 2: Allocate resources W, X, Y, and Z to the products in the order decided in step 1. Satisfy each demand until the bottleneck resource (workstation Z) is encountered. Subtract minutes away from 2400 minutes available for each week at each stage.
The best product mix is 65 A, 70 B, and 45 C
2400 1750 1050 510
2400 1815 975 525
2400 1425 725 500
2400 1360 450 0
Work Center Starting After 65 A After 70 B Can Only Make 45 C
W
X
Y
Z
Application 3Application 3
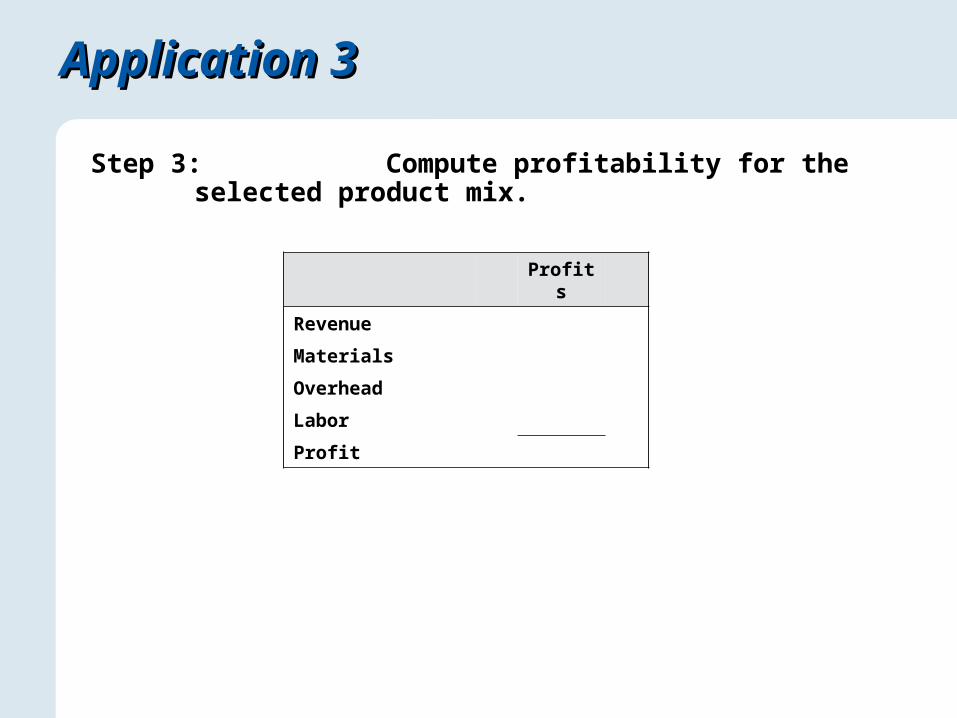
Step 3: Compute profitability for the selected product mix.
Profits
Revenue
Materials
Overhead
Labor
Profit
Profits
Revenue
Materials
Overhead
Labor
Profit
Application 3Application 3
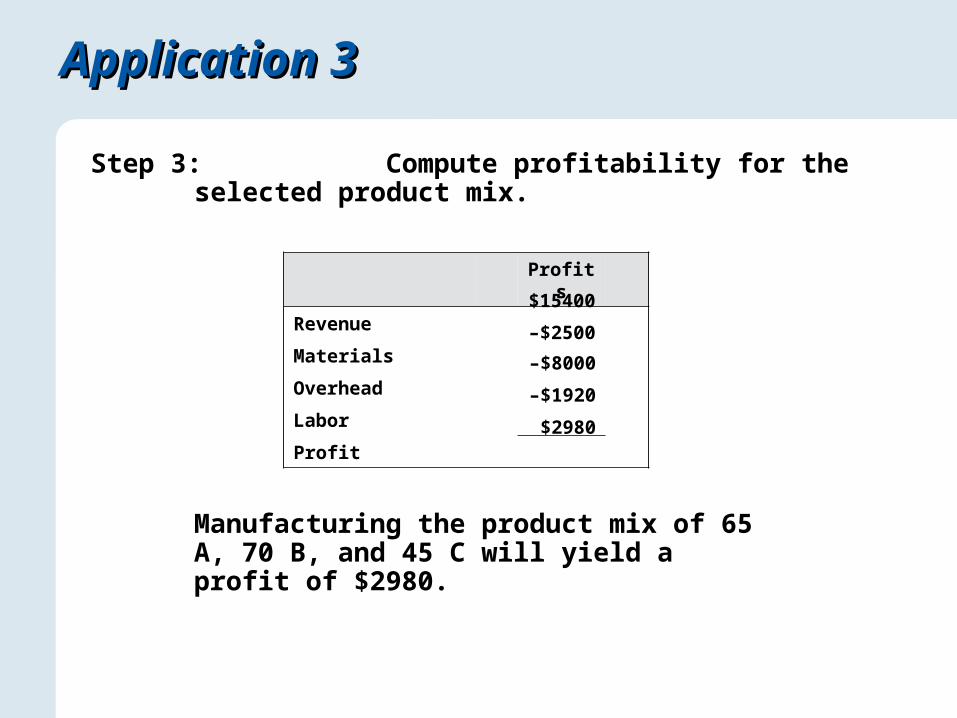
Step 3: Compute profitability for the selected product mix.
Manufacturing the product mix of 65 A, 70 B, and 45 C will yield a profit of $2980.
$15400
–$2500
–$8000
–$1920
$2980
Application 3Application 3
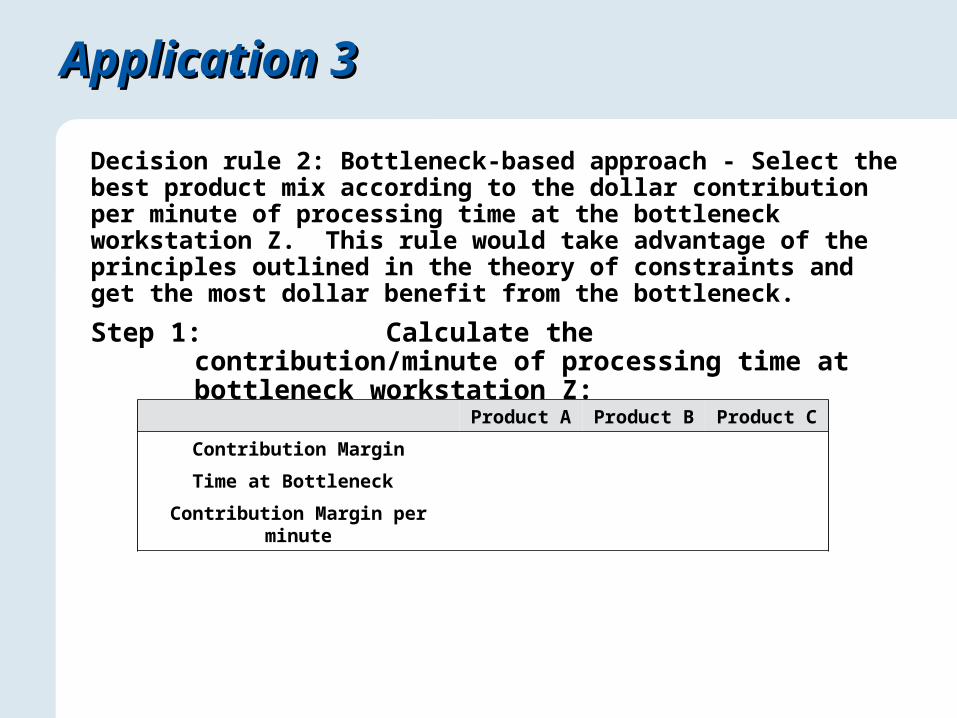
Decision rule 2: Bottleneck-based approach - Select the best product mix according to the dollar contribution per minute of processing time at the bottleneck workstation Z. This rule would take advantage of the principles outlined in the theory of constraints and get the most dollar benefit from the bottleneck.
Step 1: Calculate the contribution/minute of processing time at bottleneck workstation Z:
Product A Product B Product C
Contribution Margin
Time at Bottleneck
Contribution Margin per minute
Application 3Application 3
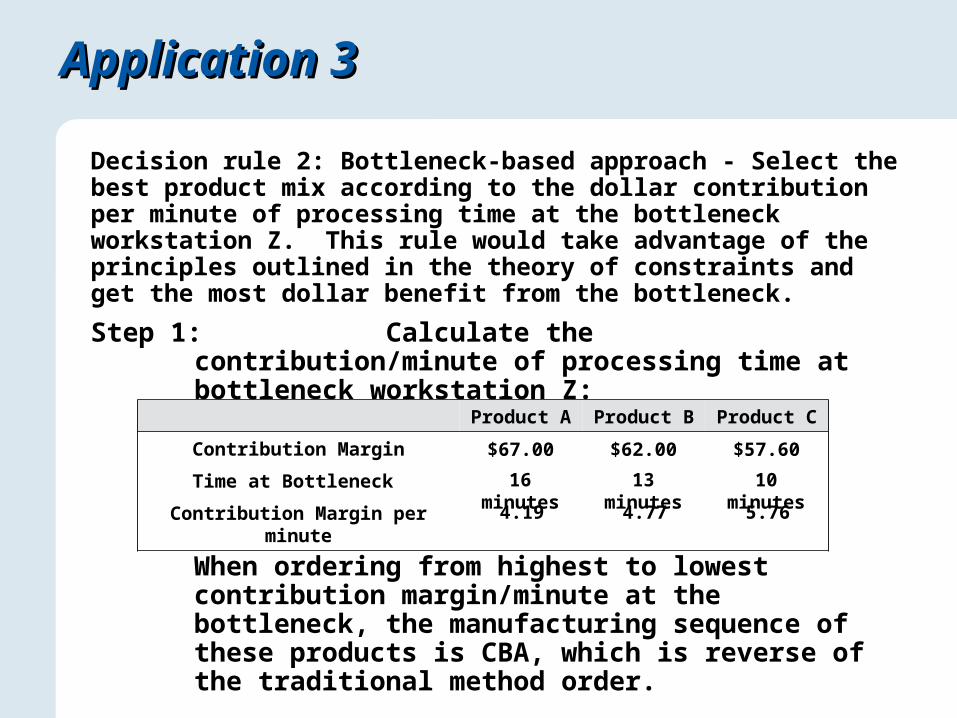
Decision rule 2: Bottleneck-based approach - Select the best product mix according to the dollar contribution per minute of processing time at the bottleneck workstation Z. This rule would take advantage of the principles outlined in the theory of constraints and get the most dollar benefit from the bottleneck.
Step 1: Calculate the contribution/minute of processing time at bottleneck workstation Z:
When ordering from highest to lowest contribution margin/minute at the bottleneck, the manufacturing sequence of these products is CBA, which is reverse of the traditional method order.
$67.00 $62.00 $57.60
16 minutes 13 minutes 10 minutes
4.19 4.77 5.76
Product A Product B Product C
Contribution Margin
Time at Bottleneck
Contribution Margin per minute

Application 3Application 3
Step 2: Allocate resources W, X, Y, and Z to the products in the order decided in step 1. Satisfy each demand until the bottleneck resource (workstation Z) is encountered. Subtract minutes away from 2400 minutes available for each week at each stage.
Work Center Starting After 80 C After 70 B Can Only Make 43 A
W
X
Y
Z
Application 3Application 3
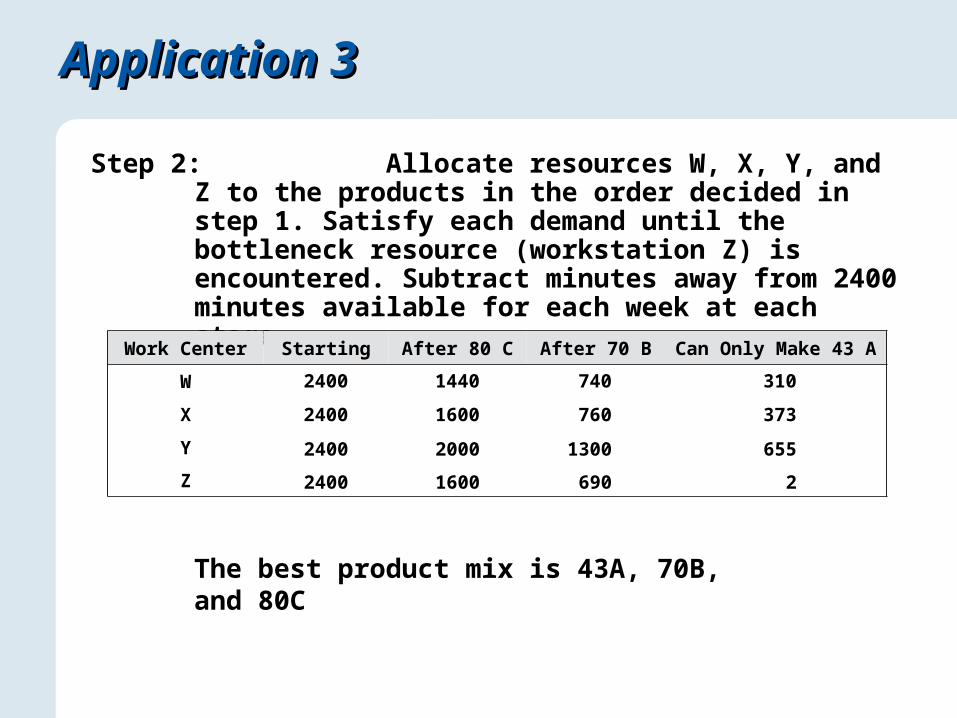
Step 2: Allocate resources W, X, Y, and Z to the products in the order decided in step 1. Satisfy each demand until the bottleneck resource (workstation Z) is encountered. Subtract minutes away from 2400 minutes available for each week at each stage.
The best product mix is 43A, 70B, and 80C
2400 1440 740 310
2400 1600 760 373
2400 2000 1300 655
2400 1600 690 2
Work Center Starting After 80 C After 70 B Can Only Make 43 A
W
X
Y
Z
Application 3Application 3
Step 3: Compute profitability for the selected product mix. The new profitability figures are shown below based on the new production quantities of 43A, 70B, and 80C.
Profits
Revenue
Materials
Overhead
Labor
Profit
Profits
Revenue
Materials
Overhead
Labor
Profit
Application 3Application 3
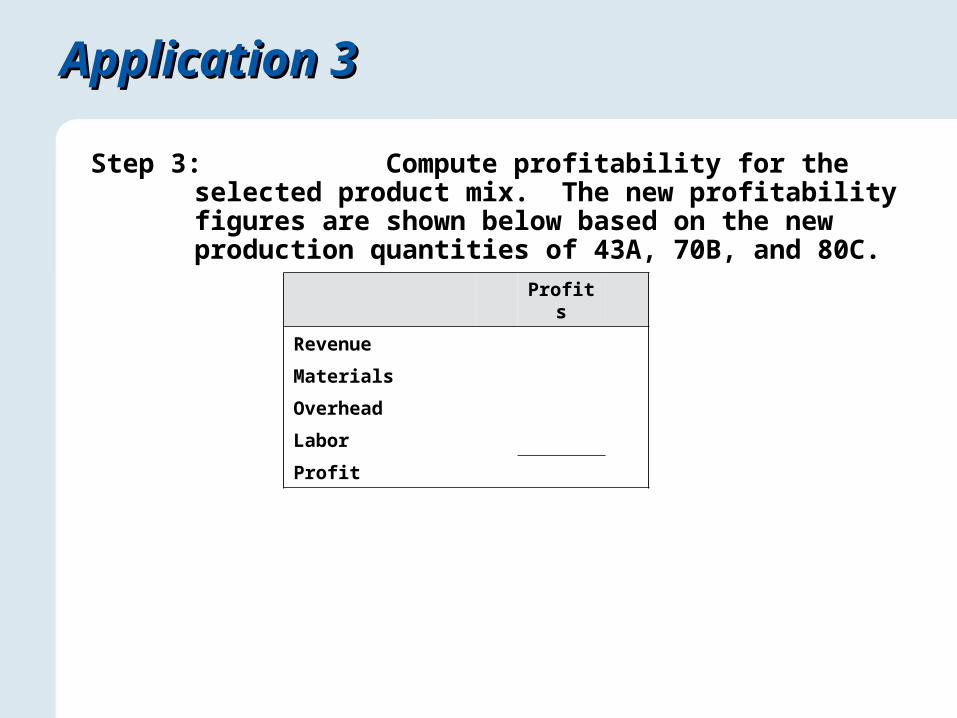
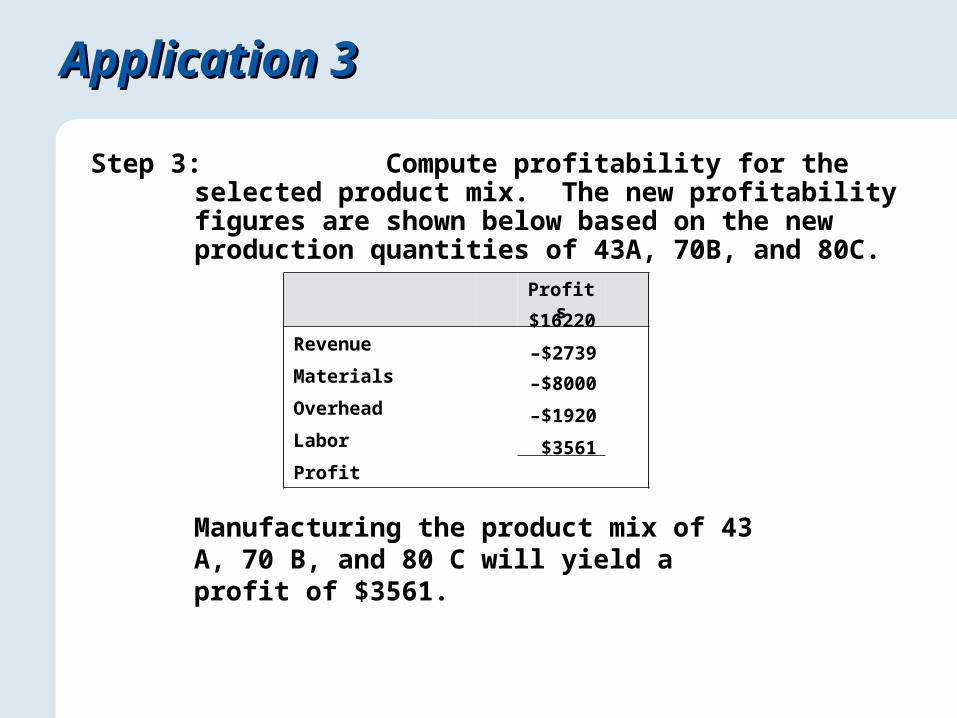
Step 3: Compute profitability for the selected product mix. The new profitability figures are shown below based on the new production quantities of 43A, 70B, and 80C.
Manufacturing the product mix of 43 A, 70 B, and 80 C will yield a profit of $3561.
$16220
–$2739
–$8000
–$1920
$3561
Drum-Buffer-Rope SystemsDrum-Buffer-Rope Systems
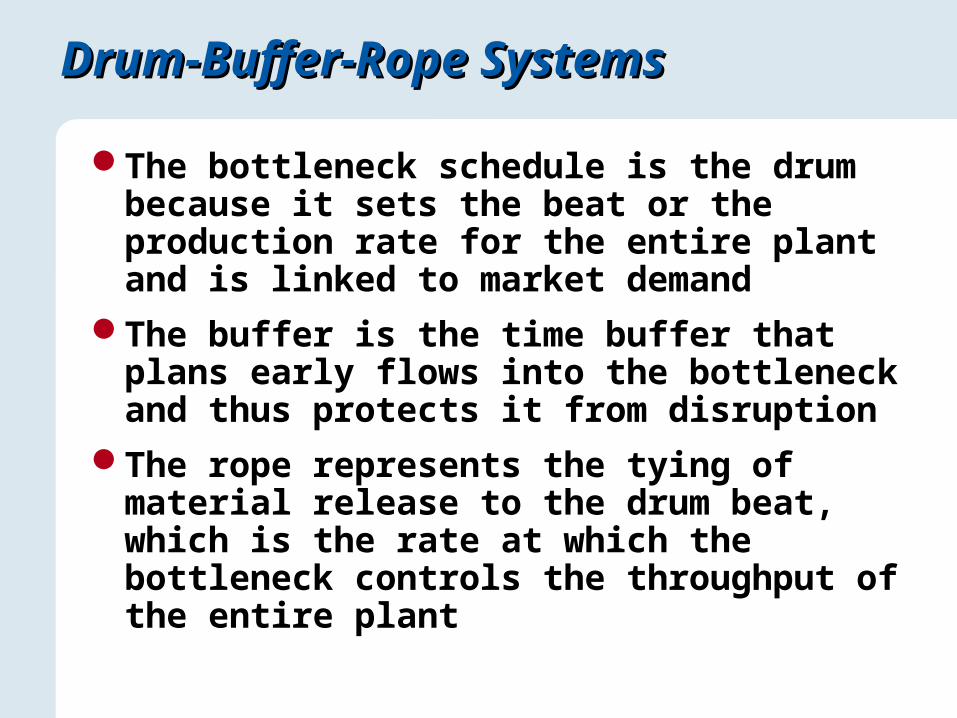
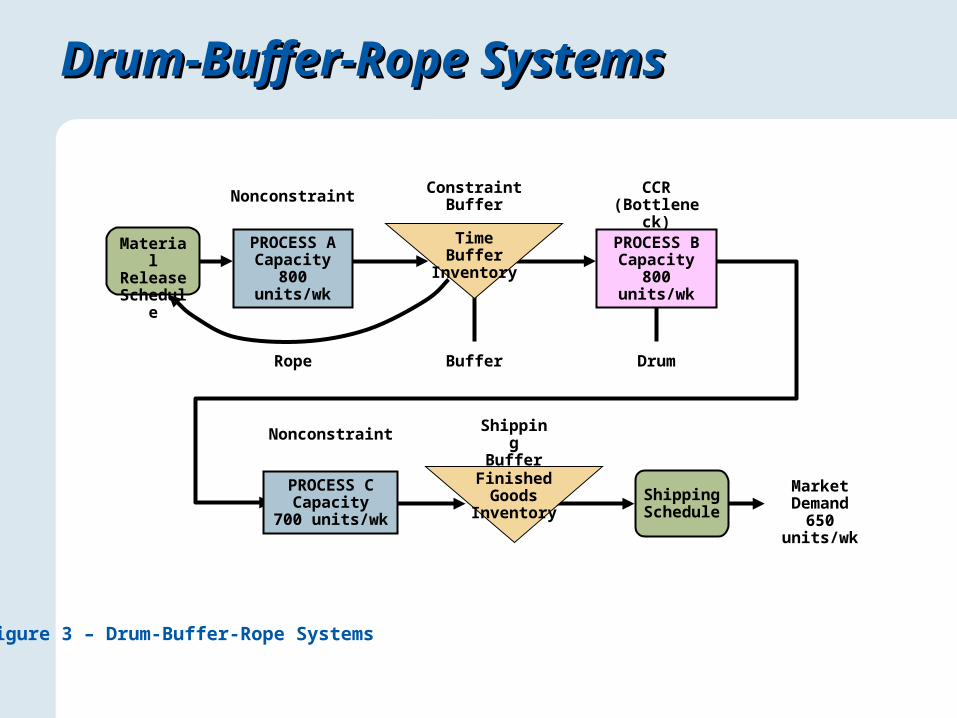
The bottleneck schedule is the drum because it sets the beat or the production rate for the entire plant and is linked to market demand
The buffer is the time buffer that plans early flows into the bottleneck and thus protects it from disruption
The rope represents the tying of material release to the drum beat, which is the rate at which the bottleneck controls the throughput of the entire plant
Drum-Buffer-Rope SystemsDrum-Buffer-Rope Systems
Buffer Drum
MarketDemand
650 units/wk
Shipping Schedule
Rope
Shipping Buffer
Finished Goods Inventory
Nonconstraint
PROCESS CCapacity
700 units/wk
PROCESS BCapacity
800 units/wk
CCR (Bottleneck)
Constraint Buffer
Time Buffer Inventory
Nonconstraint
PROCESS ACapacity
800 units/wk
Material Release
Schedule
Figure 3 – Drum-Buffer-Rope Systems
A Line ProcessA Line Process
Line Balancing Assignment of work to stations in a line so as
to achieve the desired output rate with the smallest number of workstations
Achieving the goal is similar to the theory of constraints but it differs in how it addresses bottlenecks
Precedence diagram – AON network
Precedence DiagramPrecedence Diagram
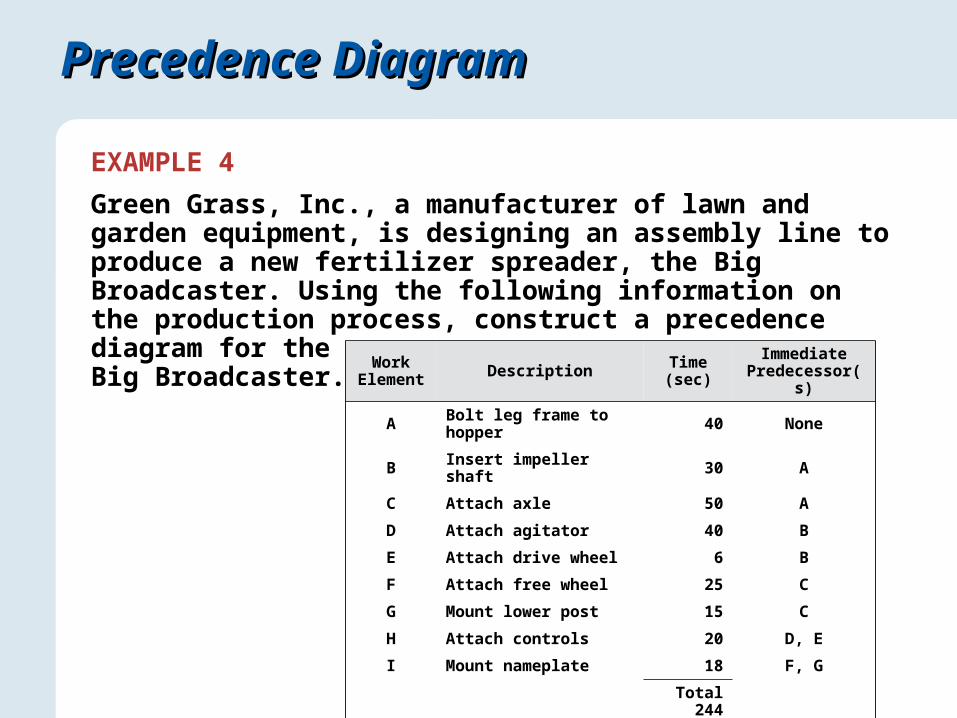
EXAMPLE 4
Green Grass, Inc., a manufacturer of lawn and garden equipment, is designing an assembly line to produce a new fertilizer spreader, the Big Broadcaster. Using the following information on the production process, construct a precedence
diagram for the Big Broadcaster.
Work Element Description Time
(sec)Immediate
Predecessor(s)
A Bolt leg frame to hopper 40 None
B Insert impeller shaft 30 A
C Attach axle 50 A
D Attach agitator 40 B
E Attach drive wheel 6 B
F Attach free wheel 25 C
G Mount lower post 15 C
H Attach controls 20 D, E
I Mount nameplate 18 F, G
Total 244
Precedence DiagramPrecedence Diagram
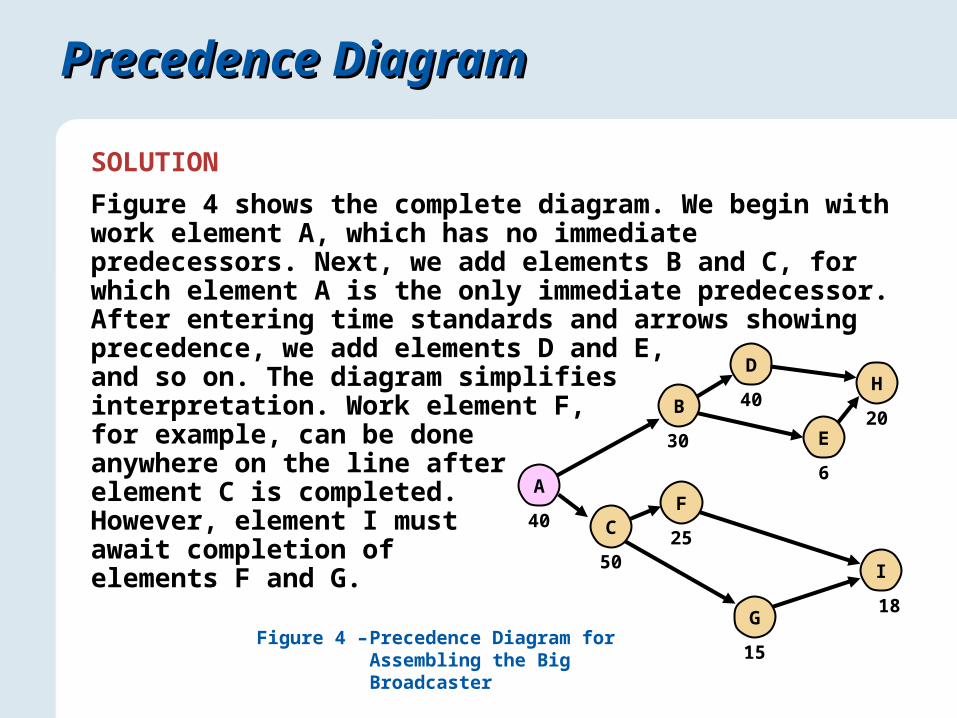
SOLUTION
Figure 4 shows the complete diagram. We begin with work element A, which has no immediate predecessors. Next, we add elements B and C, for which element A is the only immediate predecessor. After entering time standards and arrows showing precedence, we add elements D and E, and so on. The diagram simplifies interpretation. Work element F, for example, can be done anywhere on the line after element C is completed. However, element I must await completion of elements F and G.
D
40
I
18
H
20
F
25
G
15
C
50
E
6
B
30
A
40
Figure 4 – Precedence Diagram for Assembling the Big Broadcaster
A Line ProcessA Line Process
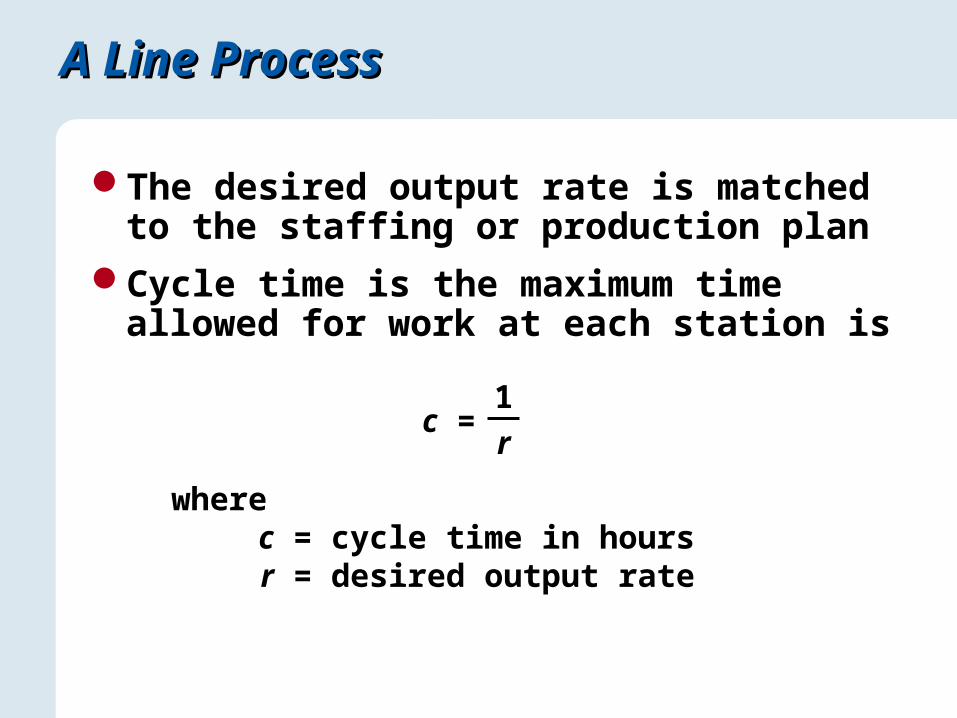
The desired output rate is matched to the staffing or production plan
Cycle time is the maximum time allowed for work at each station is
c =1
r
wherec = cycle time in hoursr = desired output rate
A Line ProcessA Line Process
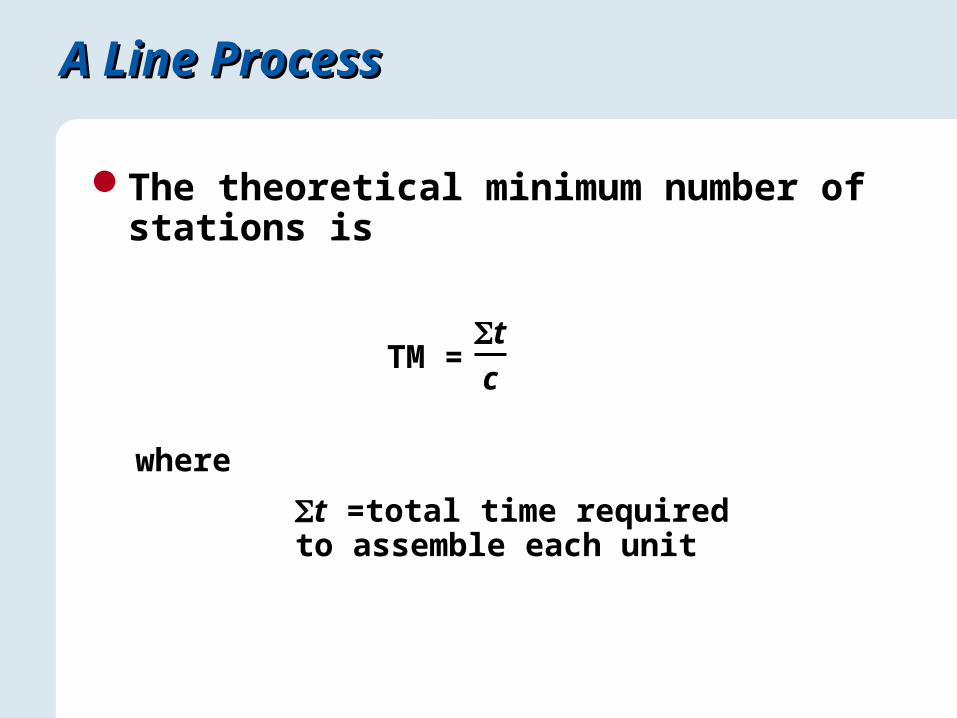
The theoretical minimum number of stations is
TM =tc
where
t =total time required to assemble each unit
A Line ProcessA Line Process
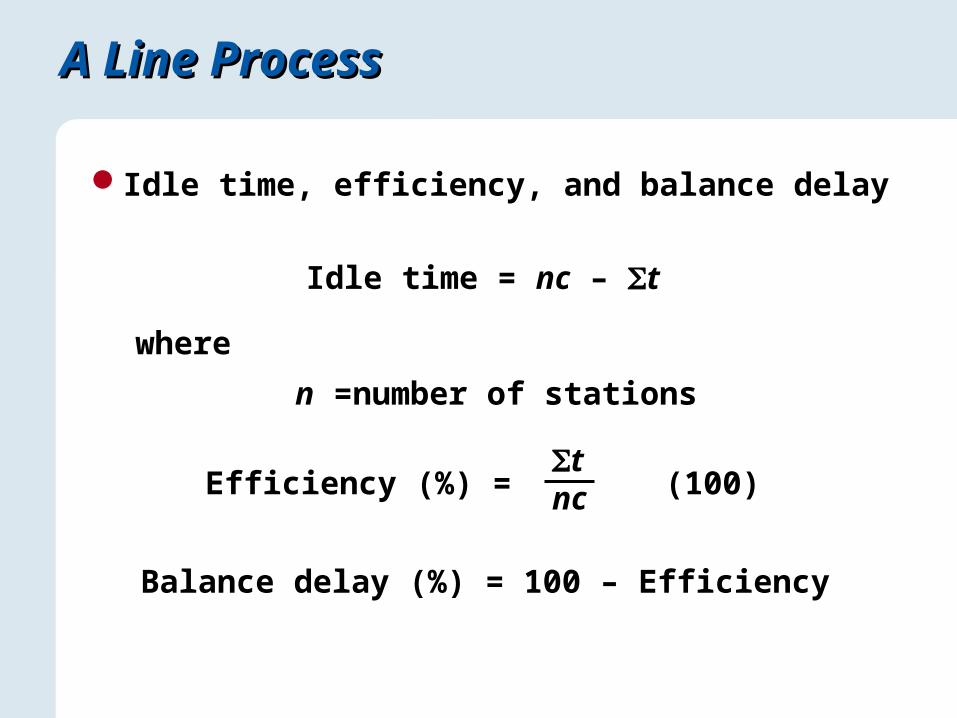
Idle time, efficiency, and balance delay
Idle time = nc – t
where
n =number of stations
Efficiency (%) = (100)tnc
Balance delay (%) = 100 – Efficiency
Calculating Cycle Time, TM, EfficiencyCalculating Cycle Time, TM, Efficiency
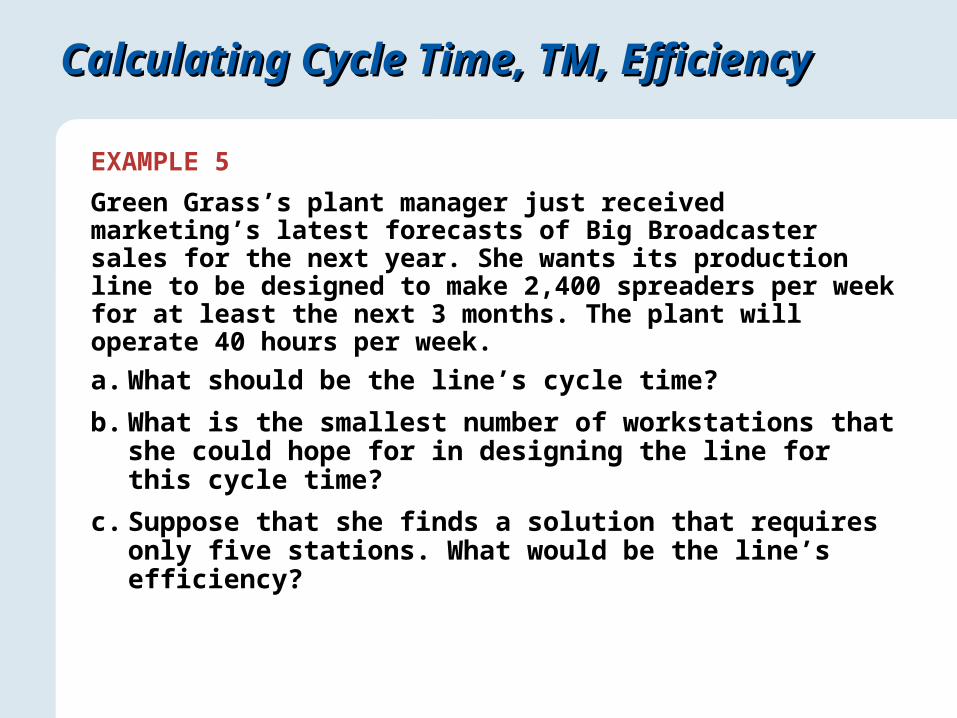
EXAMPLE 5
Green Grass’s plant manager just received marketing’s latest forecasts of Big Broadcaster sales for the next year. She wants its production line to be designed to make 2,400 spreaders per week for at least the next 3 months. The plant will operate 40 hours per week.
a. What should be the line’s cycle time?
b. What is the smallest number of workstations that she could hope for in designing the line for this cycle time?
c. Suppose that she finds a solution that requires only five stations. What would be the line’s efficiency?
Calculating Cycle Time, TM, EfficiencyCalculating Cycle Time, TM, Efficiency
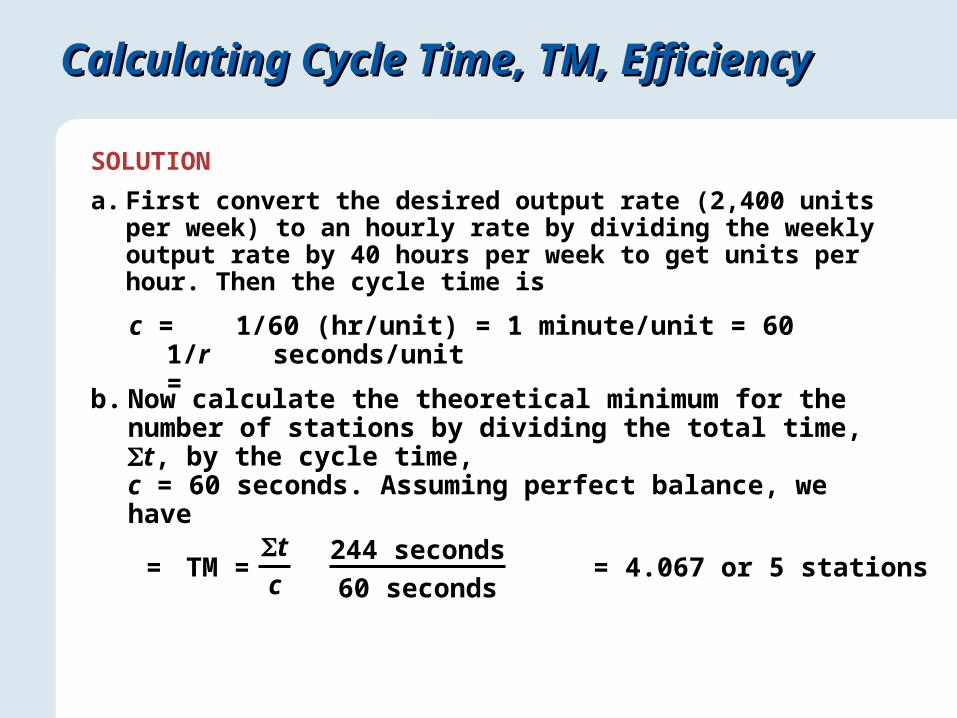
SOLUTION
a. First convert the desired output rate (2,400 units per week) to an hourly rate by dividing the weekly output rate by 40 hours per week to get units per hour. Then the cycle time is
c = 1/r =
b. Now calculate the theoretical minimum for the number of stations by dividing the total time, t, by the cycle time, c = 60 seconds. Assuming perfect balance, we have
TM =tc
244 seconds
60 seconds= = 4.067 or 5 stations
1/60 (hr/unit) = 1 minute/unit = 60 seconds/unit

Calculating Cycle Time, TM, EfficiencyCalculating Cycle Time, TM, Efficiency
c. Now calculate the efficiency of a five-station solution, assuming for now that one can be found:
Efficiency = (100) =tnc
244
5(60)= 81.3%
Finding a SolutionFinding a Solution
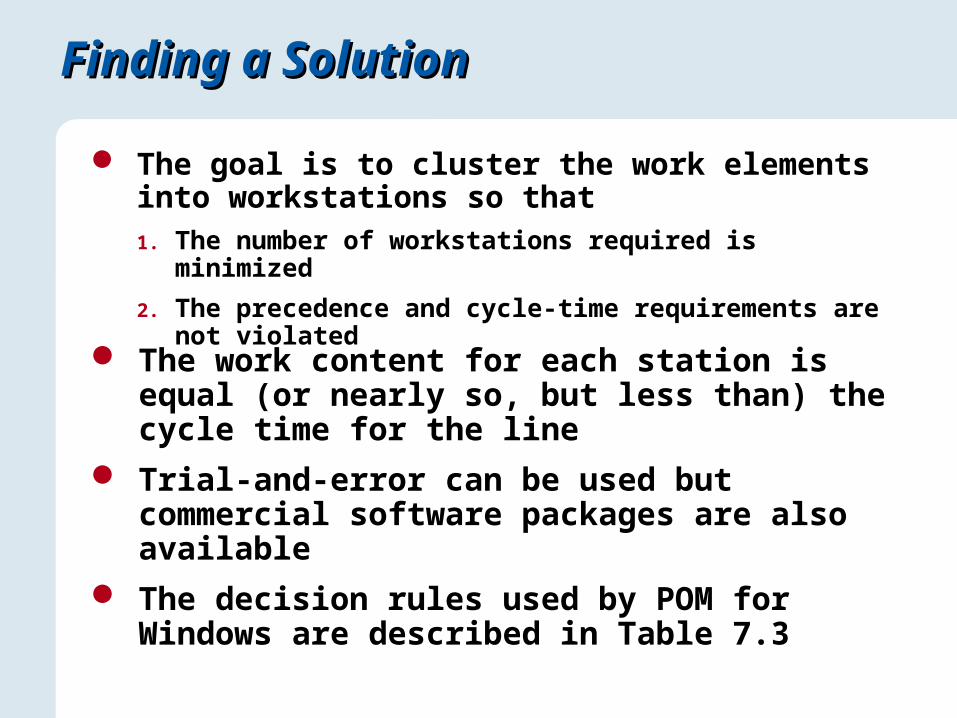
The goal is to cluster the work elements into workstations so that 1. The number of workstations required is minimized
2. The precedence and cycle-time requirements are not violated
The work content for each station is equal (or nearly so, but less than) the cycle time for the line
Trial-and-error can be used but commercial software packages are also available
The decision rules used by POM for Windows are described in Table 7.3
Finding a SolutionFinding a Solution
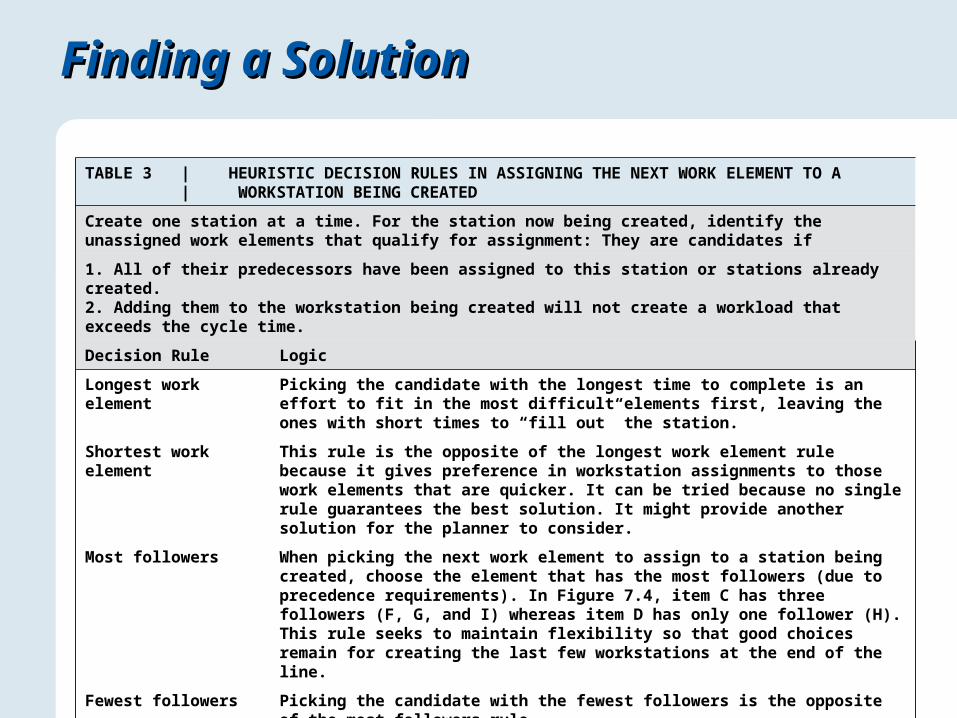
TABLE 3 | HEURISTIC DECISION RULES IN ASSIGNING THE NEXT WORK ELEMENT TO A| WORKSTATION BEING CREATED
Create one station at a time. For the station now being created, identify the unassigned work elements that qualify for assignment: They are candidates if
1. All of their predecessors have been assigned to this station or stations already created.2. Adding them to the workstation being created will not create a workload that exceeds the cycle time.
Decision Rule Logic
Longest work element Picking the candidate with the longest time to complete is an effort to fit in the most difficult elements first, leaving the ones with short times to “fill out” the station.
Shortest work element This rule is the opposite of the longest work element rule because it gives preference in workstation assignments to those work elements that are quicker. It can be tried because no single rule guarantees the best solution. It might provide another solution for the planner to consider.
Most followers When picking the next work element to assign to a station being created, choose the element that has the most followers (due to precedence requirements). In Figure 7.4, item C has three followers (F, G, and I) whereas item D has only one follower (H). This rule seeks to maintain flexibility so that good choices remain for creating the last few workstations at the end of the line.
Fewest followers Picking the candidate with the fewest followers is the opposite of the most followers rule.
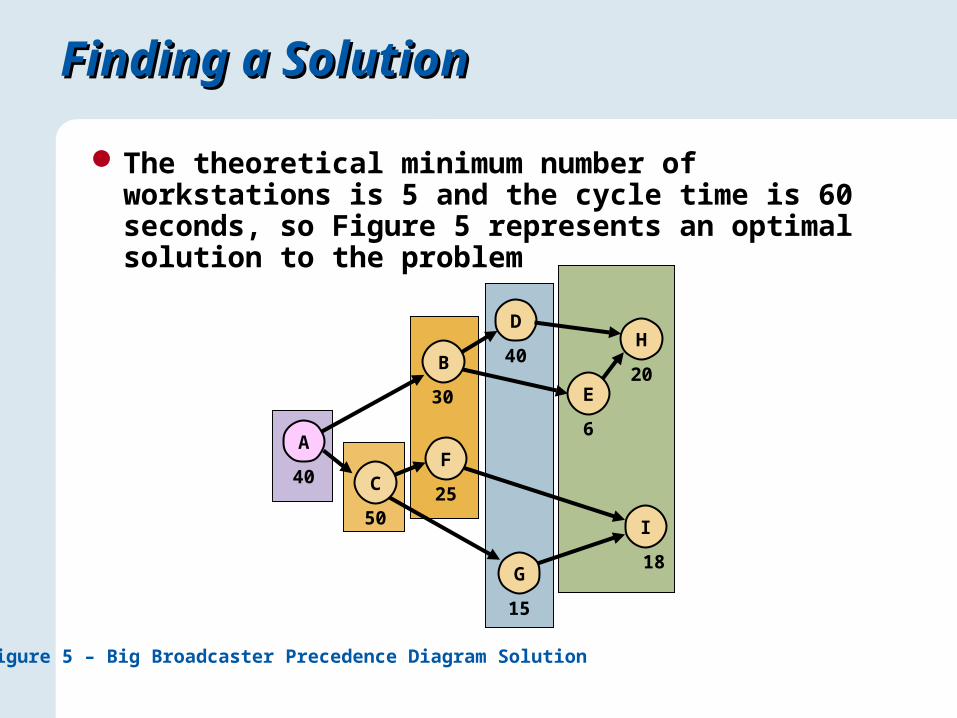
Finding a SolutionFinding a Solution
The theoretical minimum number of workstations is 5 and the cycle time is 60 seconds, so Figure 5 represents an optimal solution to the problem
Figure 5 – Big Broadcaster Precedence Diagram Solution
D
40
I
18
H
20
F
25C
50
E
6
B
30
A
40
G
15
Application 3Application 3
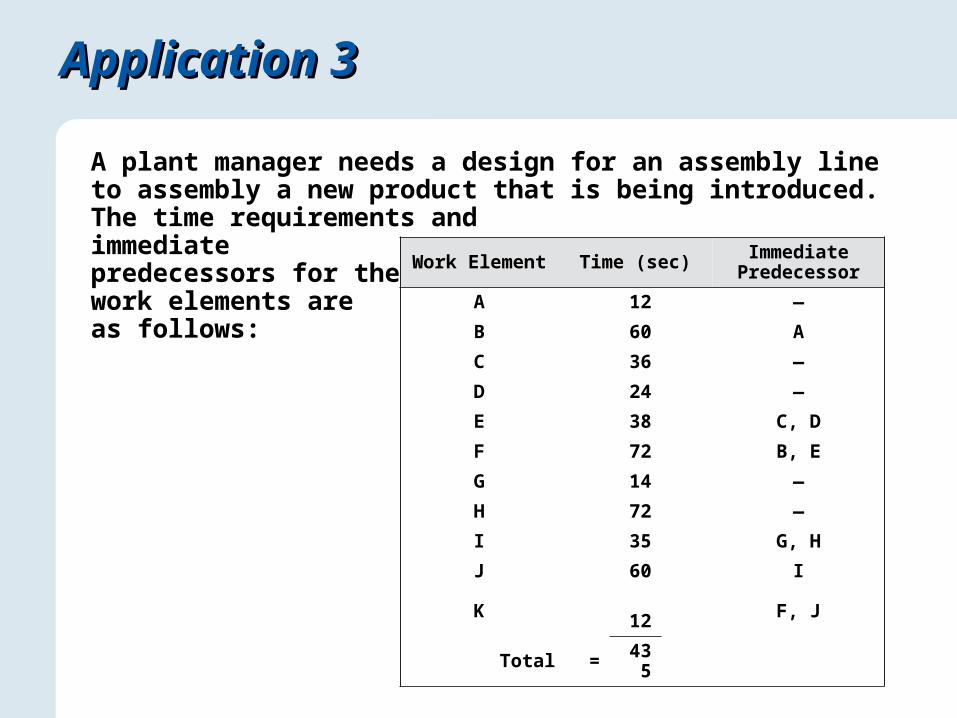
A plant manager needs a design for an assembly line to assembly a new product that is being introduced. The time requirements and immediate predecessors for the work elements are as follows:
Work Element Time (sec) Immediate Predecessor
A 12 ―
B 60 A
C 36 ―
D 24 ―
E 38 C, D
F 72 B, E
G 14 ―
H 72 ―
I 35 G, H
J 60 I
K 12 F, J
Total = 435
K
Application 3Application 3
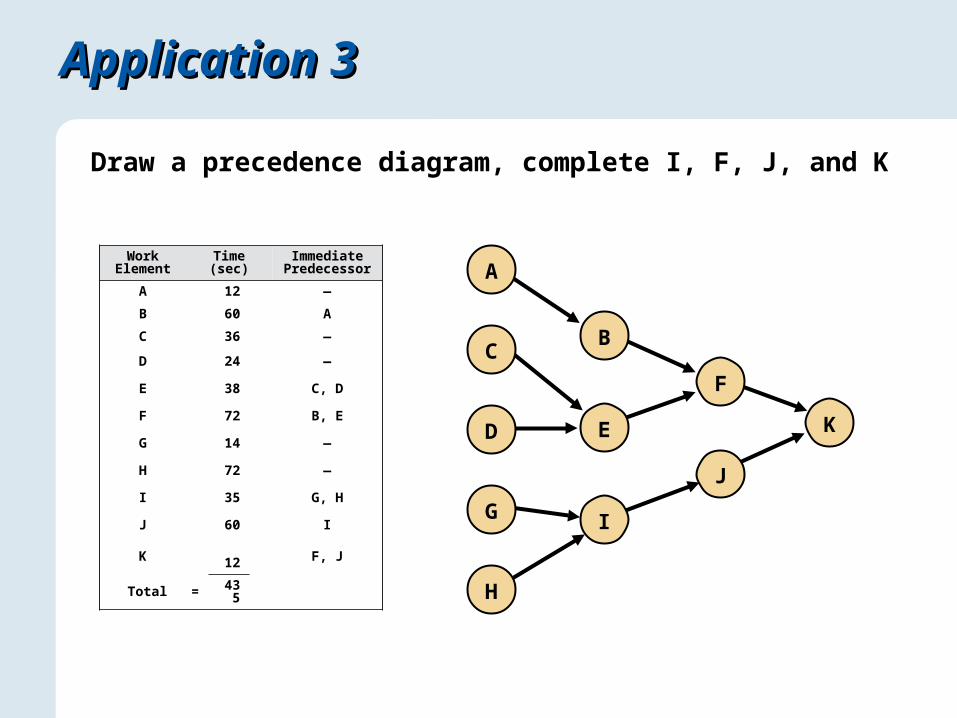
Draw a precedence diagram, complete I, F, J, and K
Work Element Time (sec) Immediate
Predecessor
A 12 ―
B 60 A
C 36 ―
D 24 ―
E 38 C, D
F 72 B, E
G 14 ―
H 72 ―
I 35 G, H
J 60 I
K 12 F, J
Total = 435
F
J
B
E
I
A
C
G
H
D
Application 3Application 3
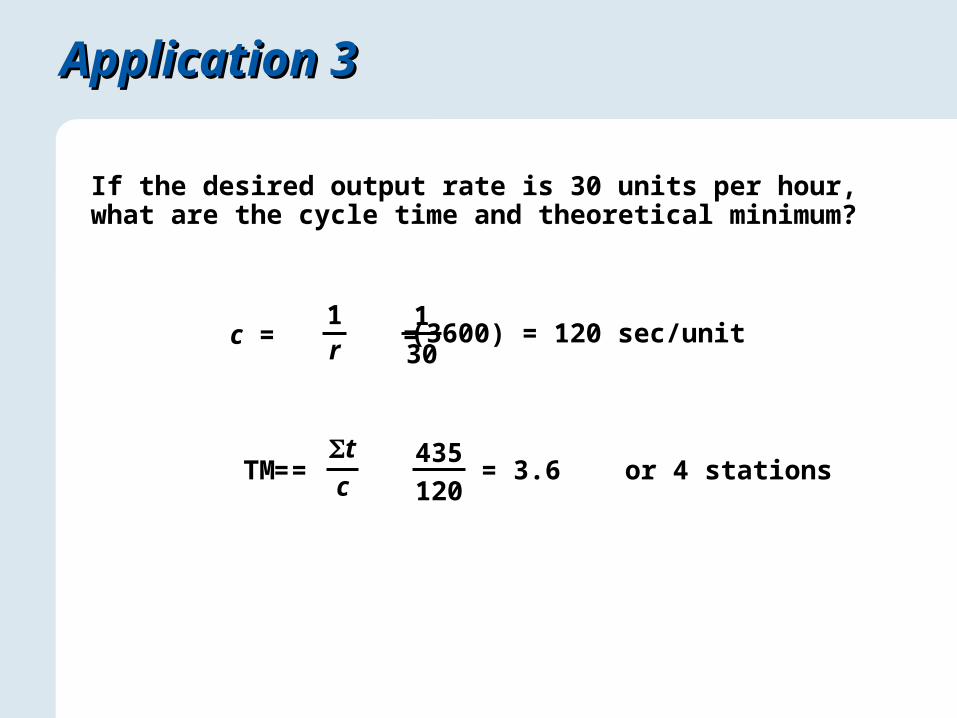
If the desired output rate is 30 units per hour, what are the cycle time and theoretical minimum?
c = =1r
1
30(3600) = 120 sec/unit
TM =tc
= = 3.6 or 4 stations435
120
Application 3Application 3
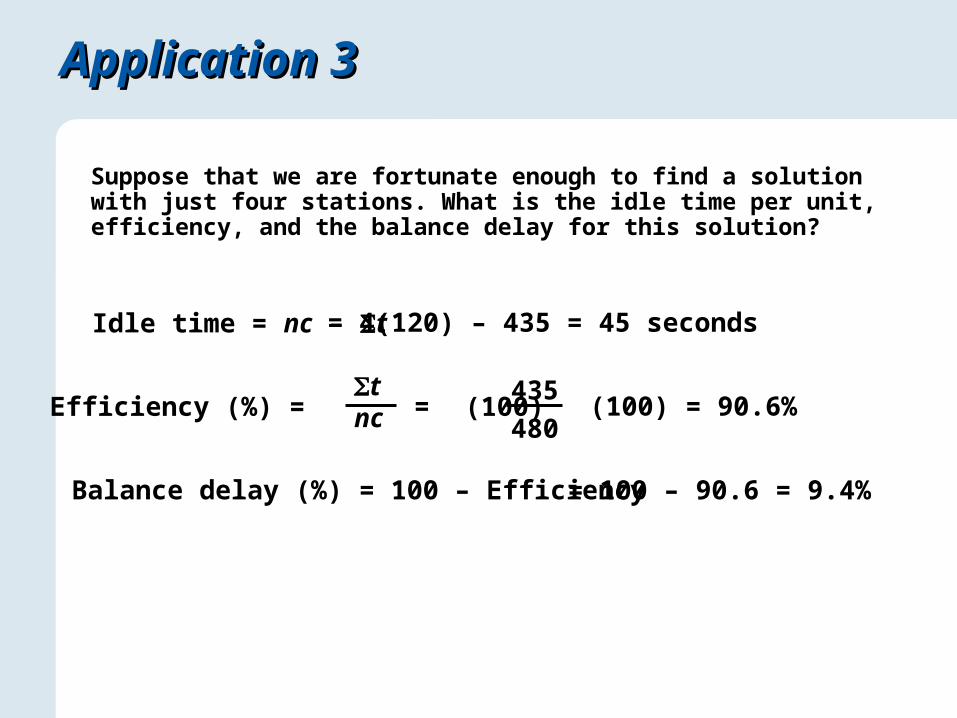
Suppose that we are fortunate enough to find a solution with just four stations. What is the idle time per unit, efficiency, and the balance delay for this solution?
Idle time = nc – t
Efficiency (%) = (100)tnc
Balance delay (%) = 100 – Efficiency
= 4(120) – 435 = 45 seconds
= 100 – 90.6 = 9.4%
= (100) = 90.6%435
480
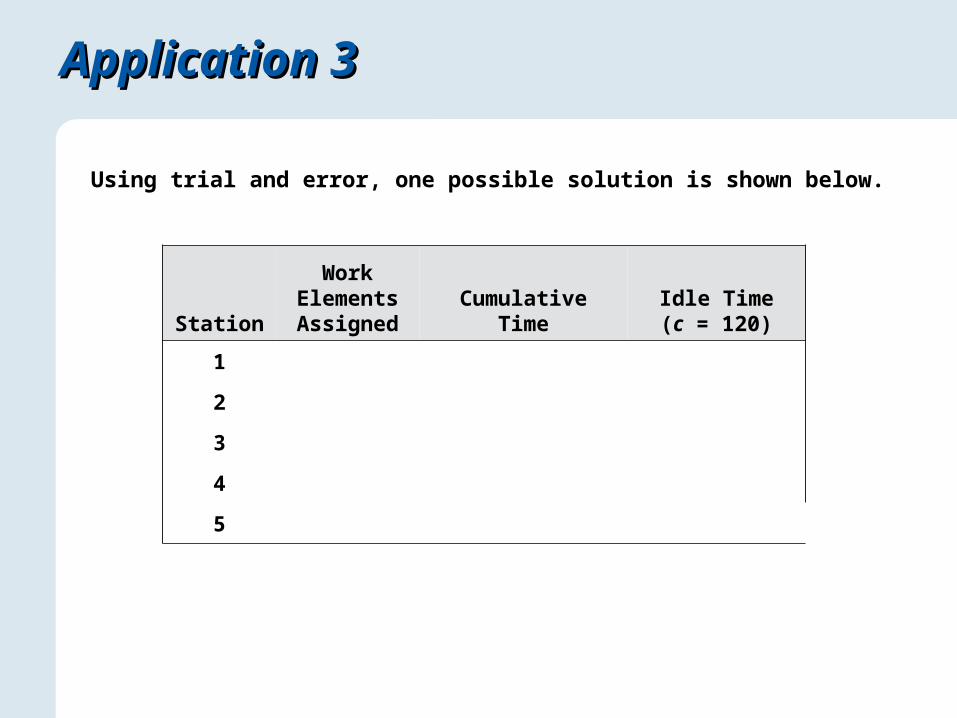
Station
Work Elements Assigned Cumulative Time
Idle Time(c = 120)
1
2
3
4
5
Application 3Application 3
Using trial and error, one possible solution is shown below.
Application 3Application 3
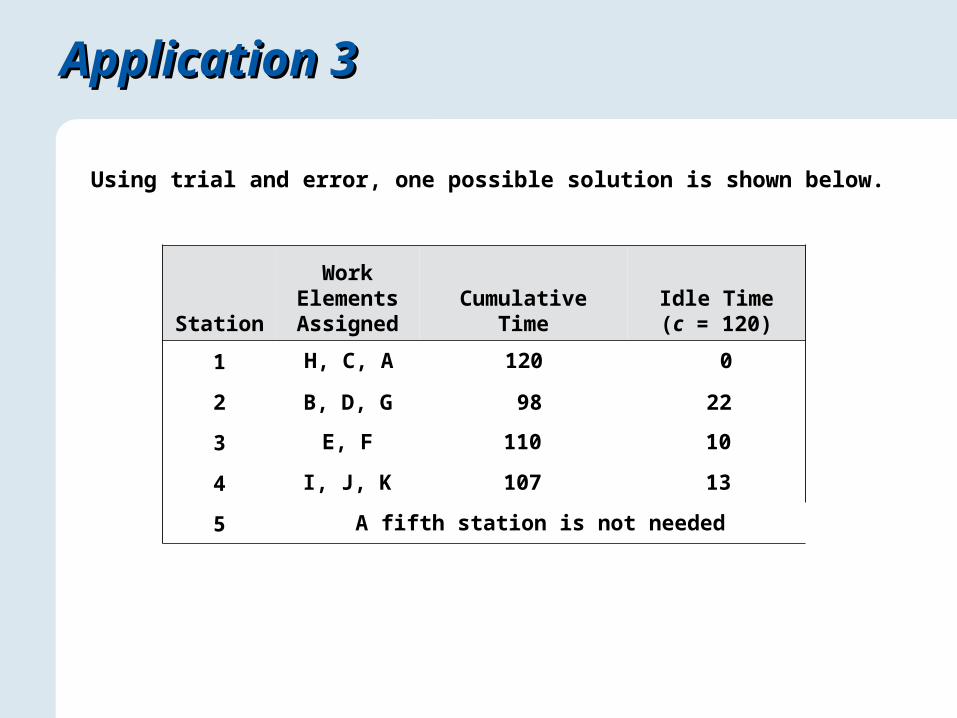
Using trial and error, one possible solution is shown below.
H, C, A 120 0
B, D, G 98 22
E, F 110 10
I, J, K 107 13
A fifth station is not needed
Station
Work Elements Assigned Cumulative Time
Idle Time(c = 120)
1
2
3
4
5
Managerial ConsiderationsManagerial Considerations
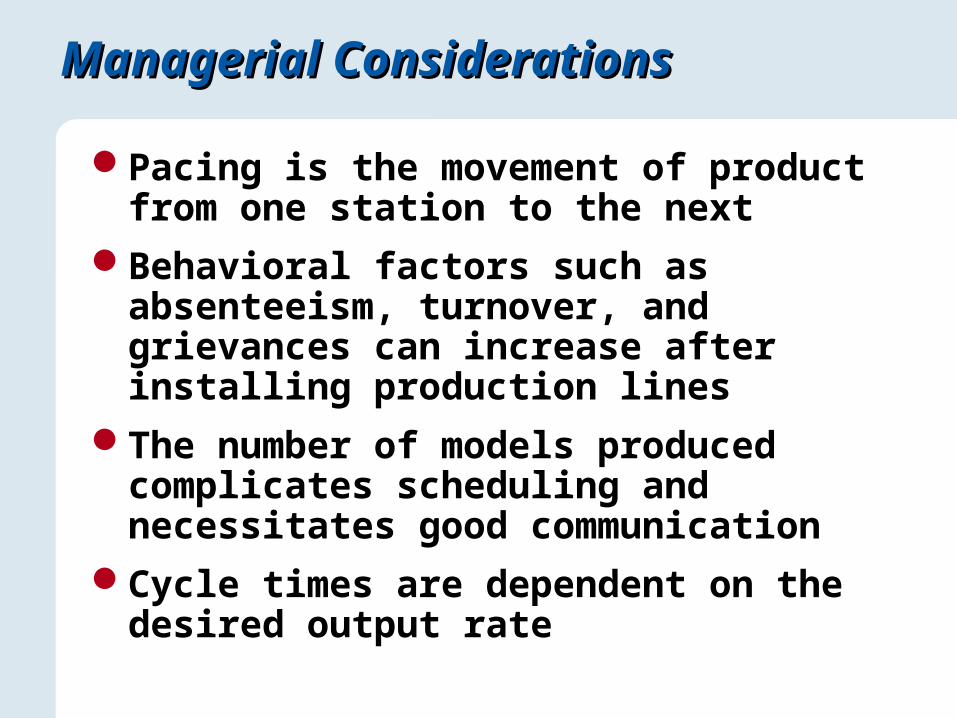
Pacing is the movement of product from one station to the next
Behavioral factors such as absenteeism, turnover, and grievances can increase after installing production lines
The number of models produced complicates scheduling and necessitates good communication
Cycle times are dependent on the desired output rate
Solved Problem 1Solved Problem 1
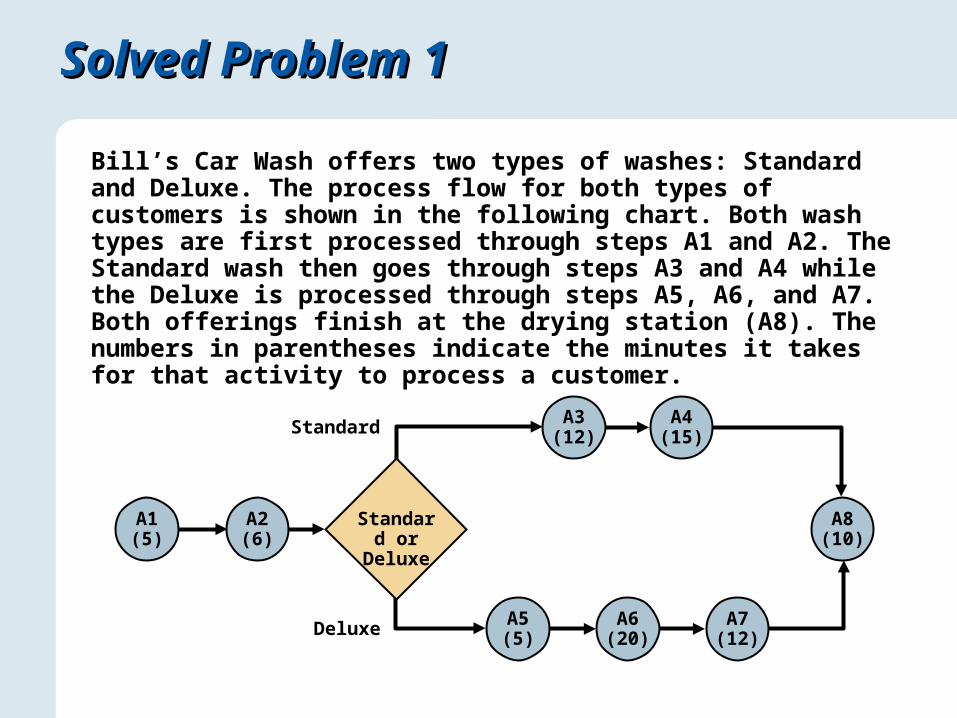
Bill’s Car Wash offers two types of washes: Standard and Deluxe. The process flow for both types of customers is shown in the following chart. Both wash types are first processed through steps A1 and A2. The Standard wash then goes through steps A3 and A4 while the Deluxe is processed through steps A5, A6, and A7. Both offerings finish at the drying station (A8). The numbers in parentheses indicate the minutes it takes for that activity to process a customer.
A8(10)
A7(12)
A6(20)
A5(5)Deluxe
A4(15)
A3(12)Standard
Standard or Deluxe
A2(6)
A1(5)
Solved Problem 1Solved Problem 1
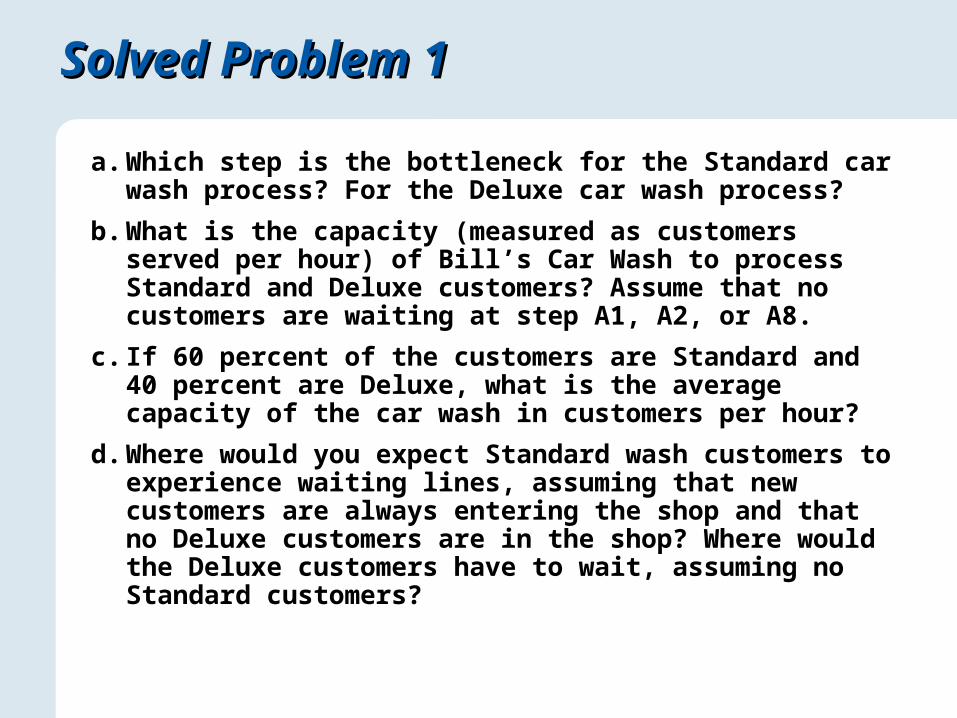
a. Which step is the bottleneck for the Standard car wash process? For the Deluxe car wash process?
b. What is the capacity (measured as customers served per hour) of Bill’s Car Wash to process Standard and Deluxe customers? Assume that no customers are waiting at step A1, A2, or A8.
c. If 60 percent of the customers are Standard and 40 percent are Deluxe, what is the average capacity of the car wash in customers per hour?
d. Where would you expect Standard wash customers to experience waiting lines, assuming that new customers are always entering the shop and that no Deluxe customers are in the shop? Where would the Deluxe customers have to wait, assuming no Standard customers?
Solved Problem 1Solved Problem 1
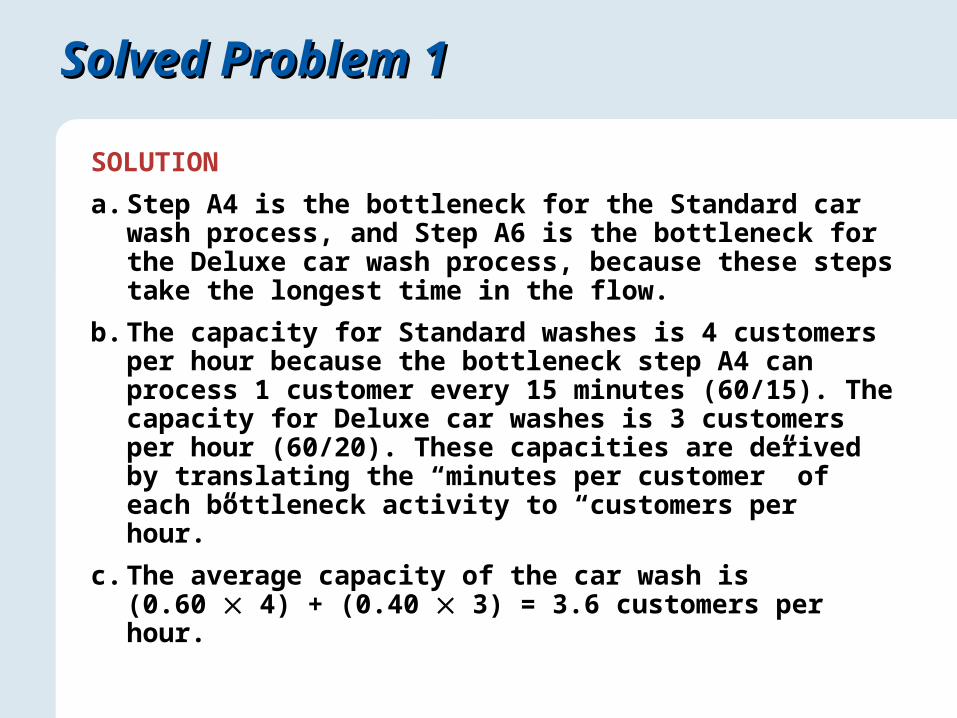
SOLUTION
a. Step A4 is the bottleneck for the Standard car wash process, and Step A6 is the bottleneck for the Deluxe car wash process, because these steps take the longest time in the flow.
b. The capacity for Standard washes is 4 customers per hour because the bottleneck step A4 can process 1 customer every 15 minutes (60/15). The capacity for Deluxe car washes is 3 customers per hour (60/20). These capacities are derived by translating the “minutes per customer” of each bottleneck activity to “customers per hour.”
c. The average capacity of the car wash is (0.60 4) + (0.40 3) = 3.6 customers per hour.
Solved Problem 1Solved Problem 1
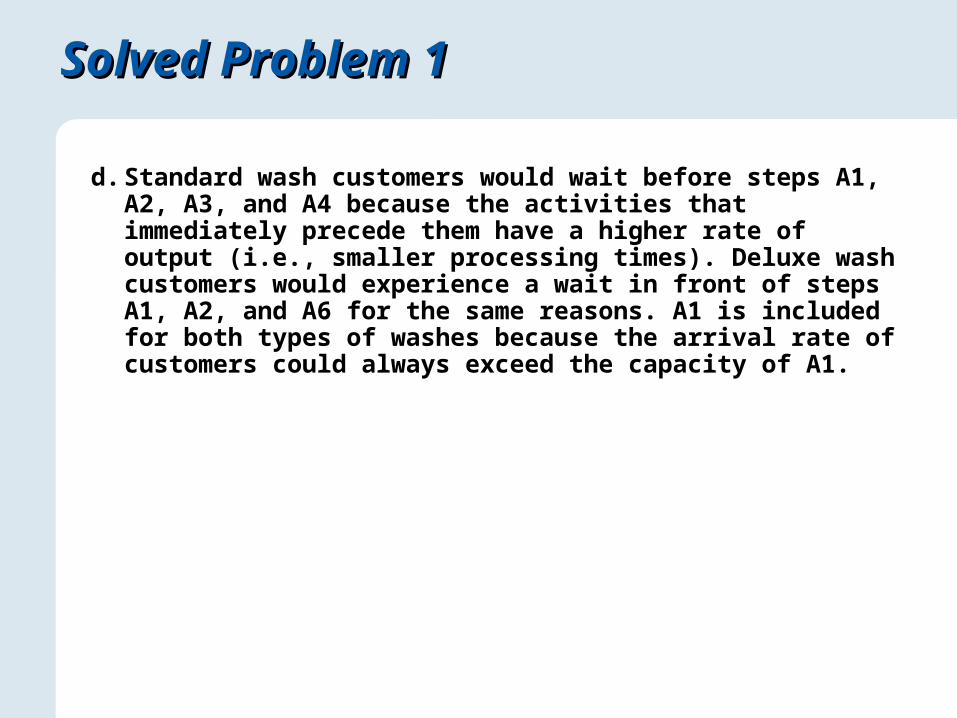
d. Standard wash customers would wait before steps A1, A2, A3, and A4 because the activities that immediately precede them have a higher rate of output (i.e., smaller processing times). Deluxe wash customers would experience a wait in front of steps A1, A2, and A6 for the same reasons. A1 is included for both types of washes because the arrival rate of customers could always exceed the capacity of A1.
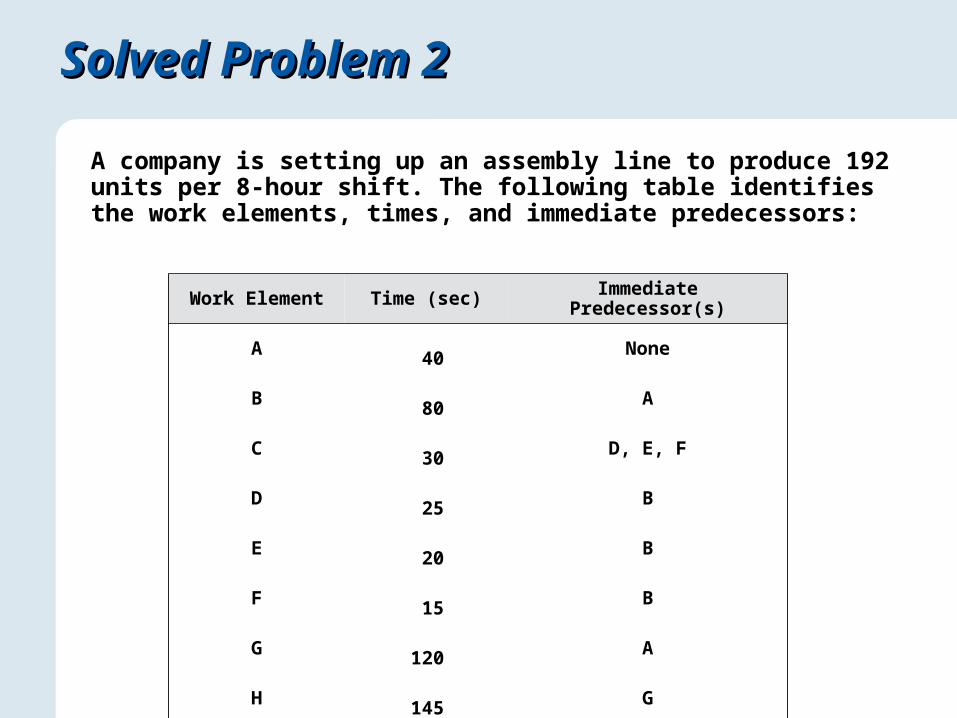
Solved Problem 2Solved Problem 2
A company is setting up an assembly line to produce 192 units per 8-hour shift. The following table identifies the work elements, times, and immediate predecessors:
Work Element Time (sec) Immediate Predecessor(s)
A 40 None
B 80 A
C 30 D, E, F
D 25 B
E 20 B
F 15 B
G 120 A
H 145 G
I 130 H
J 115 C, I
Total 720
Solved Problem 2Solved Problem 2
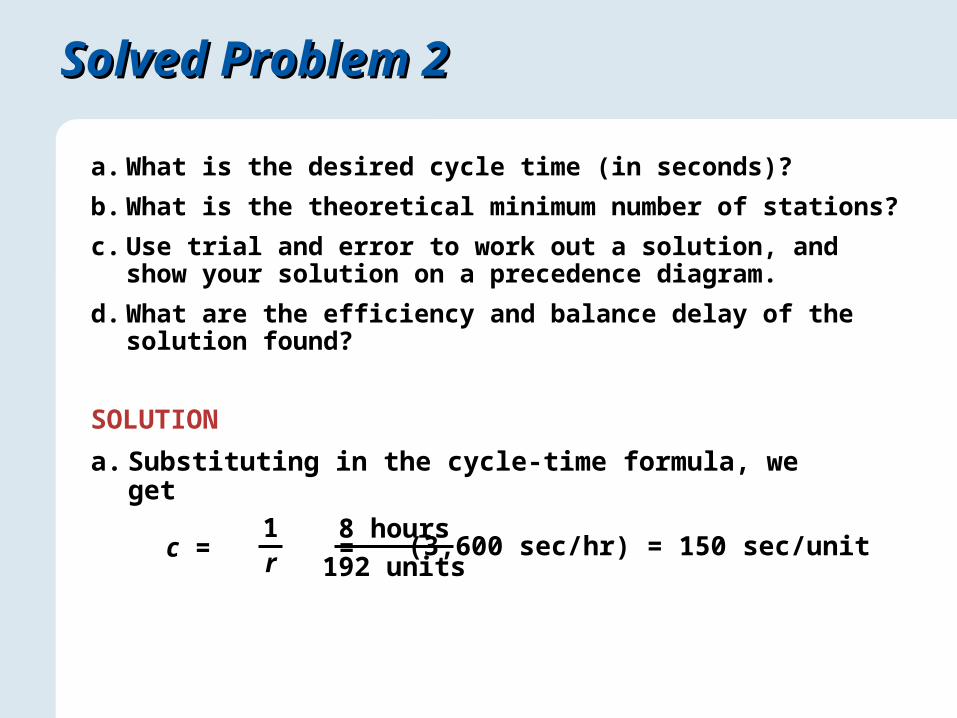
a. What is the desired cycle time (in seconds)?
b. What is the theoretical minimum number of stations?
c. Use trial and error to work out a solution, and show your solution on a precedence diagram.
d. What are the efficiency and balance delay of the solution found?
SOLUTION
a. Substituting in the cycle-time formula, we get
c = =1r
8 hours
192 units(3,600 sec/hr) = 150 sec/unit
Solved Problem 2Solved Problem 2
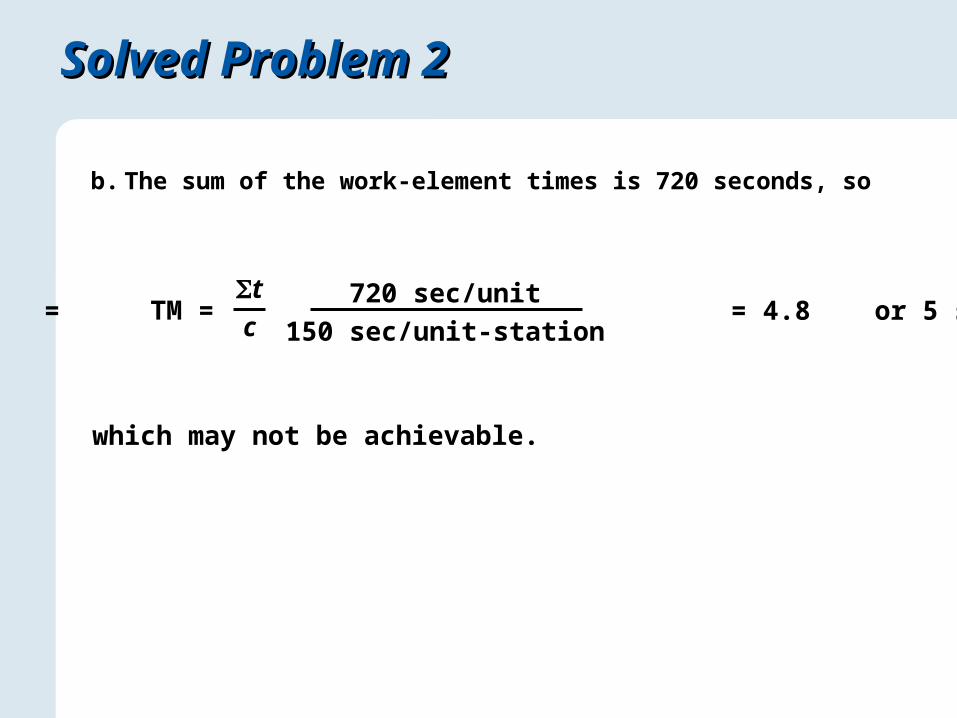
b. The sum of the work-element times is 720 seconds, so
TM =tc
= = 4.8 or 5 stations720 sec/unit
150 sec/unit-station
which may not be achievable.
Solved Problem 2Solved Problem 2
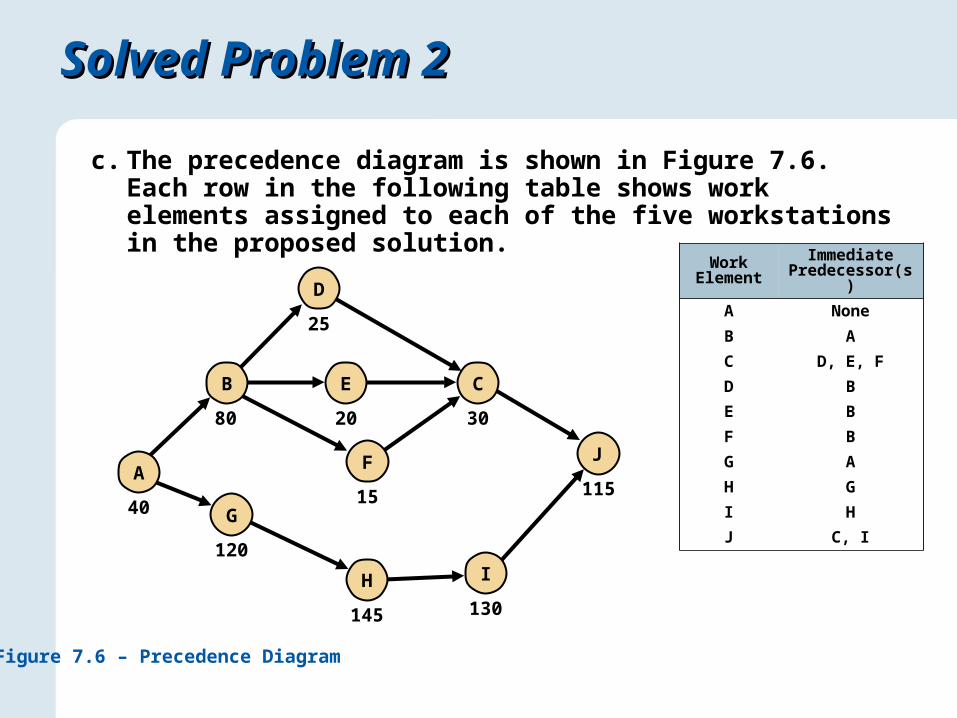
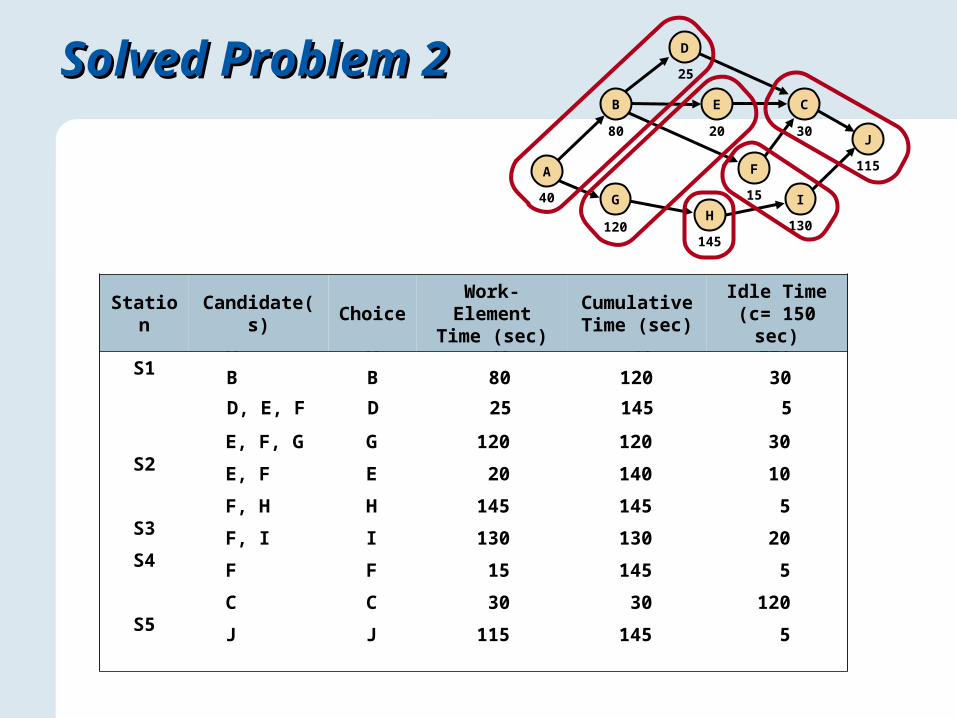
c. The precedence diagram is shown in Figure 7.6. Each row in the following table shows work elements assigned to each of the five workstations in the proposed solution.
J
115
C
30
D
25
E
20
F
15
I
130
H
145
B
80
G
120
A
40
Figure 7.6 – Precedence Diagram
Work Element
Immediate Predecessor(s)
A None
B A
C D, E, F
D B
E B
F B
G A
H G
I H
J C, I
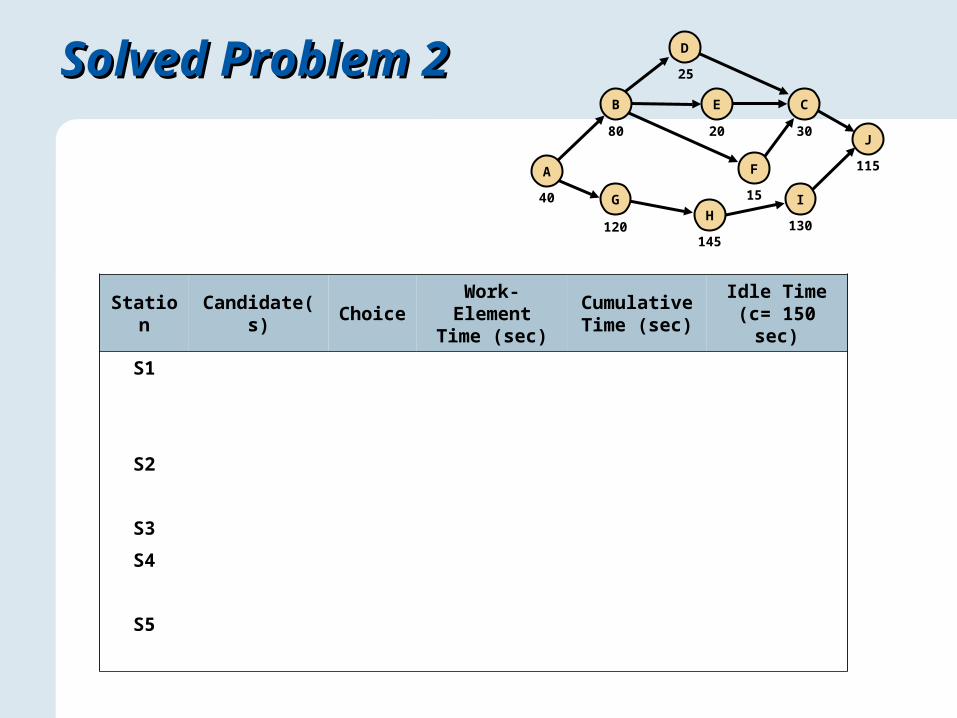
Station Candidate(s) ChoiceWork-Element
Time (sec)Cumulative Time (sec)
Idle Time(c= 150 sec)
S1
S2
S3
S4
S5
Solved Problem 2Solved Problem 2
J
115
C
30
D
25
E
20
F
15 I
130H
145
B
80
G
120
A
40
Solved Problem 2Solved Problem 2
J
115
C
30
D
25
E
20
F
15 I
130H
145
B
80
G
120
A
40
A A 40 40 110
B B 80 120 30
D, E, F D 25 145 5
E, F, G G 120 120 30
E, F E 20 140 10
F, H H 145 145 5
F, I I 130 130 20
F F 15 145 5
C C 30 30 120
J J 115 145 5
Station Candidate(s) ChoiceWork-Element
Time (sec)Cumulative Time (sec)
Idle Time(c= 150 sec)
S1
S2
S3
S4
S5
Solved Problem 2Solved Problem 2
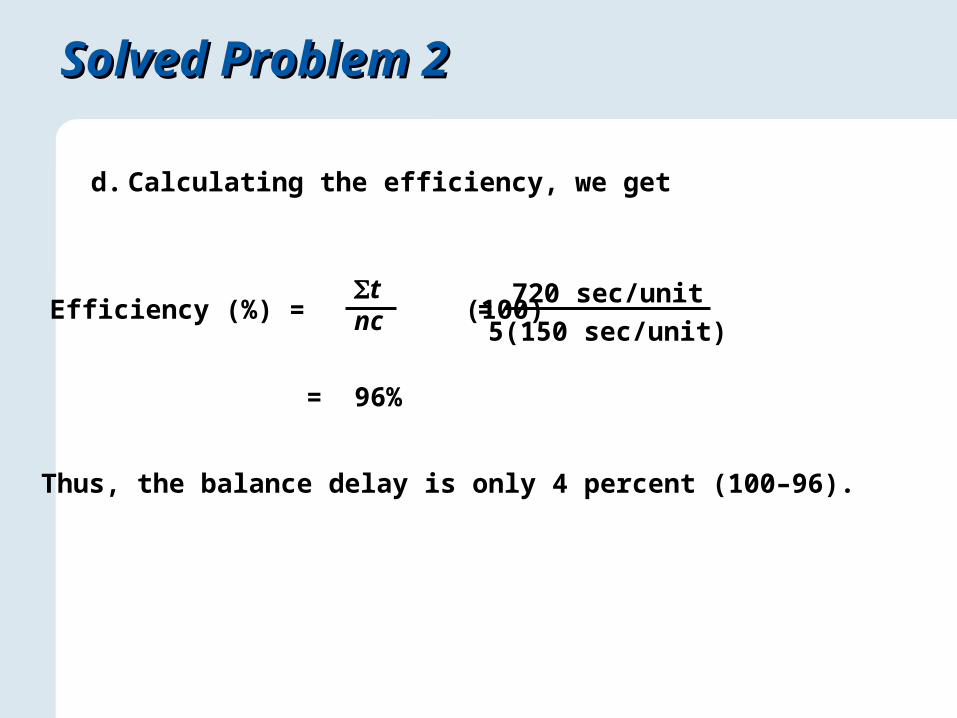
d. Calculating the efficiency, we get
Thus, the balance delay is only 4 percent (100–96).
Efficiency (%) = (100)tnc =
720 sec/unit
5(150 sec/unit)
= 96%