tlw, with 100% participation, define a topographic map and state its uses. describe how contour...
TRANSCRIPT
Lesson Objectives 12/2/13TLW, with 100% participation,Define a topographic map and state its uses.
Describe how contour lines show the elevations, shape, and slope of the land.
Identify the meanings of some symbols and colors used on topographic maps.
As we go through the power point, please do the following:
Take notes in your science notebook.
Map Notes
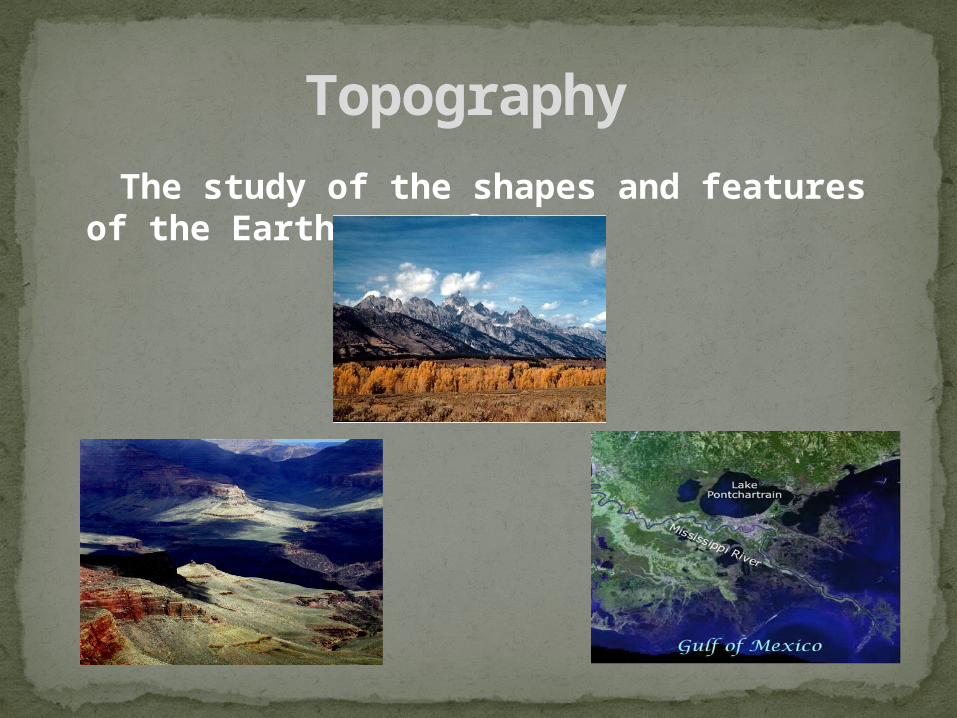
The study of the shapes and features of the Earth’s surface.
Topography

Shows the 3D shape and elevations of an
area of land in 2D. Also known as Contour Maps
Topographic Map

What do the colors on the topographic map represent?Blue lines/shapes - represent water features, such as streams and lakes.
Brown – contour linesBlack – Roads, buildings, railroads, other man made objects.
Green – Woodland areasRed - Highways
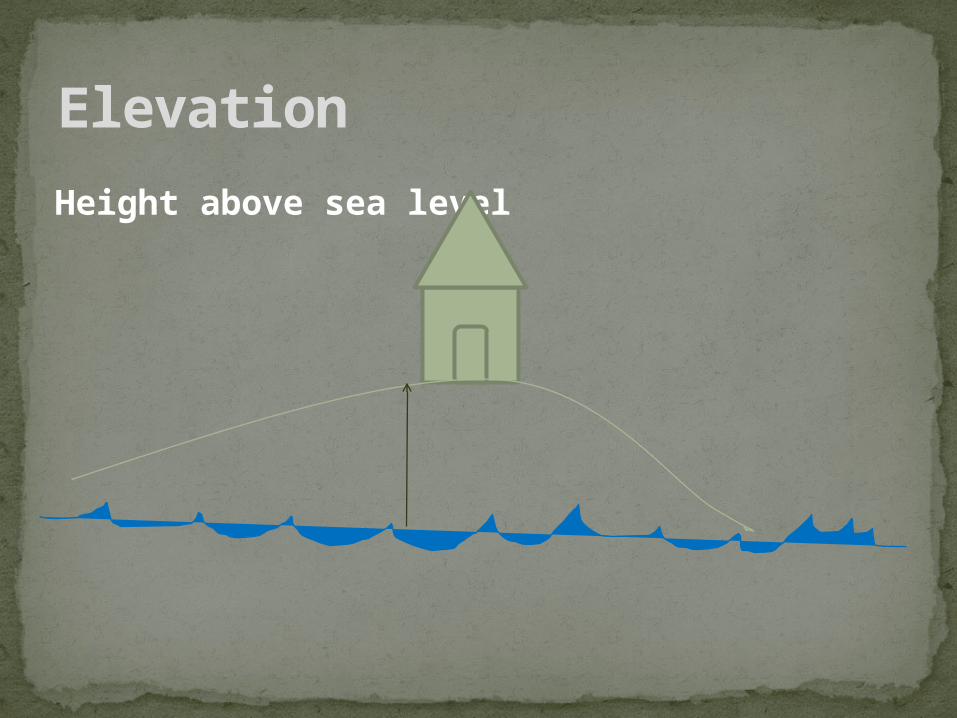
Height above sea level
Elevation
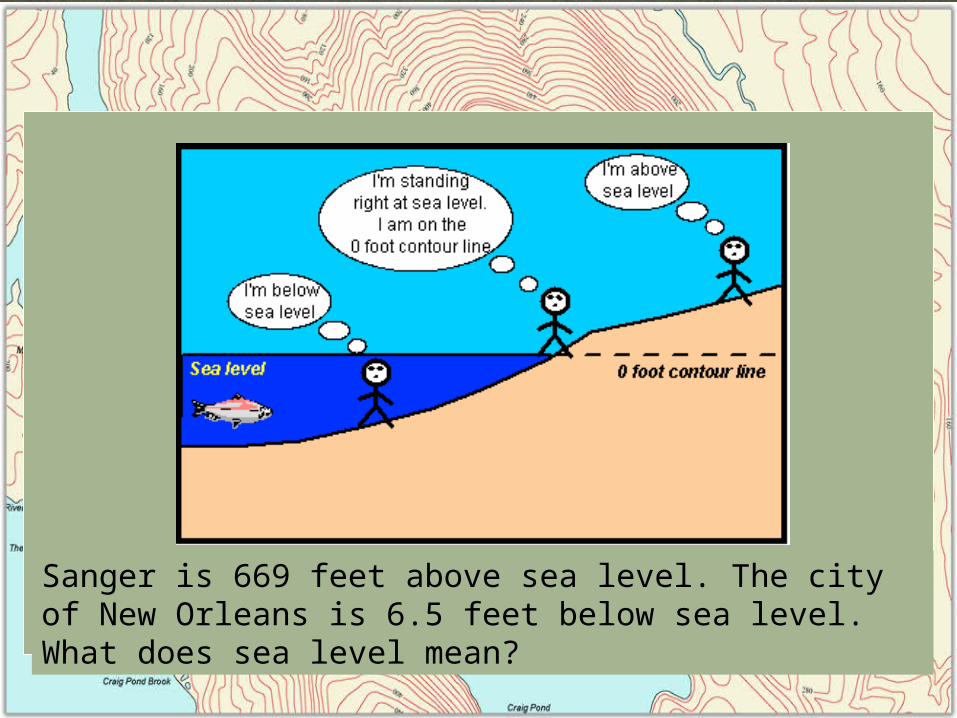
Sanger is 669 feet above sea level. The city of New Orleans is 6.5 feet below sea level. What does sea level mean?
PSC 121 Prince George's Community College
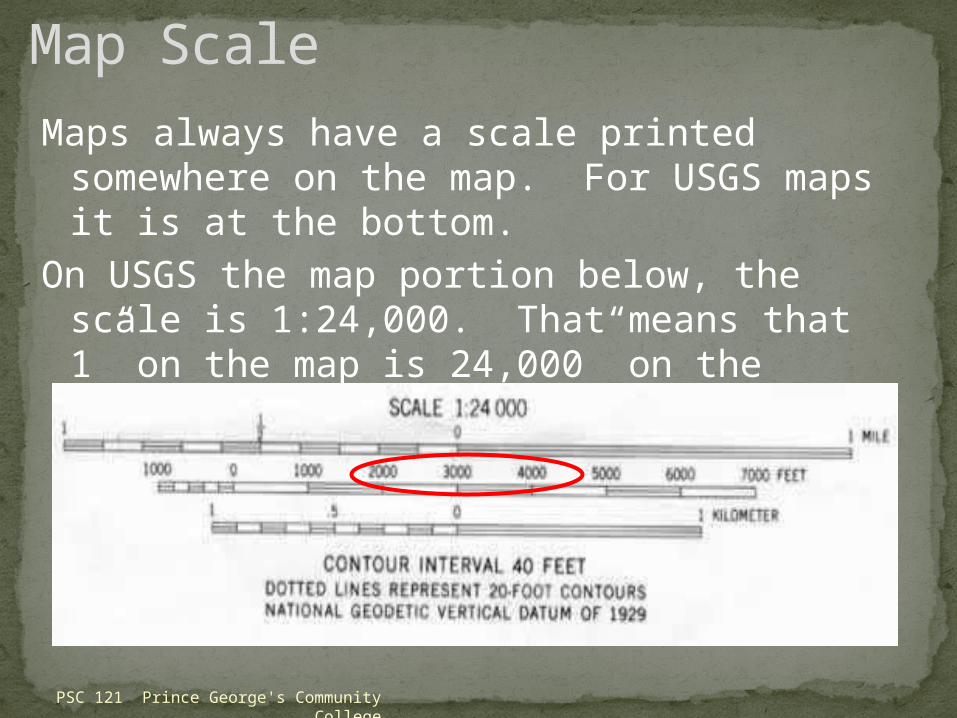
Map Scale
Maps always have a scale printed somewhere on the map. For USGS maps it is at the bottom.
On USGS the map portion below, the scale is 1:24,000. That means that 1” on the map is 24,000” on the ground or 1’ on the map is 24,000’ on the ground.
PSC 121 Prince George's Community College
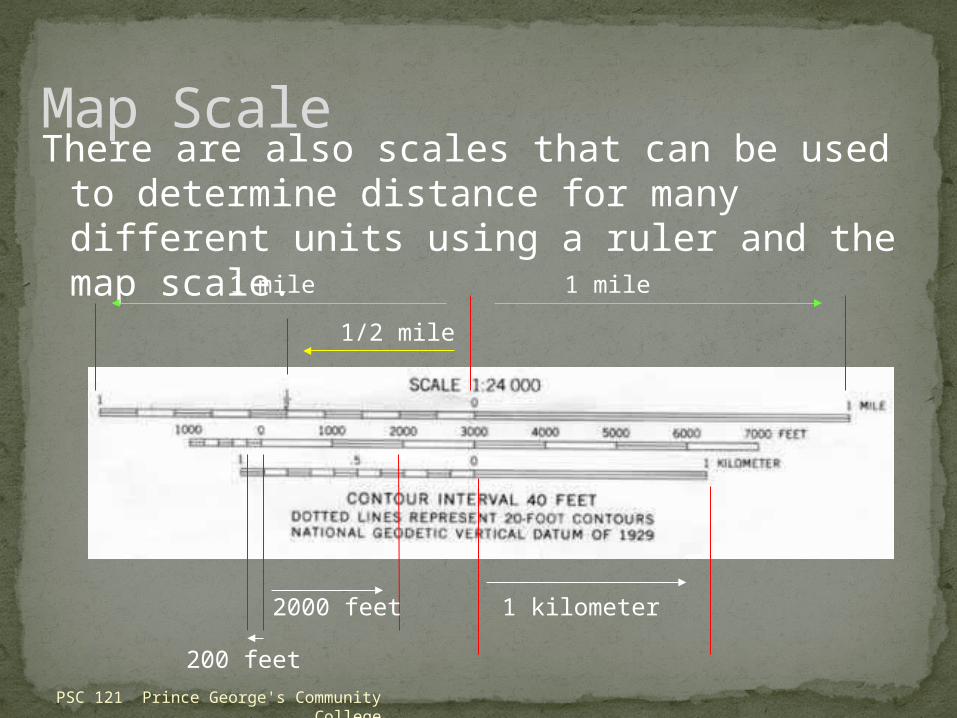
Map ScaleThere are also scales that can be used to
determine distance for many different units using a ruler and the map scale.
1 mile1 mile
1/2 mile
2000 feet
200 feet
1 kilometer
PSC 121 Prince George's Community College
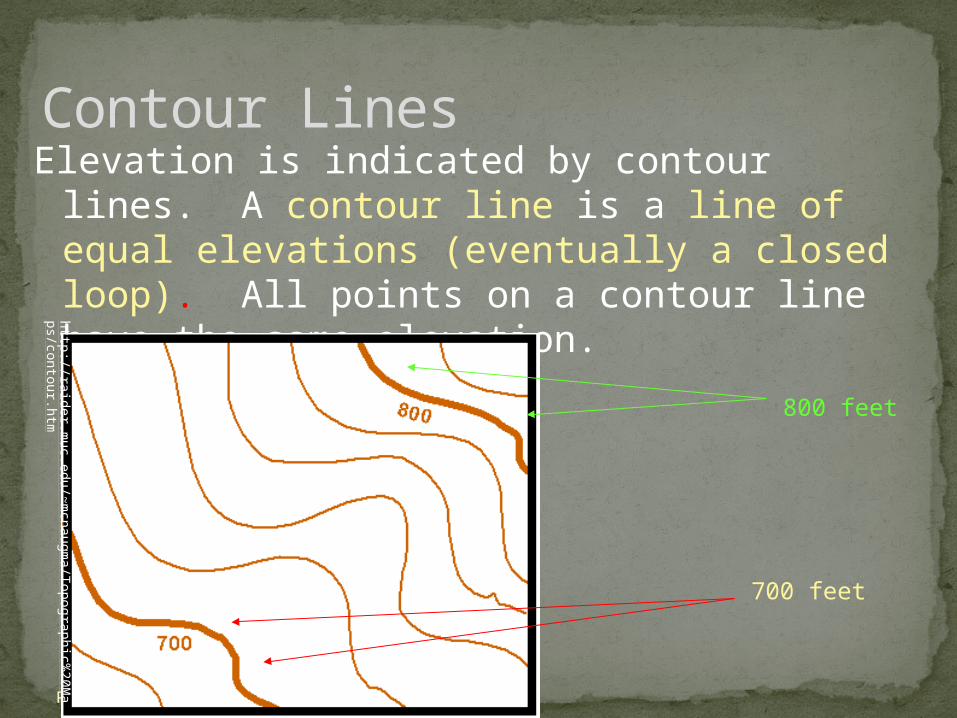
Contour LinesElevation is indicated by contour lines. A
contour line is a line of equal elevations (eventually a closed loop). All points on a contour line have the same elevation.
800 feet
700 feet
http://raider.muc.edu/~
mcnaugm
a/Topographic%20M
aps/contour.htm

PSC 121 Prince George's Community College
Contour Lines
The elevation difference from one line to another is called the contour interval. On the map portion below the contour interval is 20 ft.
20 ft elevation increase
20 ft elevation increase
20 ft elevation decreasehttp://raider.m
uc.edu/~m
cnaugma/Topographic%
20Maps/contour.
htm
PSC 121 Prince George's Community College
Contour Lines
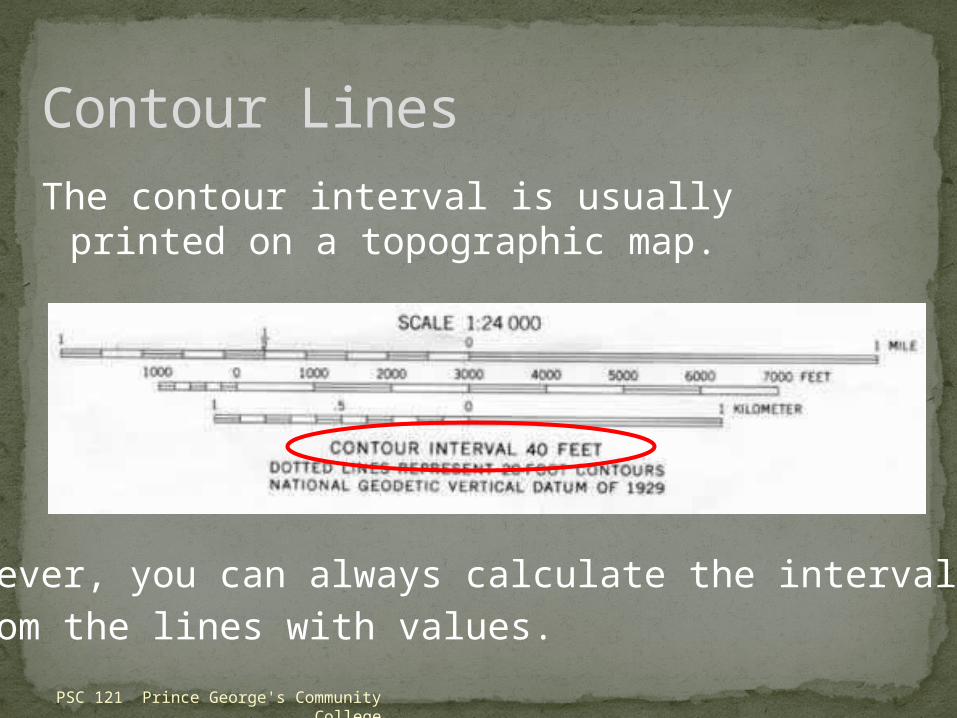
The contour interval is usually printed on a topographic map.
However, you can always calculate the interval from the lines with values.
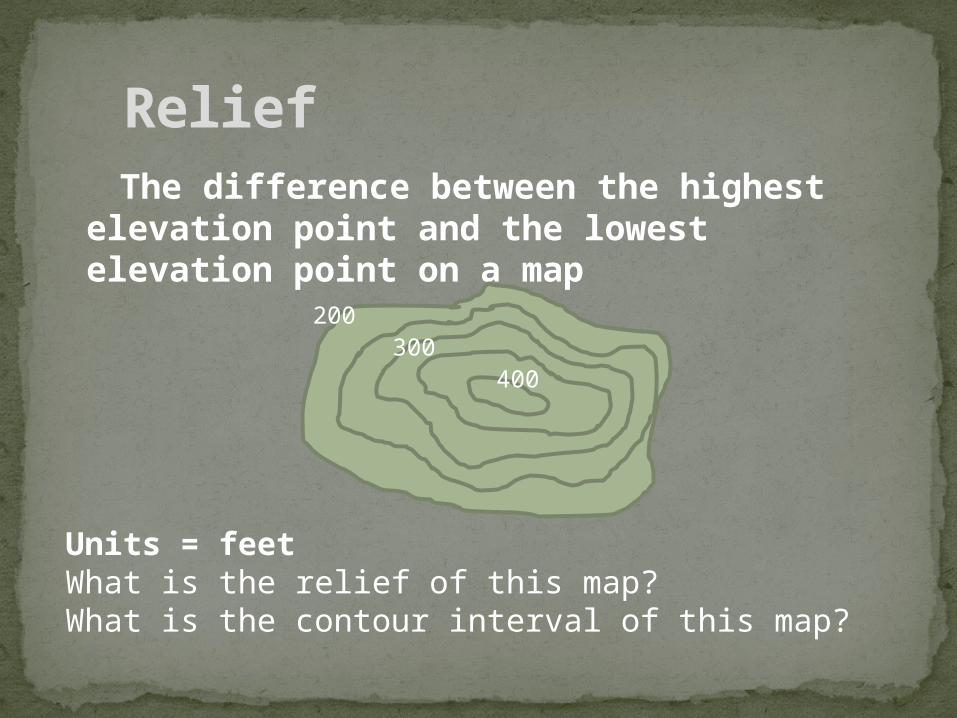
The difference between the highest elevation point and the lowest elevation point on a map
Relief
200 300
400
Units = feetWhat is the relief of this map? What is the contour interval of this map?
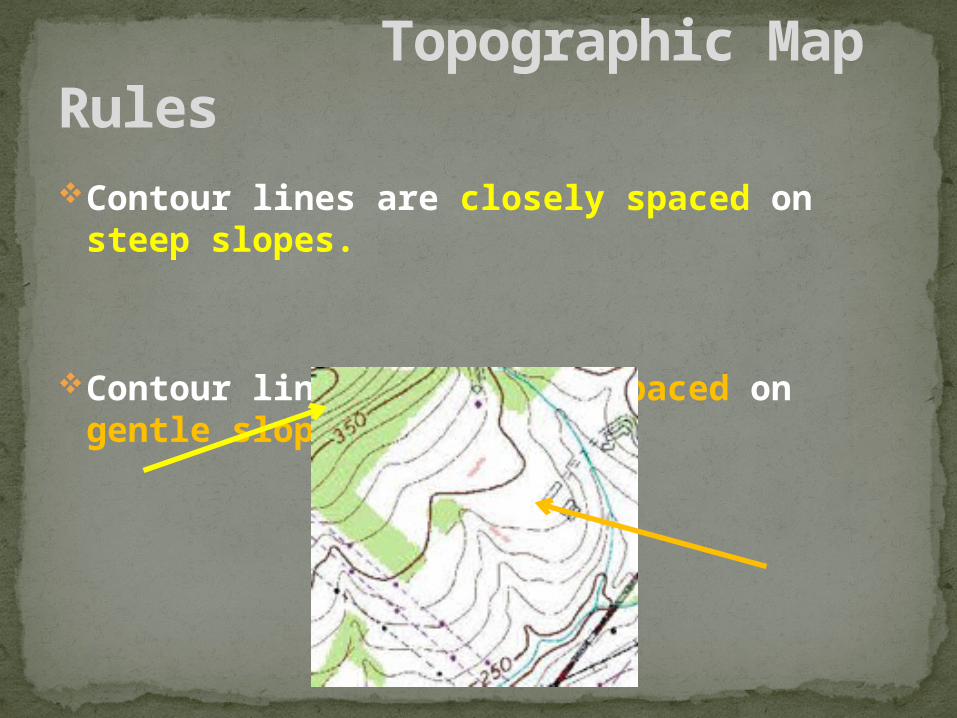
Contour lines are closely spaced on steep slopes.
Contour lines are widely spaced on gentle slopes.
Topographic Map Rules
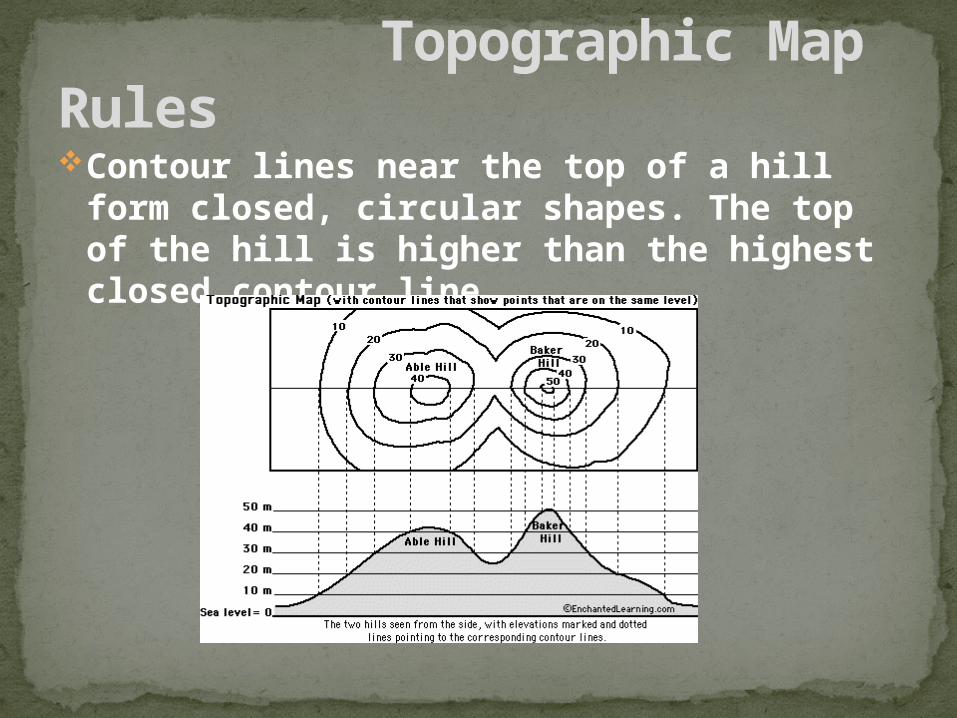
Contour lines near the top of a hill form closed, circular shapes. The top of the hill is higher than the highest closed contour line.
Topographic Map Rules
PSC 121 Prince George's Community College
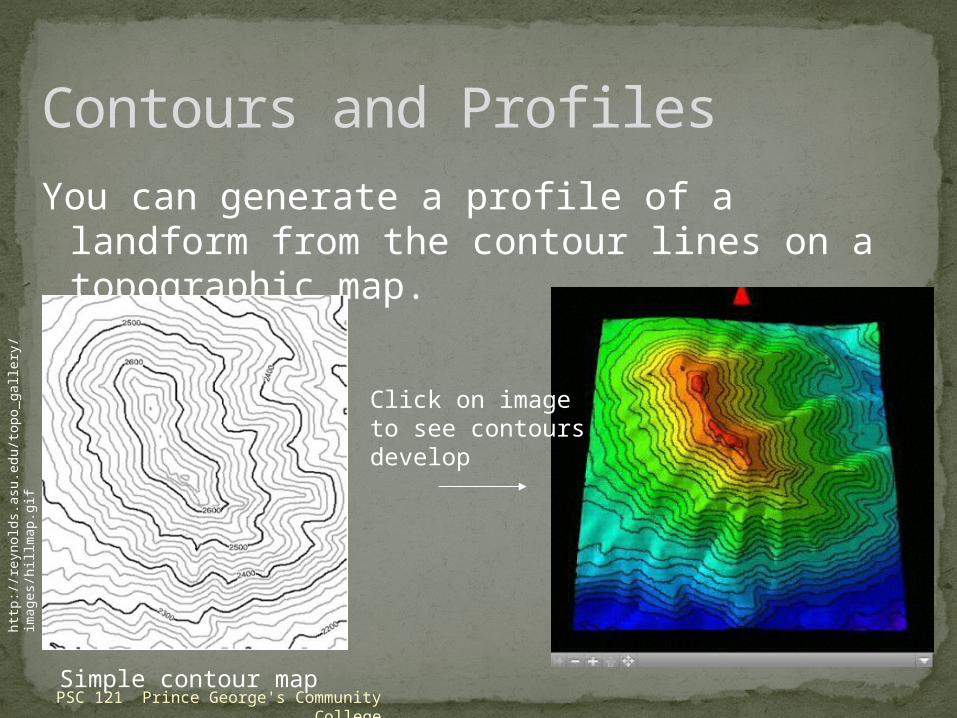
Contours and Profiles
You can generate a profile of a landform from the contour lines on a topographic map.
Simple contour map
Click on imageto see contoursdevelop
http
://re
ynol
ds.a
su.e
du/to
po_g
alle
ry/im
ages
/hill
map
.gif

Depressions without outlets are shown by closed hatched contours. The contour lines have short lines on the inside that are pointing down slope. The bottom of the depression is lower than the lowest closed contour line.
Topographic Map Rules
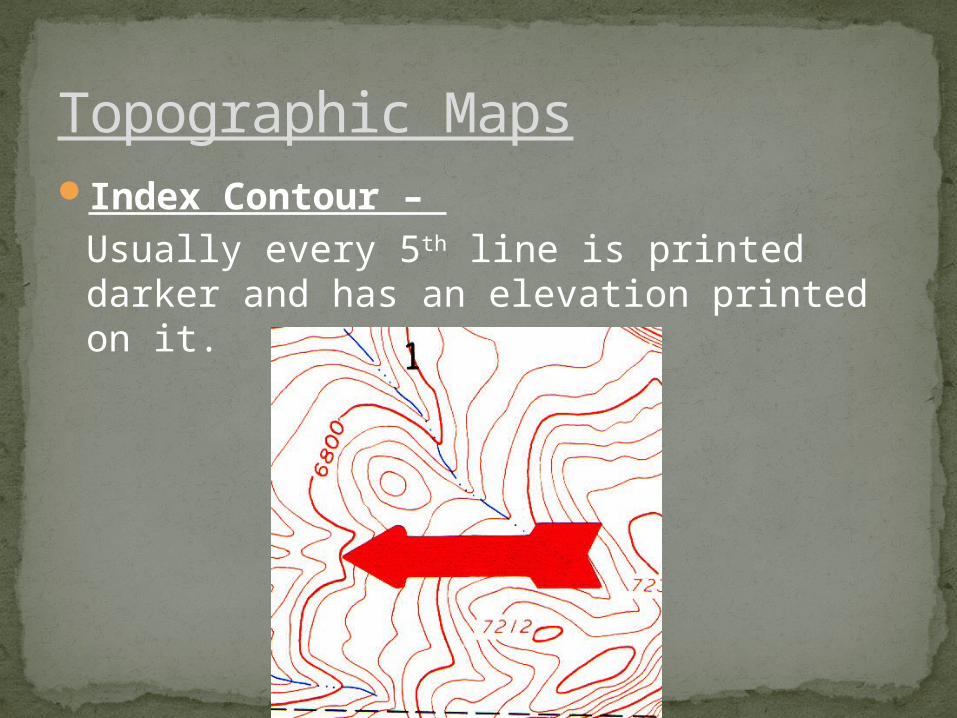
Topographic MapsIndex Contour –
Usually every 5th line is printed darker and has an elevation printed on it.
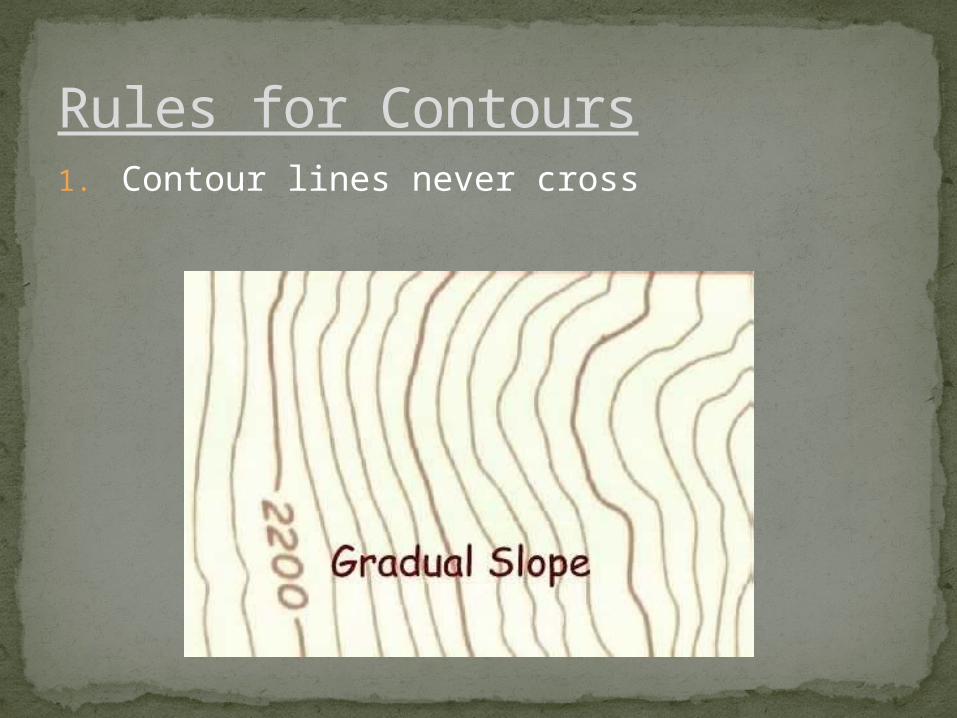
Rules for Contours1. Contour lines never cross
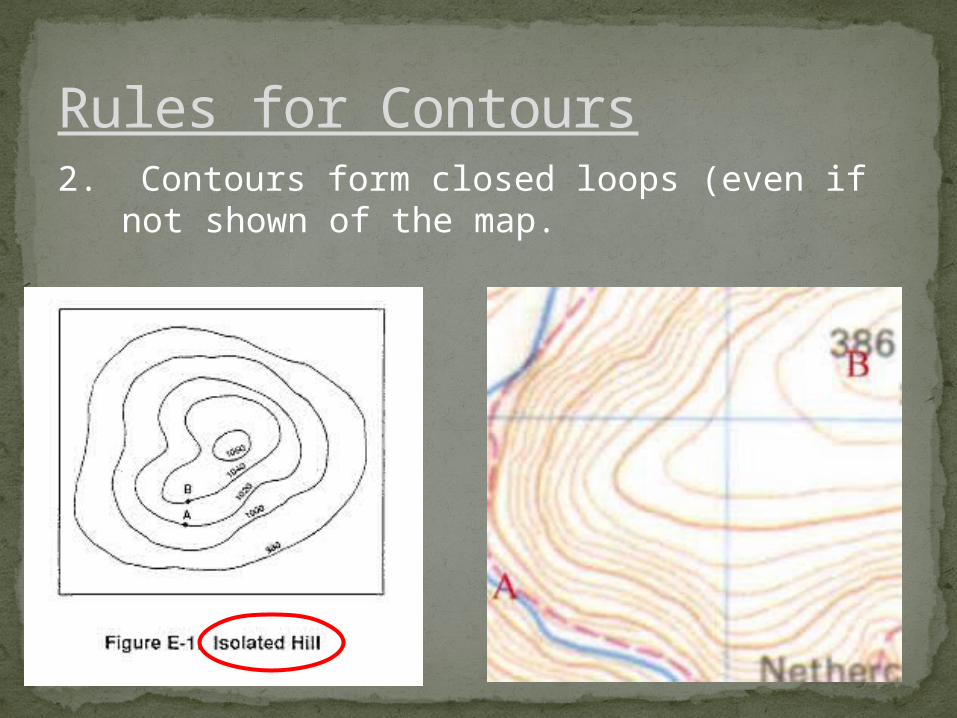
Rules for Contours2. Contours form closed loops (even if not
shown of the map.
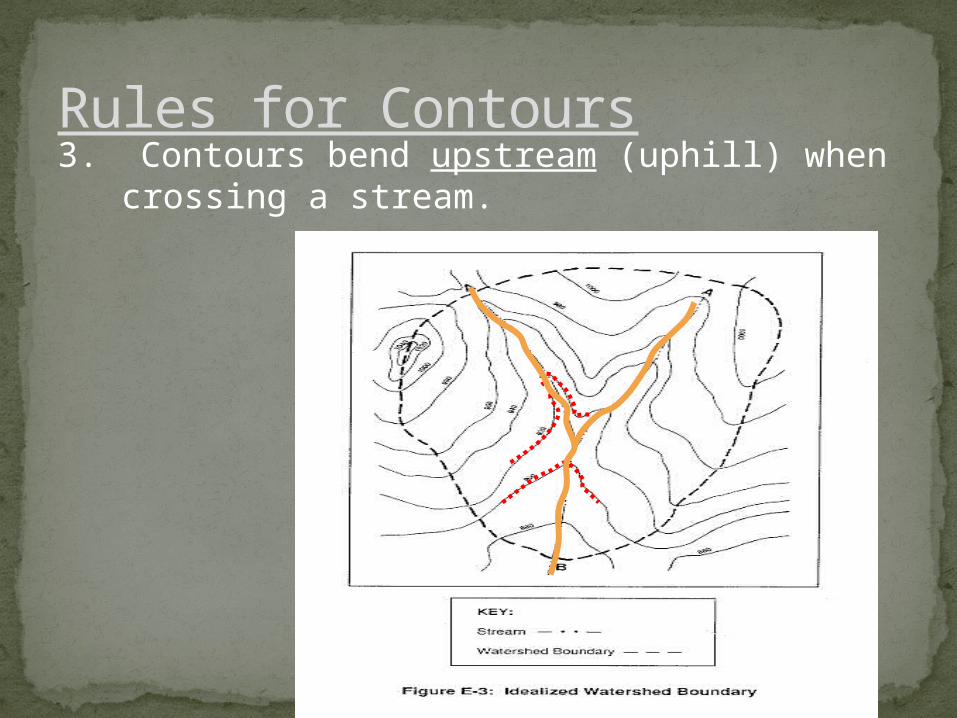
Rules for Contours3. Contours bend upstream (uphill) when
crossing a stream.
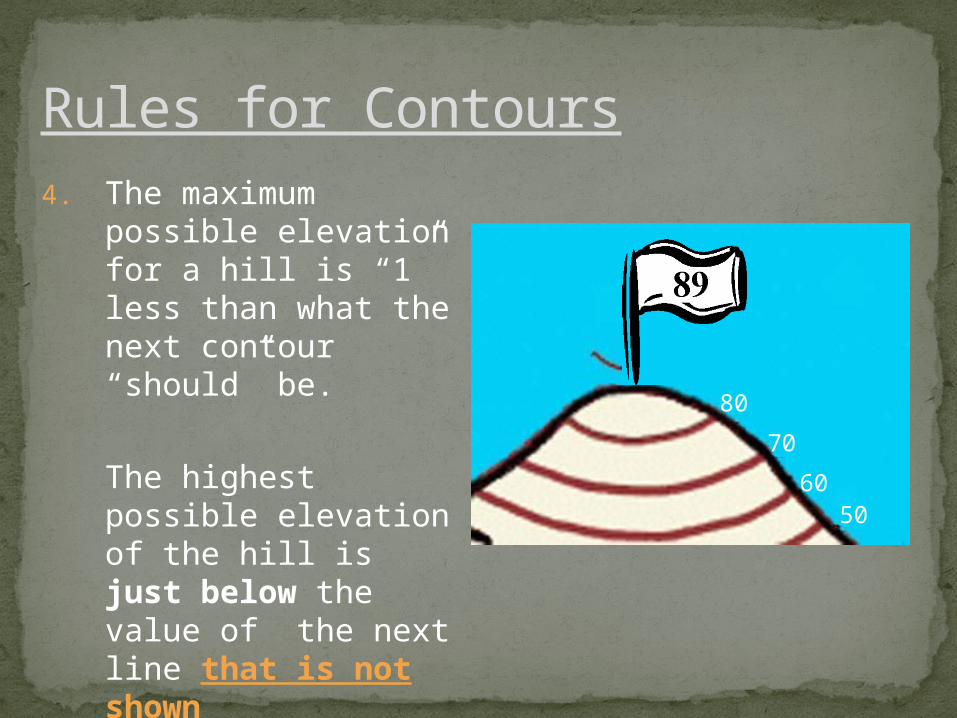
Rules for Contours4. The maximum
possible elevation for a hill is “1” less than what the next contour “should” be.
The highest possible elevation of the hill is just below the value of the next line that is not shown
5060
70
80
90

Notice the two high points on the island. What is the elevation of the two high points?
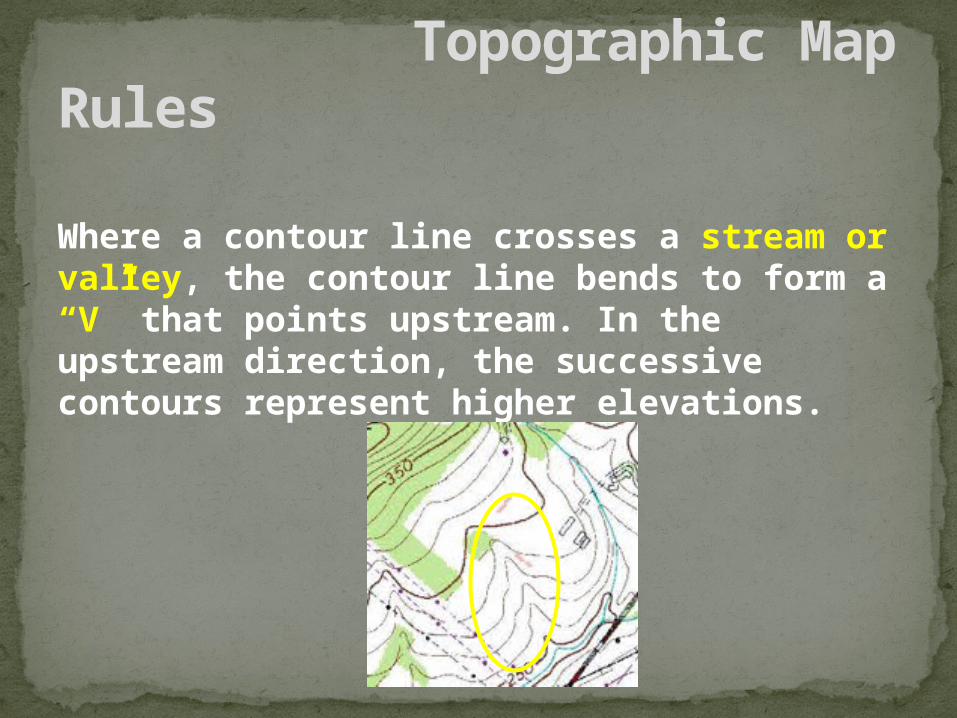
Where a contour line crosses a stream or valley, the contour line bends to form a “V” that points upstream. In the upstream direction, the successive contours represent higher elevations.
Topographic Map Rules
PSC 121 Prince George's Community College
Tracking Flowing WaterHow does water always flow?
DOWNHILLHow can we tell what direction (N,S,NW,ESE) is downhill?
PSC 121 Prince George's Community College
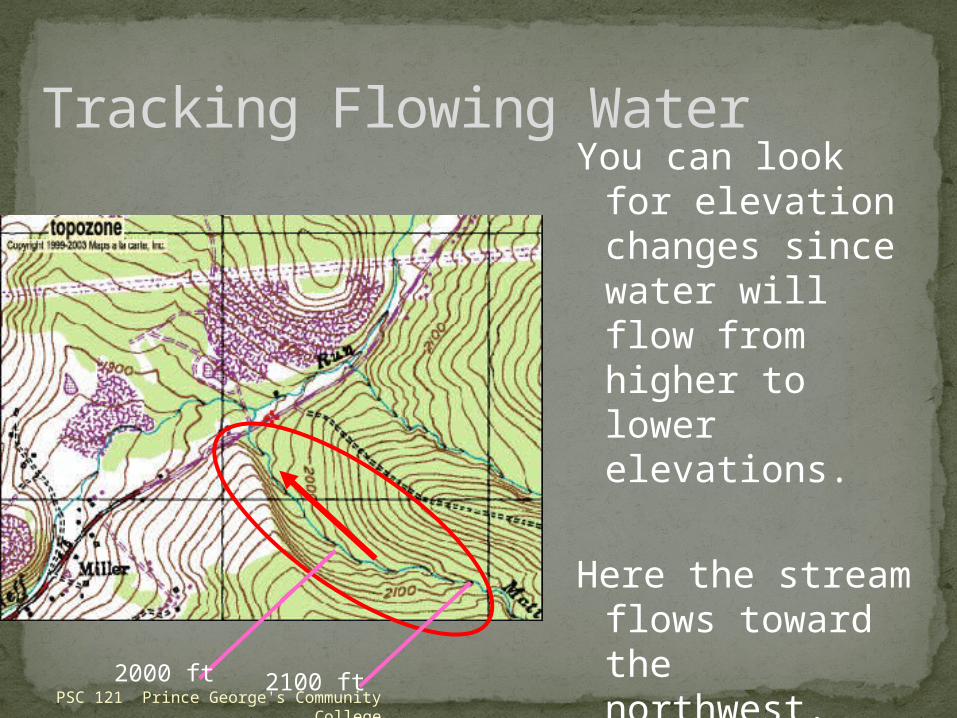
Tracking Flowing WaterYou can look for
elevation changes since water will flow from higher to lower elevations.
Here the stream flows toward the northwest.
2100 ft2000 ft
PSC 121 Prince George's Community College
Tracking Flowing Water
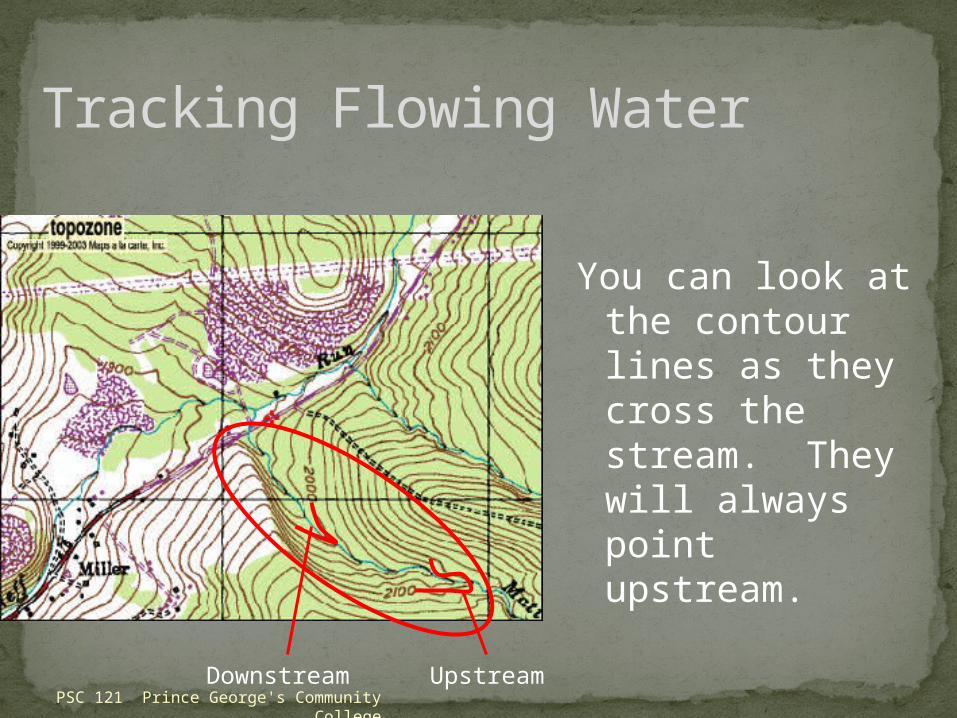
You can look at the contour lines as they cross the stream. They will always point upstream.
Downstream Upstream
PSC 121 Prince George's Community College
Tracking Flowing Water
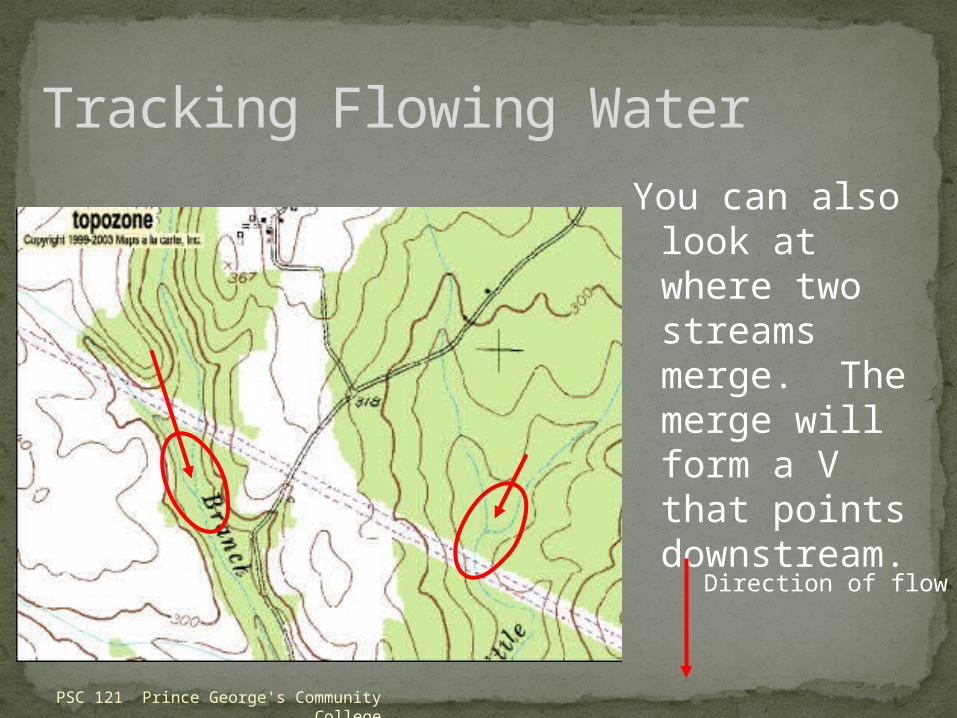
You can also look at where two streams merge. The merge will form a V that points downstream.
Direction of flow
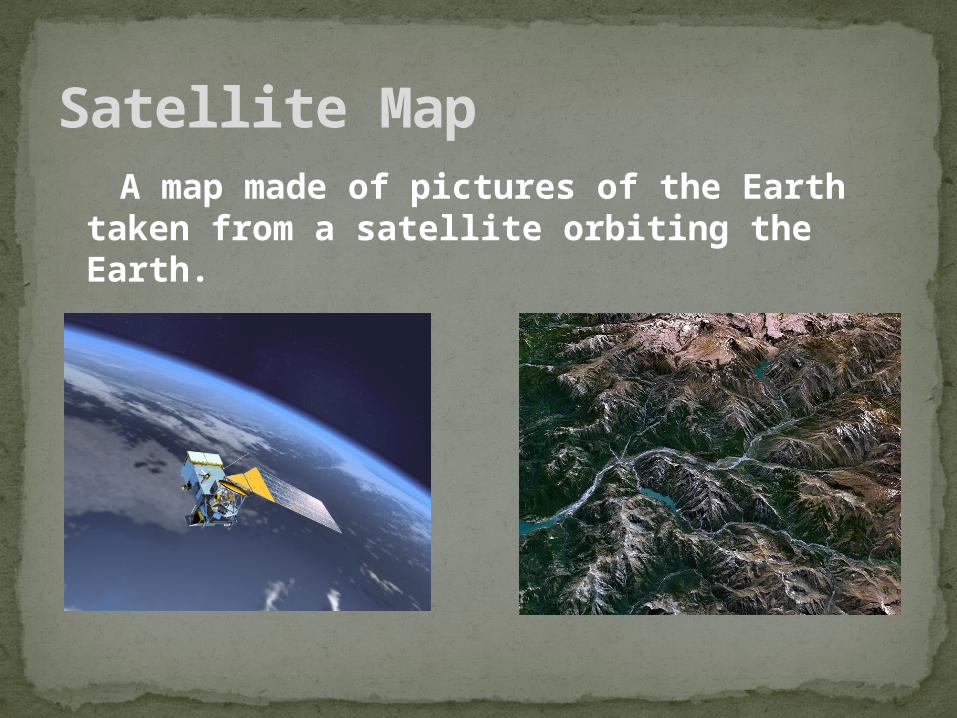
A map made of pictures of the Earth taken from a satellite orbiting the Earth.
Satellite Map