tissue resident macrophages in pancreatic ductal ... tissue resident macrophages in pancreatic...
TRANSCRIPT

1
Tissue Resident Macrophages in Pancreatic Ductal Adenocarcinoma Originate from
Embryonic Hematopoiesis and Promote Tumor Progression
Yu Zhu1,2, John M. Herndon1,2, Dorothy K. Sojka3, Ki-Wook Kim4, Brett L. Knolhoff1,2, Chong Zuo1,2,
Darren R. Cullinan7, Jingqin Luo8, Audrey R. Bearden1,2, Kory J. Lavine1, Wayne M. Yokoyama3,5,
William G. Hawkins6,7, Ryan C. Fields6,7, Gwendalyn J. Randolph1,4, and David G. DeNardo1,2,4,6*
Author Affiliations:
1Department of Medicine, 2ICCE Institute, 3Department of Rheumatology, 4Department of Pathology
and Immunology, 5Howard Hughes Medical Institute, 6Siteman Cancer Center, 7Department of
Surgery, 8Division of Biostatistics, Washington University St. Louis, School of Medicine, St. Louis, MO
63110, USA
*Corresponding author: David G. DeNardo, Department of Medicine, 660 South Euclid Ave, Box 8069,
St. Louis, MO 63110. [email protected]
Running Title: Origin and Functions of Macrophages in Pancreatic Cancer

2
SUMMARY
Tumor-associated macrophages (TAMs) are essential components of the cancer
microenvironment and play critical roles in the regulation of tumor progression. Optimal therapeutic
intervention requires in-depth understanding of the sources that sustain macrophages in malignant
tissues. In this study, we investigated the ontogeny of TAMs in murine pancreatic ductal
adenocarcinoma (PDAC) models. We identified both inflammatory monocytes and tissue-resident
macrophages as sources of TAMs. Unexpectedly, significant portions of pancreas-resident
macrophages originate during embryonic development and expand through in situ proliferation during
tumor progression. While monocyte-derived TAMs play more potent roles in antigen presentation,
embryonically derived TAMs exhibit a pro-fibrotic transcriptional profile, indicative of their role in
producing and remodeling extracellular matrix molecules. Collectively, these findings uncover the
heterogeneity of TAM origin and functions, and could provide therapeutic insight for PDAC treatment.
Key words: Macrophage ontogeny, Tissue resident macrophage, Fibrosis, Pancreatic cancer,
Pancreas, Tumor immunity.

3
INTRODUCTION
Pancreatic ductal adenocarcinoma (PDAC) is one of the most lethal malignant diseases.
Current therapeutic interventions are extremely ineffective in PDAC treatment, partly due to
components in the microenvironment that promote tumor growth. Two hallmarks of the PDAC
microenvironment are the dense fibrotic stroma and extensive infiltration of myeloid cells, including
macrophages. Tumor-associated macrophages (TAMs) are one of the most abundant immune cells
infiltrating PDAC. TAMs promote tumor growth by releasing growth factors, inhibiting anti-tumor
adaptive immune responses, modifying angiogenesis, and promoting fibrosis, among other
mechanisms (Biswas and Mantovani, 2010; Noy and Pollard, 2014; Ruffell and Coussens, 2015).
Therefore, high numbers of TAMs correlate with poor patient outcome (Balaz et al., 2002; Ino et al.,
2013; Kurahara et al., 2011). Consequently, TAMs are considered a highly desirable therapeutic
target (Mantovani et al., 2014; Noy and Pollard, 2014).
Optimal therapeutic strategies targeting TAMs require an in-depth understanding of their
ontogeny and the mechanisms governing their homeostasis. The traditional view holds that tissue
macrophages are derived from circulating Ly6CHi monocytes. In the last few years, an increasing
amount of evidence suggests that various types of tissue-resident macrophages are established
during embryonic development, persist into adulthood, and self-maintain independently of the adult
hematopoietic system (Epelman et al., 2014; Ginhoux and Guilliams, 2016; Gomez Perdiguero et al.,
2015; Hashimoto et al., 2013; Perdiguero and Geissmann, 2016; Schulz et al., 2012; Varol et al.,
2015; Yona et al., 2013). Under homeostatic conditions, macrophages derived from different
developmental origins co-exist in many organs. Two notable exceptions are brain microglia, the
majority of which are generated during embryonic hematopoiesis at the yolk sac stage (Ginhoux et al.,
2010; Hoeffel et al., 2015), and intestinal macrophages, which rely on continuous replenishment by
4
adult blood monocytes (Bain et al., 2014). Macrophages in many other organs, including the
pancreas, have mixed origins (Calderon et al., 2015). A limited number of studies suggest that co-
existing macrophages, derived from different developmental origins, have both overlapping and
distinct functions within the same tissue (Epelman et al., 2014; Gibbings et al., 2015). However, more
studies are needed to address the correlation between the ontogeny and functionality of different
macrophage subsets.
Despite the growing body of knowledge of tissue-resident macrophages, monocytes are still
often considered as the precursors of macrophages in tumors (Franklin and Li, 2016). Indeed,
multiple studies in several tumor models have demonstrated the contribution of circulating monocytes
to sustaining TAM numbers. (Franklin et al., 2014; Laoui et al., 2014; Movahedi et al., 2010b). In
addition to bone marrow, spleen was also shown to serve as an extramedullary hematopoietic site
that supplies monocytes to replenish TAM pools (Cortez-Retamozo et al., 2013). However, the
contribution of tissue-resident macrophages to TAMs has largely been understudied. Tissue-resident
macrophages are known to proliferate in situ under pathological conditions (Amano et al., 2014;
Jenkins et al., 2011). In addition, in situ proliferating macrophages have been observed in human
cancers (Campbell et al., 2010). However, it is not known whether proliferation of tissue-resident
macrophages contributes to TAM numbers in malignancies.
In this study, we document a previously unappreciated heterogeneity in the ontogeny of TAMs
in pancreatic ductal adenocarcinoma. We identify both Ly6CHi monocytes and tissue-resident
macrophages of embryonic origin as sources of TAMs. More importantly, TAMs derived from different
origins demonstrate distinct phenotypes and transcriptional profiles, suggesting divergent functionality.
While monocyte-derived TAMs are more potent at sampling tumor antigens and regulating adaptive
immune responses, embryonically derived TAMs have higher expression levels of pro-fibrotic genes

5
that encode for extracellular matrix (ECM) and ECM remodeling molecules. These data reveal a
potential novel function of embryonically derived macrophages, and suggest a previously unknown
interaction between TAMs and the fibrotic PDAC stroma, which could serve as a therapeutic target for
PDAC treatment.

6
RESULTS
Pancreatic Ductal Adenocarcinoma Tissues are Infiltrated with Macrophages
High levels of fibrosis and extensive inflammatory cell infiltration characterize the tumor
microenvironment of human PDAC. Among the infiltrating cells, macrophages are frequently a
dominant component. This can be readily observed by comparing the expression of pan-
macrophage/myeloid cell markers CD68, CD163, and CD206 in paired human pancreatic tissue
samples containing both PDAC lesions and adjacent normal tissue (Figure 1A-B). This increase in
macrophage number parallels the levels of tissue fibrosis. While tumor infiltration by macrophages is
well characterized, the sources of these macrophages have not been elucidated completely.
To explore the ontogeny of TAMs in PDAC, we analyzed p48-Cre+/LSL-KrasG12D/p53flox/+
(KPC) genetically engineered mouse models (GEMMs), which undergo stepwise progression through
stages of pancreatic intraepithelial neoplasia (PanIN) and ultimately develop PDAC (Hingorani et al.,
2005). The KPC model faithfully recapitulates many pathological features of the human disease,
including progressive development of stromal fibrosis and extensive accumulation of macrophages
(Figure 1C). By flow cytometry, we identified CD45+CD11b+CD3-CD19-Ly6G-Ly6CLow/-F4/80+MHCII+
macrophages in normal pancreas, autochthonous tumors in KPC mice (Figure 1D), and syngeneic
orthotopic PDAC tumors established using KPC-derived cancer cell lines (KPC-1) (Figure S1). In all
cases, we confirmed macrophage identity in our gating strategy based on the expression of CD68,
MerTK, CD64 (Gautier et al., 2012), colony-stimulating factor-1 receptor (CSF1R), and CX3C
chemokine receptor-1 (CX3CR1), but not Siglec-F (Figure 1E, S1C). To confirm the exclusion of
dendritic cells (DCs) in our macrophage gating, we established orthotopic tumors in Zbtb46gfp/+
reporter mice (Satpathy et al., 2012), and found minimal GFP signal in the macrophage population
compared to DC specific gating strategies (Figure 1E, S1D). Furthermore, the vast majority of DCs in

7
both normal pancreas and orthotopic PDAC (identified by CD45+Zbtb46-GFP+) express considerably
lower levels of macrophage markers, including MerTK, CD64, F4/80, and CX3CR1 (Figure S1E),
suggesting that pancreas-infiltrating macrophages are phenotypically distinct from DCs. Flow
cytometry analyses of tissues from the KPC mouse model demonstrated a 24-fold increase in total
number and 5-fold increase in density of macrophages in end-point PDAC compared to normal
pancreas (Figure 1F). Similarly, macrophage numbers expand in orthotopic PDAC tissues as the
tumors progress (Figure 1G). Taken together, the dramatic upregulation of the number and density of
macrophages in KPC mouse models mimics that seen in human pancreatic cancer. However, the
sources of these macrophages are not clearly defined.
Subsets of Macrophages in Pancreas and PDAC Tissues Are Maintained Independently of
Blood Monocytes
To test the contribution of blood monocytes to macrophages in tumors, we first performed
parabiosis by surgically joining the CD45.2-expressing KPC mice with congenic wild-type mice that
express CD45.1. Parabiotic pairs were set up when KPC mice were 3.5 months of age. At this age,
KPC mice have developed extensive PanIN lesions, with microscopic evidence of progression to full
PDAC. To study the contribution of blood monocytes to macrophages in PDAC, we analyzed
chimerism after 6 weeks (at 5 months of age), when disease in KPC mice would have progressed to
late-stage PDAC. We also evaluated chimerism in a cohort of mice 2 weeks after the establishment of
parabiosis to study the dynamics of macrophage turnover. We observed 28% chimerism of Ly6CHi
monocytes in the blood of KPC mice within the first 2 weeks, which did not increase further after 6
weeks of parabiosis (Figures 2A-2B). This level of chimerism was mirrored by tissue-infiltrating
Ly6CHi monocytes in both normal pancreas and KPC tumors (Figure S2A-B). However, tissue
8
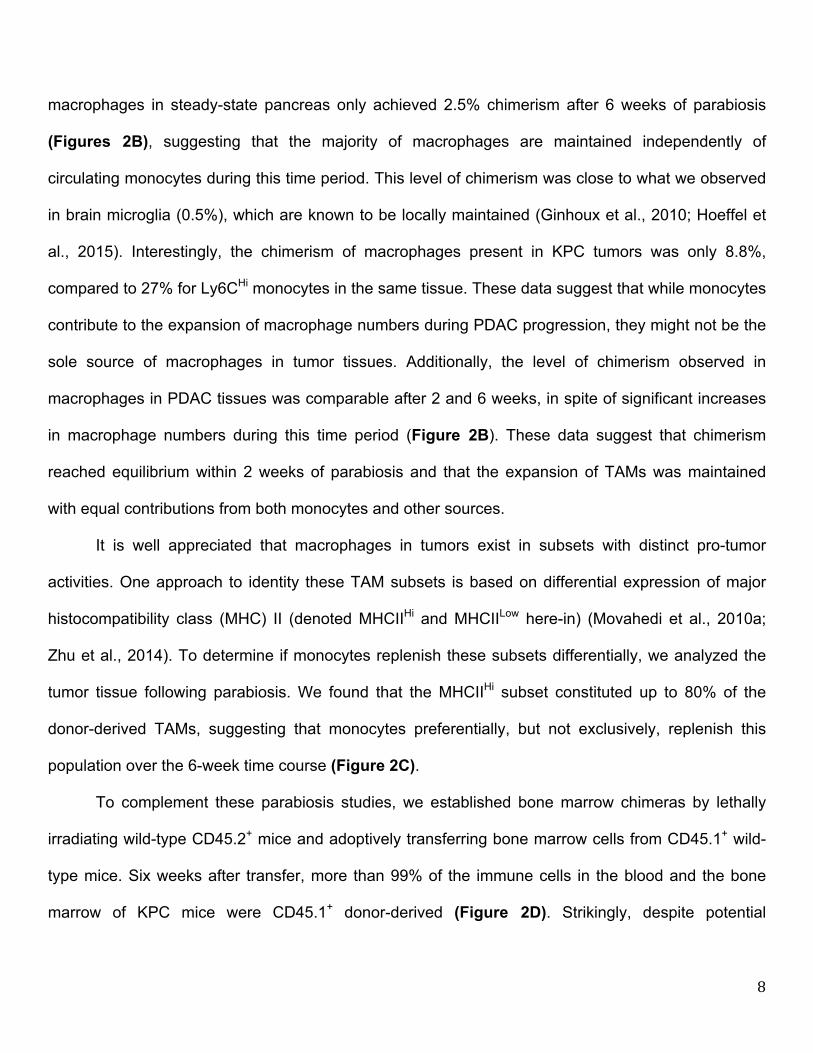
macrophages in steady-state pancreas only achieved 2.5% chimerism after 6 weeks of parabiosis
(Figures 2B), suggesting that the majority of macrophages are maintained independently of
circulating monocytes during this time period. This level of chimerism was close to what we observed
in brain microglia (0.5%), which are known to be locally maintained (Ginhoux et al., 2010; Hoeffel et
al., 2015). Interestingly, the chimerism of macrophages present in KPC tumors was only 8.8%,
compared to 27% for Ly6CHi monocytes in the same tissue. These data suggest that while monocytes
contribute to the expansion of macrophage numbers during PDAC progression, they might not be the
sole source of macrophages in tumor tissues. Additionally, the level of chimerism observed in
macrophages in PDAC tissues was comparable after 2 and 6 weeks, in spite of significant increases
in macrophage numbers during this time period (Figure 2B). These data suggest that chimerism
reached equilibrium within 2 weeks of parabiosis and that the expansion of TAMs was maintained
with equal contributions from both monocytes and other sources.
It is well appreciated that macrophages in tumors exist in subsets with distinct pro-tumor
activities. One approach to identity these TAM subsets is based on differential expression of major
histocompatibility class (MHC) II (denoted MHCIIHi and MHCIILow here-in) (Movahedi et al., 2010a;
Zhu et al., 2014). To determine if monocytes replenish these subsets differentially, we analyzed the
tumor tissue following parabiosis. We found that the MHCIIHi subset constituted up to 80% of the
donor-derived TAMs, suggesting that monocytes preferentially, but not exclusively, replenish this
population over the 6-week time course (Figure 2C).
To complement these parabiosis studies, we established bone marrow chimeras by lethally
irradiating wild-type CD45.2+ mice and adoptively transferring bone marrow cells from CD45.1+ wild-
type mice. Six weeks after transfer, more than 99% of the immune cells in the blood and the bone
marrow of KPC mice were CD45.1+ donor-derived (Figure 2D). Strikingly, despite potential
9
elimination of radio-sensitive tissue-resident macrophages and the influx of Ly6CHi monocytes
induced by irradiation, 30% of macrophages in the pancreas were host-derived (CD45.2+) (Figure
2D). In parallel, we lethally irradiated 3.5-month-old KPC mice at the PanIN stage, adoptively
transferred bone marrow cells from CD45.1+ wild-type mice, and analyzed chimerism 6 weeks later in
fully established PDAC. Similarly, a significant portion (>15%) of TAMs in KPC tumors were host-
derived, which contrasts with the >99% chimerism detected in circulating monocytes (Figure 2G).
These data confirmed the existence of pancreas-resident TAMs that were not rapidly replaced by
blood monocytes. Consistent with the results of the parabiosis studies, host-derived (CD45.2+)
macrophages were preferentially, but not exclusively, MHCIILow in both normal pancreas and KPC
tumor tissues (Figures 2E-F, 2H).
To further assess the short-term contribution of blood monocytes to TAM maintenance, we
used fluorescently labeled latex beads to selectively trace Ly6CHi blood monocytes in tumor-bearing
mice, and observed the fluorescent signals in the TAM compartments at 12, 24, 48, and 72 hours
after monocyte labeling (Figure S2C) (Tacke et al., 2006). While fluorescent beads labeled 25% of
blood monocytes within 24 hours, which is the peak time for fluorescence detection in blood (Tacke et
al., 2006), bead signal was observed in a negligible amount of macrophages (<0.5%) in normal
pancreas (Figure 2I), suggesting that the turnover of pancreas-resident macrophages relies
minimally on monocyte influx, at least short-term. In orthotopic PDAC, a significantly larger
percentage (12%) of TAMs were fluorescently labeled (Figure 2I), suggesting that tumors up-regulate
the recruitment of circulating Ly6CHi monocytes to replenish a portion of TAMs. Consistent with BMT
and parabiosis results, bead-labeled monocytes almost exclusively replenished the MHCIIHi TAM
subset (Figures 2J-K), and this replenishment persisted through 72 hours after bead injection
(Figure S2D).

10
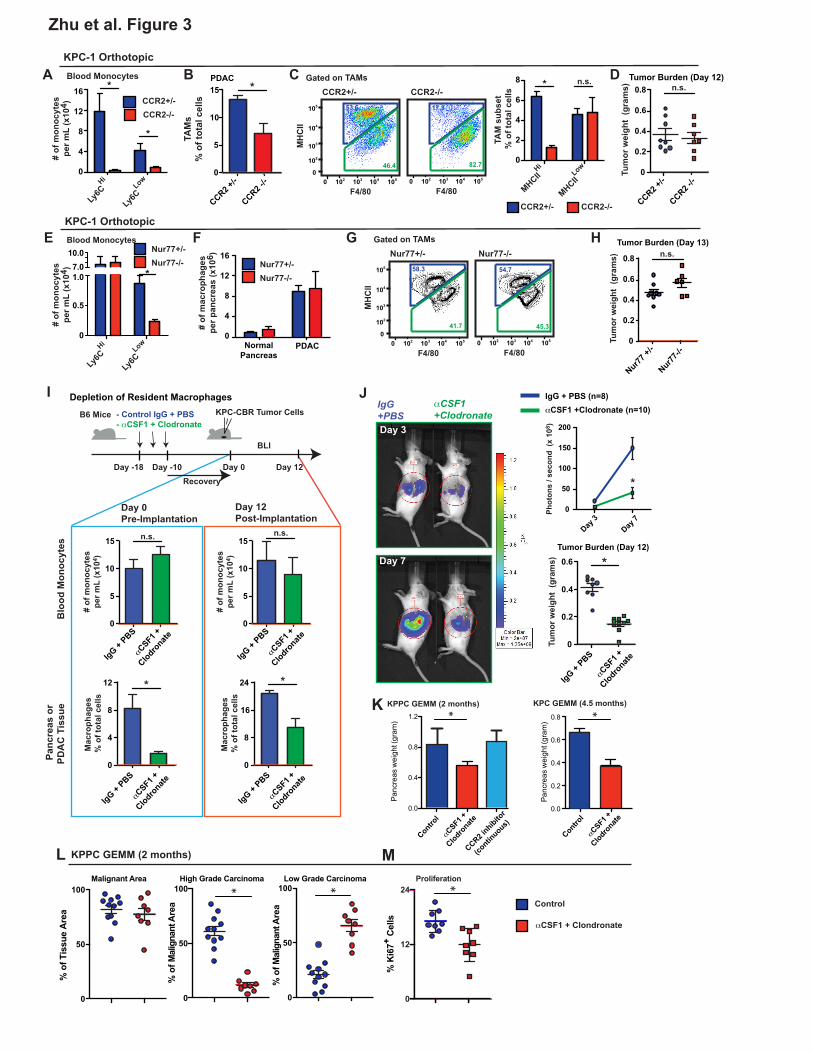
Impairment of Circulating Monocytes Alone Does Not Impact PDAC Progression
To determine the long-term contribution of blood monocytes to macrophages in the pancreas,
we evaluated pancreas and PDAC macrophages in CCR2- and Nur77-defficient mice, which have
impairments in circulating Ly6CHi and Ly6CLow monocytes, respectively (Hanna et al., 2011; Serbina
and Pamer, 2006). Despite >95% reduction in the number of circulating Ly6Chi monocytes (Figures
3A and S3A), the frequency of macrophages in steady-state pancreas was not changed in CCR2-
deficient mice (Figure S3B). Additionally, while in PDAC tumor-bearing CCR2-/- mice, circulating
Ly6CHi monocytes was still decreased by >95%, PDAC-infiltrating macrophages were decreased by
only 50% (Figures 3B and S3C). Consistent with the results of the monocyte labeling experiments,
CCR2 deficiency decreased MHCIIHi TAM frequency, while MHCIILow TAMs were not affected (Figure
3C). Surprisingly, while CCR2 deficiency did reduce macrophage numbers, this did not impact tumor
growth in two independent PDAC models (Figures 3D and S3D). Similar to these syngeneic PDAC
models, there were no changes in tumor burden in KPPC GEMMs treated with CCR2 inhibitors
continuously for 45 days (Figure 3K).
To address the possibility that Ly6CLow monocytes might contribute to macrophages in PDAC
tissues, we analyzed Nur77-/- mice. Similar to data from a previous reports (Hanna et al., 2011), we
observed a 75% decrease in circulating Ly6CLow monocyte numbers in Nur77-/- mice, compared to
Nur77+/- littermates (Figures 3E and S3A). However, neither macrophage numbers nor their MHCII-
subset distribution was changed in either normal pancreas or orthotopic PDAC tissues (Figures 3F-
G). Additionally, Nur77 deficiency did not impact PDAC tumor growth in three distinct orthotopic
PDAC models (Figures 3H and S4E). Together, these data suggest that circulating Ly6CHi
monocytes are important for sustaining MHCIIHi macrophages, but dispensable for tumor progression.

11
Tissue-Resident Macrophages Promote PDAC Progression
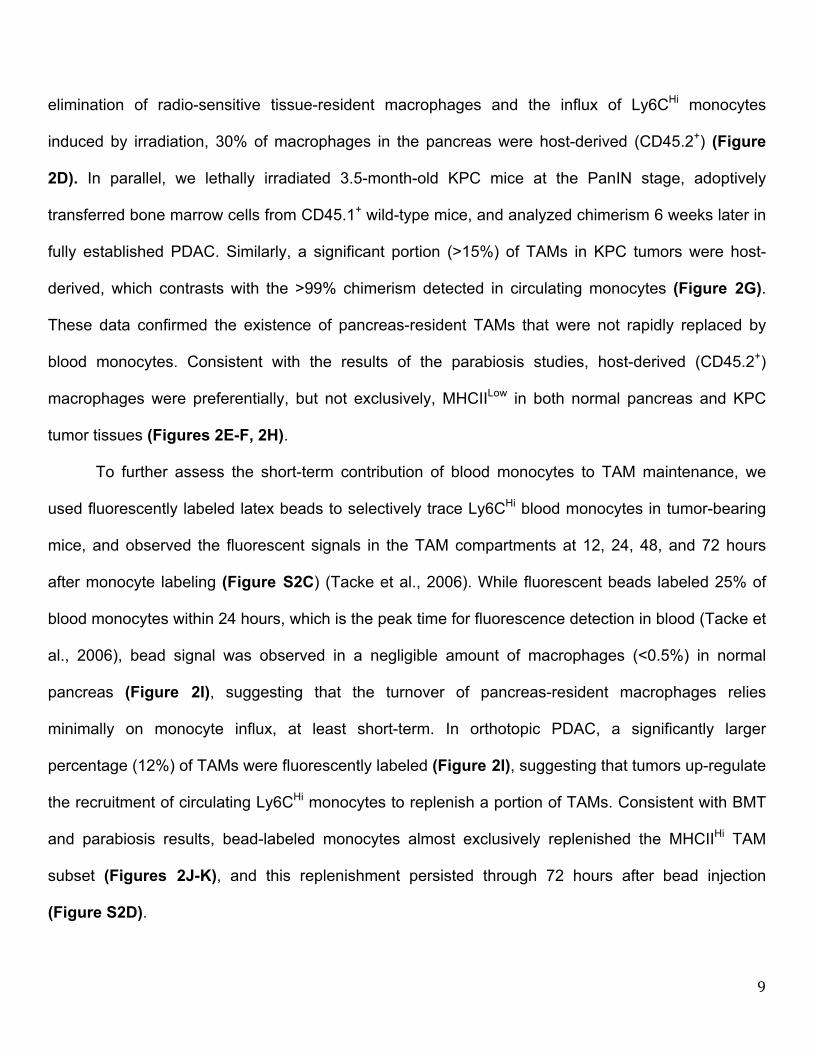
To determine whether tissue-resident macrophages regulate tumor growth, we treated tumor-
naïve mice with CSF1 neutralizing antibodies in combination with clodronate-loaded liposomes,
followed by a 10-day chase period to allow mice to recover circulating monocyte numbers. Following
the 10-day recovery, we found that circulating monocyte numbers in αCSF1/clodronate-treated
animals were restored to control/untreated levels (Figure 3I). By contrast, pancreas-resident
macrophages were depleted as early as 12 hours after injection and remained depleted by 85-95%
after 10 days of recovery (Figures 3I and S3F). These data suggest that this regimen could allow us
to test the impact of the loss of tissue-resident macrophages without decreasing circulating
inflammatory monocyte numbers. To study how loss of resident macrophages affects tumor
progression, we established orthotopic PDAC tumors 10 days after treatment with αCSF1/clodronate
or IgG/PBS. We found that loss of resident macrophages prior to tumor implantation resulted in a
50% reduction in TAMs in established tumors (Figures 3I and S3F). These data suggest that loss of
resident macrophages is not fully compensated for by monocyte-derived TAMs. In contrast to
observations in CCR2-null mice, depletion of pancreas-resident macrophages led to a significant
reduction in tumor burden, as measured by both bioluminescence imaging (BLI) and tumor wet-
weights (Figure 3J). These studies were repeated using two distinct KPC-derived PDAC models
(Figure S3G). To exclude the possibility that the impaired tumor progression was due to deficient
tumor “seeding” upon implantation, we treated two genetic PDAC models (KPC and KPPC mice) with
αCSF1/clodronate at the premalignant PanIN stage, and analyzed tumor burden after mice
developed fully established PDAC. In both KPC and KPPC models, depletion of resident
macrophages resulted in significant reduction in tumor burden (Figures 3K). By contrast, continuous
12
treatment of KPPC-mice with CCR2 inhibitors during the same time period, in spite of reducing
monocyte numbers, did not impact tumor burden (Figures 3K). More impressively, analysis of tumor
pathology in KPPC mice showed that in addition to reducing overall tumor burden, depletion of
resident macrophages dramatically reduced the development of high-grade invasive tumors, which
correlated with reduced PDAC cell proliferation (Figures 3L-M). Taken together, these data suggest
that pancreas-resident macrophages are more critical, compared to monocyte-derived TAMs, in
driving PDAC tumor progression.
Embryonically Derived Macrophages are Significant Components of Tissue-Resident
Macrophages and Expand During Tumor Progression
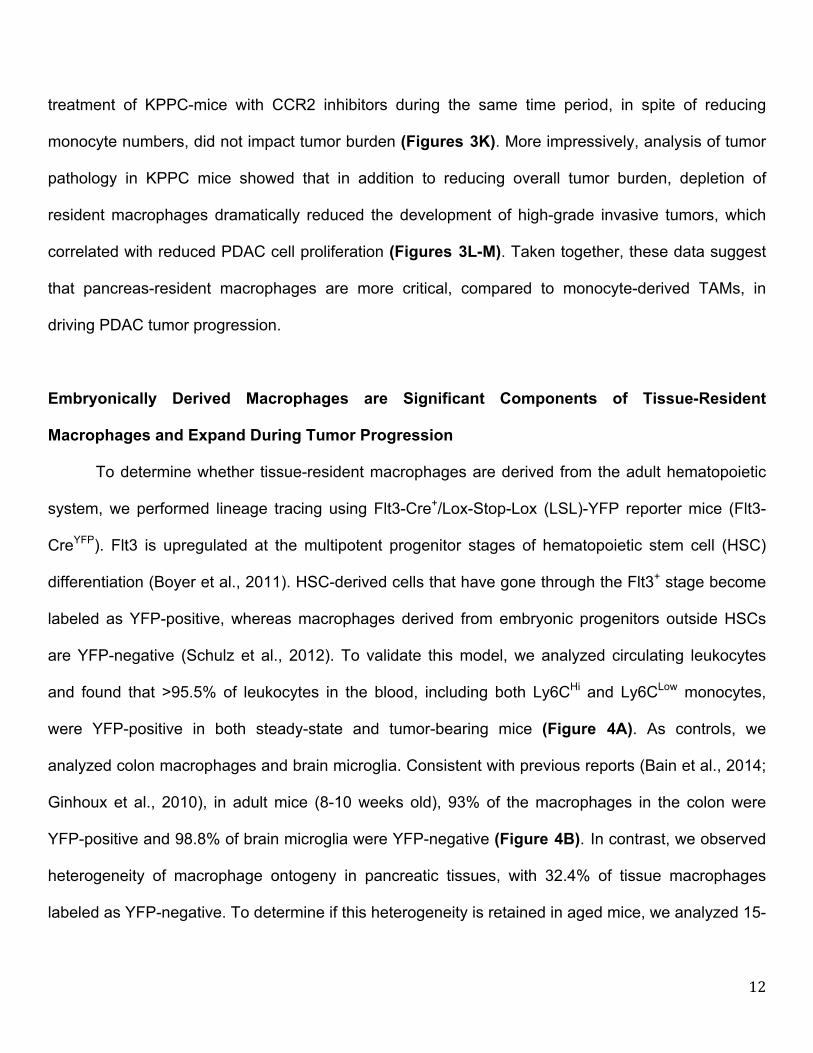
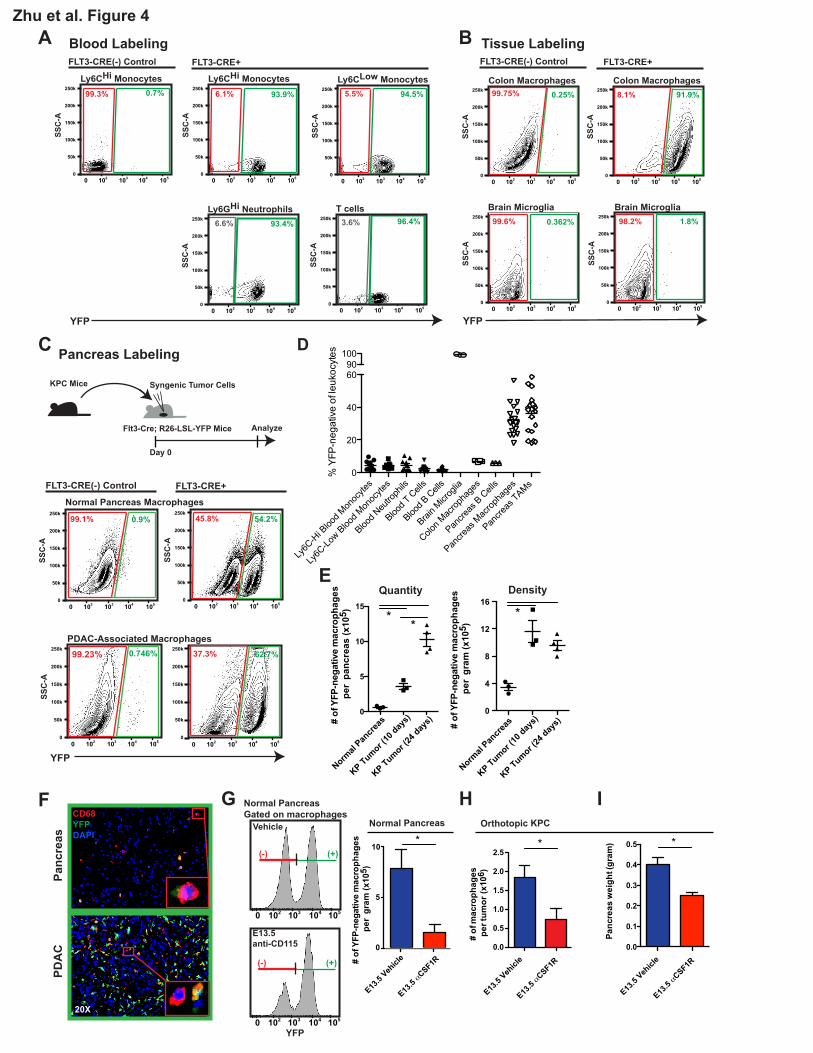
To determine whether tissue-resident macrophages are derived from the adult hematopoietic
system, we performed lineage tracing using Flt3-Cre+/Lox-Stop-Lox (LSL)-YFP reporter mice (Flt3-
CreYFP). Flt3 is upregulated at the multipotent progenitor stages of hematopoietic stem cell (HSC)
differentiation (Boyer et al., 2011). HSC-derived cells that have gone through the Flt3+ stage become
labeled as YFP-positive, whereas macrophages derived from embryonic progenitors outside HSCs
are YFP-negative (Schulz et al., 2012). To validate this model, we analyzed circulating leukocytes
and found that >95.5% of leukocytes in the blood, including both Ly6CHi and Ly6CLow monocytes,
were YFP-positive in both steady-state and tumor-bearing mice (Figure 4A). As controls, we
analyzed colon macrophages and brain microglia. Consistent with previous reports (Bain et al., 2014;
Ginhoux et al., 2010), in adult mice (8-10 weeks old), 93% of the macrophages in the colon were
YFP-positive and 98.8% of brain microglia were YFP-negative (Figure 4B). In contrast, we observed
heterogeneity of macrophage ontogeny in pancreatic tissues, with 32.4% of tissue macrophages
labeled as YFP-negative. To determine if this heterogeneity is retained in aged mice, we analyzed 15-

13
month-old Flt3-CreYFP reporter mice and found that 30% of the macrophages in the pancreas were
still YFP-negative (Figures S4A-B). These data suggest that embryonically derived pancreas-
resident macrophages persist with age.
To determine whether these YFP-negative macrophages persist during tumor progression, we
established orthotopic KPC tumors in Flt3-CreYFP reporter mice. Surprisingly, despite the known
contribution from circulating monocytes to the tumor macrophage pool, 35.4% of the macrophages in
these KPC tumors remained YFP-negative, similar to the frequency in normal pancreas (Figure 4C-
D). Even more strikingly, the number of YFP-negative macrophages was elevated by >29-fold in
tumors compared to normal pancreas (Figure 4E). Immunofluorescence analysis also identified clear
subsets of both YFP-positive and YFP-negative macrophages in normal pancreas and KPC-derived
tumors (Figure 4F). These data suggest that a significant portion of TAMs in PDAC tumors are
derived independently of the Flt3+ progenitors, and that these TAMs expand rapidly in number during
tumor progression.
The presence of large numbers of YFP-negative macrophages suggests that many TAMs
could be derived during embryonic hematopoiesis. Alternatively, these cells could have originated
from adult HSCs without going through extensive Flt3+ stages. To distinguish between these two
possibilities, we treated Flt3-CreYFP mice with one dose of a CSF1R antibody (αCSF1R) at 13.5 days
post coitum (E13.5) (Hoeffel et al., 2015) to deplete macrophages derived from embryonic sources.
We then quantified the abundance of YFP-negative macrophages in the pancreas of F1 progenies as
they reached 6 weeks of age. Treatment with αCSF1R on embryonic day E13.5 resulted in 80%
reduction in the density of YFP-negative macrophages in steady-state pancreas (Figure 4G). To
further confirm the contribution of embryonically derived macrophages to TAMs in PDAC, we
orthotopically implanted KPC tumor cells in adult mice following αCSF1R treatment on E13.5.

14
Embryonic αCSF1R treatment resulted in a 40-60% reduction in the number of macrophages in
established tumors (Figure 4H). Additionally, the loss of embryonically derived macrophages led to
delayed tumor progression in two distinct syngeneic PDAC models (Figure 4I). Taken together these
data suggest that embryonically derived macrophages facilitate PDAC progression.
To further assess the specific contribution of embryonic hematopoietic progenitors to PDAC
TAMs, we administered one dose of tamoxifen in Csf1r-mer-iCre-mer; Rosa26-LSL-tdTomato mice at
E8.5, E9.5, E10.5, E11.5, or E13.5 to span yolk sac and fetal liver stages. Using this model, we
observed that HSC-derived circulating monocytes were labeled at all time points later than E9.5
(Figures S5A-B). Using E8.5 or E9.5 tamoxifen pulsing, we observed labeling in 4% and 10% of
macrophages, respectively, in normal pancreas retained the label as mice reached 6 weeks of age
(Figures 5A-B). To confirm this, we used Cx3cr1-CreERT2; Rosa26-LSL-eYFP reporter mice. After
administration of tamoxifen on E13.5 at fetal liver stage, the majority of Ly6CHi monocytes are not
labeled (Yona et al., 2013), but we also observed significant labeling in pancreas tissue macrophages
(Figures S5C). To assess if the embryonically labeled macrophages would expand during tumor
progression, we established orthotopic Kras-INK (KI)-derived PDAC tumors in Csf1r-mer-iCre-mer/
LSL-tdTomato mice. Consistent with results in Flt3-Cre reporter mice, tdTomato+ macrophages
labeled with a tamoxifen pulse at E8.5 or E9.5 expanded in number by 6.8- or 13.5-fold, respectively,
during PDAC tumor progression (Figures 5C). These data suggest that yolk sac-derived
macrophages are a significant source of tissue-resident macrophages that undergo significant
numerical expansion during tumor progression.
In both CSF1R- and CX3CR1-driven lineage-tracing models, we observed higher levels of
labeling in the MHCIILow macrophage subset (Figures S5D-E). Similarly, in the Flt3-Cre reporter mice,
significantly larger portions of YFP-negative macrophages constitute the MHCIILow subset in both
15
normal pancreas and PDAC tissues (Figures S4C-D). These results further confirm that
embryonically derived macrophages are preferentially but not exclusively enriched in the MHCIILow
macrophages. Interestingly, we found that in both HSC-derived and embryonically derived TAMs, the
MHCIILow subset experiences higher levels of hypoxia. However, macrophage hypoxia level was
independent of origin (Figure S4E-F). These data suggest that macrophage origin might drive
intrinsic differences in macrophage phenotype and function that can be further molded by conditions
in the tumor microenvironment.
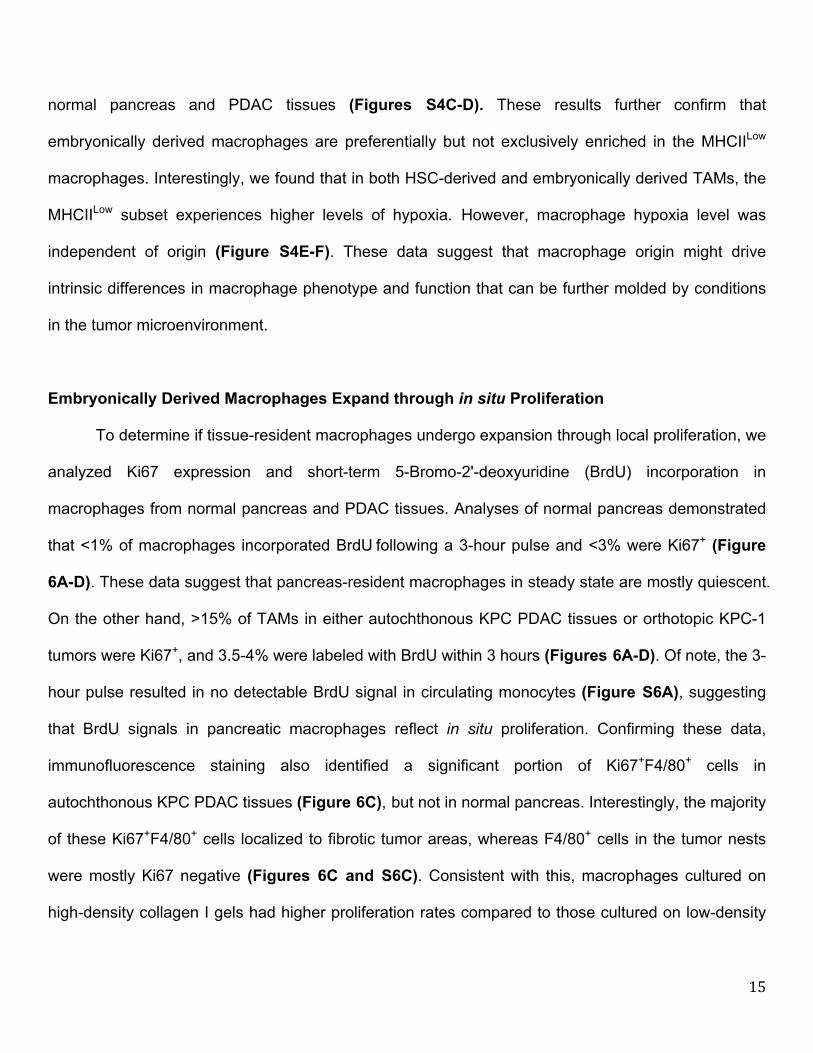
Embryonically Derived Macrophages Expand through in situ Proliferation
To determine if tissue-resident macrophages undergo expansion through local proliferation, we
analyzed Ki67 expression and short-term 5-Bromo-2'-deoxyuridine (BrdU) incorporation in
macrophages from normal pancreas and PDAC tissues. Analyses of normal pancreas demonstrated
that <1% of macrophages incorporated BrdU following a 3-hour pulse and <3% were Ki67+ (Figure
6A-D). These data suggest that pancreas-resident macrophages in steady state are mostly quiescent.
On the other hand, >15% of TAMs in either autochthonous KPC PDAC tissues or orthotopic KPC-1
tumors were Ki67+, and 3.5-4% were labeled with BrdU within 3 hours (Figures 6A-D). Of note, the 3-
hour pulse resulted in no detectable BrdU signal in circulating monocytes (Figure S6A), suggesting
that BrdU signals in pancreatic macrophages reflect in situ proliferation. Confirming these data,
immunofluorescence staining also identified a significant portion of Ki67+F4/80+ cells in
autochthonous KPC PDAC tissues (Figure 6C), but not in normal pancreas. Interestingly, the majority
of these Ki67+F4/80+ cells localized to fibrotic tumor areas, whereas F4/80+ cells in the tumor nests
were mostly Ki67 negative (Figures 6C and S6C). Consistent with this, macrophages cultured on
high-density collagen I gels had higher proliferation rates compared to those cultured on low-density

16
collagen (Figure S6D), suggesting that there may be cross talks between tumor fibrosis and
proliferative expansion of macrophages. Microarray analysis of TAMs from autochthonous KPC
tumors demonstrated distinct changes in cell cycle regulatory genes when compared to macrophages
in normal pancreas (Figure 6E). To assess if embryonically derived TAMs proliferate at higher rates
than HSC-derived TAMs, we stained for Ki67 in tumor-bearing Flt3-CreYFP mice. Embryonically
derived TAMs had a significantly higher frequency of Ki67 positivity than their HSC-derived
counterparts (Figure 6F). This increased level of Ki67 in embryonic TAMs was independent of their
MHCII status (Figure S6B). In addition, transcriptional profiling by Q-PCR also identified significantly
reduced level of genes that negatively regulate cell cycle progression, such as Mafb and c-Maf, but
higher levels of cell cycle promoting genes, such as Jun and Ets2, in the YFP-negative TAM subset
(Figure 6G). These data suggest that macrophages in PDAC tissues up-regulate proliferative
programs, perhaps in response to fibrosis, and that embryonically derived macrophages proliferate at
high levels to keep pace with tumor progression.
We next sought to identity what signals sustain the survival of these TAM subsets in PDAC
tissues. We took a targeted approach and treated orthotopic PDAC-bearing Flt3-CreYFP mice with
neutralizing antibodies against CSF1 and CSF2, both of which have been implicated in macrophage
survival in mouse models of cancer (Lavin et al., 2015; Zhu et al., 2014). Although CSF2 signal
blockade did not change the number of TAMs, inhibition of CSF1 signaling led to a 48% reduction in
the YFP-positive and a 75% reduction in the YFP-negative macrophages (Figure 6H). These data
suggest that CSF1 is important for the survival of both TAM subsets, but embryonically derived
macrophages are more sensitive.
Embryonically Derived TAMs Have a Distinct Pro-fibrotic Phenotype.

17
Having identified both embryonically derived and HSC-derived monocytes as sources of TAMs
in PDAC, we next asked whether distinct macrophage origins correlated with phenotypic differences.
Towards that end, we first performed flow cytometry analyses to compare the expression of a panel
of cell surface markers in TAM subsets using the Flt3-CreYFP mice. Both subsets expressed similar
levels of macrophage identity markers, including CD64, CD115, and F4/80, whereas YFP-negative
TAMs expressed lower levels of CD11b (Figures 7A and S7A), consistent with previous reports of
CD11b level in embryonically derived macrophages under homeostatic conditions (Schulz et al.,
2012). YFP-negative TAMs also expressed significantly lower levels of MHCI and MHCII (Figure 7A).
Similar differences were also seen between the two macrophage subsets in normal pancreas (Figure
S7B), which suggests possibly inherent differences in antigen presentation activities. By contrast, co-
stimulatory molecules (CD80, CD86), T cell-activating molecules (CD40), and immune checkpoint
molecules (PDL1, PDL2, PD1) were expressed at comparable levels (Figure 7A). Embryonically
derived TAMs also expressed significantly higher levels of CX3CR1 and lower levels of CD11a and
CD49d (Figures 7A and S7C). Interestingly, despite the lack of CXCR4 expression in either
macrophage subset in the normal pancreas, CXCR4 was significantly upregulated in TAMs, but only
in the YFP-negative population (Figure 7A and S7B). Taken together, these data suggest that TAMs
derived from different origins are phenotypically distinct.
To gain further insight into potential functional differences between embryonically derived and
HSC-derived macrophages, we performed transcriptional profiling on macrophages sorted from Flt3-
CreYFP mice (Figures 7B and S7D). Only a modest number of genes were expressed differentially
between the YFP-positive and YFP-negative macrophages in steady-state pancreas tissue. However,
660 genes were differentially expressed (>1.5 fold, p<0.05) between the two subsets in orthotopic
KPC tumors, suggesting that TAMs of different origins may have distinct functions in PDAC tumors.
18
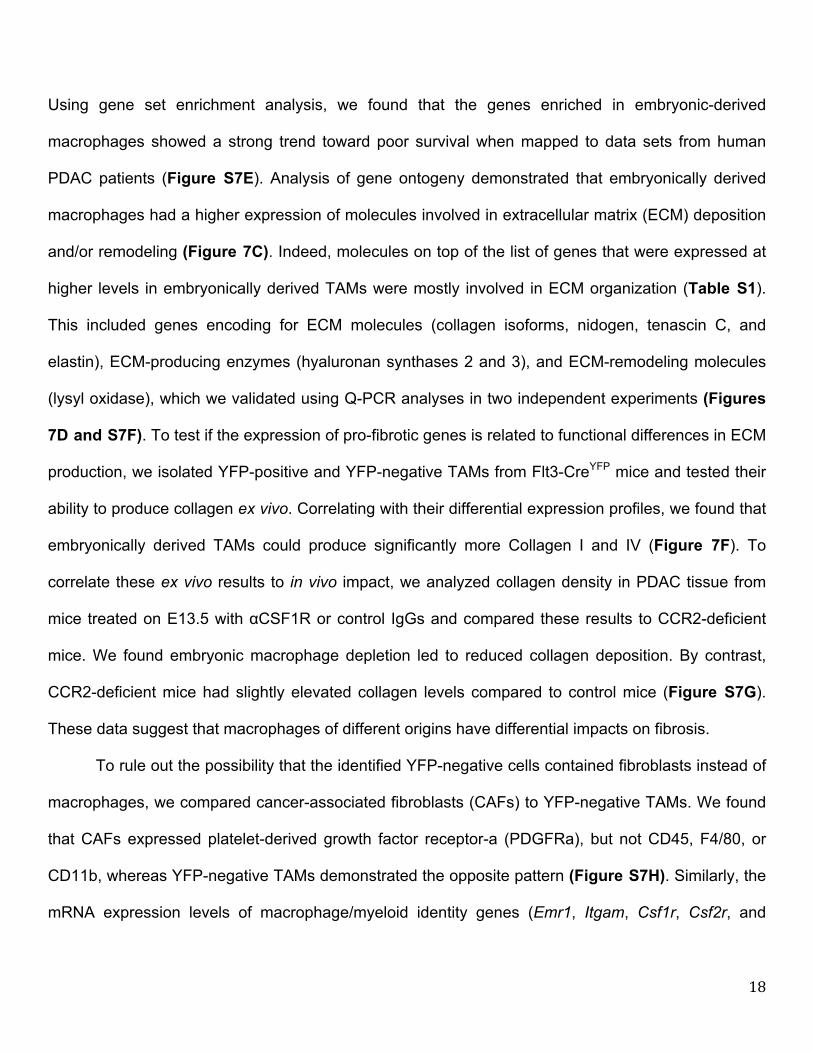
Using gene set enrichment analysis, we found that the genes enriched in embryonic-derived
macrophages showed a strong trend toward poor survival when mapped to data sets from human
PDAC patients (Figure S7E). Analysis of gene ontogeny demonstrated that embryonically derived
macrophages had a higher expression of molecules involved in extracellular matrix (ECM) deposition
and/or remodeling (Figure 7C). Indeed, molecules on top of the list of genes that were expressed at
higher levels in embryonically derived TAMs were mostly involved in ECM organization (Table S1).
This included genes encoding for ECM molecules (collagen isoforms, nidogen, tenascin C, and
elastin), ECM-producing enzymes (hyaluronan synthases 2 and 3), and ECM-remodeling molecules
(lysyl oxidase), which we validated using Q-PCR analyses in two independent experiments (Figures
7D and S7F). To test if the expression of pro-fibrotic genes is related to functional differences in ECM
production, we isolated YFP-positive and YFP-negative TAMs from Flt3-CreYFP mice and tested their
ability to produce collagen ex vivo. Correlating with their differential expression profiles, we found that
embryonically derived TAMs could produce significantly more Collagen I and IV (Figure 7F). To
correlate these ex vivo results to in vivo impact, we analyzed collagen density in PDAC tissue from
mice treated on E13.5 with αCSF1R or control IgGs and compared these results to CCR2-deficient
mice. We found embryonic macrophage depletion led to reduced collagen deposition. By contrast,
CCR2-deficient mice had slightly elevated collagen levels compared to control mice (Figure S7G).
These data suggest that macrophages of different origins have differential impacts on fibrosis.
To rule out the possibility that the identified YFP-negative cells contained fibroblasts instead of
macrophages, we compared cancer-associated fibroblasts (CAFs) to YFP-negative TAMs. We found
that CAFs expressed platelet-derived growth factor receptor-a (PDGFRa), but not CD45, F4/80, or
CD11b, whereas YFP-negative TAMs demonstrated the opposite pattern (Figure S7H). Similarly, the
mRNA expression levels of macrophage/myeloid identity genes (Emr1, Itgam, Csf1r, Csf2r, and

19
Cx3cr1) were comparable in both YFP-positive and YFP-negative TAMs, as determined by Q-PCR
analysis, and were 10- to 1000-fold higher in both subsets of TAMs as compared to CAFs (Figure
S7I). These data confirm that the YFP-negative cells were not fibroblasts but were a macrophage
subset with a unique pro-fibrotic phenotype. To evaluate how the pro-fibrotic gene signature in
embryonically derived TAMs differed from that in CAFs, we compared selected fibrosis genes by Q-
PCR. As expected, CAFs were the dominant producers of several isoforms of collagens (such as
Col1a2 and Col3a1), Elastin, and Sparc (Figure S7J). However, mRNA for other ECM molecules,
such as Col6a1, Nidogen, and Adamts12, were expressed at comparable levels. In contrast,
embryonically derived TAMs were the more dominant expressers of Col4a4, Col10a1, Col17a1,
Col18a1, and Has3 (Figure S7J). Taken together, these data suggest that embryonically derived
TAMs may be more involved in “fine-tuning” fibrotic responses in PDAC tumors.
In contrast to pro-fibrotic genes, the levels of mRNA involved in class I and class II antigen
presentations (Erap1, Psme1, and Ciita) were higher in HSC-derived TAMs (Figure 7E). To test the
antigen uptake capacity in TAMs subsets in vivo, we orthotopically implanted mCherry+ KPC-1 PDAC
cells and determined the mCherry positivity in TAMs. Although both TAM subsets demonstrated
potent capacity to uptake tumor antigen, the amount of antigen uptake was >2-fold higher in HSC-
derived TAMs compared to their embryonic counterparts (Figure 7G). We next tested the ability of
each TAM subset to present antigen (ovalbumin) to OT1+ CD8+ T cells and found that HSC-derived
(YFP+) TAMs were far more potent at antigen presentation compared to their embryonically derived
(YFP-) counterparts. In addition, HSC-derived TAMs expressed significantly higher levels of Il12a, Il4,
Ccl17, and Ifnb1 compared to their embryonic counterparts (Figure 7E). Taken together, these data
suggest that TAMs derived from HSCs and embryonic sources likely play more potent roles in
regulating adaptive immunity and/or driving immune tolerance. This is consistent with previous

20
reports showing that monocyte-derived TAMs regulate immunosuppression in PDAC models (Beatty
et al., 2015; Mitchem et al., 2013; Sanford et al., 2013) and in early phase clinical trials (Nywening et
al., 2016).
Subsets of TAMs in Human PDAC Tissue Resemble Murine Embryonically Derived TAMs
To address whether the identification and characterization of embryonic TAMs in murine PDAC
models is relevant for human cancer, we took advantage of the observation that CXCR4 was almost
exclusively upregulated in murine embryonic TAMs (Figure 7A). We first evaluated human PDAC
tissues for CXCR4+ TAMs and found that 10-40% of TAMs expressed high levels of CXCR4 (Figure
7I). We also noted that these CXCR4+ TAMs expressed lower levels of HLA-DR in eight out of nine
patients evaluated (Figure 7J). These results are consistent with our observation that CXCR4+ TAMs
of embryonic origin expressed lower levels of MHCII in murine PDAC models. To determine if this
subset of human PDAC TAMs shared the pro-fibrotic gene expression profile we identified in mice,
we isolated CXCR4-positive and negative TAMs from PDAC tissues from three untreated surgical
patients and performed Q-PCR analyses. Consistent with our animal model data, we found that
CXCR4+ TAMs expressed significantly higher levels of Collagens and ECM-modulating molecules
compared to their CXCR4-negative counterparts (Figure 7K). Collectively, these data suggest that
CXCR4+ TAMs in human PDAC resemble the ECM regulatory phenotype of murine embryonically
derived PDAC TAMs.
21
DISCUSSION
Ontological origins of tissue macrophages vary among different tissues under steady state.
With the exception of brain and intestine, many other organs contain macrophages of different origins
co-existing within the tissue context. Consistent with previous reports (Calderon et al., 2015), our
study demonstrated that pancreas-associated macrophages contain cells derived from both adult
HSCs and embryonic hematopoietic sources. The precise nature of embryonic hematopoietic
progenitors that gave rise to these macrophages needs to be defined; likely sources include yolk sac-
derived erythro-myeloid progenitors (EMPs) (Gomez Perdiguero et al., 2015) and EMP-derived fetal
monocytes (Hoeffel et al., 2015). The origin of HSC-derived macrophages in normal pancreas is also
unclear; possible sources include fetal liver HSCs and bone marrow HSC-derived monocytes that
may populate the pancreas perinatally. Regardless of developmental origin, significant portions of
macrophages in the pancreatic stroma are likely resident in the tissue without rapid replenishment
from circulating monocytes. The majority of pancreas-resident macrophages are quiescent under
steady state, suggesting that these cells may self-maintain through longevity. It is also important to
note that the ontogeny of tissue-resident macrophages is not static. Embryonically derived
macrophages in multiple organs have shown various degrees of replacement by monocytes with
different kinetics (Bain et al., 2016; Ginhoux and Guilliams, 2016; Molawi et al., 2014). Our study
using aged mice demonstrated that embryonically derived macrophages could persist long-term in
the pancreas, despite potential slow replacement by blood monocytes that we cannot rule out. It
remains to be seen if and to what extent could embryonically derived macrophages persist in aged
human patients.
Fates of tissue-resident macrophages vary under different pathological conditions. For
example, liver resident Kupffer cells undergo necroptosis during Listeria monocytogenes infection,

22
which recruits monocytes to replenish macrophages (Bleriot et al., 2015). On the other hand, tissue
macrophages undergo in situ proliferation during helminth infections (Jenkins et al., 2011). Very few
studies have looked at the fate of tissue-resident macrophages during cancer progression. One report
documented a loss of resident macrophages concomitant with the increase in monocyte-derived
TAMs in a breast cancer model (Franklin et al., 2014). On the other hand, microglia were shown to be
present in brain tumor models (Bowman et al., 2016; Hambardzumyan et al., 2016). Here, we
demonstrated that in PDAC, embryonically derived tissue-resident macrophages not only persisted in
the tissue, but also underwent significant proliferative expansion to keep pace with tumor progression.
TAMs in the PDAC tissues adopted a transcriptional program to enhance proliferation, and
embryonically derived tissue-resident macrophages further enhanced their proliferative programs
compared to the monocyte-derived counterparts. Of note, PDAC also upregulated the proliferation of
monocyte-derived macrophages, similar to what is seen in other cancers and tissue repair (Franklin
et al., 2014; Wang and Kubes, 2016); though their proliferative activities were less robust than those
in the embryonically derived macrophages. Factors that sustain and promote in situ proliferation in
different TAM subsets, as well as the cellular sources of these factors, have yet to be identified. It
also remains to been seen to what extent would these observations hold true in other tumors or if this
feature is enriched in PDAC due to its uniquely fibrotic nature. One tumor type of interest is
pancreatic neuroendocrine tumors (PNET), which originate from the islets of Langerhans. Under
steady state, macrophages in the pancreatic islets are maintained by blood monocytes, whereas
stromal macrophages are embryonically derived and locally maintained (Calderon et al., 2015). It
would be interestingly to see whether PNET contrasts with PDAC and relies on circulating monocytes
to sustain TAMs in-spite of residing in the same tissue. Answers to these questions could provide

23
insights into how we can therapeutically target TAM subset-specific pathways in order to restrain the
progression of different types of tumors even within the same organ.
A highly debated question regarding macrophage ontogeny is the functional differences
between macrophages derived from distinct origins that are located within the same tissue context.
This question remains largely unsolved. A limited number of transcriptional studies suggest that
macrophages of different ontogeny demonstrate mostly overlapping transcriptional profiles within the
same tissue, at least in non-disease settings (Gibbings et al., 2015; Gundra et al., 2014; van de Laar
et al., 2016). Upon engraftment, circulating monocytes could also replenish the resident macrophage
pool and adopt a transcriptional profile similar to their embryonically derived counterparts (Scott et al.,
2016). These studies led to the assumption that tissue environment, as opposed to ontogeny, is the
main driver of macrophage functions. Indeed, macrophages resident in different organs or at different
niches within the same organ have distinct transcriptional profiles, supporting the concept that tissue
environment could educate macrophages to adopt distinct functionalities (Gautier et al., 2012; Mass
et al., 2016; Movahedi et al., 2010b; Ojalvo et al., 2009). However, our microarray data demonstrated
that although gene expression profiles of embryonically derived and HSC-derived macrophages are
fairly similar in the normal pancreatic tissue, their expression profiles and ex vivo functions are very
distinct in PDAC tissues. As a harbinger of this dynamic, CXCR4 is largely not expressed in
macrophages of either origin in the normal pancreas, but specifically upregulated in PDAC TAMs of
embryonic origin. These data suggest that origin may epigenetically poise macrophages to
differentially respond to inflammatory insults with distinct bioactivities, such as ECM modulation or
antigen processing/presentation. Future experiments are needed to determine which lineage
commitment factors poise macrophages for differing functional responses during tumor progression.

24
Our studies also demonstrate unique fibrosis-modulating functions in embryonically derived
TAMs. Macrophages are well known for their ability to promote fibrosis in multiple physiological and
pathological conditions, such as wound healing and cancer (Wynn and Vannella, 2016). However,
such activities are thought to be indirectly executed by activating fibroblasts to lay down and remodel
ECM. Here, our data suggest that subsets of macrophages may fine-tune fibrosis by directly
depositing and/or remodeling the ECM. Fibrosis is a hallmark of PDAC, which imposes a major
physical barrier that not only inhibits endogenous anti-tumor immune responses but also deters
effective delivery of chemo- and immune-therapies (Beatty et al., 2011; Jiang et al., 2016). Although it
has been demonstrated that tumor-derived factors promote macrophage expansion and fibrosis, the
initiation of these two pathological features were considered to be independent of each other. Our
data suggest these responses may be more integrated. Corresponding with this idea, a recent report
demonstrated that TAMs directly construct ECM in colon cancer (Afik et al., 2016). Interestingly, such
activities were carried out by monocyte-derived TAMs in their model.
Strikingly, depletion of macrophage subsets had different impacts on tumor progression in
PDAC models. Loss of monocyte-derived macrophages had limited effects on tumor progression,
whereas depletion of tissue-resident macrophages significantly reduced tumor growth and
aggressivity/grade. These observations form a nice comparison to several other tumor models, where
the depletion of monocyte-derived macrophages inhibits tumor growth and metastasis (Afik et al.,
2016; Franklin et al., 2014; Qian et al., 2011). Although we cannot rule out the importance of
monocyte-derived TAMs in the regulation of PDAC development, our data suggest that tissue-
resident macrophages are important in PDAC progression.
In summary, our study demonstrates that PDAC contains macrophages with heterogeneous
ontological origins. In addition to Ly6CHi monocytes, tissue-resident macrophages derived from

25
embryonic origin are also a major source of TAMs in murine models. Embryonically derived
macrophages expand in PDAC tissues through in situ proliferation and exhibit a pro-fibrotic
transcriptional profile, suggesting a potential role in fine-tuning fibrosis in PDAC. We provide a new
paradigm of macrophage heterogeneity under the tumor setting, which may facilitate future
investigations that ultimately improve therapeutics to target the “fibro-inflammatory” microenvironment
of PDAC and potentially other cancers.

26
EXPERIMENTAL PROCEDURES
Murine PDAC Models
KPC mice (p48-CRE/Lox-stop-Lox(LSL)-KrasG12D/p53flox/+) used in these studies have been
previously described (Hingorani et al., 2005) and were backcrossed to C57BL/6 background and
screened for C57BL/6 identity using congenic markers. KPC-1 cell line was derived from PDAC
tissues of 2.2-month-old p48-CRE+/LSL-Lox KrasG12D/p53flox/flox (KPPC); the KPC-2 cell line was
derived from tumors of 6-month-old p48-CRE+/LSL-Lox KrasG12D/p53flox/+ (KPC) mice. Cells were
grown on collagen-coated tissue culture flasks for <12 passages, and were tested for cytokeratin-19,
smooth muscle actin, vimentin, and CD45 to verify their carcinoma identity and purity. To establish
orthotopic KPC models, either 50,000 or 200,000 KPC-1 or KPC-2 cells in 50 µL of Cultrex (Trevigen)
were injected into the pancreas of 6-12-week-old C57BL/6 mice according to published protocol (Kim
et al., 2009). For mCherry analyses or bioluminescence imaging (BLI), KPC-1 or KPC-2 cells were
infected with mCherry or click beetle red (CBR)-GFP vector respectively. mCherryhi or GFPhi cells
were selected by FACS prior to orthotopic implantation.
Labeling of Blood Ly6Chi Monocytes
To selectively label Ly6Chi monocytes, 250 uL of liposomes containing clodronate were injected
intraveneously (i.v.), followed by i.v. injection of 250 uL of FITC-conjugated plain microspheres 16-18
hours later (1.0 um, 2.5% solids [wt/vol]; Polysciences, diluted 1:4 in PBS). Tissues were processed
for flow cytometry analyses at indicated time points after bead injection.
Macrophage Depletion
27
To deplete tissue resident macrophages, 8-16-week old C57BL/6 mice were treated with 3 doses of
CSF1 neutralizing antibody (clone 5A1, BioXCell) (1 mg, 0.5 mg, 0.5 mg on Days -18, -14, and -11,
Figure 3) and 3 doses of clodronate-containing liposome (200 uL/each on Days -17, -13, and -10).
Control mice were treated with same doses/volume of IgG (clone HRPN, BioXCell) and liposome (or
phosphate buffered saline as indicated). On Day 0, Mice were implanted orthotopically with 200,000
CBR+ KPC-2 cells or 50,000 CBR+ KPC-1 cells, and subjected to BLI on Days 3 and 7.
Similarly, KPC and KPPC mice were treated with 2 doses of αCSF1 (0.5 mg each, Day 1 and Day 5)
and 2 doses of clodronate-loaded liposome (100 uL each, Day 3 and Day 7) starting at 2.5-month and
1-month of age, respectively. Tumor burden was analyzed when mice reached 4.5 months for KPC
mice or 2.0 months for KPPC mice.
To deplete embryonically derived macrophages, C57BL/6 or Flt3-CreYFP mice were intraperitoneally
injected with 3.0 mgs of CSF1R depleting antibody (AFS98 clone, BioXCell) on 13.5 dpc. Surviving
mice were implanted with 50,000 CBR+ KPC-1 at 6 weeks of age. Mice were sacrificed 12 days after
tumor establishment for flow cytometry and tumor burden analyses.
SUPPLEMENTAL INFORMATION
Supplemental Information includes seven figures, four tables, and Supplemental Experiment
Procedures.

28
AUTHOR CONTRIBUTIONS
D.G.D. and Y.Z. conceived the study. Y.Z., G.J.R., and D.G.D. designed experiments. Y.Z., J.M.H.,
D.K.S., K.W.K., B.L.K., C.Z., A.R.B., and D.G.D. performed experiments. Y.Z., J.M.H., C.Z., J.L.,
G.J.R., and D.G.D. analyzed data. D.R.C., K.J.L., R.C.F., W.G.H., and W.M.Y. provided advice and
resources. Y.Z. and D.G.D. wrote the manuscript with input from all authors.
ACKNOWLEDGEMENTS
The Authors acknowledges support from an AACR/PANCAN Award, NCI awards R01-CA177670,
R01-CA203890, P50-CA196510, T32CA009621, UL1TR000448, P30-CA91842 and the
BJCIH/Siteman Cancer Center Cancer Frontier Fund. Microarray analyses were performed by
Genome Technology Access Center at Washington University, funded partially by NCI Award P30-
CA91842 NCRR UL1RR024992. The authors also acknowledge Grant Gould and Hans Challen for
help on irradiation experiments, Liping Yang for help on parabiosis, and Daniel C. Link, Jason C. Mills,
Boris Calderon, and Jesse W. Williams for advice.

29
REFERENCES
Afik, R., Zigmond, E., Vugman, M., Klepfish, M., Shimshoni, E., Pasmanik-Chor, M., Shenoy, A., Bassat, E., Halpern, Z., Geiger, T., et al. (2016). Tumor macrophages are pivotal constructors of tumor collagenous matrix. The Journal of experimental medicine 213, 2315-2331. Amano, S.U., Cohen, J.L., Vangala, P., Tencerova, M., Nicoloro, S.M., Yawe, J.C., Shen, Y., Czech, M.P., and Aouadi, M. (2014). Local proliferation of macrophages contributes to obesity-associated adipose tissue inflammation. Cell Metab 19, 162-171. Bain, C.C., Bravo-Blas, A., Scott, C.L., Gomez Perdiguero, E., Geissmann, F., Henri, S., Malissen, B., Osborne, L.C., Artis, D., and Mowat, A.M. (2014). Constant replenishment from circulating monocytes maintains the macrophage pool in the intestine of adult mice. Nature immunology 15, 929-937. Bain, C.C., Hawley, C.A., Garner, H., Scott, C.L., Schridde, A., Steers, N.J., Mack, M., Joshi, A., Guilliams, M., Mowat, A.M., et al. (2016). Long-lived self-renewing bone marrow-derived macrophages displace embryo-derived cells to inhabit adult serous cavities. Nature communications 7, ncomms11852. Balaz, P., Friess, H., Kondo, Y., Zhu, Z., Zimmermann, A., and Buchler, M.W. (2002). Human macrophage metalloelastase worsens the prognosis of pancreatic cancer. Ann Surg 235, 519-527. Beatty, G.L., Chiorean, E.G., Fishman, M.P., Saboury, B., Teitelbaum, U.R., Sun, W., Huhn, R.D., Song, W., Li, D., Sharp, L.L., et al. (2011). CD40 agonists alter tumor stroma and show efficacy against pancreatic carcinoma in mice and humans. Science 331, 1612-1616. Beatty, G.L., Winograd, R., Evans, R.A., Long, K.B., Luque, S.L., Lee, J.W., Clendenin, C., Gladney, W.L., Knoblock, D.M., Guirnalda, P.D., et al. (2015). Exclusion of T Cells From Pancreatic Carcinomas in Mice Is Regulated by Ly6C(low) F4/80(+) Extratumoral Macrophages. Gastroenterology 149, 201-210. Biswas, S.K., and Mantovani, A. (2010). Macrophage plasticity and interaction with lymphocyte subsets: cancer as a paradigm. Nature immunology 11, 889-896. Bleriot, C., Dupuis, T., Jouvion, G., Eberl, G., Disson, O., and Lecuit, M. (2015). Liver-resident macrophage necroptosis orchestrates type 1 microbicidal inflammation and type-2-mediated tissue repair during bacterial infection. Immunity 42, 145-158. Bowman, R.L., Klemm, F., Akkari, L., Pyonteck, S.M., Sevenich, L., Quail, D.F., Dhara, S., Simpson, K., Gardner, E.E., Iacobuzio-Donahue, C.A., et al. (2016). Macrophage Ontogeny Underlies Differences in Tumor-Specific Education in Brain Malignancies. Cell reports 17, 2445-2459. Boyer, S.W., Schroeder, A.V., Smith-Berdan, S., and Forsberg, E.C. (2011). All hematopoietic cells develop from hematopoietic stem cells through Flk2/Flt3-positive progenitor cells. Cell Stem Cell 9, 64-73. Calderon, B., Carrero, J.A., Ferris, S.T., Sojka, D.K., Moore, L., Epelman, S., Murphy, K.M., Yokoyama, W.M., Randolph, G.J., and Unanue, E.R. (2015). The pancreas anatomy conditions the origin and properties of resident macrophages. The Journal of experimental medicine 212, 1497-1512. Campbell, M.J., Tonlaar, N.Y., Garwood, E.R., Huo, D., Moore, D.H., Khramtsov, A.I., Au, A., Baehner, F., Chen, Y., Malaka, D.O., et al. (2010). Proliferating macrophages associated with high grade, hormone receptor negative breast cancer and poor clinical outcome. Breast Cancer Res Treat. Cortez-Retamozo, V., Etzrodt, M., Newton, A., Ryan, R., Pucci, F., Sio, S.W., Kuswanto, W., Rauch, P.J., Chudnovskiy, A., Iwamoto, Y., et al. (2013). Angiotensin II drives the production of tumor-promoting macrophages. Immunity 38, 296-308. Epelman, S., Lavine, K.J., Beaudin, A.E., Sojka, D.K., Carrero, J.A., Calderon, B., Brija, T., Gautier, E.L., Ivanov, S., Satpathy, A.T., et al. (2014). Embryonic and adult-derived resident cardiac

30
macrophages are maintained through distinct mechanisms at steady state and during inflammation. Immunity 40, 91-104. Franklin, R.A., and Li, M.O. (2016). Ontogeny of Tumor-associated Macrophages and Its Implication in Cancer Regulation. Trends Cancer 2, 20-34. Franklin, R.A., Liao, W., Sarkar, A., Kim, M.V., Bivona, M.R., Liu, K., Pamer, E.G., and Li, M.O. (2014). The cellular and molecular origin of tumor-associated macrophages. Science 344, 921-925. Gautier, E.L., Shay, T., Miller, J., Greter, M., Jakubzick, C., Ivanov, S., Helft, J., Chow, A., Elpek, K.G., Gordonov, S., et al. (2012). Gene-expression profiles and transcriptional regulatory pathways that underlie the identity and diversity of mouse tissue macrophages. Nature immunology 13, 1118-1128. Gibbings, S.L., Goyal, R., Desch, A.N., Leach, S.M., Prabagar, M., Atif, S.M., Bratton, D.L., Janssen, W., and Jakubzick, C.V. (2015). Transcriptome analysis highlights the conserved difference between embryonic and postnatal-derived alveolar macrophages. Blood 126, 1357-1366. Ginhoux, F., Greter, M., Leboeuf, M., Nandi, S., See, P., Gokhan, S., Mehler, M.F., Conway, S.J., Ng, L.G., Stanley, E.R., et al. (2010). Fate mapping analysis reveals that adult microglia derive from primitive macrophages. Science 330, 841-845. Ginhoux, F., and Guilliams, M. (2016). Tissue-Resident Macrophage Ontogeny and Homeostasis. Immunity 44, 439-449. Gomez Perdiguero, E., Klapproth, K., Schulz, C., Busch, K., Azzoni, E., Crozet, L., Garner, H., Trouillet, C., de Bruijn, M.F., Geissmann, F., et al. (2015). Tissue-resident macrophages originate from yolk-sac-derived erythro-myeloid progenitors. Nature 518, 547-551. Gundra, U.M., Girgis, N.M., Ruckerl, D., Jenkins, S., Ward, L.N., Kurtz, Z.D., Wiens, K.E., Tang, M.S., Basu-Roy, U., Mansukhani, A., et al. (2014). Alternatively activated macrophages derived from monocytes and tissue macrophages are phenotypically and functionally distinct. Blood 123, e110-122. Hambardzumyan, D., Gutmann, D.H., and Kettenmann, H. (2016). The role of microglia and macrophages in glioma maintenance and progression. Nature neuroscience 19, 20-27. Hanna, R.N., Carlin, L.M., Hubbeling, H.G., Nackiewicz, D., Green, A.M., Punt, J.A., Geissmann, F., and Hedrick, C.C. (2011). The transcription factor NR4A1 (Nur77) controls bone marrow differentiation and the survival of Ly6C- monocytes. Nature immunology 12, 778-785. Hashimoto, D., Chow, A., Noizat, C., Teo, P., Beasley, M.B., Leboeuf, M., Becker, C.D., See, P., Price, J., Lucas, D., et al. (2013). Tissue-resident macrophages self-maintain locally throughout adult life with minimal contribution from circulating monocytes. Immunity 38, 792-804. Hingorani, S.R., Wang, L., Multani, A.S., Combs, C., Deramaudt, T.B., Hruban, R.H., Rustgi, A.K., Chang, S., and Tuveson, D.A. (2005). Trp53R172H and KrasG12D cooperate to promote chromosomal instability and widely metastatic pancreatic ductal adenocarcinoma in mice. Cancer cell 7, 469-483. Hoeffel, G., Chen, J., Lavin, Y., Low, D., Almeida, F.F., See, P., Beaudin, A.E., Lum, J., Low, I., Forsberg, E.C., et al. (2015). C-Myb(+) erythro-myeloid progenitor-derived fetal monocytes give rise to adult tissue-resident macrophages. Immunity 42, 665-678. Ino, Y., Yamazaki-Itoh, R., Shimada, K., Iwasaki, M., Kosuge, T., Kanai, Y., and Hiraoka, N. (2013). Immune cell infiltration as an indicator of the immune microenvironment of pancreatic cancer. Br J Cancer 108, 914-923. Jenkins, S.J., Ruckerl, D., Cook, P.C., Jones, L.H., Finkelman, F.D., van Rooijen, N., MacDonald, A.S., and Allen, J.E. (2011). Local macrophage proliferation, rather than recruitment from the blood, is a signature of TH2 inflammation. Science 332, 1284-1288.

31
Jiang, H., Hegde, S., Knolhoff, B., Zhu, Y., Meyers, M., Herndon, J., Nywening, T., Hawkins, W.G., Shapiro, I., Weaver, D., et al. (2016). Targeting Focal Adhesion Kinase Renders Pancreatic Cancers Responsive to Checkpoint Immunotherapy. Nature Medicine. Kim, M.P., Evans, D.B., Wang, H., Abbruzzese, J.L., Fleming, J.B., and Gallick, G.E. (2009). Generation of orthotopic and heterotopic human pancreatic cancer xenografts in immunodeficient mice. Nat Protoc 4, 1670-1680. Kurahara, H., Shinchi, H., Mataki, Y., Maemura, K., Noma, H., Kubo, F., Sakoda, M., Ueno, S., Natsugoe, S., and Takao, S. (2011). Significance of M2-polarized tumor-associated macrophage in pancreatic cancer. J Surg Res 167, e211-219. Laoui, D., Van Overmeire, E., Di Conza, G., Aldeni, C., Keirsse, J., Morias, Y., Movahedi, K., Houbracken, I., Schouppe, E., Elkrim, Y., et al. (2014). Tumor hypoxia does not drive differentiation of tumor-associated macrophages but rather fine-tunes the M2-like macrophage population. Cancer Res 74, 24-30. Lavin, Y., Mortha, A., Rahman, A., and Merad, M. (2015). Regulation of macrophage development and function in peripheral tissues. Nature reviews Immunology 15, 731-744. Mantovani, A., Vecchi, A., and Allavena, P. (2014). Pharmacological modulation of monocytes and macrophages. Current opinion in pharmacology 17, 38-44. Mass, E., Ballesteros, I., Farlik, M., Halbritter, F., Gunther, P., Crozet, L., Jacome-Galarza, C.E., Handler, K., Klughammer, J., Kobayashi, Y., et al. (2016). Specification of tissue-resident macrophages during organogenesis. Science 353. Mitchem, J.B., Brennan, D.J., Knolhoff, B.L., Belt, B.A., Zhu, Y., Sanford, D.E., Belaygorod, L., Carpenter, D., Collins, L., Piwnica-Worms, D., et al. (2013). Targeting Tumor-Infiltrating Macrophages Decreases Tumor-Initiating Cells, Relieves Immunosuppression, and Improves Chemotherapeutic Responses. Cancer Res. Molawi, K., Wolf, Y., Kandalla, P.K., Favret, J., Hagemeyer, N., Frenzel, K., Pinto, A.R., Klapproth, K., Henri, S., Malissen, B., et al. (2014). Progressive replacement of embryo-derived cardiac macrophages with age. The Journal of experimental medicine 211, 2151-2158. Movahedi, K., Laoui, D., Gysemans, C., Baeten, M., Stange, G., Van den Bossche, J., Mack, M., Pipeleers, D., In't Veld, P., De Baetselier, P., et al. (2010a). Different tumor microenvironments contain functionally distinct subsets of macrophages derived from Ly6C(high) monocytes. Cancer research 70, 5728-5739. Movahedi, K., Laoui, D., Gysemans, C., Baeten, M., Stange, G., Van den Bossche, J., Mack, M., Pipeleers, D., In't Veld, P., De Baetselier, P., et al. (2010b). Different tumor microenvironments contain functionally distinct subsets of macrophages derived from Ly6C(high) monocytes. Cancer Res 70, 5728-5739. Noy, R., and Pollard, J.W. (2014). Tumor-associated macrophages: from mechanisms to therapy. Immunity 41, 49-61. Nywening, T.M., Wang-Gillam, A., Sanford, D.E., Belt, B.A., Panni, R.Z., Cusworth, B.M., Toriola, A.T., Nieman, R.K., Worley, L.A., Yano, M., et al. (2016). Targeting tumour-associated macrophages with CCR2 inhibition in combination with FOLFIRINOX in patients with borderline resectable and locally advanced pancreatic cancer: a single-centre, open-label, dose-finding, non-randomised, phase 1b trial. Lancet Oncol. Ojalvo, L.S., King, W., Cox, D., and Pollard, J.W. (2009). High-density gene expression analysis of tumor-associated macrophages from mouse mammary tumors. The American journal of pathology 174, 1048-1064.

32
Perdiguero, E.G., and Geissmann, F. (2016). The development and maintenance of resident macrophages. Nature immunology 17, 2-8. Qian, B.Z., Li, J., Zhang, H., Kitamura, T., Zhang, J., Campion, L.R., Kaiser, E.A., Snyder, L.A., and Pollard, J.W. (2011). CCL2 recruits inflammatory monocytes to facilitate breast-tumour metastasis. Nature 475, 222-225. Ruffell, B., and Coussens, L.M. (2015). Macrophages and therapeutic resistance in cancer. Cancer cell 27, 462-472. Sanford, D.E., Belt, B.A., Panni, R.Z., Mayer, A.B., Deshpande, A.D., Carpenter, D., Mitchem, J.B., Plambeck-Suess, S., Worley, L.A., Goetz, B.D., et al. (2013). Inflammatory Monocyte Mobilization Decreases Patient Survival in Pancreatic Cancer: a Role for Targeting the CCL2/CCR2 Axis. Clin Cancer Res. Satpathy, A.T., Kc, W., Albring, J.C., Edelson, B.T., Kretzer, N.M., Bhattacharya, D., Murphy, T.L., and Murphy, K.M. (2012). Zbtb46 expression distinguishes classical dendritic cells and their committed progenitors from other immune lineages. The Journal of experimental medicine 209, 1135-1152. Schulz, C., Gomez Perdiguero, E., Chorro, L., Szabo-Rogers, H., Cagnard, N., Kierdorf, K., Prinz, M., Wu, B., Jacobsen, S.E., Pollard, J.W., et al. (2012). A lineage of myeloid cells independent of Myb and hematopoietic stem cells. Science 336, 86-90. Scott, C.L., Zheng, F., De Baetselier, P., Martens, L., Saeys, Y., De Prijck, S., Lippens, S., Abels, C., Schoonooghe, S., Raes, G., et al. (2016). Bone marrow-derived monocytes give rise to self-renewing and fully differentiated Kupffer cells. Nature communications 7, 10321. Serbina, N.V., and Pamer, E.G. (2006). Monocyte emigration from bone marrow during bacterial infection requires signals mediated by chemokine receptor CCR2. Nature immunology 7, 311-317. Tacke, F., Ginhoux, F., Jakubzick, C., van Rooijen, N., Merad, M., and Randolph, G.J. (2006). Immature monocytes acquire antigens from other cells in the bone marrow and present them to T cells after maturing in the periphery. The Journal of experimental medicine 203, 583-597. van de Laar, L., Saelens, W., De Prijck, S., Martens, L., Scott, C.L., Van Isterdael, G., Hoffmann, E., Beyaert, R., Saeys, Y., Lambrecht, B.N., et al. (2016). Yolk Sac Macrophages, Fetal Liver, and Adult Monocytes Can Colonize an Empty Niche and Develop into Functional Tissue-Resident Macrophages. Immunity 44, 755-768. Varol, C., Mildner, A., and Jung, S. (2015). Macrophages: development and tissue specialization. Annu Rev Immunol 33, 643-675. Wang, J., and Kubes, P. (2016). A Reservoir of Mature Cavity Macrophages that Can Rapidly Invade Visceral Organs to Affect Tissue Repair. Cell 165, 668-678. Wynn, T.A., and Vannella, K.M. (2016). Macrophages in Tissue Repair, Regeneration, and Fibrosis. Immunity 44, 450-462. Yona, S., Kim, K.W., Wolf, Y., Mildner, A., Varol, D., Breker, M., Strauss-Ayali, D., Viukov, S., Guilliams, M., Misharin, A., et al. (2013). Fate mapping reveals origins and dynamics of monocytes and tissue macrophages under homeostasis. Immunity 38, 79-91. Zhu, Y., Knolhoff, B.L., Meyer, M.A., Nywening, T.M., West, B.L., Luo, J., Wang-Gillam, A., Goedegebuure, S.P., Linehan, D.C., and DeNardo, D.G. (2014). CSF1/CSF1R Blockade Reprograms Tumor-Infiltrating Macrophages and Improves Response to T Cell Checkpoint Immunotherapy in Pancreatic Cancer Models. Cancer Res.

102 103 104 1050
50k
100k
150k
250k
0
200k
SSC
-A
CD45102 103 104 1050
50k
100k
150k
250k
0
200k
SSC
-A
CD11b102 103 104 1050
50k
100k
150k
250k
0
200k
SSC
-A
Ly6G102 103 104 1050
50k
100k
150k
250k
0
200k
SSC
-A
Ly6C102 103 104 1050
102
103
104
105
0
F4/80
MH
CII
D
C
GF
A
_______Isotype Control or Gentic Control_______Antibody Stained
Adjacent Normal Pancreas PDAC
Gated on live single cells
2x
KPC GEMMPanIN PDAC
Siru
s R
ed
20x
Human PDAC
0
2
4
6
0
6
12
# of
mac
roph
ages
per
pa
ncre
as (x
106 )
Day 0
Day 7
Day 12
Day 16
0
2
4
6
Adjacent Norm
al
Pancreas PDAC
4
3
2
1
0
CD
68+
area
%
of t
otal
tiss
ue
2x
Siru
s R
ed
102 103 104 1050CD68
102 103 104 1050MerTK
102 103 104 1050CD64
102 103 104 1050CD115
102 103 104 1050Siglec F
102 103 104 1050CD206
102 103 104 1050CX3CR1
EGated on CD45+CD3-CD19-CD11b+Ly6G-Ly6CLow/-F4/80+MHCII+
CD
68 P
anK
DA
PI
*
20x
20x
20x
Zhu et al. Figure 1
Normal Pancreas
F4/8
0 Pa
nK D
API
KPC GEMM KPC Orthotopic Model
# of
mac
roph
ages
per
gra
m o
f tis
sue
(x 1
06 )
Normal
PancreasPDAC
Normal
PancreasPDAC
# of
mac
roph
ages
per
pa
ncre
as (x
106 )
* * *
20x
20x
20x 20x
20x 20x
PDAC
CD
163
PanK
DA
PIC
D20
6 Pa
nK D
API
20x
20x
BHuman PDAC
102 103 104 1050
50k
100k
150k
250k
0
200k
SSC
-A
Dump(CD3/CD19)
102 103 104 1050Zbtb46-GFP

0
25
50
100
A
G IH
102 103 104 1050
MH
CII
Beads+ TAMs
F4/80
102
103
104
0
105
Total TAMs
102 103 104 1050
MH
CII
Total TAMs
F4/80
102
103
104
0
105
102 103 104 1050
MH
CII
Overlay
F4/80
102
103
104
0
105
Beads-FITC102 103 104 1050
50k
100k
150k
0
200k
SSC
-A
250k
J
C
102 103 104 1050C
D45
.2
Tumor Monocytes
CD45.1
102
103
104
0
105 72.5%
27.5%
102 103 104 1050
CD
45.2
PDAC Macrophages
CD45.1
102
103
104
0
105 89.7%
10.3%102 103 104 1050
CD
45.2
Normal Pancreas Macrophages
CD45.1
102
103
104
0
105 99.0%
0.9%
102 103 104 1050
CD
45.2
Blood Ly6CHi Monocytes
CD45.1
102
103
104
0
105
30.5%
69.5%B
0
12
24
36
Blood Ly6CHi
Monocytes
0
12
24
36
Zhu et al. Figure 2KPC GEMM- Parabiosis
KPC GEMM- BMT
KPC Orthotopic Model- Beads Labeling
Tissue Macrophages
PDACTAMs
PancreasMacrophages
BrainMicroglia
Blood Ly6CHi
Monocytes
Chi
mer
ism
(% n
on H
ost-d
eriv
ed)
2-weeks
6-weeks
MHCIIHi
MHCIILow%
of C
D45
.1+ C
D45
.2(-)
TA
Ms
(non
hos
t-der
ived
)
Tumor Macrophage Subsets(6 Weeks of Parabiosis)
*
KPC Orthotopic Model- Beads LabelingPDAC Tumor BearingTumor Naive
PDAC
Macro
phage
Blood Ly6CHi
Monocytes Pan
creas
Macro
phage
0
12
24
36
% B
eads
+ of C
ell T
ype
% B
eads
+ of
Cel
l Typ
e
0
50
100
% o
f Bea
ds+ T
AM
s
MHCIIHi
MHCIILow
0
12
24
% C
D45
.2+ /C
D45
.1(-)
o
f TA
M s
ubse
t(H
ost-d
eriv
ed)
MHCIIHi
MHCIILow
0
10
20
% C
D45
.2+ /C
D45
.1(-)
(Hos
t-der
ived
)BM Ly
6CHi
Monocytes
Blood Ly6C
Hi
Monocytes PDAC
Macro
phages
K
***
75
CD45.2+ KPC Mice
CD45.1+ Mice
BMT
*
DTumor Naive - BMT
MHCII-Hi
MHCII-Low
0
20
40
60
80
% C
D45
.2+/
CD
45.1
(-)O
f mac
roph
age
subs
et(H
ost-d
eriv
ed)
*
102 103 104 1050
MH
CII
Donor-Derived
F4/80
102
103
104
0
105
E
102 103 104 1050M
HC
II
Host-Derived
F4/80
102
103
104
0
105
F
102 103 104 1050
MH
CII
Overlay
F4/80
102
103
104
0
105
Blood L
y6C-H
i
Monoc
ytes
Brain M
icrog
lia
Liver
Kupffe
r Cell
s
Pancre
as
Macrop
hage
s0
10
20
30
4090
100
% C
D45
.2+/
CD
45.1
-(-)
(Hos
t-der
ived
)
Zhu et al. Figure 3
IIgG +PBS
αCSF1 +Clodronate
Day 3
Day 7
0
50
100
150
200
Day 0
KPC-CBR Tumor Cells
Day 12
B6 Mice - Control IgG + PBS- αCSF1 + Clodronate
Day -10Day -18
BLI
Recovery
Blo
od M
onoc
ytes
Pan
crea
s or
PD
AC
Tis
sue
JDepletion of Resident Macrophages
Day 0Pre-Implantation
Day 12Post-Implantation
C
102 103 104 1050
MH
CII
CCR2+/-
F4/80
102
103
104
0
105
102 103 104 1050
CCR2-/-
F4/80
F H
0
2
4
6
8Gated on TAMsA B D
E
CCR2 +/-
0
0.4
0.8
Tum
or w
eigh
t (g
ram
s)
CCR2 -/-
n.s.
KPC-1 Orthotopic
TAM
sub
set
% o
f tot
al c
ells
MHCIIHi
MHCIILow
CCR2+/- CCR2-/-
n.s.*
0.6
0.2
Nur77 +/
-0
0.4
0.8
Tum
or w
eigh
t (g
ram
s)
Nur77-/-
n.s.
0.6
0.2
Tumor Burden (Day 12)
Tumor Burden (Day 13)
CCR2 +/-
0
15
CCR2 -/-
*
5
IgG + PBS
0
0.2
0.6Tu
mor
wei
ght
(gra
ms)
αCSF1 +
Clodronate
*
0.4
Tumor Burden (Day 12)
Blood Monocytes
0
4
8
12
16Ly
6CHi
Ly6C
Low
CCR2+/-CCR2-/-
*
# of
mon
ocyt
espe
r mL
(x10
4 )
*
Blood Monocytes
Ly6C
Hi
Ly6C
Low
Nur77+/-Nur77-/-
*
0
0.5
1.07.0
10.0
Phot
ons
/ sec
ond
(x 1
08)
*
Day 3
Day 7
IgG + PBS (n=8)αCSF1 +Clodronate (n=10)
0
12
8
4
Mac
roph
ages
%
of t
otal
cel
ls
IgG + PBS
αCSF1 +
Clodronate
0
24
16
8
Mac
roph
ages
%
of t
otal
cel
ls
IgG + PBS
αCSF1 +
Clodronate
* *
0
15
10
5
# of
mon
ocyt
espe
r mL
(x10
4 )
IgG + PBS
αCSF1 +
Clodronate
n.s.
0
15
10
5
# of
mon
ocyt
espe
r mL
(x10
4 )
IgG + PBS
αCSF1 +
Clodronate
n.s.
KPPC GEMM (2 months)
0.0
0.4
0.8
1.2
Panc
reas
wei
ght (
gram
)
K*
0.0
0.4
0.6
0.8
Panc
reas
wei
ght (
gram
) *
0.2
KPC GEMM (4.5 months)
αCSF1 +
Clodronate
CCR2 inhibito
r
(contin
uous)
Control
αCSF1 +
Clodronate
Control
KPPC GEMM (2 months)
0
50
100
% o
f Mal
igna
nt A
rea
High Grade Carcinoma
0
50
100
% o
f Mal
igna
nt A
rea
Low Grade Carcinoma
0
50
100
% o
f Tis
sue
Are
a
Malignant Area
Control
αCSF1 + Clondronate
L
* *
0
12
24
% K
i67+ C
ells
Proliferation
M
KPC-1 Orthotopic
# of
mon
ocyt
espe
r mL
(x10
4 )
102 103 104 1050
MH
CII
Nur77+/-
F4/80
102
103
104
0
105
102 103 104 1050
Nur77-/-
F4/80
Gated on TAMs
0
4
8
12
16
# of
mac
roph
ages
per p
ancr
eas
(x10
6 )
Nur77+/-Nur77-/-
NormalPancreas
PDAC
G
10
PDAC
58.3
41.7
54.7
45.3
*
53.6
46.4
17.3
82.7
TAM
s%
of t
otal
cel
ls
102 103 104 1050
50k
100k
150k
250k
0
200k
SSC
-A
Ly6CHi Monocytes6.1%
FLT3-CRE+
93.9%
102 103 104 1050
50k
100k
150k
250k
0
200k
SSC
-A
Ly6CLow Monocytes5.5% 94.5%
102 103 104 1050
50k
100k
150k
250k
0
200k
SSC
-A
Ly6GHi Neutrophils6.6% 93.4%
102 103 104 1050
50k
100k
150k
250k
0
200k
SSC
-A
T cells5.8% 94.2%
YFP
FLT3-CRE(-) Control
102 103 104 1050
50k
100k
150k
250k
0
200k
SSC
-A
Ly6CHi Monocytes99.3% 0.7%
3.6% 96.4%
Syngenic Tumor Cells
Day 0
Analyze
KPC Mice
Flt3-Cre; R26-LSL-YFP Mice
102 103 104 1050
50k
100k
150k
250k
0
200k
SSC
-A
PDAC-Associated Macrophages
YFP
99.23%
FLT3-CRE(-) Control FLT3-CRE+
102 103 104 1050
37.3% 62.7%0.746%
50k
100k
150k
250k
0
200k
Blood Labeling Tissue Labeling
Pancreas Labeling
FLT3-CRE+FLT3-CRE(-) Control
102 103 104 1050
50k
100k
150k
250k
0
200k
SSC
-A
Normal Pancreas Macrophages
99.1% 0.9%
102 103 104 1050
50k
100k
150k
250k
0
200k
SSC
-A
45.8% 54.2%
102 103 104 1050
50k
100k
150k
250k
0
200k
SSC
-A
Brain Microglia99.6% 0.362%
102 103 104 1050
50k
100k
150k
250k
0
200k
SSC
-A
98.2% 1.8%Brain Microglia
A B
CYFP
D
E
102 103 104 1050
50k
100k
150k
250k
0
200k
SSC
-A
8.1% 91.9%Colon Macrophages
102 103 104 1050
50k
100k
150k
250k
0
200k
SSC
-A
99.75% 0.25%Colon Macrophages
G
Normal
Pancre
as
KP Tumor (10
days)
KP Tumor (24
days)
0
5
10
15
Normal
Pancre
as
KP Tumor (10
days)
KP Tumor (24
days)
0
4
8
12
16
F
102 103 104 1050
102 103 104 1050YFP
E13.5anti-CD115
Vehicle
H
0.0
0.5
1.0
1.5
2.0
2.5
Orthotopic KPC
*
CD68YFPDAPI
Panc
reas
PDA
C
Normal PancreasGated on macrophages
20X
Quantity Density
Zhu et al. Figure 4
** *
(-) (+)
(-) (+)
# of
mac
roph
ages
pe
r tum
or (x
106 )
# of
YFP
-neg
ativ
e m
acro
phag
es
per
gram
(x10
5 )
# of
YFP
-neg
ativ
e m
acro
phag
es
per
panc
reas
(x10
5 )
E13.5
Vehicl
e
E13.5 αC
SF1R0
5
10
# of
YFP
-neg
ativ
e m
acro
phag
es
per
gram
(x10
5 )
Normal Pancreas
*
Ly6C
-Hi B
lood M
onoc
ytes
Ly6C
-Low B
lood M
onoc
ytes
Blood N
eutro
phils
Blood T
Cell
s
Blood B
Cell
s
Brain M
icrog
lia
Colon M
acrop
hage
s
Pancre
as B
Cell
s
Pancre
as M
acrop
hage
s
Pancre
as TAMs
0
20
40
6090
100
% Y
FP-n
egat
ive
of le
ukoc
ytes
I
0.0
0.1
0.2
0.3
0.4
0.5
Panc
reas
wei
ght (
gram
) *
E13.5
Vehicl
e
E13.5 αC
SF1R
E13.5
Vehicl
e
E13.5 αC
SF1R
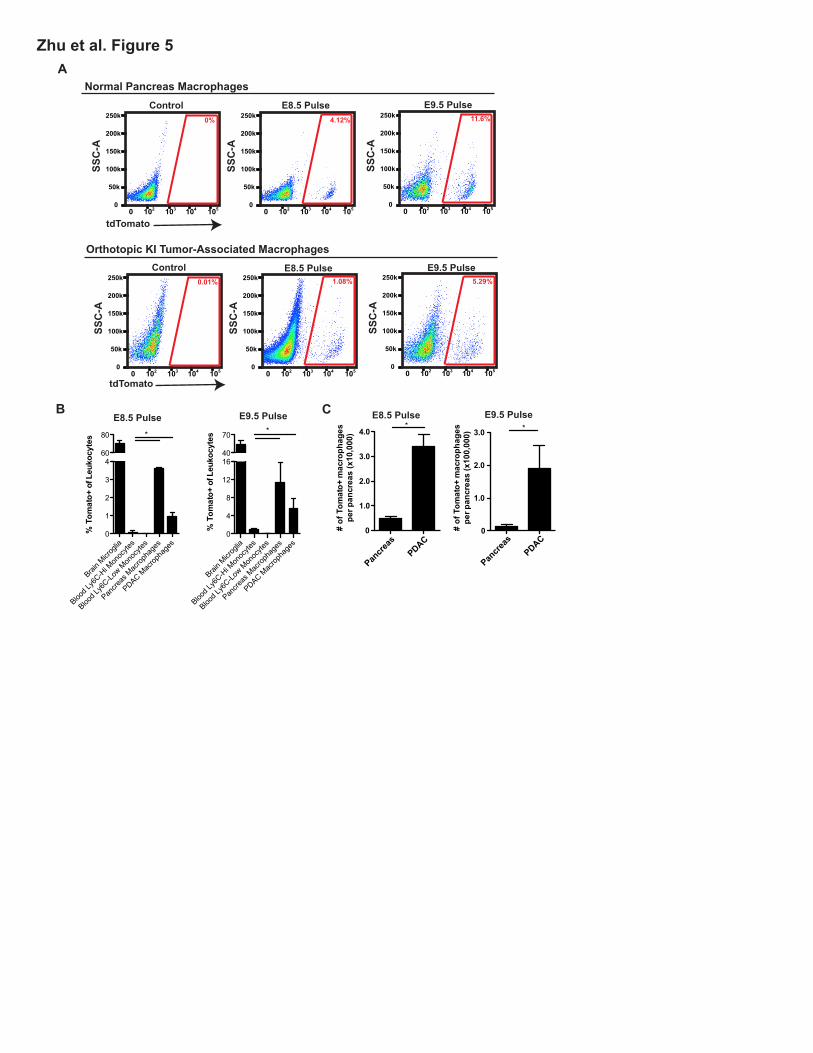
Brain M
icrog
lia
Blood L
y6C-H
i Mon
ocyte
s
Blood L
y6C-Lo
w Mon
ocyte
s
Pancre
as M
acrop
hage
s
PDAC Mac
ropha
ges
0
4
8
12
1640
70 *
tdTomato102 103 104 1050
50k
100k
150k
250k
0
200k
SSC
-A
102 103 104 1050
50k
100k
150k
250k
0
200k
SSC
-A
102 103 104 1050
50k
100k
150k
250k
0
200k
SSC
-A
102 103 104 1050
50k
100k
150k
250k
0
200k
SSC
-A
102 103 104 1050
50k
100k
150k
250k
0
200k
SSC
-A
102 103 104 1050
50k
100k
150k
250k
0
200k
SSC
-A
Normal Pancreas Macrophages
Orthotopic KI Tumor-Associated MacrophagesControl E8.5 Pulse E9.5 Pulse
Control E8.5 Pulse E9.5 Pulse
A
B C
tdTomato
Brain M
icrog
lia
Blood L
y6C-H
i Mon
ocyte
s
Blood L
y6C-Lo
w Mon
ocyte
s
Pancre
as M
acrop
hage
s
PDAC Mac
ropha
ges
0
1
2
3
460
80 *
0%
0.01%
4.12% 11.6%
1.08% 5.29%
Zhu et al. Figure 5
0
1.0
2.0
3.0 *
0
1.0
2.0
3.0
4.0*
# of
Tom
ato+
mac
roph
ages
per p
ancr
eas
(x10
,000
)
E8.5 Pulse E9.5 Pulse
# of
Tom
ato+
mac
roph
ages
per p
ancr
eas
(x10
0,00
0)
Pancre
asPDAC
Pancre
asPDAC
E8.5 Pulse E9.5 Pulse
% T
omat
o+ o
f Leu
kocy
tes
% T
omat
o+ o
f Leu
kocy
tes
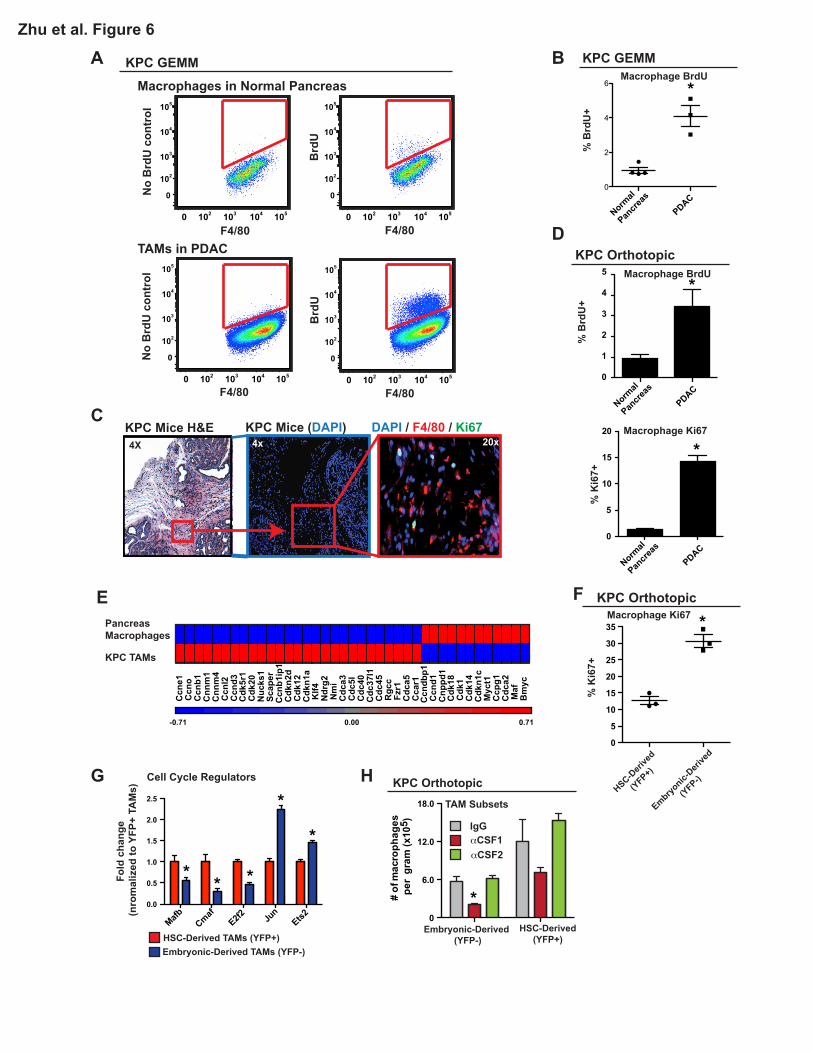
A B
C
F
D
KPC Mice H&E KPC Mice (DAPI) DAPI / F4/80 / Ki67
F4/80
No
Brd
U c
ontr
ol
F4/80
No
Brd
U c
ontr
ol
102 103 104 1050
102
103
104
105
0
F4/80
Brd
U
102 103 104 1050
102
103
104
105
0
F4/80
Brd
U
TAMs in PDAC
Macrophages in Normal Pancreas
G
E
HSC-Deri
ved
(YFP+)
Embryonic-
Derive
d
(YFP-)
0
5
10
15
20
25
30
35
0
5
10
15
20
Normal
Pancre
as
PDAC0
2
4
6
20x4x4X
Macrophage BrdU
Macrophage BrdU
Macrophage Ki67
Macrophage Ki67
Zhu et al. Figure 6
MafbCmaf
E2f2 Jun
Ets20.0
0.5
1.0
1.5
2.0
2.5
H
0
6.0
12.0
18.0
-0.71 0.00 0.71
Ccn
e1C
cno
Ccn
b1C
nnm
1C
nnm
4C
cnl2
Ccn
d3
Ccn
dbp1
Ccn
d1C
nppd
1
Cdk
5r1
Cdk
20N
ucks
1Sc
aper
Ccn
b1ip
1C
dkn2
dC
dk12
Cdk
n1a
Cdk
18C
dk1
Cdk
14C
dkn1
c
Klf4
Ndr
g2N
mi
Cdc
a3C
dc5l
Cdc
40C
dc37
l1C
dc45
Rgc
cFz
r1C
dca5
Cca
r1
Maf
Bm
yc
Myc
t1C
cpg1
Cdc
a2
KPC TAMs
PancreasMacrophages
HSC-Derived TAMs (YFP+)Embryonic-Derived TAMs (YFP-)
Fold
cha
nge
(nro
mal
ized
to Y
FP+
TAM
s)
Cell Cycle Regulators
% K
i67+
Normal
Pancre
as
PDAC
Normal
Pancre
as
PDAC
% K
i67+
% B
rdU
+%
Brd
U+
0
2
3
4
5
1
KPC GEMM
KPC Orthotopic
KPC GEMM
KPC Orthotopic
# of
mac
roph
ages
pe
r gr
am (x
105 ) IgG
αCSF1αCSF2
HSC-Derived(YFP+)
Embryonic-Derived (YFP-)
TAM Subsets
KPC Orthotopic
*
*
*
** * *
*
*
*
102 103 104 1050
102
103
104
105
0
102 103 104 1050
102
103
104
105
0

102 103 104 1050
CD115102 103 104 1050
CX3CR1
102 103 104 1050
MHCII
102 103 104 1050
Tie2102 103 104 1050
102 103 104 1050
PDL1
A
C
B
D
102 103 104 1050
CD124
102 103 104 1050
MHCI
102 103 104 1050
PD1
CD64
102 103 104 1050
PDL2102 103 104 1050
CD40
102 103 104 1050
CD80
102 103 104 1050
CXCR4
102 103 104 1050
F4/80102 103 104 1050
CD11b
*n.s.n.s.n.s.
n.s.
*
* *
n.s.
Mac
roph
age
Iden
tity
Mar
kers
Ant
igen
Pres
enta
tion
T C
ell A
ctiv
atio
n an
d Ex
haus
tion
Che
mok
ine
and
Cyt
okin
e R
ecep
tor
*
n.s.
n.s.
n.s.
102 103 104 1050
CD86
n.s.
n.s.
n.s.
E
Col1a2
Col3a1
Col4a4
Col5a1
Col6a1
Col10a1
Col17a1
Col18a1
Nid1Tnc
ElnSparc Has
2Has
3Lox
Loxl1
Adamts1
2
Mmp2Mmp9
Yap1
10-1
100
101
102
103
104
Gated on TAMs
Zhu et al. Figure 7
ECM and ECM Remodeling
HSC-Derived TAMs (YFP+)Embryonic-Derived TAMs (YFP-)
Log 10
fold
cha
nge
(nor
mal
ized
to Y
FP+
TAM
s)
KPC Orthotopic Model
**
*
*
*
* ** * * *
* *
* *
CiitaErap
1
Psme1
0.0
0.5
1.0
1.5
Il12a Il4
Ccl17
Ccl22
Ifnβ
Ifnγ
Fold
cha
nge
(nor
mal
ized
to Y
FP+
TAM
s) HSC-Derived TAMs (YFP+)Embryonic-Derived TAMs (YFP-)
Antigen Presentation Cytokines
Immune Modulation
***** *
*
Gated on Live,CD45+,DR+ K
Col
-I Pi
xels
/ ce
ll(x
108 )
F
0
0.5
1.0
1.5
2.0
HSC-Derived TAM (YFP+)Embryonic-Derived TAM (YFP-)
Col
-IV P
ixel
s / c
ell
(x10
6 )
0
1.0
2.0
3.0Ex-Vivo Collagen Produciton
102 103 104 1050
102
103
104
105
0
Control
CD
45
102 103 104 1050
102
103
104
105
0
CXCR4
CD
45
17.3
Patient 08
I
102 103 104 1050
mCherry
0
5
10
15
20
25G
HSC-Derived TAM (YFP+)Embryonic-Derived TAM (YFP-)
mC
herr
y M
FI(x
1000
)
Gated on TAMs*Tumor Antigen Uptake H Antigen Presentation
0.0001
0.001
0.01
0.1
1
Rel
ativ
e Ex
pres
sion
(Log
10)
Yap
0.001
0.01
0.1
1Col1A2
0.001
0.01
0.1Col6A1
0.00001
0.0001
0.001
0.01
0.1HAS2
0.00001
0.0001
0.001
0.01
0.1LOX
0.001
0.01
0.1
1Col3A1
0.00001
0.0001
0.001
0.01Col10A1
0.001
0.01
0.1
1SPARC TNC
0.00001
0.0001
0.001
0.01
0.1
0.0001
0.001
0.01
0.1LOXL1
CXCR4 Low
High Low
High Low
High Low
High
CXCR4 Low
High Low
High Low
High Low
High
Low
High Low
High
Patient 05
Patient 08
Patient 09
* * * *
* * * *
102 103 104 1050CD3/CD19/CD16
50k
100k
150k
250k
0
200k
SSC
-A
102 103 104 1050
102
103
104
105
0
CSF1R
CD
14
0.6
0
10
20
30
40
50Gated on TAMs
% C
XCR
4+ o
f Tot
al T
AM
s
0
5
10
15
HLA
DR
MFI
(x10
00)
Human PDAC Tissues
CXCR4Low
High
J
102 103 104 1050
CXCR4(-)CXCR4(+)
HLA-DR
Gated on TAMs
control
YFP+YFP-
0
20
40
60
80
100
Act
ivat
ed %
of t
otal
OT1
’s
Exp#1Exp#2Exp#3
*
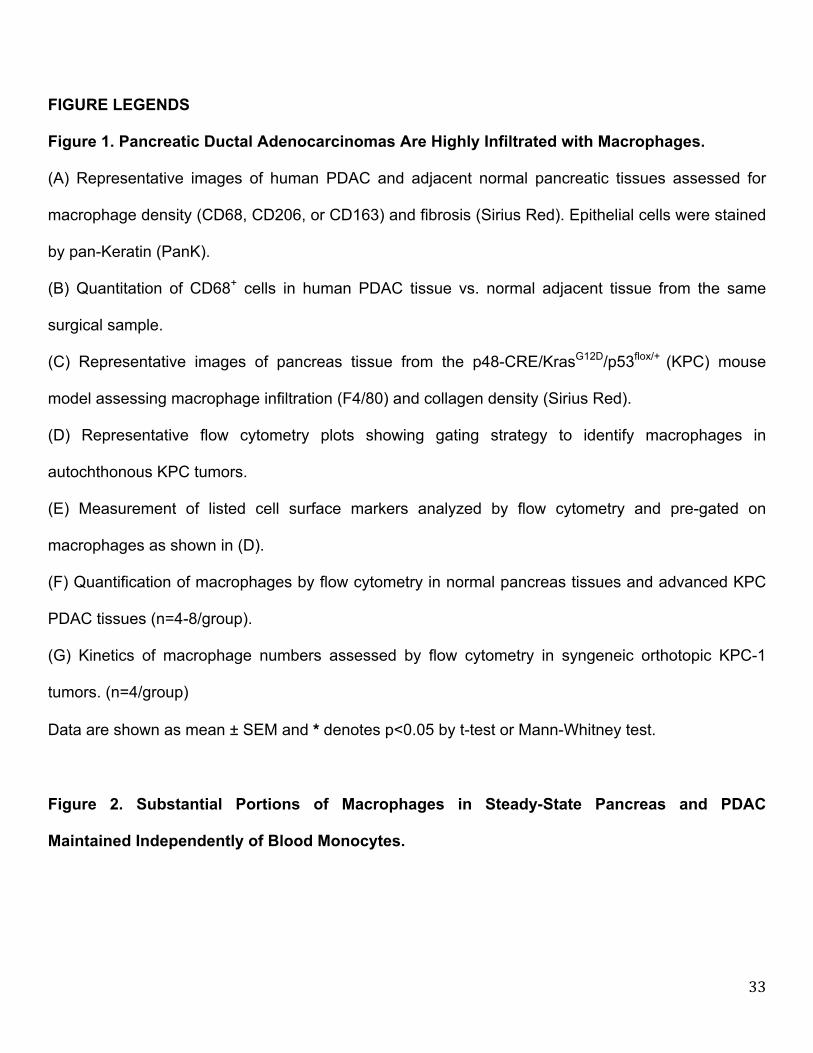
33
FIGURE LEGENDS
Figure 1. Pancreatic Ductal Adenocarcinomas Are Highly Infiltrated with Macrophages.
(A) Representative images of human PDAC and adjacent normal pancreatic tissues assessed for
macrophage density (CD68, CD206, or CD163) and fibrosis (Sirius Red). Epithelial cells were stained
by pan-Keratin (PanK).
(B) Quantitation of CD68+ cells in human PDAC tissue vs. normal adjacent tissue from the same
surgical sample.
(C) Representative images of pancreas tissue from the p48-CRE/KrasG12D/p53flox/+ (KPC) mouse
model assessing macrophage infiltration (F4/80) and collagen density (Sirius Red).
(D) Representative flow cytometry plots showing gating strategy to identify macrophages in
autochthonous KPC tumors.
(E) Measurement of listed cell surface markers analyzed by flow cytometry and pre-gated on
macrophages as shown in (D).
(F) Quantification of macrophages by flow cytometry in normal pancreas tissues and advanced KPC
PDAC tissues (n=4-8/group).
(G) Kinetics of macrophage numbers assessed by flow cytometry in syngeneic orthotopic KPC-1
tumors. (n=4/group)
Data are shown as mean ± SEM and * denotes p<0.05 by t-test or Mann-Whitney test.
Figure 2. Substantial Portions of Macrophages in Steady-State Pancreas and PDAC
Maintained Independently of Blood Monocytes.

34
(A) 3.5-month-old homozygous CD45.1 and CD45.2 (KPC or wild-type C57BL/6) mice were surgically
joined to create parabiotic pairs. Tissues were analyzed after 2 or 6 weeks of parabiosis.
Representative plots (6 weeks) of chimerism in indicated cell types are shown.
(B) Quantification of chimerism in (A); (n=6-16/group).
(C) MHCIIHi and MHCIILow composition of CD45.1+CD45.2(-)-derived TAMs in (B).
(D) C57BL/6J mice were lethally irradiated and adoptively transferred with bone marrow cells from
homozygous CD45.1 mice. Analysis of chimerism in several tissues after 6 weeks is depicted.
(E) Quantification of chimerism in MHCIIHi and MHCIILow macrophage subsets in normal pancreas in
(D).
(F) Representative plots of (E).
(G) Autochthonous KPC mice bearing premalignant disease (3.5-month-old) were lethally irradiated
and adoptively transferred with bone marrow cells from CD45.1 mice. Tissues were analyzed for
chimerism after 6 weeks, when disease had progressed to full PDAC. Relative CD45.1 and CD45.2
percentages analyzed by flow cytometry are depicted.
(H) Quantification of chimerism in MHCIIHi and MHCIILow TAMs in (G).
(I) Tumor-naïve mice and orthotopic KPC tumor-bearing mice were treated with clodronate-loaded
liposomes followed by i.v. injection of FITC-labeled beads. Tissue macrophages were analyzed for
FITC signal by flow cytometry after 24 hours.
(J) Representative flow cytometry plots of beads+ TAMs in orthotopic PDAC from (I).
(K) MHCIIHi and MHCIILow composition of beads+ TAMs from (I).
Data are shown as mean ± SEM and * denotes p<0.05 by t-test.
Figure 3. Tissue-Resident Macrophages Promote PDAC Progression.

35
(A-D) KPC cells were orthotopically implanted into CCR2+/- and CCR2-/- mice. Tumors were
processed on Day 12 for flow cytometry analysis.
(A) Blood was drawn from orthotopic KPC-2-bearing mice via intracardiac puncture. Monocytes were
assessed by flow cytometry (n=3-4/group).
(B) Frequency of macrophages orthotopic KPC-2 tissues of CCR2+/- and CCR2-/- mice.
(C) Frequency of MHCIIHi and Low TAM subsets assessed by flow cytometry in orthotopic KPC-2
tumors. Representative plots of TAM subsets are shown (n=3-4/group).
(D) Wet weights of KPC-2 tumors in (B).
(E-H) KPC-2 cells were orthotopically implanted into Nur77+/- and Nur77-/- mice. Tumors were
processed on Day 13 for flow cytometry analysis (n=4/group normal, n=6-8/group of tumor bearing).
(E) Blood was drawn from orthotopic PDAC-bearing mice via intracardiac puncture. Monocytes were
quantified.
(F) Quantity of macrophages in normal pancreas and orthotopic PDAC in Nur77+/- and Nur77-/- mice.
(G) Representative plots of MHCIIHi and Low TAM subsets.
(H) Wet weights of KPC-2 tumors in (F).
(I-J) KPC-2-CBRLuc+ cells were orthotopically implanted into IgG/PBS- or αCSF1/clodronate-treated
mice. Bioluminescence imaging (BLI) was used to measure tumor progression. Tumors were
processed on Day 12 for flow cytometry and tumor burden analyses.
(I) Scheme of pancreas-resident macrophage depletion followed by orthotopic PDAC of KPC-2-
CBRLuc+ cells. Blood monocytes and pancreatic macrophage numbers before and after PDAC
implantation are shown.
(J) Tumor burden based on BLI and wet weight measurement.
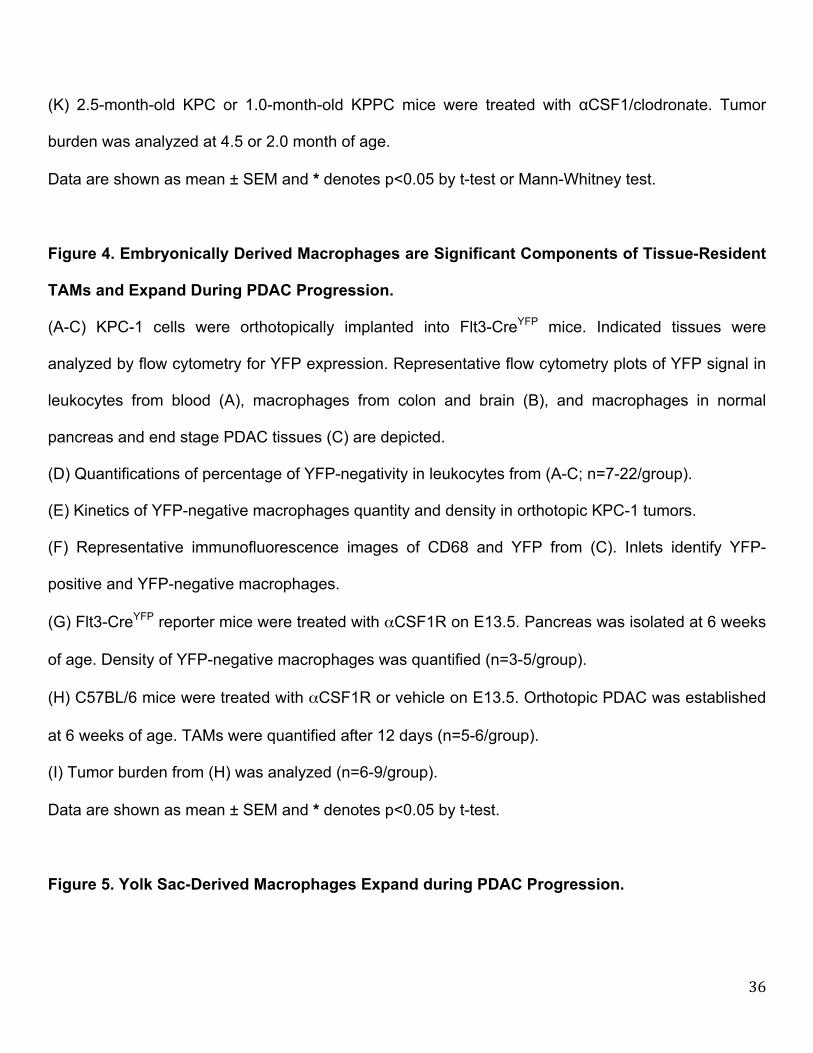
36
(K) 2.5-month-old KPC or 1.0-month-old KPPC mice were treated with αCSF1/clodronate. Tumor
burden was analyzed at 4.5 or 2.0 month of age.
Data are shown as mean ± SEM and * denotes p<0.05 by t-test or Mann-Whitney test.
Figure 4. Embryonically Derived Macrophages are Significant Components of Tissue-Resident
TAMs and Expand During PDAC Progression.
(A-C) KPC-1 cells were orthotopically implanted into Flt3-CreYFP mice. Indicated tissues were
analyzed by flow cytometry for YFP expression. Representative flow cytometry plots of YFP signal in
leukocytes from blood (A), macrophages from colon and brain (B), and macrophages in normal
pancreas and end stage PDAC tissues (C) are depicted.
(D) Quantifications of percentage of YFP-negativity in leukocytes from (A-C; n=7-22/group).
(E) Kinetics of YFP-negative macrophages quantity and density in orthotopic KPC-1 tumors.
(F) Representative immunofluorescence images of CD68 and YFP from (C). Inlets identify YFP-
positive and YFP-negative macrophages.
(G) Flt3-CreYFP reporter mice were treated with αCSF1R on E13.5. Pancreas was isolated at 6 weeks
of age. Density of YFP-negative macrophages was quantified (n=3-5/group).
(H) C57BL/6 mice were treated with αCSF1R or vehicle on E13.5. Orthotopic PDAC was established
at 6 weeks of age. TAMs were quantified after 12 days (n=5-6/group).
(I) Tumor burden from (H) was analyzed (n=6-9/group).
Data are shown as mean ± SEM and * denotes p<0.05 by t-test.
Figure 5. Yolk Sac-Derived Macrophages Expand during PDAC Progression.
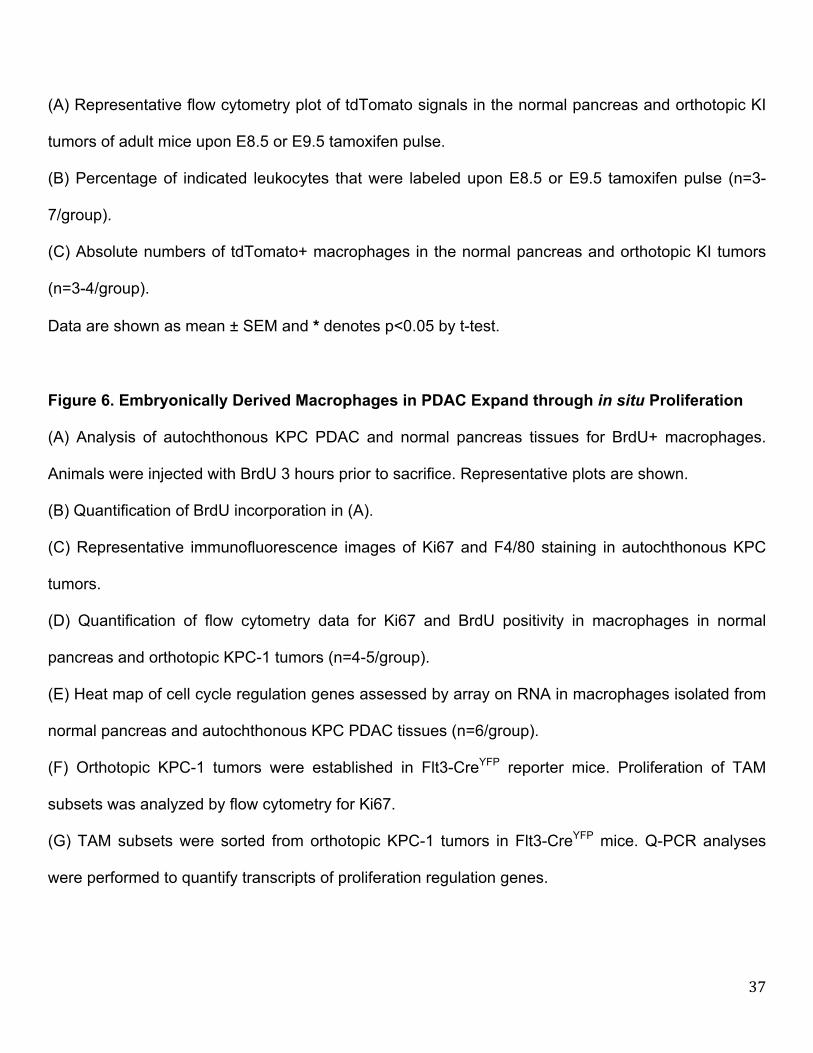
37
(A) Representative flow cytometry plot of tdTomato signals in the normal pancreas and orthotopic KI
tumors of adult mice upon E8.5 or E9.5 tamoxifen pulse.
(B) Percentage of indicated leukocytes that were labeled upon E8.5 or E9.5 tamoxifen pulse (n=3-
7/group).
(C) Absolute numbers of tdTomato+ macrophages in the normal pancreas and orthotopic KI tumors
(n=3-4/group).
Data are shown as mean ± SEM and * denotes p<0.05 by t-test.
Figure 6. Embryonically Derived Macrophages in PDAC Expand through in situ Proliferation
(A) Analysis of autochthonous KPC PDAC and normal pancreas tissues for BrdU+ macrophages.
Animals were injected with BrdU 3 hours prior to sacrifice. Representative plots are shown.
(B) Quantification of BrdU incorporation in (A).
(C) Representative immunofluorescence images of Ki67 and F4/80 staining in autochthonous KPC
tumors.
(D) Quantification of flow cytometry data for Ki67 and BrdU positivity in macrophages in normal
pancreas and orthotopic KPC-1 tumors (n=4-5/group).
(E) Heat map of cell cycle regulation genes assessed by array on RNA in macrophages isolated from
normal pancreas and autochthonous KPC PDAC tissues (n=6/group).
(F) Orthotopic KPC-1 tumors were established in Flt3-CreYFP reporter mice. Proliferation of TAM
subsets was analyzed by flow cytometry for Ki67.
(G) TAM subsets were sorted from orthotopic KPC-1 tumors in Flt3-CreYFP mice. Q-PCR analyses
were performed to quantify transcripts of proliferation regulation genes.
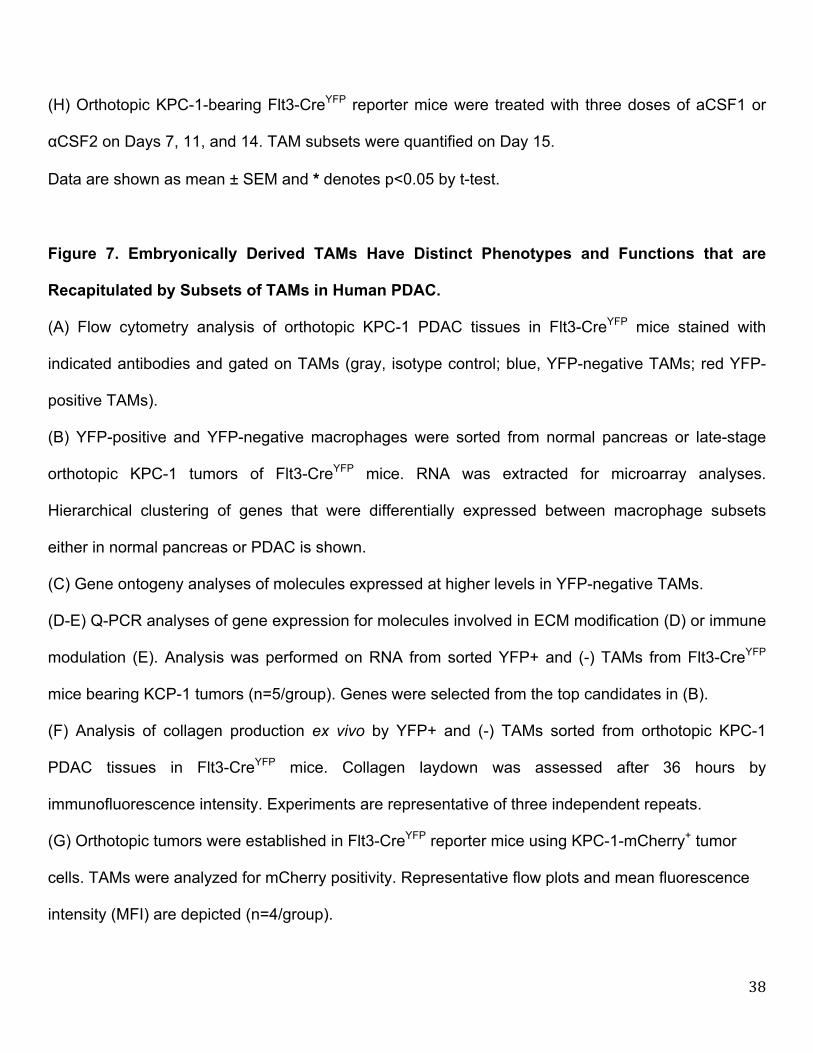
38
(H) Orthotopic KPC-1-bearing Flt3-CreYFP reporter mice were treated with three doses of aCSF1 or
αCSF2 on Days 7, 11, and 14. TAM subsets were quantified on Day 15.
Data are shown as mean ± SEM and * denotes p<0.05 by t-test.
Figure 7. Embryonically Derived TAMs Have Distinct Phenotypes and Functions that are
Recapitulated by Subsets of TAMs in Human PDAC.
(A) Flow cytometry analysis of orthotopic KPC-1 PDAC tissues in Flt3-CreYFP mice stained with
indicated antibodies and gated on TAMs (gray, isotype control; blue, YFP-negative TAMs; red YFP-
positive TAMs).
(B) YFP-positive and YFP-negative macrophages were sorted from normal pancreas or late-stage
orthotopic KPC-1 tumors of Flt3-CreYFP mice. RNA was extracted for microarray analyses.
Hierarchical clustering of genes that were differentially expressed between macrophage subsets
either in normal pancreas or PDAC is shown.
(C) Gene ontogeny analyses of molecules expressed at higher levels in YFP-negative TAMs.
(D-E) Q-PCR analyses of gene expression for molecules involved in ECM modification (D) or immune
modulation (E). Analysis was performed on RNA from sorted YFP+ and (-) TAMs from Flt3-CreYFP
mice bearing KCP-1 tumors (n=5/group). Genes were selected from the top candidates in (B).
(F) Analysis of collagen production ex vivo by YFP+ and (-) TAMs sorted from orthotopic KPC-1
PDAC tissues in Flt3-CreYFP mice. Collagen laydown was assessed after 36 hours by
immunofluorescence intensity. Experiments are representative of three independent repeats.
(G) Orthotopic tumors were established in Flt3-CreYFP reporter mice using KPC-1-mCherry+ tumor
cells. TAMs were analyzed for mCherry positivity. Representative flow plots and mean fluorescence
intensity (MFI) are depicted (n=4/group).

39
(H) Analysis of antigen presentation to CD8+ T cells by YFP+ and (-) TAMs sorted from Flt3-CreYFP
mice bearing KPC-1 tumors. Antigen presentation was assessed by the ability of TAMs to activate
OT1 cells after SIINFEKL loading and measured by CFSE-dilution and/or CD44+/CD69+/CD62L-
expression on T cells. Three independent sorting experiments are depicted as paired analyses.
(I) Flow cytometry analysis of human PDAC tissues from surgical resections is depicted. The
percentage of CXCR4+ TAMs of total is shown for nine patients.
(J) Analysis of HLA-DR expression in CXCR4-positive and negative TAMs using data from (I). A
representative flow plot and MFI analysis in paired samples are depicted.
(K) Q-PCR analysis of mRNA from CXCR4-positive and negative TAMs sorted from human PDAC
tissues. Pro-fibrotic genes assessed were identified in (B), and analysis of paired isolates from three
patients is depicted. All graphs depict mean values +/- SEM and * denotes p<0.05 by t-test, Mann-
Whitney test, or Wilcoxon matched pairs rank test as appropriate for the data set.