tips on your routine 15 minute scientific talk 1. consider...
TRANSCRIPT
9/26/2012
1
Tips on Your Routine 15 Minute Scientific Talk
1. Consider your audience
2. Know and obey your time constraints2. Know and obey your time constraints
3. Use proper organization
4. Presentation is key
5. Create simple, clear slides
6. Be calm, casual, personable
7. Practice, practice, practice
beforehand, try to determine the range of
knowledge/familiarity that your audience has
1. Consider your audience
knowledge/familiarity that your audience has
with your research topic and speak to that level.
audience will be comprised of a continuum of
familiarity with your subject, so to engage most
f th k it i l Thi d ’t tof them, keep it simple. This doesn’t mean to
assume they are idiots, but downplay and define
any jargon.
speak to the “lowest level” in the audience.
9/26/2012
2
2. Know and obey your time constraints
know well ahead of time what your time limits are(i.e. talk versus question period)
15 min is very little time; plan to get only 1-3 ideas across
again, the necessity of simplicity
avoid too many data slides (4-5 max.), but plenty ofvery simple introductory and transitional slides
everyone hates when someone goes over the time limitbut no one hates someone who ends earlywith more time for discussion
3. Use proper organization
t t ith li ht i ti l d
A. Introduction
start with lights on in conversational mode
general question / big picture relevance (like a paper)
educate audience of the state of knowledge on the subject,which motivates…
lay out questions (1-3) early, in the first few minutesof the talk
use a single slide for each questionto emphasize it’s importance
9/26/2012
3
3. Use proper organization
A. Introduction - continued
i di t b i fl h th t lk i h d dindicate briefly where the talk is headed:
use a slide that lists all of the 2-3 questions.
“today I’m going to present the results of some experimentsdesigned to answer each of these questions”
this slide will structure the rest of the talk and provide thetransition from one question to the next (i.e. plan to make and use multiple copies).
B. Methods
3. Use proper organization
really, really, simple! (audience can ask questions later)
go with the flow created in the Introduction…
state each question again, the hypothesis and predictionsto be tested (this relates why you use the design andmethods you are about to introduce)
study design slide indicating what was manipulated andhow, sample size can be indicated but not dwelled on
study design slide should be titled with the question orhypothesis being tested (NOT “Experiment #1”)
9/26/2012
4
B. Methods continued
3. Use proper organization
figure of the location of study (if field work)figure of the location of study (if field work)and relevant environmental features
slide(s) of the species involved in the study, their role,and relevant information that makes them appropriatefor the study
photos of doing stuff in the field or lab are a great way to convey methods as you verbally describe some details
C. Results
3. Use proper organization
d t h th 4 li ( f bl 3) hdo not show more than 4 lines (preferably 3) per graph
do not show more than two graphs per slide unlesssimple temporal comparison (e.g., “small multiples”)
slide titles: present questions and/or results with datadatado not show ANOVA tables
Instead, include summary stats (F, P, r2) with graphs or tables (i.e. emphasize effect sizes)
9/26/2012
5
D. Conclusions / Summary
3. Use proper organization
b ti th ti threcap by presenting the question, then your answer,
verbally describe implications
4. Presentation is key
crack a joke to break the ice as early as possible
d ’t k t id j kdon’t make a stupid joke
avoid reading notes or directly from slides, but rely moreon…
use slides for transitions and talk from your slides…design slides to guide youg g y
practice makes perfect, before a group that can give you constructive criticism
9/26/2012
6
4. Presentation is key
if constructing talk on a Mac, be sure to:1) save in PC version2) run entire presentation on a PC to be sure
at break before your talk, familiarize yourself with
before meeting or session, be sure your presentationworks on the projection system available
2) run entire presentation on a PC to be sureformatting and images work properly
at break before your talk, familiarize yourself withprojector and pointer controls
Don’t forget the “Blaustein phenomenon”,or the mobile microphone
Slide Theory
1. Slide colors
2. Text
3. General design
4. Tables
5 Fi5. Figures
6. Animation
9/26/2012
7
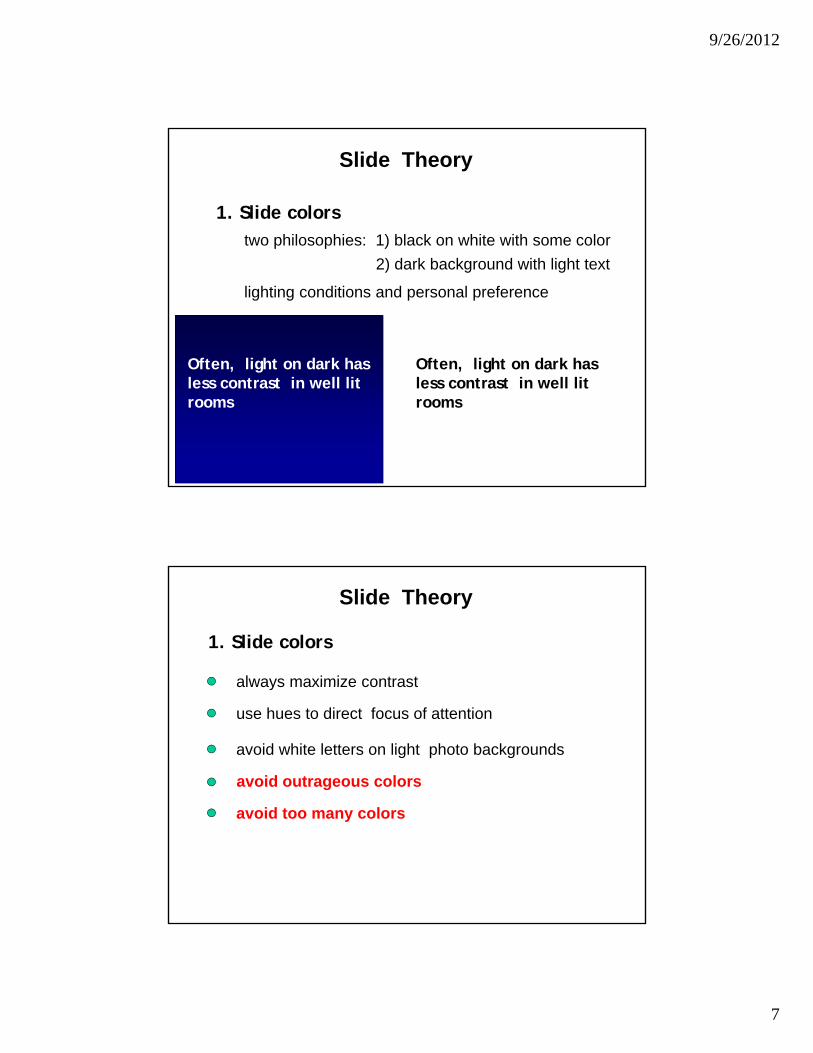
Slide Theory
1. Slide colorstwo philosophies: 1) black on white with some colorp p )
2) dark background with light text
lighting conditions and personal preference
Often, light on dark has Often, light on dark has Often, light on dark has less contrast in well lit rooms
Often, light on dark has less contrast in well lit rooms
Slide Theory
1. Slide colors
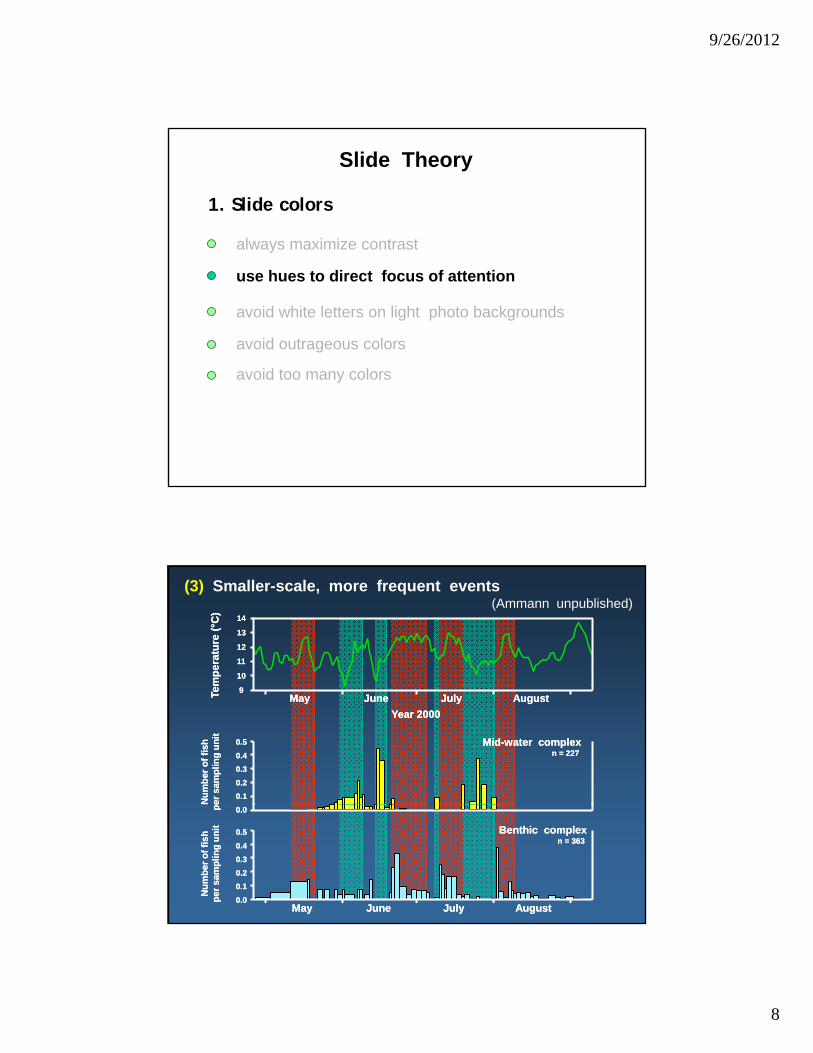
always maximize contrast
avoid outrageous colors
always maximize contrast
avoid white letters on light photo backgrounds
use hues to direct focus of attention
avoid too many colors
9/26/2012
8
Slide Theory
1. Slide colors
always maximize contrast
avoid outrageous colors
always maximize contrast
avoid white letters on light photo backgrounds
use hues to direct focus of attention
avoid too many colors
mpe
ratu
re (
mpe
ratu
re (°°
C)
C)
1010
1111
1212
1313
1414
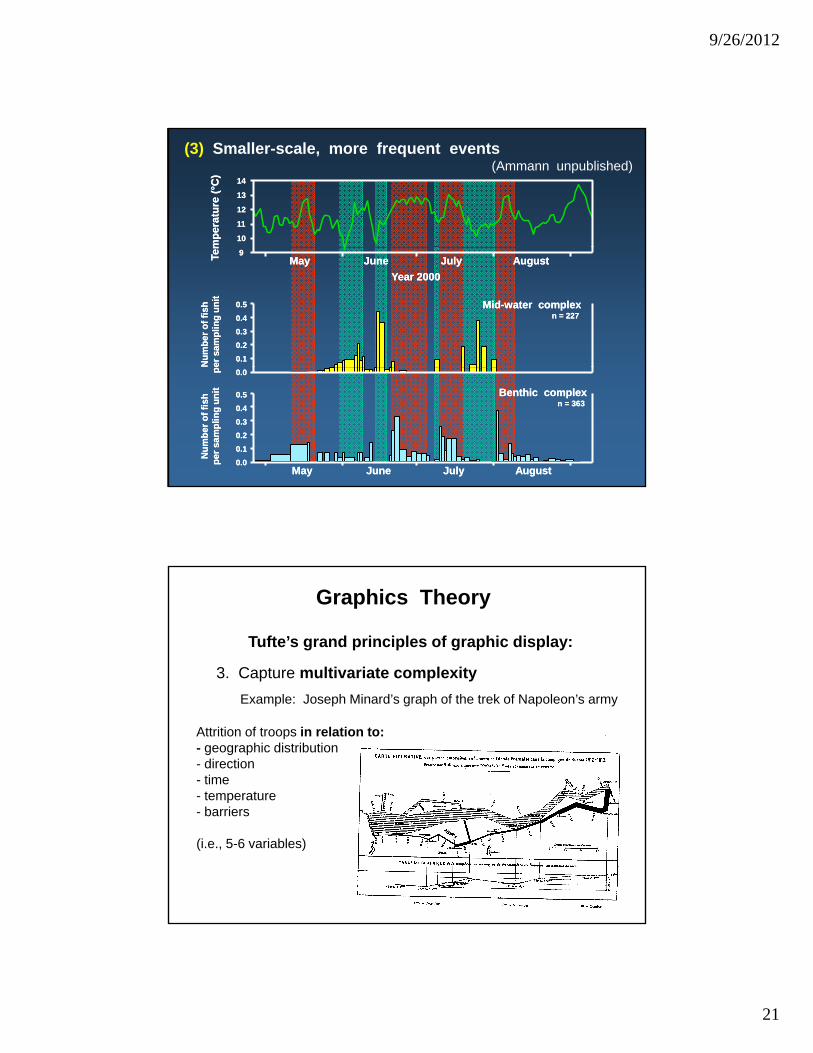
(3) Smaller-scale, more frequent events(Ammann unpublished)
MidMid--water complexwater complexn = 227 n = 227
Num
ber o
f fis
hN
umbe
r of f
ish
er s
ampl
ing
unit
er s
ampl
ing
unit
0.50.5
0.30.30.40.4
0.20.20.10.1
Tem
Tem
MayMay JuneJune JulyJuly AugustAugustYear 2000Year 2000
99
MayMay JuneJune JulyJuly AugustAugust
Num
ber o
f fis
hN
umbe
r of f
ish
per s
ampl
ing
unit
per s
ampl
ing
unit Benthic complexBenthic complex
n = 363 n = 363 0.50.5
0.30.30.40.4
0.20.20.10.10.00.0
pp 0.00.0
9/26/2012
9
Slide Theory
1. Slide colors
always maximize contrast
avoid outrageous colors
always maximize contrast
avoid white letters on light photo backgrounds
use hues to direct focus of attention
avoid too many colors
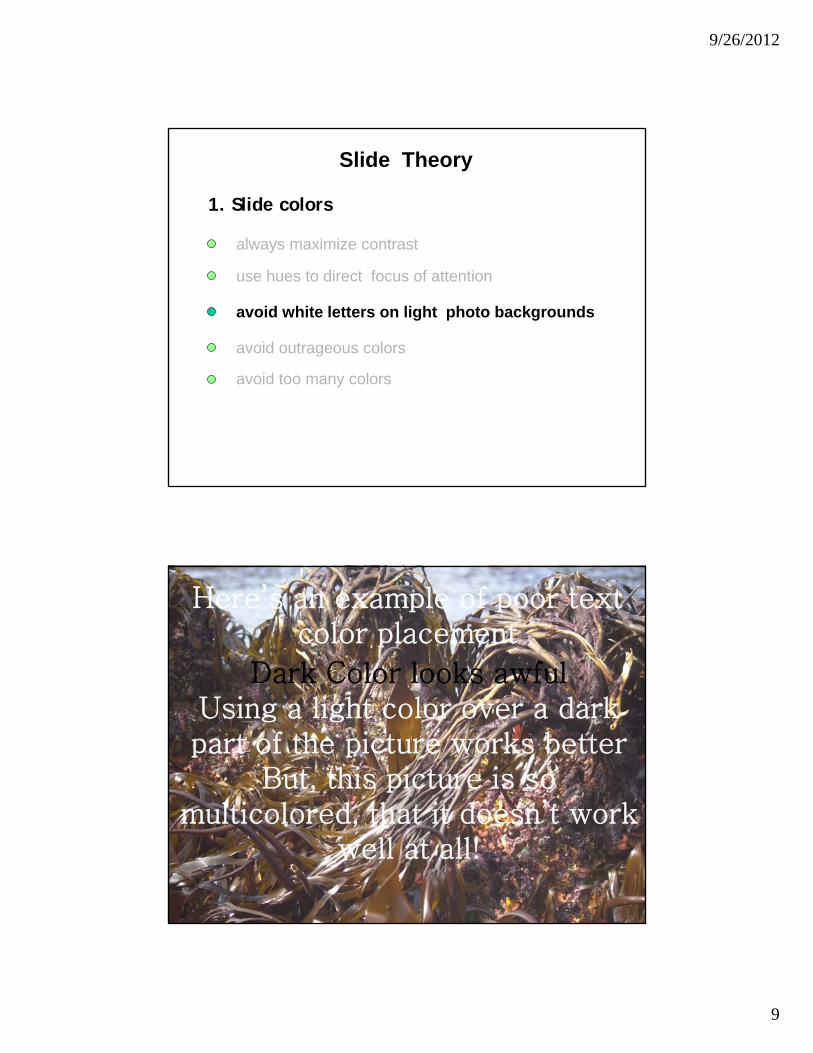
Here’s an example of poor text color placement
Dark Color looks awfulUsing a light color over a dark part of the picture works better
But, this picture is so lti l d th t it d ’t kmulticolored, that it doesn’t work
well at all!
9/26/2012
10
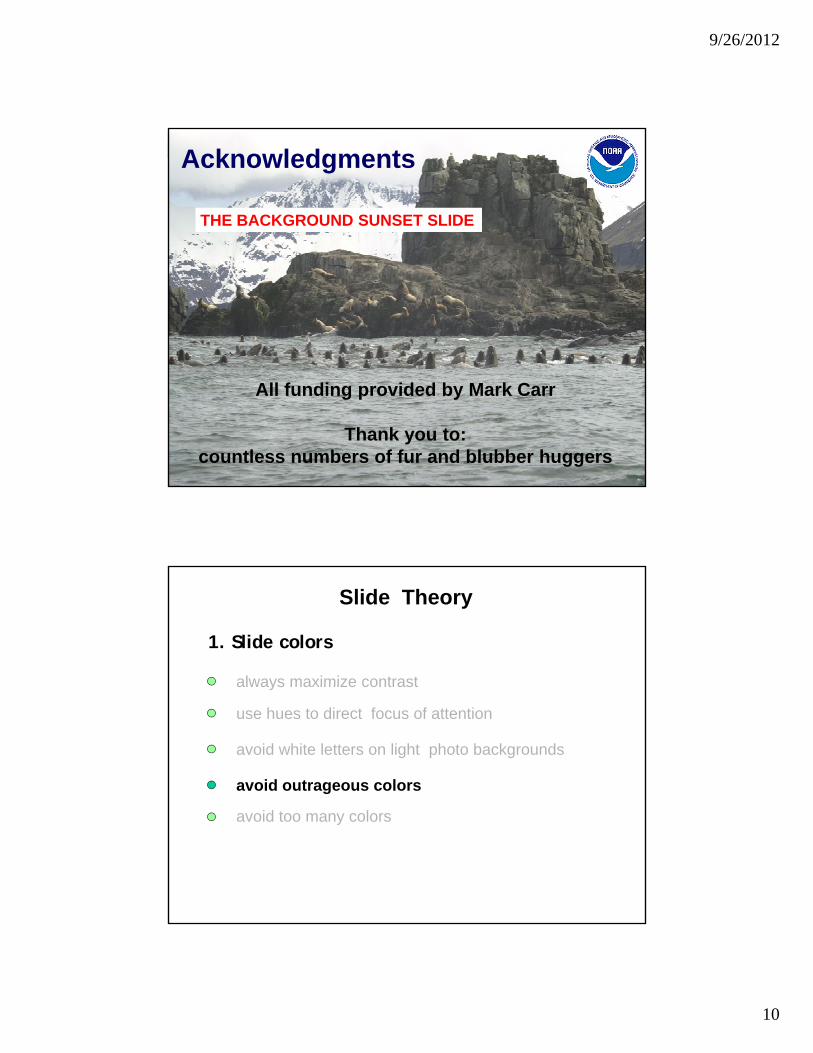
Acknowledgments
THE BACKGROUND SUNSET SLIDE
All funding provided by Mark Carr
Thank you to:countless numbers of fur and blubber huggers
Slide Theory
1. Slide colors
always maximize contrast
avoid outrageous colors
always maximize contrast
avoid white letters on light photo backgrounds
use hues to direct focus of attention
avoid too many colors
9/26/2012
11
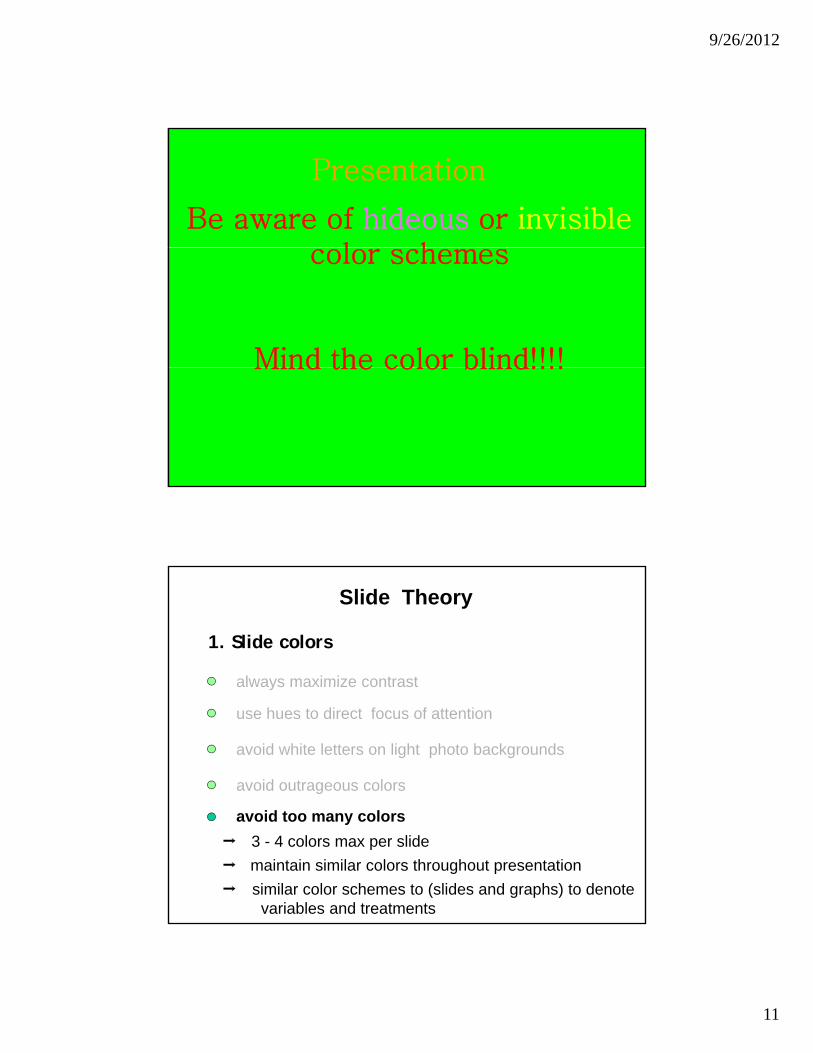
Presentation
Be aware of hideous or invisible l hcolor schemes
Mind the color blind!!!!Mind the color blind!!!!
Slide Theory
1. Slide colors
always maximize contrast
avoid outrageous colors
always maximize contrast
avoid white letters on light photo backgrounds
use hues to direct focus of attention
avoid too many colors3 - 4 colors max per slidemaintain similar colors throughout presentationsimilar color schemes to (slides and graphs) to denotevariables and treatments
9/26/2012
12
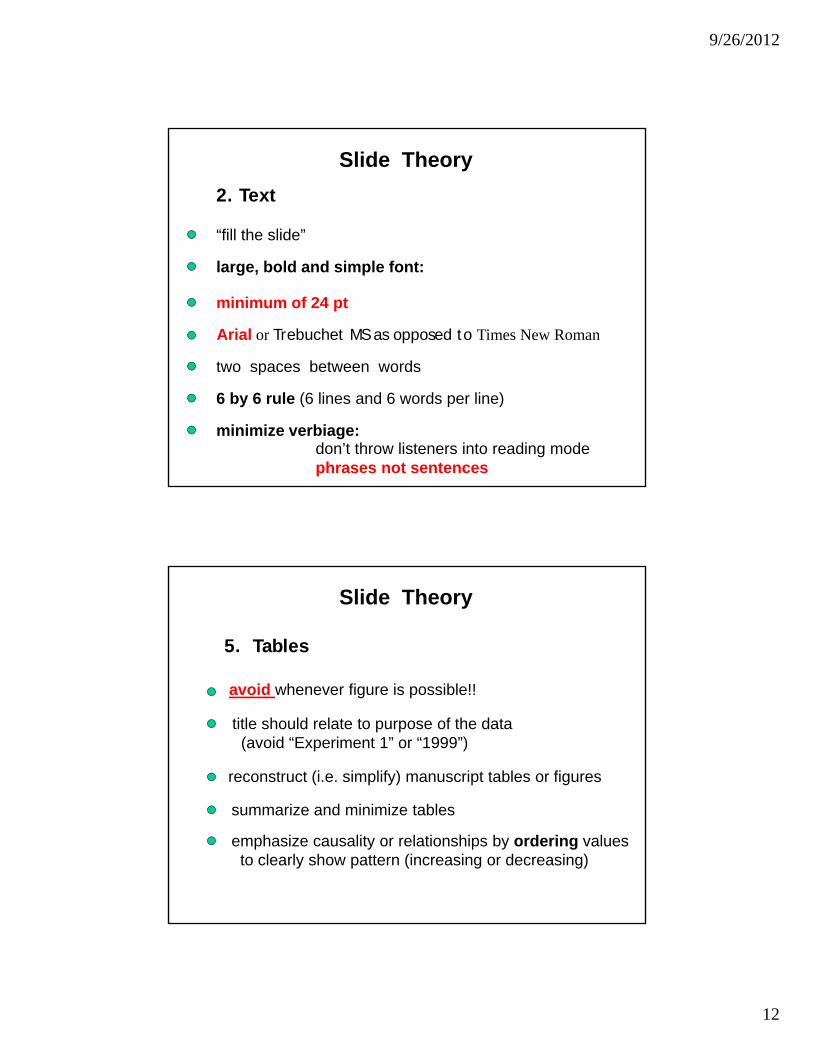
Slide Theory2. Text
“fill the slide”
two spaces between words
Arial or Trebuchet MS as opposed to Times New Roman
minimum of 24 pt
large, bold and simple font:
two spaces between words
6 by 6 rule (6 lines and 6 words per line)
minimize verbiage:don’t throw listeners into reading mode phrases not sentences
Slide Theory
5. Tables
id h fi i ibl !!avoid whenever figure is possible!!
title should relate to purpose of the data(avoid “Experiment 1” or “1999”)
reconstruct (i.e. simplify) manuscript tables or figures
i d i i i t blsummarize and minimize tables
emphasize causality or relationships by ordering valuesto clearly show pattern (increasing or decreasing)
9/26/2012
13
Slide Theory
5. Figures
id 3 D lavoid 3-D unless necessary
draw attention to result being conveyed by:1) bold relationship relative to axes2) different colors for relationships and axes
color and style code variables and keep consistentthroughout talk
avoid coding variables, instead label lines with text
Slide Theory
5. Figures
h i “ l” l ti hiemphasize “causal” relationships
(organize data to clearly relate dependent andindependent variables)
provide comparison, provide some referenceto time or spaceto time or space
temporal comparisons must be summarized on same slide
9/26/2012
14
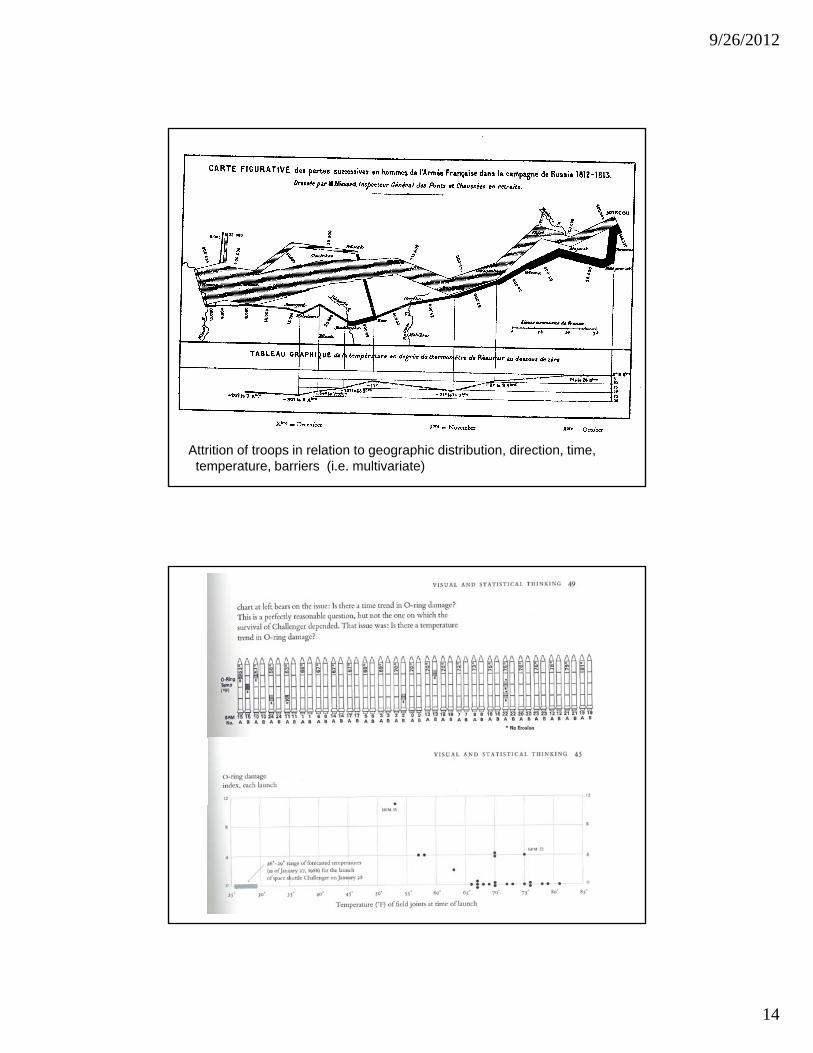
Attrition of troops in relation to geographic distribution, direction, time,temperature, barriers (i.e. multivariate)
9/26/2012
15
5. Figures
h i “ l” l ti hi
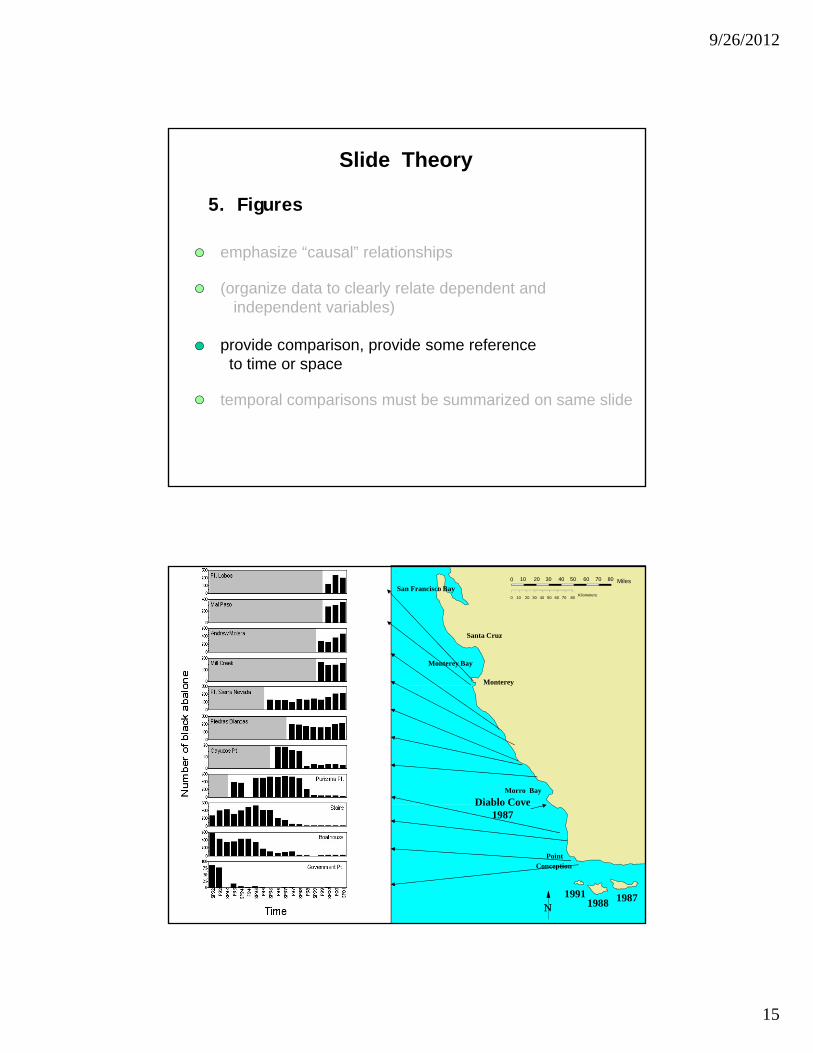
Slide Theory
emphasize “causal” relationships
(organize data to clearly relate dependent andindependent variables)
provide comparison, provide some referenceto time or spaceto time or space
temporal comparisons must be summarized on same slide
Monterey Bay
Monterey
Santa Cruz
San Francisco Bay0 10 20 30 40 50 60 70 80 Miles
0 10 20 30 40 50 60 70 80 Kilometers
???
???
???
???
y
Morro Bay1998
1998
???
???
Diablo Cove
Ν
PointConception
1988 198719911993
1995
1996Diablo Cove
1987
9/26/2012
16
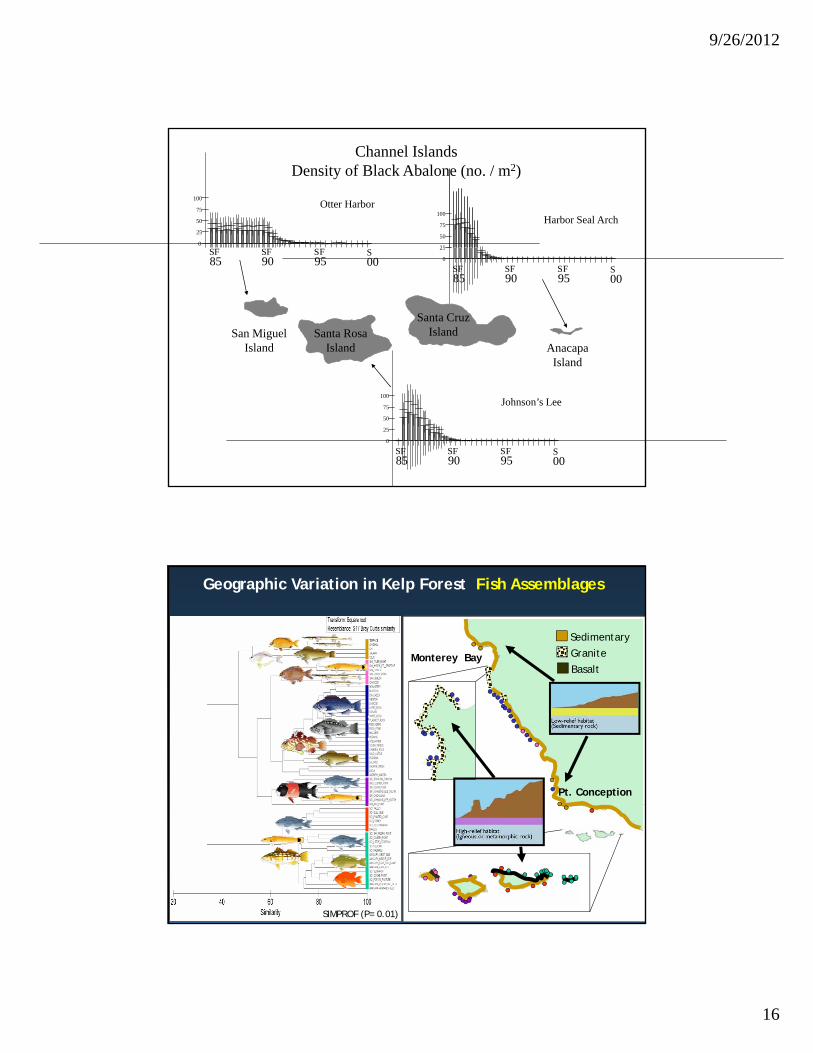
Channel IslandsDensity of Black Abalone (no. / m2)
25
50
75
100Harbor Seal Arch
25
50
75
100Otter Harbor
0
AnacapaIsland
Santa CruzIslandSan Miguel
IslandSanta Rosa
Island
0
25
SF85 90 95 00
SF SF S
SF85 90 95 00
SF SF S
0
25
50
75
100Johnson’s Lee
SF85 90 95 00
SF SF S
Geographic Variation in Kelp Forest Fish Assemblages
Monterey Bay
Sedimentary
Granite
Basalt
Monterey Bay
Sedimentary
Granite
Basalt
Pt. ConceptionPt. Conception
SIMPROF (P= 0.01)
9/26/2012
17
(Largely from seminar and books by Dr. Edward Tufte)
Graphics Theory
Problem 1: how to convey high dimensional dataProblem 1: how to convey high dimensional datain a 2 dimensional world… “escaping flatland”
Problem 2: convey as much information as necessarywithout losing the major point
Tufte’s grand principles of graphic display:
Graphics Theory
1. Provide comparison and referencep
2. Provide causality
3. Capture multivariate complexity
4. Motivation of display – quality of the data
5 Convey change over time within the eye span5. Convey change over time within the eye span
6. Maximize information content per unit area of page
7. Coordination and simplicity for clarity(okay, Carr snuck in this last grand principle)
9/26/2012
18
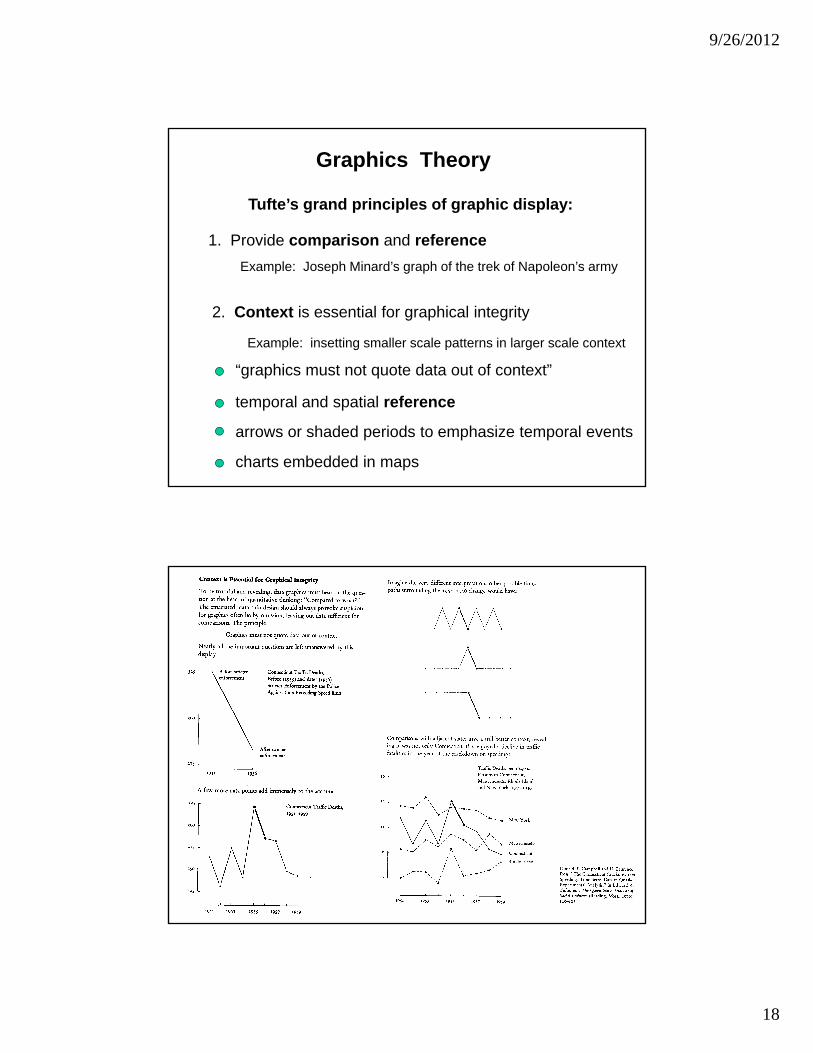
Tufte’s grand principles of graphic display:
Graphics Theory
1. Provide comparison and referencepExample: Joseph Minard’s graph of the trek of Napoleon’s army
2. Context is essential for graphical integrity
Example: insetting smaller scale patterns in larger scale context
“graphics must not quote data out of context”“graphics must not quote data out of context”
temporal and spatial reference
arrows or shaded periods to emphasize temporal events
charts embedded in maps
9/26/2012
19
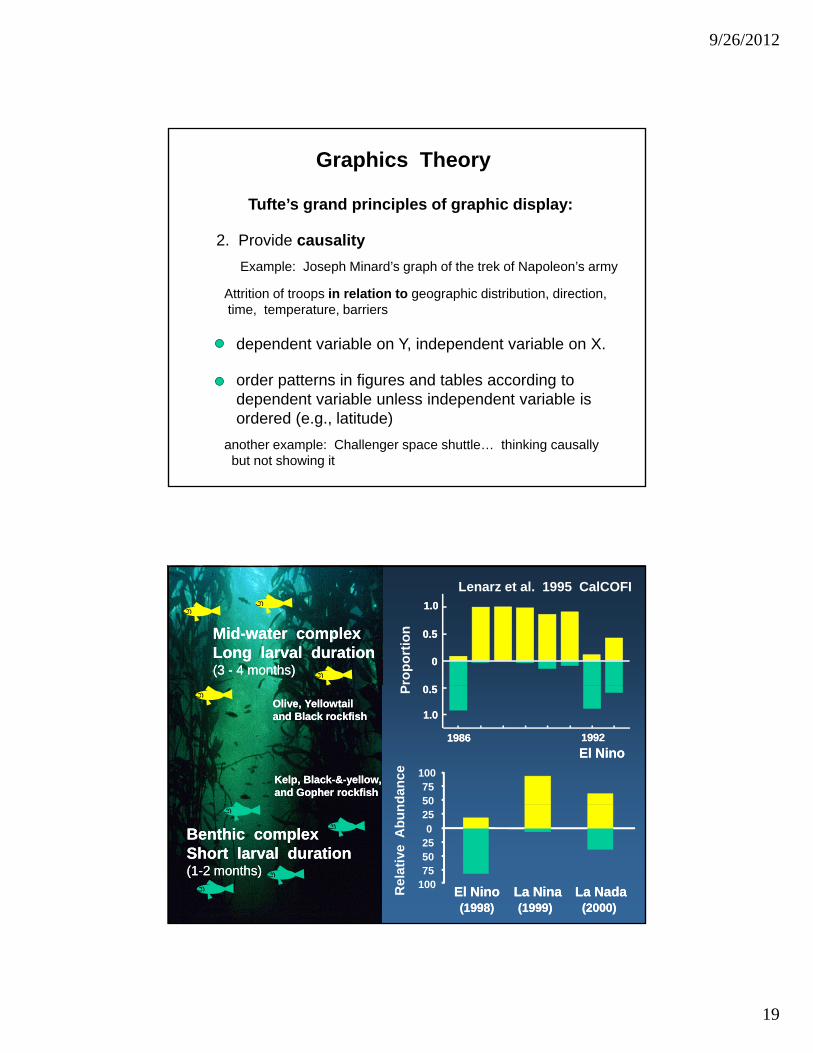
Tufte’s grand principles of graphic display:
Graphics Theory
2. Provide causalityyExample: Joseph Minard’s graph of the trek of Napoleon’s army
dependent variable on Y, independent variable on X.
Attrition of troops in relation to geographic distribution, direction,time, temperature, barriers
order patterns in figures and tables according to dependent variable unless independent variable is ordered (e.g., latitude)
another example: Challenger space shuttle… thinking causallybut not showing it
MidMid--water complexwater complexLong larval durationLong larval duration(3 (3 -- 4 months)4 months)
1.01.0
0.50.5
00
ropo
rtio
n
Lenarz et al. 1995 CalCOFI
Kelp, BlackKelp, Black--&&--yellow, yellow, and Gopher rockfishand Gopher rockfish
Olive, Yellowtail Olive, Yellowtail and Black rockfishand Black rockfish
5075
100
ndan
ce
19861986 19921992
0.50.5
1.01.0
P
El NinoEl Nino
(1998)(1998) (1999)(1999) (2000)(2000)El NinoEl Nino La NinaLa Nina La NadaLa Nada
Benthic complexBenthic complexShort larval durationShort larval duration(1(1--2 months)2 months)
1007550250
25
Rel
ativ
e A
bun
9/26/2012
20
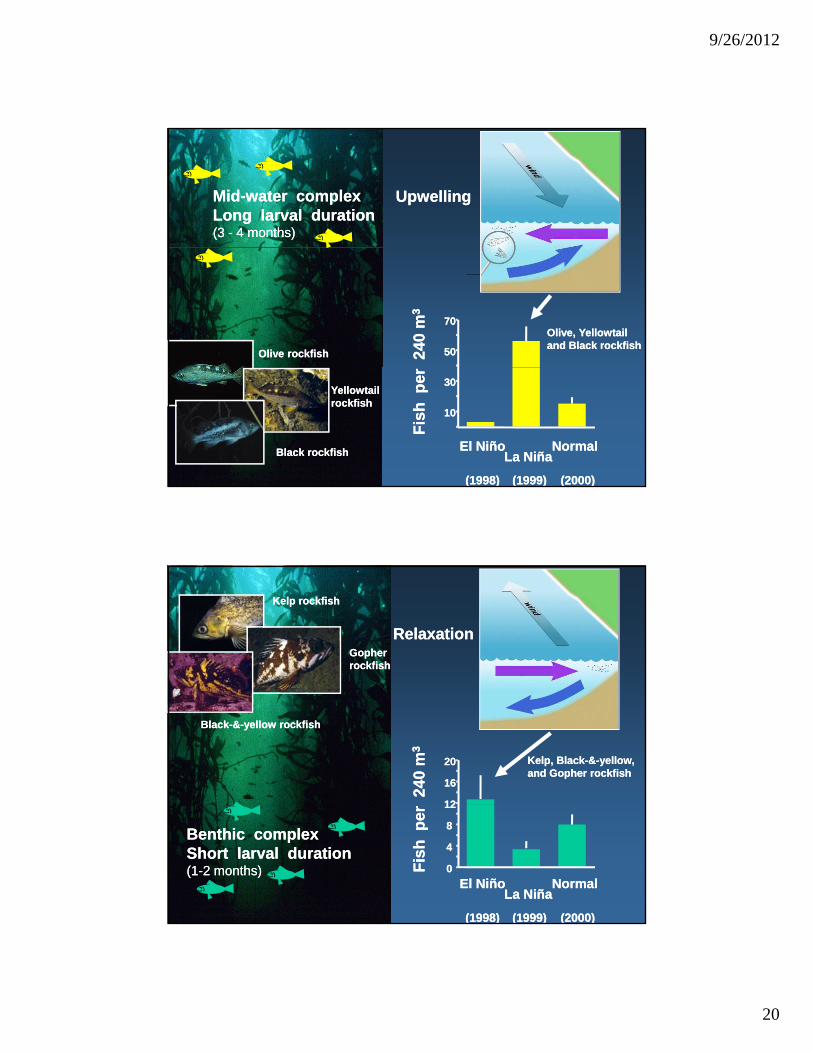
MidMid--water complexwater complexLong larval durationLong larval duration(3 (3 -- 4 months)4 months)
UpwellingUpwelling
5050
7070
240
m 2
40 m
33
Olive, Yellowtail Olive, Yellowtail and Black rockfishand Black rockfish
Olive rockfishOlive rockfish
1010
3030
(1998)(1998) (1999)(1999) (2000)(2000)
El NiEl NiññooLa NiLa Niññaa
NormalNormal
Fish
per
Fi
sh p
er
Black rockfishBlack rockfish
Yellowtail Yellowtail rockfishrockfish
RelaxationRelaxationGopher Gopher rockfishrockfish
Kelp rockfishKelp rockfish
240
m 2
40 m
33
1212
1616
2020 Kelp, BlackKelp, Black--&&--yellow, yellow, and Gopher rockfishand Gopher rockfish
BlackBlack--&&--yellow rockfishyellow rockfish
Benthic complexBenthic complexShort larval durationShort larval duration(1(1--2 months)2 months)
(1998)(1998) (1999)(1999) (2000)(2000)
El NiEl NiññooLa NiLa Niññaa
NormalNormal
Fish
per
Fi
sh p
er
00
44
88
1212
9/26/2012
21
mpe
ratu
re (
mpe
ratu
re (°°
C)
C)
1010
1111
1212
1313
1414
(3) Smaller-scale, more frequent events(Ammann unpublished)
MidMid--water complexwater complexn = 227 n = 227
Num
ber o
f fis
hN
umbe
r of f
ish
er s
ampl
ing
unit
er s
ampl
ing
unit
0.50.5
0.30.30.40.4
0.20.20.10.1
Tem
Tem
MayMay JuneJune JulyJuly AugustAugustYear 2000Year 2000
99
MayMay JuneJune JulyJuly AugustAugust
Num
ber o
f fis
hN
umbe
r of f
ish
per s
ampl
ing
unit
per s
ampl
ing
unit Benthic complexBenthic complex
n = 363 n = 363 0.50.5
0.30.30.40.4
0.20.20.10.10.00.0
pp 0.00.0
Tufte’s grand principles of graphic display:
Graphics Theory
3. Capture multivariate complexityExample: Joseph Minard’s graph of the trek of Napoleon’s army
Attrition of troops in relation to:- geographic distribution- direction- time- temperature- barriers
(i.e., 5-6 variables)
9/26/2012
22
Tufte’s grand principles of graphic display:
Graphics Theory
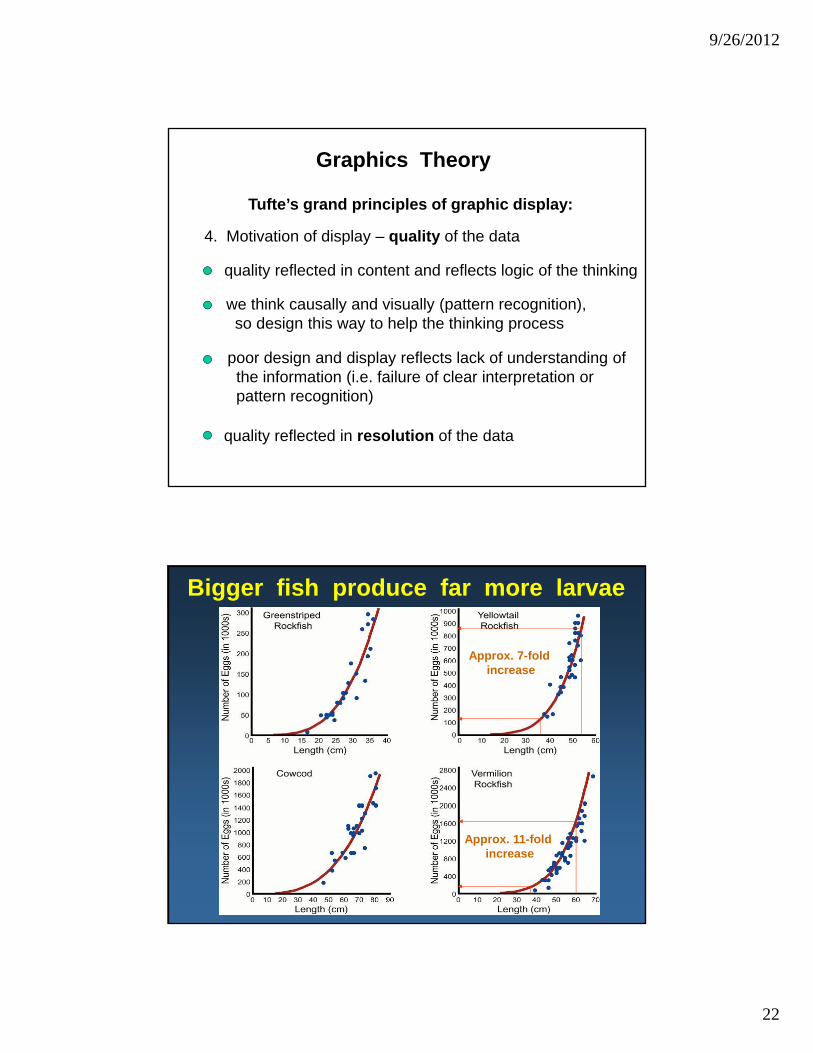
4. Motivation of display – quality of the data
we think causally and visually (pattern recognition),so design this way to help the thinking process
quality reflected in content and reflects logic of the thinking
poor design and display reflects lack of understanding of the information (i.e. failure of clear interpretation orpattern recognition)
quality reflected in resolution of the data
Bigger fish produce far more larvae
Approx. 7-fold increase
Approx. 11-fold increase
9/26/2012
23
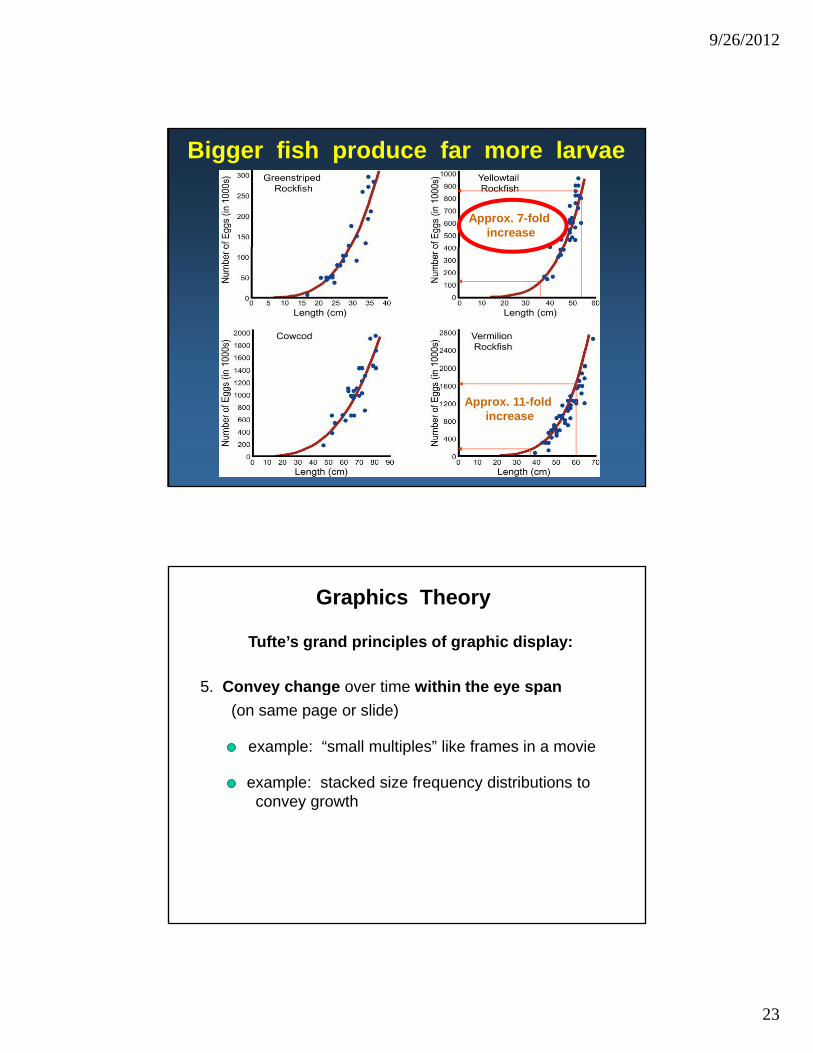
Bigger fish produce far more larvae
Approx. 7-fold increase
Approx. 11-fold increase
Tufte’s grand principles of graphic display:
Graphics Theory
5 Convey change over time within the eye span(on same page or slide)
example: “small multiples” like frames in a movie
example: stacked size frequency distributions toconvey growth
5. Convey change over time within the eye span
convey growth
9/26/2012
24
Tips more related to papers than talks…
Graphics Theory
Tufte’s grand principles of graphic display:
Graphics Theory
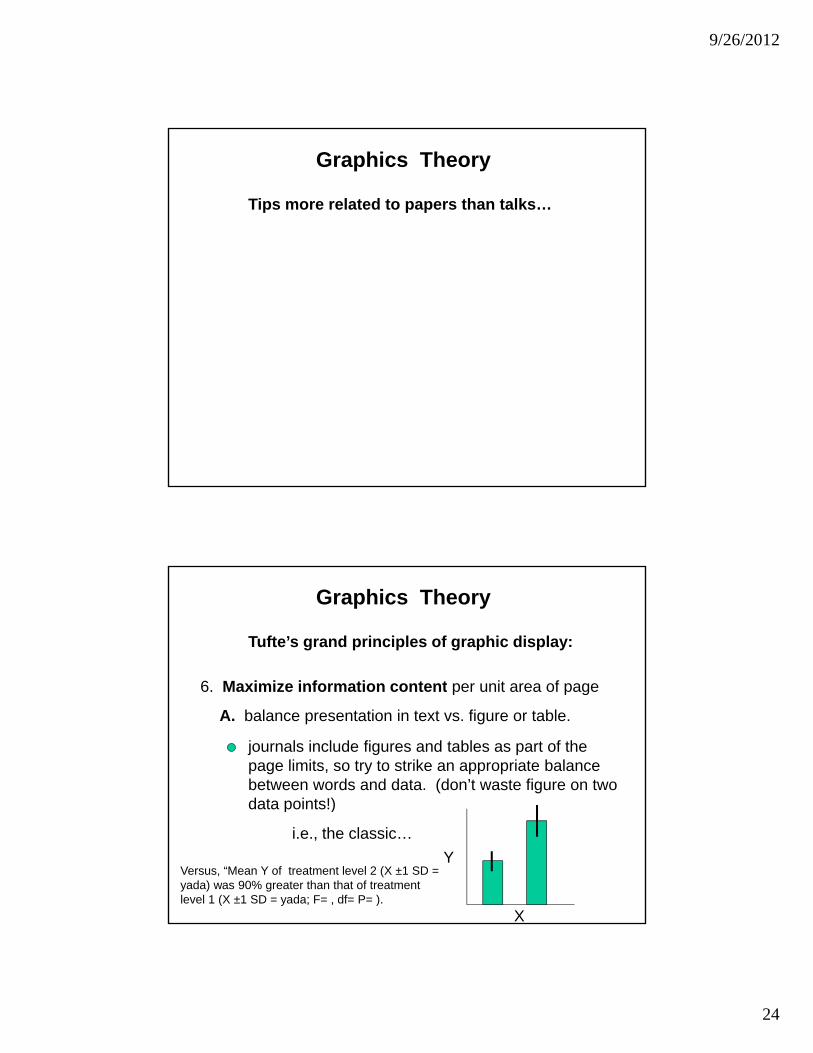
6 Maximize information content per unit area of page
journals include figures and tables as part of the page limits, so try to strike an appropriate balance between words and data. (don’t waste figure on two data points!)
6. Maximize information content per unit area of page
A. balance presentation in text vs. figure or table.
data points!)
i.e., the classic…
X
YVersus, “Mean Y of treatment level 2 (X ±1 SD = yada) was 90% greater than that of treatment level 1 (X ±1 SD = yada; F= , df= P= ).
9/26/2012
25
Tufte’s grand principles of graphic display:
Graphics Theory
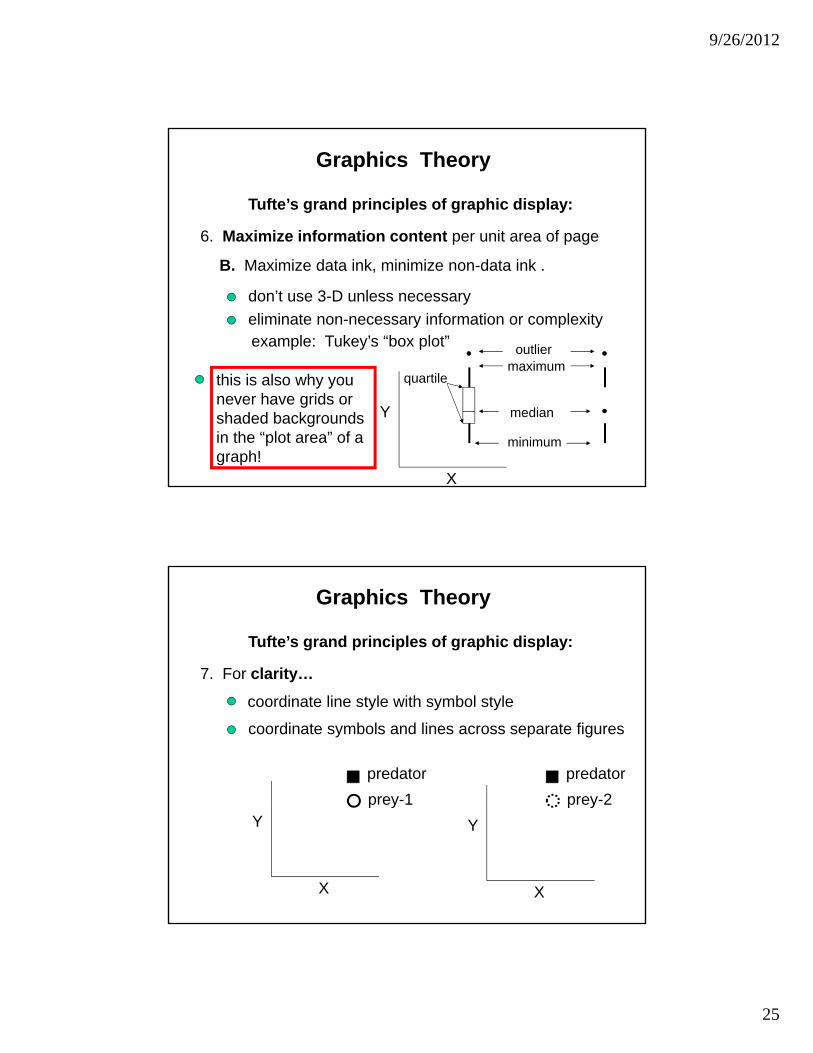
6. Maximize information content per unit area of page
don’t use 3-D unless necessary
B. Maximize data ink, minimize non-data ink .
eliminate non-necessary information or complexity example: Tukey’s “box plot”
maximumoutlier
quartile
X
Y median
maximum
minimum
this is also why you never have grids or shaded backgrounds in the “plot area” of a graph!
Tufte’s grand principles of graphic display:
Graphics Theory
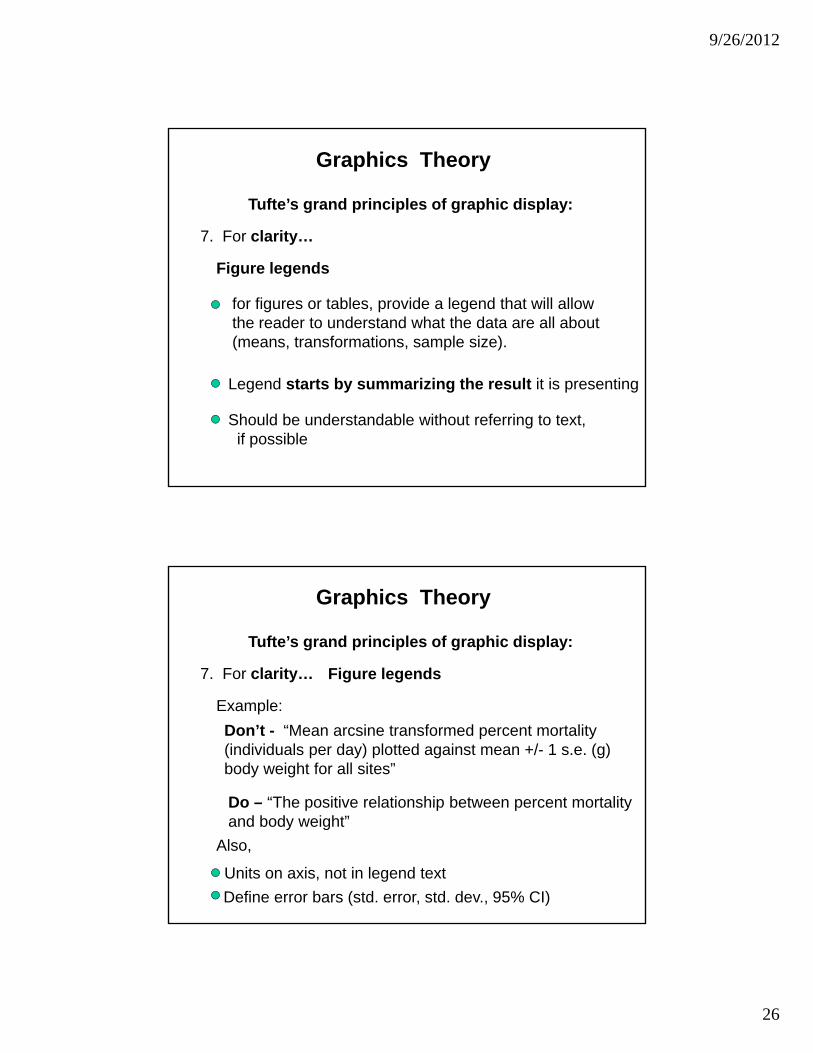
7. For clarity…
coordinate line style with symbol style
coordinate symbols and lines across separate figures
predatorprey-1
predatorprey-2
X
Yp ey
X
Yp ey
9/26/2012
26
Tufte’s grand principles of graphic display:
Graphics Theory
7. For clarity…
for figures or tables, provide a legend that will allow the reader to understand what the data are all about (means, transformations, sample size).
Figure legends
Legend starts by summarizing the result it is presenting
Should be understandable without referring to text,if possible
Tufte’s grand principles of graphic display:
Graphics Theory
7. For clarity… Figure legends
Example:Don’t - “Mean arcsine transformed percent mortality (individuals per day) plotted against mean +/- 1 s.e. (g) body weight for all sites”
Do – “The positive relationship between percent mortalityDo The positive relationship between percent mortality and body weight”
Units on axis, not in legend textDefine error bars (std. error, std. dev., 95% CI)
Also,
9/26/2012
27
PowerPoint Tips
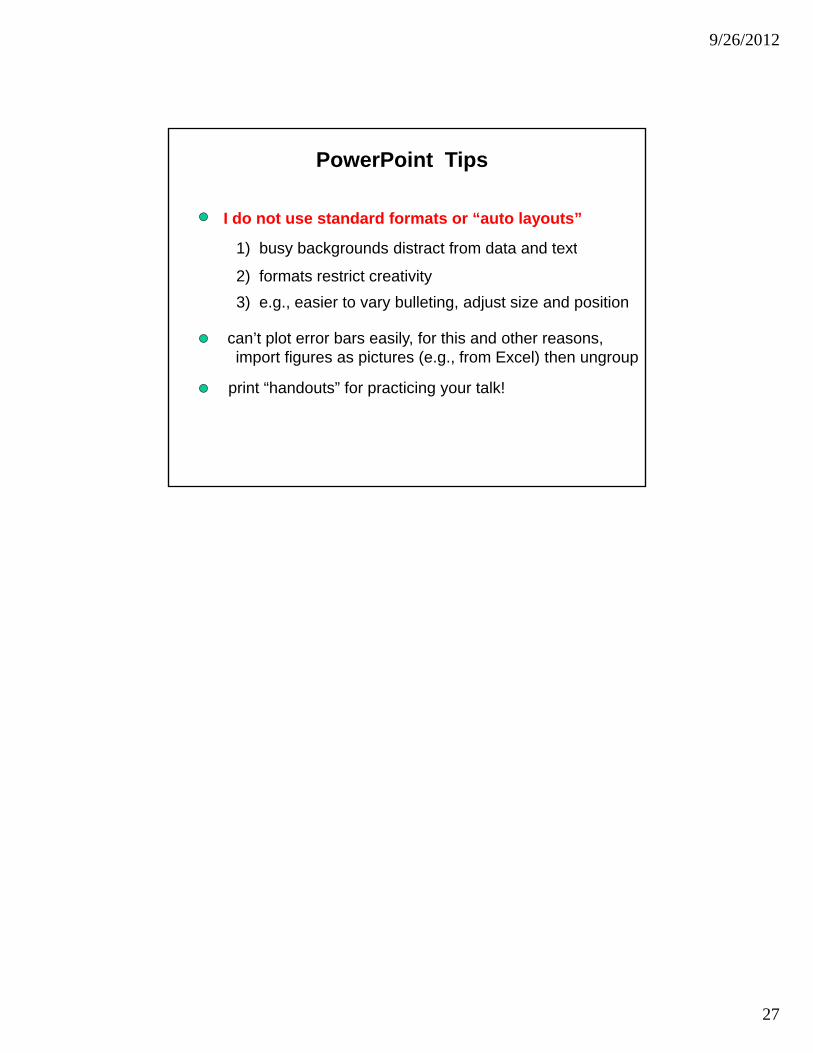
I do not use standard formats or “auto layouts”
1) busy backgrounds distract from data and text1) busy backgrounds distract from data and text
2) formats restrict creativity3) e.g., easier to vary bulleting, adjust size and position
can’t plot error bars easily, for this and other reasons,import figures as pictures (e.g., from Excel) then ungroup
print “handouts” for practicing your talk!