tips for navigating the targeted improvement plan · 2016-2017 targeted improvement plan ......
TRANSCRIPT
Feature/Tip
Completion of the Data Analysis Summary
Zoom Level Bar
Check Box Selection
Expanding the Height of Rows
2016-2017 Targeted Improvement Plan - for PC and Mac Users
Tips for Navigating the Targeted Improvement Plan
Explanation Screenshot
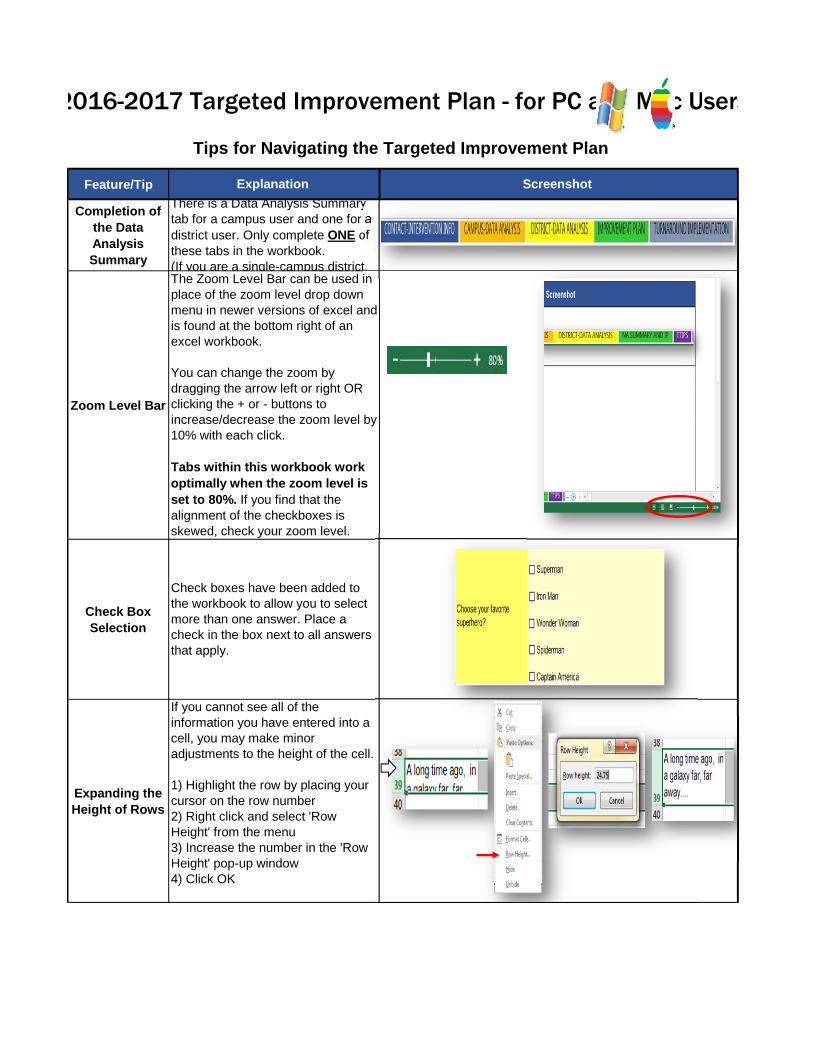
There is a Data Analysis Summary tab for a campus user and one for a district user. Only complete ONE of these tabs in the workbook. (If you are a single-campus district, The Zoom Level Bar can be used in place of the zoom level drop down menu in newer versions of excel and is found at the bottom right of an excel workbook.
You can change the zoom by dragging the arrow left or right OR clicking the + or - buttons to increase/decrease the zoom level by 10% with each click.
Tabs within this workbook work optimally when the zoom level is set to 80%. If you find that the alignment of the checkboxes is skewed, check your zoom level.
Check boxes have been added to the workbook to allow you to select more than one answer. Place a check in the box next to all answers that apply.
If you cannot see all of the information you have entered into a cell, you may make minor adjustments to the height of the cell.
1) Highlight the row by placing your cursor on the row number2) Right click and select 'Row Height' from the menu3) Increase the number in the 'Row Height' pop-up window4) Click OK
ewing Help Boxe
Using the Copy/Paste
feature within the Excel document
Entering the District/Campus Information
List of Acronyms
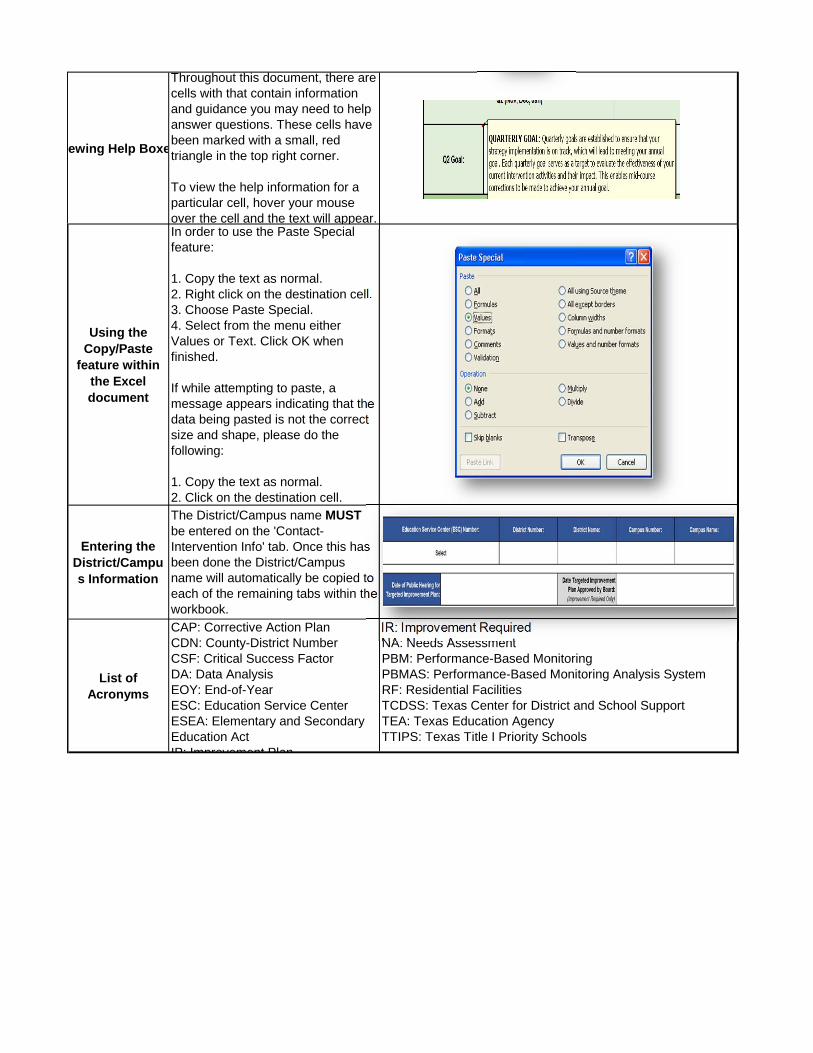
CAP: Corrective Action Plan CDN: County-District NumberCSF: Critical Success FactorDA: Data AnalysisEOY: End-of-YearESC: Education Service CenterESEA: Elementary and Secondary Education ActIP: Improvement Plan
IR: Improvement RequiredNA: Needs AssessmentPBM: Performance-Based MonitoringPBMAS: Performance-Based Monitoring Analysis SystemRF: Residential FacilitiesTCDSS: Texas Center for District and School SupportTEA: Texas Education AgencyTTIPS: Texas Title I Priority Schools
Throughout this document, there are cells with that contain information and guidance you may need to help answer questions. These cells have been marked with a small, red triangle in the top right corner.
To view the help information for a particular cell, hover your mouse over the cell and the text will appear. In order to use the Paste Special feature:
1. Copy the text as normal.2. Right click on the destination cell.3. Choose Paste Special.4. Select from the menu either Values or Text. Click OK when finished.
If while attempting to paste, a message appears indicating that the data being pasted is not the correct size and shape, please do the following:
1. Copy the text as normal. 2. Click on the destination cell.The District/Campus name MUST be entered on the 'Contact-Intervention Info' tab. Once this has been done the District/Campus name will automatically be copied to each of the remaining tabs within the workbook.
District Number: District Name: Campus Number: Campus Name:
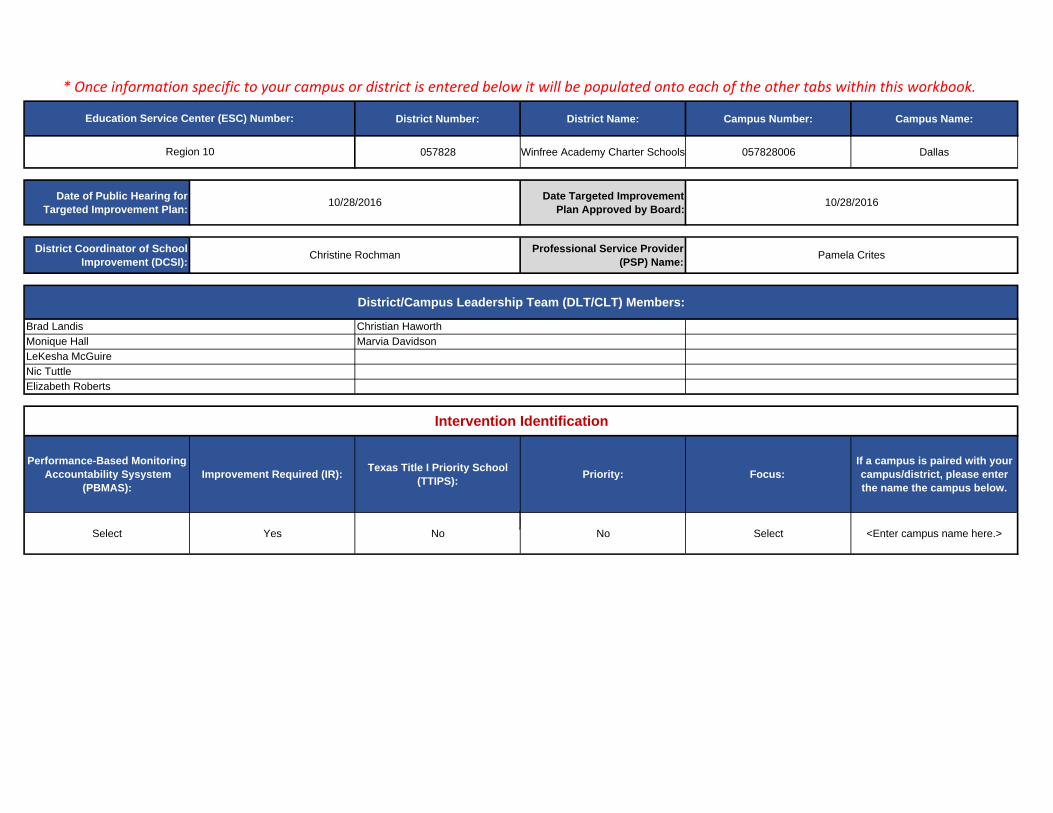
057828 Winfree Academy Charter Schools 057828006 Dallas
Date of Public Hearing for Targeted Improvement Plan:
Date Targeted Improvement Plan Approved by Board:
District Coordinator of School Improvement (DCSI):
Professional Service Provider (PSP) Name:
Performance-Based Monitoring Accountability Sysystem
(PBMAS): Improvement Required (IR):
Texas Title I Priority School (TTIPS):
Priority: Focus:If a campus is paired with your campus/district, please enter the name the campus below.
Select Yes No No Select <Enter campus name here.>
Intervention Identification
Elizabeth Roberts
Christian Haworth
Marvia Davidson
* Once information specific to your campus or district is entered below it will be populated onto each of the other tabs within this workbook.
Brad Landis
Monique Hall
LeKesha McGuire
Nic Tuttle
Region 10
Christine Rochman
10/28/2016 10/28/2016
District/Campus Leadership Team (DLT/CLT) Members:
Education Service Center (ESC) Number:
Pamela Crites
057828
District Number:
Winfree Academy Charter Schools
District Name:
057828006
Campus Number:
Dallas
Campus Name:
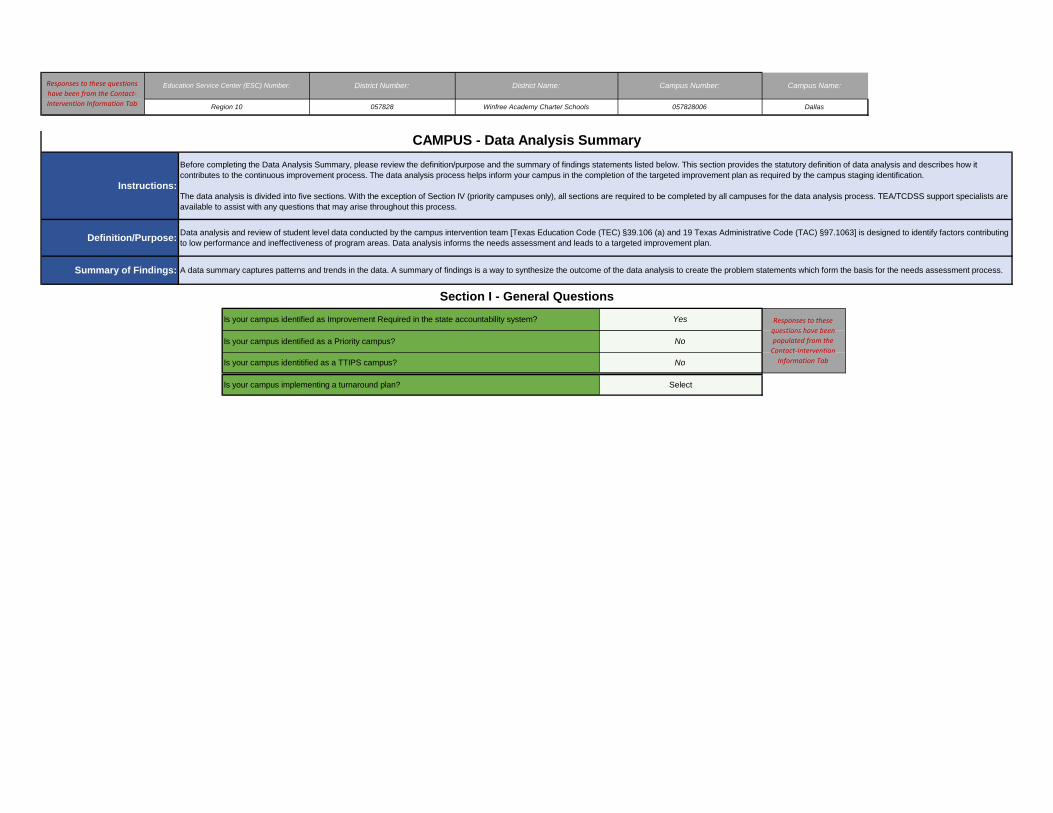
Is your campus identified as a Priority campus? No
Responses to these questions have been populated from the Contact‐Intervention Information Tab
Responses to these questions have been from the Contact‐Intervention Information Tab Region 10
Education Service Center (ESC) Number:
Instructions:
Yes
No
SelectIs your campus implementing a turnaround plan?
Is your campus identitified as a TTIPS campus?
Definition/Purpose:
Is your campus identified as Improvement Required in the state accountability system?
Section I - General Questions
CAMPUS - Data Analysis Summary
Before completing the Data Analysis Summary, please review the definition/purpose and the summary of findings statements listed below. This section provides the statutory definition of data analysis and describes how it contributes to the continuous improvement process. The data analysis process helps inform your campus in the completion of the targeted improvement plan as required by the campus staging identification.
The data analysis is divided into five sections. With the exception of Section IV (priority campuses only), all sections are required to be completed by all campuses for the data analysis process. TEA/TCDSS support specialists are available to assist with any questions that may arise throughout this process.
Data analysis and review of student level data conducted by the campus intervention team [Texas Education Code (TEC) §39.106 (a) and 19 Texas Administrative Code (TAC) §97.1063] is designed to identify factors contributing to low performance and ineffectiveness of program areas. Data analysis informs the needs assessment and leads to a targeted improvement plan.
A data summary captures patterns and trends in the data. A summary of findings is a way to synthesize the outcome of the data analysis to create the problem statements which form the basis for the needs assessment process.Summary of Findings:
Reading Writing Science Social Studies Mathematics
Reading Writing Science Social Studies Mathematics
Reading Writing Science Social Studies Mathematics
Reading Writing Science Social Studies Mathematics
Reading Writing Science Social Studies Mathematics
Reading Writing Science Social Studies Mathematics
Reading Writing Science Social Studies Mathematics
Reading Writing Science Social Studies Mathematics
Reading Writing Science Social Studies Mathematics
Reading Writing Science Social Studies Mathematics
African American
Hispanic White American Indian Asian Pacific IslanderTwo or More Races
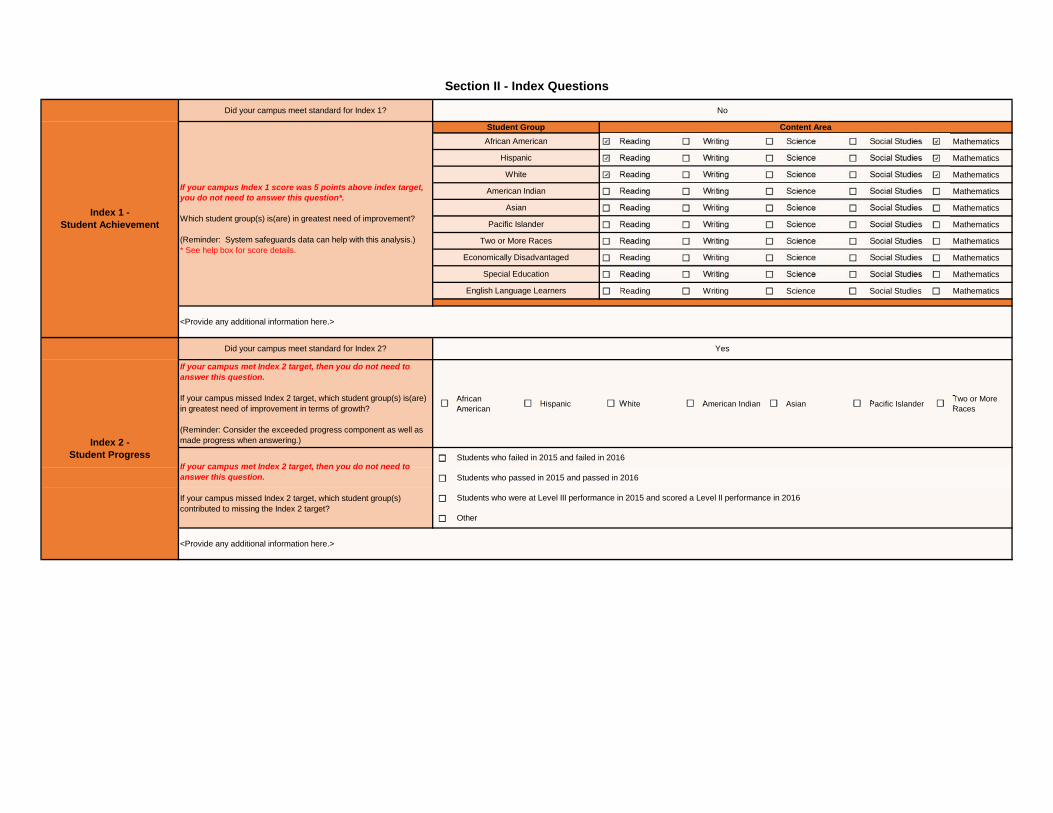
Index 2 - Student Progress
Index 1 -Student Achievement
Students who failed in 2015 and failed in 2016
If your campus met Index 2 target, then you do not need to answer this question.
If your campus missed Index 2 target, which student group(s) is(are) in greatest need of improvement in terms of growth?
(Reminder: Consider the exceeded progress component as well as made progress when answering.)
Section II - Index Questions
Other
Students who were at Level III performance in 2015 and scored a Level II performance in 2016
Students who passed in 2015 and passed in 2016
<Provide any additional information here.>
<Provide any additional information here.>
White
Hispanic
African American
Did your campus meet standard for Index 1?
Student Group Content Area
If your campus Index 1 score was 5 points above index target, you do not need to answer this question*.
Which student group(s) is(are) in greatest need of improvement?
(Reminder: System safeguards data can help with this analysis.) * See help box for score details.
No
American Indian
Asian
Pacific Islander
Two or More Races
Economically Disadvantaged
Special Education
English Language Learners
Did your campus meet standard for Index 2? Yes
If your campus met Index 2 target, then you do not need to answer this question.
If your campus missed Index 2 target, which student group(s) contributed to missing the Index 2 target?
African American
Hispanic White American Indian Asian Pacific IslanderTwo or More Races
African American
Hispanic White American Indian Asian Pacific IslanderTwo or More Races
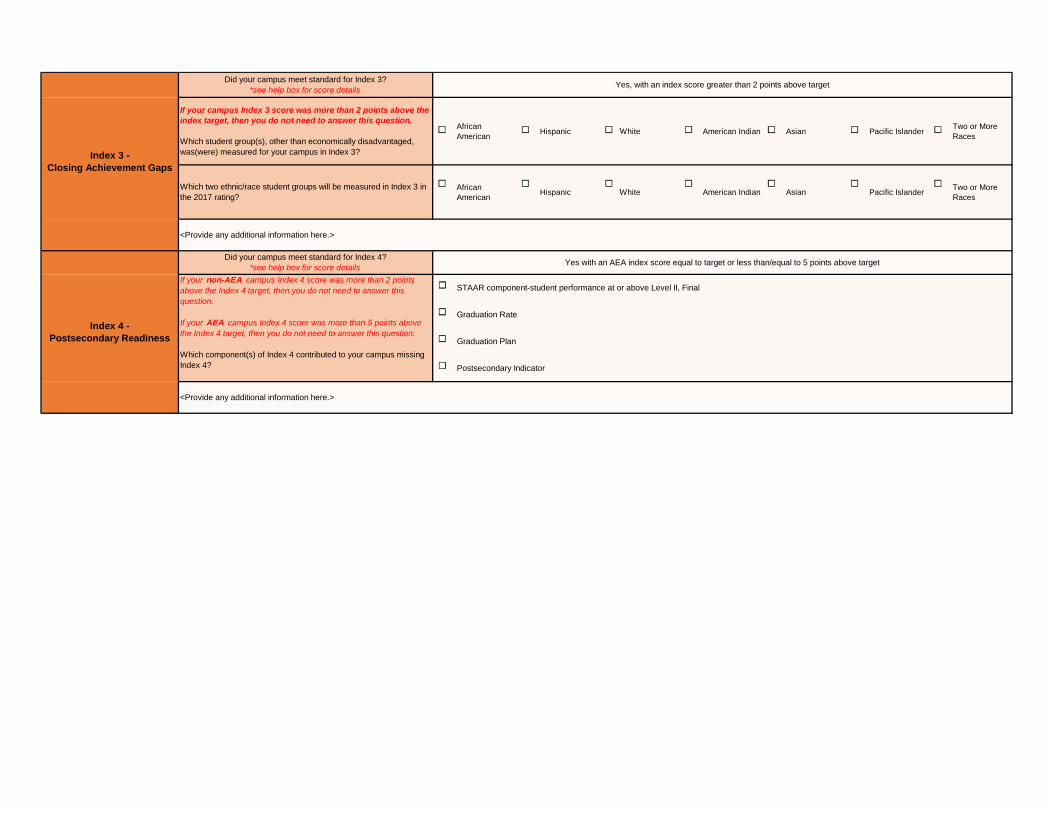
Index 4 -Postsecondary Readiness
Index 3 -Closing Achievement Gaps
Graduation Rate
STAAR component-student performance at or above Level II, FinalIf your non-AEA campus Index 4 score was more than 2 points above the Index 4 target, then you do not need to answer this question.
If your AEA campus Index 4 score was more than 5 points above the Index 4 target, then you do not need to answer this question.
Which component(s) of Index 4 contributed to your campus missing Index 4? Postsecondary Indicator
Graduation Plan
<Provide any additional information here.>
<Provide any additional information here.>
Did your campus meet standard for Index 4?*see help box for score details Yes with an AEA index score equal to target or less than/equal to 5 points above target
Did your campus meet standard for Index 3?*see help box for score details
If your campus Index 3 score was more than 2 points above the index target, then you do not need to answer this question.
Which student group(s), other than economically disadvantaged, was(were) measured for your campus in Index 3?
Yes, with an index score greater than 2 points above target
Which two ethnic/race student groups will be measured in Index 3 in the 2017 rating?
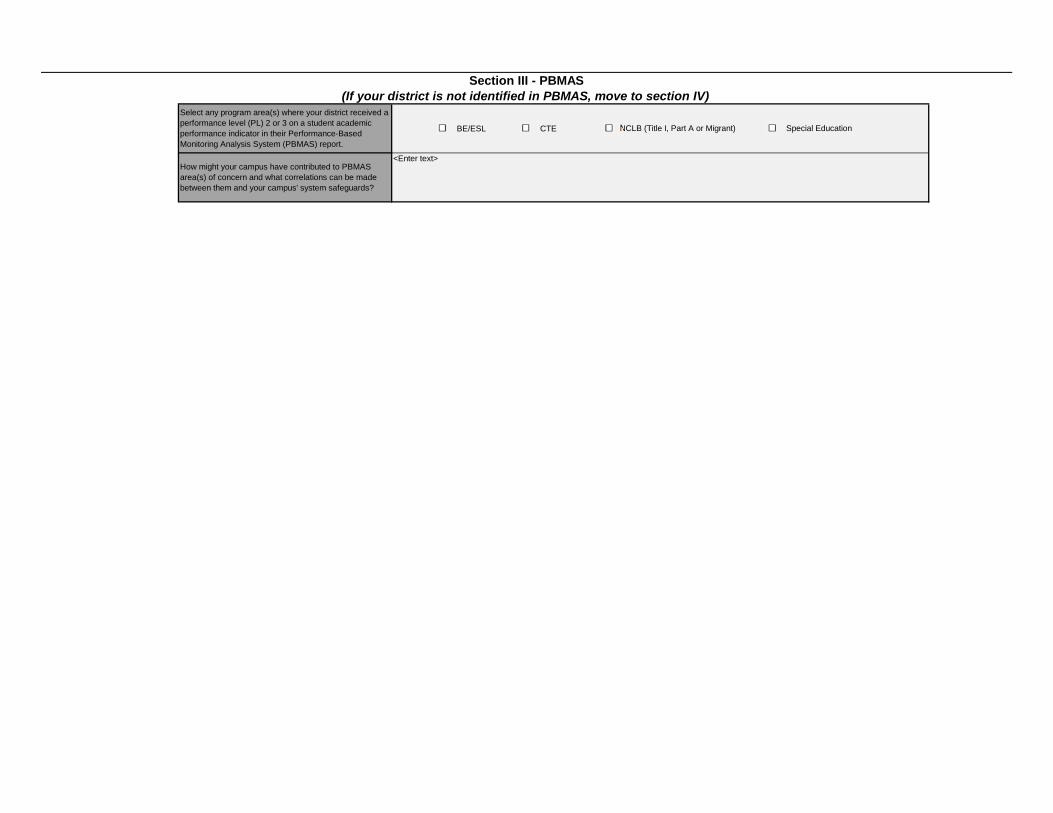
BE/ESL CTE NCLB (Title I, Part A or Migrant) Special Education
Select any program area(s) where your district received a performance level (PL) 2 or 3 on a student academic performance indicator in their Performance-Based Monitoring Analysis System (PBMAS) report.
Section III - PBMAS(If your district is not identified in PBMAS, move to section IV)
<Enter text>How might your campus have contributed to PBMAS area(s) of concern and what correlations can be made between them and your campus' system safeguards?
(For possible data sources, see the document)CSF Data Sources
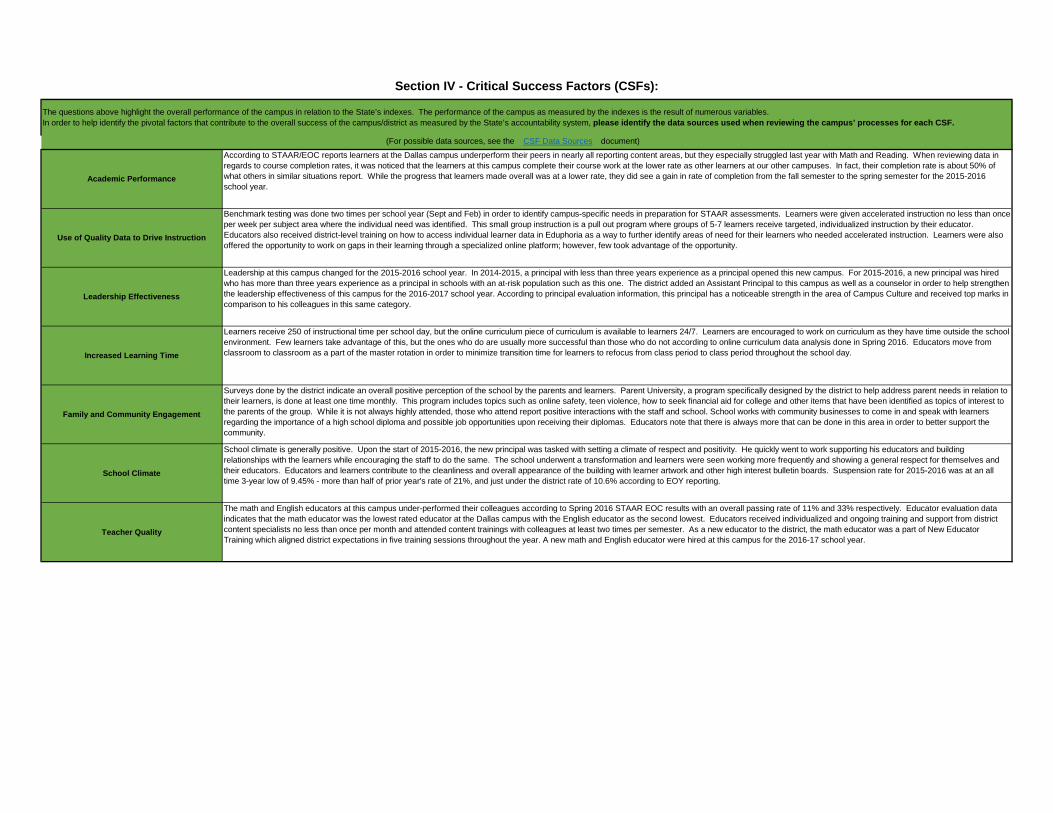
School climate is generally positive. Upon the start of 2015-2016, the new principal was tasked with setting a climate of respect and positivity. He quickly went to work supporting his educators and building relationships with the learners while encouraging the staff to do the same. The school underwent a transformation and learners were seen working more frequently and showing a general respect for themselves and their educators. Educators and learners contribute to the cleanliness and overall appearance of the building with learner artwork and other high interest bulletin boards. Suspension rate for 2015-2016 was at an all time 3-year low of 9.45% - more than half of prior year's rate of 21%, and just under the district rate of 10.6% according to EOY reporting.
Surveys done by the district indicate an overall positive perception of the school by the parents and learners. Parent University, a program specifically designed by the district to help address parent needs in relation to their learners, is done at least one time monthly. This program includes topics such as online safety, teen violence, how to seek financial aid for college and other items that have been identified as topics of interest to the parents of the group. While it is not always highly attended, those who attend report positive interactions with the staff and school. School works with community businesses to come in and speak with learners regarding the importance of a high school diploma and possible job opportunities upon receiving their diplomas. Educators note that there is always more that can be done in this area in order to better support the community.
Learners receive 250 of instructional time per school day, but the online curriculum piece of curriculum is available to learners 24/7. Learners are encouraged to work on curriculum as they have time outside the school environment. Few learners take advantage of this, but the ones who do are usually more successful than those who do not according to online curriculum data analysis done in Spring 2016. Educators move from classroom to classroom as a part of the master rotation in order to minimize transition time for learners to refocus from class period to class period throughout the school day.
Leadership at this campus changed for the 2015-2016 school year. In 2014-2015, a principal with less than three years experience as a principal opened this new campus. For 2015-2016, a new principal was hired who has more than three years experience as a principal in schools with an at-risk population such as this one. The district added an Assistant Principal to this campus as well as a counselor in order to help strengthen the leadership effectiveness of this campus for the 2016-2017 school year. According to principal evaluation information, this principal has a noticeable strength in the area of Campus Culture and received top marks in comparison to his colleagues in this same category.
Benchmark testing was done two times per school year (Sept and Feb) in order to identify campus-specific needs in preparation for STAAR assessments. Learners were given accelerated instruction no less than once per week per subject area where the individual need was identified. This small group instruction is a pull out program where groups of 5-7 learners receive targeted, individualized instruction by their educator. Educators also received district-level training on how to access individual learner data in Eduphoria as a way to further identify areas of need for their learners who needed accelerated instruction. Learners were also offered the opportunity to work on gaps in their learning through a specialized online platform; however, few took advantage of the opportunity.
Section IV - Critical Success Factors (CSFs):
The questions above highlight the overall performance of the campus in relation to the State’s indexes. The performance of the campus as measured by the indexes is the result of numerous variables. In order to help identify the pivotal factors that contribute to the overall success of the campus/district as measured by the State’s accountability system, please identify the data sources used when reviewing the campus’ processes for each CSF.
Academic Performance
Use of Quality Data to Drive Instruction
Leadership Effectiveness
According to STAAR/EOC reports learners at the Dallas campus underperform their peers in nearly all reporting content areas, but they especially struggled last year with Math and Reading. When reviewing data in regards to course completion rates, it was noticed that the learners at this campus complete their course work at the lower rate as other learners at our other campuses. In fact, their completion rate is about 50% of what others in similar situations report. While the progress that learners made overall was at a lower rate, they did see a gain in rate of completion from the fall semester to the spring semester for the 2015-2016 school year.
Teacher Quality
The math and English educators at this campus under-performed their colleagues according to Spring 2016 STAAR EOC results with an overall passing rate of 11% and 33% respectively. Educator evaluation data indicates that the math educator was the lowest rated educator at the Dallas campus with the English educator as the second lowest. Educators received individualized and ongoing training and support from district content specialists no less than once per month and attended content trainings with colleagues at least two times per semester. As a new educator to the district, the math educator was a part of New Educator Training which aligned district expectations in five training sessions throughout the year. A new math and English educator were hired at this campus for the 2016-17 school year.
Increased Learning Time
Family and Community Engagement
School Climate
Reading Writing Science Social Studies Mathematics
Reading Writing Science Social Studies Mathematics
Reading Writing Science Social Studies Mathematics
Reading Writing Science Social Studies Mathematics
Reading Writing Science Social Studies Mathematics
Reading Writing Science Social Studies Mathematics
Reading Writing Science Social Studies Mathematics
Reading Writing Science Social Studies Mathematics
Reading Writing Science Social Studies Mathematics
Reading Writing Science Social Studies Mathematics
Reading Writing Science Social Studies Mathematics
Reading Writing Science Social Studies Mathematics
Reading Writing Science Social Studies Mathematics
Reading Writing Science Social Studies Mathematics
Reading Writing Science Social Studies Mathematics
Reading Writing Science Social Studies Mathematics
Reading Writing Science Social Studies Mathematics
Reading Writing Science Social Studies Mathematics
Reading Writing Science Social Studies Mathematics
Reading Writing Science Social Studies Mathematics
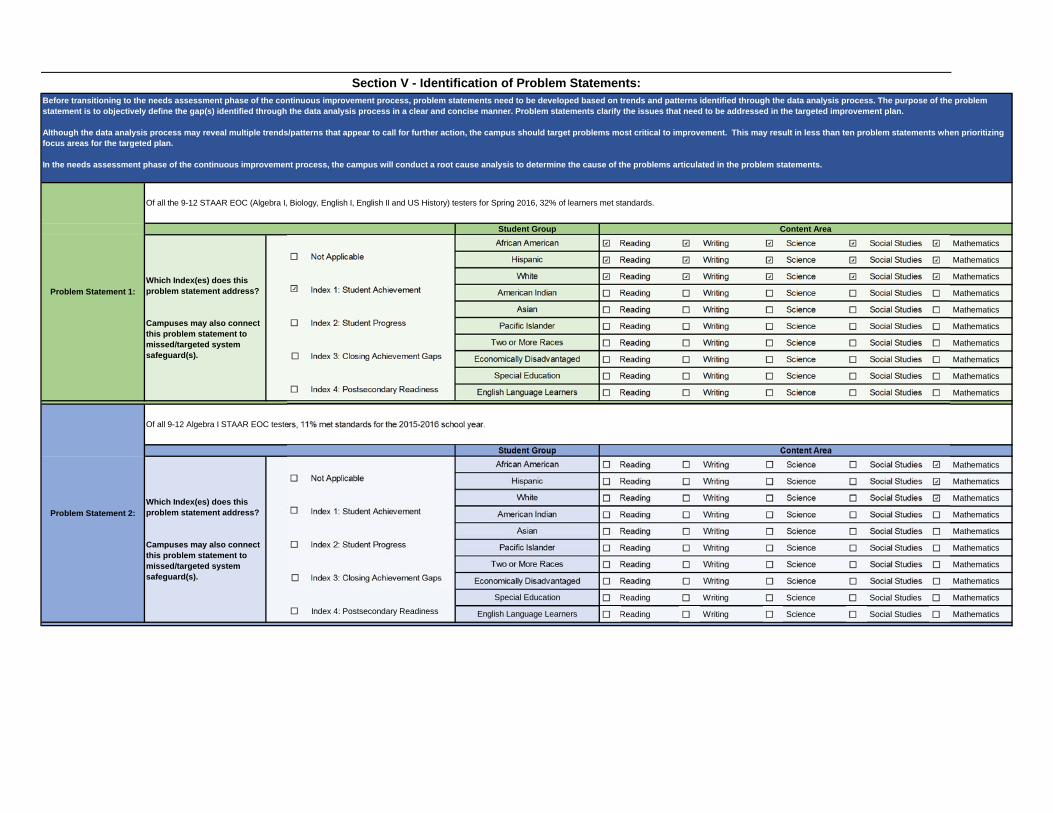
Of all the 9-12 STAAR EOC (Algebra I, Biology, English I, English II and US History) testers for Spring 2016, 32% of learners met standards.
Not Applicable
Index 1: Student Achievement
Index 2: Student Progress
Student Group
Special Education
English Language Learners
African American
Hispanic
Content Area
Of all 9-12 Algebra I STAAR EOC testers, 11% met standards for the 2015-2016 school year.
Student Group
Which Index(es) does this problem statement address?
Campuses may also connect this problem statement to missed/targeted system safeguard(s).
African American
Not Applicable Hispanic
White
Index 1: Student Achievement American Indian
Asian
Index 2: Student Progress Pacific Islander
Two or More Races
Index 3: Closing Achievement Gaps Economically Disadvantaged
Problem Statement 1:
Problem Statement 2:
Which Index(es) does this problem statement address?
Campuses may also connect this problem statement to missed/targeted system safeguard(s).
Content Area
Section V - Identification of Problem Statements:Before transitioning to the needs assessment phase of the continuous improvement process, problem statements need to be developed based on trends and patterns identified through the data analysis process. The purpose of the problem statement is to objectively define the gap(s) identified through the data analysis process in a clear and concise manner. Problem statements clarify the issues that need to be addressed in the targeted improvement plan.
Although the data analysis process may reveal multiple trends/patterns that appear to call for further action, the campus should target problems most critical to improvement. This may result in less than ten problem statements when prioritizing focus areas for the targeted plan.
In the needs assessment phase of the continuous improvement process, the campus will conduct a root cause analysis to determine the cause of the problems articulated in the problem statements.
Index 4: Postsecondary Readiness
Index 3: Closing Achievement Gaps
White
American Indian
Asian
Pacific Islander
Two or More Races
Economically Disadvantaged
Special Education
Index 4: Postsecondary Readiness English Language Learners

Reading Writing Science Social Studies Mathematics
Reading Writing Science Social Studies Mathematics
Reading Writing Science Social Studies Mathematics
Reading Writing Science Social Studies Mathematics
Reading Writing Science Social Studies Mathematics
Reading Writing Science Social Studies Mathematics
Reading Writing Science Social Studies Mathematics
Reading Writing Science Social Studies Mathematics
Reading Writing Science Social Studies Mathematics
Reading Writing Science Social Studies Mathematics
Reading Writing Science Social Studies Mathematics
Reading Writing Science Social Studies Mathematics
Reading Writing Science Social Studies Mathematics
Reading Writing Science Social Studies Mathematics
Reading Writing Science Social Studies Mathematics
Reading Writing Science Social Studies Mathematics
Reading Writing Science Social Studies Mathematics
Reading Writing Science Social Studies Mathematics
Reading Writing Science Social Studies Mathematics
Reading Writing Science Social Studies Mathematics
Problem Statement 4:
Content Area
Problem Statement 3:
Of all 9-12 English I and English II STAAR EOC testers, 33% met standards for the 2015-2016 school year.
Student Group Content Area
Which Index(es) does this problem statement address?
Campuses may also connect this problem statement to missed/targeted system safeguard(s).
African American
Not Applicable Hispanic
White
Index 1: Student Achievement American Indian
Asian
Index 2: Student Progress Pacific Islander
Two or More Races
Index 3: Closing Achievement Gaps Economically Disadvantaged
Special Education
Index 4: Postsecondary Readiness English Language Learners
<Type your problem statement here.>
Student Group
Which Index(es) does this problem statement address?
Campuses may also connect this problem statement to missed/targeted system safeguard(s).
African American
Not Applicable Hispanic
White
Index 1: Student Achievement American Indian
Asian
Index 2: Student Progress Pacific Islander
Two or More Races
Index 3: Closing Achievement Gaps Economically Disadvantaged
Special Education
Index 4: Postsecondary Readiness English Language Learners
Reading Writing Science Social Studies Mathematics
Reading Writing Science Social Studies Mathematics
Reading Writing Science Social Studies Mathematics
Reading Writing Science Social Studies Mathematics
Reading Writing Science Social Studies Mathematics
Reading Writing Science Social Studies Mathematics
Reading Writing Science Social Studies Mathematics
Reading Writing Science Social Studies Mathematics
Reading Writing Science Social Studies Mathematics
Reading Writing Science Social Studies Mathematics
Reading Writing Science Social Studies Mathematics
Reading Writing Science Social Studies Mathematics
Reading Writing Science Social Studies Mathematics
Reading Writing Science Social Studies Mathematics
Reading Writing Science Social Studies Mathematics
Reading Writing Science Social Studies Mathematics
Reading Writing Science Social Studies Mathematics
Reading Writing Science Social Studies Mathematics
Reading Writing Science Social Studies Mathematics
Reading Writing Science Social Studies Mathematics
Problem Statement 5:
Content Area
Problem Statement 6:
Content Area
<Type your problem statement here.>
<Type your problem statement here.>
Student Group
Which Index(es) does this problem statement address?
Campuses may also connect this problem statement to missed/targeted system safeguard(s).
African American
Not Applicable Hispanic
White
Index 1: Student Achievement American Indian
Asian
Index 2: Student Progress Pacific Islander
Two or More Races
Index 3: Closing Achievement Gaps Economically Disadvantaged
Special Education
Index 4: Postsecondary Readiness English Language Learners
Reading Writing Science Social Studies Mathematics
Reading Writing Science Social Studies Mathematics
Reading Writing Science Social Studies Mathematics
Reading Writing Science Social Studies Mathematics
Reading Writing Science Social Studies Mathematics
Reading Writing Science Social Studies Mathematics
Reading Writing Science Social Studies Mathematics
Reading Writing Science Social Studies Mathematics
Reading Writing Science Social Studies Mathematics
Reading Writing Science Social Studies Mathematics
Reading Writing Science Social Studies Mathematics
Reading Writing Science Social Studies Mathematics
Reading Writing Science Social Studies Mathematics
Reading Writing Science Social Studies Mathematics
Reading Writing Science Social Studies Mathematics
Reading Writing Science Social Studies Mathematics
Reading Writing Science Social Studies Mathematics
Reading Writing Science Social Studies Mathematics
Reading Writing Science Social Studies Mathematics
Reading Writing Science Social Studies Mathematics
Problem Statement 7:
Content Area
Problem Statement 8:
Content Area
<Type your problem statement here.>
Student Group
Which Index(es) does this problem statement address?
Campuses may also connect this problem statement to missed/targeted system safeguard(s).
African American
Not Applicable Hispanic
White
Index 1: Student Achievement American Indian
Asian
Index 2: Student Progress Pacific Islander
Two or More Races
Index 3: Closing Achievement Gaps
English Language Learners
<Type your problem statement here.>
Student Group
Which Index(es) does this problem statement address?
Campuses may also connect this problem statement to missed/targeted system safeguard(s).
African American
Not Applicable Hispanic
White
Index 1: Student Achievement American Indian
Asian
Index 2: Student Progress Pacific Islander
Two or More Races
Index 3: Closing Achievement Gaps Economically Disadvantaged
Special Education
Index 4: Postsecondary Readiness
Economically Disadvantaged
Special Education
Index 4: Postsecondary Readiness English Language Learners
Reading Writing Science Social Studies Mathematics
Reading Writing Science Social Studies Mathematics
Reading Writing Science Social Studies Mathematics
Reading Writing Science Social Studies Mathematics
Reading Writing Science Social Studies Mathematics
Reading Writing Science Social Studies Mathematics
Reading Writing Science Social Studies Mathematics
Reading Writing Science Social Studies Mathematics
Reading Writing Science Social Studies Mathematics
Reading Writing Science Social Studies Mathematics
Reading Writing Science Social Studies Mathematics
Reading Writing Science Social Studies Mathematics
Reading Writing Science Social Studies Mathematics
Reading Writing Science Social Studies Mathematics
Reading Writing Science Social Studies Mathematics
Reading Writing Science Social Studies Mathematics
Reading Writing Science Social Studies Mathematics
Reading Writing Science Social Studies Mathematics
Reading Writing Science Social Studies Mathematics
Reading Writing Science Social Studies Mathematics
<Type your problem statement here.>
Student Group
Which Index(es) does this problem statement address?
Campuses may also connect this problem statement to missed/targeted system safeguard(s).
African American
Not Applicable Hispanic
White
Index 1: Student Achievement American Indian
Asian
Problem Statement 9:
Content Area
<Type your problem statement here.>
Student Group
Problem Statement 10:
Content Area
Index 2: Student Progress Pacific Islander
Two or More Races
Index 3: Closing Achievement Gaps Economically Disadvantaged
Special Education
Index 4: Postsecondary Readiness English Language Learners
Which Index(es) does this problem statement address?
Campuses may also connect this problem statement to missed/targeted system safeguard(s).
African American
Not Applicable Hispanic
White
Index 1: Student Achievement American Indian
Asian
Index 2: Student Progress Pacific Islander
Two or More Races
Index 3: Closing Achievement Gaps Economically Disadvantaged
Special Education
Index 4: Postsecondary Readiness English Language Learners
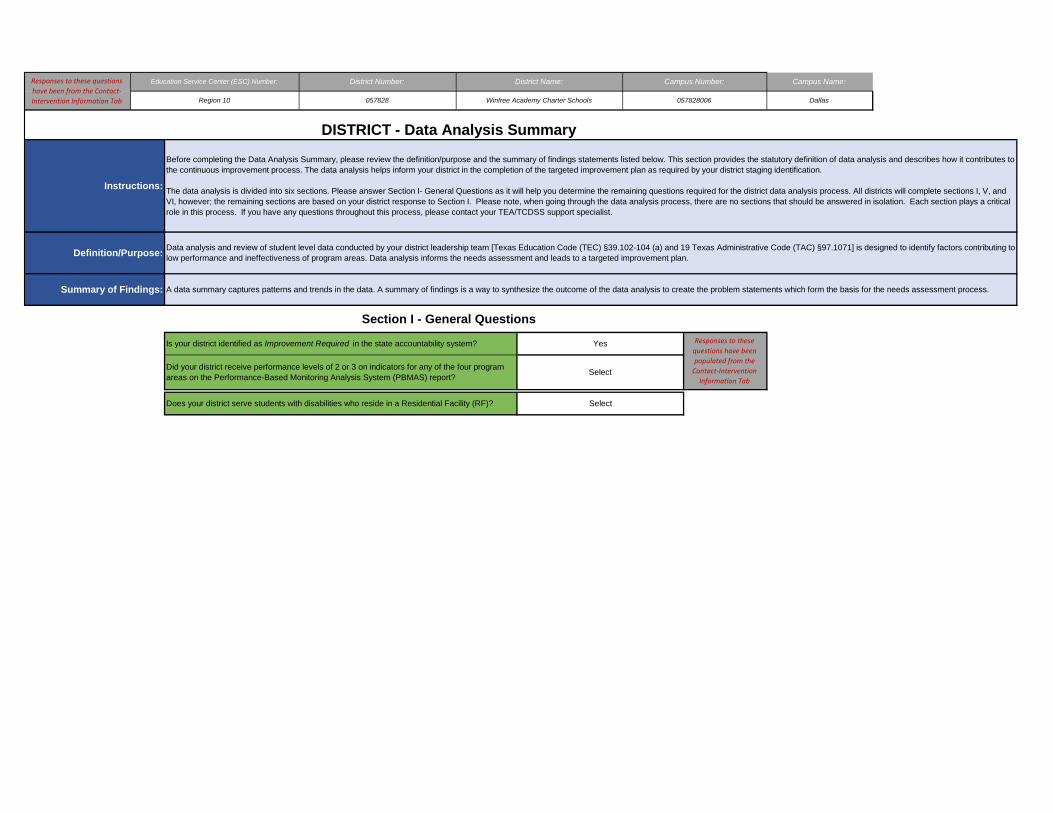
Does your district serve students with disabilities who reside in a Residential Facility (RF)?
Did your district receive performance levels of 2 or 3 on indicators for any of the four program areas on the Performance-Based Monitoring Analysis System (PBMAS) report?
Is your district identified as Improvement Required in the state accountability system?
Summary of Findings:
Responses to these questions have been from the Contact‐Intervention Information Tab
Education Service Center (ESC) Number: District Number: District Name: Campus Number: Campus Name:
Region 10 057828 Winfree Academy Charter Schools 057828006 Dallas
DISTRICT - Data Analysis Summary
Section I - General Questions
Definition/Purpose:
Instructions:
Before completing the Data Analysis Summary, please review the definition/purpose and the summary of findings statements listed below. This section provides the statutory definition of data analysis and describes how it contributes to the continuous improvement process. The data analysis helps inform your district in the completion of the targeted improvement plan as required by your district staging identification.
The data analysis is divided into six sections. Please answer Section I- General Questions as it will help you determine the remaining questions required for the district data analysis process. All districts will complete sections I, V, and VI, however; the remaining sections are based on your district response to Section I. Please note, when going through the data analysis process, there are no sections that should be answered in isolation. Each section plays a critical role in this process. If you have any questions throughout this process, please contact your TEA/TCDSS support specialist.
Data analysis and review of student level data conducted by your district leadership team [Texas Education Code (TEC) §39.102-104 (a) and 19 Texas Administrative Code (TAC) §97.1071] is designed to identify factors contributing to low performance and ineffectiveness of program areas. Data analysis informs the needs assessment and leads to a targeted improvement plan.
A data summary captures patterns and trends in the data. A summary of findings is a way to synthesize the outcome of the data analysis to create the problem statements which form the basis for the needs assessment process.
Select
Select
Yes Responses to these questions have been populated from the Contact‐Intervention Information Tab
Reading Writing Science Social Studies Mathematics
Reading Writing Science Social Studies Mathematics
Reading Writing Science Social Studies Mathematics
Reading Writing Science Social Studies Mathematics
Reading Writing Science Social Studies Mathematics
Reading Writing Science Social Studies Mathematics
Reading Writing Science Social Studies Mathematics
Reading Writing Science Social Studies Mathematics
Reading Writing Science Social Studies Mathematics
Reading Writing Science Social Studies Mathematics
African American
Hispanic White American Indian Asian Pacific IslanderTwo or More Races
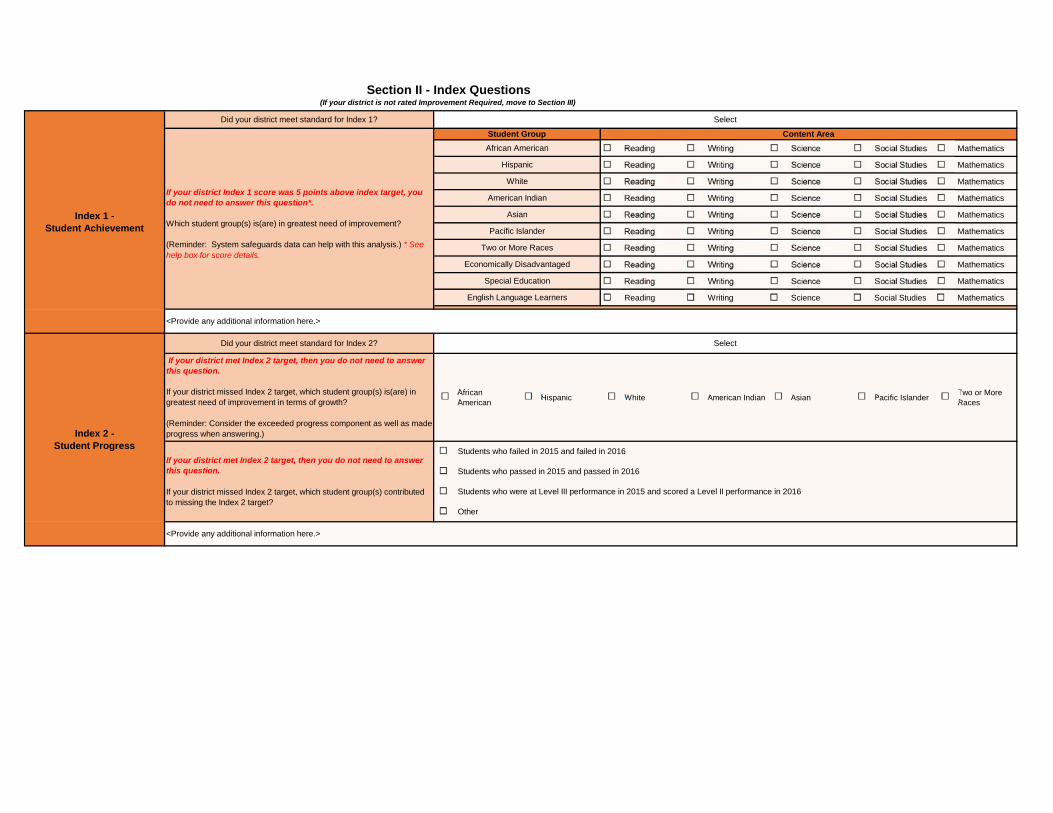
Did your district meet standard for Index 2?
Did your district meet standard for Index 1?
If your district Index 1 score was 5 points above index target, you do not need to answer this question*.
Which student group(s) is(are) in greatest need of improvement?
(Reminder: System safeguards data can help with this analysis.) * See help box for score details.
If your district met Index 2 target, then you do not need to answer this question.
If your district missed Index 2 target, which student group(s) is(are) in greatest need of improvement in terms of growth?
(Reminder: Consider the exceeded progress component as well as made progress when answering.)
Economically Disadvantaged
Two or More Races
Pacific Islander
Section II - Index Questions(If your district is not rated Improvement Required, move to Section III)
Index 2 -Student Progress
Index 1 -Student Achievement
English Language Learners
Special Education
Asian
American Indian
White
Hispanic
African American
Student Group
Select
<Provide any additional information here.>
Content Area
Select
<Provide any additional information here.>
Other
Students who were at Level III performance in 2015 and scored a Level II performance in 2016
Students who passed in 2015 and passed in 2016
Students who failed in 2015 and failed in 2016If your district met Index 2 target, then you do not need to answer this question.
If your district missed Index 2 target, which student group(s) contributed to missing the Index 2 target?
African American
Hispanic White American Indian Asian Pacific IslanderTwo or More Races
African American
Hispanic White American Indian Asian Pacific IslanderTwo or More Races
<Provide any additional information here.>
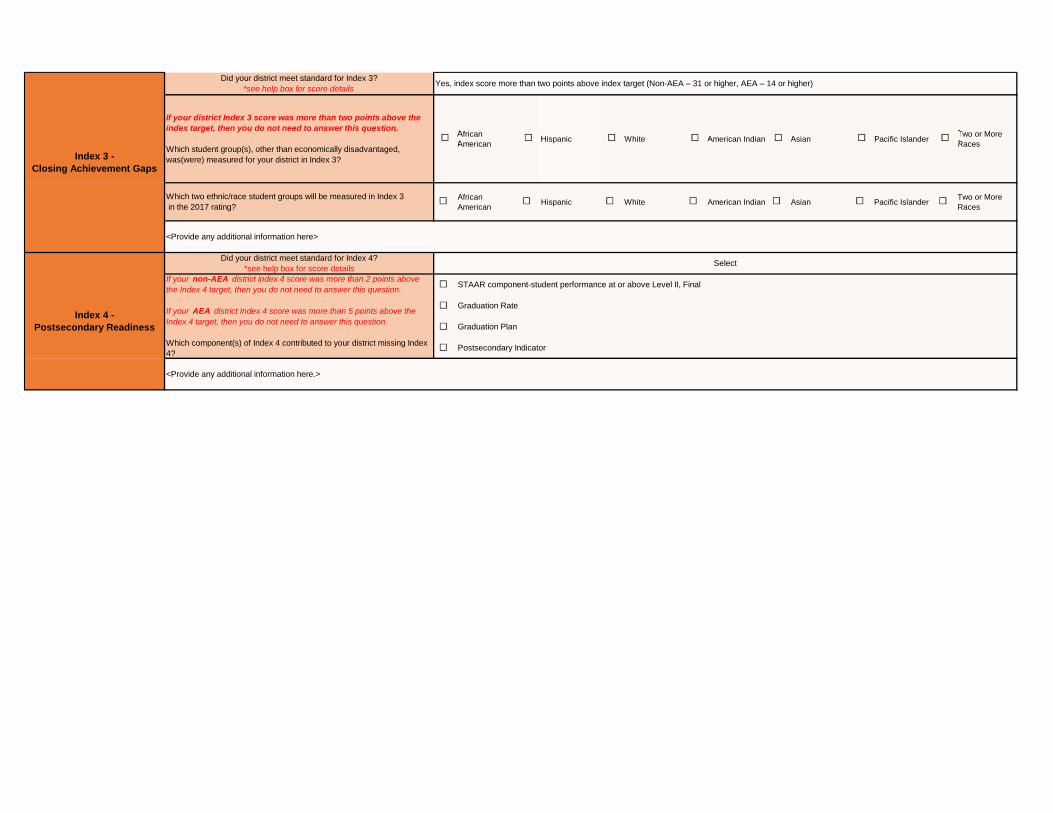
Did your district meet standard for Index 3?*see help box for score details
If your district Index 3 score was more than two points above the index target, then you do not need to answer this question.
Which student group(s), other than economically disadvantaged, was(were) measured for your district in Index 3?
Which two ethnic/race student groups will be measured in Index 3 in the 2017 rating?
Did your district meet standard for Index 4?*see help box for score details
Select
<Provide any additional information here>
Yes, index score more than two points above index target (Non-AEA – 31 or higher, AEA – 14 or higher)
If your non-AEA district index 4 score was more than 2 points above the Index 4 target, then you do not need to answer this question.
If your AEA district Index 4 score was more than 5 points above the Index 4 target, then you do not need to answer this question.
Which component(s) of Index 4 contributed to your district missing Index 4?
STAAR component-student performance at or above Level II, Final
Graduation Rate
Graduation Plan
Postsecondary Indicator
Index 4 -Postsecondary Readiness
Index 3 -Closing Achievement Gaps
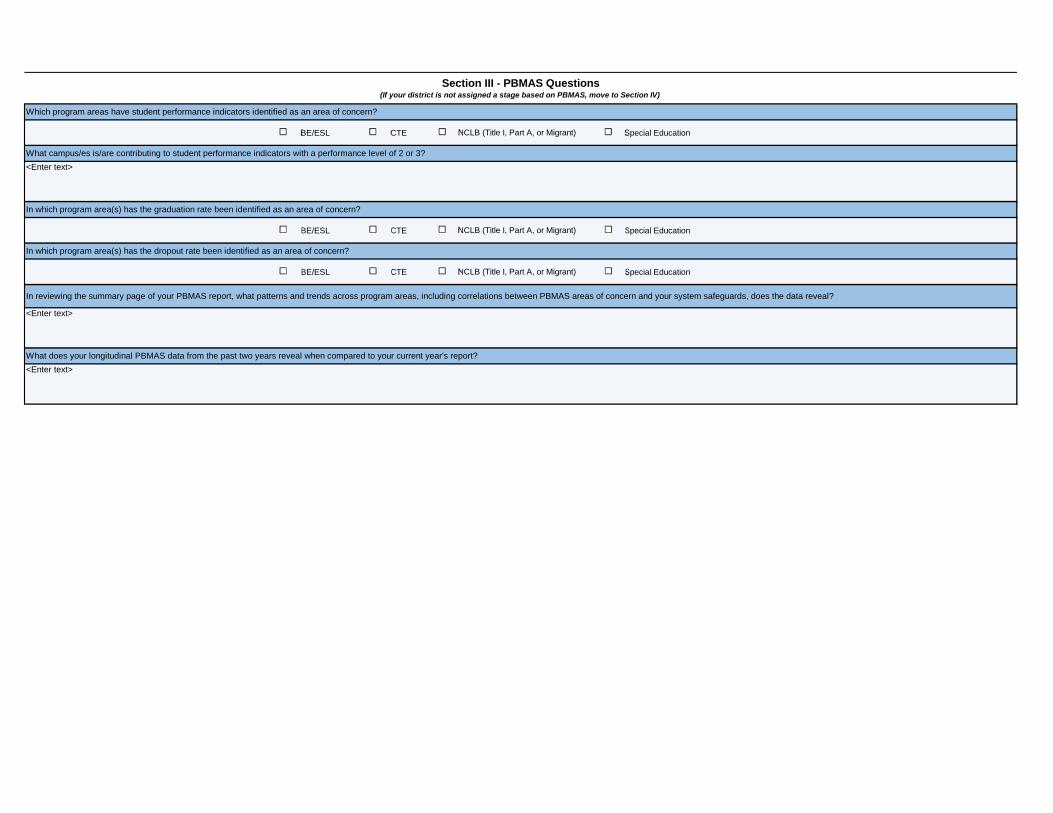
BE/ESL CTE Special Education
BE/ESL CTE Special Education
BE/ESL CTE Special Education
<Enter text>
Section III - PBMAS Questions(If your district is not assigned a stage based on PBMAS, move to Section IV)
Which program areas have student performance indicators identified as an area of concern?
NCLB (Title I, Part A, or Migrant)
NCLB (Title I, Part A, or Migrant)
NCLB (Title I, Part A, or Migrant)
<Enter text>
<Enter text>
What does your longitudinal PBMAS data from the past two years reveal when compared to your current year's report?
In reviewing the summary page of your PBMAS report, what patterns and trends across program areas, including correlations between PBMAS areas of concern and your system safeguards, does the data reveal?
In which program area(s) has the dropout rate been identified as an area of concern?
In which program area(s) has the graduation rate been identified as an area of concern?
What campus/es is/are contributing to student performance indicators with a performance level of 2 or 3?
<Enter text>
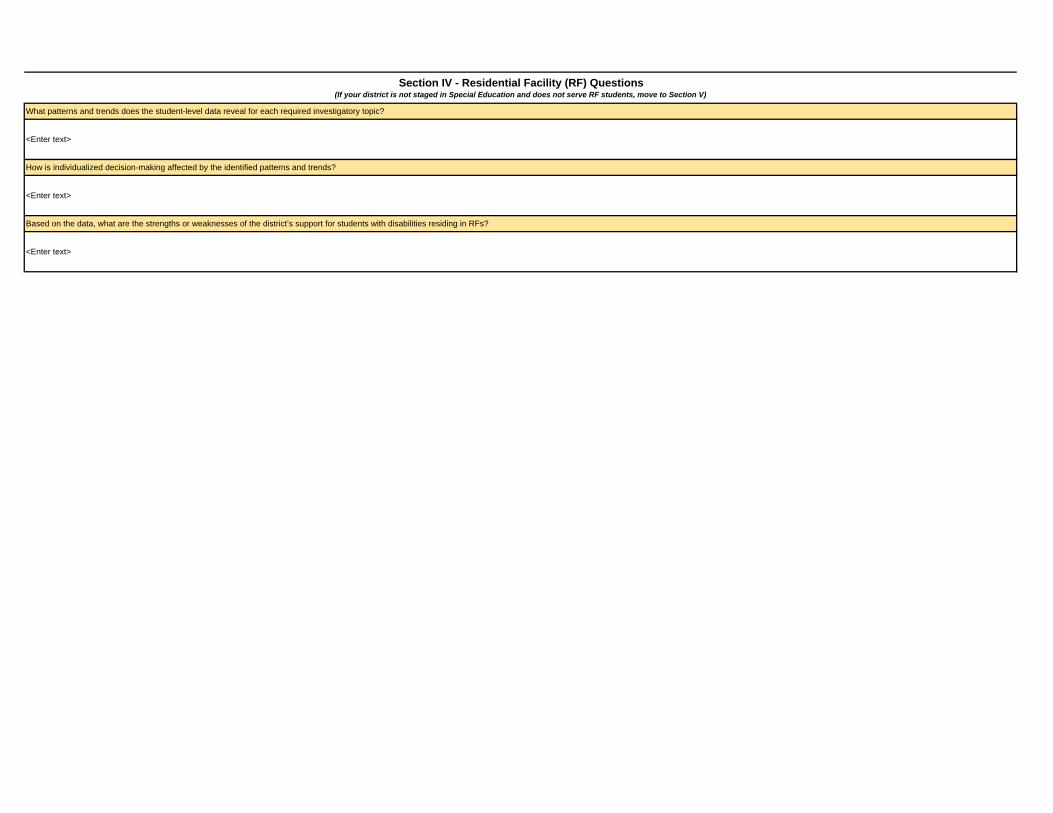
Based on the data, what are the strengths or weaknesses of the district’s support for students with disabilities residing in RFs?
<Enter text>
How is individualized decision-making affected by the identified patterns and trends?
<Enter text>
What patterns and trends does the student-level data reveal for each required investigatory topic?
Section IV - Residential Facility (RF) Questions(If your district is not staged in Special Education and does not serve RF students, move to Section V)
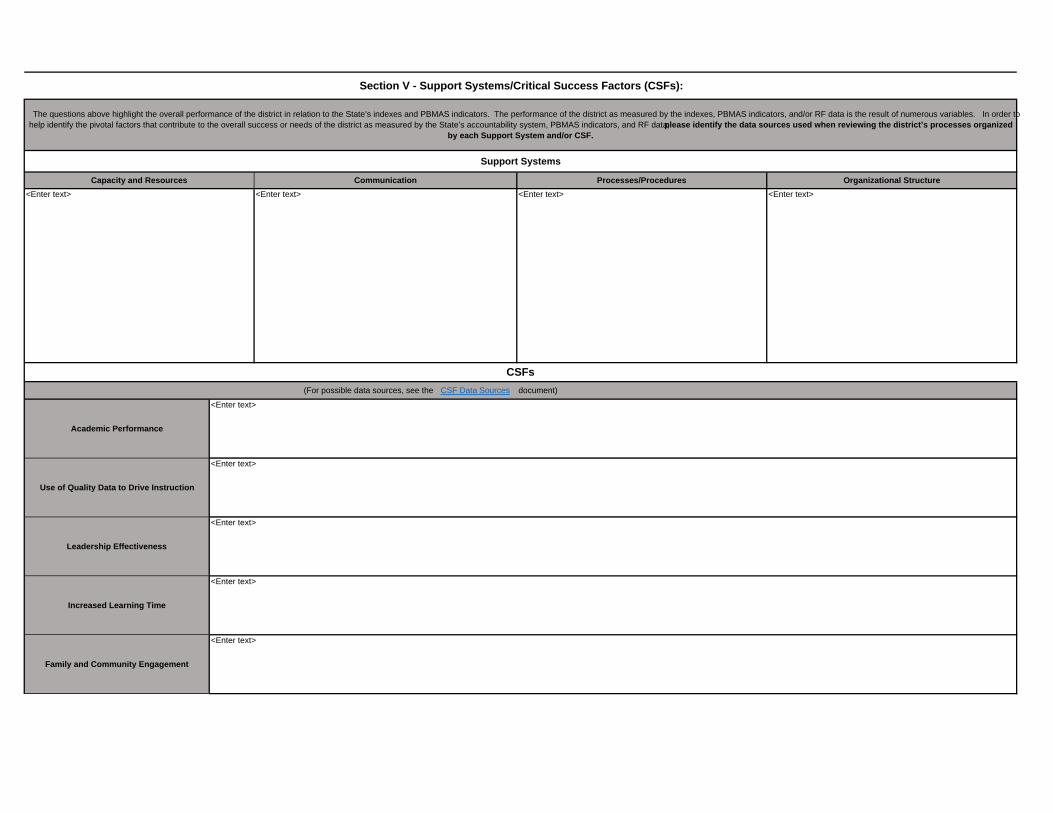
Support Systems
Capacity and Resources
Academic Performance
Use of Quality Data to Drive Instruction
<Enter text>
(For possible data sources, see the CSF Data Sources
<Enter text>
Organizational Structure
<Enter text>
Communication
<Enter text>
Processes/Procedures
The questions above highlight the overall performance of the district in relation to the State’s indexes and PBMAS indicators. The performance of the district as measured by the indexes, PBMAS indicators, and/or RF data is the result of numerous variables. In order to help identify the pivotal factors that contribute to the overall success or needs of the district as measured by the State’s accountability system, PBMAS indicators, and RF data, please identify the data sources used when reviewing the district’s processes organized
by each Support System and/or CSF.
Section V - Support Systems/Critical Success Factors (CSFs):
CSFs
<Enter text>
<Enter text>
<Enter text>
<Enter text>
<Enter text>
Family and Community Engagement
Leadership Effectiveness
document)
Increased Learning Time
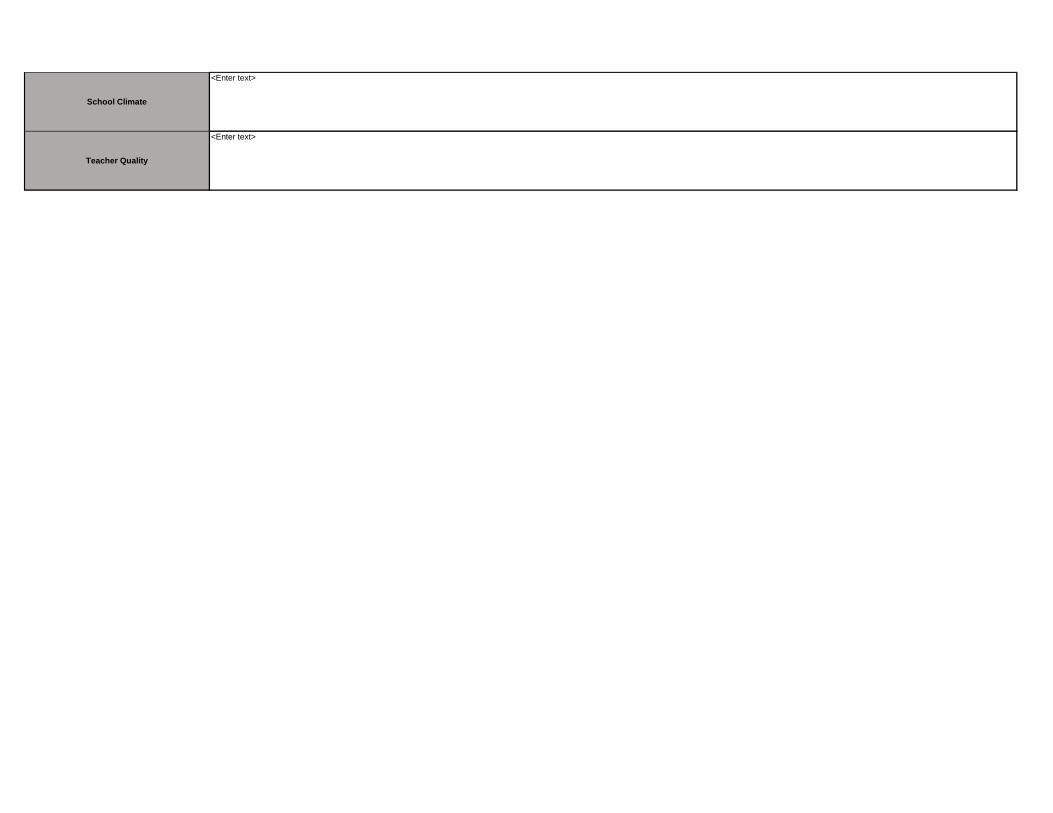
School Climate
<Enter text>
<Enter text>
Teacher Quality
Reading Writing Science Social Studies Mathematics
Reading Writing Science Social Studies Mathematics
Reading Writing Science Social Studies Mathematics
Reading Writing Science Social Studies Mathematics
Reading Writing Science Social Studies Mathematics
Reading Writing Science Social Studies Mathematics
Reading Writing Science Social Studies Mathematics
Reading Writing Science Social Studies Mathematics
Reading Writing Science Social Studies Mathematics
Reading Writing Science Social Studies Mathematics
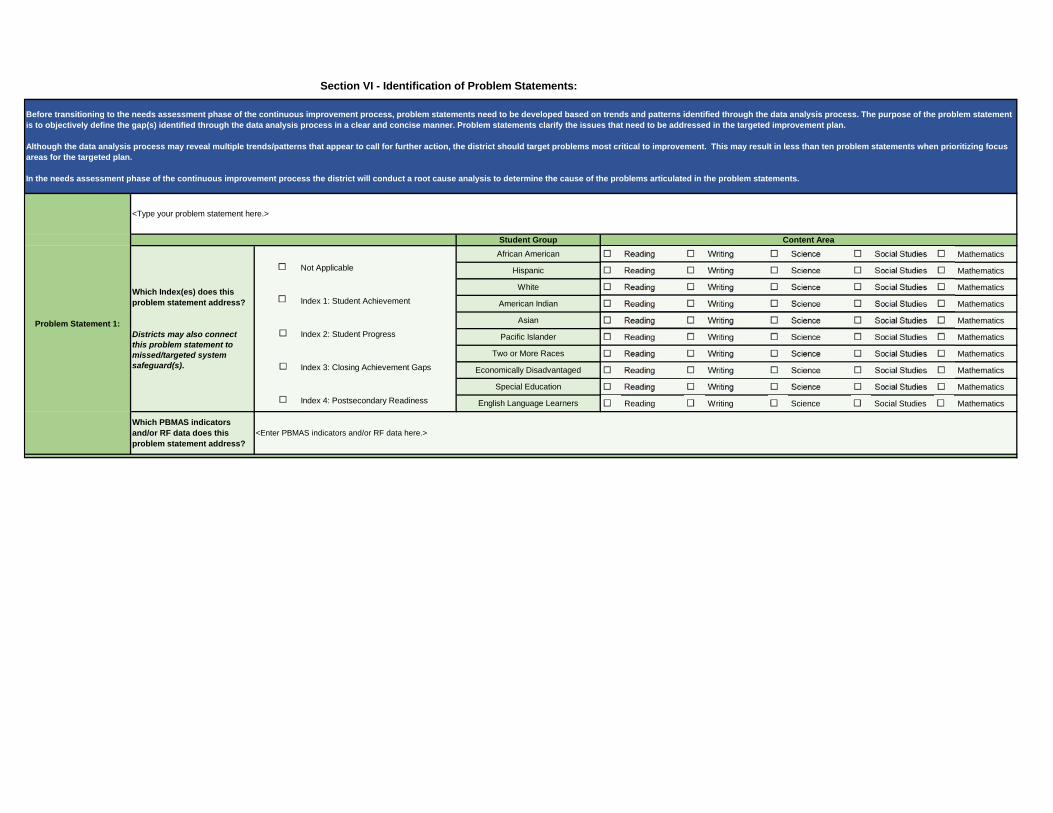
Section VI - Identification of Problem Statements:
Problem Statement 1:
Index 1: Student Achievement
Not Applicable
Student Group
African American
Content Area
Hispanic
White
American Indian
Asian
Pacific Islander
Two or More Races
Economically Disadvantaged
Special Education
English Language Learners
Which Index(es) does this problem statement address?
Districts may also connect this problem statement to missed/targeted system safeguard(s).
Index 4: Postsecondary Readiness
Index 3: Closing Achievement Gaps
Index 2: Student Progress
Which PBMAS indicators and/or RF data does this problem statement address?
<Enter PBMAS indicators and/or RF data here.>
Before transitioning to the needs assessment phase of the continuous improvement process, problem statements need to be developed based on trends and patterns identified through the data analysis process. The purpose of the problem statement is to objectively define the gap(s) identified through the data analysis process in a clear and concise manner. Problem statements clarify the issues that need to be addressed in the targeted improvement plan.
Although the data analysis process may reveal multiple trends/patterns that appear to call for further action, the district should target problems most critical to improvement. This may result in less than ten problem statements when prioritizing focus areas for the targeted plan.
In the needs assessment phase of the continuous improvement process the district will conduct a root cause analysis to determine the cause of the problems articulated in the problem statements.
<Type your problem statement here.>
Definition /Purpose:
PS 1: Root
Cause 1:
PS 2: Root
Cause 2:
PS 3: Root
Cause 3:
PS 4:Root
Cause 4:
PS 5: Root
Cause 5:
PS 6: Root
Cause 6:
PS 7: Root
Cause 7:
PS 8:Root
Cause 8:
PS 9:Root
Cause 9:
PS 10:Root
Cause 10:
Responses to these questions have been from the Contact‐Intervention Information Tab
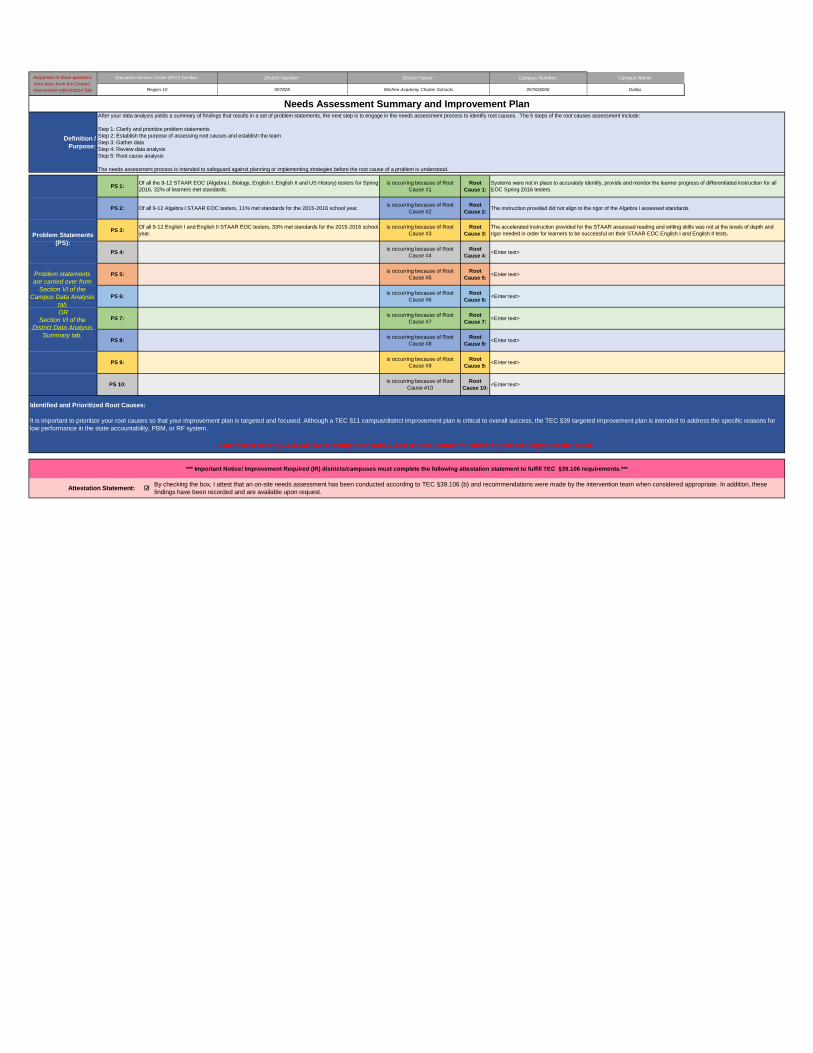
Needs Assessment Summary and Improvement PlanAfter your data analysis yields a summary of findings that results in a set of problem statements, the next step is to engage in the needs assessment process to identify root causes. The 5 steps of the root causes assessment include:
Step 1: Clarify and prioritize problem statementsStep 2: Establish the purpose of assessing root causes and establish the teamStep 3: Gather dataStep 4: Review data analysisStep 5: Root cause analysis
The needs assessment process is intended to safeguard against planning or implementing strategies before the root cause of a problem is understood.
Of all the 9-12 STAAR EOC (Algebra I, Biology, English I, English II and US History) testers for Spring 2016, 32% of learners met standards.
Of all 9-12 English I and English II STAAR EOC testers, 33% met standards for the 2015-2016 school year.
Of all 9-12 Algebra I STAAR EOC testers, 11% met standards for the 2015-2016 school year.
is occurring because of Root Cause #3
is occurring because of Root Cause #2
is occurring because of Root Cause #1
Problem Statements (PS):
Problem statements are carried over from
Section VI of the Campus Data Analysis
tab OR
Section VI of the District Data Analysis
Summary tab.
Identified and Prioritized Root Causes:
It is important to prioritize your root causes so that your improvement plan is targeted and focused. Although a TEC §11 campus/district improvement plan is critical to overall success, the TEC §39 targeted improvement plan is intended to address the specific reasons for low performance in the state accountability, PBM, or RF system.
If the district or campus would like to identify more than 10 root causes, contact the support specialist assigned to the review.
*** Important Notice! Improvement Required (IR) districts/campuses must complete the following attestation statement to fulfill TEC §39.106 requirements.***
Systems were not in place to accurately identify, provide and monitor the learner progress of differentiated instruction for all EOC Spring 2016 testers.
The instruction provided did not align to the rigor of the Algebra I assessed standards.
The accelerated instruction provided for the STAAR assessed reading and writing skills was not at the levels of depth and rigor needed in order for learners to be successful on their STAAR EOC English I and English II tests.
<Enter text>
<Enter text>
<Enter text>is occurring because of Root
Cause #6
is occurring because of Root Cause #5
is occurring because of Root Cause #4
is occurring because of Root Cause #8
is occurring because of Root Cause #7
By checking the box, I attest that an on-site needs assessment has been conducted according to TEC §39.106 (b) and recommendations were made by the intervention team when considered appropriate. In addition, these findings have been recorded and are available upon request.
Attestation Statement:
<Enter text>
<Enter text>
<Enter text>
<Enter text>is occurring because of Root
Cause #10
is occurring because of Root Cause #9
Education Service Center (ESC) Number: District Number: District Name: Campus Number: Campus Name:
Region 10 057828 Winfree Academy Charter Schools 057828006 Dallas
Responses to these questions have been from the Contact‐Intervention Information Tab
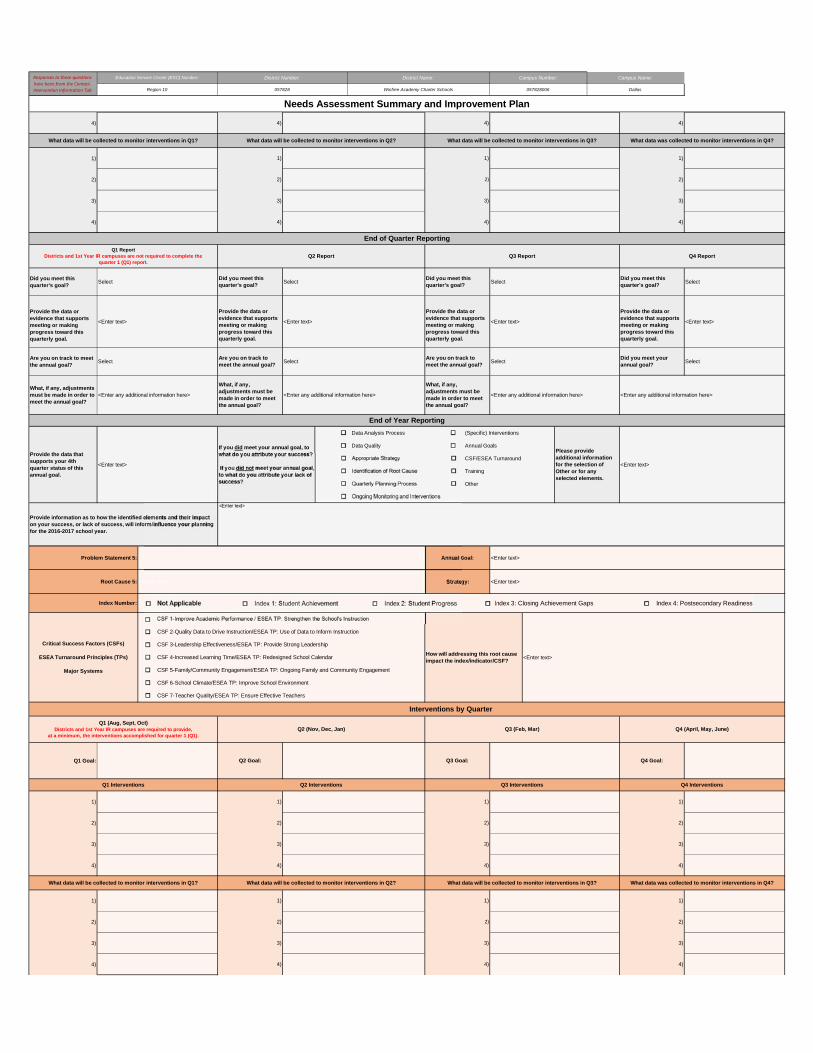
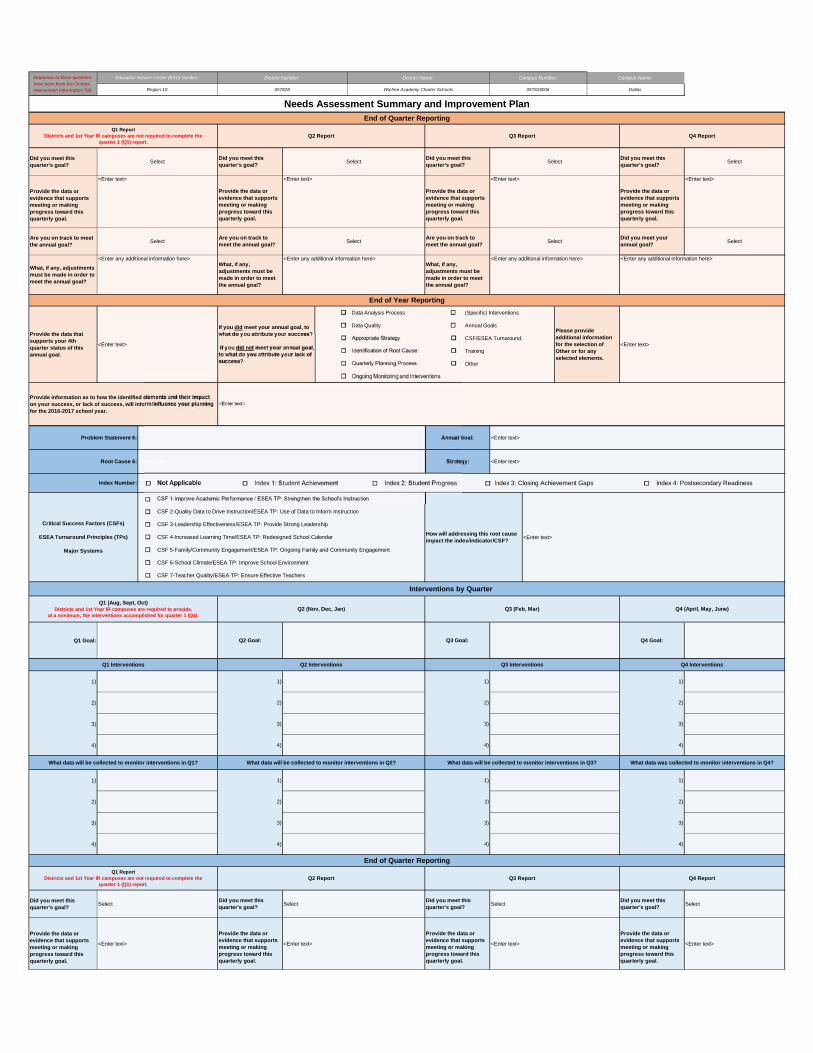
Needs Assessment Summary and Improvement Plan
Education Service Center (ESC) Number: District Number: District Name: Campus Number: Campus Name:
Region 10 057828 Winfree Academy Charter Schools 057828006 Dallas
Not Applicable Index 1: Student Achievement Index 2: Student Progress Index 3: Closing Achievement Gaps Index 4: Postsecondary Readiness
Q1 Goal:
1)
2)
3)
4)
1)
2)
3)
4)
Did you meet this quarter's goal?
Provide the data or evidence that supports meeting or making progress toward this quarterly goal.
Are you on track to meet the annual goal?
What, if any, adjustments must be made in order to meet the annual goal?
Data Analysis Process (Specific) Interventions
Data Quality Annual Goals
Appropriate Strategy CSF/ESEA Turnaround
Identification of Root Cause Training
Quarterly Planning Process Other
Ongoing Monitoring and Interventions
Not Applicable Index 1: Student Achievement Index 2: Student Progress Index 3: Closing Achievement Gaps Index 4: Postsecondary Readiness
Testing Lists, benchmark calendar, benchmark data
Learner Progress Monitoring Tool created, agenda and sign in sheets
Assessment Spreadsheet created, agenda, sign in sheets
What data will be collected to monitor interventions in Q1?
Critical Success Factors (CSFs)
ESEA Turnaround Principles (TPs)
Major Systems
Problem Statement 2:
<Enter text>Provide information as to how the identified elements and their impact on your success, or lack of success, will inform/influence your planning for the 2017-2018 school year.
End of Year Reporting
Provide the data or evidence that supports meeting or making progress toward this quarterly goal.
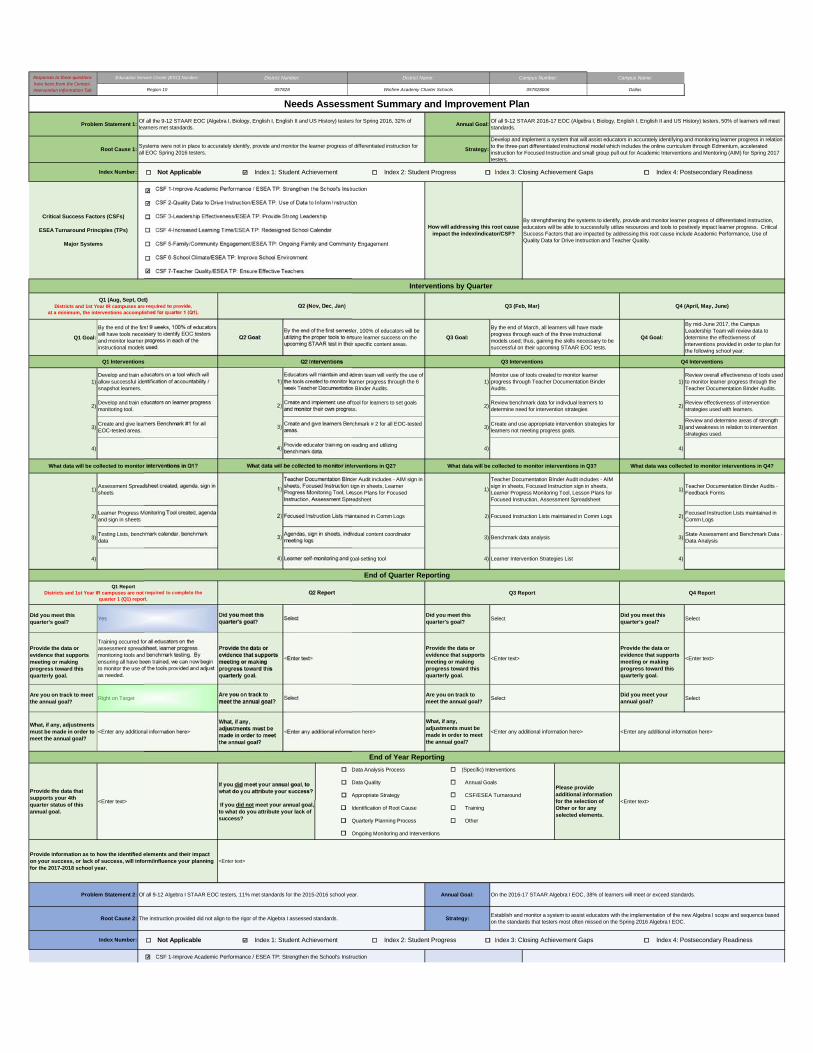
Of all 9-12 Algebra I STAAR EOC testers, 11% met standards for the 2015-2016 school year. Annual Goal: On the 2016-17 STAAR Algebra I EOC, 38% of learners will meet or exceed standards.
Root Cause 2: The instruction provided did not align to the rigor of the Algebra I assessed standards. Strategy:Establish and monitor a system to assist educators with the implementation of the new Algebra I scope and sequence based on the standards that testers most often missed on the Spring 2016 Algebra I EOC.
Index Number:
Provide the data that supports your 4th quarter status of this annual goal.
If you did meet your annual goal, to what do you attribute your success?
If you did not meet your annual goal, to what do you attribute your lack of success?
<Enter text>
Please provide additional information for the selection of Other or for any selected elements.
<Enter text>
CSF 1-Improve Academic Performance / ESEA TP: Strengthen the School's Instruction
Select
<Enter text>
<Enter any additional information here>
Interventions by Quarter
Strategy:
Annual Goal:Problem Statement 1:Of all the 9-12 STAAR EOC (Algebra I, Biology, English I, English II and US History) testers for Spring 2016, 32% of learners met standards.
Systems were not in place to accurately identify, provide and monitor the learner progress of differentiated instruction for all EOC Spring 2016 testers.
Develop and implement a system that will assist educators in accurately identifying and monitoring learner progress in relation to the three-part differentiated instructional model which includes the online curriculum through Edmentum, accelerated instruction for Focused Instruction and small group pull out for Academic Interventions and Mentoring (AIM) for Spring 2017 testers.
Of all 9-12 STAAR 2016-17 EOC (Algebra I, Biology, English I, English II and US History) testers, 50% of learners will meet standards.
Index Number:
Root Cause 1:
By strenghthening the systems to identify, provide and monitor learner progress of differentiated instruction, educators will be able to successfully utilize resources and tools to positively impact learner progress. Critical Success Factors that are impacted by addressing this root cause include Academic Performance, Use of Quality Data for Drive Instruction and Teacher Quality.
CSF 1-Improve Academic Performance / ESEA TP: Strengthen the School's Instruction
CSF 2-Quality Data to Drive Instruction/ESEA TP: Use of Data to Inform Instruction
CSF 3-Leadership Effectiveness/ESEA TP: Provide Strong Leadership
CSF 4-Increased Learning Time/ESEA TP: Redesigned School Calendar
CSF 5-Family/Community Engagement/ESEA TP: Ongoing Family and Community Engagement
CSF 6-School Climate/ESEA TP: Improve School Environment
CSF 7-Teacher Quality/ESEA TP: Ensure Effective Teachers
How will addressing this root cause impact the index/indicator/CSF?
Q3 InterventionsQ2 InterventionsQ1 Interventions
Q3 Goal:
By mid-June 2017, the Campus Leadership Team will review data to determine the effectiveness of interventions provided in order to plan for the following school year.
By the end of March, all learners will have made progress through each of the three instructional models used; thus, gaining the skills necessary to be successful on their upcoming STAAR EOC tests.
Develop and train educators on learner progress monitoring tool.
Develop and train educators on a tool which will allow successful identification of accountability / snapshot learners.
Create and give learners Benchmark #1 for all EOC-tested areas.
Educators will maintain and admin team will verify the use of the tools created to monitor learner progress through the 6 week Teacher Documentation BInder Audits.
Create and implement use of tool for learners to set goals and monitor their own progress.
Create and give learners Benchmark # 2 for all EOC-tested areas.
3)
Provide educator training on reading and utilizing benchmark data.
4)
3)
4)
1)
2)
Review overall effectiveness of tools used to monitor learner progress through the Teacher Documentation Binder Audits.
Review effectiveness of intervention strategies used with learners.
Review and determine areas of strength and weakness in relation to intervention strategies used.
Did you meet your annual goal?
Provide the data or evidence that supports meeting or making progress toward this quarterly goal.
Did you meet this quarter's goal?
Q2 Goal:By the end of the first semester, 100% of educators will be utilizing the proper tools to ensure learner success on the upcoming STAAR test in their specific content areas.
Q4 Goal:
1)
3)
2)
1)
4)
3)
2)
1)
4)
2)
4)
3)
2)
1)
4)
3)
2)
1)
Focused Instruction Lists maintained in Comm Logs
Teacher Documentation BInder Audit includes - AIM sign in sheets, Focused Instruction sign in sheets, Learner Progress Monitoring Tool, Lesson Plans for Focused Instruction, Assessment Spreadsheet
Focused Instruction Lists maintained in Comm Logs
Learner Intervention Strategies List
Monitor use of tools created to monitor learner progress through Teacher Documentation Binder Audits.
Review benchmark data for indivdual learners to determine need for intervention strategies
Create and use appropriate intervention strategies for learners not meeting progress goals.
Teacher Documentation Binder Audits - Feedback Forms
What data was collected to monitor interventions in Q4?What data will be collected to monitor interventions in Q3?
Focused Instruction Lists maintained in Comm Logs
State Assessment and Benchmark Data - Data Analysis
Select
End of Quarter Reporting
Q4 Report
Agendas, sign in sheets, individual content coordinator meeting logs
Learner self-monitoring and goal-setting tool
Teacher Documentation BInder Audit includes - AIM sign in sheets, Focused Instruction sign in sheets, Learner Progress Monitoring Tool, Lesson Plans for Focused Instruction, Assessment Spreadsheet
What data will be collected to monitor interventions in Q2?
Select Select
Benchmark data analysis
Q1 (Aug, Sept, Oct)Districts and 1st Year IR campuses are required to provide,
at a minimum, the interventions accomplished for quarter 1 (Q1).Q3 (Feb, Mar) Q4 (April, May, June)Q2 (Nov, Dec, Jan)
By the end of the first 9 weeks, 100% of educators will have tools necessary to identify EOC testers and monitor learner progress in each of the instructional models used.
Q4 Interventions
<Enter text>
Select
Q1 Report Districts and 1st Year IR campuses are not required to complete the
quarter 1 (Q1) report. Q3 Report
<Enter any additional information here>
Training occurred for all educators on the assessment spreadsheet, learner progress monitoring tools and benchmark testing. By ensuring all have been trained, we can now begin to monitor the use of the tools provided and adjust as needed.
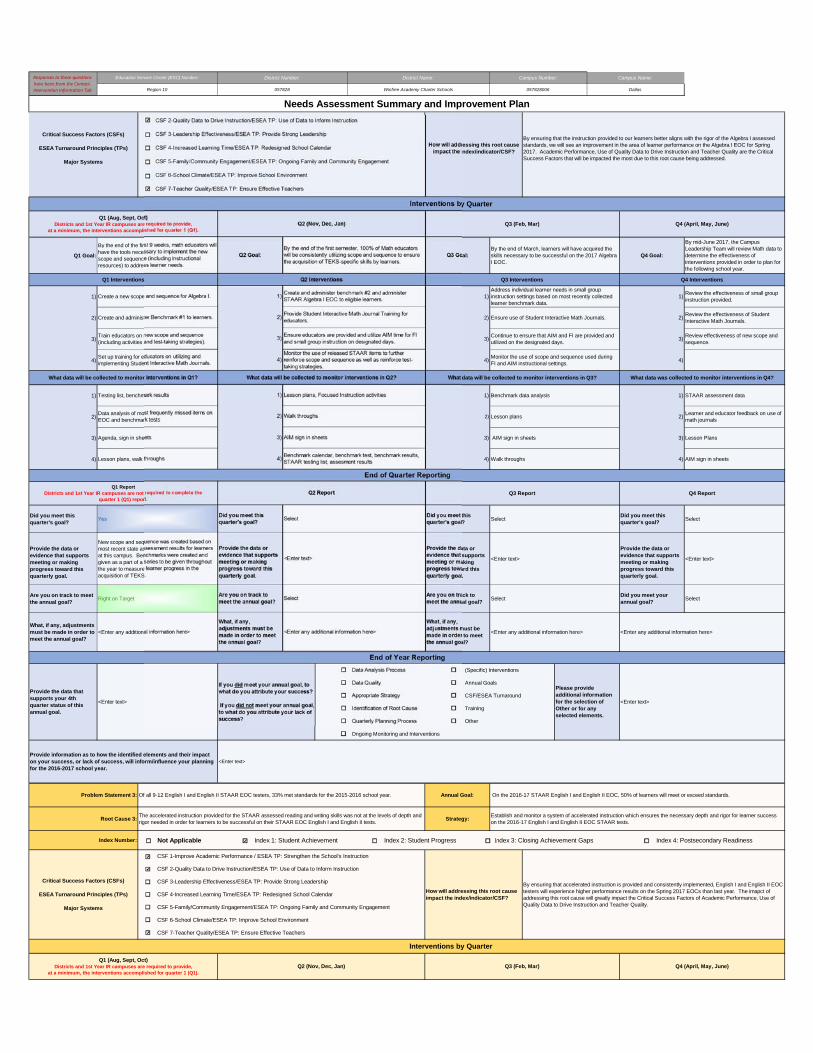
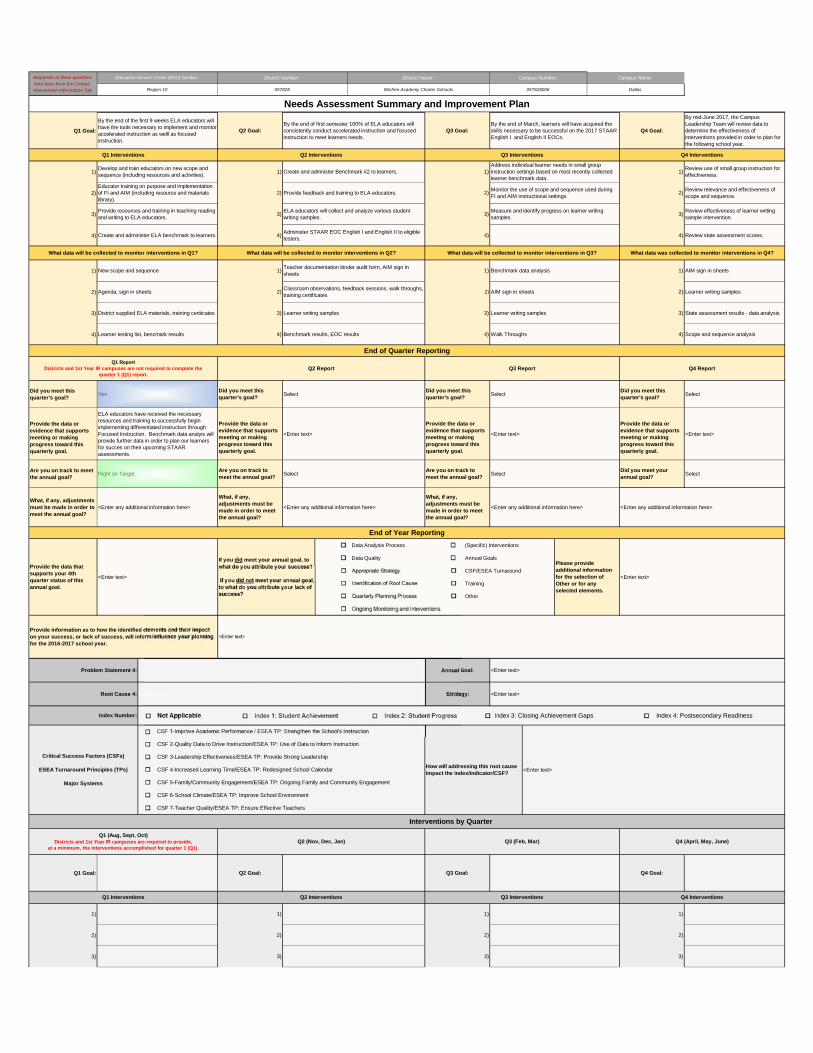
Yes
Right on Target
What, if any, adjustments must be made in order to meet the annual goal?
Are you on track to meet the annual goal?
Provide the data or evidence that supports meeting or making progress toward this quarterly goal.
Did you meet this quarter's goal?
Q2 Report
<Enter any additional information here>
Select
<Enter any additional information here>
What, if any, adjustments must be made in order to meet the annual goal?
Are you on track to meet the annual goal?
Did you meet this quarter's goal?
<Enter text>
Responses to these questions have been from the Contact‐Intervention Information Tab
Needs Assessment Summary and Improvement Plan
Education Service Center (ESC) Number: District Number: District Name: Campus Number: Campus Name:
Region 10 057828 Winfree Academy Charter Schools 057828006 Dallas
Q1 Goal:
1)
2)
3)
4)
1)
2)
3)
4)
Did you meet this quarter's goal?
Provide the data or evidence that supports meeting or making progress toward this quarterly goal.
Are you on track to meet the annual goal?
What, if any, adjustments must be made in order to meet the annual goal?
Data Analysis Process (Specific) Interventions
Data Quality Annual Goals
Appropriate Strategy CSF/ESEA Turnaround
Identification of Root Cause Training
Quarterly Planning Process Other
Ongoing Monitoring and Interventions
Not Applicable Index 1: Student Achievement Index 2: Student Progress Index 3: Closing Achievement Gaps Index 4: Postsecondary Readiness
Train educators on new scope and sequence (including activities and test-taking strategies).
Q1 Interventions
By the end of the first 9 weeks, math educators will have the tools necessary to implement the new scope and sequence (including instructional resources) to address learner needs.
Q1 (Aug, Sept, Oct)Districts and 1st Year IR campuses are required to provide,
at a minimum, the interventions accomplished for quarter 1 (Q1).
Critical Success Factors (CSFs)
ESEA Turnaround Principles (TPs)
Major Systems
Interventions by Quarter
Q1 (Aug, Sept, Oct)Districts and 1st Year IR campuses are required to provide,
at a minimum, the interventions accomplished for quarter 1 (Q1).Q2 (Nov, Dec, Jan) Q3 (Feb, Mar) Q4 (April, May, June)
Root Cause 3:The accelerated instruction provided for the STAAR assessed reading and writing skills was not at the levels of depth and rigor needed in order for learners to be successful on their STAAR EOC English I and English II tests.
Strategy:Establish and monitor a system of accelerated instruction which ensures the necessary depth and rigor for learner success on the 2016-17 English I and English II EOC STAAR tests.
Index Number:
Critical Success Factors (CSFs)
ESEA Turnaround Principles (TPs)
Major Systems
CSF 1-Improve Academic Performance / ESEA TP: Strengthen the School's Instruction
How will addressing this root cause impact the index/indicator/CSF?
By ensuring that accelerated instruction is provided and consistently implemented, English I and English II EOC testers will experience higher performance results on the Spring 2017 EOCs than last year. The imapct of addressing this root cause will greatly impact the Critical Success Factors of Academic Performance, Use of Quality Data to Drive Instruction and Teacher Quality.
CSF 2-Quality Data to Drive Instruction/ESEA TP: Use of Data to Inform Instruction
CSF 3-Leadership Effectiveness/ESEA TP: Provide Strong Leadership
CSF 4-Increased Learning Time/ESEA TP: Redesigned School Calendar
CSF 5-Family/Community Engagement/ESEA TP: Ongoing Family and Community Engagement
CSF 6-School Climate/ESEA TP: Improve School Environment
CSF 7-Teacher Quality/ESEA TP: Ensure Effective Teachers
End of Year Reporting
Provide the data that supports your 4th quarter status of this annual goal.
<Enter text>
If you did meet your annual goal, to what do you attribute your success?
If you did not meet your annual goal, to what do you attribute your lack of success?
Please provide additional information for the selection of Other or for any selected elements.
<Enter text>
Provide information as to how the identified elements and their impact on your success, or lack of success, will inform/influence your planning for the 2016-2017 school year.
<Enter text>
Problem Statement 3: Of all 9-12 English I and English II STAAR EOC testers, 33% met standards for the 2015-2016 school year. Annual Goal: On the 2016-17 STAAR English I and English II EOC, 50% of learners will meet or exceed standards.
Right on TargetAre you on track to meet the annual goal?
SelectAre you on track to meet the annual goal?
SelectDid you meet your annual goal?
Select
<Enter any additional information here>
What, if any, adjustments must be made in order to meet the annual goal?
<Enter any additional information here>
What, if any, adjustments must be made in order to meet the annual goal?
<Enter any additional information here> <Enter any additional information here>
YesDid you meet this quarter's goal?
SelectDid you meet this quarter's goal?
SelectDid you meet this quarter's goal?
Select
New scope and sequence was created based on most recent state assessment results for learners at this campus. Benchmarks were created and given as a part of a series to be given throughout the year to measure learner progress in the acquisition of TEKS.
Provide the data or evidence that supports meeting or making progress toward this quarterly goal.
<Enter text>
Provide the data or evidence that supports meeting or making progress toward this quarterly goal.
<Enter text>
Provide the data or evidence that supports meeting or making progress toward this quarterly goal.
<Enter text>
Lesson plans, walk throughs 4)Benchmark calendar, benchmark test, benchmark results, STAAR testing list, assesment results
4) Walk throughs 4) AIM sign in sheets
End of Quarter Reporting
Q1 Report Districts and 1st Year IR campuses are not required to complete the
quarter 1 (Q1) report. Q2 Report Q3 Report Q4 Report
Data analysis of most frequently missed items on EOC and benchmark tests
2) Walk throughs 2) Lesson plans 2)Learner and educator feedback on use of math journals
Agenda, sign in sheets 3) AIM sign in sheets 3) AIM sign in sheets 3) Lesson Plans
What data will be collected to monitor interventions in Q1? What data will be collected to monitor interventions in Q2? What data will be collected to monitor interventions in Q3? What data was collected to monitor interventions in Q4?
Testing list, benchmark results 1) Lesson plans, Focused Instruction activities 1) Benchmark data analysis 1) STAAR assessment data
Set up training for educators on utilizing and implementing Student Interactive Math Journals.
4)Monitor the use of released STAAR items to further reinforce scope and sequence as well as reinforce test-taking strategies.
4)Monitor the use of scope and sequence used during FI and AIM instructional settings.
4)
Create a new scope and sequence for Algebra I. 1)Create and administer benchmark #2 and administer STAAR Algebra I EOC to eligible learners.
1)Address individual learner needs in small group instruction settings based on most recently collected learner benchmark data.
1)Review the effectiveness of small group instruction provided.
Create and administer Benchmark #1 to learners. 2)Provide Student Interactive Math Journal Training for educators.
2) Ensure use of Student Interactive Math Journals. 2)Review the effectiveness of Student Interactive Math Journals.
Q4 (April, May, June)
Q2 Goal:By the end of the first semester, 100% of Math educators will be consistently utilizing scope and sequence to ensure the acquisition of TEKS-specific skills by learners.
Q3 Goal:By the end of March, learners will have acquired the skills necessary to be successful on the 2017 Algebra I EOC.
Q4 Goal:
By mid-June 2017, the Campus Leadership Team will review Math data to determine the effectiveness of interventions provided in order to plan for the following school year.
Q2 Interventions Q3 Interventions Q4 Interventions
Interventions by Quarter
Q2 (Nov, Dec, Jan) Q3 (Feb, Mar)
3)Ensure educators are provided and utilize AIM time for FI and small group instruction on designated days.
3)Continue to ensure that AIM and FI are provided and utilized on the designated days.
3)Review effectiveness of new scope and sequence.
By ensuring that the instruction provided to our learners better aligns with the rigor of the Algebra I assessed standards, we will see an improvement in the area of learner performance on the Algebra I EOC for Spring 2017. Academic Performance, Use of Quality Data to Drive Instruction and Teacher Quality are the Critical Success Factors that will be impacted the most due to this root cause being addressed.
CSF 2-Quality Data to Drive Instruction/ESEA TP: Use of Data to Inform Instruction
CSF 3-Leadership Effectiveness/ESEA TP: Provide Strong Leadership
CSF 4-Increased Learning Time/ESEA TP: Redesigned School Calendar
CSF 5-Family/Community Engagement/ESEA TP: Ongoing Family and Community Engagement
CSF 6-School Climate/ESEA TP: Improve School Environment
CSF 7-Teacher Quality/ESEA TP: Ensure Effective Teachers
How will addressing this root cause impact the index/indicator/CSF?
Responses to these questions have been from the Contact‐Intervention Information Tab
Needs Assessment Summary and Improvement Plan
Education Service Center (ESC) Number: District Number: District Name: Campus Number: Campus Name:
Region 10 057828 Winfree Academy Charter Schools 057828006 Dallas
Q1 Goal:
1)
2)
3)
4)
1)
2)
3)
4)
Did you meet this quarter's goal?
Provide the data or evidence that supports meeting or making progress toward this quarterly goal.
Are you on track to meet the annual goal?
What, if any, adjustments must be made in order to meet the annual goal?
Data Analysis Process (Specific) Interventions
Data Quality Annual Goals
Appropriate Strategy CSF/ESEA Turnaround
Identification of Root Cause Training
Quarterly Planning Process Other
Ongoing Monitoring and Interventions
Not Applicable Index 1: Student Achievement Index 2: Student Progress Index 3: Closing Achievement Gaps Index 4: Postsecondary Readiness
Q1 Goal:
1)
2)
3)
Problem Statement 4: Annual Goal: <Enter text>
Root Cause 4: <Enter text> Strategy: <Enter text>
2) 2) 2)
3) 3) 3)
Q1 Interventions Q2 Interventions Q3 Interventions Q4 Interventions
1) 1) 1)
Interventions by Quarter
Q1 (Aug, Sept, Oct)Districts and 1st Year IR campuses are required to provide,
at a minimum, the interventions accomplished for quarter 1 (Q1).Q2 (Nov, Dec, Jan) Q3 (Feb, Mar) Q4 (April, May, June)
Q2 Goal: Q3 Goal: Q4 Goal:
Index Number:
Critical Success Factors (CSFs)
ESEA Turnaround Principles (TPs)
Major Systems
CSF 1-Improve Academic Performance / ESEA TP: Strengthen the School's Instruction
How will addressing this root cause impact the index/indicator/CSF?
<Enter text>
CSF 2-Quality Data to Drive Instruction/ESEA TP: Use of Data to Inform Instruction
CSF 3-Leadership Effectiveness/ESEA TP: Provide Strong Leadership
CSF 4-Increased Learning Time/ESEA TP: Redesigned School Calendar
CSF 5-Family/Community Engagement/ESEA TP: Ongoing Family and Community Engagement
CSF 6-School Climate/ESEA TP: Improve School Environment
CSF 7-Teacher Quality/ESEA TP: Ensure Effective Teachers
Provide information as to how the identified elements and their impact on your success, or lack of success, will inform/influence your planning for the 2016-2017 school year.
<Enter text>
<Enter any additional information here>
What, if any, adjustments must be made in order to meet the annual goal?
<Enter any additional information here>
What, if any, adjustments must be made in order to meet the annual goal?
<Enter any additional information here> <Enter any additional information here>
End of Year Reporting
Provide the data that supports your 4th quarter status of this annual goal.
<Enter text>
If you did meet your annual goal, to what do you attribute your success?
If you did not meet your annual goal, to what do you attribute your lack of success?
Please provide additional information for the selection of Other or for any selected elements.
<Enter text>
ELA educators have received the necessary resources and training to successfully begin implementing differentiated instruction through Focused Instruction. Benchmark data analyis will provide further data in order to plan our learners for succes on their upcoming STAAR assessments.
Provide the data or evidence that supports meeting or making progress toward this quarterly goal.
<Enter text>
Provide the data or evidence that supports meeting or making progress toward this quarterly goal.
<Enter text>
Provide the data or evidence that supports meeting or making progress toward this quarterly goal.
<Enter text>
Right on TargetAre you on track to meet the annual goal?
SelectAre you on track to meet the annual goal?
SelectDid you meet your annual goal?
Select
End of Quarter Reporting
Q1 Report Districts and 1st Year IR campuses are not required to complete the
quarter 1 (Q1) report. Q2 Report Q3 Report Q4 Report
YesDid you meet this quarter's goal?
SelectDid you meet this quarter's goal?
SelectDid you meet this quarter's goal?
Select
District supplied ELA materials, training certiicates 3) Learner writing samples 3) Learner writing samples 3) State assessment results - data analysis
Learner testing list, bencmark results 4) Benchmark results, EOC results 4) Walk Throughs 4) Scope and sequence analysis
New scope and sequence 1)Teacher documentation binder audit form, AIM sign in sheets
1) Benchmark data analysis 1) AIM sign in sheets
Agenda, sign in sheets 2)Classroom observations, feedback sessions, walk throughs, training certificates
2) AIM sign in sheets 2) Learner writing samples
Create and administer ELA benchmark to learners. 4)Administer STAAR EOC English I and English II to eligible testers.
4) 4) Review state assessment scores.
What data will be collected to monitor interventions in Q1? What data will be collected to monitor interventions in Q2? What data will be collected to monitor interventions in Q3? What data was collected to monitor interventions in Q4?
Educator training on purpose and implementation of FI and AIM (including resource and materials library).
2) Provide feedback and training to ELA educators. 2)Monitor the use of scope and sequence used during FI and AIM instructional settings.
2)Review relevance and effectiveness of scope and sequence.
Provide resources and training in teaching reading and writing to ELA educators.
3)ELA educators will collect and analyze various student writing samples.
3)Measure and identify progress on learner writing samples.
3)Review effectiveness of learner writing sample intervention.
Q1 Interventions Q2 Interventions Q3 Interventions Q4 Interventions
Develop and train educators on new scope and sequence (including resources and activities).
1) Create and admnister Benchmark #2 to learners. 1)Address individual learner needs in small group instruction settings based on most recently collected learner benchmark data.
1)Review use of small group instruction for effectiveness.
By the end of the first 9 weeks ELA educators will have the tools necessary to implement and monitor accelerated instruction as welll as focused instruction.
Q2 Goal:By the end of first semester 100% of ELA educators will consistently conduct accelerated instruction and focused instruction to meet learners needs.
Q3 Goal:By the end of March, learners will have acquired the skills necessary to be successful on the 2017 STAAR English I and English II EOCs.
Q4 Goal:
By mid-June 2017, the Campus Leadership Team will review data to determine the effectiveness of interventions provided in order to plan for the following school year.
Responses to these questions have been from the Contact‐Intervention Information Tab
Needs Assessment Summary and Improvement Plan
Education Service Center (ESC) Number: District Number: District Name: Campus Number: Campus Name:
Region 10 057828 Winfree Academy Charter Schools 057828006 Dallas
4)
1)
2)
3)
4)
Did you meet this quarter's goal?
Provide the data or evidence that supports meeting or making progress toward this quarterly goal.
Are you on track to meet the annual goal?
What, if any, adjustments must be made in order to meet the annual goal?
Data Analysis Process (Specific) Interventions
Data Quality Annual Goals
Appropriate Strategy CSF/ESEA Turnaround
Identification of Root Cause Training
Quarterly Planning Process Other
Ongoing Monitoring and Interventions
Not Applicable Index 1: Student Achievement Index 2: Student Progress Index 3: Closing Achievement Gaps Index 4: Postsecondary Readiness
Q1 Goal:
1)
2)
3)
4)
1)
2)
3)
4)
3) 3) 3)
4) 4) 4)
1) 1) 1)
2) 2) 2)
4) 4) 4)
What data will be collected to monitor interventions in Q1? What data will be collected to monitor interventions in Q2? What data will be collected to monitor interventions in Q3? What data was collected to monitor interventions in Q4?
2) 2) 2)
3) 3) 3)
Q1 Interventions Q2 Interventions Q3 Interventions Q4 Interventions
1) 1) 1)
Interventions by Quarter
Q1 (Aug, Sept, Oct)Districts and 1st Year IR campuses are required to provide,
at a minimum, the interventions accomplished for quarter 1 (Q1).Q2 (Nov, Dec, Jan) Q3 (Feb, Mar) Q4 (April, May, June)
Q2 Goal: Q3 Goal: Q4 Goal:
Critical Success Factors (CSFs)
ESEA Turnaround Principles (TPs)
Major Systems
CSF 1-Improve Academic Performance / ESEA TP: Strengthen the School's Instruction
How will addressing this root cause impact the index/indicator/CSF?
<Enter text>
CSF 2-Quality Data to Drive Instruction/ESEA TP: Use of Data to Inform Instruction
CSF 3-Leadership Effectiveness/ESEA TP: Provide Strong Leadership
CSF 4-Increased Learning Time/ESEA TP: Redesigned School Calendar
CSF 5-Family/Community Engagement/ESEA TP: Ongoing Family and Community Engagement
CSF 6-School Climate/ESEA TP: Improve School Environment
CSF 7-Teacher Quality/ESEA TP: Ensure Effective Teachers
Problem Statement 5: Annual Goal: <Enter text>
Root Cause 5: <Enter text> Strategy: <Enter text>
Index Number:
Provide information as to how the identified elements and their impact on your success, or lack of success, will inform/influence your planning for the 2016-2017 school year.
<Enter text>
<Enter any additional information here>
What, if any, adjustments must be made in order to meet the annual goal?
<Enter any additional information here>
What, if any, adjustments must be made in order to meet the annual goal?
<Enter any additional information here> <Enter any additional information here>
End of Year Reporting
Provide the data that supports your 4th quarter status of this annual goal.
<Enter text>
If you did meet your annual goal, to what do you attribute your success?
If you did not meet your annual goal, to what do you attribute your lack of success?
Please provide additional information for the selection of Other or for any selected elements.
<Enter text>
<Enter text>
Provide the data or evidence that supports meeting or making progress toward this quarterly goal.
<Enter text>
Provide the data or evidence that supports meeting or making progress toward this quarterly goal.
<Enter text>
Provide the data or evidence that supports meeting or making progress toward this quarterly goal.
<Enter text>
SelectAre you on track to meet the annual goal?
SelectAre you on track to meet the annual goal?
SelectDid you meet your annual goal?
Select
End of Quarter Reporting
Q2 Report Q3 Report Q4 Report
Did you meet this quarter's goal?
SelectDid you meet this quarter's goal?
SelectDid you meet this quarter's goal?
SelectSelect
Q1 Report Districts and 1st Year IR campuses are not required to complete the
quarter 1 (Q1) report.
3) 3) 3)
4) 4) 4)
1) 1) 1)
2) 2) 2)
4) 4) 4)
What data will be collected to monitor interventions in Q1? What data will be collected to monitor interventions in Q2? What data will be collected to monitor interventions in Q3? What data was collected to monitor interventions in Q4?
Responses to these questions have been from the Contact‐Intervention Information Tab
Needs Assessment Summary and Improvement Plan
Education Service Center (ESC) Number: District Number: District Name: Campus Number: Campus Name:
Region 10 057828 Winfree Academy Charter Schools 057828006 Dallas
Did you meet this quarter's goal?
Provide the data or evidence that supports meeting or making progress toward this quarterly goal.
Are you on track to meet the annual goal?
What, if any, adjustments must be made in order to meet the annual goal?
Data Analysis Process (Specific) Interventions
Data Quality Annual Goals
Appropriate Strategy CSF/ESEA Turnaround
Identification of Root Cause Training
Quarterly Planning Process Other
Ongoing Monitoring and Interventions
Not Applicable Index 1: Student Achievement Index 2: Student Progress Index 3: Closing Achievement Gaps Index 4: Postsecondary Readiness
Q1 Goal:
1)
2)
3)
4)
1)
2)
3)
4)
Did you meet this quarter's goal?
Provide the data or evidence that supports meeting or making progress toward this quarterly goal.
End of Quarter Reporting
Q1 Report Districts and 1st Year IR campuses are not required to complete the
quarter 1 (Q1) report. Q2 Report Q3 Report Q4 Report
SelectDid you meet this quarter's goal?
SelectDid you meet this quarter's goal?
SelectDid you meet this quarter's goal?
Select
<Enter text>
Provide the data or evidence that supports meeting or making progress toward this quarterly goal.
<Enter text>
Provide the data or evidence that supports meeting or making progress toward this quarterly goal.
<Enter text>
Provide the data or evidence that supports meeting or making progress toward this quarterly goal.
<Enter text>
3) 3) 3)
4) 4) 4)
1) 1) 1)
2) 2) 2)
4) 4) 4)
What data will be collected to monitor interventions in Q1? What data will be collected to monitor interventions in Q2? What data will be collected to monitor interventions in Q3? What data was collected to monitor interventions in Q4?
2) 2) 2)
3) 3) 3)
Q1 Interventions Q2 Interventions Q3 Interventions Q4 Interventions
1) 1) 1)
Interventions by Quarter
Q1 (Aug, Sept, Oct)Districts and 1st Year IR campuses are required to provide,
at a minimum, the interventions accomplished for quarter 1 (Q1).Q2 (Nov, Dec, Jan) Q3 (Feb, Mar) Q4 (April, May, June)
Q2 Goal: Q3 Goal: Q4 Goal:
Index Number:
Critical Success Factors (CSFs)
ESEA Turnaround Principles (TPs)
Major Systems
CSF 1-Improve Academic Performance / ESEA TP: Strengthen the School's Instruction
How will addressing this root cause impact the index/indicator/CSF?
<Enter text>
CSF 2-Quality Data to Drive Instruction/ESEA TP: Use of Data to Inform Instruction
CSF 3-Leadership Effectiveness/ESEA TP: Provide Strong Leadership
CSF 4-Increased Learning Time/ESEA TP: Redesigned School Calendar
CSF 5-Family/Community Engagement/ESEA TP: Ongoing Family and Community Engagement
CSF 6-School Climate/ESEA TP: Improve School Environment
CSF 7-Teacher Quality/ESEA TP: Ensure Effective Teachers
Provide information as to how the identified elements and their impact on your success, or lack of success, will inform/influence your planning for the 2016-2017 school year.
<Enter text>
Problem Statement 6: Annual Goal: <Enter text>
Root Cause 6: <Enter text> Strategy: <Enter text>
<Enter any additional information here>What, if any, adjustments must be made in order to meet the annual goal?
<Enter any additional information here>What, if any, adjustments must be made in order to meet the annual goal?
<Enter any additional information here> <Enter any additional information here>
End of Year Reporting
Provide the data that supports your 4th quarter status of this annual goal.
<Enter text>
If you did meet your annual goal, to what do you attribute your success?
If you did not meet your annual goal, to what do you attribute your lack of success?
Please provide additional information for the selection of Other or for any selected elements.
<Enter text>
<Enter text>
Provide the data or evidence that supports meeting or making progress toward this quarterly goal.
<Enter text>
Provide the data or evidence that supports meeting or making progress toward this quarterly goal.
<Enter text>
Provide the data or evidence that supports meeting or making progress toward this quarterly goal.
<Enter text>
SelectAre you on track to meet the annual goal?
SelectAre you on track to meet the annual goal?
SelectDid you meet your annual goal?
Select
End of Quarter Reporting
Q1 Report Districts and 1st Year IR campuses are not required to complete the
quarter 1 (Q1) report. Q2 Report Q3 Report Q4 Report
SelectDid you meet this quarter's goal?
SelectDid you meet this quarter's goal?
SelectDid you meet this quarter's goal?
Select
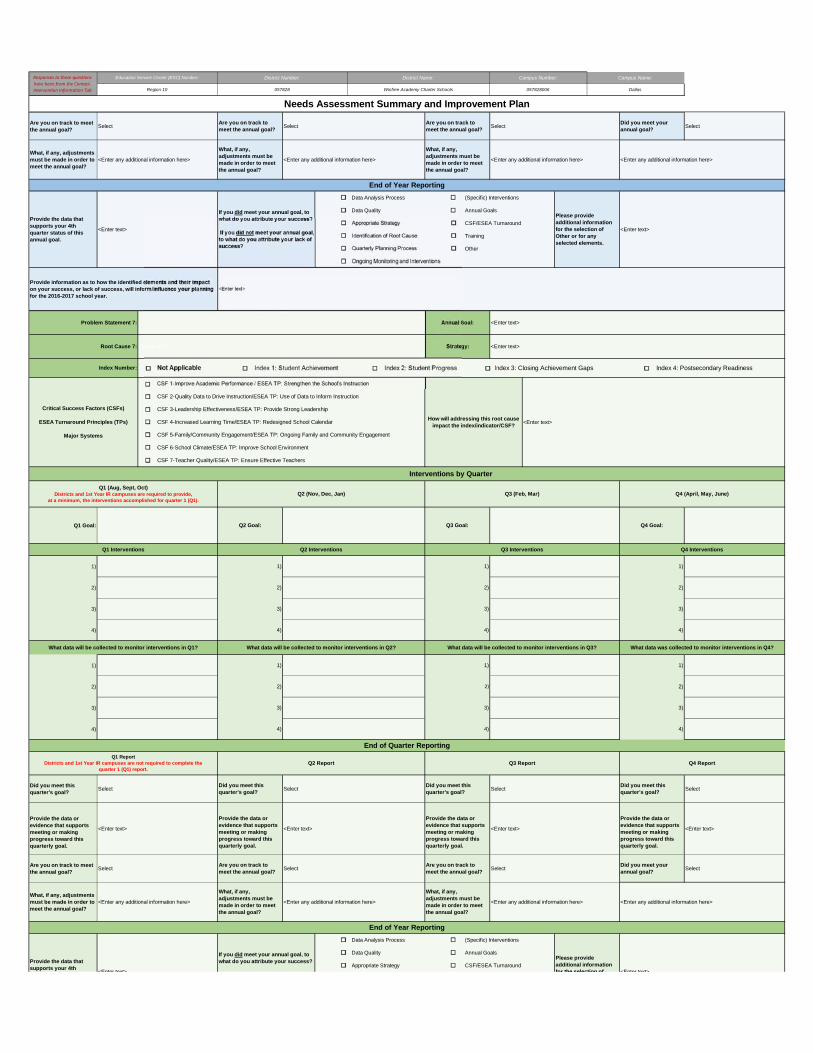
Responses to these questions have been from the Contact‐Intervention Information Tab
Needs Assessment Summary and Improvement Plan
Education Service Center (ESC) Number: District Number: District Name: Campus Number: Campus Name:
Region 10 057828 Winfree Academy Charter Schools 057828006 Dallas
Are you on track to meet the annual goal?
What, if any, adjustments must be made in order to meet the annual goal?
Data Analysis Process (Specific) Interventions
Data Quality Annual Goals
Appropriate Strategy CSF/ESEA Turnaround
Identification of Root Cause Training
Quarterly Planning Process Other
Ongoing Monitoring and Interventions
Not Applicable Index 1: Student Achievement Index 2: Student Progress Index 3: Closing Achievement Gaps Index 4: Postsecondary Readiness
Q1 Goal:
1)
2)
3)
4)
1)
2)
3)
4)
Did you meet this quarter's goal?
Provide the data or evidence that supports meeting or making progress toward this quarterly goal.
Are you on track to meet the annual goal?
What, if any, adjustments must be made in order to meet the annual goal?
Data Analysis Process (Specific) Interventions
Data Quality Annual Goals
Appropriate Strategy CSF/ESEA Turnaround
Provide information as to how the identified elements and their impact on your success, or lack of success, will inform/influence your planning for the 2016-2017 school year.
1) 1) 1)
Problem Statement 7: Annual Goal: <Enter text>
Root Cause 7: <Enter text> Strategy: <Enter text>
<Enter any additional information here>
What, if any, adjustments must be made in order to meet the annual goal?
<Enter any additional information here>
What, if any, adjustments must be made in order to meet the annual goal?
<Enter any additional information here> <Enter any additional information here>
End of Year Reporting
Provide the data that supports your 4th
<Enter text>
If you did meet your annual goal, to what do you attribute your success?
Please provide additional information for the selection of <Enter text>
<Enter text>
Provide the data or evidence that supports meeting or making progress toward this quarterly goal.
<Enter text>
Provide the data or evidence that supports meeting or making progress toward this quarterly goal.
<Enter text>
Provide the data or evidence that supports meeting or making progress toward this quarterly goal.
<Enter text>
SelectAre you on track to meet the annual goal?
SelectAre you on track to meet the annual goal?
SelectDid you meet your annual goal?
Select
End of Quarter Reporting
Q2 Report Q3 Report Q4 Report
Did you meet this quarter's goal?
SelectDid you meet this quarter's goal?
SelectDid you meet this quarter's goal?
Select
3) 3) 3)
4) 4) 4)
Select
Q1 Report Districts and 1st Year IR campuses are not required to complete the
quarter 1 (Q1) report.
2) 2) 2)
4) 4) 4)
What data will be collected to monitor interventions in Q1? What data will be collected to monitor interventions in Q2? What data will be collected to monitor interventions in Q3? What data was collected to monitor interventions in Q4?
2) 2) 2)
3) 3) 3)
Q1 Interventions Q2 Interventions Q3 Interventions Q4 Interventions
1) 1) 1)
Interventions by Quarter
Q1 (Aug, Sept, Oct)Districts and 1st Year IR campuses are required to provide,
at a minimum, the interventions accomplished for quarter 1 (Q1).Q2 (Nov, Dec, Jan) Q3 (Feb, Mar) Q4 (April, May, June)
Q2 Goal: Q3 Goal: Q4 Goal:
Index Number:
Critical Success Factors (CSFs)
ESEA Turnaround Principles (TPs)
Major Systems
CSF 1-Improve Academic Performance / ESEA TP: Strengthen the School's Instruction
How will addressing this root cause impact the index/indicator/CSF?
<Enter text>
CSF 2-Quality Data to Drive Instruction/ESEA TP: Use of Data to Inform Instruction
CSF 3-Leadership Effectiveness/ESEA TP: Provide Strong Leadership
CSF 4-Increased Learning Time/ESEA TP: Redesigned School Calendar
CSF 5-Family/Community Engagement/ESEA TP: Ongoing Family and Community Engagement
CSF 6-School Climate/ESEA TP: Improve School Environment
CSF 7-Teacher Quality/ESEA TP: Ensure Effective Teachers
<Enter text>
<Enter any additional information here>
What, if any, adjustments must be made in order to meet the annual goal?
<Enter any additional information here>
What, if any, adjustments must be made in order to meet the annual goal?
<Enter any additional information here> <Enter any additional information here>
End of Year Reporting
Provide the data that supports your 4th quarter status of this annual goal.
<Enter text>
If you did meet your annual goal, to what do you attribute your success?
If you did not meet your annual goal, to what do you attribute your lack of success?
Please provide additional information for the selection of Other or for any selected elements.
<Enter text>
SelectAre you on track to meet the annual goal?
SelectAre you on track to meet the annual goal?
SelectDid you meet your annual goal?
Select
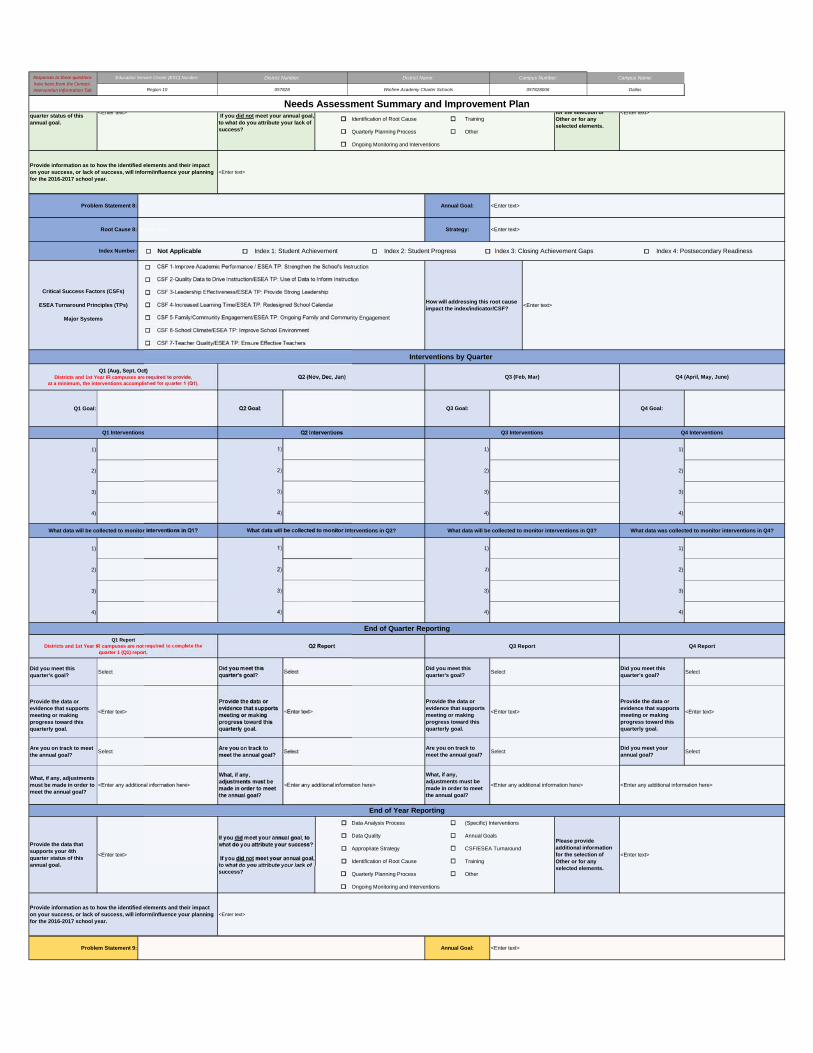
Responses to these questions have been from the Contact‐Intervention Information Tab
Needs Assessment Summary and Improvement Plan
Education Service Center (ESC) Number: District Number: District Name: Campus Number: Campus Name:
Region 10 057828 Winfree Academy Charter Schools 057828006 Dallas
Identification of Root Cause Training
Quarterly Planning Process Other
Ongoing Monitoring and Interventions
Not Applicable Index 1: Student Achievement Index 2: Student Progress Index 3: Closing Achievement Gaps Index 4: Postsecondary Readiness
Q1 Goal:
1)
2)
3)
4)
1)
2)
3)
4)
Did you meet this quarter's goal?
Provide the data or evidence that supports meeting or making progress toward this quarterly goal.
Are you on track to meet the annual goal?
What, if any, adjustments must be made in order to meet the annual goal?
Data Analysis Process (Specific) Interventions
Data Quality Annual Goals
Appropriate Strategy CSF/ESEA Turnaround
Identification of Root Cause Training
Quarterly Planning Process Other
Ongoing Monitoring and Interventions
Provide information as to how the identified elements and their impact on your success, or lack of success, will inform/influence your planning for the 2016-2017 school year.
<Enter text>
Problem Statement 9: Annual Goal: <Enter text>
<Enter any additional information here>
What, if any, adjustments must be made in order to meet the annual goal?
<Enter any additional information here>
What, if any, adjustments must be made in order to meet the annual goal?
<Enter any additional information here> <Enter any additional information here>
End of Year Reporting
Provide the data that supports your 4th quarter status of this annual goal.
<Enter text>
If you did meet your annual goal, to what do you attribute your success?
If you did not meet your annual goal, to what do you attribute your lack of success?
Please provide additional information for the selection of Other or for any selected elements.
<Enter text>
<Enter text>
Provide the data or evidence that supports meeting or making progress toward this quarterly goal.
<Enter text>
Provide the data or evidence that supports meeting or making progress toward this quarterly goal.
<Enter text>
Provide the data or evidence that supports meeting or making progress toward this quarterly goal.
<Enter text>
SelectAre you on track to meet the annual goal?
SelectAre you on track to meet the annual goal?
SelectDid you meet your annual goal?
Select
End of Quarter Reporting
Q1 Report Districts and 1st Year IR campuses are not required to complete the
quarter 1 (Q1) report. Q2 Report Q3 Report Q4 Report
SelectDid you meet this quarter's goal?
SelectDid you meet this quarter's goal?
SelectDid you meet this quarter's goal?
Select
3) 3) 3)
4) 4) 4)
1) 1) 1)
2) 2) 2)
4) 4) 4)
What data will be collected to monitor interventions in Q1? What data will be collected to monitor interventions in Q2? What data will be collected to monitor interventions in Q3? What data was collected to monitor interventions in Q4?
2) 2) 2)
3) 3) 3)
Q1 Interventions Q2 Interventions Q3 Interventions Q4 Interventions
1) 1) 1)
Interventions by Quarter
Q1 (Aug, Sept, Oct)Districts and 1st Year IR campuses are required to provide,
at a minimum, the interventions accomplished for quarter 1 (Q1).Q2 (Nov, Dec, Jan) Q3 (Feb, Mar) Q4 (April, May, June)
Q2 Goal: Q3 Goal: Q4 Goal:
Critical Success Factors (CSFs)
ESEA Turnaround Principles (TPs)
Major Systems
CSF 1-Improve Academic Performance / ESEA TP: Strengthen the School's Instruction
How will addressing this root cause impact the index/indicator/CSF?
<Enter text>
CSF 2-Quality Data to Drive Instruction/ESEA TP: Use of Data to Inform Instruction
CSF 3-Leadership Effectiveness/ESEA TP: Provide Strong Leadership
CSF 4-Increased Learning Time/ESEA TP: Redesigned School Calendar
CSF 5-Family/Community Engagement/ESEA TP: Ongoing Family and Community Engagement
CSF 6-School Climate/ESEA TP: Improve School Environment
CSF 7-Teacher Quality/ESEA TP: Ensure Effective Teachers
Problem Statement 8: Annual Goal: <Enter text>
Root Cause 8: <Enter text> Strategy: <Enter text>
Index Number:
Provide information as to how the identified elements and their impact on your success, or lack of success, will inform/influence your planning for the 2016-2017 school year.
<Enter text>
quarter status of this annual goal.
<Enter text> If you did not meet your annual goal, to what do you attribute your lack of success?
for the selection of Other or for any selected elements.
<Enter text>
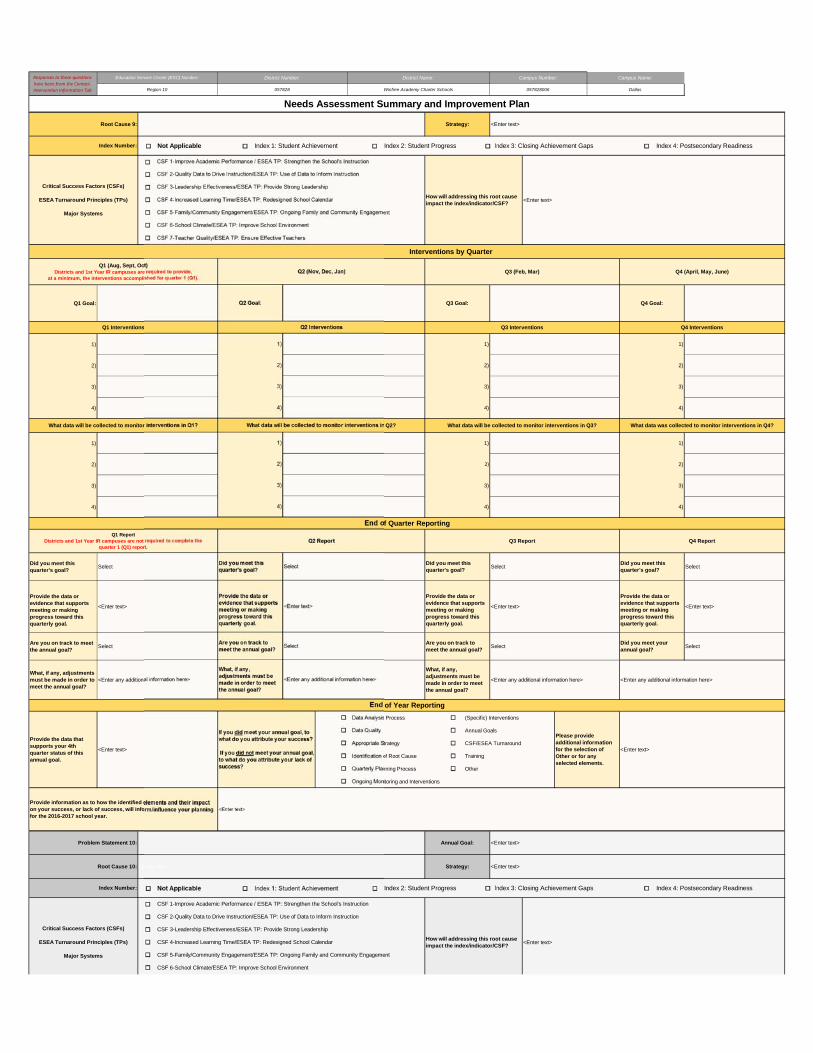
Responses to these questions have been from the Contact‐Intervention Information Tab
Needs Assessment Summary and Improvement Plan
Education Service Center (ESC) Number: District Number: District Name: Campus Number: Campus Name:
Region 10 057828 Winfree Academy Charter Schools 057828006 Dallas
Not Applicable Index 1: Student Achievement Index 2: Student Progress Index 3: Closing Achievement Gaps Index 4: Postsecondary Readiness
Q1 Goal:
1)
2)
3)
4)
1)
2)
3)
4)
Did you meet this quarter's goal?
Provide the data or evidence that supports meeting or making progress toward this quarterly goal.
Are you on track to meet the annual goal?
What, if any, adjustments must be made in order to meet the annual goal?
Data Analysis Process (Specific) Interventions
Data Quality Annual Goals
Appropriate Strategy CSF/ESEA Turnaround
Identification of Root Cause Training
Quarterly Planning Process Other
Ongoing Monitoring and Interventions
Not Applicable Index 1: Student Achievement Index 2: Student Progress Index 3: Closing Achievement Gaps Index 4: Postsecondary ReadinessIndex Number:
Critical Success Factors (CSFs)
ESEA Turnaround Principles (TPs)
Major Systems
CSF 1-Improve Academic Performance / ESEA TP: Strengthen the School's Instruction
How will addressing this root cause impact the index/indicator/CSF?
<Enter text>
CSF 2-Quality Data to Drive Instruction/ESEA TP: Use of Data to Inform Instruction
CSF 3-Leadership Effectiveness/ESEA TP: Provide Strong Leadership
CSF 4-Increased Learning Time/ESEA TP: Redesigned School Calendar
CSF 5-Family/Community Engagement/ESEA TP: Ongoing Family and Community Engagement
CSF 6-School Climate/ESEA TP: Improve School Environment
Provide information as to how the identified elements and their impact on your success, or lack of success, will inform/influence your planning for the 2016-2017 school year.
<Enter text>
Problem Statement 10: Annual Goal: <Enter text>
Root Cause 10: <Enter text> Strategy: <Enter text>
<Enter any additional information here>
What, if any, adjustments must be made in order to meet the annual goal?
<Enter any additional information here>
What, if any, adjustments must be made in order to meet the annual goal?
<Enter any additional information here> <Enter any additional information here>
End of Year Reporting
Provide the data that supports your 4th quarter status of this annual goal.
<Enter text>
If you did meet your annual goal, to what do you attribute your success?
If you did not meet your annual goal, to what do you attribute your lack of success?
Please provide additional information for the selection of Other or for any selected elements.
<Enter text>
<Enter text>
Provide the data or evidence that supports meeting or making progress toward this quarterly goal.
<Enter text>
Provide the data or evidence that supports meeting or making progress toward this quarterly goal.
<Enter text>
Provide the data or evidence that supports meeting or making progress toward this quarterly goal.
<Enter text>
SelectAre you on track to meet the annual goal?
SelectAre you on track to meet the annual goal?
SelectDid you meet your annual goal?
Select
End of Quarter Reporting
Q1 Report Districts and 1st Year IR campuses are not required to complete the
quarter 1 (Q1) report. Q2 Report Q3 Report Q4 Report
SelectDid you meet this quarter's goal?
SelectDid you meet this quarter's goal?
SelectDid you meet this quarter's goal?
Select
3) 3) 3)
4) 4) 4)
1) 1) 1)
2) 2) 2)
4) 4) 4)
What data will be collected to monitor interventions in Q1? What data will be collected to monitor interventions in Q2? What data will be collected to monitor interventions in Q3? What data was collected to monitor interventions in Q4?
2) 2) 2)
3) 3) 3)
Q1 Interventions Q2 Interventions Q3 Interventions Q4 Interventions
1) 1) 1)
Interventions by Quarter
Q1 (Aug, Sept, Oct)Districts and 1st Year IR campuses are required to provide,
at a minimum, the interventions accomplished for quarter 1 (Q1).Q2 (Nov, Dec, Jan) Q3 (Feb, Mar) Q4 (April, May, June)
Q2 Goal: Q3 Goal: Q4 Goal:
Index Number:
Critical Success Factors (CSFs)
ESEA Turnaround Principles (TPs)
Major Systems
CSF 1-Improve Academic Performance / ESEA TP: Strengthen the School's Instruction
How will addressing this root cause impact the index/indicator/CSF?
<Enter text>
CSF 2-Quality Data to Drive Instruction/ESEA TP: Use of Data to Inform Instruction
CSF 3-Leadership Effectiveness/ESEA TP: Provide Strong Leadership
CSF 4-Increased Learning Time/ESEA TP: Redesigned School Calendar
CSF 5-Family/Community Engagement/ESEA TP: Ongoing Family and Community Engagement
CSF 6-School Climate/ESEA TP: Improve School Environment
CSF 7-Teacher Quality/ESEA TP: Ensure Effective Teachers
Root Cause 9: <Enter text> Strategy: <Enter text>
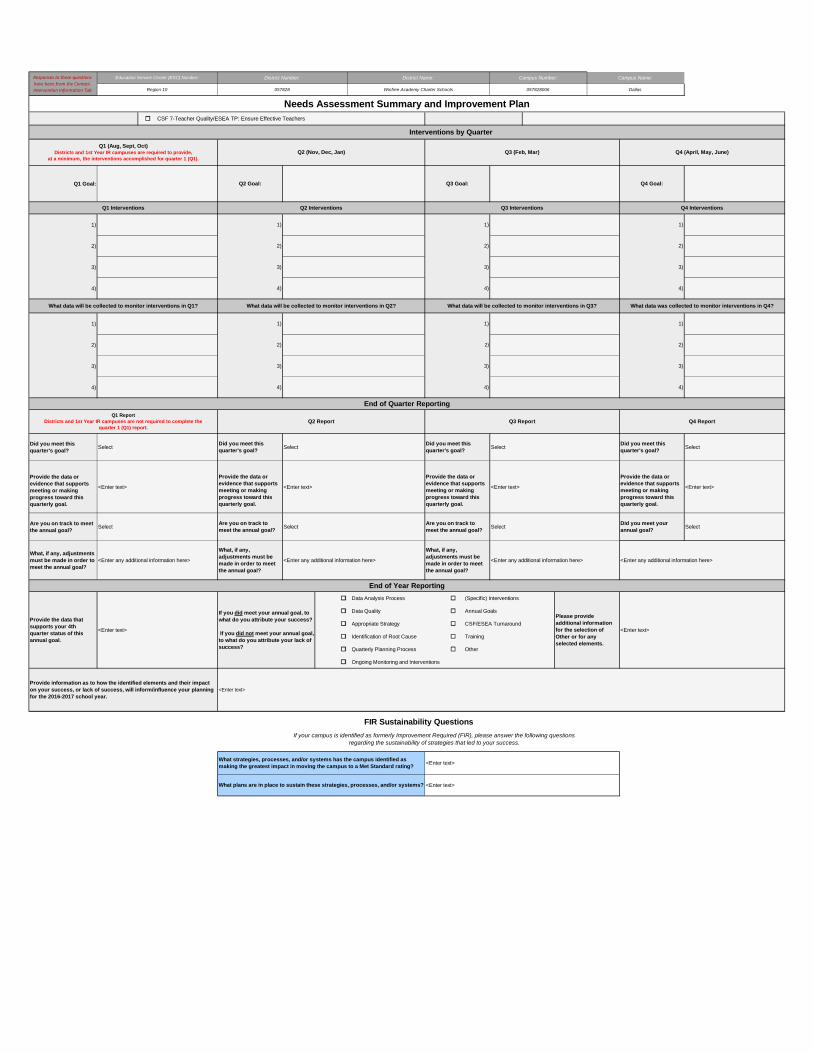
Responses to these questions have been from the Contact‐Intervention Information Tab
Needs Assessment Summary and Improvement Plan
Education Service Center (ESC) Number: District Number: District Name: Campus Number: Campus Name:
Region 10 057828 Winfree Academy Charter Schools 057828006 Dallas
Q1 Goal:
1)
2)
3)
4)
1)
2)
3)
4)
Did you meet this quarter's goal?
Provide the data or evidence that supports meeting or making progress toward this quarterly goal.
Are you on track to meet the annual goal?
What, if any, adjustments must be made in order to meet the annual goal?
Data Analysis Process (Specific) Interventions
Data Quality Annual Goals
Appropriate Strategy CSF/ESEA Turnaround
Identification of Root Cause Training
Quarterly Planning Process Other
Ongoing Monitoring and Interventions
Provide information as to how the identified elements and their impact on your success, or lack of success, will inform/influence your planning for the 2016-2017 school year.
<Enter text>
If your campus is identified as formerly Improvement Required (FIR), please answer the following questions regarding the sustainability of strategies that led to your success.
What plans are in place to sustain these strategies, processes, and/or systems?
What strategies, processes, and/or systems has the campus identified as making the greatest impact in moving the campus to a Met Standard rating?
<Enter text>
<Enter text>
<Enter any additional information here>
What, if any, adjustments must be made in order to meet the annual goal?
<Enter any additional information here>
What, if any, adjustments must be made in order to meet the annual goal?
<Enter any additional information here> <Enter any additional information here>
End of Year Reporting
Provide the data that supports your 4th quarter status of this annual goal.
<Enter text>
If you did meet your annual goal, to what do you attribute your success?
If you did not meet your annual goal, to what do you attribute your lack of success?
Please provide additional information for the selection of Other or for any selected elements.
<Enter text>
FIR Sustainability Questions
<Enter text>
Provide the data or evidence that supports meeting or making progress toward this quarterly goal.
<Enter text>
Provide the data or evidence that supports meeting or making progress toward this quarterly goal.
<Enter text>
Provide the data or evidence that supports meeting or making progress toward this quarterly goal.
<Enter text>
SelectAre you on track to meet the annual goal?
SelectAre you on track to meet the annual goal?
SelectDid you meet your annual goal?
Select
End of Quarter Reporting
Q1 Report Districts and 1st Year IR campuses are not required to complete the
quarter 1 (Q1) report. Q2 Report Q3 Report Q4 Report
SelectDid you meet this quarter's goal?
SelectDid you meet this quarter's goal?
SelectDid you meet this quarter's goal?
Select
3) 3) 3)
4) 4) 4)
1) 1) 1)
2) 2) 2)
4) 4) 4)
What data will be collected to monitor interventions in Q1? What data will be collected to monitor interventions in Q2? What data will be collected to monitor interventions in Q3? What data was collected to monitor interventions in Q4?
2) 2) 2)
3) 3) 3)
Q1 Interventions Q2 Interventions Q3 Interventions Q4 Interventions
1) 1) 1)
Interventions by Quarter
Q1 (Aug, Sept, Oct)Districts and 1st Year IR campuses are required to provide,
at a minimum, the interventions accomplished for quarter 1 (Q1).Q2 (Nov, Dec, Jan) Q3 (Feb, Mar) Q4 (April, May, June)
Q2 Goal: Q3 Goal: Q4 Goal:
CSF 7-Teacher Quality/ESEA TP: Ensure Effective Teachers
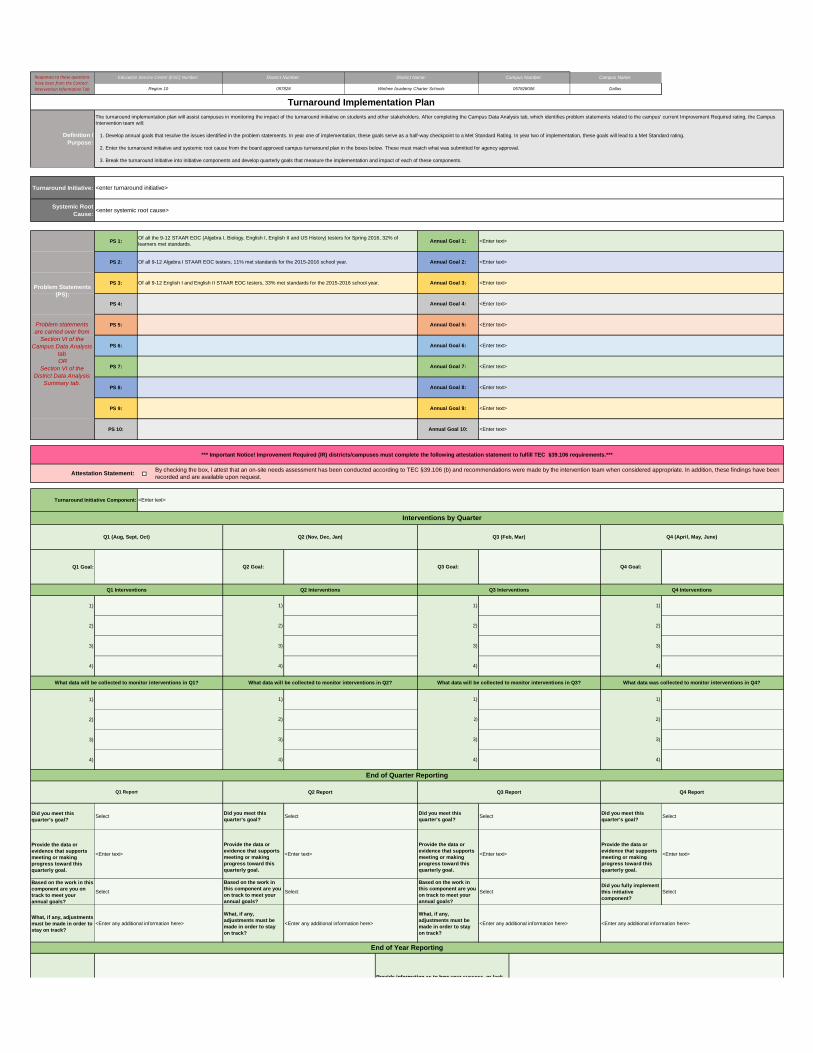
Definition /Purpose:
Turnaround Initiative:
Systemic Root Cause:
PS 1:
PS 2:
PS 3:
PS 4:
PS 5:
PS 6:
PS 7:
PS 8:
PS 9:
PS 10:
Q1 Goal:
1)
2)
3)
4)
1)
2)
3)
4)
Did you meet this quarter's goal?
Provide the data or evidence that supports meeting or making progress toward this quarterly goal.
Based on the work in this component are you on track to meet your annual goals?
What, if any, adjustments must be made in order to stay on track?
End of Quarter Reporting
<Enter any additional information here>
Select
<Enter text>
Select
Q4 Report
End of Year Reporting
Provide information as to how your success or lack
4)
3) 3)
Q3 Interventions
Provide the data or evidence that supports meeting or making progress toward this quarterly goal.
<Enter text>
Provide the data or evidence that supports meeting or making progress toward this quarterly goal.
Q1 Report Q2 Report Q3 Report
SelectDid you meet this quarter's goal?
SelectDid you meet this quarter's goal?
Select
<Enter any additional information here>
What, if any, adjustments must be made in order to stay on track?
<Enter any additional information here>
What, if any, adjustments must be made in order to stay on track?
<Enter any additional information here>
Select
<Enter text>
Provide the data or evidence that supports meeting or making progress toward this quarterly goal.
<Enter text>
Did you meet this quarter's goal?
3)
4)
2) 2) 2)
4)
Q4 (April, May, June)
Q4 Interventions
<Enter text>
*** Important Notice! Improvement Required (IR) districts/campuses must complete the following attestation statement to fulfill TEC §39.106 requirements.***
By checking the box, I attest that an on-site needs assessment has been conducted according to TEC §39.106 (b) and recommendations were made by the intervention team when considered appropriate. In addition, these findings have been recorded and are available upon request.
Q2 Goal: Q3 Goal: Q4 Goal:
1) 1) 1)
3)
2) 2) 2)
Q1 Interventions Q2 Interventions
<Enter text>Annual Goal 10:
Problem Statements (PS):
Problem statements are carried over from
Section VI of the Campus Data Analysis
tab OR
Section VI of the District Data Analysis
Summary tab.
Annual Goal 7:
Annual Goal 6:
Annual Goal 5:
Annual Goal 4:
Annual Goal 3:
Annual Goal 2:
Annual Goal 1:
Of all 9-12 English I and English II STAAR EOC testers, 33% met standards for the 2015-2016 school year.
Of all 9-12 Algebra I STAAR EOC testers, 11% met standards for the 2015-2016 school year.
Q3 (Feb, Mar)
Turnaround Initiative Component:
Attestation Statement:
Interventions by Quarter
Q1 (Aug, Sept, Oct) Q2 (Nov, Dec, Jan)
057828006
<Enter text>
<Enter text>
<Enter text>
<Enter text>
<Enter text>
<Enter text>
<Enter text>
Dallas
<Enter text>
<Enter text>
Annual Goal 9:
Annual Goal 8:
Turnaround Implementation Plan
Responses to these questions have been from the Contact‐Intervention Information Tab
The turnaround implementation plan will assist campuses in monitoring the impact of the turnaround initiative on students and other stakeholders. After completing the Campus Data Analysis tab, which identifies problem statements related to the campus’ current Improvement Required rating, the Campus Intervention team will:
1. Develop annual goals that resolve the issues identified in the problem statements. In year one of implementation, these goals serve as a half-way checkpoint to a Met Standard Rating. In year two of implementation, these goals will lead to a Met Standard rating.
2. Enter the turnaround initiative and systemic root cause from the board approved campus turnaround plan in the boxes below. These must match what was submitted for agency approval.
3. Break the turnaround initiative into initiative components and develop quarterly goals that measure the implementation and impact of each of these components.
Education Service Center (ESC) Number: District Number: District Name: Campus Number: Campus Name:
Region 10 057828 Winfree Academy Charter Schools
Of all the 9-12 STAAR EOC (Algebra I, Biology, English I, English II and US History) testers for Spring 2016, 32% of learners met standards.
What data will be collected to monitor interventions in Q1? What data will be collected to monitor interventions in Q2? What data will be collected to monitor interventions in Q3?
1) 1) 1)
4) 4) 4)
3) 3)
What data was collected to monitor interventions in Q4?
Based on the work in this component are you on track to meet your annual goals?
Select
Based on the work in this component are you on track to meet your annual goals?
SelectDid you fully implement this initiative component?
<enter systemic root cause>
<enter turnaround initiative>
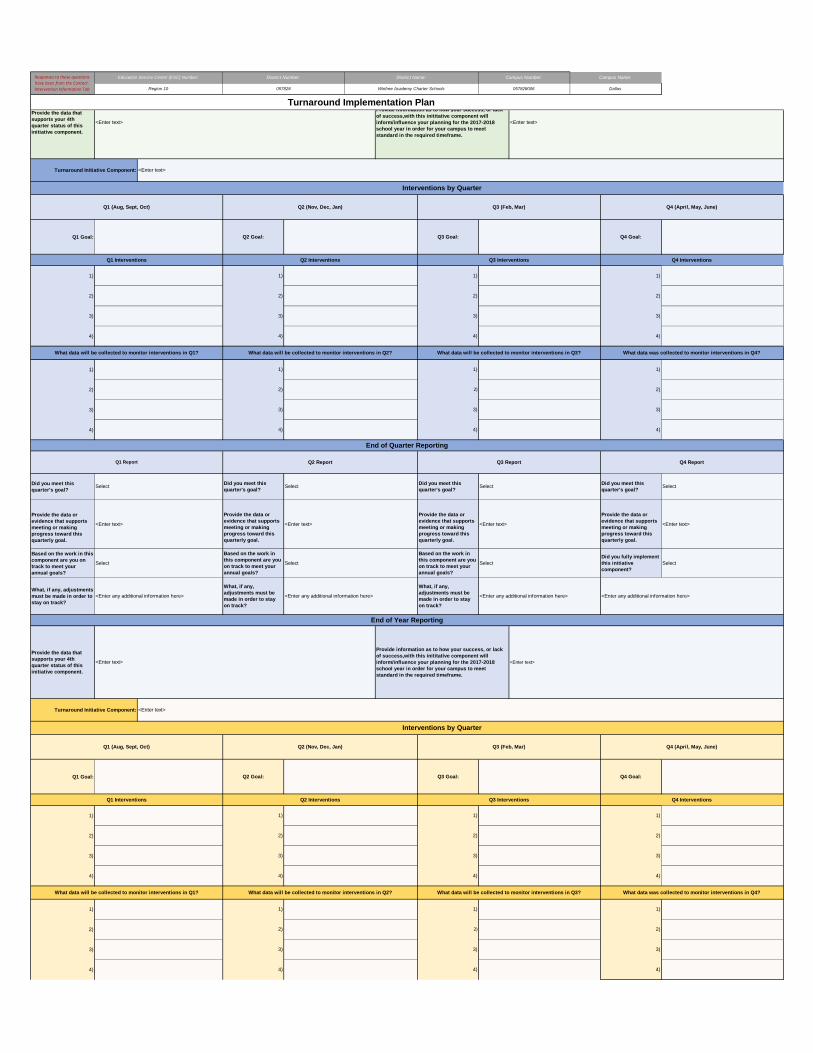
057828006 Dallas
Turnaround Implementation Plan
Responses to these questions have been from the Contact‐Intervention Information Tab
Education Service Center (ESC) Number: District Number: District Name: Campus Number: Campus Name:
Region 10 057828 Winfree Academy Charter Schools
Q1 Goal:
1)
2)
3)
4)
1)
2)
3)
4)
Did you meet this quarter's goal?
Provide the data or evidence that supports meeting or making progress toward this quarterly goal.
Based on the work in this component are you on track to meet your annual goals?
What, if any, adjustments must be made in order to stay on track?
Q1 Goal:
1)
2)
3)
4)
1)
2)
3)
4)
Provide information as to how your success, or lack of success,with this inititative component will inform/influence your planning for the 2017-2018 school year in order for your campus to meet standard in the required timeframe.
<Enter text>
2) 2)
1)1)
Provide the data that supports your 4th quarter status of this initiative component.
What data was collected to monitor interventions in Q4?
<Enter text>
1)
What data will be collected to monitor interventions in Q1? What data will be collected to monitor interventions in Q2? What data will be collected to monitor interventions in Q3?
Q4 Interventions
1)
4)
1)
Q4 Goal:
Q1 Interventions
Q2 Goal:
1)
2)
3) 3)
Q2 Interventions Q3 Interventions
Q3 Goal:
3) 3) 3)
2) 2) 2)
Interventions by Quarter
Q1 (Aug, Sept, Oct) Q2 (Nov, Dec, Jan) Q3 (Feb, Mar)
Turnaround Initiative Component:
Q4 (April, May, June)
<Enter text>
4) 4)
3)
Did you meet this quarter's goal?
<Enter text>
Provide the data or evidence that supports meeting or making progress toward this quarterly goal.
<Enter text>
Provide the data or evidence that supports meeting or making progress toward this quarterly goal.
<Enter text>
Provide the data or evidence that supports meeting or making progress toward this quarterly goal.
Q1 Report Q2 Report Q3 Report
SelectDid you meet this quarter's goal?
SelectDid you meet this quarter's goal?
Select
4) 4) 4)
Q1 (Aug, Sept, Oct) Q2 (Nov, Dec, Jan) Q3 (Feb, Mar)
Q2 Goal: Q3 Goal: Q4 Goal:
Select
<Enter text>
Select
Q4 Report
End of Quarter Reporting
Interventions by Quarter
Turnaround Initiative Component:
Provide the data that supports your 4th quarter status of this initiative component.
<Enter any additional information here>
What, if any, adjustments must be made in order to stay on track?
<Enter any additional information here>
What, if any, adjustments must be made in order to stay on track?
<Enter any additional information here>
End of Year Reporting
<Enter any additional information here>
<Enter text>
Select
Based on the work in this component are you on track to meet your annual goals?
Select
Based on the work in this component are you on track to meet your annual goals?
SelectDid you fully implement this initiative component?
3) 3) 3)
What data was collected to monitor interventions in Q4?
1)
2) 2) 2)
Q1 Interventions Q2 Interventions Q3 Interventions
1) 1)
3) 3) 3)
2) 2) 2)
Q4 Interventions
Q4 (April, May, June)
What data will be collected to monitor interventions in Q1? What data will be collected to monitor interventions in Q2? What data will be collected to monitor interventions in Q3?
1) 1) 1)
4) 4) 4)
4) 4) 4)
Provide information as to how your success, or lack of success,with this inititative component will inform/influence your planning for the 2017-2018 school year in order for your campus to meet standard in the required timeframe.
<Enter text> <Enter text>
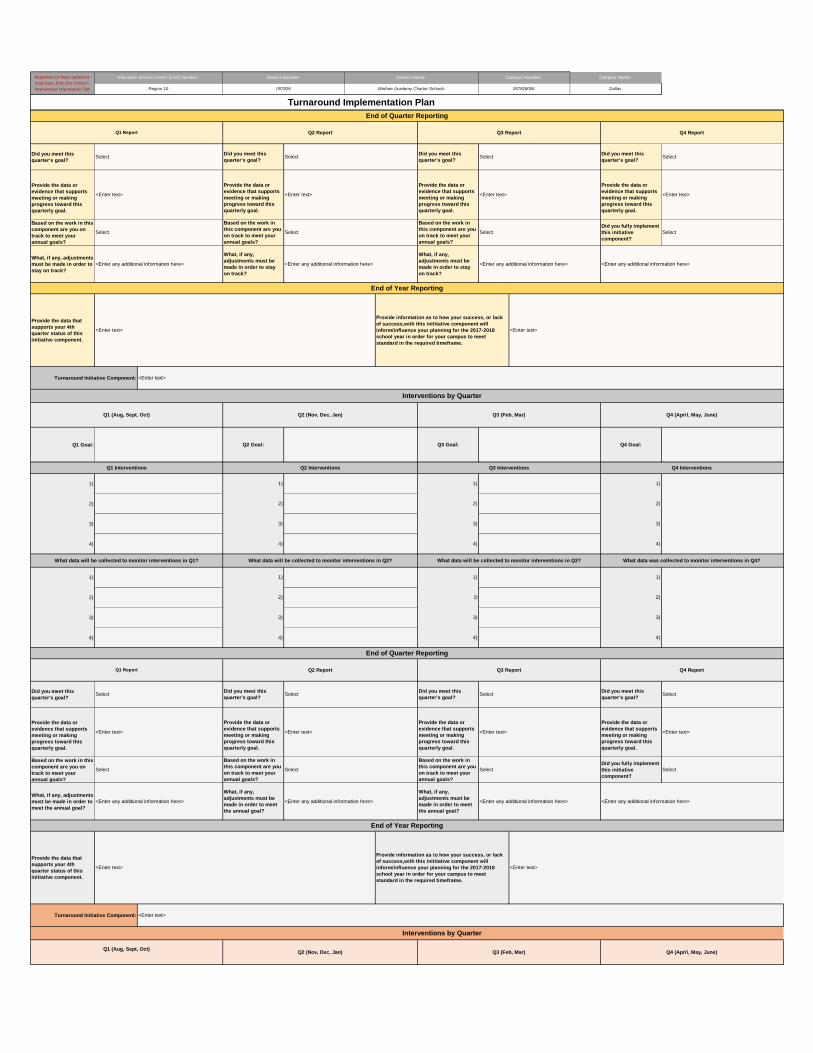
057828006 Dallas
Turnaround Implementation Plan
Responses to these questions have been from the Contact‐Intervention Information Tab
Education Service Center (ESC) Number: District Number: District Name: Campus Number: Campus Name:
Region 10 057828 Winfree Academy Charter Schools
Did you meet this quarter's goal?
Provide the data or evidence that supports meeting or making progress toward this quarterly goal.
Based on the work in this component are you on track to meet your annual goals?
What, if any, adjustments must be made in order to stay on track?
Q1 Goal:
1)
2)
3)
4)
1)
2)
3)
4)
Did you meet this quarter's goal?
Provide the data or evidence that supports meeting or making progress toward this quarterly goal.
Based on the work in this component are you on track to meet your annual goals?
What, if any, adjustments must be made in order to meet the annual goal?
End of Quarter Reporting
Q4 Report
Select
<Enter text>
Select
<Enter any additional information here>
End of Year Reporting
Did you meet this quarter's goal?
<Enter text>
Provide the data or evidence that supports meeting or making progress toward this quarterly goal.
<Enter text>
Provide the data or evidence that supports meeting or making progress toward this quarterly goal.
<Enter text>
Provide the data or evidence that supports meeting or making progress toward this quarterly goal.
Q1 Report Q2 Report Q3 Report
SelectDid you meet this quarter's goal?
SelectDid you meet this quarter's goal?
Select
Q1 (Aug, Sept, Oct) Q2 (Nov, Dec, Jan) Q3 (Feb, Mar)
Q2 Goal: Q3 Goal: Q4 Goal:
Interventions by Quarter
Turnaround Initiative Component:
<Enter any additional information here>
What, if any, adjustments must be made in order to stay on track?
<Enter any additional information here>
What, if any, adjustments must be made in order to stay on track?
<Enter any additional information here>
Select
Based on the work in this component are you on track to meet your annual goals?
Select
Based on the work in this component are you on track to meet your annual goals?
SelectDid you fully implement this initiative component?
4) 4)
3) 3) 3)
1)
2) 2) 2)
Q1 Interventions Q2 Interventions Q3 Interventions
1) 1)
End of Quarter Reporting
4) 4) 4)
3) 3) 3)
2) 2) 2)
Did you meet this quarter's goal?
<Enter text>
Provide the data or evidence that supports meeting or making progress toward this quarterly goal.
<Enter text>
Provide the data or evidence that supports meeting or making progress toward this quarterly goal.
<Enter text>
Provide the data or evidence that supports meeting or making progress toward this quarterly goal.
Q1 Report Q2 Report Q3 Report
SelectDid you meet this quarter's goal?
SelectDid you meet this quarter's goal?
Select
<Enter text>
Select
Q4 Report
Interventions by Quarter
Turnaround Initiative Component: <Enter text>
<Enter text>
Provide information as to how your success, or lack of success,with this inititative component will inform/influence your planning for the 2017-2018 school year in order for your campus to meet standard in the required timeframe.
<Enter text>
Provide the data that supports your 4th quarter status of this initiative component.
<Enter any additional information here>
What, if any, adjustments must be made in order to meet the annual goal?
<Enter any additional information here>
What, if any, adjustments must be made in order to meet the annual goal?
<Enter any additional information here>
Select
Based on the work in this component are you on track to meet your annual goals?
Select
Based on the work in this component are you on track to meet your annual goals?
SelectDid you fully implement this initiative component?
Select
End of Year Reporting
<Enter any additional information here>
Q1 (Aug, Sept, Oct)Q2 (Nov, Dec, Jan) Q3 (Feb, Mar) Q4 (April, May, June)
Provide the data that supports your 4th quarter status of this initiative component.
<Enter text>
Provide information as to how your success, or lack of success,with this inititative component will inform/influence your planning for the 2017-2018 school year in order for your campus to meet standard in the required timeframe.
<Enter text>
<Enter text>
Q4 (April, May, June)
What data was collected to monitor interventions in Q4?
Q4 Interventions
What data will be collected to monitor interventions in Q1? What data will be collected to monitor interventions in Q2? What data will be collected to monitor interventions in Q3?
1) 1) 1)
4)
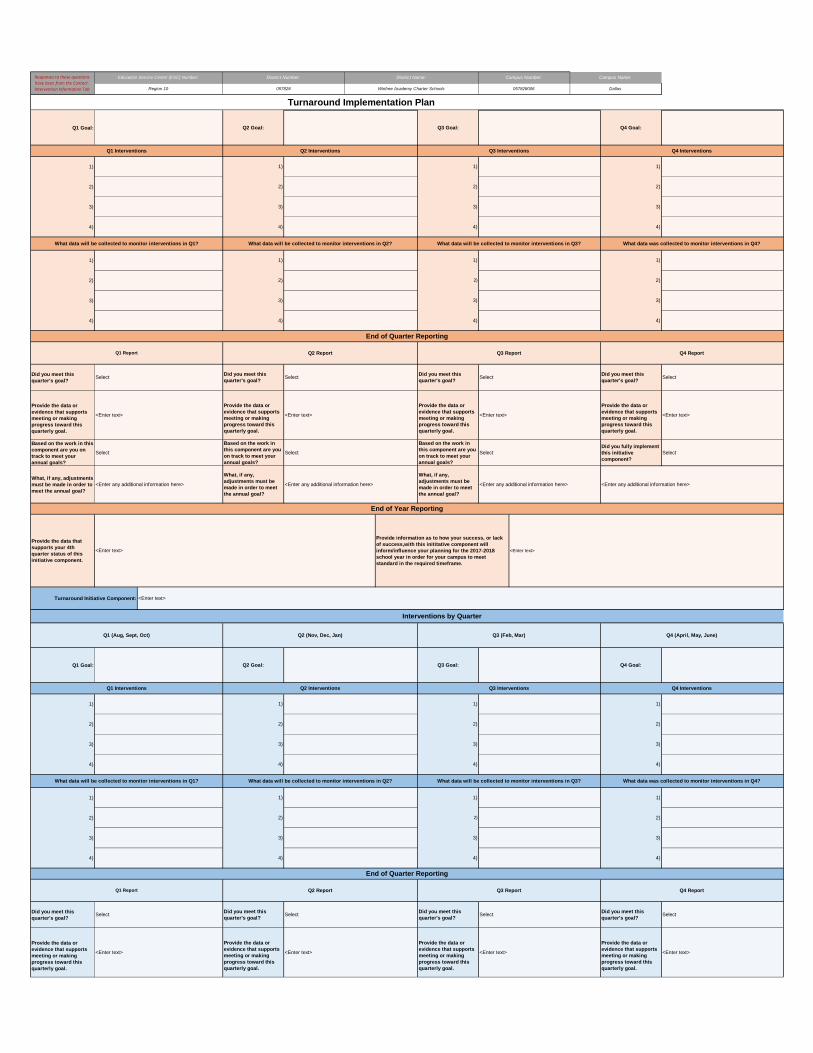
057828006 Dallas
Turnaround Implementation Plan
Responses to these questions have been from the Contact‐Intervention Information Tab
Education Service Center (ESC) Number: District Number: District Name: Campus Number: Campus Name:
Region 10 057828 Winfree Academy Charter Schools
Q1 Goal:
1)
2)
3)
4)
1)
2)
3)
4)
Did you meet this quarter's goal?
Provide the data or evidence that supports meeting or making progress toward this quarterly goal.
Based on the work in this component are you on track to meet your annual goals?
What, if any, adjustments must be made in order to meet the annual goal?
Q1 Goal:
1)
2)
3)
4)
1)
2)
3)
4)
Did you meet this quarter's goal?
Provide the data or evidence that supports meeting or making progress toward this quarterly goal.
1)
2) 2) 2)
Q1 Interventions Q2 Interventions Q3 Interventions
1) 1)
Q2 Goal: Q3 Goal: Q4 Goal:
Q4 Interventions
What data will be collected to monitor interventions in Q2? What data will be collected to monitor interventions in Q3?
1) 1) 1)
4) 4) 4)
3) 3) 3)
What data will be collected to monitor interventions in Q1?
Interventions by Quarter
Provide the data that supports your 4th quarter status of this initiative component.
<Enter any additional information here>
What, if any, adjustments must be made in order to meet the annual goal?
<Enter any additional information here>
What, if any, adjustments must be made in order to meet the annual goal?
<Enter any additional information here>
Select
Based on the work in this component are you on track to meet your annual goals?
Select
Based on the work in this component are you on track to meet your annual goals?
SelectDid you fully implement this initiative component?
Did you meet this quarter's goal?
<Enter text>
Provide the data or evidence that supports meeting or making progress toward this quarterly goal.
<Enter text>
Provide the data or evidence that supports meeting or making progress toward this quarterly goal.
<Enter text>
Provide the data or evidence that supports meeting or making progress toward this quarterly goal.
SelectDid you meet this quarter's goal?
SelectDid you meet this quarter's goal?
Select
Provide information as to how your success, or lack of success,with this inititative component will inform/influence your planning for the 2017-2018 school year in order for your campus to meet standard in the required timeframe.
<Enter text> <Enter text>
End of Year Reporting
<Enter any additional information here>
Select
<Enter text>
Q1 Interventions Q2 Interventions Q3 Interventions
1) 1)
Q1 (Aug, Sept, Oct) Q2 (Nov, Dec, Jan) Q3 (Feb, Mar)
Q2 Goal: Q3 Goal: Q4 Goal:
4) 4) 4)
3) 3) 3)
1)
2) 2) 2)
3) 3) 3)
2) 2) 2)
What data will be collected to monitor interventions in Q1? What data will be collected to monitor interventions in Q2? What data will be collected to monitor interventions in Q3?
1) 1) 1)
Did you meet this quarter's goal?
<Enter text>
Provide the data or evidence that supports meeting or making progress toward this quarterly goal.
<Enter text>
Provide the data or evidence that supports meeting or making progress toward this quarterly goal.
<Enter text>
Provide the data or evidence that supports meeting or making progress toward this quarterly goal.
Q1 Report Q2 Report Q3 Report
SelectDid you meet this quarter's goal?
SelectDid you meet this quarter's goal?
Select
4) 4) 4)
Select
Q4 Report
End of Quarter Reporting
What data was collected to monitor interventions in Q4?
Q1 Report Q2 Report Q3 Report
4) 4) 4)
3) 3) 3)
2) 2) 2)
Turnaround Initiative Component: <Enter text>
<Enter text>
Select
Q4 Report
End of Quarter Reporting
What data was collected to monitor interventions in Q4?
Q4 Interventions
Q4 (April, May, June)
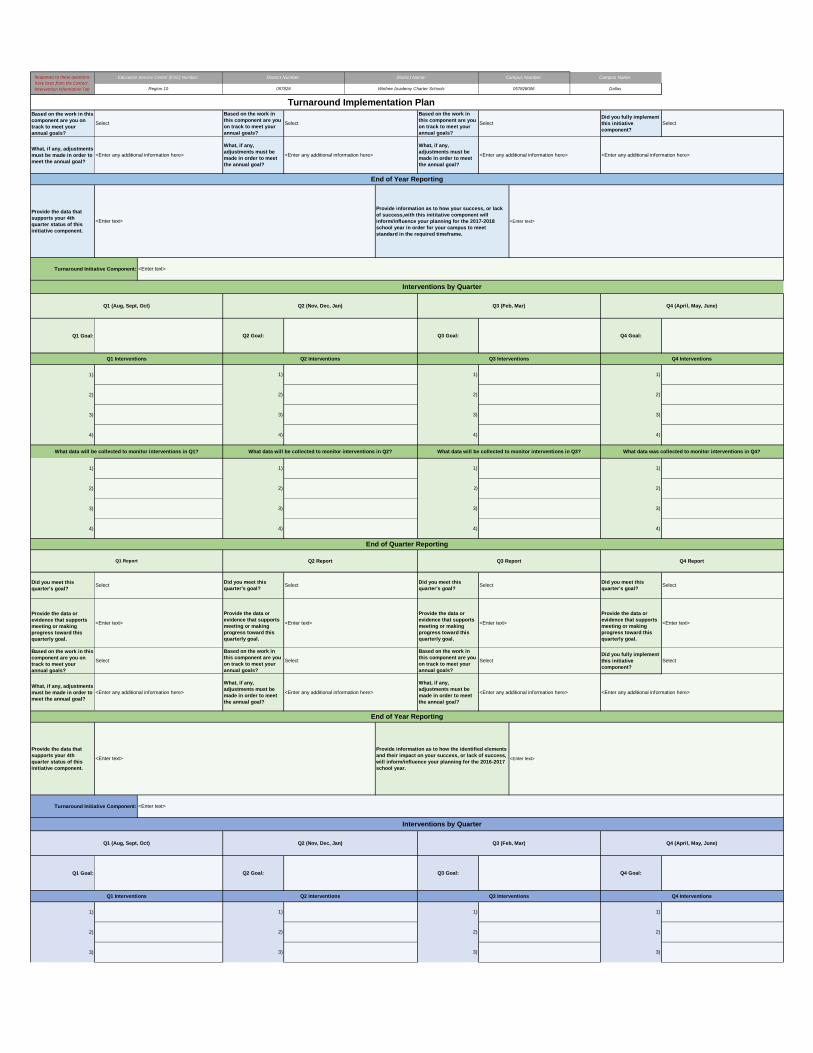
057828006 Dallas
Turnaround Implementation Plan
Responses to these questions have been from the Contact‐Intervention Information Tab
Education Service Center (ESC) Number: District Number: District Name: Campus Number: Campus Name:
Region 10 057828 Winfree Academy Charter Schools
Based on the work in this component are you on track to meet your annual goals?
What, if any, adjustments must be made in order to meet the annual goal?
Q1 Goal:
1)
2)
3)
4)
1)
2)
3)
4)
Did you meet this quarter's goal?
Provide the data or evidence that supports meeting or making progress toward this quarterly goal.
Based on the work in this component are you on track to meet your annual goals?
What, if any, adjustments must be made in order to meet the annual goal?
Q1 Goal:
1)
2)
3)
Interventions by Quarter
Turnaround Initiative Component: <Enter text>
Provide the data that supports your 4th quarter status of this initiative component.
<Enter any additional information here>
What, if any, adjustments must be made in order to meet the annual goal?
<Enter any additional information here>
What, if any, adjustments must be made in order to meet the annual goal?
<Enter any additional information here>
Select
Based on the work in this component are you on track to meet your annual goals?
Select
Based on the work in this component are you on track to meet your annual goals?
SelectDid you fully implement this initiative component?
<Enter text> <Enter text>
Provide information as to how your success, or lack of success,with this inititative component will inform/influence your planning for the 2017-2018 school year in order for your campus to meet standard in the required timeframe.
Q1 Interventions Q2 Interventions Q3 Interventions
1) 1)
Q1 (Aug, Sept, Oct) Q2 (Nov, Dec, Jan) Q3 (Feb, Mar)
Q2 Goal: Q3 Goal: Q4 Goal:
4) 4) 4)
3) 3) 3)
1)
2) 2) 2)
4)
3) 3) 3)
2) 2) 2)
What data will be collected to monitor interventions in Q1? What data will be collected to monitor interventions in Q2? What data will be collected to monitor interventions in Q3?
1) 1) 1)
Provide the data that supports your 4th quarter status of this initiative component.
<Enter any additional information here>
What, if any, adjustments must be made in order to meet the annual goal?
<Enter any additional information here>
What, if any, adjustments must be made in order to meet the annual goal?
<Enter any additional information here>
Select
Based on the work in this component are you on track to meet your annual goals?
Select
Based on the work in this component are you on track to meet your annual goals?
SelectDid you fully implement this initiative component?
<Enter text>
Provide information as to how the identified elements and their impact on your success, or lack of success, will inform/influence your planning for the 2016-2017 school year.
<Enter text>
Did you meet this quarter's goal?
<Enter text>
Provide the data or evidence that supports meeting or making progress toward this quarterly goal.
<Enter text>
Provide the data or evidence that supports meeting or making progress toward this quarterly goal.
<Enter text>
Provide the data or evidence that supports meeting or making progress toward this quarterly goal.
SelectDid you meet this quarter's goal?
SelectDid you meet this quarter's goal?
Select
Q1 (Aug, Sept, Oct) Q2 (Nov, Dec, Jan) Q3 (Feb, Mar)
Q2 Goal: Q3 Goal: Q4 Goal:
Q4 (April, May, June)
Q4 Interventions
Interventions by Quarter
Turnaround Initiative Component: <Enter text>
1)
2) 2) 2)
Q1 Interventions Q2 Interventions Q3 Interventions
1) 1)
3) 3) 3)
Q4 Report
End of Quarter Reporting
End of Year Reporting
End of Year Reporting
<Enter any additional information here>
Select
Q1 Report Q2 Report Q3 Report
4) 4)
What data was collected to monitor interventions in Q4?
Q4 Interventions
Q4 (April, May, June)
<Enter any additional information here>
Select
<Enter text>
Select
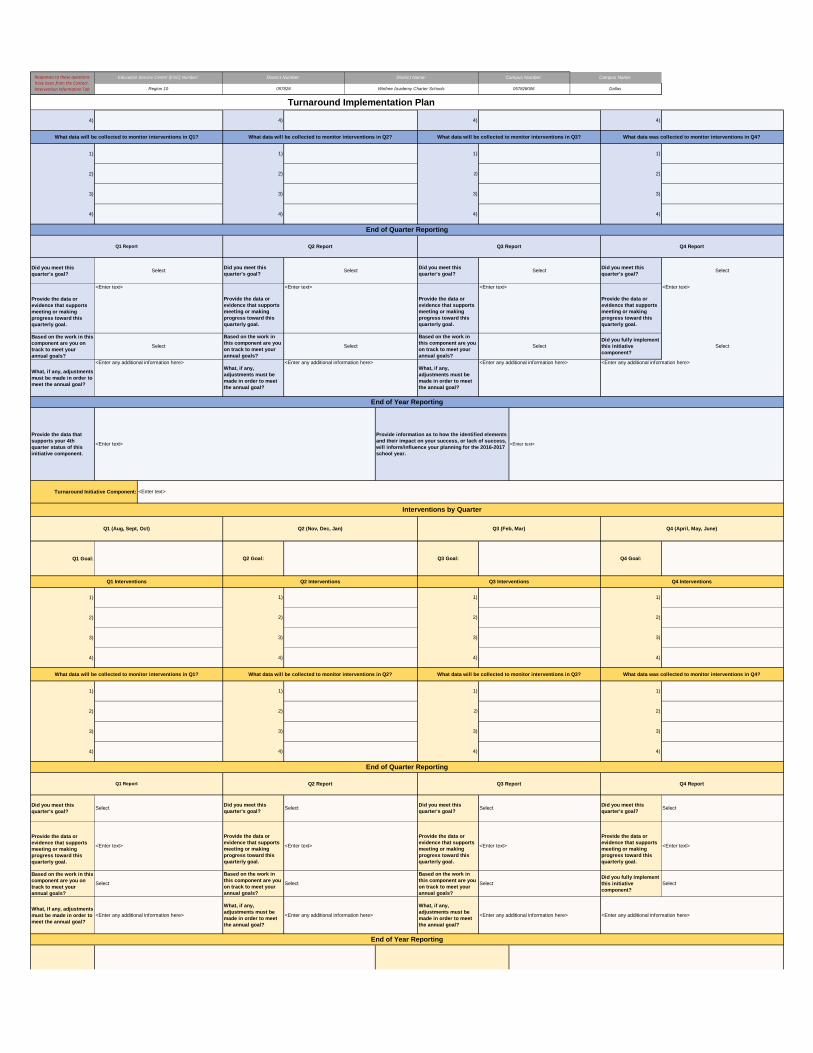
057828006 Dallas
Turnaround Implementation Plan
Responses to these questions have been from the Contact‐Intervention Information Tab
Education Service Center (ESC) Number: District Number: District Name: Campus Number: Campus Name:
Region 10 057828 Winfree Academy Charter Schools
4)
1)
2)
3)
4)
Did you meet this quarter's goal?
Provide the data or evidence that supports meeting or making progress toward this quarterly goal.
Based on the work in this component are you on track to meet your annual goals?
What, if any, adjustments must be made in order to meet the annual goal?
Q1 Goal:
1)
2)
3)
4)
1)
2)
3)
4)
Did you meet this quarter's goal?
Provide the data or evidence that supports meeting or making progress toward this quarterly goal.
Based on the work in this component are you on track to meet your annual goals?
What, if any, adjustments must be made in order to meet the annual goal?
What data was collected to monitor interventions in Q4?What data will be collected to monitor interventions in Q1? What data will be collected to monitor interventions in Q2? What data will be collected to monitor interventions in Q3?
1) 1) 1)
4) 4) 4)
4) 4) 4)
3) 3) 3)
2) 2) 2)
Did you meet this quarter's goal?
<Enter text>
Provide the data or evidence that supports meeting or making progress toward this quarterly goal.
<Enter text>
Provide the data or evidence that supports meeting or making progress toward this quarterly goal.
<Enter text>
Provide the data or evidence that supports meeting or making progress toward this quarterly goal.
Q1 Report Q2 Report Q3 Report
SelectDid you meet this quarter's goal?
SelectDid you meet this quarter's goal?
Select
Q4 Report
Select
<Enter text>
Interventions by Quarter
Turnaround Initiative Component:
Provide the data that supports your 4th quarter status of this initiative component.
<Enter any additional information here>What, if any, adjustments must be made in order to meet the annual goal?
<Enter any additional information here>What, if any, adjustments must be made in order to meet the annual goal?
<Enter any additional information here>
Select
Based on the work in this component are you on track to meet your annual goals?
Select
Based on the work in this component are you on track to meet your annual goals?
SelectDid you fully implement this initiative component?
Select
<Enter any additional information here>
End of Year Reporting
Q1 Interventions Q2 Interventions Q3 Interventions
1) 1)
Q1 (Aug, Sept, Oct) Q2 (Nov, Dec, Jan) Q3 (Feb, Mar)
Q2 Goal: Q3 Goal: Q4 Goal:
Q4 (April, May, June)
Q4 Interventions
4) 4) 4)
3) 3) 3)
What data was collected to monitor interventions in Q4?
1)
2) 2) 2)
3) 3) 3)
2) 2) 2)
What data will be collected to monitor interventions in Q1? What data will be collected to monitor interventions in Q2? What data will be collected to monitor interventions in Q3?
1) 1) 1)
Q1 Report Q2 Report Q3 Report
SelectDid you meet this quarter's goal?
SelectDid you meet this quarter's goal?
Select
End of Quarter Reporting
Q4 Report
Select
<Enter text>
4) 4) 4)
<Enter any additional information here>
What, if any, adjustments must be made in order to meet the annual goal?
<Enter any additional information here>
What, if any, adjustments must be made in order to meet the annual goal?
<Enter any additional information here>
Select
Based on the work in this component are you on track to meet your annual goals?
Select
Based on the work in this component are you on track to meet your annual goals?
SelectDid you fully implement this initiative component?
Select
<Enter any additional information here>
End of Year Reporting
Did you meet this quarter's goal?
<Enter text>
Provide the data or evidence that supports meeting or making progress toward this quarterly goal.
<Enter text>
Provide the data or evidence that supports meeting or making progress toward this quarterly goal.
<Enter text>
Provide the data or evidence that supports meeting or making progress toward this quarterly goal.
End of Quarter Reporting
<Enter text>
<Enter text>
Provide information as to how the identified elements and their impact on your success, or lack of success, will inform/influence your planning for the 2016-2017 school year.
<Enter text>

057828006 Dallas
Turnaround Implementation Plan
Responses to these questions have been from the Contact‐Intervention Information Tab
Education Service Center (ESC) Number: District Number: District Name: Campus Number: Campus Name:
Region 10 057828 Winfree Academy Charter Schools
Q1 Goal:
1)
2)
3)
4)
1)
2)
3)
4)
Did you meet this quarter's goal?
Provide the data or evidence that supports meeting or making progress toward this quarterly goal.
Based on the work in this component are you on track to meet your annual goals?
What, if any, adjustments must be made in order to meet the annual goal?
Provide the data that supports your 4th quarter status of this initiative component.
Q1 (Aug, Sept, Oct) Q2 (Nov, Dec, Jan) Q3 (Feb, Mar)
Q2 Goal: Q3 Goal: Q4 Goal:
Q4 (April, May, June)
Q4 Interventions
Interventions by Quarter
Turnaround Initiative Component:
Select
<Enter text>
3) 3) 3)
1)
2) 2) 2)
Q1 Interventions Q2 Interventions Q3 Interventions
1) 1)
What data will be collected to monitor interventions in Q1? What data will be collected to monitor interventions in Q2? What data will be collected to monitor interventions in Q3?
1) 1) 1)
What data was collected to monitor interventions in Q4?
4) 4) 4)
4)
End of Quarter Reporting
Q4 Report
Select
<Enter text>
3) 3) 3)
2) 2) 2)
Q1 Report Q2 Report Q3 Report
Select
What plans are in place to sustain these strategies, processes, and/or systems?<Enter text>
FIR Sustainability Questions
If your campus is identified as formerly Improvement Required (FIR), please answer the following questions regarding the sustainability of strategies that led to your success.
What strategies, processes, and/or systems has the campus identified as making the greatest impact in moving the campus to a Met Standard rating?
<Enter text>
Provide the data that supports your 4th quarter status of this initiative component.
<Enter any additional information here>
What, if any, adjustments must be made in order to meet the annual goal?
<Enter any additional information here>
What, if any, adjustments must be made in order to meet the annual goal?
<Enter any additional information here>
End of Year Reporting
<Enter any additional information here>
<Enter text>
Provide the data or evidence that supports meeting or making progress toward this quarterly goal.
<Enter text>
Provide the data or evidence that supports meeting or making progress toward this quarterly goal.
Did you meet this quarter's goal?
SelectDid you meet this quarter's goal?
Select
4) 4)
Select
Based on the work in this component are you on track to meet your annual goals?
Select
Based on the work in this component are you on track to meet your annual goals?
SelectDid you fully implement this initiative component?
Did you meet this quarter's goal?
<Enter text>
Provide the data or evidence that supports meeting or making progress toward this quarterly goal.
<Enter text> <Enter text>
Provide information as to how the identified elements and their impact on your success, or lack of success, will inform/influence your planning for the 2016-2017 school year.
<Enter text>
Provide information as to how the identified elements and their impact on your success, or lack of success, will inform/influence your planning for the 2016-2017 school year.
<Enter text>
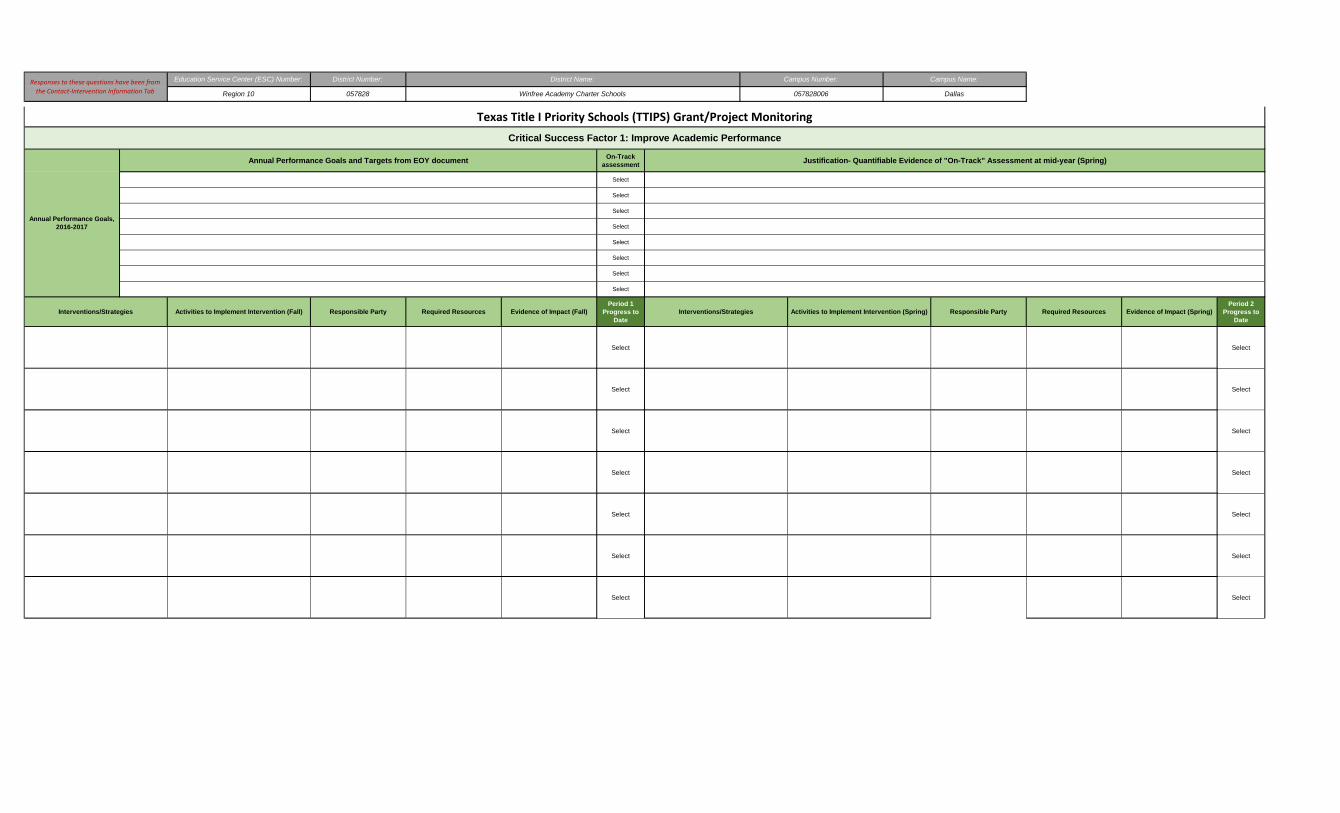
On-Track assessment
Select
Select
Select
Select
Select
Select
Select
Select
Period 1 Progress to
Date
Period 2 Progress to
Date
Select Select
Select Select
Select Select
Select Select
Select Select
Select Select
Select Select
Responses to these questions have been from the Contact‐Intervention Information Tab
Education Service Center (ESC) Number: District Number: District Name: Campus Number: Campus Name:
Region 10 057828 Winfree Academy Charter Schools 057828006 Dallas
Interventions/StrategiesResponsible PartyActivities to Implement Intervention (Fall) Required Resources Activities to Implement Intervention (Spring) Responsible Party Required Resources Evidence of Impact (Spring)
Annual Performance Goals and Targets from EOY document Justification- Quantifiable Evidence of "On-Track" Assessment at mid-year (Spring)
Evidence of Impact (Fall)Interventions/Strategies
Annual Performance Goals, 2016-2017
Texas Title I Priority Schools (TTIPS) Grant/Project MonitoringCritical Success Factor 1: Improve Academic Performance
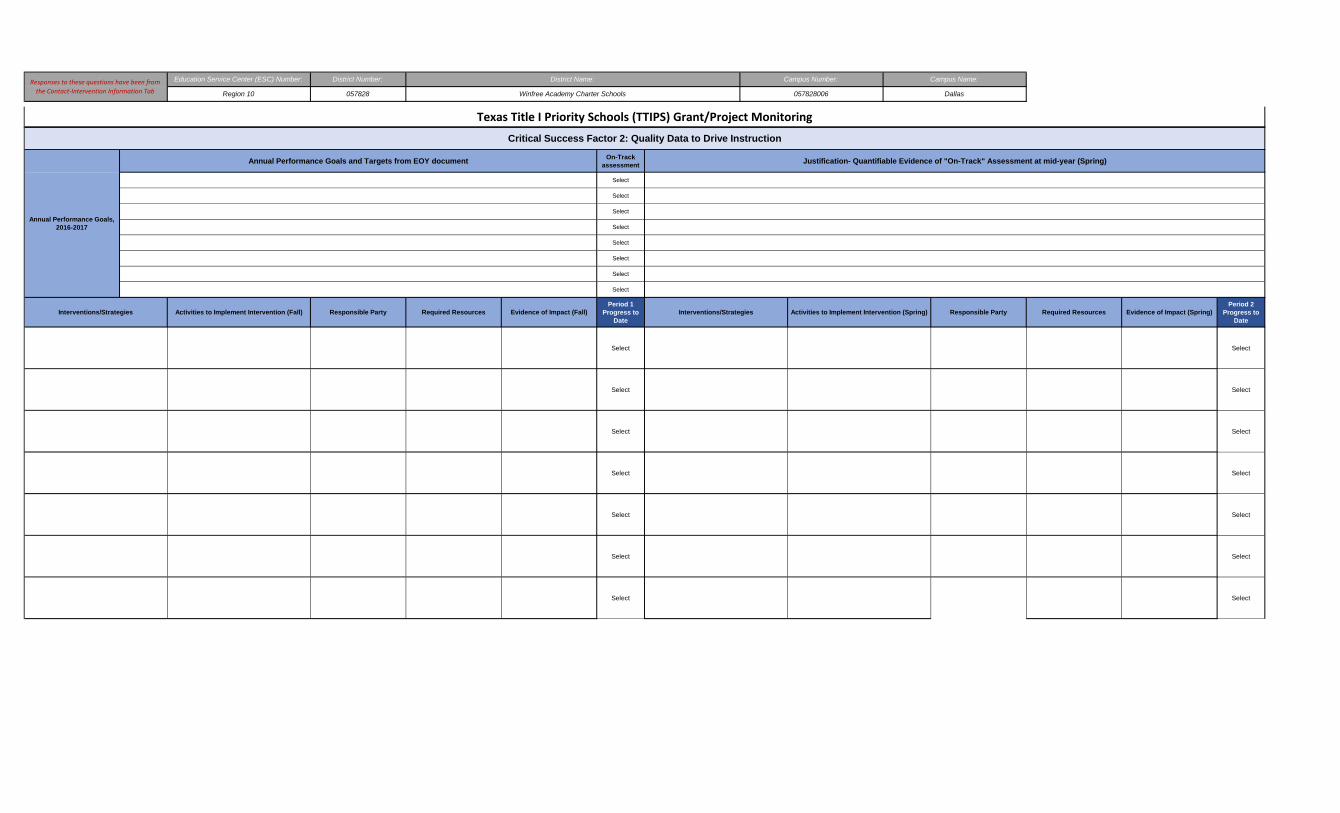
Responses to these questions have been from the Contact‐Intervention Information Tab
Education Service Center (ESC) Number: District Number: District Name: Campus Number: Campus Name:
Region 10 057828 Winfree Academy Charter Schools 057828006 Dallas
Texas Title I Priority Schools (TTIPS) Grant/Project Monitoring
On-Track assessment
Select
Select
Select
Select
Select
Select
Select
Select
Period 1 Progress to
Date
Period 2 Progress to
Date
Select Select
Select Select
Select Select
Select Select
Select Select
Select Select
Select Select
Required Resources Evidence of Impact (Fall) Interventions/Strategies Activities to Implement Intervention (Spring) Responsible Party Required Resources
Critical Success Factor 2: Quality Data to Drive Instruction
Annual Performance Goals, 2016-2017
Annual Performance Goals and Targets from EOY document Justification- Quantifiable Evidence of "On-Track" Assessment at mid-year (Spring)
Evidence of Impact (Spring)Interventions/Strategies Activities to Implement Intervention (Fall) Responsible Party
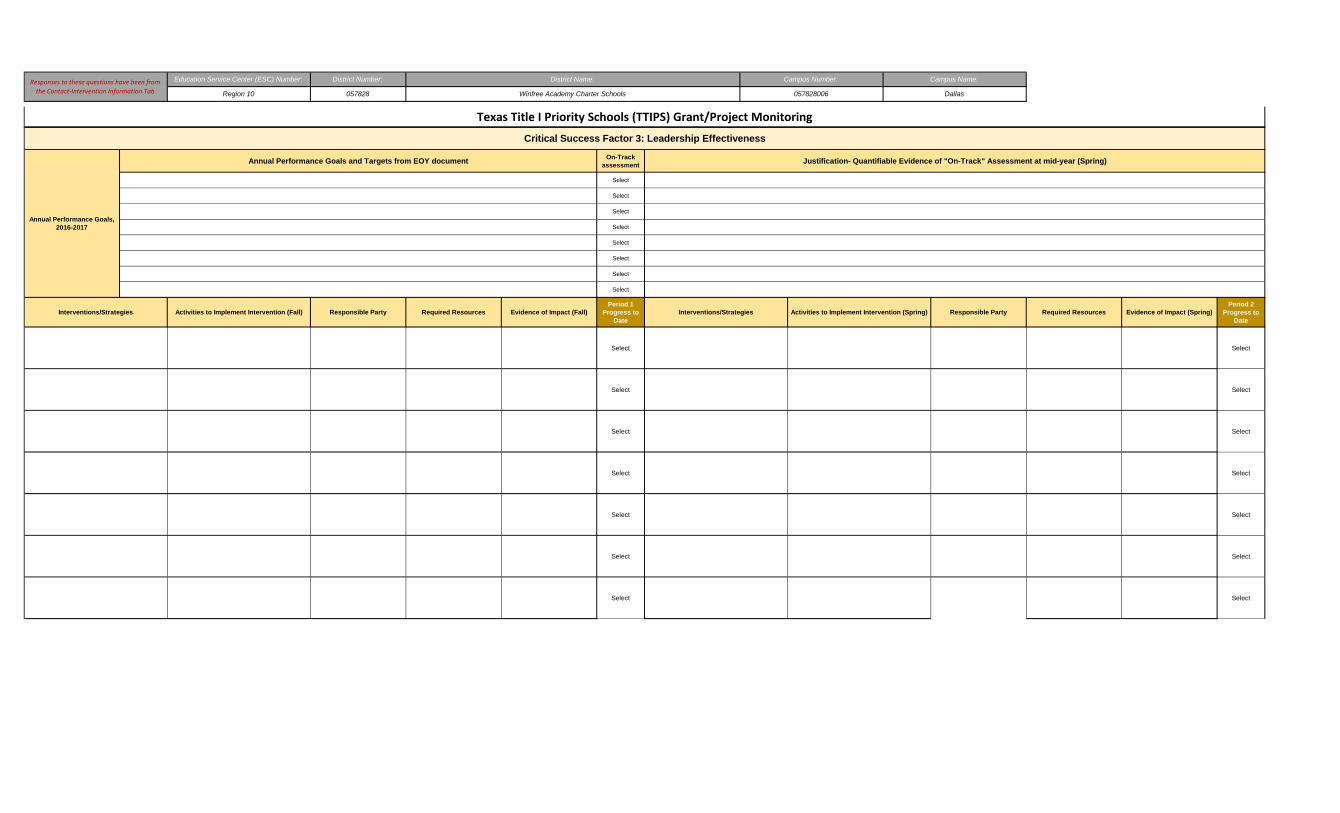
Responses to these questions have been from the Contact‐Intervention Information Tab
Education Service Center (ESC) Number: District Number: District Name: Campus Number: Campus Name:
Region 10 057828 Winfree Academy Charter Schools 057828006 Dallas
Texas Title I Priority Schools (TTIPS) Grant/Project Monitoring
On-Track assessment
Select
Select
Select
Select
Select
Select
Select
Select
Period 1 Progress to
Date
Period 2 Progress to
Date
Select Select
Select Select
Select Select
Select Select
Select Select
Select Select
Select Select
Critical Success Factor 3: Leadership Effectiveness
Annual Performance Goals, 2016-2017
Annual Performance Goals and Targets from EOY document Justification- Quantifiable Evidence of "On-Track" Assessment at mid-year (Spring)
Evidence of Impact (Spring)Interventions/Strategies Activities to Implement Intervention (Fall) Responsible Party Required Resources Evidence of Impact (Fall) Interventions/Strategies Activities to Implement Intervention (Spring) Responsible Party Required Resources
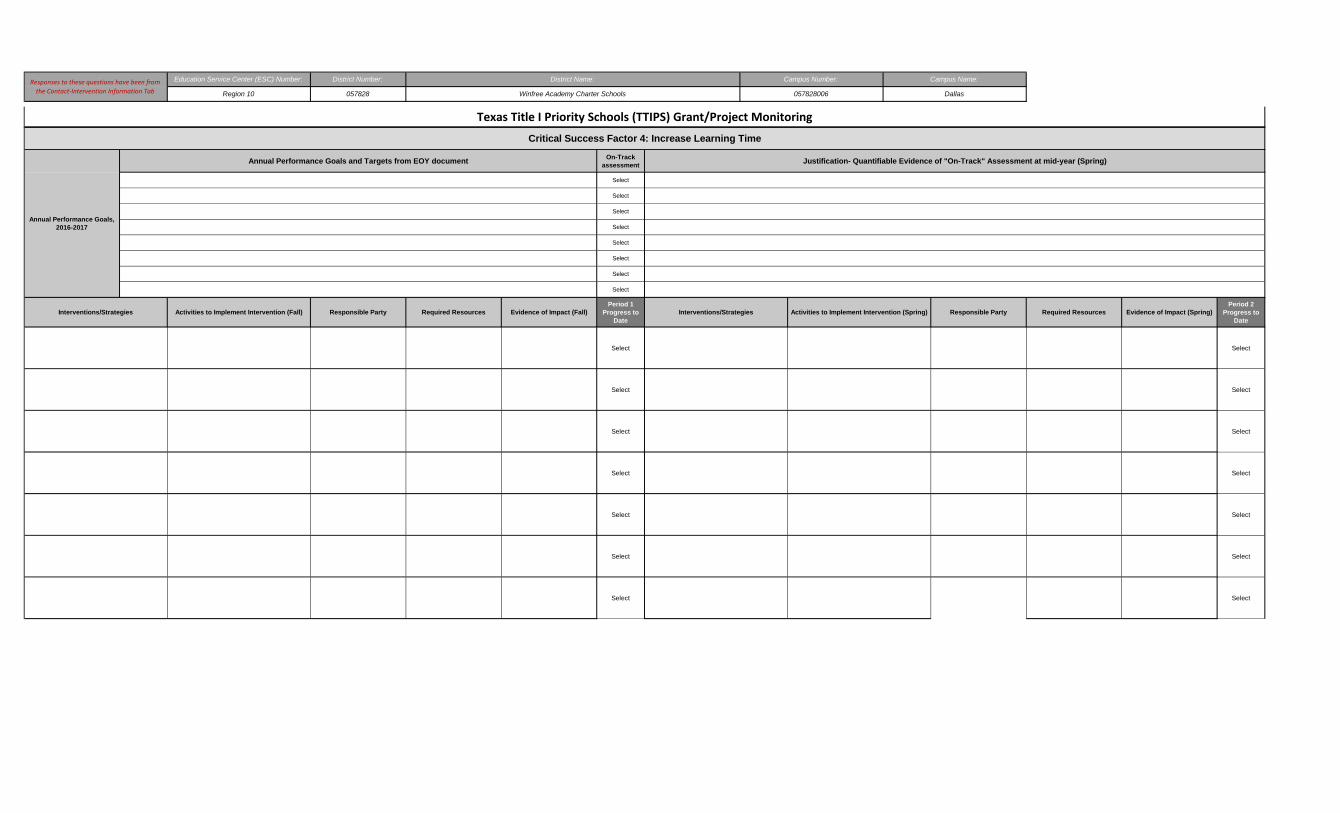
Responses to these questions have been from the Contact‐Intervention Information Tab
Education Service Center (ESC) Number: District Number: District Name: Campus Number: Campus Name:
Region 10 057828 Winfree Academy Charter Schools 057828006 Dallas
Texas Title I Priority Schools (TTIPS) Grant/Project Monitoring
On-Track assessment
Select
Select
Select
Select
Select
Select
Select
Select
Period 1 Progress to
Date
Period 2 Progress to
Date
Select Select
Select Select
Select Select
Select Select
Select Select
Select Select
Select Select
Critical Success Factor 4: Increase Learning Time
Annual Performance Goals, 2016-2017
Annual Performance Goals and Targets from EOY document Justification- Quantifiable Evidence of "On-Track" Assessment at mid-year (Spring)
Evidence of Impact (Spring)Interventions/Strategies Activities to Implement Intervention (Fall) Responsible Party Required Resources Evidence of Impact (Fall) Interventions/Strategies Activities to Implement Intervention (Spring) Responsible Party Required Resources
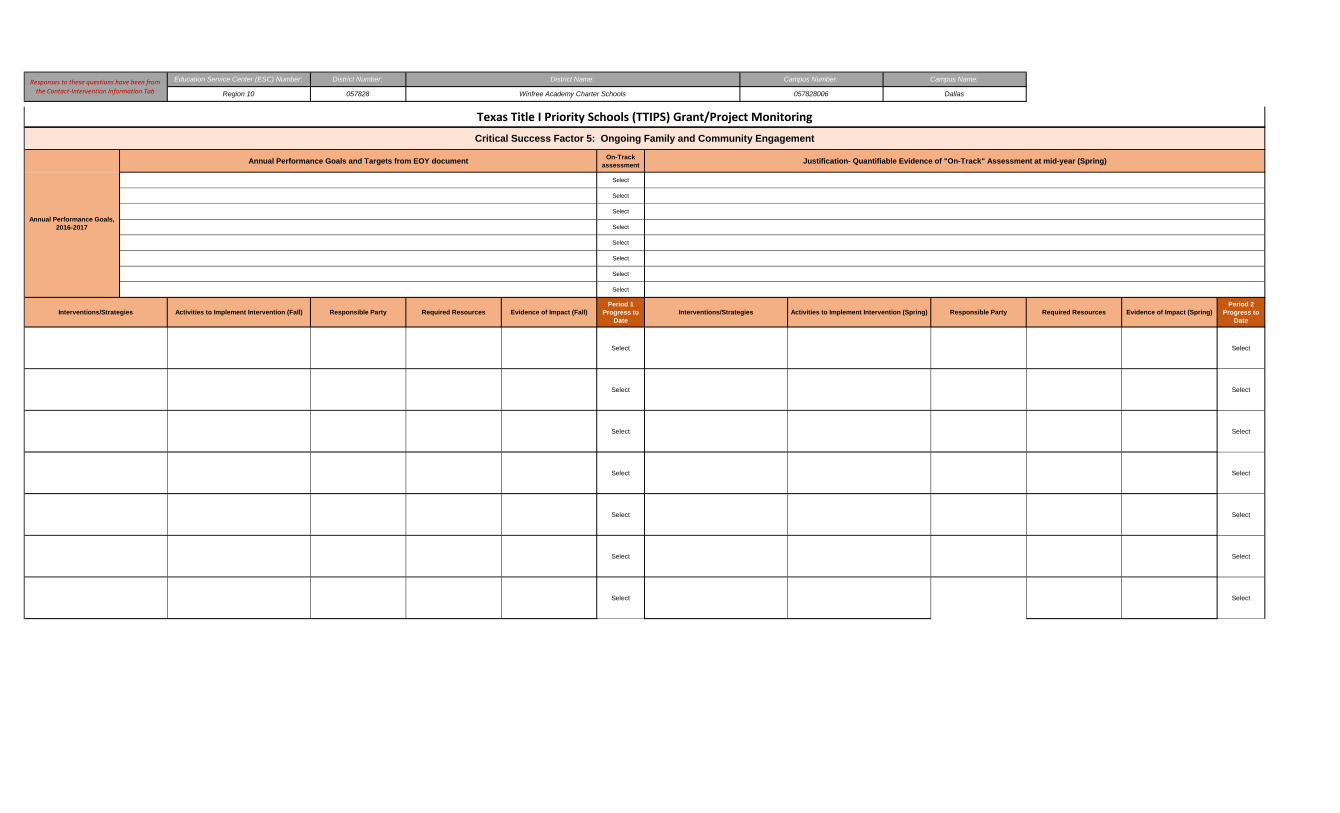
Responses to these questions have been from the Contact‐Intervention Information Tab
Education Service Center (ESC) Number: District Number: District Name: Campus Number: Campus Name:
Region 10 057828 Winfree Academy Charter Schools 057828006 Dallas
Texas Title I Priority Schools (TTIPS) Grant/Project Monitoring
On-Track assessment
Select
Select
Select
Select
Select
Select
Select
Select
Period 1 Progress to
Date
Period 2 Progress to
Date
Select Select
Select Select
Select Select
Select Select
Select Select
Select Select
Select Select
Critical Success Factor 5: Ongoing Family and Community Engagement
Annual Performance Goals, 2016-2017
Annual Performance Goals and Targets from EOY document Justification- Quantifiable Evidence of "On-Track" Assessment at mid-year (Spring)
Evidence of Impact (Spring)Interventions/Strategies Activities to Implement Intervention (Fall) Responsible Party Required Resources Evidence of Impact (Fall) Interventions/Strategies Activities to Implement Intervention (Spring) Responsible Party Required Resources
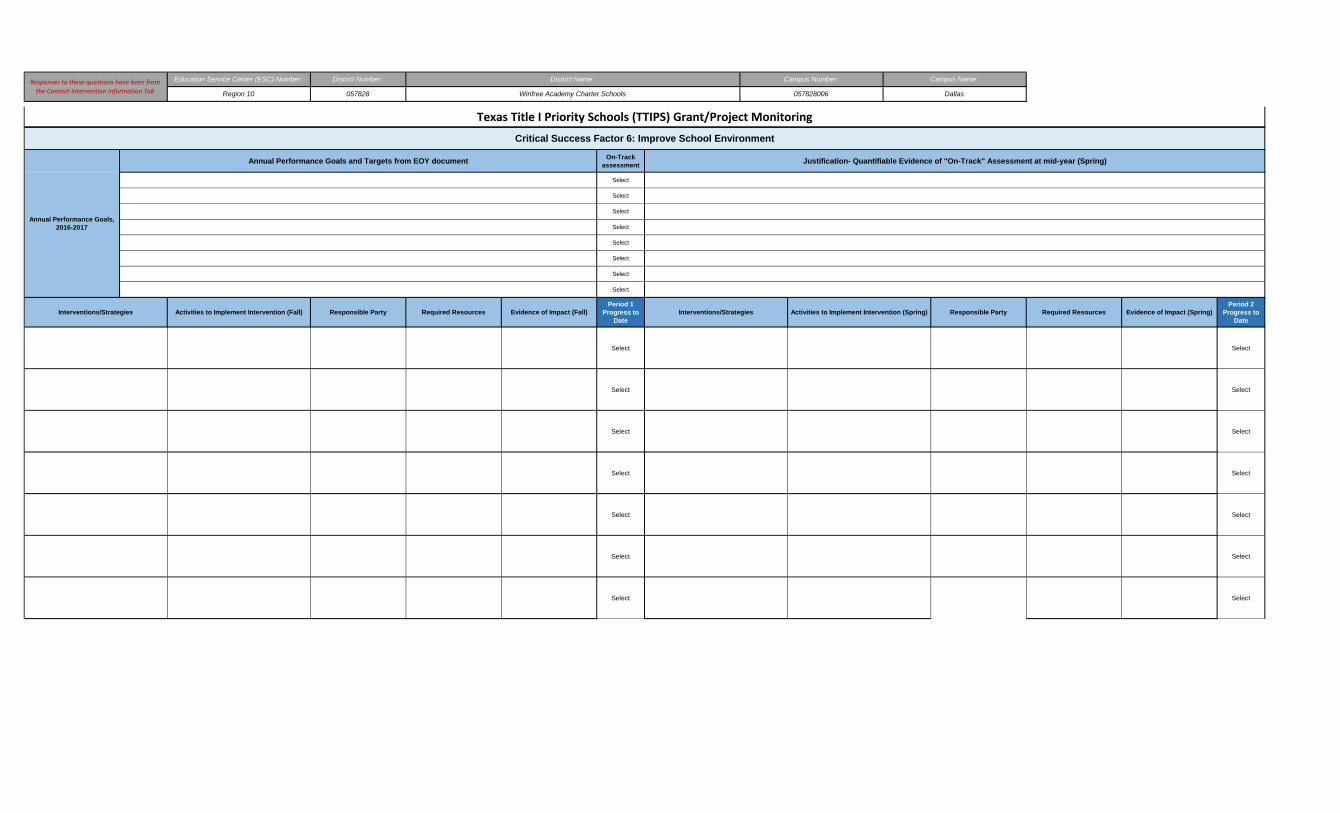
Responses to these questions have been from the Contact‐Intervention Information Tab
Education Service Center (ESC) Number: District Number: District Name: Campus Number: Campus Name:
Region 10 057828 Winfree Academy Charter Schools 057828006 Dallas
Texas Title I Priority Schools (TTIPS) Grant/Project Monitoring
On-Track assessment
Select
Select
Select
Select
Select
Select
Select
Select
Period 1 Progress to
Date
Period 2 Progress to
Date
Select Select
Select Select
Select Select
Select Select
Select Select
Select Select
Select Select
Critical Success Factor 6: Improve School Environment
Annual Performance Goals, 2016-2017
Annual Performance Goals and Targets from EOY document Justification- Quantifiable Evidence of "On-Track" Assessment at mid-year (Spring)
Evidence of Impact (Spring)Interventions/Strategies Activities to Implement Intervention (Fall) Responsible Party Required Resources Evidence of Impact (Fall) Interventions/Strategies Activities to Implement Intervention (Spring) Responsible Party Required Resources
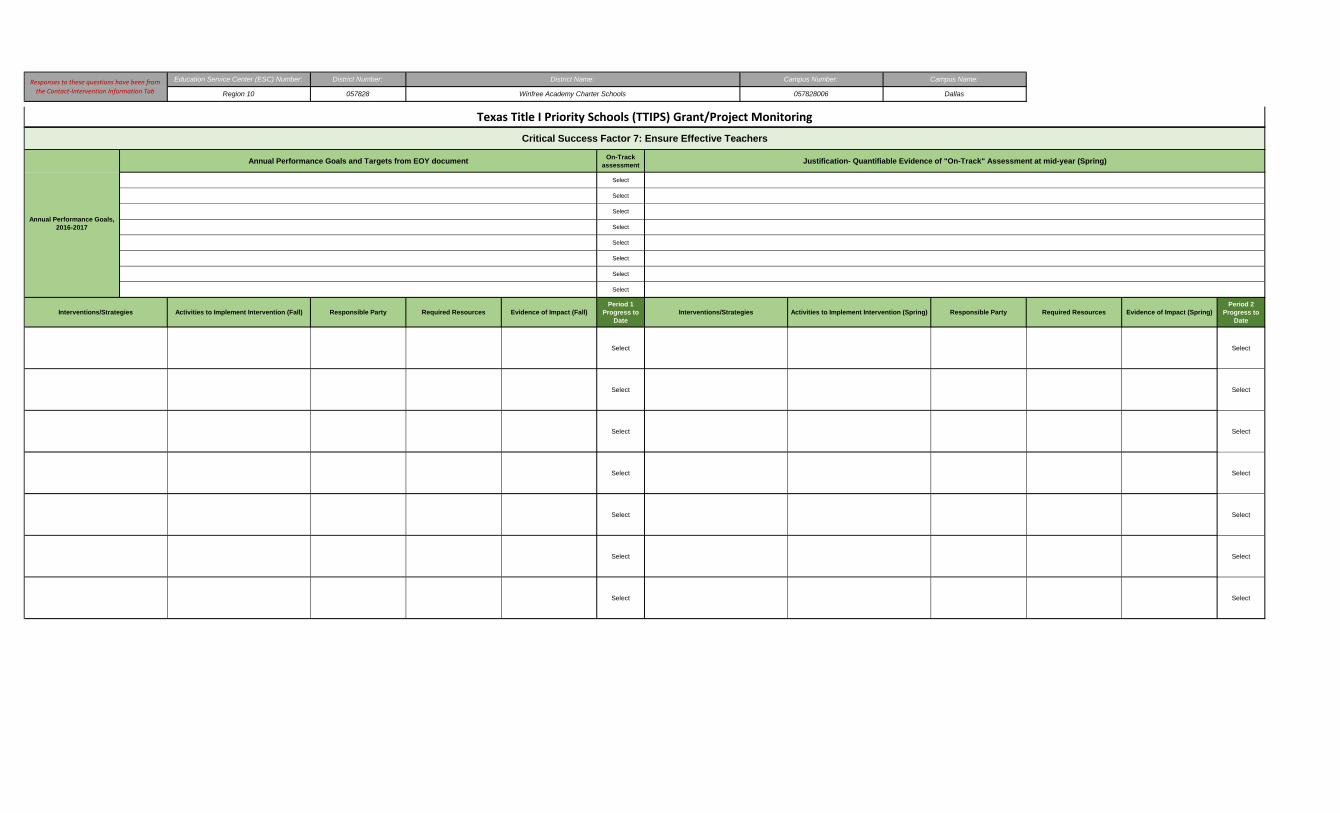
Responses to these questions have been from the Contact‐Intervention Information Tab
Education Service Center (ESC) Number: District Number: District Name: Campus Number: Campus Name:
Region 10 057828 Winfree Academy Charter Schools 057828006 Dallas
Texas Title I Priority Schools (TTIPS) Grant/Project Monitoring
On-Track assessment
Select
Select
Select
Select
Select
Select
Select
Select
Period 1 Progress to
Date
Period 2 Progress to
Date
Select Select
Select Select
Select Select
Select Select
Select Select
Select Select
Select Select
Critical Success Factor 7: Ensure Effective Teachers
Annual Performance Goals, 2016-2017
Annual Performance Goals and Targets from EOY document Justification- Quantifiable Evidence of "On-Track" Assessment at mid-year (Spring)
Evidence of Impact (Spring)Interventions/Strategies Activities to Implement Intervention (Fall) Responsible Party Required Resources Evidence of Impact (Fall) Interventions/Strategies Activities to Implement Intervention (Spring) Responsible Party Required Resources
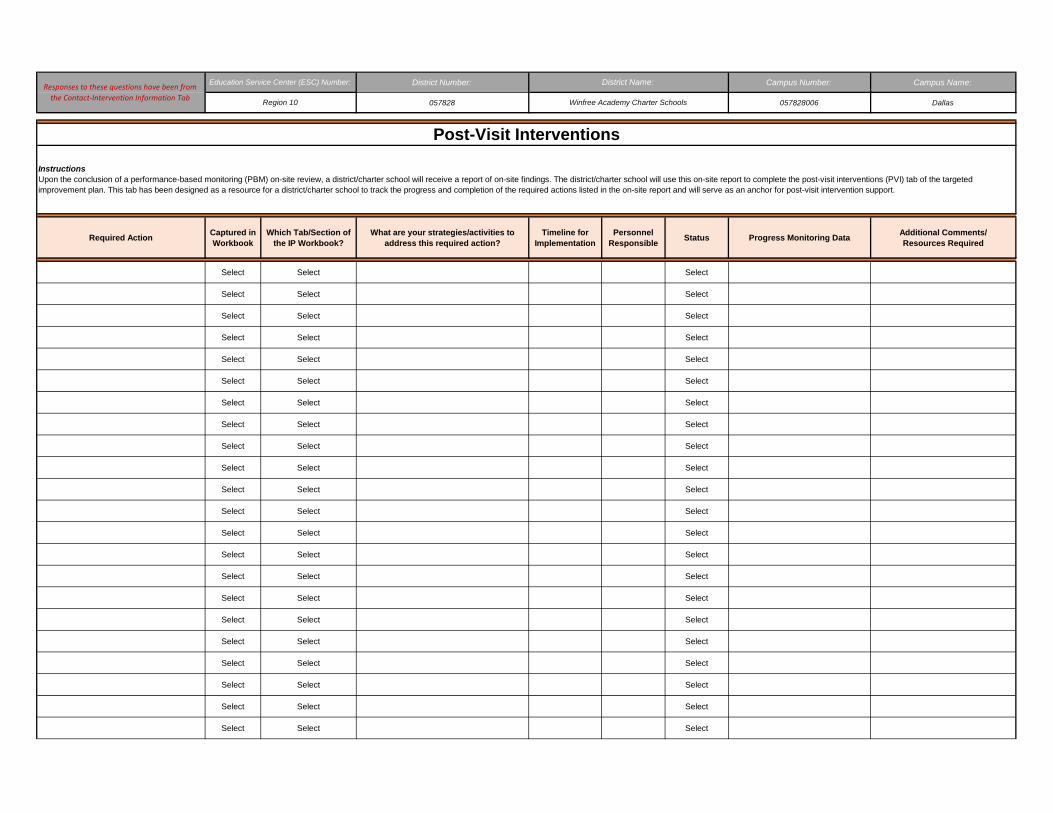
District Number: Campus Number: Campus Name:
057828 057828006 Dallas
Required ActionCaptured in Workbook
Which Tab/Section of the IP Workbook?
What are your strategies/activities to address this required action?
Timeline for Implementation
Personnel Responsible
Status Progress Monitoring DataAdditional Comments/Resources Required
Select Select Select
Select Select Select
Select Select Select
Select Select Select
Select Select Select
Select Select Select
Select Select Select
Select Select Select
Select Select Select
Select Select Select
Select Select Select
Select Select Select
Select Select Select
Select Select Select
Select Select Select
Select Select Select
Select Select Select
Select Select Select
Select Select Select
Select Select Select
Select Select Select
Select Select Select
Post-Visit Interventions
InstructionsUpon the conclusion of a performance-based monitoring (PBM) on-site review, a district/charter school will receive a report of on-site findings. The district/charter school will use this on-site report to complete the post-visit interventions (PVI) tab of the targeted improvement plan. This tab has been designed as a resource for a district/charter school to track the progress and completion of the required actions listed in the on-site report and will serve as an anchor for post-visit intervention support.
Responses to these questions have been from the Contact‐Intervention Information Tab
Education Service Center (ESC) Number: District Name:
Region 10 Winfree Academy Charter Schools
Select Select Select
Select Select Select
Select Select Select
Select Select Select
Select Select Select
Select Select Select
Select Select Select
Select Select Select
Select Select Select
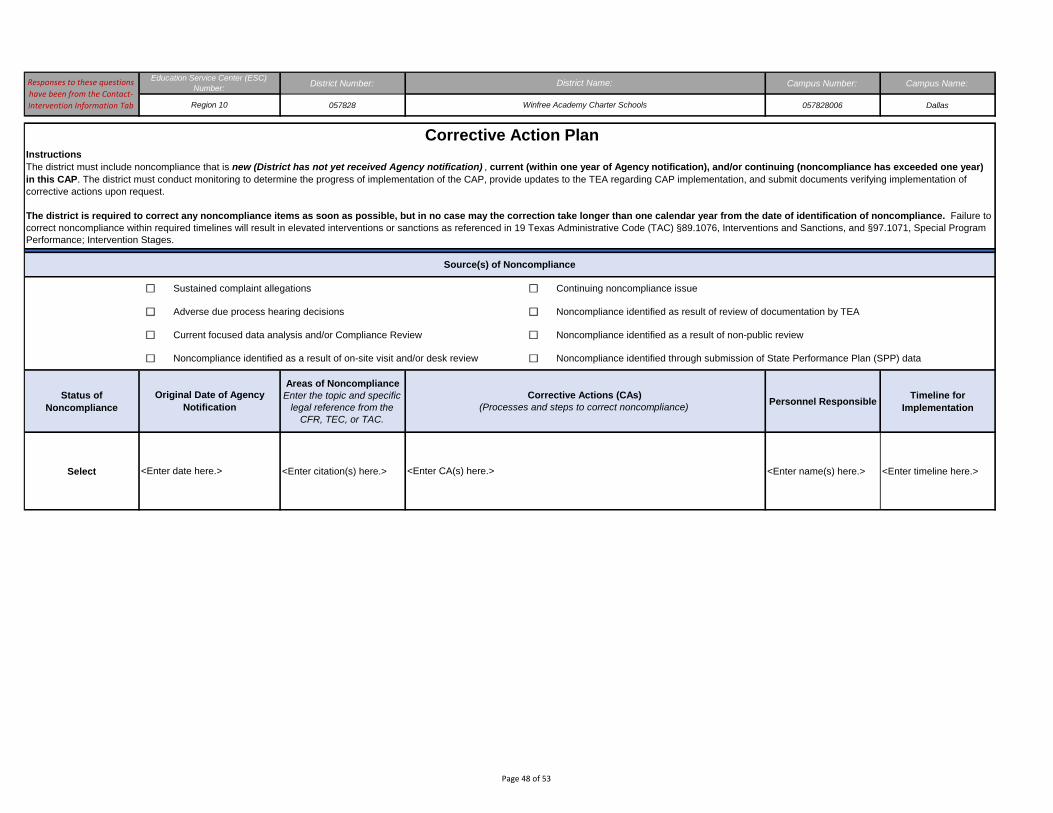
District Number: Campus Number: Campus Name:
057828 057828006 Dallas
Status of Noncompliance
Areas of NoncomplianceEnter the topic and specific
legal reference from the CFR, TEC, or TAC.
Personnel ResponsibleTimeline for
Implementation
Select <Enter citation(s) here.> <Enter name(s) here.> <Enter timeline here.>
Corrective Action Plan
Source(s) of Noncompliance
Noncompliance identified as a result of on-site visit and/or desk review
Current focused data analysis and/or Compliance Review
Adverse due process hearing decisions
Sustained complaint allegations
Noncompliance identified as a result of non-public review
<Enter date here.>
Responses to these questions have been from the Contact‐Intervention Information Tab
Education Service Center (ESC) Number: District Name:
Region 10 Winfree Academy Charter Schools
Noncompliance identified as result of review of documentation by TEA
Continuing noncompliance issue
Noncompliance identified through submission of State Performance Plan (SPP) data
InstructionsThe district must include noncompliance that is new (District has not yet received Agency notification) , current (within one year of Agency notification), and/or continuing (noncompliance has exceeded one year) in this CAP. The district must conduct monitoring to determine the progress of implementation of the CAP, provide updates to the TEA regarding CAP implementation, and submit documents verifying implementation of corrective actions upon request.
The district is required to correct any noncompliance items as soon as possible, but in no case may the correction take longer than one calendar year from the date of identification of noncompliance. Failure to correct noncompliance within required timelines will result in elevated interventions or sanctions as referenced in 19 Texas Administrative Code (TAC) §89.1076, Interventions and Sanctions, and §97.1071, Special Program Performance; Intervention Stages.
Original Date of Agency Notification
Corrective Actions (CAs)(Processes and steps to correct noncompliance)
<Enter CA(s) here.>
Page 48 of 53
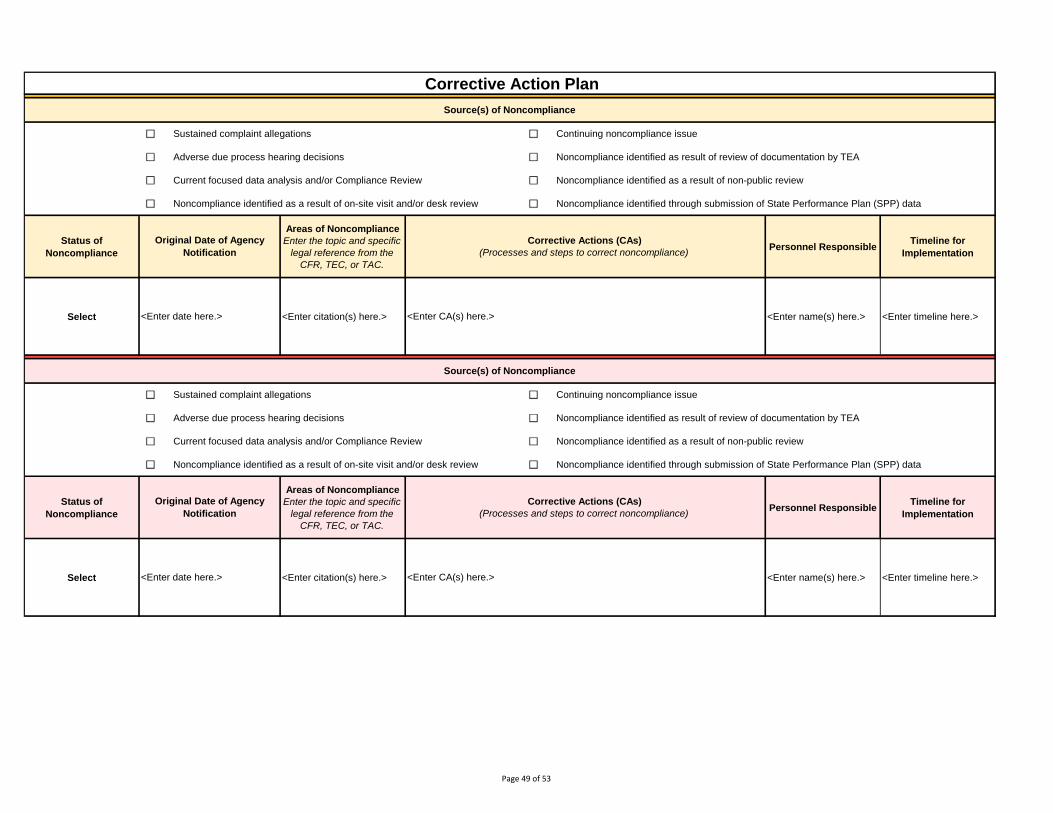
Corrective Action Plan
Status of Noncompliance
Areas of NoncomplianceEnter the topic and specific
legal reference from the CFR, TEC, or TAC.
Personnel ResponsibleTimeline for
Implementation
Select <Enter citation(s) here.> <Enter name(s) here.> <Enter timeline here.>
Status of Noncompliance
Areas of NoncomplianceEnter the topic and specific
legal reference from the CFR, TEC, or TAC.
Personnel ResponsibleTimeline for
Implementation
Select <Enter citation(s) here.> <Enter name(s) here.> <Enter timeline here.>
Original Date of Agency Notification
Corrective Actions (CAs)(Processes and steps to correct noncompliance)
<Enter date here.> <Enter CA(s) here.>
Source(s) of Noncompliance
Source(s) of Noncompliance
Current focused data analysis and/or Compliance Review Noncompliance identified as a result of non-public review
Noncompliance identified as a result of on-site visit and/or desk review Noncompliance identified through submission of State Performance Plan (SPP) data
Sustained complaint allegations Continuing noncompliance issue
Adverse due process hearing decisions Noncompliance identified as result of review of documentation by TEA
Sustained complaint allegations Continuing noncompliance issue
Adverse due process hearing decisions Noncompliance identified as result of review of documentation by TEA
Current focused data analysis and/or Compliance Review Noncompliance identified as a result of non-public review
Noncompliance identified as a result of on-site visit and/or desk review Noncompliance identified through submission of State Performance Plan (SPP) data
Original Date of Agency Notification
Corrective Actions (CAs)(Processes and steps to correct noncompliance)
<Enter date here.> <Enter CA(s) here.>
Page 49 of 53
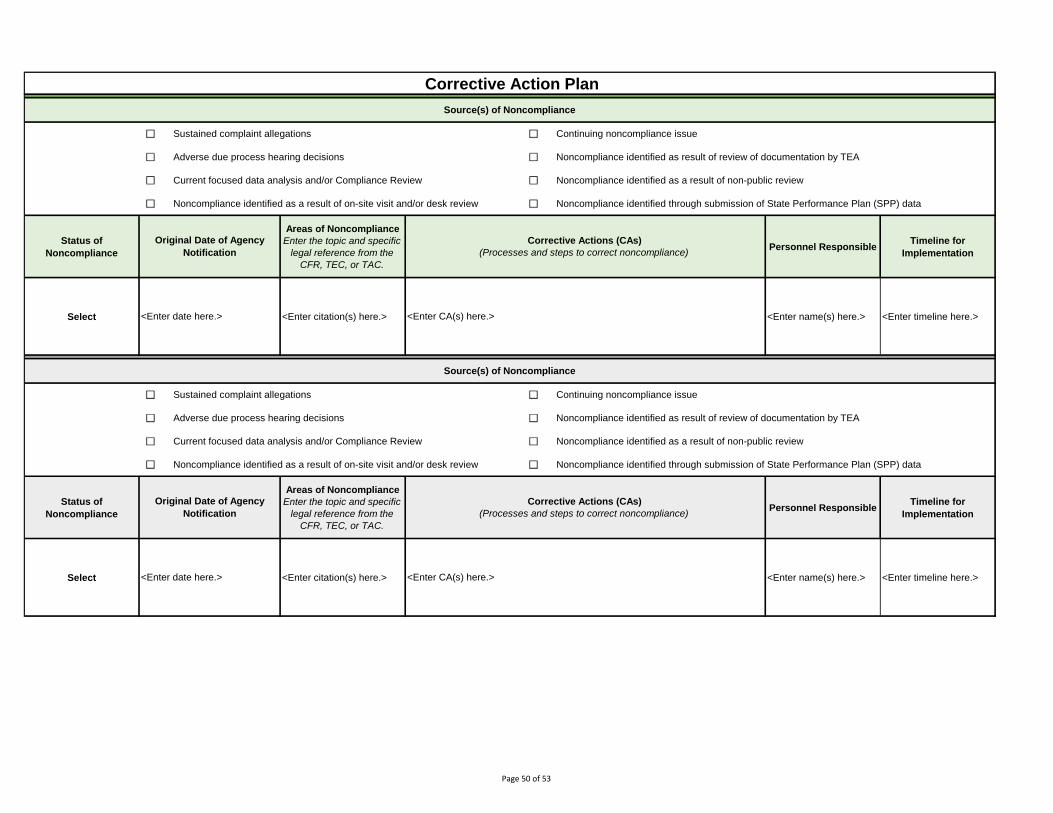
Corrective Action Plan
Status of Noncompliance
Areas of NoncomplianceEnter the topic and specific
legal reference from the CFR, TEC, or TAC.
Personnel ResponsibleTimeline for
Implementation
Select <Enter citation(s) here.> <Enter name(s) here.> <Enter timeline here.>
Status of Noncompliance
Areas of NoncomplianceEnter the topic and specific
legal reference from the CFR, TEC, or TAC.
Personnel ResponsibleTimeline for
Implementation
Select <Enter citation(s) here.> <Enter name(s) here.> <Enter timeline here.>
Source(s) of Noncompliance
Sustained complaint allegations Continuing noncompliance issue
Adverse due process hearing decisions Noncompliance identified as result of review of documentation by TEA
Current focused data analysis and/or Compliance Review Noncompliance identified as a result of non-public review
Sustained complaint allegations Continuing noncompliance issue
Adverse due process hearing decisions Noncompliance identified as result of review of documentation by TEA
Current focused data analysis and/or Compliance Review Noncompliance identified as a result of non-public review
Original Date of Agency Notification
Corrective Actions (CAs)(Processes and steps to correct noncompliance)
<Enter date here.> <Enter CA(s) here.>
Noncompliance identified as a result of on-site visit and/or desk review Noncompliance identified through submission of State Performance Plan (SPP) data
Source(s) of Noncompliance
Noncompliance identified as a result of on-site visit and/or desk review Noncompliance identified through submission of State Performance Plan (SPP) data
Original Date of Agency Notification
Corrective Actions (CAs)(Processes and steps to correct noncompliance)
<Enter date here.> <Enter CA(s) here.>
Page 50 of 53
Corrective Action Plan
Status of Noncompliance
Areas of NoncomplianceEnter the topic and specific
legal reference from the CFR, TEC, or TAC.
Personnel ResponsibleTimeline for
Implementation
Select <Enter citation(s) here.> <Enter name(s) here.> <Enter timeline here.>
Status of Noncompliance
Areas of NoncomplianceEnter the topic and specific
legal reference from the CFR, TEC, or TAC.
Personnel ResponsibleTimeline for
Implementation
Select <Enter citation(s) here.> <Enter name(s) here.> <Enter timeline here.>
Adverse due process hearing decisions Noncompliance identified as result of review of documentation by TEA
Current focused data analysis and/or Compliance Review Noncompliance identified as a result of non-public review
Current focused data analysis and/or Compliance Review Noncompliance identified as a result of non-public review
Noncompliance identified as a result of on-site visit and/or desk review Noncompliance identified through submission of State Performance Plan (SPP) data
Original Date of Agency Notification
Corrective Actions (CAs)(Processes and steps to correct noncompliance)
<Enter date here.> <Enter CA(s) here.>
Source(s) of Noncompliance
Sustained complaint allegations Continuing noncompliance issue
Adverse due process hearing decisions Noncompliance identified as result of review of documentation by TEA
Source(s) of Noncompliance
Sustained complaint allegations Continuing noncompliance issue
Noncompliance identified as a result of on-site visit and/or desk review Noncompliance identified through submission of State Performance Plan (SPP) data
Original Date of Agency Notification
Corrective Actions (CAs)(Processes and steps to correct noncompliance)
<Enter date here.> <Enter CA(s) here.>
Page 51 of 53

Corrective Action Plan
Status of Noncompliance
Areas of NoncomplianceEnter the topic and specific
legal reference from the CFR, TEC, or TAC.
Personnel ResponsibleTimeline for
Implementation
Select <Enter citation(s) here.> <Enter name(s) here.> <Enter timeline here.>
Status of Noncompliance
Areas of NoncomplianceEnter the topic and specific
legal reference from the CFR, TEC, or TAC.
Personnel ResponsibleTimeline for
Implementation
Select <Enter citation(s) here.> <Enter name(s) here.> <Enter timeline here.>
Source(s) of Noncompliance
Sustained complaint allegations Continuing noncompliance issue
Adverse due process hearing decisions Noncompliance identified as result of review of documentation by TEA
<Enter date here.> <Enter CA(s) here.>
Source(s) of Noncompliance
Sustained complaint allegations Continuing noncompliance issue
Current focused data analysis and/or Compliance Review Noncompliance identified as a result of non-public review
Noncompliance identified as a result of on-site visit and/or desk review Noncompliance identified through submission of State Performance Plan (SPP) data
Original Date of Agency Notification
Corrective Actions (CAs)(Processes and steps to correct noncompliance)
Original Date of Agency Notification
Corrective Actions (CAs)(Processes and steps to correct noncompliance)
<Enter date here.> <Enter CA(s) here.>
Adverse due process hearing decisions Noncompliance identified as result of review of documentation by TEA
Current focused data analysis and/or Compliance Review Noncompliance identified as a result of non-public review
Noncompliance identified as a result of on-site visit and/or desk review Noncompliance identified through submission of State Performance Plan (SPP) data
Page 52 of 53
Corrective Action Plan
Status of Noncompliance
Areas of NoncomplianceEnter the topic and specific
legal reference from the CFR, TEC, or TAC.
Personnel ResponsibleTimeline for
Implementation
Select <Enter citation(s) here.> <Enter name(s) here.> <Enter timeline here.>
Source(s) of Noncompliance
Noncompliance identified as a result of on-site visit and/or desk review Noncompliance identified through submission of State Performance Plan (SPP) data
Original Date of Agency Notification
Corrective Actions (CAs)(Processes and steps to correct noncompliance)
<Enter date here.> <Enter CA(s) here.>
Sustained complaint allegations Continuing noncompliance issue
Adverse due process hearing decisions Noncompliance identified as result of review of documentation by TEA
Current focused data analysis and/or Compliance Review Noncompliance identified as a result of non-public review
Page 53 of 53