timelapse imagery, crowdsourcing, and repeat photography...
TRANSCRIPT
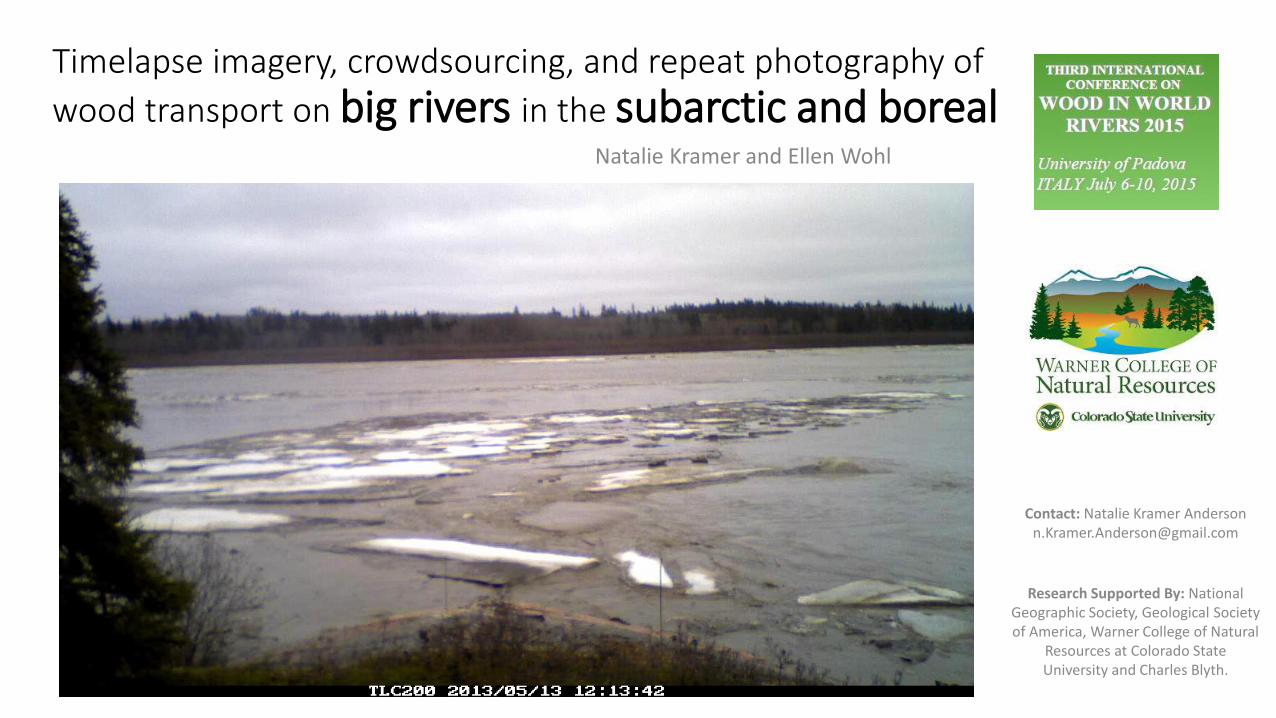
Timelapse imagery, crowdsourcing, and repeat photography of
wood transport on big rivers in the subarctic and borealNatalie Kramer and Ellen Wohl
Contact: Natalie Kramer [email protected]
Research Supported By: National Geographic Society, Geological Society of America, Warner College of Natural
Resources at Colorado State University and Charles Blyth.
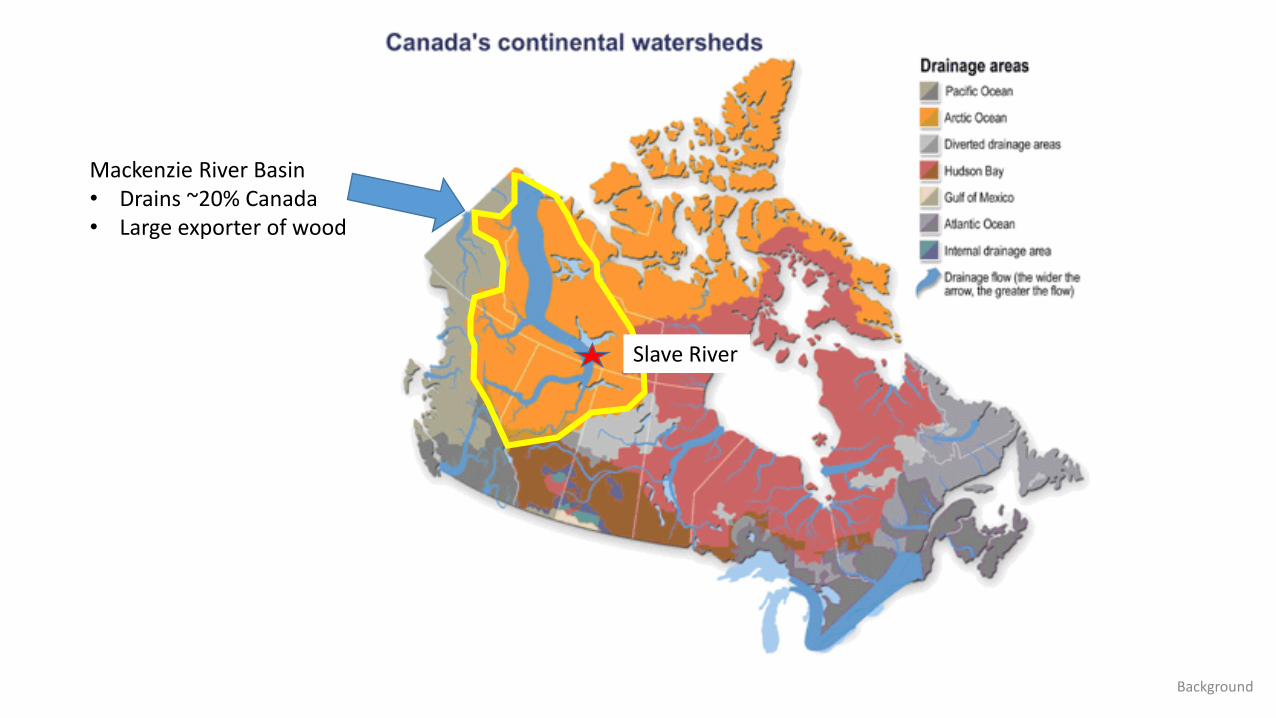
Background
Slave River
Mackenzie River Basin• Drains ~20% Canada• Large exporter of wood
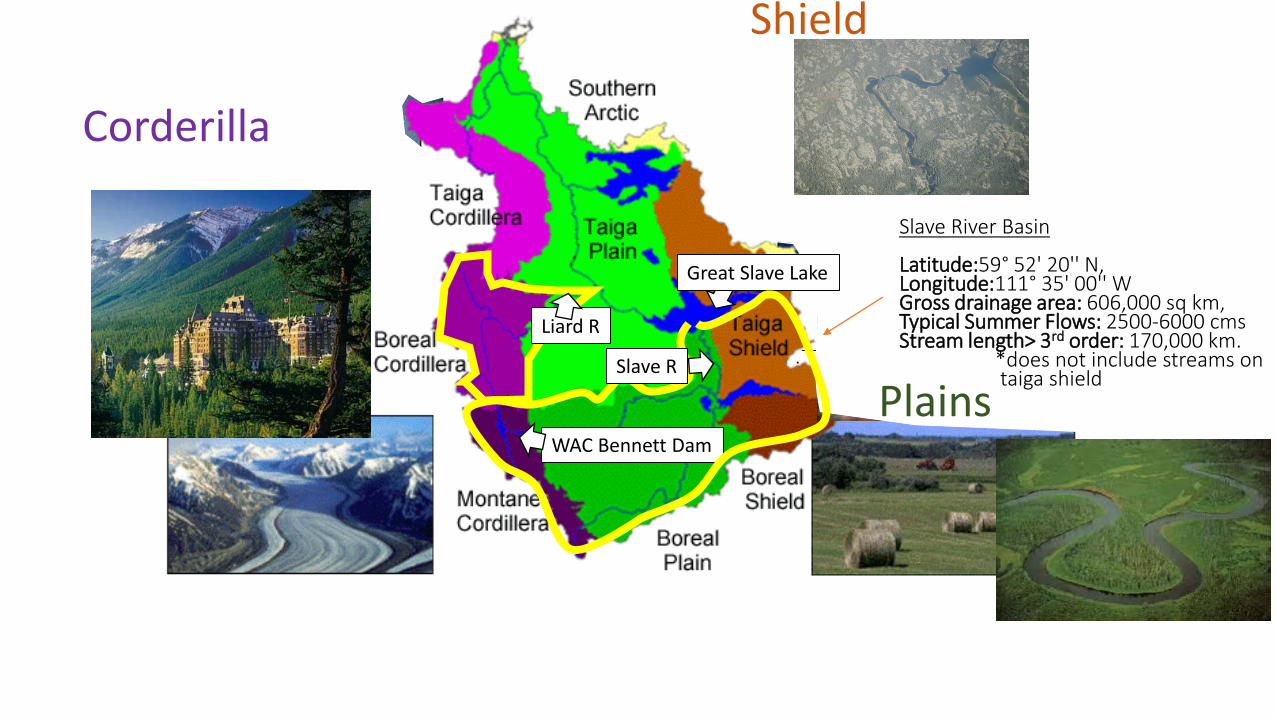
Liard R
Great Slave Lake
Mackenzie R
Slave R
Shield
PlainsWAC Bennett Dam
Great Slave Lake
Slave R
Shield
Plains
Corderilla
Slave River Basin
Latitude:59° 52' 20'' N, Longitude:111° 35' 00'' WGross drainage area: 606,000 sq km, Typical Summer Flows: 2500-6000 cmsStream length> 3rd order: 170,000 km.
*does not include streams on taiga shield
Liard R
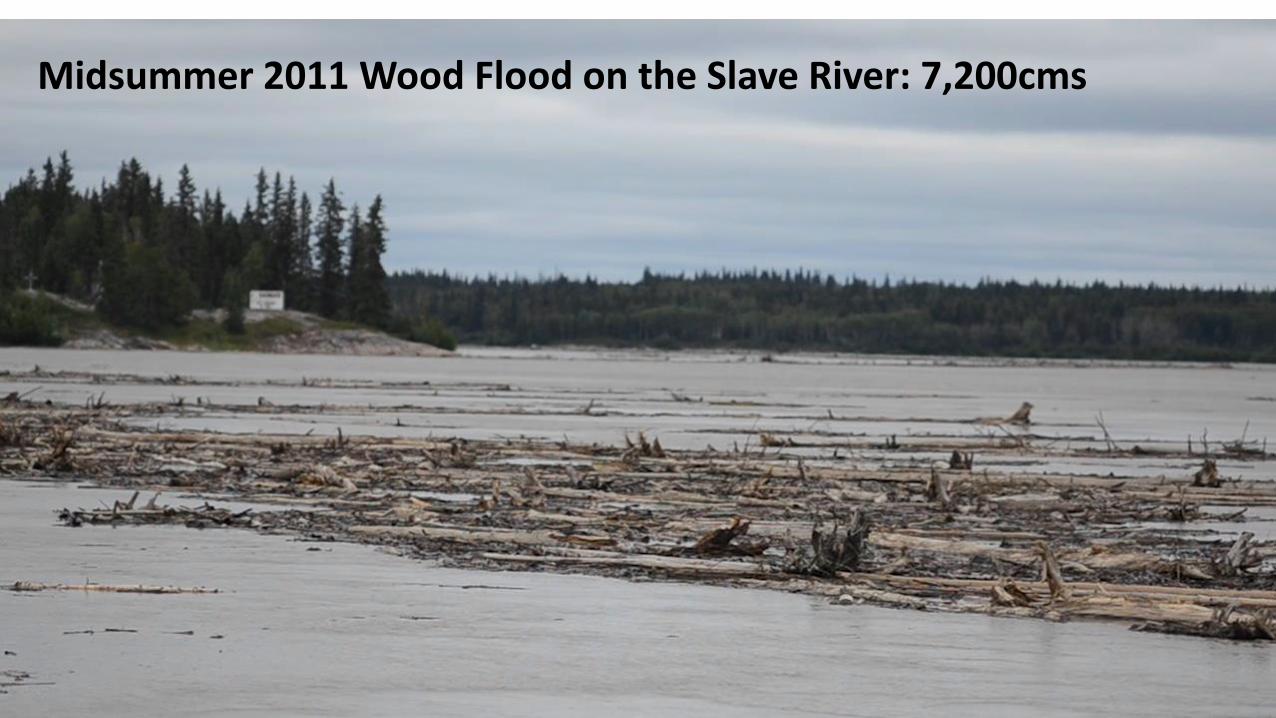
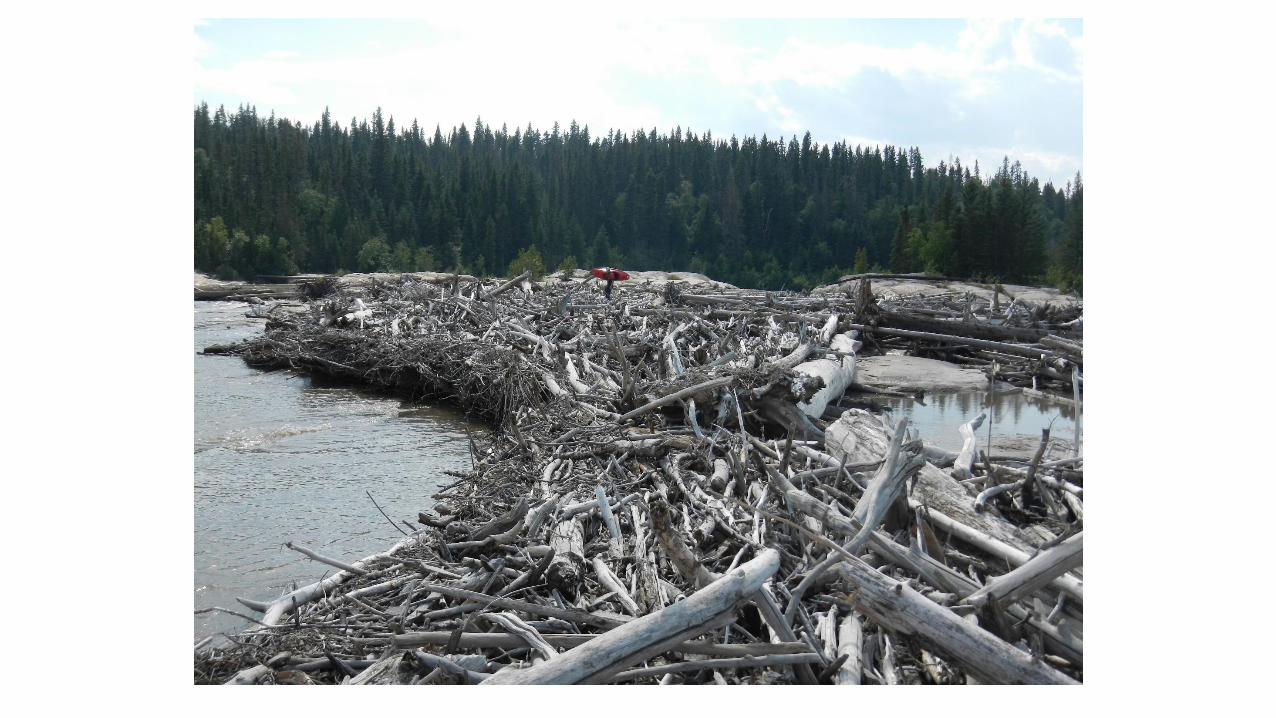
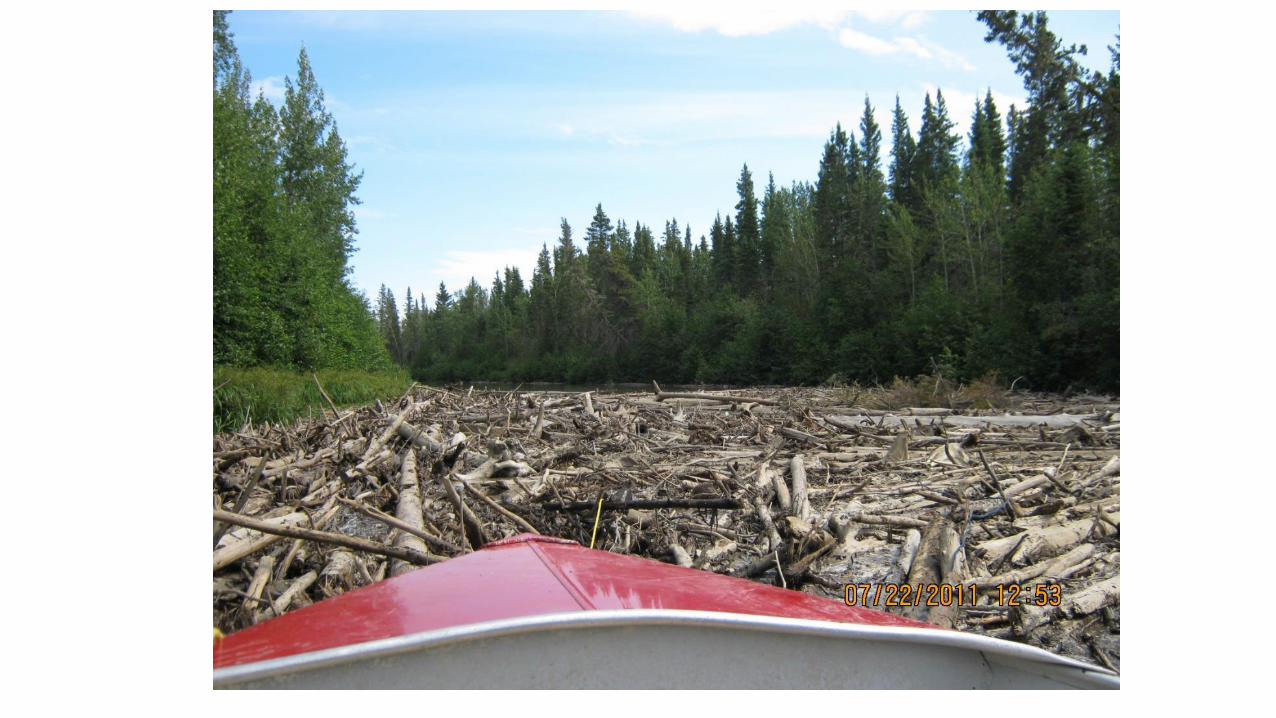
The Slave River Wood Flood VideoMidsummer 2011 Wood Flood on the Slave River: 7,200cms
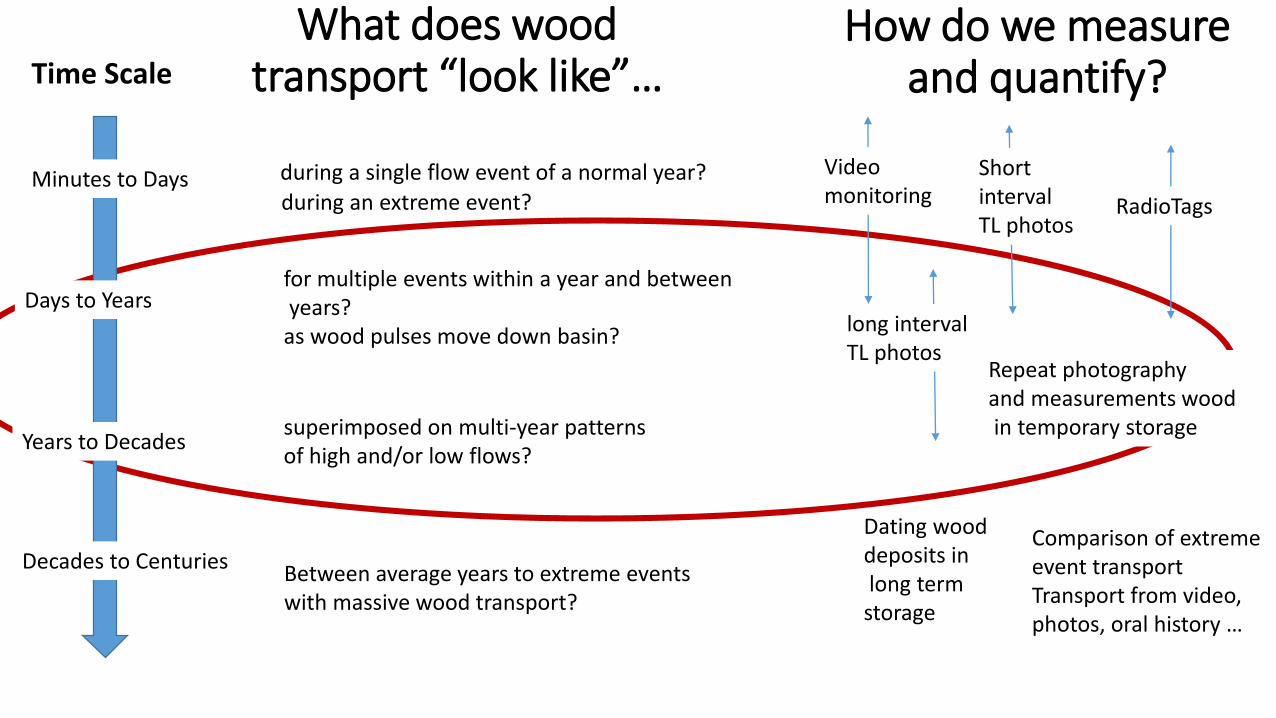
What does wood transport “look like”…Time Scale
Minutes to Days
Days to Years
Years to Decades
Decades to Centuries
during a single flow event of a normal year?
for multiple events within a year and betweenyears?
as wood pulses move down basin?
superimposed on multi-year patterns of high and/or low flows?
during an extreme event?
Between average years to extreme events with massive wood transport?
How do we measure and quantify?
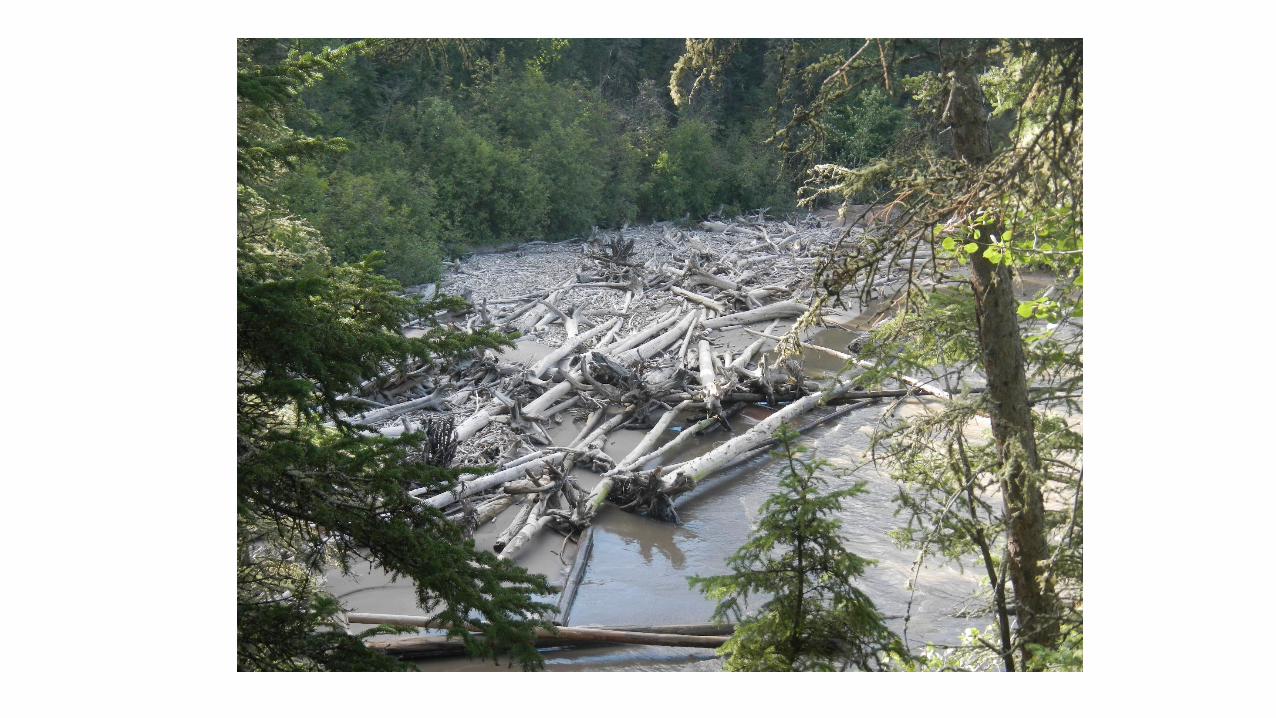
Repeat photography and measurements woodin temporary storage
Comparison of extreme event transportTransport from video, photos, oral history …
Videomonitoring
Short interval TL photos
RadioTags
Dating wood deposits inlong term
storage
long intervalTL photos
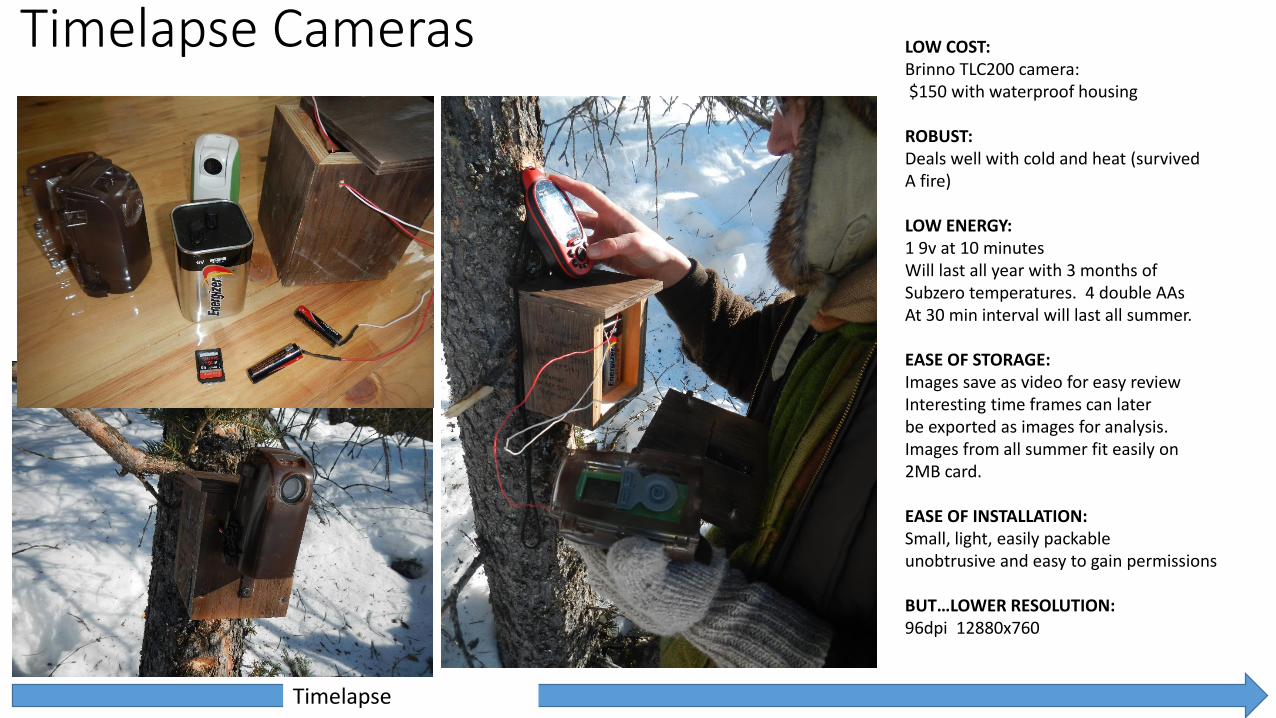
Timelapse Cameras LOW COST:Brinno TLC200 camera:$150 with waterproof housing
ROBUST:Deals well with cold and heat (survivedA fire)
LOW ENERGY: 1 9v at 10 minutes Will last all year with 3 months of Subzero temperatures. 4 double AAs At 30 min interval will last all summer.
EASE OF STORAGE:Images save as video for easy reviewInteresting time frames can laterbe exported as images for analysis. Images from all summer fit easily on 2MB card.
EASE OF INSTALLATION:Small, light, easily packableunobtrusive and easy to gain permissions
BUT…LOWER RESOLUTION:96dpi 12880x760
Timelapse
Timelapse
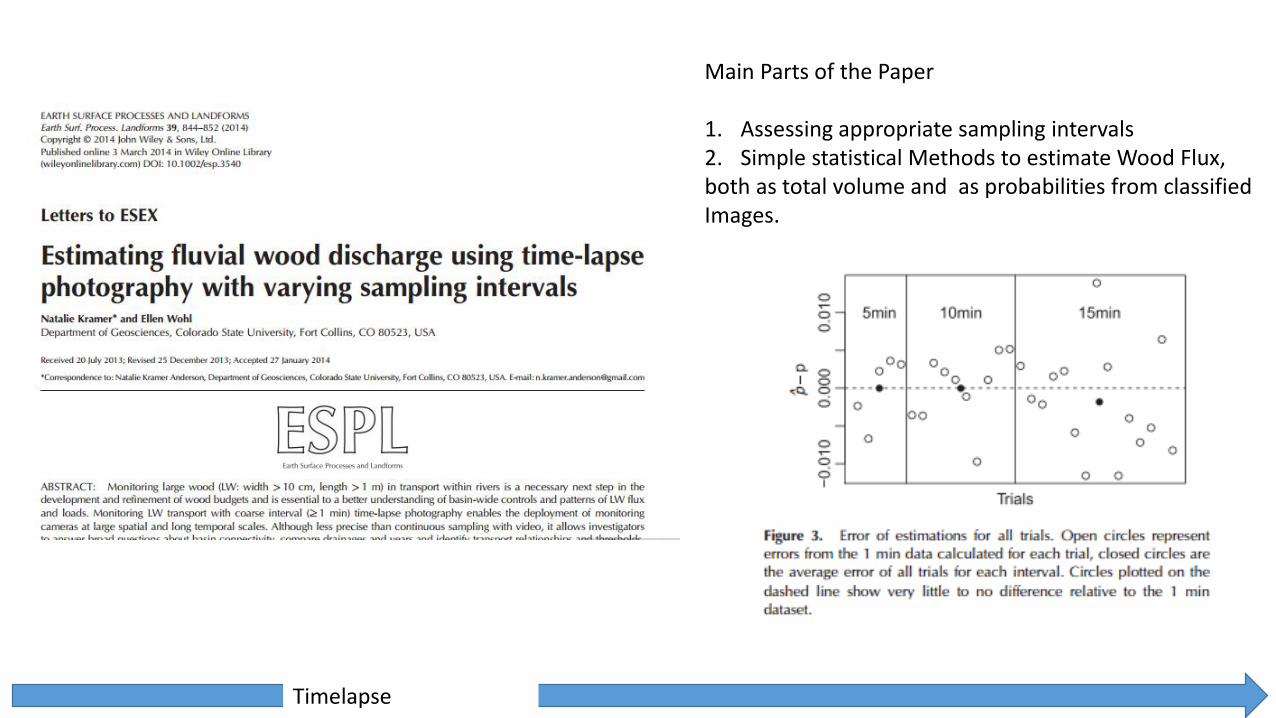
Main Parts of the Paper
1. Assessing appropriate sampling intervals2. Simple statistical Methods to estimate Wood Flux,both as total volume and as probabilities from classifiedImages.
Timelapse
Timelapse
Crowdsourcing
Crowd sourcing
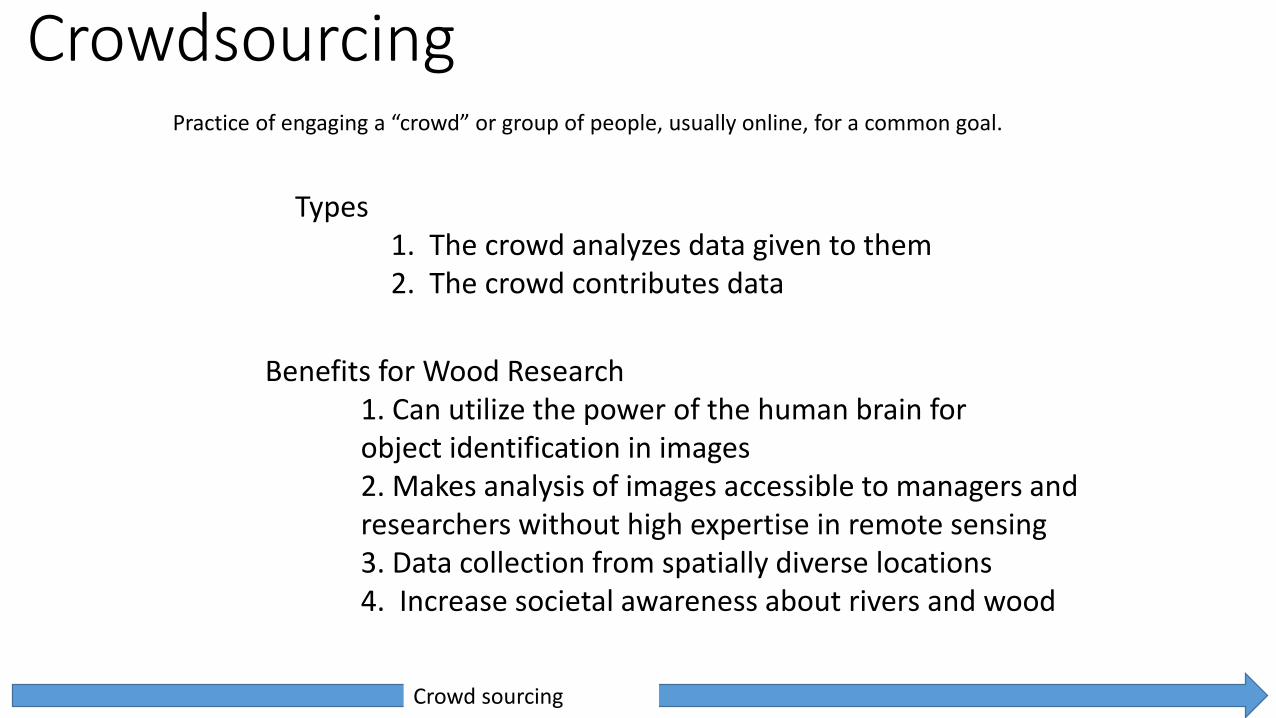
Types1. The crowd analyzes data given to them2. The crowd contributes data
Practice of engaging a “crowd” or group of people, usually online, for a common goal.
Benefits for Wood Research1. Can utilize the power of the human brain for object identification in images2. Makes analysis of images accessible to managers and researchers without high expertise in remote sensing 3. Data collection from spatially diverse locations4. Increase societal awareness about rivers and wood
ReRepeat Photography
Repeat PhotographyRepeat Photography
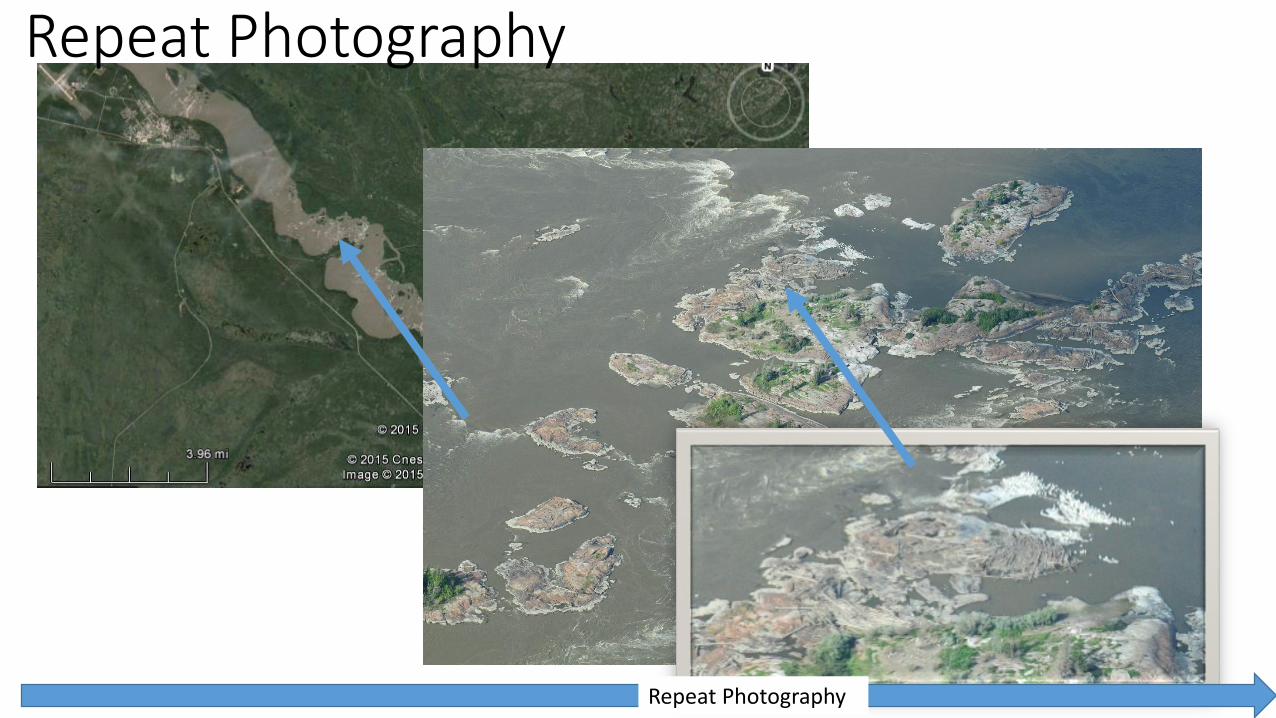
Repeat Photography
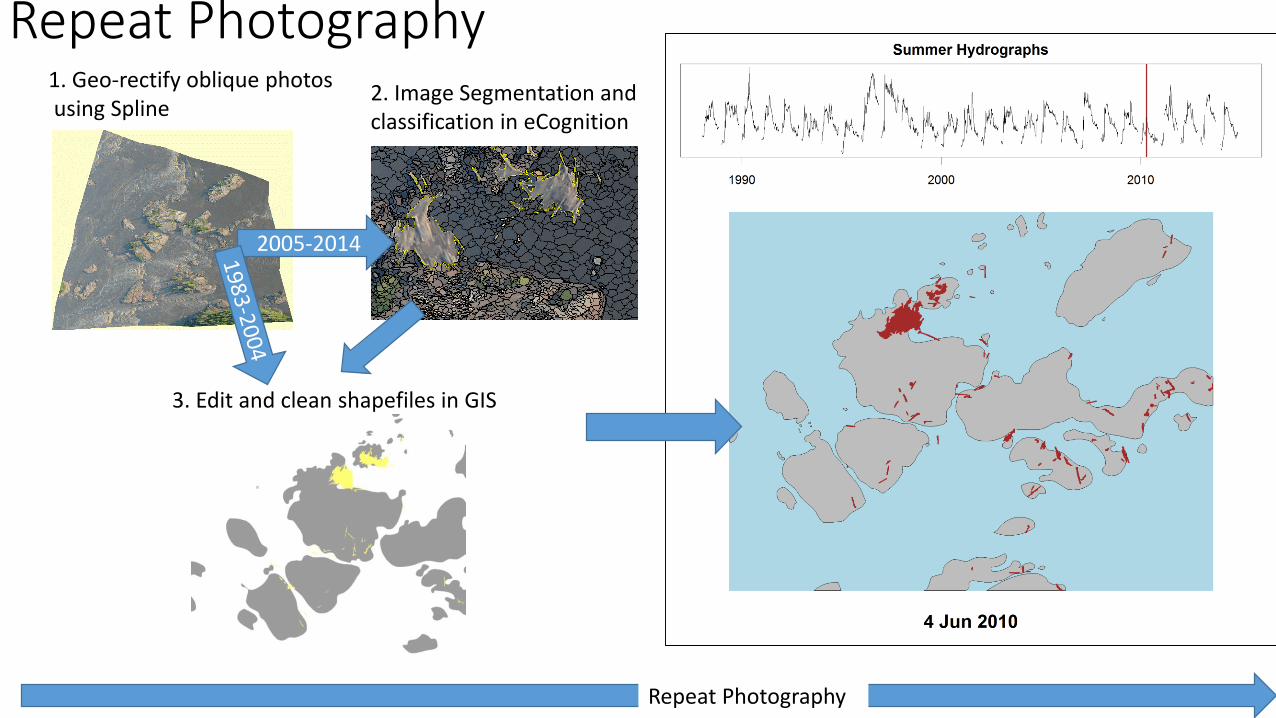
1. Geo-rectify oblique photosusing Spline
2. Image Segmentation and classification in eCognition
Repeat Photography
3. Edit and clean shapefiles in GIS
2005-2014
Repeat Photography
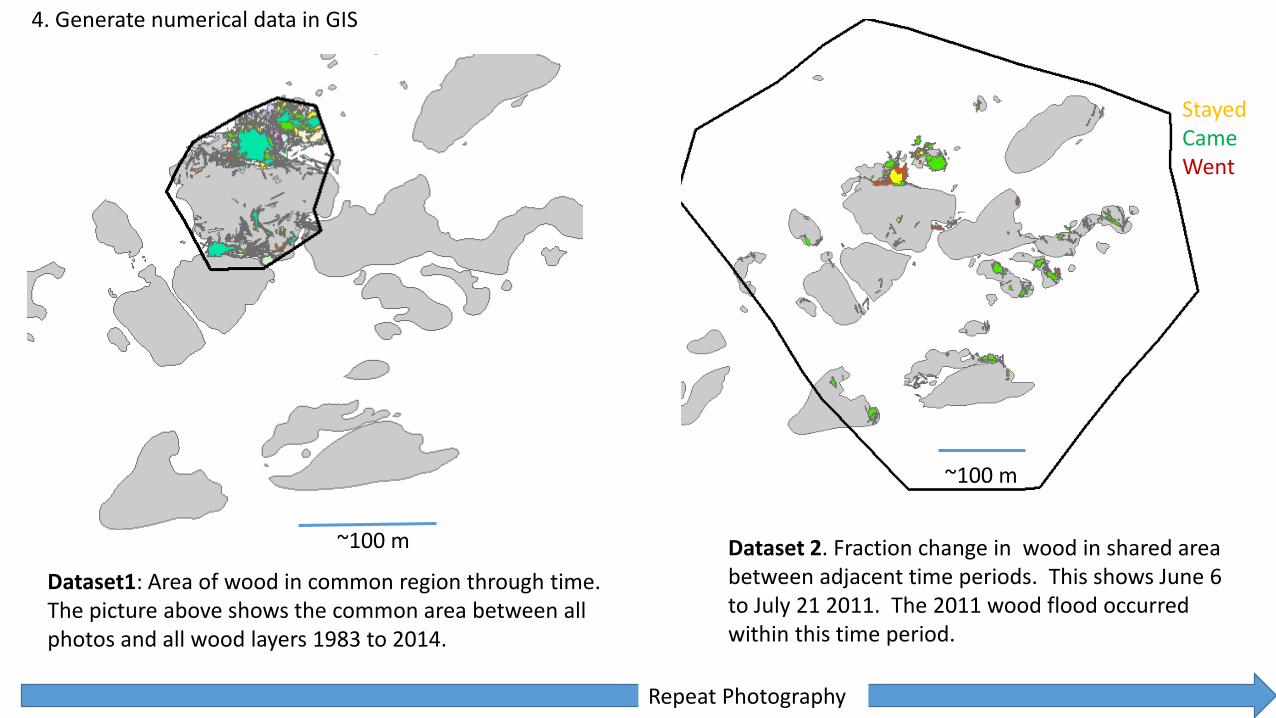
4. Generate numerical data in GIS
Dataset 2. Fraction change in wood in shared area between adjacent time periods. This shows June 6 to July 21 2011. The 2011 wood flood occurred within this time period.
Dataset1: Area of wood in common region through time. The picture above shows the common area between all photos and all wood layers 1983 to 2014.
StayedCameWent
~100 m
~100 m
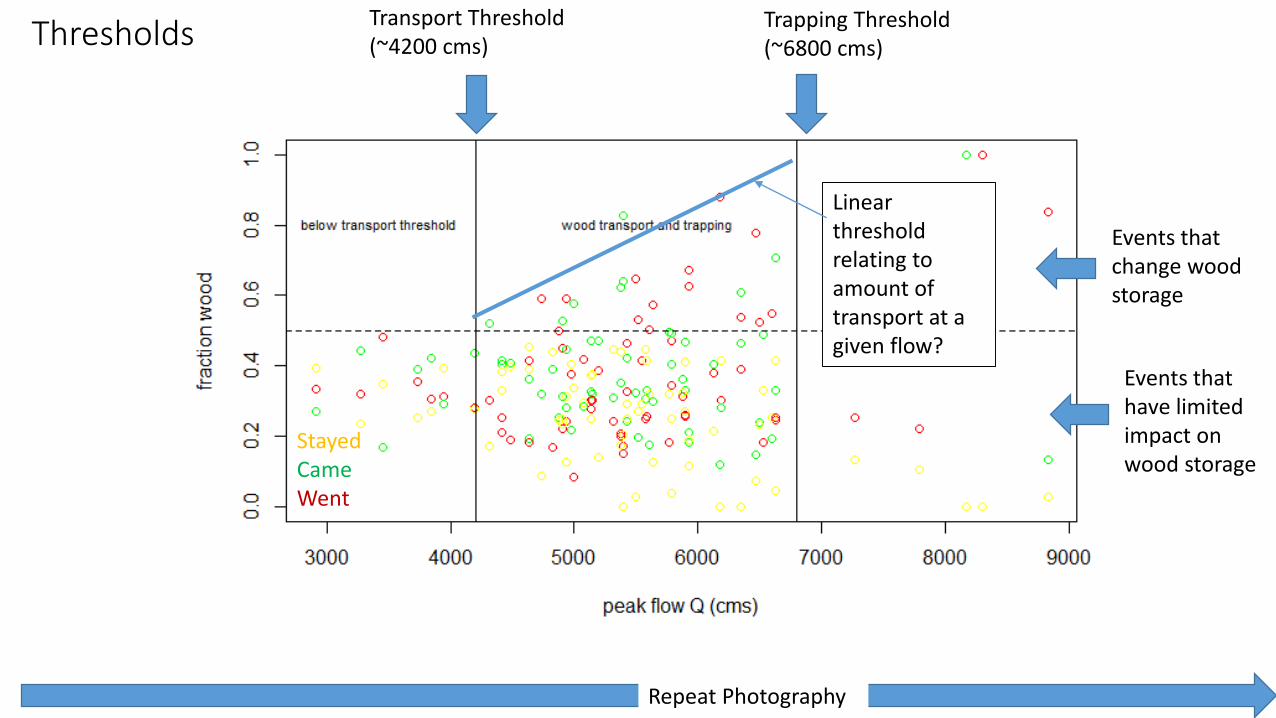
Thresholds Trapping Threshold(~6800 cms)
Repeat Photography
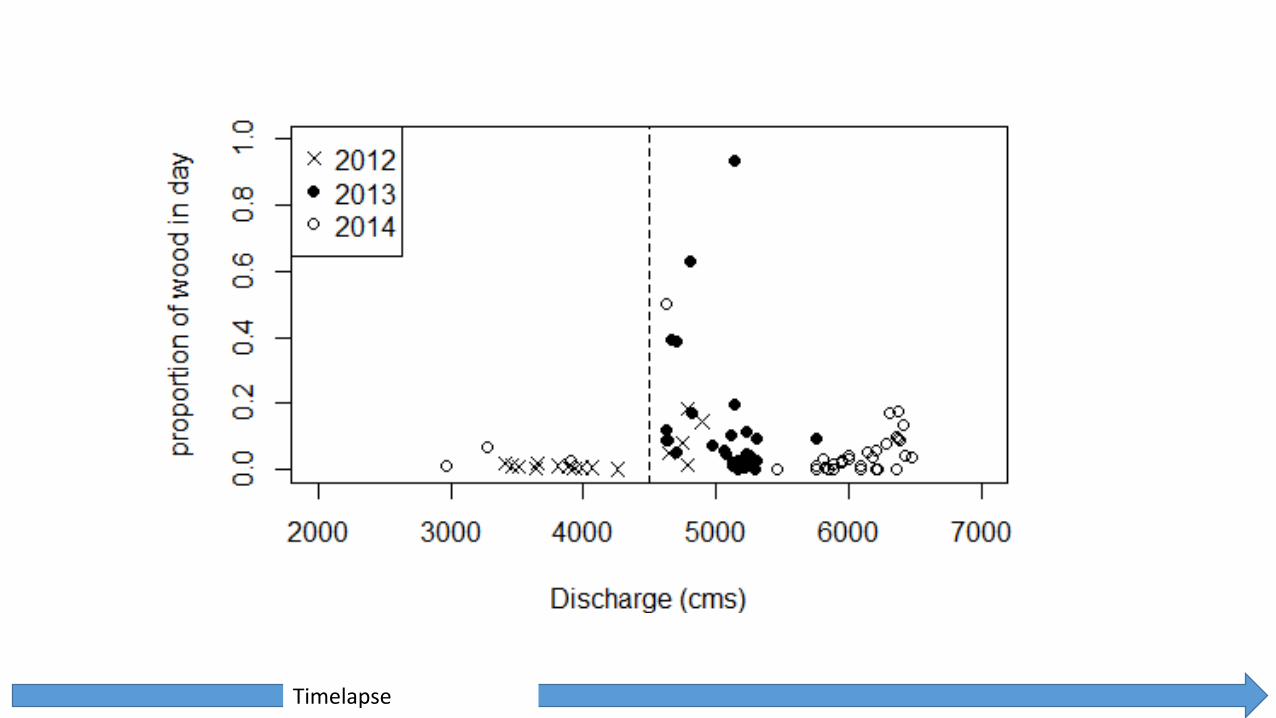
Transport Threshold(~4200 cms)
StayedCameWent
Events thatchange wood storage
Events that have limited impact on wood storage
Linear thresholdrelating to amount of transport at a given flow?
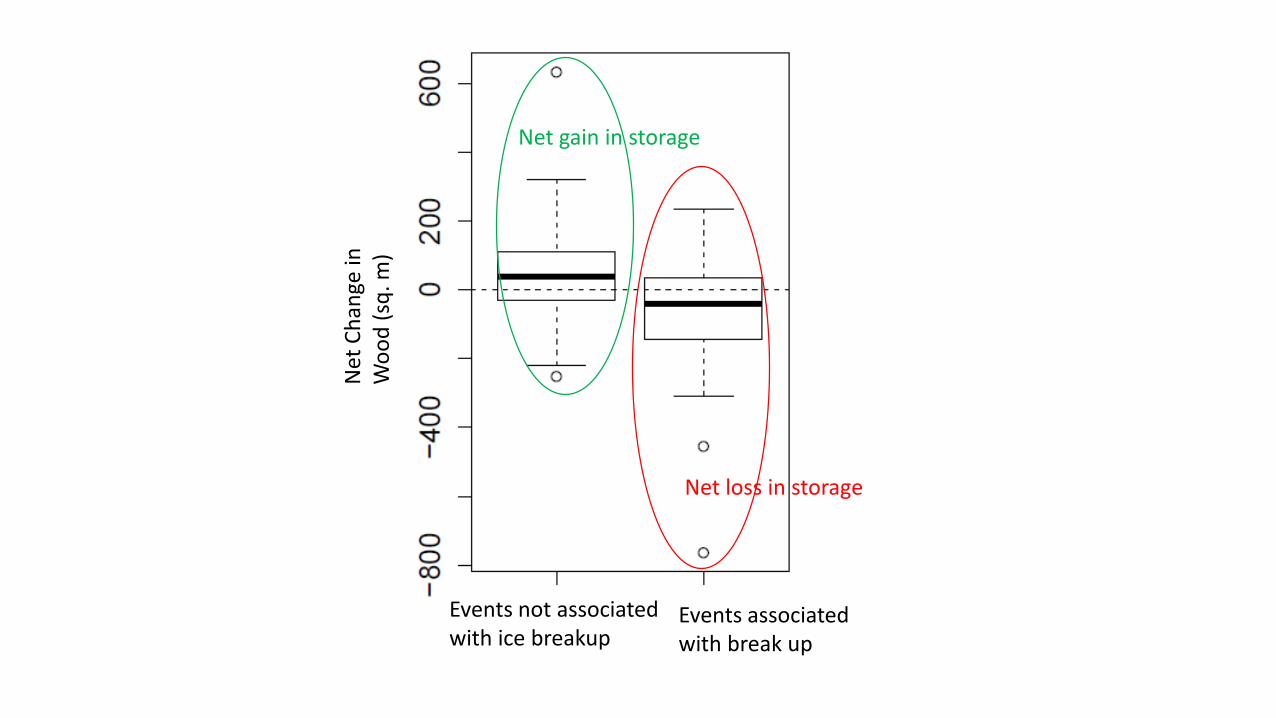
Events not associated with ice breakup
Events associated with break up
Net
Ch
ange
in
Wo
od
(sq
. m)
Net gain in storage
Net loss in storage
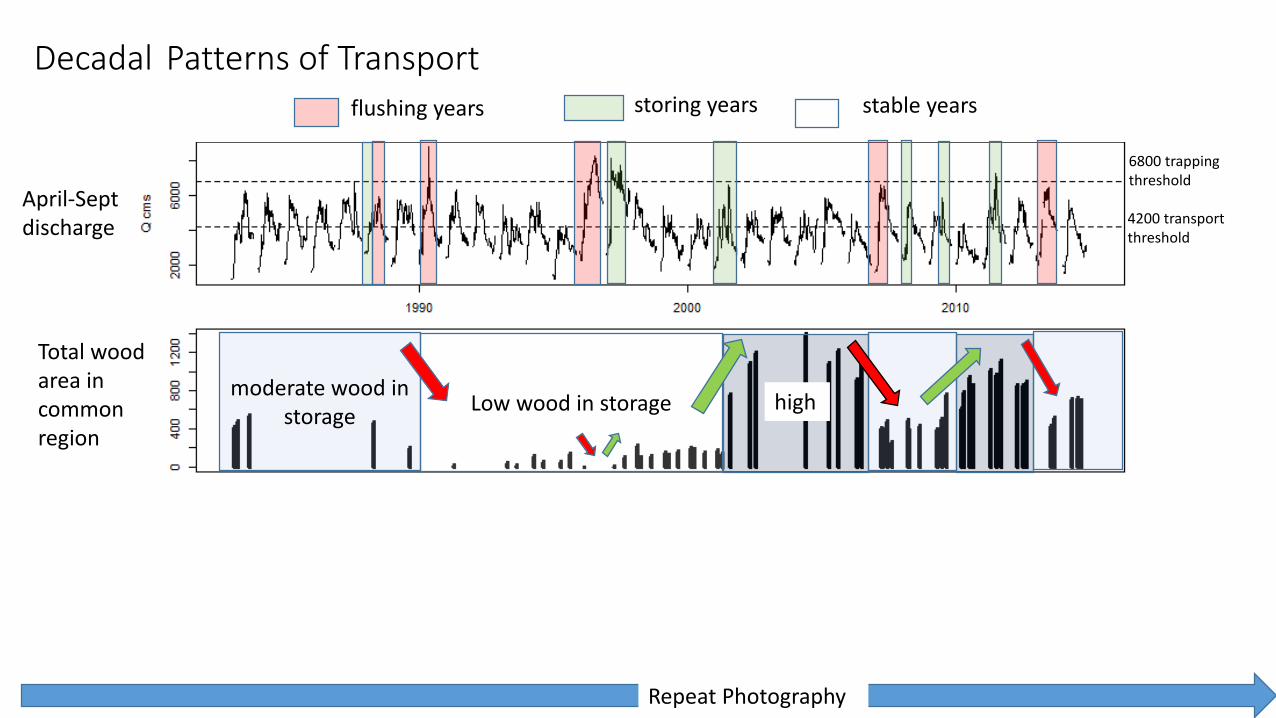
Low wood in storagemoderate wood in
storagehigh
flushing years storing years stable years
Fractionchange in wood between adjacent photos
Total wood area in common region
Decadal Patterns of Transport
April-Septdischarge
Repeat Photography
6800 trappingthreshold
4200 transportthreshold
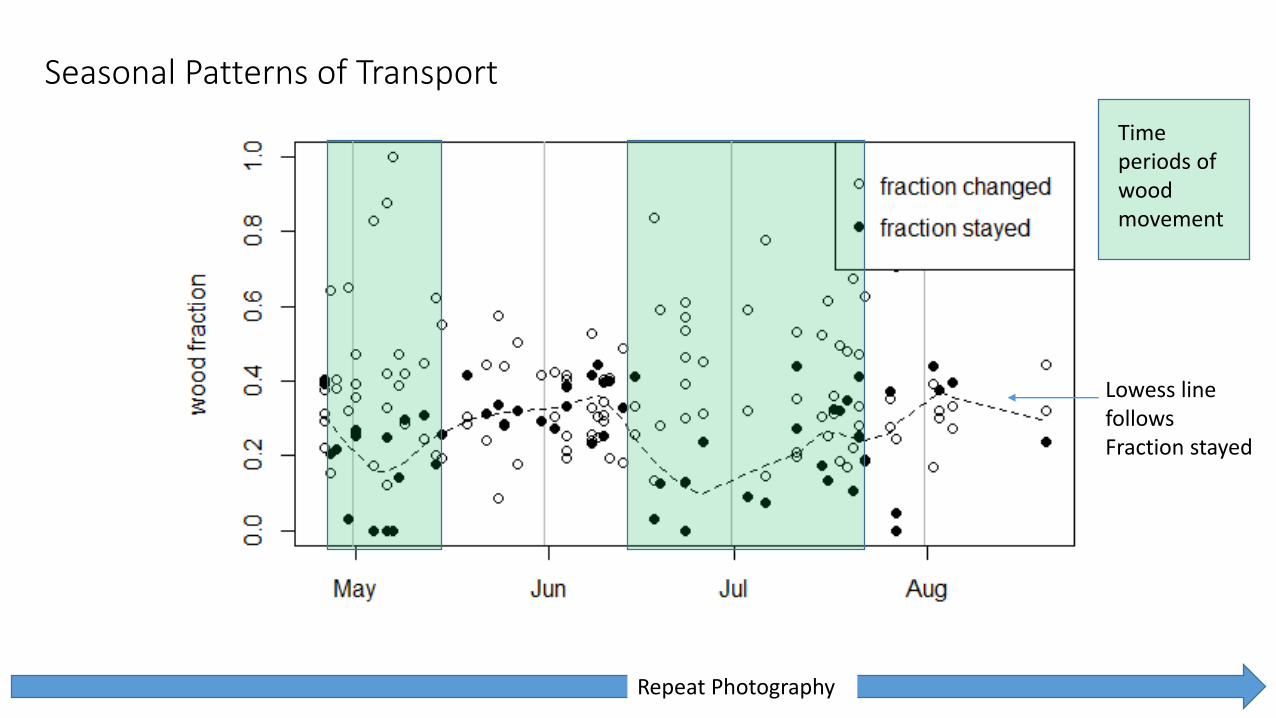
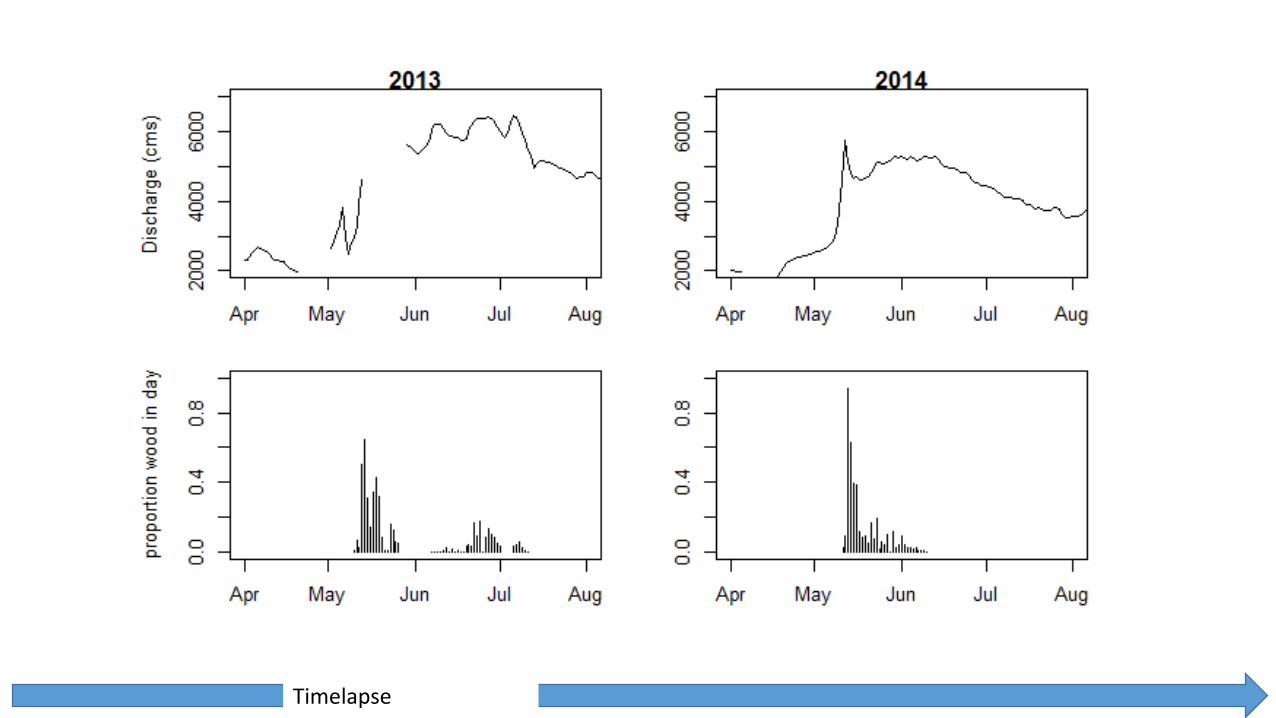
Seasonal Patterns of Transport
Time periods of wood movement
Repeat Photography
Lowess line follows Fraction stayed
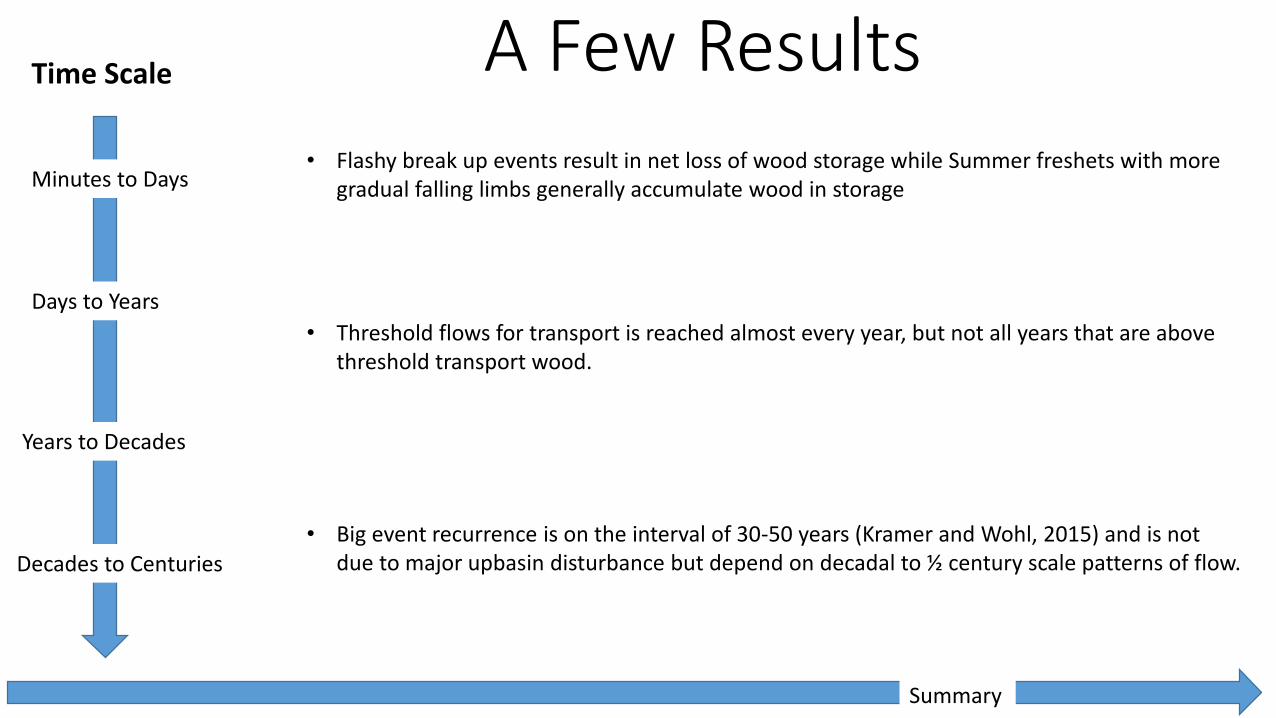
A Few ResultsTime Scale
Minutes to Days
Days to Years
Years to Decades
Decades to Centuries
Summary
• Flashy break up events result in net loss of wood storage while Summer freshets with more gradual falling limbs generally accumulate wood in storage
• Threshold flows for transport is reached almost every year, but not all years that are above threshold transport wood.
• Big event recurrence is on the interval of 30-50 years (Kramer and Wohl, 2015) and is not due to major upbasin disturbance but depend on decadal to ½ century scale patterns of flow.
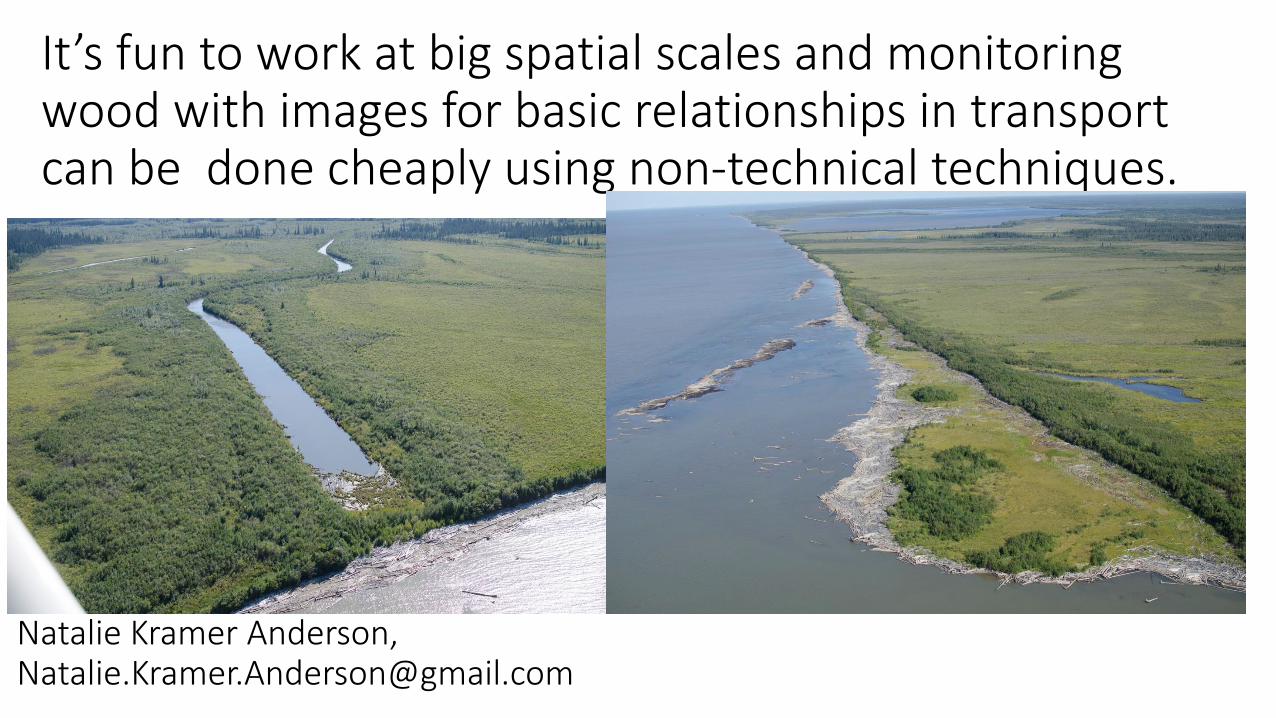
It’s fun to work at big spatial scales and monitoring wood with images for basic relationships in transport can be done cheaply using non-technical techniques.
Contact: Natalie Kramer Anderson,[email protected]