time-dependent nanomechanics of cartilage
TRANSCRIPT

1846 Biophysical Journal Volume 100 April 2011 1846–1854
Time-Dependent Nanomechanics of Cartilage
Lin Han,† Eliot H. Frank,‡ Jacqueline J. Greene,† Hsu-Yi Lee,§ Han-Hwa K. Hung,‡ Alan J. Grodzinsky,‡§{k
and Christine Ortiz†*†Department of Materials Science and Engineering, ‡Center for Biomedical Engineering, §Department of Electrical Engineering and ComputerScience, {Department of Mechanical Engineering, and kDepartment of Biological Engineering, Massachusetts Institute of Technology,Cambridge, Massachusetts
ABSTRACT In this study, atomic force microscopy-based dynamic oscillatory and force-relaxation indentation was employedto quantify the time-dependent nanomechanics of native (untreated) and proteoglycan (PG)-depleted cartilage disks, includingindentation modulus Eind, force-relaxation time constant t, magnitude of dynamic complex modulus jE *j, phase angle d betweenforce and indentation depth, storage modulus E 0, and loss modulus E 00. At ~2 nm dynamic deformation amplitude, jE *jincreased significantly with frequency from 0.225 0.02 MPa (1 Hz) to 0.775 0.10 MPa (316 Hz), accompanied by an increasein d (energy dissipation). At this length scale, the energy dissipation mechanisms were deconvoluted: the dynamic frequencydependence was primarily governed by the fluid-flow-induced poroelasticity, whereas the long-time force relaxation reflectedflow-independent viscoelasticity. After PG depletion, the change in the frequency response of jE *j and d was consistent withan increase in cartilage local hydraulic permeability. Although untreated disks showed only slight dynamic amplitude-dependentbehavior, PG-depleted disks showed great amplitude-enhanced energy dissipation, possibly due to additional viscoelasticmechanisms. Hence, in addition to functioning as a primary determinant of cartilage compressive stiffness and hydraulicpermeability, the presence of aggrecan minimized the amplitude dependence of jE *j at nanometer-scale deformation.
INTRODUCTION
Cartilage exhibits time-dependent mechanical behavior thathas been documented macroscopically (1–9) and micro-scopically (10,11) in a variety of loading configurations.These time-dependent properties are essential for propertissue function, energy dissipation, frequency-dependentstiffening, and reswelling after joint unloading (12). Theobserved time dependence has been interpreted usingcontinuum theoretical models that include both poroelastic-ity and viscoelasticity (13–16). The biomechanical behaviorof cartilage is related to the tissue’s type II collagen networkand the negatively charged aggrecan aggregates within thehydrated extracellular matrix (ECM) (12). Viscoelasticrelaxation of the solid matrix involves the translationaldiffusion and reptation of aggrecan aggregate, aggrecanmonomers, and glycosaminoglycan (GAG) side chains ofaggrecan (17), as well as reconfiguration of the collagennetwork and associated proteins. Poroelastic energy dissipa-tion is governed by the fluid flow through the porous ECM.
In hydrated cartilage tissue, the collagen fibrils are typi-cally 30–80 nm in diameter, and the gaps between them areon the order of 100 nm (12,18). Between the fibrils, brush-like aggrecan monomers bind to hyaluronan, stabilized bylink protein, to form aggregates (19). The aggrecan coreprotein has a contour length of ~400 nm, and ~40 nm-longGAG chains are substituted onto the core protein ~2–3 nmapart (20). The high density of GAG chains has been identi-fied as the main determinant of the tissue’s hydraulic perm-
Submitted November 17, 2010, and accepted for publication February 22,
2011.
*Correspondence: [email protected]
Editor: Denis Wirtz.
� 2011 by the Biophysical Society
0006-3495/11/04/1846/9 $2.00
ability and, thereby, as an important constituent regulatingcartilage poroelastic behavior (21). Deformation that takesplace at the length scale of these molecules can affect localfixed charge density (22), hydraulic permeability (23),streaming potential (24), and other biophysical mediatorsof chondrocyte-cell signaling and mechanotransduction(25). The nanomechanics of isolated ECM macromoleculessuch as type II collagen (26), GAGs (27,28) and aggrecan(29–33) have been studied in vitro. However, there is stilla lack of understanding of the ECM mechanical behaviorwithin native tissue subjected to local deformations on thesame length scale as macromolecular dimensions.
Hence, the objective of this study was to quantify thetime- and frequency-dependent mechanics of native carti-lage at deformation length scales comparable to its ECMmolecular dimensions and the fluid flow pore sizes, whichprovides direct molecular-level insights into how theseECM constituents contribute to the tissue-level cartilagebehavior. In this study, atomic force microscopy (AFM)-based techniques were employed to carry out sinusoidaldynamic oscillatory indentation of bovine cartilage disksas a function of oscillation frequency f (~1–316 Hz), usingpreviously reported methods (34,35). The results werecompared to data obtained on the same cartilage specimensusing classical nanoindentation and force-relaxation loadingconfigurations. The contact radius between the AFM probetips and the cartilage tissue samples (~1 mm) corresponds tothe length scale over which fluid-flow-related poroelasticphenomena can occur (i.e., a homogenized microscaleregion of the ECM). However, the dynamic deformationamplitudes utilized were in the range of ~2–50 nm, a length
doi: 10.1016/j.bpj.2011.02.031

Time-Dependent Cartilage Nanomechanics 1847
scale as small as the GAG-GAG interstitial spacing(12,20,36) that encompasses the range of estimated poresizes (21) that govern tissue hydraulic permeability, k,and, correspondingly, the degree of poroelastic fluid flow.This length scale also corresponds to the dimensions ofthe ECM macromolecular components (12,18–20) thatcontribute to elastic and viscoelastic molecular interactions.The contributions of poro- and viscoelasticity to theobserved cartilage time dependence were investigated byrelating the results to the associated length- and timescalesof these mechanisms. By comparing the dynamic nanome-chanical properties of native (untreated) and proteoglycan(PG)-depleted cartilage disks, the observed time andfrequency dependence were interpreted in the context ofthe macromolecular structure and properties of the ECMconstituents (e.g., collagen and aggrecan).
METHODS
Sample preparation
Cartilage disks (9 mm in diameter and ~0.5 mm thick) were harvested (37)
from the middle zone of femoropatellar groove articular cartilage of 1- to
2-week-old bovine calves and maintained in sterile phosphate-buffered
saline (PBS, without Mg2þ, Ca2þ) with protease inhibitors for<24 h before
testing. Additional groups of disks were digested with 1 mg/mL trypsin in
0.15 MNaCl and 0.05MNa3PO4, pH ~7.2 (Sigma-Aldrich, St. Louis, MO),
followed by digestion with 0.1 U/mL chondroitinase-ABC in 0.15 M NaCl
and 0.05 M Tris-HCl, pH ~8.0 (Seikagaku, Tokyo, Japan), both for 24 h at
37�C. Together, these enzyme treatments resulted in loss of >95% of
matrix aggrecan, the most abundant PG in cartilage (38), as assessed by
the GAG content via the dimethylmethyleneblue dye binding assay (39).
It has been reported that the trypsin digestion does not produce any signif-
icant structural change in the collagen fibrillar network, either microscop-
ically (40) or macroscopically (41), or the intrinsic tensile strength of
collagen fibrils (42).
untreated
PG-depleted
untreated
PG-depleted
Indentation Depth
0 20 40 60
0
2
3
Time (sec)
z-p
iezo
D
isp
lacem
en
t (μm
)
0 1
-2
-1
0
1
2
0
100
200
)m
n(
n
oi
tc
el
fe
D
re
ve
li
tn
aC
1
hold
load
dynamic
0 0.2 0.4
0
10
20
30
40
50
Fo
rce (n
N)
loa
R ~ 2.5 µm
R ~ 50 nm
a b
c d
ΔDep
th
(n
m)
ment); a sinusoidal z-piezo displacement (1 Hz, ~4 nm amplitude) was then initia
ment. (d) Sinusoidal steady-state dynamic force and indentation depth for five
cartilage disk with a hydroxyl-functionalized neutral spherical probe tip (R ~ 2
AFM-based nanomechanics experiments
Cantilever probe tips
Square pyramidal probe tips were employed with an end radius of R ~
50 nm, half-open angle of the pyramidal face of a ~ 35�, nickel-platedtip D, silicon nitride V-shaped cantilever, and nominal spring constant, k,
~0.58 N/m (Veeco, Santa Barbara, CA), as well as spherical borosilicate
colloidal probe tips (R ~ 2.5 mm and k ~ 0.58 N/m, Bioforce Nanosciences,
Ames, IA) (Fig. 1 a). Both probe tips were coated with 2 nm Cr and 50 nm
Au, and functionalized with a neutral hydroxyl-terminated self-assembled
monolayer (OH-SAM) by immersion in 3 mM 11-mercaptoundecanol
(HS(CH2)11OH) (Sigma-Aldrich) ethanol solution for 24 h.
Classical nanoindentation
AFM-based classical nanoindentation were carried out in PBS using
a maximum load of ~70 nN in force mode, using a MultiMode AFM
with a PicoForce piezo and Nanoscope IV controller (Veeco) over a range
of constant z-piezo displacement rates (0.1–10 mm/s), where the closed-
looped PicoFoce piezo in the z-direction (perpendicular to the sample
plane) enabled the precise control and quantification of indentation force
and depth. For each indentation curve, the cantilever deflection (in Volts)
and z-piezo displacement (in mm) were converted and averaged to quantify
the indentation force-depth data (see Appendix A in the Supporting Mate-
rial). Three cartilage disk specimens were tested for each treatment condi-
tion (i.e., PG-depleted and untreated); separate groups of three disks each
were used for testing with spherical and pyramidal probe tips. For each
disk specimen, indentation was performed at two to three different locations
on relatively flat regions (surface roughness <40 nm for 5 mm �5 mm scans). At each location, indentation was repeated 10 times at 1
and 10 mm/s z-piezo displacement rate, and five times at 0.1 mm/s, with
enough wait time between each repeat.
Force relaxation
Force-relaxation experiments were carried out at the same locations as the
classical nanoindentation experiments via a number of programmed
sequences as follows. 1), First, the sample was indented using the closed-
loop force mode at a constant z-piezo displacement of ~2 mm at 1 mm/s
up to a maximum load of ~85 nN, as described above. 2), The system
(μm)
2 3 4 5
-2
-1
0
1
2
3
-3
0.6 0.8
d
ΔF
orce (n
N)
ΔTime (sec)
FIGURE 1 (a) Schematic of AFM-based nano-
indentation of cartilage and its extracellular matrix
components via spherical and pyramidal tips,
adapted from Loparic et al. (56). (b) Typical
force-indentation depth curves taken from a single
location on untreated and PG-depleted cartilage
disks using hydroxyl-functionalized spherical
(R ~ 2.5 mm) and pyramidal (R ~ 50 nm, half-open
angle of the pyramidal face a ~ 35�) probe tips at10 mm/s z-piezo displacement rate (mean 5 SD
of 10 repeats at each location to show the repeat-
ability of the indentation at the same location).
Data were analyzed using the effective contact
point determination algorithm in Appendix A in
the Supporting Material, and are shown with corre-
sponding analytical model fits based on Eqs. 1 and
2 (solid lines). The number of data points shown
here was reduced to increase clarity. (c) z-Piezo
displacement and cantilever deflection data versus
time during a typical force-relaxation experiment
(~2.3 mm z-piezo displacement applied at 10 mm/s,
followed by 60-s hold at constant z-piezo displace-
ted after ~15 s of the holding period, superimposed onto the static displace-
cycles. All the data from c and d correspond to those using an untreated
.5 mm) in PBS.
Biophysical Journal 100(7) 1846–1854

1848 Han et al.
was then changed to the open-loop script mode, in which the cantilever
probe tip was programmed to move toward and into the surface at the
same z-piezo displacement size and rate, which ensured that the maximum
indentation force was kept constant at ~85 nN for each test. 3), Immediately
after indentation, the piezo was held at a constant position for 60 s before
retracting from the specimen, during which period relaxation of indentation
force took place. The script mode thus recorded the data for z-piezo
displacement and cantilever deflection as a function of time during the
indentation and hold period (steps 2 and 3) at a data acquisition rate of
1.02 kHz. At least three repeats were carried out at the same indentation
location on each sample, with the time between each repeat sufficient to
allow complete recovery.
Dynamic oscillatory loading
After each force-relaxation experiment, a dynamic oscillatory loading
experiment was also carried out at the same specimen locations. A function
generator (5100, Rockland Scientific, Victoria, British Columbia, Canada)
was connected to the PicoForce piezo controller to enable sinusoidal
displacement of the z-piezo at specified dynamic oscillation frequencies,
f (f ¼ 1–316 Hz), and z-piezo displacement amplitudes of ~4, 25, and
125 nm. By subtracting the dynamic oscillation of cantilever deflection
(in nm), the dynamic indentation depth amplitudes of cartilage were
measured to be ~2, 10, and 50 nm, respectively (see Appendix B in the Sup-
porting Material). Prior to each specified frequency, f, and dynamic z-piezo
displacement amplitude, a force-relaxation experiment was first carried out,
as described above, and the dynamic oscillation was then superimposed
onto the static indentation (Fig. 1 c) during the 60-s hold period at ~15 s
after the indentation (step 2 of the force-relaxation experiment). The
same z-piezo displacement, cantilever deflection, and time data were
acquired at rates of 1.02 kHz for f < 100 Hz and 11.74 kHz for f R100 Hz (Fig. 1 c). The offset static indentation depths were at 0.43 5
0.04 mm and 1.01 5 0.06 mm for the spherical and pyramidal tips on the
untreated disks, respectively, and 0.77 5 0.04 mm and 1.37 5 0.12 mm
(mean5 SE) for the spherical and pyramidal tips on the PG-depleted disks,
respectively. Before the experiments on cartilage, control experiments were
performed using a mica sample at the same z-piezo displacement frequen-
cies and amplitudes for system calibration (see Appendix B in the Support-
ing Material).
Data analysis and modulus calculation
For AFM-based nanoindentation, the tip-sample contact point for each
force-depth approach curve was determined via the Golden Section search
method (43) (Appendix A in the Supporting Material). The effective inden-
tation modulus, Eind , was computed using analytical contact mechanics
models via least-squares linear regression of the experimental loading
F-D curves taken at the same sample position and z-piezo displacement
rate. For the spherical colloidal probe tip with end radius R on the cartilage
sample with thickness h >> R (here, h ~ 0.5 mm, R ~ 2.5 mm),
untreated
PG-depleted
untreated
PG-depleted
In
den
tatio
n M
od
ulu
s E
in
d (M
Pa)
z-piezo Displacement Rate (μm/s)
In
stan
tan
eo
us
In
den
tatio
n M
od
ulu
s Eind(t) (M
Pa)
Time (sec)
0.1 1 10
0
0.1
0.2
0 20 40 60
0
0.04
0.08
0.12
0 2 4 6
0.08
0.10
0.12
0
0.1
0.2
a b
(c), and characteristic relaxation time constant, t (d), of untreated and PG-de
and d were performed using hydroxyl-functionalized spherical and pyramidal p
Biophysical Journal 100(7) 1846–1854
F ¼ 4 Eind
2R1=2D3=2; (1)
3 ð1� n Þwhere F is the indentation force, D is the indentation depth (Appendix A in
the Supporting Material), n is the Poisson’s ratio (n ¼ 0.1 for both the
untreated and PG-depleted bovine cartilage disks (7,44)). For the sharp,
pyramidal probe tip (here, R ~ 50 nm << D) (45),
F ¼ 1:4906
2
Eind
ð1� n2Þtan aD2; (2)
where a is the half-open angle of the pyramidal face (a ¼ 35�, as measured
with a scanning electron microscope (6060, JEOL, Peabody, MA). The
analytical models (Eqs. 1 and 2) were used to account for the indentation
geometry. It should be noted that Eind is actually time- and rate-dependent
(nonequilibrium), and hence, is utilized to assess trends in cartilage
mechanical response to different experimental conditions (e.g., tip geom-
etry and PG depletion) at a given indentation rate.
For each force-relaxation experiment, the loading data were first
analyzed as described above to calculate the indentation depth, D. During
the subsequent 60-s hold period, the z-piezo position (the sum of the canti-
lever deflection, d, and indentation depth, D) was held constant. The canti-
lever deflection decreased over time due to force relaxation, and the
indentation depth increased subsequently to a small extent (~5–7%). The
time-dependent instantaneous indentation modulus, Eind(t), was calculated
via the analytical models (Eqs. 1 and 2) to account for the geometry and the
change in both F and, to a much smaller extent, D during the hold period
(Fig. 2 b). The equilibrium indentation modulus (after completion of relax-
ation), Eind,0, and the longest relaxation time constant, t, were computed
via a least squares nonlinear regression based on a three-element spring-
dashpot model,
EindðtÞ ¼ Eind;0 þ Eind;1expð�t=tÞ: (3)
For the nanometer-scale dynamic oscillatory loading experiments, the
amplitudes of sinusoidal force, ~F, and indentation depth, ~D, and the phase
lag, d, between them, were calculated at randomly selected intervals start-
ing at ~15 s after the initiation of dynamic z-piezo displacement. During this
period, the dynamic oscillatory deformation was observed to be at steady
state as ~F, ~D, and d remained statistically constant over time. The calcula-
tion utilized five loading cycles at each frequency (e.g., Fig. 1, c and d;
Appendix B in the Supporting Material). Within the dynamic oscillation
region of Fig. 1 c, this calculation procedure was repeated 100 times, and
the mean values of ~F and ~D amplitudes and phase angle d were obtained.
Thus, the total force, F, including static and dynamic components, can be
described using the Hertz model with a Taylor series expansion in the
indentation depth, D (46),
Fz4
3R1=2
�Eind;0
1� n2D3=2 þ 3
2
jE�j1� n2
D1=2 ~D
�; (4)
τ (sec)Eind, 0
(MPa)
0
10
20
30c dFIGURE 2 (a) Indentation modulus, Eind, of
untreated and PG-depleted cartilage disks at z-
piezo displacement rates of 0.1–10 mm/s, estimated
using Eqs. 1 and 2. (b) Instantaneous indentation
modulus, Eind(t), directly calculated, using the
Hertz model (Eq. 1), from the relaxation data of
a single force-relaxation test on an untreated carti-
lage disk (hydroxyl-functionalized neutral spher-
ical tip, R ~ 2.5 mm). The gray line is the best fit
of a three-element model (Eq. 3) to the data. (c
and d) Equilibrium indentation modulus, Eind,0
pleted cartilage disks, estimated using Eqs. 1–3. All experiments in a, c,
robe tips (n R 6 different locations, mean 5 SE).
Time-Dependent Cartilage Nanomechanics 1849
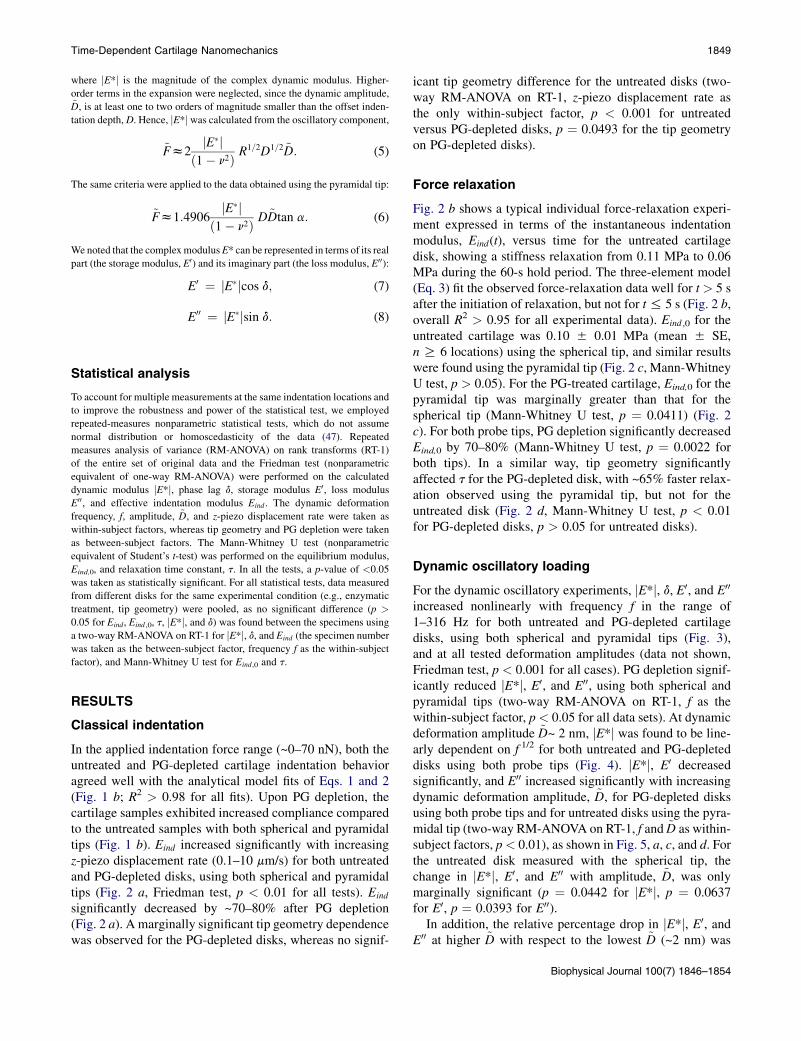
where jE*j is the magnitude of the complex dynamic modulus. Higher-
order terms in the expansion were neglected, since the dynamic amplitude,~D, is at least one to two orders of magnitude smaller than the offset inden-
tation depth,D. Hence, jE*jwas calculated from the oscillatory component,
~Fz2jE�j
ð1� n2Þ R1=2D1=2 ~D: (5)
The same criteria were applied to the data obtained using the pyramidal tip:
~Fz1:4906jE�j
ð1� n2Þ D~Dtan a: (6)
Wenoted that the complexmodulusE* can be represented in terms of its real
part (the storage modulus, E0) and its imaginary part (the loss modulus, E00):
E0 ¼ jE�jcos d; (7)
E00 ¼ jE�jsin d: (8)
Statistical analysis
To account for multiple measurements at the same indentation locations and
to improve the robustness and power of the statistical test, we employed
repeated-measures nonparametric statistical tests, which do not assume
normal distribution or homoscedasticity of the data (47). Repeated
measures analysis of variance (RM-ANOVA) on rank transforms (RT-1)
of the entire set of original data and the Friedman test (nonparametric
equivalent of one-way RM-ANOVA) were performed on the calculated
dynamic modulus jE*j, phase lag d, storage modulus E0, loss modulus
E00, and effective indentation modulus Eind . The dynamic deformation
frequency, f, amplitude, ~D, and z-piezo displacement rate were taken as
within-subject factors, whereas tip geometry and PG depletion were taken
as between-subject factors. The Mann-Whitney U test (nonparametric
equivalent of Student’s t-test) was performed on the equilibrium modulus,
Eind,0, and relaxation time constant, t. In all the tests, a p-value of <0.05
was taken as statistically significant. For all statistical tests, data measured
from different disks for the same experimental condition (e.g., enzymatic
treatment, tip geometry) were pooled, as no significant difference (p >
0.05 for Eind, Eind ,0, t, jE*j, and d) was found between the specimens using
a two-way RM-ANOVA on RT-1 for jE*j, d, and Eind (the specimen number
was taken as the between-subject factor, frequency f as the within-subject
factor), and Mann-Whitney U test for Eind ,0 and t.
RESULTS
Classical indentation
In the applied indentation force range (~0–70 nN), both theuntreated and PG-depleted cartilage indentation behavioragreed well with the analytical model fits of Eqs. 1 and 2(Fig. 1 b; R2 > 0.98 for all fits). Upon PG depletion, thecartilage samples exhibited increased compliance comparedto the untreated samples with both spherical and pyramidaltips (Fig. 1 b). Eind increased significantly with increasingz-piezo displacement rate (0.1–10 mm/s) for both untreatedand PG-depleted disks, using both spherical and pyramidaltips (Fig. 2 a, Friedman test, p < 0.01 for all tests). Eind
significantly decreased by ~70–80% after PG depletion(Fig. 2 a). A marginally significant tip geometry dependencewas observed for the PG-depleted disks, whereas no signif-
icant tip geometry difference for the untreated disks (two-way RM-ANOVA on RT-1, z-piezo displacement rate asthe only within-subject factor, p < 0.001 for untreatedversus PG-depleted disks, p ¼ 0.0493 for the tip geometryon PG-depleted disks).
Force relaxation
Fig. 2 b shows a typical individual force-relaxation experi-ment expressed in terms of the instantaneous indentationmodulus, Eind(t), versus time for the untreated cartilagedisk, showing a stiffness relaxation from 0.11 MPa to 0.06MPa during the 60-s hold period. The three-element model(Eq. 3) fit the observed force-relaxation data well for t > 5 safter the initiation of relaxation, but not for t% 5 s (Fig. 2 b,overall R2 > 0.95 for all experimental data). Eind ,0 for theuntreated cartilage was 0.10 5 0.01 MPa (mean 5 SE,n R 6 locations) using the spherical tip, and similar resultswere found using the pyramidal tip (Fig. 2 c, Mann-WhitneyU test, p > 0.05). For the PG-treated cartilage, Eind,0 for thepyramidal tip was marginally greater than that for thespherical tip (Mann-Whitney U test, p ¼ 0.0411) (Fig. 2c). For both probe tips, PG depletion significantly decreasedEind,0 by 70–80% (Mann-Whitney U test, p ¼ 0.0022 forboth tips). In a similar way, tip geometry significantlyaffected t for the PG-depleted disk, with ~65% faster relax-ation observed using the pyramidal tip, but not for theuntreated disk (Fig. 2 d, Mann-Whitney U test, p < 0.01for PG-depleted disks, p > 0.05 for untreated disks).
Dynamic oscillatory loading
For the dynamic oscillatory experiments, jE*j, d, E0, and E00
increased nonlinearly with frequency f in the range of1–316 Hz for both untreated and PG-depleted cartilagedisks, using both spherical and pyramidal tips (Fig. 3),and at all tested deformation amplitudes (data not shown,Friedman test, p < 0.001 for all cases). PG depletion signif-icantly reduced jE*j, E0, and E00, using both spherical andpyramidal tips (two-way RM-ANOVA on RT-1, f as thewithin-subject factor, p< 0.05 for all data sets). At dynamicdeformation amplitude ~D~ 2 nm, jE*j was found to be line-arly dependent on f 1/2 for both untreated and PG-depleteddisks using both probe tips (Fig. 4). jE*j, E0 decreasedsignificantly, and E00 increased significantly with increasingdynamic deformation amplitude, ~D, for PG-depleted disksusing both probe tips and for untreated disks using the pyra-midal tip (two-way RM-ANOVA on RT-1, f and ~D as within-subject factors, p< 0.01), as shown in Fig. 5, a, c, and d. Forthe untreated disk measured with the spherical tip, thechange in jE*j, E0, and E00 with amplitude, ~D, was onlymarginally significant (p ¼ 0.0442 for jE*j, p ¼ 0.0637for E0, p ¼ 0.0393 for E00).In addition, the relative percentage drop in jE*j, E0, and
E00 at higher ~D with respect to the lowest ~D (~2 nm) was
Biophysical Journal 100(7) 1846–1854
untreated
PG-depleted
untreated
PG-depleted
1 10 100 1000 1 10 100 1000
0
0.2
0.4
0.6
0.8
1.0
1.2
Frequency (Hz)
1 10 100 1000 1 10 100 1000
0
10
20
30
40
Frequency (Hz)
1 10 100 1000 1 10 100 1000
10-2
10-1
100
Frequency (Hz)
E' (f) (M
Pa
)
1 10 100 1000 1 10 100 1000
10-2
10-1
100
Frequency (Hz)
E'' (f) (M
Pa
)δ(
f)
°(
)
|
*E
(f
)a
PM
(
|)
a b
c d
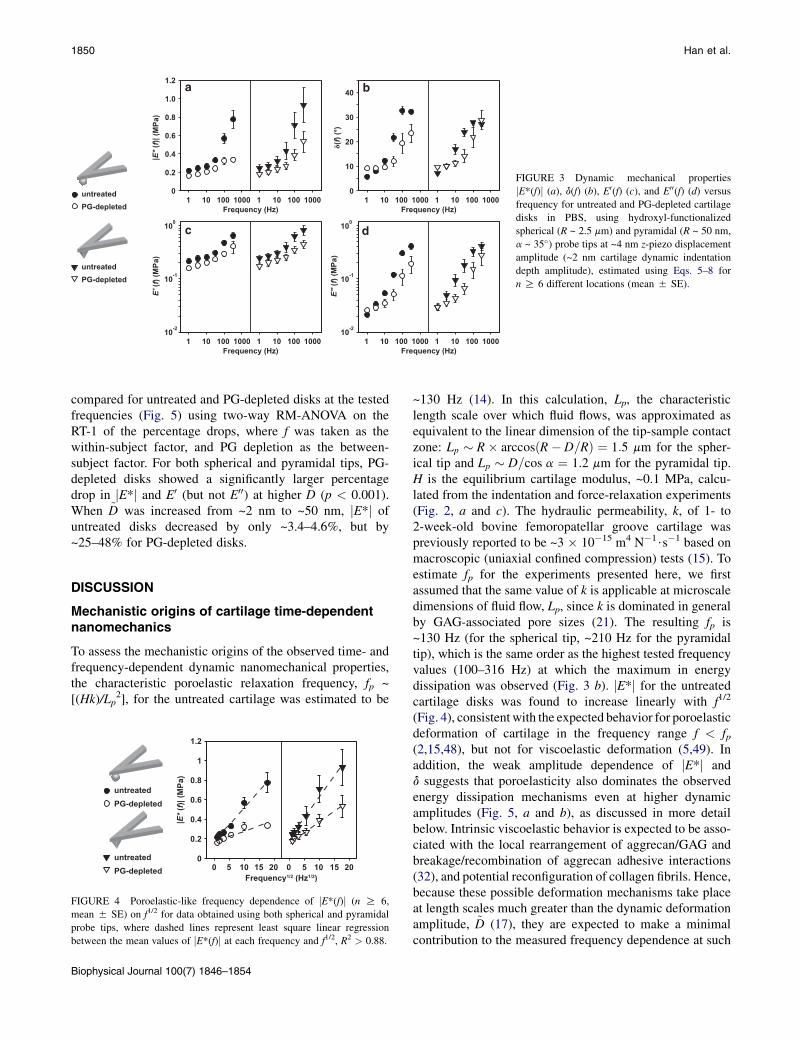
FIGURE 3 Dynamic mechanical properties
jE*(f)j (a), d(f) (b), E0(f) (c), and E00(f) (d) versusfrequency for untreated and PG-depleted cartilage
disks in PBS, using hydroxyl-functionalized
spherical (R ~ 2.5 mm) and pyramidal (R ~ 50 nm,
a ~ 35�) probe tips at ~4 nm z-piezo displacement
amplitude (~2 nm cartilage dynamic indentation
depth amplitude), estimated using Eqs. 5–8 for
n R 6 different locations (mean 5 SE).
1850 Han et al.
compared for untreated and PG-depleted disks at the testedfrequencies (Fig. 5) using two-way RM-ANOVA on theRT-1 of the percentage drops, where f was taken as thewithin-subject factor, and PG depletion as the between-subject factor. For both spherical and pyramidal tips, PG-depleted disks showed a significantly larger percentagedrop in jE*j and E0 (but not E00) at higher ~D (p < 0.001).When ~D was increased from ~2 nm to ~50 nm, jE*j ofuntreated disks decreased by only ~3.4–4.6%, but by~25–48% for PG-depleted disks.
DISCUSSION
Mechanistic origins of cartilage time-dependentnanomechanics
To assess the mechanistic origins of the observed time- andfrequency-dependent dynamic nanomechanical properties,the characteristic poroelastic relaxation frequency, fp ~[(Hk)/Lp
2], for the untreated cartilage was estimated to be
untreated
PG-depleted
untreated
PG-depleted0 5 10 15 20 0 5 10 15 20
0
0.2
0.4
0.6
0.8
1
1.2
Frequency1/2
(Hz1/2
)
|
*E
(f
)a
PM
(
|)
FIGURE 4 Poroelastic-like frequency dependence of jE*(f)j (n R 6,
mean 5 SE) on f1/2 for data obtained using both spherical and pyramidal
probe tips, where dashed lines represent least square linear regression
between the mean values of jE*(f)j at each frequency and f1/2, R2 > 0.88.
Biophysical Journal 100(7) 1846–1854
~130 Hz (14). In this calculation, Lp, the characteristiclength scale over which fluid flows, was approximated asequivalent to the linear dimension of the tip-sample contactzone: Lp � R� arccosðR� D=RÞ ¼ 1:5 mm for the spher-ical tip and Lp � D=cos a ¼ 1.2 mm for the pyramidal tip.H is the equilibrium cartilage modulus, ~0.1 MPa, calcu-lated from the indentation and force-relaxation experiments(Fig. 2, a and c). The hydraulic permeability, k, of 1- to2-week-old bovine femoropatellar groove cartilage waspreviously reported to be ~3 � 10�15 m4 N�1$s�1 based onmacroscopic (uniaxial confined compression) tests (15). Toestimate fp for the experiments presented here, we firstassumed that the same value of k is applicable at microscaledimensions of fluid flow, Lp, since k is dominated in generalby GAG-associated pore sizes (21). The resulting fp is~130 Hz (for the spherical tip, ~210 Hz for the pyramidaltip), which is the same order as the highest tested frequencyvalues (100–316 Hz) at which the maximum in energydissipation was observed (Fig. 3 b). jE*j for the untreatedcartilage disks was found to increase linearly with f1/2
(Fig. 4), consistent with the expected behavior for poroelasticdeformation of cartilage in the frequency range f < fp(2,15,48), but not for viscoelastic deformation (5,49). Inaddition, the weak amplitude dependence of jE*j andd suggests that poroelasticity also dominates the observedenergy dissipation mechanisms even at higher dynamicamplitudes (Fig. 5, a and b), as discussed in more detailbelow. Intrinsic viscoelastic behavior is expected to be asso-ciated with the local rearrangement of aggrecan/GAG andbreakage/recombination of aggrecan adhesive interactions(32), and potential reconfiguration of collagen fibrils. Hence,because these possible deformation mechanisms take placeat length scales much greater than the dynamic deformationamplitude, ~D (17), they are expected to make a minimalcontribution to the measured frequency dependence at such

untreated
PG-depleted
1 Hz 10 Hzfrequency 1 Hz 10 Hz
0
0.1
0.2
0.3
0.4
1 10 100 1 10 100
|
*E
(f
)a
PM
(
|)
0
5
10
15
20
25
1 10 100 1 10 100
δ(f
)°
(
)
0
0.1
0.2
0.3
0.4
1 10 100 1 10 100
’E
(f
)a
PM
(
)
0
0.04
0.08
0.12
cartilage dynamic deformation amplitude D (nm)
1 10 100 1 10 100
’’E
(f
)a
PM
(
)
~
a
b
c
d
FIGURE 5 Dynamic mechanical properties jE*(f)j (a), d(f) (b), E0(f) (c),and E00(f) (d) as a function of cartilage dynamic deformation amplitude
(~2–50 nm) at 1- and 10-Hz deformation frequencies for untreated and
PG-depleted cartilage disks in PBS, using hydroxyl-functionalized spher-
Time-Dependent Cartilage Nanomechanics 1851
small deformation amplitudes. In addition, the known visco-elastic behavior of cartilage disks measured via torsionalshear (in the absence of poroelastic behavior) exhibitsa maximum of d < 14� at larger macroscopic deformationscales (5), which is much smaller than the observed d ofFig. 3 b at frequencies near fp. Furthermore, the frequencydependence of jE*j and d at higher deformation amplitudes,~D, remains consistent (Fig. 5), supporting the hypothesis thatfluid flow tangential to the direction of dynamic oscillationdominates energy dissipation in this regime, rather thanviscoelastic processes, which are most likely dominated byaxially directed deformations. Hence, these results suggestthat even at fluid-flow length scales much smaller thanmacroscopic load configurations, and deformation ampli-tudes on the scale of molecular dimensions, fluid-flow-related poroelasticity dominates energy dissipation in thef ¼ 1–316 Hz frequency range. It is interesting that recentstudies have also revealed that poroelasticity is the dominantmechanism governing the frequency-dependent behavior ofnewly synthesized cell-associated matrix surrounding indi-vidual chondrocytes, removed from 1- to 4-week alginateculture, and subjected to nanometer-scale dynamic oscilla-tory loading (35).
Since the force-relaxation behavior of untreated cartilagein Fig. 2, b and c, corresponds to t >> tp (characteristicporoelastic relaxation time, tp ¼ ð1=fpÞ � 8 ms) and inden-tation depth ~430 nm, it is hypothesized that the time depen-dence is dominated by the intrinsic viscoelastic behavior ofthe ECM. The fact that a single relaxation time constantcould not fit the relaxation behavior of Fig. 2 b for interme-diate time (1 < t < 5 s) suggests the presence of multipleviscoelastic relaxation mechanisms that may be associatedwith hierarchical structures of cartilage ECM at nano- andmicroscales (12,17). This viscoelastic behavior could bedue to rearrangement of aggrecan/GAGs, adhesive interac-tions between aggrecan (32), reptation of aggrecan mono-mers and aggregates (17), and relaxation of interconnectedcollagen fibrils. At short times (t < 1 s), the force relaxationcould be a combined effect of both poro- and viscoelasticmechanisms.
This time-dependent behavior of cartilage was also re-flected in classical nanoindentation tests using the sameprobe tips. A single indentation test took place over ~0.05to 10 s, corresponding to z-piezo displacement rates of 10to 0.1 mm/s, respectively. Hence, based on the above discus-sion, the observed rate dependence of Eind (Fig. 2 a) waslikely due to the combined effects of poro- and viscoelas-ticity. The values of Eind are therefore effective responsesof cartilage at given indentation rates, resulting from a
ical (R ~ 2.5 mm) and pyramidal (R ~ 50 nm, a ~ 35�) probe tips, estimated
using Eqs. 5–8 for n R 6 different locations (mean 5 SE). The amplitude
dependence was similar at 100-Hz frequency for both untreated and
PG-depleted disks with both probe tips (not shown, for better clarity).
Biophysical Journal 100(7) 1846–1854
1852 Han et al.
combination of cartilage mechanical properties that affectits time dependence (e.g., Eind,0, t, k). Because both thesedeformation mechanisms could occur during the indentationtest, the contribution of each mechanism could not be indi-vidually quantified using only F-D indentation curves.Therefore, although classical nanoindentation results didshow significant tissue time dependence (Fig. 2 a), thedynamic oscillatory indentation combined with force-relax-ation tests are advantageous for direct probing of the time-and frequency-dependent behavior of cartilage.
0.0001 0.01 1 100 10000 0
10
20
30
40
δ(f)
(°)
f × Lp2/Hk
~ μm ~ mm
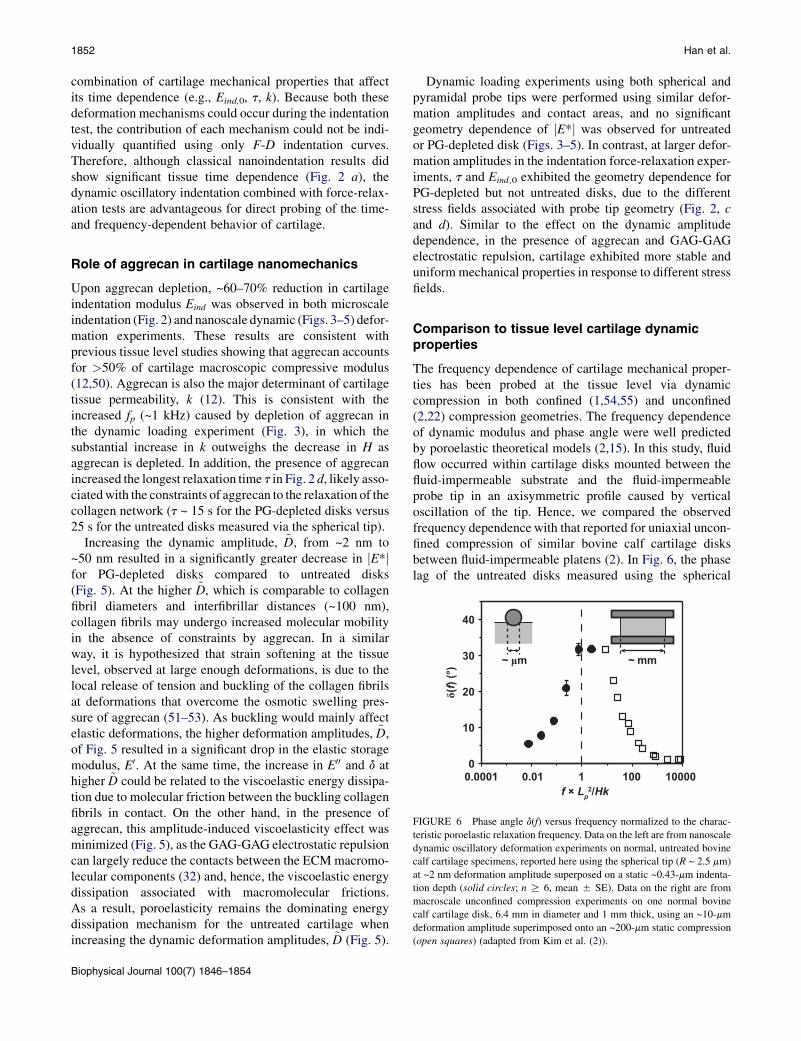
FIGURE 6 Phase angle d(f) versus frequency normalized to the charac-
teristic poroelastic relaxation frequency. Data on the left are from nanoscale
dynamic oscillatory deformation experiments on normal, untreated bovine
calf cartilage specimens, reported here using the spherical tip (R ~ 2.5 mm)
at ~2 nm deformation amplitude superposed on a static ~0.43-mm indenta-
tion depth (solid circles; n R 6, mean 5 SE). Data on the right are from
macroscale unconfined compression experiments on one normal bovine
calf cartilage disk, 6.4 mm in diameter and 1 mm thick, using an ~10-mm
deformation amplitude superimposed onto an ~200-mm static compression
(open squares) (adapted from Kim et al. (2)).
Role of aggrecan in cartilage nanomechanics
Upon aggrecan depletion, ~60–70% reduction in cartilageindentation modulus Eind was observed in both microscaleindentation (Fig. 2) and nanoscale dynamic (Figs. 3–5) defor-mation experiments. These results are consistent withprevious tissue level studies showing that aggrecan accountsfor >50% of cartilage macroscopic compressive modulus(12,50). Aggrecan is also the major determinant of cartilagetissue permeability, k (12). This is consistent with theincreased fp (~1 kHz) caused by depletion of aggrecan inthe dynamic loading experiment (Fig. 3), in which thesubstantial increase in k outweighs the decrease in H asaggrecan is depleted. In addition, the presence of aggrecanincreased the longest relaxation time t in Fig. 2 d, likely asso-ciatedwith the constraints of aggrecan to the relaxation of thecollagen network (t ~ 15 s for the PG-depleted disks versus25 s for the untreated disks measured via the spherical tip).
Increasing the dynamic amplitude, ~D, from ~2 nm to~50 nm resulted in a significantly greater decrease in jE*jfor PG-depleted disks compared to untreated disks(Fig. 5). At the higher ~D, which is comparable to collagenfibril diameters and interfibrillar distances (~100 nm),collagen fibrils may undergo increased molecular mobilityin the absence of constraints by aggrecan. In a similarway, it is hypothesized that strain softening at the tissuelevel, observed at large enough deformations, is due to thelocal release of tension and buckling of the collagen fibrilsat deformations that overcome the osmotic swelling pres-sure of aggrecan (51–53). As buckling would mainly affectelastic deformations, the higher deformation amplitudes, ~D,of Fig. 5 resulted in a significant drop in the elastic storagemodulus, E0. At the same time, the increase in E00 and d athigher ~D could be related to the viscoelastic energy dissipa-tion due to molecular friction between the buckling collagenfibrils in contact. On the other hand, in the presence ofaggrecan, this amplitude-induced viscoelasticity effect wasminimized (Fig. 5), as the GAG-GAG electrostatic repulsioncan largely reduce the contacts between the ECMmacromo-lecular components (32) and, hence, the viscoelastic energydissipation associated with macromolecular frictions.As a result, poroelasticity remains the dominating energydissipation mechanism for the untreated cartilage whenincreasing the dynamic deformation amplitudes, ~D (Fig. 5).
Biophysical Journal 100(7) 1846–1854
Dynamic loading experiments using both spherical andpyramidal probe tips were performed using similar defor-mation amplitudes and contact areas, and no significantgeometry dependence of jE*j was observed for untreatedor PG-depleted disk (Figs. 3–5). In contrast, at larger defor-mation amplitudes in the indentation force-relaxation exper-iments, t and Eind ,0 exhibited the geometry dependence forPG-depleted but not untreated disks, due to the differentstress fields associated with probe tip geometry (Fig. 2, cand d). Similar to the effect on the dynamic amplitudedependence, in the presence of aggrecan and GAG-GAGelectrostatic repulsion, cartilage exhibited more stable anduniformmechanical properties in response to different stressfields.
Comparison to tissue level cartilage dynamicproperties
The frequency dependence of cartilage mechanical proper-ties has been probed at the tissue level via dynamiccompression in both confined (1,54,55) and unconfined(2,22) compression geometries. The frequency dependenceof dynamic modulus and phase angle were well predictedby poroelastic theoretical models (2,15). In this study, fluidflow occurred within cartilage disks mounted between thefluid-impermeable substrate and the fluid-impermeableprobe tip in an axisymmetric profile caused by verticaloscillation of the tip. Hence, we compared the observedfrequency dependence with that reported for uniaxial uncon-fined compression of similar bovine calf cartilage disksbetween fluid-impermeable platens (2). In Fig. 6, the phaselag of the untreated disks measured using the spherical

Time-Dependent Cartilage Nanomechanics 1853
probe tip is plotted as a function of frequency normalized byfp ~Hk/Lp
2, assuming Lp ~ 1.5 mm,H ~ 0.1 MPa, and k ~ 3�10�15 m4 N�1 s�1, as discussed previously. Also shown inFig. 6 is the previously reported phase lag of the dynamicmodulus of one cartilage disk, 6.4 mm in diameter and1 mm thick, tested in uniaxial unconfined compression(2). The macroscopic tests (2) focused on frequencies f >fp, since fp for the millimeter-sized disks in unconfinedcompression was ~0.001 Hz (for the given disk geometry),and tests at lower frequencies were not possible. In thisstudy, the frequency range was confined to the region f %fp (~100–300 Hz for the current geometry) due to AFMinstrumentation constraints, which prevented measurementsat frequencies >~300 Hz. Overall, the normalizedfrequency dependence of the phase lag in Fig. 6 is qualita-tively consistent with the poroelastic behavior that wouldbe expected over the complete frequency range (fp˛f ) inuniaxial unconfined compression as well as the nanoscaledynamic compression geometry in Fig. 1 a (2). In contrastto poroelasticity, the length scale dependence was muchless remarkable for cartilage intrinsic viscoelasticity, asmacroscale stress relaxation experiments via unconfinedcompression (3) resulted in viscoelastic relaxation timeconstants very similar to those reported by AFM-basednanoindentation (Fig. 2 d).
CONCLUSIONS
In this work, AFM-based indentation methods were used toquantify the time, frequency, and amplitude dependence ofuntreated and PG-depleted cartilage mechanical properties,including Eind (classical indentation), Eind,0, t (force relaxa-tion), jE*j, E0, E00, and d (dynamic oscillatory loading).An important contribution that emerged from this studyinvolves the comparison between untreated and PG-depleted cartilage disks at the small length scales thatyielded insights into the contributions of the ECM molec-ular components to the measured mechanical properties.In particular, for the dynamic oscillatory experiments onthe untreated cartilage disks, it was determined that fluid-flow-induced poroelasticity primarily governs frequency-dependent energy dissipation even at exceedingly smallnanometer-scale deformation amplitudes, whereas thelonger-timescale force relaxation mainly reflects viscoelas-ticity. Thus, using contact radii and deformation amplitudesthat are several orders smaller than tissue-level testingconfigurations (2,8), the visco- and poroelastic contributionsto cartilage time-dependent mechanical behavior could bedeconvoluted. Furthermore, depletion of aggrecan causeda dramatic increase in energy dissipation at higher ampli-tudes (associated with increased d and decreased E0 inFig. 5), which is hypothesized to be due to the presence ofadditional viscoelastic mechanisms, i.e., collagen molecularinteractions. Hence, the presence of aggrecan minimizes the
amplitude dependence and provides a more uniform andstable mechanical response.
SUPPORTING MATERIAL
Additional text, figures, and references are available at http://www.
biophysj.org/biophysj/supplemental/S0006-3495(11)00249-9.
The authors thank the Institute for Soldier Nanotechnologies at MIT,
funded through the U.S. Army Research Office, for use of instruments.
This work was supported by the National Science Foundation (grant
CMMI-0758651), the National Institutes of Health (grant AR3326), and
the National Security Science and Engineering Faculty Fellowship (grant
N00244-09-1-0064).
REFERENCES
1. Lee, R. C., E. H. Frank,., D. K. Roylance. 1981. Oscillatory compres-sional behavior of articular cartilage and its associated electromechan-ical properties. J. Biomech. Eng. 103:280–292.
2. Kim, Y.-J., L. J. Bonassar, and A. J. Grodzinsky. 1995. The role ofcartilage streaming potential, fluid flow and pressure in the stimulationof chondrocyte biosynthesis during dynamic compression. J. Biomech.28:1055–1066.
3. June, R. K., S. Ly, and D. P. Fyhrie. 2009. Cartilage stress-relaxationproceeds slower at higher compressive strains. Arch. Biochem. Biophys.483:75–80.
4. Grodzinsky, A. J., V. Roth, ., V. C. Mow. 1981. The significance ofelectromechanical and osmotic forces in the nonequilibrium swellingbehavior of articular cartilage in tension. J. Biomech. Eng.103:221–231.
5. Hayes, W. C., and A. J. Bodine. 1978. Flow-independent viscoelasticproperties of articular cartilage matrix. J. Biomech. 11:407–419.
6. Jin, M. S., and A. J. Grodzinsky. 2001. Effect of electrostatic interac-tions between glycosaminoglycans on the shear stiffness of cartilage:a molecular model and experiments. Macromolecules. 34:8330–8339.
7. Buschmann, M. D., Y.-J. Kim,., A. J. Grodzinsky. 1999. Stimulationof aggrecan synthesis in cartilage explants by cyclic loading is local-ized to regions of high interstitial fluid flow. Arch. Biochem. Biophys.366:1–7.
8. Kempson, G. E., M. A. R. Freeman, and S. A. V. Swanson. 1971. Thedetermination of a creep modulus for articular cartilage from indenta-tion tests on the human femoral head. J. Biomech. 4:239–250.
9. Mow, V. C., M. C. Gibbs, ., K. A. Athanasiou. 1989. Biphasicindentation of articular cartilage—II. A numerical algorithm and anexperimental study. J. Biomech. 22:853–861.
10. Gupta, S., J. Lin, ., L. Pruitt. 2009. A fiber reinforced poroelasticmodel of nanoindentation of porcine costal cartilage: a combinedexperimental and finite element approach. J. Mech. Behav. Biomed.Mater. 2:326–337, discussion 337–338.
11. Miller, G. J., and E. F. Morgan. 2010. Use of microindentation tocharacterize the mechanical properties of articular cartilage: compar-ison of biphasic material properties across length scales. OsteoarthritisCartilage. 18:1051–1057.
12. Maroudas, A. 1979. Physicochemical properties of articular cartilage.In Adult Articular Cartilage. M. A. R. Freeman, editor. PitmanMedical, Tunbridge Wells, UK. 215–290.
13. Biot, M. A. 1956. Theory of propagation of elastic waves in a fluid-saturated porous solid. I. Low-frequency range. J. Acoust. Soc. Am. 28:168–178.
14. Mow, V. C., S. C. Kuei,., C. G. Armstrong. 1980. Biphasic creep andstress relaxation of articular cartilage in compression: theory andexperiments. J. Biomech. Eng. 102:73–84.
Biophysical Journal 100(7) 1846–1854

1854 Han et al.
15. Frank, E. H., and A. J. Grodzinsky. 1987. Cartilage electromechanics—II. A continuum model of cartilage electrokinetics and correlation withexperiments. J. Biomech. 20:629–639.
16. Mak, A. F. 1986. The apparent viscoelastic behavior of articular carti-lage—the contributions from the intrinsic matrix viscoelasticity andinterstitial fluid flows. J. Biomech. Eng. 108:123–130.
17. Papagiannopoulos, A., T. A. Waigh, ., M. Heinrich. 2006. Solutionstructure and dynamics of cartilage aggrecan. Biomacromolecules.7:2162–2172.
18. Clark, I. C. 1971. Articular cartilage: a review and scanning electronmicroscopy study. 1. The interterritorial fibrillar architecture. J. BoneJoint Surg. Br. 53B:732–749.
19. Hardingham, T. E., and H. Muir. 1972. The specific interaction ofhyaluronic acid with cartilage proteoglycans. Biochim. Biophys.Acta. 279:401–405.
20. Ng, L., A. J. Grodzinsky,., C. Ortiz. 2003. Individual cartilage aggre-can macromolecules and their constituent glycosaminoglycans visual-ized via atomic force microscopy. J. Struct. Biol. 143:242–257.
21. Maroudas, A., J. Mizrahi, ., I. Ziv. 1987. Swelling pressure in carti-lage. Adv. Microcirculat. 13:203–212.
22. Buschmann, M. D., and A. J. Grodzinsky. 1995. A molecular model ofproteoglycan-associated electrostatic forces in cartilage mechanics.J. Biomech. Eng. 117:179–192.
23. Reynaud, B., and T. M. Quinn. 2006. Anisotropic hydraulic perme-ability in compressed articular cartilage. J. Biomech. 39:131–137.
24. Eisenberg, S. R., and A. J. Grodzinsky. 1988. Electrokinetic micromo-del of extracellular matrix and other polyelectrolytes networks.PhysicoChem. Hydrodyn. 10:517–539.
25. Guilak, F., A. Ratcliffe, and V. C. Mow. 1995. Chondrocyte deforma-tion and local tissue strain in articular cartilage: a confocal microscopystudy. J. Orthop. Res. 13:410–421.
26. Sun, Y.-L., Z.-P. Luo, ., K. N. An. 2004. Stretching type II collagenwith optical tweezers. J. Biomech. 37:1665–1669.
27. Haverkamp, R. G., M. A. Williams, and J. E. Scott. 2005. Stretchingsingle molecules of connective tissue glycans to characterize theirshape-maintaining elasticity. Biomacromolecules. 6:1816–1818.
28. Seog, J., D. Dean, ., C. Ortiz. 2005. Nanomechanics of opposingglycosaminoglycan macromolecules. J. Biomech. 38:1789–1797.
29. Dean, D., L. Han, ., C. Ortiz. 2006. Compressive nanomechanics ofopposing aggrecan macromolecules. J. Biomech. 39:2555–2565.
30. Han, L., D. Dean, ., A. J. Grodzinsky. 2007. Lateral nanomechanicsof cartilage aggrecan macromolecules. Biophys. J. 92:1384–1398.
31. Han, L., D. Dean, ., A. J. Grodzinsky. 2007. Nanoscale shear defor-mation mechanisms of opposing cartilage aggrecan macromolecules.Biophys. J. 93:L23–L25.
32. Han, L., D. Dean, ., C. Ortiz. 2008. Cartilage aggrecan can undergoself-adhesion. Biophys. J. 95:4862–4870.
33. Harder, A., V. Walhorn, ., D. Anselmetti. 2010. Single-moleculeforce spectroscopy of cartilage aggrecan self-adhesion. Biophys. J. 99:3498–3504.
34. Tyrrell, J. W. G., and P. Attard. 2003. Viscoelastic study using anatomic force microscope modified to operate as a nanorheometer.Langmuir. 19:5254–5260.
35. Lee, B., L. Han, ., A. J. Grodzinsky. 2010. Dynamic mechanicalproperties of the tissue-engineered matrix associated with individualchondrocytes. J. Biomech. 43:469–476.
36. Lai, W. M., J. S. Hou, and V. C. Mow. 1991. A triphasic theory for theswelling and deformation behaviors of articular cartilage. J. Biomech.Eng. 113:245–258.
Biophysical Journal 100(7) 1846–1854
37. Sui, Y., J. H. Lee,., A. J. Grodzinsky. 2009. Mechanical injury poten-tiates proteoglycan catabolism induced by interleukin-6 with solubleinterleukin-6 receptor and tumor necrosis factor a in immature bovineand adult human articular cartilage. Arthritis Rheum. 60:2985–2996.
38. Hardingham, T. E., and A. J. Fosang. 1992. Proteoglycans: many formsand many functions. FASEB J. 6:861–870.
39. Farndale, R. W., D. J. Buttle, and A. J. Barrett. 1986. Improved quan-titation and discrimination of sulphated glycosaminoglycans by use ofdimethylmethylene blue. Biochim. Biophys. Acta. 883:173–177.
40. Lewis, J. L., and S. L. Johnson. 2001. Collagen architecture and failureprocesses in bovine patellar cartilage. J. Anat. 199:483–492.
41. Bonassar, L. J., E. H. Frank, ., A. J. Grodzinsky. 1995. Changes incartilage composition and physical properties due to stromelysin degra-dation. Arthritis Rheum. 38:173–183.
42. Schmidt, M. B., V. C. Mow, ., D. R. Eyre. 1990. Effects of proteo-glycan extraction on the tensile behavior of articular cartilage.J. Orthop. Res. 8:353–363.
43. Lin, D. C., E. K. Dimitriadis, and F. Horkay. 2007. Robust strategies forautomated AFM force curve analysis—I. Non-adhesive indentation ofsoft, inhomogeneous materials. J. Biomech. Eng. 129:430–440.
44. Kiviranta, P., J. Rieppo, ., J. S. Jurvelin. 2006. Collagen networkprimarily controls Poisson’s ratio of bovine articular cartilage incompression. J. Orthop. Res. 24:690–699.
45. Bilodeau, G. G. 1992. Regular pyramid punch problem. J. Appl. Mech.59:519–523.
46. Mahaffy, R. E., S. Park, ., C. K. Shih. 2004. Quantitative analysis ofthe viscoelastic properties of thin regions of fibroblasts using atomicforce microscopy. Biophys. J. 86:1777–1793.
47. Conover, W. J., and R. L. Iman. 1981. Rank transformations as a bridgebetween parametric and nonparametric statistics. Am. Stat. 35:124–129.
48. Soltz, M. A., and G. A. Ateshian. 2000. A conewise linear elasticitymixture model for the analysis of tension-compression nonlinearityin articular cartilage. J. Biomech. Eng. 122:576–586.
49. Jin, M., E. H. Frank,., A. J. Grodzinsky. 2001. Tissue shear deforma-tion stimulates proteoglycan and protein biosynthesis in bovine carti-lage explants. Arch. Biochem. Biophys. 395:41–48.
50. Williamson, A. K., A. C. Chen, and R. L. Sah. 2001. Compressiveproperties and function-composition relationships of developingbovine articular cartilage. J. Orthop. Res. 19:1113–1121.
51. Lanir, Y. 1987. Biorheology and fluid flux in swelling tissues. II.Analysis of unconfined compressive response of transversely isotropiccartilage disc. Biorheology. 24:189–205.
52. Schwartz, M. H., P. H. Leo, and J. L. Lewis. 1994. A microstructuralmodel for the elastic response of articular cartilage. J. Biomech.27:865–873.
53. Bursa�c, P., C. V. McGrath,., D. Stamenovi�c. 2000. A microstructuralmodel of elastostatic properties of articular cartilage in confinedcompression. J. Biomech. Eng. 122:347–353.
54. Frank, E. H., and A. J. Grodzinsky. 1987. Cartilage electromechanics—I. Electrokinetic transduction and the effects of electrolyte pH and ionicstrength. J. Biomech. 20:615–627.
55. Soltz, M. A., and G. A. Ateshian. 2000. Interstitial fluid pressurizationduring confined compression cyclical loading of articular cartilage.Ann. Biomed. Eng. 28:150–159.
56. Loparic, M., D. Wirz, ., M. Stolz. 2010. Micro- and nanomechanicalanalysis of articular cartilage by indentation-type atomic forcemicroscopy: validation with a gel-microfiber composite. Biophys. J.98:2731–2740.

Time-Dependent Cartilage Nanomechanics Han et al.
Biophysical Journal S01
Time-Dependent Nanomechanics of Cartilage (Supporting Material)
Lin Han,† Eliot H. Frank,‡ Jacqueline J. Greene,† Hsu-Yi Lee,§ Han-Hwa Hung,‡ Alan J Grodzinsky,‡§¶ǁ and Christine Ortiz†* †Department of Materials Science and Engineering, ‡Center for Biomedical Engineernig, §Department of Electrical Engineering and Computer Science, ¶Department of Mechanical Engineering, and ǁDepartment of Biological Engineering,
APPENDIX
Massachusetts Institute of Technology, Cambridge, Massachusetts
A. Analysis of AFM-based indentation curves
For each AFM-based indentation experiment, the raw data outputs were the cantilever deflection (dV, in volts) and z-piezo displacement (z, in nm). To calculate forces, F (nN), calibration of the cantilever deflection sensitivity, ds (nm/V) was first performed via measurement of cantilever bending on a hard mica surface, and the spring constant k (nN/nm) was measured via thermal vibration (1). Force was then calculated as F = dV × ds × k. For each indentation curve, the z-piezo displacement z was adjusted by subtracting the cantilever deflection d (in nm, d = dV × ds), z’ = z – d. Force data F were slightly offset by subtracting a small value (e.g., 10-6 nN) from the measured minimum value to ensure positive definite values along the force curve.
To calculate the indentation depth D, the contact point between the probe tip and cartilage disk must be determined. In all the experiments of this study, no attractive or adhesive interactions were observed between the tip and cartilage. Hence, we adapted a previously reported method (2) to determine the effective tip-sample contact point in the absence of adhesion. In order to remove the spurious portion of the curve that contains no detectable force signals, two positions were searched via the cubic spline fit on the loading curve of log F versus z’ in the direction of tip moving towards the sample (2). The first position, z1, was taken as the last data point at which the first derivative of the fit is negative and second derivative is positive (dlogF/dz’ < 0 and d2logF/dz’2 > 0). The second position, z2, was taken as the last data point prior to z1 where dlogF/dz’ > 0 and d2logF/dz’2 < 0, or the first data point along the curve if no data point was detected via the former scenario. The noise level of the force data, nF, was taken as the 95th percentile of logF for the data between z1 and z2. The zero force data point, z0, was determined as the last data point along the curve where the force signal was below the noise level, logF < nF. After the removal of the spurious data (z’ < z0), the remaining portion of the F versus z’ curve was converted to force (F) versus indentation depth (D) using D = z’ – z0.
For indentation on microtomed cartilage disks, there were sometimes small long range repulsion forces between the cartilage and the neutral probe tip prior to tip-sample contact, possibly due to electrostatic repulsion from the
negatively charged aggrecan (3) and/or the presence of microtomed collagen fibrils on the cartilage disk surface. The effective tip-cartilage disk contact point, (D0, F0), was determined via the Golden Section search method along the F versus D curve. This effective contact point was taken as the point corresponding to the minimal weighted root mean square error from two least square linear regressions: the linear fit in the noncontant region (LSLR of F versus D, D < D0) and the polynomial fit in the contact region (LSLR of (F – F0) versus (D – D0)m, m = 1.5 for spherical tip and m = 2 for pyramidal tip), with errors in the noncontact region weighted half (2). The F versus D curve, which represents indentation of the cartilage disk, was thereby corrected by trimming the noncontact region and offsetting the remaining F-D data by (D0, F0).
As negligible irreversible plastic deformation was observed upon repeated indentation at the same location (Fig. 1b), we utilized loading curves to estimate the effective indentation modulus Eind via the analytical models Eqs. (1) and (2) assuming linear, isotropic, and elastic material behavior. The validity of the analytical model for the geometry (e.g., Hertz model for spherical indentation) was tested by comparing the modulus calculated via Hertz model to that calculated via finite element modeling, and < 1% difference was found between these two methods. In the tested indentation depth range, fitting different portions of the loading curve yielded similar Eind, suggesting that the cartilage behaved linearly within the tested range (4). Previous AFM-based nanoindentation studies of bovine knee cartilage utilizing the Hertz model and the loading portion of the curve have reported similar Eind values (5,6). Differences in the magnitude of the reported indentation moduli in other studies were possibly due to different cartilage species (7,8), different experimental parameters (e.g., applied force, indentation rate) and data analysis methods (e.g., the Oliver-Pharr method (9) on the unloading curve) (10-12), and/or different magnitudes of deformation (e.g., deformations up to hundreds of μm via an instrumented nanoindenter) (13-17).
B. Calibration and analysis of dynamic oscillatory indentation data
To correct for any systematic errors in the AFM-based dynamic indentation measurements, calibration was first
Time-Dependent Cartilage Nanomechanics Han et al.
Biophysical Journal S02
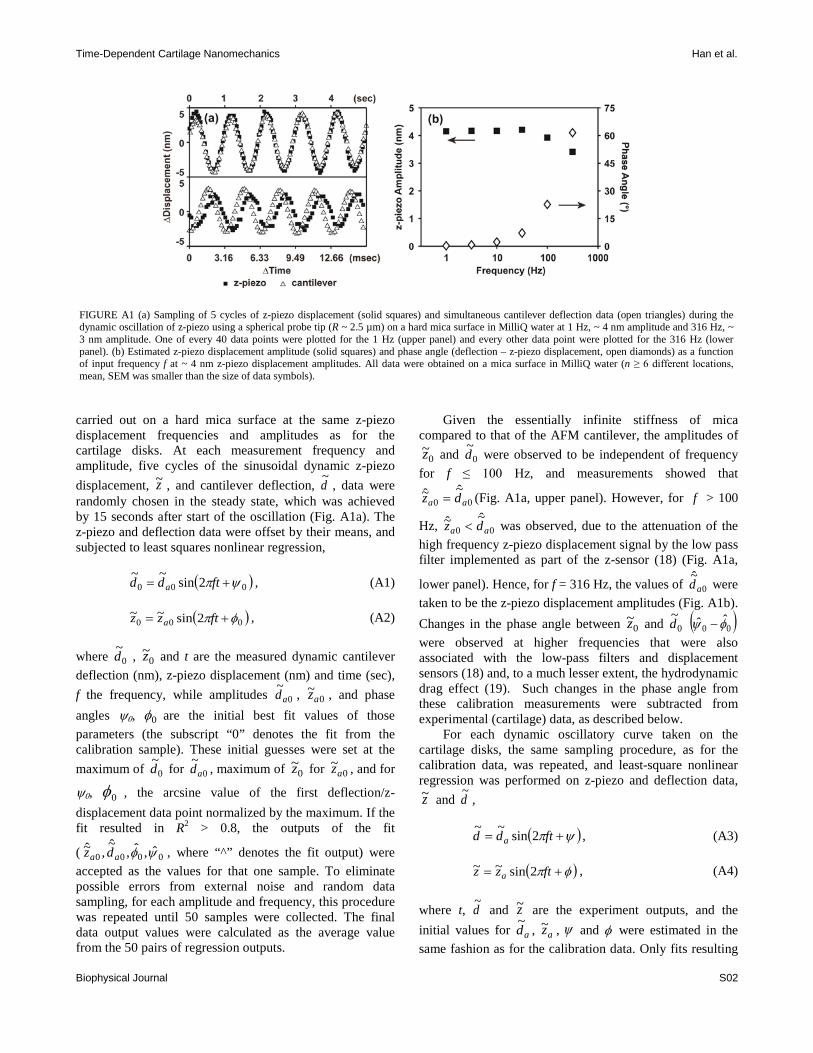
carried out on a hard mica surface at the same z-piezo displacement frequencies and amplitudes as for the cartilage disks. At each measurement frequency and amplitude, five cycles of the sinusoidal dynamic z-piezo displacement, z~ , and cantilever deflection, d
~, data were
randomly chosen in the steady state, which was achieved by 15 seconds after start of the oscillation (Fig. A1a). The z-piezo and deflection data were offset by their means, and subjected to least squares nonlinear regression,
( )000 2sin~~
ψπ += ftdd a , (A1)
( )000 2sin~~ φπ += ftzz a , (A2)
where 0~d , 0
~z and t are the measured dynamic cantilever deflection (nm), z-piezo displacement (nm) and time (sec), f the frequency, while amplitudes 0
~ad , 0
~az , and phase
angles ψ0, 0φ are the initial best fit values of those parameters (the subscript “0” denotes the fit from the calibration sample). These initial guesses were set at the maximum of 0
~d for 0~
ad , maximum of 0~z for 0
~az , and for
ψ0, 0φ , the arcsine value of the first deflection/z-displacement data point normalized by the maximum. If the fit resulted in R2 > 0.8, the outputs of the fit
( 0000 ˆ,ˆ,~̂
,~̂ ψφaa dz , where “^” denotes the fit output) were accepted as the values for that one sample. To eliminate possible errors from external noise and random data sampling, for each amplitude and frequency, this procedure was repeated until 50 samples were collected. The final data output values were calculated as the average value from the 50 pairs of regression outputs.
Given the essentially infinite stiffness of mica compared to that of the AFM cantilever, the amplitudes of
0~z and 0
~d were observed to be independent of frequency for f ≤ 100 Hz, and measurements showed that
00~̂~̂
aa dz = (Fig. A1a, upper panel). However, for f > 100
Hz, 00~̂~̂
aa dz < was observed, due to the attenuation of the high frequency z-piezo displacement signal by the low pass filter implemented as part of the z-sensor (18) (Fig. A1a,
lower panel). Hence, for f = 316 Hz, the values of 0~̂
ad were taken to be the z-piezo displacement amplitudes (Fig. A1b). Changes in the phase angle between 0
~z and 0~d ( )00
ˆˆ φψ − were observed at higher frequencies that were also associated with the low-pass filters and displacement sensors (18) and, to a much lesser extent, the hydrodynamic drag effect (19). Such changes in the phase angle from these calibration measurements were subtracted from experimental (cartilage) data, as described below.
For each dynamic oscillatory curve taken on the cartilage disks, the same sampling procedure, as for the calibration data, was repeated, and least-square nonlinear regression was performed on z-piezo and deflection data, z~ and d
~,
( )ψπ += ftdd a 2sin~~
, (A3)
( )φπ += ftzz a 2sin~~ , (A4)
where t, d~
and z~ are the experiment outputs, and the initial values for ad
~, az~ , ψ and φ were estimated in the
same fashion as for the calibration data. Only fits resulting
FIGURE A1 (a) Sampling of 5 cycles of z-piezo displacement (solid squares) and simultaneous cantilever deflection data (open triangles) during the dynamic oscillation of z-piezo using a spherical probe tip (R ~ 2.5 µm) on a hard mica surface in MilliQ water at 1 Hz, ~ 4 nm amplitude and 316 Hz, ~ 3 nm amplitude. One of every 40 data points were plotted for the 1 Hz (upper panel) and every other data point were plotted for the 316 Hz (lower panel). (b) Estimated z-piezo displacement amplitude (solid squares) and phase angle (deflection – z-piezo displacement, open diamonds) as a function of input frequency f at ~ 4 nm z-piezo displacement amplitudes. All data were obtained on a mica surface in MilliQ water (n ≥ 6 different locations, mean, SEM was smaller than the size of data symbols).
Time-Dependent Cartilage Nanomechanics Han et al.
Biophysical Journal S03
in R2 > 0.9 for both cantilever deflection and z-piezo data were accepted. The corresponding complex numbers representing the amplitudes and phase of z-piezo and cantilever deflection were calculated after correction in
amplitude ( 0~̂~̂
aa dz = for f = 316 Hz) and phase angle via calibration:
( ) ( )[ ]0000 ˆˆˆsinˆˆˆcos~̂~ ψφψψφψ −++−+= idad , (A5)
( )φφ ˆsinˆcos~̂~ iza +=z . (A6)
The complex amplitudes (magnitude and phase) of dynamic indentation depth, D~ , and force, F~ , were calculated as dzD ~~~
−= , and k×= dF ~~ , respectively. For each dynamic oscillation curve, the phase δ(f) between D~ to F~ and the magnitude of complex dynamic modulus |E*| were calculated as the average of 100 sampling results using the analytical models, Eqs. (5) and (6), as shown in Figs. 3 – 6.
REFERENCES
1. Hutter, J. L. and J. Bechhoefer. 1993. Calibration of atomic-force microscope tips. Rev. Sci. Instrum. 64:1868-1873.
2. Lin, D. C., E. K. Dimitriadis and F. Horkay. 2007. Robust strategies for automated AFM force curve analysis - I. Non-adhesive indentation of soft, inhomogeneous materials. J. Biomech. Eng. 129:430-440.
3. Dean, D., L. Han, …, C. Ortiz. 2006. Compressive nanomechanics of opposing aggrecan macromolecules. J. Biomech. 39:2555-2565.
4. Mahaffy, R. E., C. K. Shih, …, J. Kas. 2000. Scanning probe-based frequency-dependent microrheology of polymer gels and biological cells. Phys. Rev. Lett. 85:880-883.
5. Park, S., K. D. Costa, …, K.-S. Hong. 2009. Mechanical properties of bovine articular cartilage under microscale indentation loading from atomic force microscopy. Proc. Inst. Mech. Eng. [H]. 223:339-347.
6. Park, S., K. D. Costa and G. A. Ateshian. 2004. Microscale frictional response of bovine articular cartilage from atomic force microscopy. J. Biomech. 37:1679-1687.
7. Hu, K., P. Radhakrishnan, …, J. J. Mao. 2001. Regional structural and viscoelastic properties of fibrocartilage upon dynamic nanoindentation of the articular condyle. J. Struct. Biol. 136:46-52.
8. Radhakrishnan, P., N. T. Lewis and J. J. Mao. 2004. Zone-specific micromechanical properties of the extracellular matrices of growth plate cartilage. Ann. Biomed. Eng. 32:284-291.
9. Oliver, W. C. and G. M. Pharr. 1992. An improved technique for determining hardness and elastic modulus using load and displacement sensing indentation experiments. J. Mater. Res. 7:1564-1583.
10. Stolz, M., R. Raiteri, …, U. Aebi. 2004. Dynamic elastic modulus of porcine articular cartilage determined at two different levels of tissue organization by indentation-type atomic force microscopy. Biophys. J. 86:3269-3283.
11. Stolz, M., R. Gottardi, …, U. Aebi. 2009. Early detection of aging cartilage and osteoarthritis in mice and patient samples using atomic force microscopy. Nat. Nanotechnol. 4:186-192.
12. Loparic, M., D. Wirz, …, M. Stolz. 2010. Micro- and nanomechanical analysis of articular cartilage by indentation-type atomic force microscopy: validation with a gel-microfiber composite. Biophys. J. 98:2731-2740.
13. Franke, O., K. Durst, …, K. Gelse. 2007. Mechanical properties of hyaline and repair cartilage studied by nanoindentation. Acta Biomaterialia. 3:873-881.
14. Li, C., L. Pruitt and K. B. King. 2006. Nanoindentation differentiates tissue-scale functional properties of native articular cartilage. J. Biomed. Mater. Res. A. 78A:729-738.
15. Ebenstein, D. M., A. Kuo, …, L. Pruitt. 2004. A nanoindentation technique for functional evaluation of cartilage repair tissue. J. Mater. Res. 19:273-281.
16. Gupta, S., J. Lin, …, L. Pruitt. 2009. A fiber reinforced poroelastic model of nanoindentation of porcine costal cartilage: a combined experimental and finite element approach. J. Mech. Behav. Biomed. Mater. 2:326-338.
17. Miller, G. J. and E. F. Morgan. 2010. Use of microindentation to characterize the mechanical properties of articular cartilage: comparison of biphasic material properties across length scales. Osteoarthritis Cartilage. 18:1051-1057.
18. Asif, S. A. S., K. J. Wahl, …, O. L. Warren. 2001. Quantitative imaging of nanoscale mechanical properties using hybrid nanoindentation and force modulation. J. Appl. Phys. 90:1192-1200.
19. Alcaraz, J., L. Buscemi, …, D. Navajas. 2002. Correction of microrheological measurements of soft samtples with atomic force microscopy for the hydrodynamic drag on the cantilever. Langmuir. 18:716-721.