thurston county drainage design and erosion control … · thurston county drainage design and...
TRANSCRIPT

Thurston County Drainage Design and Erosion Control
Manual
Volume III Hydrologic Analysis and Stormwater Conveyance
Prepared by: Thurston County Department of Resource Stewardship
Water Resources Division
December 2016

This page intentionally left blank
THURSTON COUNTY DRAINAGE DESIGN AND EROSION CONTROL MANUAL
December 2016 Volume III – Hydrologic Analysis and Flow Control BMPs i
Table of Contents
Chapter 1 - Introduction to Volume III ....................................................................... 1-1
1.1 What is the Purpose of this Volume? ........................................................................... 1-1 1.2 How This Volume is Organized .................................................................................. 1-2 1.3 How Do I Get Started? ................................................................................................. 1-2
Chapter 2 - Hydrologic Analysis and Design Standards ............................................ 2-1
2.1 Minimum Computational Standards ............................................................................ 2-1 Hydrologic Analysis of LID and Flow Control BMPs .............................................. 2-3 Hydrologic Analysis of Runoff Treatment BMPs ...................................................... 2-4 Hydrologic Analysis of Conveyance Systems ........................................................... 2-4
2.2 Closed Depression Analysis ........................................................................................ 2-5 Analysis and Design Criteria ...................................................................................... 2-5 Closed Depression Located On-Site or with a Legal Right to Discharge to Closed Depression ..................................................................................................... 2-6 Closed Depression Located Off-Site .......................................................................... 2-6
2.3 Site Suitability and Hydrologic Analysis of Infiltration Facilities .............................. 2-7 Infiltration Facilities for Runoff Treatment ............................................................... 2-7 Site Suitability and Analysis Procedures ................................................................... 2-8 Simple Analysis Procedures ..................................................................................... 2-16 Detailed Analysis Procedure .................................................................................... 2-22 Sizing of Infiltration Facilities ................................................................................. 2-26
Chapter 3 - Conveyance Systems and Hydraulic Structures ..................................... 3-1
3.1 Overview ...................................................................................................................... 3-1 3.2 Design Event Storm Frequency ................................................................................... 3-1 3.3 Determination of Design Flows ................................................................................... 3-2 3.4 Open Channel Flow – Hydraulic Analysis .................................................................. 3-2
Uniform Flow Analysis - Manning’s Equation .......................................................... 3-3 Backwater Analysis .................................................................................................... 3-4
3.5 Conveyance System Route Design and Off-Site Drainage .......................................... 3-5 3.6 Easements, Access, and Dedicated Tracts ................................................................... 3-6
Maintenance Access to Stormwater Facilities ........................................................... 3-6 Access to Conveyance Systems ................................................................................. 3-7 Discharge to Private Property .................................................................................... 3-7
3.7 Pipe System Design Criteria ........................................................................................ 3-8 Analysis Methods ....................................................................................................... 3-8 Acceptable Pipe Sizes ................................................................................................ 3-8 Pipe Materials ............................................................................................................. 3-8 Pipe Slope and Velocity ............................................................................................. 3-9 Pipes on Steep Slopes ............................................................................................... 3-10 Pipe System Layout Criteria .................................................................................... 3-10
THURSTON COUNTY DRAINAGE DESIGN AND EROSION CONTROL MANUAL
December 2016 Volume III – Hydrologic Analysis and Flow Control BMPs ii
Pipe Structure Criteria .............................................................................................. 3-11 3.8 Outfalls ....................................................................................................................... 3-19
General Design Criteria for Outfall Features ........................................................... 3-19 3.9 Flow Spreading Options ............................................................................................ 3-27
General Design Criteria ............................................................................................ 3-28 3.10 Culvert Criteria .......................................................................................................... 3-33
Culvert Design Criteria ............................................................................................ 3-33 Fish Passage Criteria ................................................................................................ 3-34
3.11 Open Conveyances..................................................................................................... 3-34 3.12 Private Drainage Systems .......................................................................................... 3-36
Discharge Locations ................................................................................................. 3-36 Drainage Stub-outs ................................................................................................... 3-36
Volume III References................................................................................................ Ref-1
Additional Resources .................................................................................................. Ref-2
Appendix III-A Methods for Determining Design Infiltration Rates ....................... A-1
Simple Method 1 – Field Testing Procedures (In-Situ) .......................................................... A-1 Safety Factor for Field Measurements ...................................................................... A-1 Falling Head Percolation Test Procedure (as Modified for Thurston County) ......... A-3 Washington Department of Ecology Infiltration PIT Method .................................. A-4 Small-Scale Pilot Infiltration Test ............................................................................. A-6
Simple Method 2 – Soil Property Relationships ..................................................................... A-7 USDA Soil Textural Classification ........................................................................... A-7
Method 3 - Soil Grain Size Analysis Method ....................................................................... A-10 Determine the Saturated Hydraulic Conductivity ................................................... A-10 Calculate the Hydraulic Gradient ............................................................................ A-12 Calculate the Infiltration Rate using Darcy’s Law .................................................. A-13 Adjustments to Infiltration Rate .............................................................................. A-13
Appendix III-B Design Aids ......................................................................................... B-1
Single Event Model Guidance .................................................................................................B-1 SBUH or SCS Methods ..............................................................................................B-1 Isopluvial Maps ..........................................................................................................B-1 Time of Concentration ...............................................................................................B-1 Design Storm Hyetographs ........................................................................................B-3
Rational Method ......................................................................................................................B-4
Appendix III-C – Nomographs for Culvert Sizing Needs .......................................... C-1
Appendix III-D – On-site Stormwater Management BMP Infeasibility Criteria ... D-1

THURSTON COUNTY DRAINAGE DESIGN AND EROSION CONTROL MANUAL
December 2016 Volume III – Hydrologic Analysis and Flow Control BMPs iii
Tables Table 2.1 Summary of Applicable Hydrologic Design Methodologies for Design of
Stormwater Best Management Practices in Thurston County ................................ 2-2 Table 2.2 Required Number of Test Pits, Test Holes, and In-Situ Testing Locations for
infiltration Facilities .............................................................................................. 2-18 Table 3.1 Manning’s Roughness Factors for Open Channel Conveyances ................................. 3-4 Table 3.2 Manning’s Roughness Factors for Pipe Conveyances ................................................. 3-4 Table 3.3 Minimum Easement Widths for Conveyance Systems for Access, Inspection and
Maintenance ............................................................................................................ 3-7 Table 3.4 Maximum Pipe Slopes and Velocities ......................................................................... 3-9 Table 3.5 Maximum Surface Runs Between Inlet Structures on the Paved Roadway Surface
in Thurston County ............................................................................................... 3-12 Table 3.6 Allowable Structure and Pipe Sizes ........................................................................... 3-15 Table 3.7 Channel Protection ..................................................................................................... 3-35 Table A.1. Recommended Infiltration Rates based on USDA Soil Textural Classification ... A-8 Table A.3. Infiltration Rate Reduction Factors to Account for Biofouling and Siltation
Effects for Ponds (Massmann, 2003) ................................................................... A-13 Table B.2. "n" and "k" Values Used in Time Calculations for Hydrographs .........................B-12 Table B.3. Values of the Roughness Coefficient, "n" ............................................................B-13 Table B.4. Runoff Curve Numbers for Selected Agricultural, Suburban, and Urban Areas .B-14 Table B.5. Major Soil Groups in Thurston County ................................................................B-15 Table B.6. Runoff Coefficients for Rational Method Calculations. .......................................B-16 Table B.7. Regression Coefficients for Rational Method Calculations. ................................B-17 Table B.8. SCS Type IA Storm Rainfall Distribution, 6-minute intervals. ............................B-18
Figures Figure 2.1 Infiltration Analysis and Sizing Flow Chart ............................................................... 2-9 Figure 2.2 Engineering Design Steps for Final Design of Infiltration Facilities Using the
Detailed Method (from Ecology [2012]) .............................................................. 2-23 Figure 3.1 Asphalt Inlet Berm ................................................................................................... 3-13 Figure 3.2 Recessed Curb Inlet (From Pierce County Standard Plan 10.0) .............................. 3-14 Figure 3.3 Flow Splitter, Option A. (Source, King County Surface Water Design Manual) .... 3-16 Figure 3.4 Flow Splitter, Option B. (Source, King County Surface Water Design Manual) .... 3-17 Figure 3.5 Pipe/Culvert Outfall Discharge Protection ............................................................... 3-23 Figure 3.6 Flow Dispersal Trench ............................................................................................. 3-24 Figure 3.7 Alternative Flow Dispersal Trench .......................................................................... 3-25 Figure 3.8 Gabion Outfall Detail ............................................................................................... 3-26 Figure 3.9. Diffuser TEE (an example of energy dissipating end feature) ................................ 3-27 Figure A-1. USDA Textural Triangle. ...................................................................................... A-9 Western Washington Isopluvial 2-year, 24-hour ........................................................................ A-6 Western Washington Isopluvial 5-year, 24-hour ........................................................................ A-7 Western Washington Isopluvial 10-year, 24-hour ...................................................................... A-8 Western Washington Isopluvial 25-year, 24-hour ...................................................................... A-9 Western Washington Isopluvial 50-year, 24-hour .................................................................... A-10 Western Washington Isopluvial 100-year, 24-hour .................................................................. A-11 Figure C.1. Headwater Depth for Smooth Interior Pipe Culverts with Inlet Control. ...............C-1

THURSTON COUNTY DRAINAGE DESIGN AND EROSION CONTROL MANUAL
December 2016 Volume III – Hydrologic Analysis and Flow Control BMPs iv
Figure C.2. Headwater Depth for Corrugated Pipe Culverts with Inlet Control. ......................C-2 Figure C.3. Critical Depth of Flow for Circular Culverts. .........................................................C-3 Figure C.4. Circular Channel Ratios. .........................................................................................C-4

December 2016 Volume III – Hydrologic Analysis and Flow Control BMPs 1-1
Chapter 1 - Introduction to Volume III 1.1 What is the Purpose of this Volume?
This volume of the Drainage Design and Erosion Control Manual describes hydrologic analysis techniques and general design criteria for flow control and water quality Best Management Practices (BMPs). Design details and requirements for specific flow control and water quality BMPs are provided in Volume V. This volume also includes hydrologic analysis techniques, design criteria and specifications for stormwater conveyance systems including pipes, open channels, outfalls and other stormwater conveyance structures.
This volume is intended to prescribe approved methods and requirements for calculating infiltration rates, runoff flow volumes and rates to be used in sizing water quality treatment and flow control BMPs to minimize or eliminate impacts on downstream properties and natural resources. The County recognizes that it is not always possible to fully prevent any downstream impacts; in these cases, the County may require the project to provide off-site mitigation.
These regulations and criteria are based on fundamental principles of drainage, hydraulics, and hydrology, environmental considerations, and publications, manuals, and texts accepted by the professional engineering community. The project design engineer is responsible for being knowledgeable of and proficient with necessary design methodologies identified in this manual. The following is a partial list of publications which may be used as reference documents:
• The Washington State Department of Ecology Stormwater Management Manual For Western Washington
• Any Washington State Department of Ecology Approved Stormwater Management Manual, such as one produced by an NPDES Phase I community
• The Low Impact Development Technical Guidance Manual for Puget Sound (Washington State University Extension and the Puget Sound Partnership)
• Washington State Department of Transportation Highway Runoff Manual.
• Applied Handbook of Hydrology, by V.T. Chow
• Handbook of Hydraulics, by E.G. Brater and H.W. King
• Washington State Department of Transportation Hydraulics Manual
• Soil Survey of Thurston County, Washington, published by the Natural Resource Conservation Service, U.S. Department of Agriculture
• Washington State Department of Transportation Standard Plans for Road, Bridge and Municipal Construction
• Thurston County Road Standards, or the latest amendment
The most current edition of all publications shall be used.

December 2016 Volume III – Hydrologic Analysis and Flow Control BMPs 1-2
1.2 How This Volume is Organized
Volume III is organized into three chapters and three appendices:
• Chapter 1: Introduction
• Chapter 2: Hydrologic design standards and acceptable analysis methods, including the use of hydrograph methods for BMP design, an overview of computerized modeling methods, analysis of closed depressions, and evaluation of the feasibility and sizing of infiltration facilities.
• Chapter 3: Natural and constructed conveyance systems and acceptable analysis methods. This chapter also discusses hydraulic structures linking conveyance systems to runoff treatment and flow control facilities.
• Appendix A: Infiltration testing procedures. This appendix also includes the USDA soil textural triangle, used for alternative methods of determining infiltration rates.
• Appendix B: SBUH/SCS computer models and charts and tables useful in designing conveyance systems with event-based hydrologic models. This includes: design storm rainfall totals, isopluvial maps for western Washington, common Thurston County Soil types, and hydrologic groupings, SCS curve numbers, and hydraulic roughness coefficients.
• Appendix C: Nomographs useful for culvert sizing.
• Appendix D: summarizes the feasibility criteria that can be used to determine if various on-site stormwater management BMPs in the List #1 or List #2 option of Core Requirement #5 can or cannot be used on the site. This information is also presented under the description of each BMP, but is summarized in Appendix D as a quick reference point.
1.3 How Do I Get Started?
First, consult Chapter 2 of Volume I to determine which Core Requirements apply to your project and to select BMPs. After determining the Core Requirements for your project and selecting BMPs, use Volume III (this volume) to determine the methods of estimating design volume or flow rates for those BMPs. Design guidelines for stormwater BMPs are included in Volume V. These facilities can then be included in any required stormwater submittals (see Volume I, Chapter 3). Chapter 3 of this volume also includes information on the design of stormwater conveyance systems.
December 2016 Volume III – Hydrologic Analysis and Flow Control BMPs 2-1
Chapter 2 - Hydrologic Analysis and Design Standards Hydrology is the study of the source, properties, distribution, and laws of water as it moves through its closed cycle (the hydrologic cycle). In this manual, however, the term “hydrologic analysis” addresses and quantifies only a small portion of this cycle, the relatively short-term movement of water over land resulting from precipitation, called surface water or stormwater runoff. Localized and long-term ground water movement is also a concern for successful stormwater management, but only as this relates to the movement of water on or near the surface, such as stream base flow or shallow groundwater effects on stormwater infiltration systems.
This chapter defines the minimum computational standards for conducting hydrologic analysis and how to apply these standards. It also explains the hydrologic design process, including flow routing through on-site stormwater management facilities.
Due to the relationship between stormwater runoff quantity (both flow and volume) and quality, it is critical to consider runoff treatment when designing for flow control and vice versa. Runoff treatment and flow control goals can often be accomplished in one facility. For example, wet ponds can be designed to provide both runoff treatment and flow control by providing for live storage volume above the permanent pool.
Site planning and layout play an important role in the amount of stormwater runoff generated by a project site. Reductions in impervious areas result in smaller runoff treatment and flow control facilities, thereby reducing stormwater management costs. Low Impact Development (LID) directly addresses this idea by limiting runoff and creating more aesthetically appealing sites. LID is discussed in Chapter 2 of Volume V.
Some of the things that must be considered during site planning and layout include: minimizing creating hard and impervious surfaces, clustering buildings and preserving larger areas of open space, minimizing directly connected hard and impervious areas (try to separate impervious surfaces with areas of turf, or other vegetation or gravel), incorporation of low maintenance landscaping that doesn't need frequent applications of fertilizers, herbicides and pesticides and minimizing the impact area and soil compaction during construction.
2.1 Minimum Computational Standards
Minimum computational standards depend on the type of information required and the size of the drainage area to be analyzed, as follows:
When designing runoff treatment and flow control BMPs, use a continuous simulation hydrologic model based on the EPA’s Hydrologic Simulation Program-Fortran (HSPF) program (i.e., Ecology’s Western Washington Hydrology Model (WWHM) or WSDOT’s MGS Flood model) to calculate runoff and determine flow rates and volumes. Continuous models simulate rainfall and runoff over a long period of time, usually years, encompassing many storm events. Additional design standards applicable for selection and sizing of specific runoff treatment and flow control BMPs are found in Volume V.

December 2016 Volume III – Hydrologic Analysis and Flow Control BMPs 2-2
• For conveyance system design, the designer may use a single event hydrologic model, a continuous simulation model, or the Rational Method to determine peak flow rate. For conveyance facilities that are also designed as water quality or flow control BMPs a continuous simulation runoff model shall be used to design the facility to meet the water quality or flow control requirements and the methodologies of this chapter shall be used to design the same facility for conveyance of stormwater. A single event hydrologic model may be used to determine the peak flow rate. The peak flow rate from a continuous runoff model will vary depending on the time step used in the model. Therefore, the length of the time step must be sufficiently short relative to the time of concentration of the watershed to provide for reasonable conveyance system design flows. For most situations in Thurston County, a 15-minute (maximum) time step will be sufficient for conveyance system design. If the project is in a predominantly urbanized watershed with a time of concentration less than about 15 minutes (roughly 10 acres in size), the conveyance design must either use a 5-minute time step (if available), or use an event-based model for conveyance sizing.
Conveyance design is discussed in detail in Chapter 3 of this Volume.
Circumstances where different methodologies apply are summarized in Table 2.1 Summary of Applicable Hydrologic Design Methodologies for Design of Stormwater Best Management Practices in Thurston County Table 2.1 below.
Table 2.1 Summary of Applicable Hydrologic Design Methodologies for Design of Stormwater Best Management Practices in Thurston County
Method Runoff
Treatment Flow Control Conveyance
Continuous Runoff Models: (WWHM or MGS Flood)
Method applies to all BMPs
Method applies to all BMPs
Method applies with appropriate time step based on time of concentration
SCSUH/SBUH (Soil Conservation Service Unit Hydrograph/Santa Barbara Urban Hydrograph)
Not Applicablea Not Applicable Method applies
Rational Method Not Applicable Not Applicable Method applies for some conveyance design
a can be used for biofiltration BMPs (BF.01 – BF.05) By default, the Department of Ecology’s WWHM uses rainfall/runoff relationships originally developed for specific basins in the Puget Sound region for all parts of western Washington. These default parameters may be replaced with basin-specific rainfall/runoff data established by extensive field monitoring approved by the County where such data will improve the model’s accuracy.
Free WWHM 2012 software and documentation can be found at the Department of Ecology website: http://www.ecy.wa.gov/programs/wq/stormwater/wwhmtraining/index.html.
A professional version of WWHM with expanded capabilities can be purchased from Clear Creek Solutions, Inc. at http://www.clearcreeksolutions.com/.
December 2016 Volume III – Hydrologic Analysis and Flow Control BMPs 2-3
Use of continuous simulation runoff models other than WWHM 2012 or MGS Flood must be approved by the County before being used as a computational standard.
For large, master-planned developments, the County may require a basin-specific calibration of HSPF rather than default parameters. Basin-specific calibrations may be required for projects that encompass more than 320 acres.
Hydrologic Analysis of LID and Flow Control BMPs
There are three flow-related standards stated in Volume I of this manual: Core Requirement #5: On-site Stormwater Management; Core Requirement #7: Flow Control; and Core Requirement #8: Wetlands Protection.
The LID performance and flow control standards (Core Requirements #5 and #7) must be met using an approved continuous runoff model. Core Requirement #5 allows the user to demonstrate compliance with the LID Performance Standard of matching developed discharge durations to pre-developed durations for the range of pre-developed discharge rates from 8 percent of the 2-year peak flow to 50 percent of the 2-year peak flow. If the post development duration values exceed any of the predevelopment flow levels between 8 percent and 50 percent of the 2-year predevelopment peak flow values, then the LID performance standard has not been met.1
The standard flow control requirement is summarized below:
• Stormwater discharges shall match developed discharge durations to pre-developed durations for the range of pre-developed discharge rates from 50 percent of the 2-year peak flow up to the full 50-year peak flow. The pre-developed condition to be matched shall be a forested land cover unless:
o Reasonable, historic information is available that indicates the site was prairie prior to settlement (modeled as “pasture” in the Western Washington Hydrology Model); or
Core Requirement #8 specifies that total discharge to a wetland must not deviate by more than 20 percent on a single event basis, and must not deviate by more than 15 percent on a monthly basis. Flow components feeding the wetland under both pre- and post-development scenarios are assumed to be the sum of the surface, interflow, and groundwater flows from the project site. Ecology has added the capability to model flows to wetlands and analyze the daily and monthly flow deviations (per these requirements) to WWHM2012.
See the documentation for WWHM (or alternate model) for instructions on how to use the model to meet these standards.
If off-site drainage combines with site runoff, these off-site flows must be included in the flow control BMP sizing analysis. See Chapter 3 for conveyance requirements for off-site drainage.
1Core Requirement #5 can be met by using the menu of BMPs as outlined in Volume I, Section 2.4.6 or the LID Performance Standard.
December 2016 Volume III – Hydrologic Analysis and Flow Control BMPs 2-4
Hydrologic Analysis of Runoff Treatment BMPs
Water Quality Design Storm Volume
The 91st percentile, 24-hour runoff volume estimated by an approved continuous runoff model shall be used as the water quality design storm volume.
Water Quality Design Flow Rate
Downstream of detention facilities: The full 2-year recurrence interval release rate from a detention facility (using an approved continuous runoff model) designed to meet the flow duration standard shall be used as the design flow rate.
Preceding detention facilities or when detention facilities are not required: The flow rate at or below which 91 percent of the runoff volume, as estimated by an approved continuous runoff model, is routed through the treatment facility shall be used as the design flow rate. The 91 percent volume for treatment facilities is designed to achieve the applicable performance goal at the water quality design flow rate (e.g., 80 percent total suspended solids removal).
• Offline facilities: When runoff flow rates exceed the water quality design flow rate and treatment facilities are not preceded by an equalization or storage basin, the treatment facility should continue to receive and treat the water quality design flow rate to the applicable treatment performance goal. Only the portion of flow rates that exceed the water quality design flow may be bypassed around a treatment facility.
Treatment facilities preceded by an equalization or storage basin may identify a lower water quality design flow rate provided that at least 91 percent of the estimated runoff volume in the time series of an approved continuous runoff model is treated to the applicable performance goals (e.g., 80 percent total suspended solids removal at the water quality design flow rate and 80 percent total suspended solids removal on an annual average basis).
• Online facilities: Runoff flow rates in excess of the water quality design flow rate can be routed through the facility provided a net pollutant reduction is maintained.
Treatment facilities that are located downstream of detention facilities shall only be designed as on-line facilities.
Hydrologic Analysis of Conveyance Systems
For design of storm drainage conveyance systems, several design storms may have to be used to adequately assess the project and any downstream impact. The design of conveyance systems can be performed using the flow rates generated by an approved continuous simulation model per Section 2.1 or by one of two other methods, either the single event hydrograph method (SCS, SBUH) or the Rational Method (for small projects).

December 2016 Volume III – Hydrologic Analysis and Flow Control BMPs 2-5
Single Event Storms – Hydrograph
Hydrograph analysis uses a plot of runoff flow versus time for a given single design storm event, allowing the key runoff characteristics like peak discharge, volume, and timing to be considered in drainage facility design. All storm event hydrograph methods require parameters that describe physical drainage basin characteristics. These parameters provide the basis of development of the runoff hydrograph. Because single event methods are only used in this manual to size conveyance systems and flow-through treatment facilities (biofiltration swales), discussion of design storms, curve numbers and peak runoff calculation is limited (see Appendix III-B).
For conveyance design, the preferred single event method is the Santa Barbara Urban Hydrograph Method or, if unavailable, the SCS Unit Hydrograph Method.
Rational Method
The rational method is a simple method used to estimate peak flows, and may be used for conveyance sizing on sites 25 acres or less in size, and having a time of concentration of less than 100 minutes. See Appendix III-B for details on the method.
2.2 Closed Depression Analysis
Closed depressions (potholes, kettles) represent a “dead end” for surface water flows and generally facilitate infiltration of runoff. If a closed depression is classified as a wetland or the discharge path flows through a wetland, then Core Requirement #8 for wetlands applies. If there is an outflow from this depression to a surface water (such as a creek), then the flow must also meet Core Requirement #7 for flow control.
A calibrated continuous simulation runoff model must be used for closed depression analysis and design of mitigation facilities. If a closed depression is not classified as a wetland, model the ponding area at the bottom of the closed depression as an infiltration pond using WWHM or an approved continuous runoff model.
Analysis and Design Criteria
The infiltration rates used in the analysis of closed depressions must be determined according to the procedures of Section 2.3. For closed depressions containing standing water, soil texture tests must be performed on dry land adjacent to, and on opposite sides of the standing water (as practicable). The elevation of the testing surface at the bottom of the test pit must be one foot above the standing water elevation. A minimum of four tests must be performed to estimate an average surface infiltration rate.
The criteria which must be met for discharge to a closed depression depend upon the location, whether the proponent has control of, or a right to discharge to the closed depression and the results of a hydrologic analysis of the closed depression.
December 2016 Volume III – Hydrologic Analysis and Flow Control BMPs 2-6
Closed Depression Located On-Site or with a Legal Right to Discharge to Closed Depression
For a closed depression entirely on the subject property, or a closed depression to which the Proponent has acquired a legal right to discharge, analyze the closed depression using hydrologic methods described in Section 2.1. Infiltration must be addressed where appropriate. In assessing the impacts of the proposed project on the performance of the closed depression, there are two cases that dictate different approaches to meeting Core Requirement #7 – Flow Control.
Case 1
The 100-year recurrence interval storm runoff from an approved continuous simulation program, flowing from the TDA to the closed depression, is routed into the closed depression using only infiltration as outflow. If predevelopment runoff does not overflow the closed depression, then no runoff may leave the closed depression at the 100-year recurrence interval storm runoff following development of the proposed project. This may be accomplished by excavating additional storage volume in the closed depression, subject to all applicable requirements (for example, providing a defined overflow system).
Case 2
The 100-year recurrence interval storm runoff from an approved continuous simulation program, from the TDA to the closed depression, is routed into the closed depression using only infiltration as outflow, and overflow occurs in both the existing and the proposed conditions. The closed depression must then be analyzed as a detention/infiltration pond. The required performance, therefore, is to meet the runoff duration standard specified in Core Requirement 7 – Flow Control, using an adequately calibrated continuous simulation model. This will require a control structure, emergency overflow spillway, access road, and other design criteria and may require excavating additional storage volume in the closed depression. Also depending on who will maintain the system, it will require placing the closed depression in a tract dedicated to the responsible party.
Closed Depression Located Off-Site
For a closed depression shared with, or entirely on other properties, absent a legal agreement to the contrary, the peak water elevation for the 100-year recurrence interval storm runoff from an approved continuous simulation program, from the Threshold Discharge Area to the closed depression shall not cause an increase in water levels exceeding:
o 0.1 feet above the base, if available information indicates that the base is to be dry at all times, or
o 0.1 feet above the current peak water elevation, if this elevation can be clearly demonstrated.
In all cases, discharge to a closed depression shall be allowed only if the Project Engineer can satisfactorily demonstrate that no significant public health, safety, welfare, or property damage issues are present.

December 2016 Volume III – Hydrologic Analysis and Flow Control BMPs 2-7
2.3 Site Suitability and Hydrologic Analysis of Infiltration Facilities
Infiltration is the percolation of surface water into the ground, and is an effective way to meet the flow control requirements of Core Requirement #7. While other flow control facilities, such as detention ponds, just reduce peak flow rates associated with developed areas, infiltration facilities reduce the total volume of surface runoff as well as peak flow rates. When properly sited and designed, infiltration facilities can help recharge groundwater and protect downstream receiving waters. In some cases, infiltration facilities can be used to meet the runoff treatment requirements of Core Requirement #6 also (see Section 2.3.1 below).
Infiltration Facilities for Runoff Treatment
Infiltration facilities can be designed for runoff treatment within Thurston County. The soil texture and design infiltration rates should be considered along with the physical and chemical characteristics specified below to determine if the soil is adequate for removing the target pollutants.
• Measured (initial) soil infiltration rate should be 9 inches per hour, or less. This infiltration rate is also typical for soil textures that possess sufficient physical and chemical properties for adequate treatment, particularly for soluble pollutant removal. It is comparable to the textures represented by Hydrologic Group B and C. Design (long-term) infiltration rates up to 3.0 inches per hour can also be used with approval by Thurston County, if the infiltration receptor is not a sole-source aquifer, and in the judgment of the site professional, the treatment soil has characteristics comparable to those considered suitable for treatment (see description later in this section) to control target pollutants.
• Cation exchange capacity (CEC) of the treatment soil must be ≥5 milliequivalents CEC/100 g dry soil (USEPA Method 9081). Consider empirical testing of soil sorption capacity, if practicable. Ensure that soil CEC is sufficient for expected pollutant loadings, particularly heavy metals. CEC values of >5 meq/100g are expected in loamy sands, according to Rawls et al. Lower CEC content may be considered if it is based on a soil loading capacity determination for the target pollutants that is accepted by Thurston County.
• Depth of suitable treatment soil used for infiltration treatment must be a minimum of 18 inches. If native soils cannot meet the treatment criteria of this section, soils may be amended or an engineered soil (minimum depth of 18 inches) may be used. See BMP LID.08 Bioretention in Volume V for an acceptable engineered soil for runoff treatment.
• Organic content of the treatment soil (ASTM D 2974): Organic matter can increase the sorptive capacity of the soil for many pollutants. The site professional shall evaluate whether the organic matter content is sufficient for control of the target pollutant(s). A minimum organic content of 1.0% is necessary.

December 2016 Volume III – Hydrologic Analysis and Flow Control BMPs 2-8
• Waste fill materials shall not be used as infiltration soil media nor should such media be placed over uncontrolled or non-engineered fill soils.
• Engineered soils may be used to meet infiltration BMP design criteria in Volume V and the performance goals in Core Requirement #6 (Runoff Treatment; Volume I). BMP LID.08 Bioretention provides an acceptable engineered soil specification for runoff treatment. Use of alternate engineered soils must be accepted by the County, and requires field performance evaluation(s), using acceptable protocols, to determine effectiveness, feasibility, and acceptability.
Also note that although infiltration is one of the preferred methods for disposing of excess stormwater, and may be required to meet Core Requirement #7 – Flow Control, infiltration may be regulated by the Department of Ecology and the Underground Injection Control (UIC) Program (WAC 173-218) if an injection device, such as a dry well or trench with distribution pipe is used. Additional information and requirements on UIC and how it applies to infiltration and stormwater management is included in Volume V, Section 3.1.3.
Site Suitability and Analysis Procedures
The following procedures must be followed when considering and designing an infiltration facility. Each step is outlined in more detail in the subsequent sections. Figure 2.1 illustrates the process of analyzing and sizing infiltration facilities.
Step 1 – Conduct general site reconnaissance, and review survey and other information to identify existing drinking water wells or aquifers, designated well head protection areas for public water systems, existing and proposed buildings, steep slopes, and septic systems in the vicinity of the proposed facility.
Step 2 – Evaluate Core Requirements for infiltration facilities to determine whether infiltration is feasible for the site.
Step 3 – Infiltration Receptor Characterization. Estimate depth to groundwater from the bottom of proposed infiltration facility. If estimated depth to groundwater is less than 50 feet, installation of groundwater monitoring wells and characterization of the infiltration receptor will be required. If less than 6 feet to groundwater, then a mounding analysis will be required.
Step 4 – Determine whether the simple or detailed method of analysis will be used to establish a design infiltration rate. Consultation with Thurston County is required at this stage to obtain acceptance of the proposed method of analysis (simple or detailed).
Step 5 – Complete simple analysis or detailed analysis, as determined in Step 4 and described in Sections 2.3.3 and 2.3.5. Prepare geotechnical report.

December 2016 Volume III – Hydrologic Analysis and Flow Control BMPs 2-9
Figure 2.1 Infiltration Analysis and Sizing Flow Chart
December 2016 Volume III – Hydrologic Analysis and Flow Control BMPs 2-10
Details of these five steps are provided in the sections below.
Step 1: General Surface Characterization
The first step in designing an infiltration facility is to select a location and assess the site’s suitability. The information to be reviewed as part of this initial site characterization varies by site, but may include:
• Topography within 500 feet of the proposed facility
• Anticipated site use (street/highway, residential, commercial, high-use site)
• Location of water supply wells within 500 feet of proposed facility
• Location of project relative to any designated well head protection areas for public water systems and/or 1-, 5-, and 10-year time of travel zones for municipal well protection areas2. (Enhanced treatment required prior to infiltration if located within a designated WHPA). Location of steep slopes (>15%) or landslide hazard areas
• Location of septic systems in the vicinity of the proposed facility
• A description of local site geology, including soil or rock units likely to be encountered, the groundwater regime, and geologic history of the site.
• Analysis of site borings and soil testing and review of any available existing soils information for the site or adjacent sites.
• Analyze any existing runoff flowing into and out of the site. Speculate on possible flows generated by greater than the 100-year event. Check the proximity of other stormwater facilities on adjacent properties.
• Location of any high groundwater hazard areas or wetlands per the Thurston County Critical Areas Ordinance, TCC Title 17 and Title 24.
This information, along with additional geotechnical information necessary to design the facility, shall be summarized in the geotechnical report prepared in Step 5.
Step 2: Evaluate Core Requirements for Infiltration Facilities
Infiltration is not permitted unless all of the Depth to Seasonal High Groundwater and Setbacks criteria below are met. Note: not all sites that meet the following criteria will be suitable for infiltration – these are Core Requirements only.
2 Infiltration facilities of drinking water supplies and within 1, 5, and 10-year time of travel zones must comply with Health Dept. requirements (Washington State Wellhead Protection Program Guidance Document, DOH, 6/2010).

December 2016 Volume III – Hydrologic Analysis and Flow Control BMPs 2-11
Depth to Seasonal High Groundwater
The base of all infiltration basins or trench systems shall be a minimum of 3 feet above seasonal high groundwater levels, bedrock (or hardpan), or any other low permeability layer. Small bioretention (BMP LID.08) facilities with less than 10,000 square feet of impervious area contributing to the facility may be designed with a reduced vertical separation of 1 foot minimum.
Seasonal high groundwater level is the upper level at which the groundwater table normally is located during the season of the year when such levels are at their highest (typically December 1 through April 30). This level is determined using a test pit (reviewed by a soil analyst for soil color patterns in the soil profile) or using groundwater monitoring data gathered through a minimum of one wet period (December through April). See Step 3 for additional criteria related to groundwater depth.
Setbacks
Infiltration basins may not be constructed within a floodplain area or high groundwater flood hazard area as defined in Thurston County Code, Title 17 and Title 24. Additional setbacks are summarized in Appendix V-E.
Step 3: Infiltration Receptor Characterization
An Infiltration receptor characterization consists of monitoring and analysis of groundwater, and (in some cases) a mounding analysis. This characterization must be conducted if any of the following conditions are present:
• Proposed facility would pose a risk of flooding or property damage if failure were to occur.
• Separation between base of facility and seasonal high groundwater is less than 50 feet AND tributary drainage area contains more than 15,000 square feet impervious surface or ¾ acre total area.
• Separation between base of facility and seasonal high groundwater is less than 50 feet AND on-site soils may not have adequate infiltration capacity (Hydrologic Soil Group C or D [till soils]).
• Separation between base of facility and seasonal high groundwater is less than 50 feet AND there is less than 2 times the minimum setback to a critical area, drainfield, or steep slope (>15%).
In addition, mounding analysis must be conducted if BOTH of the following conditions are present:
• Separation between base of facility and seasonal high groundwater is less than 15 feet, AND
December 2016 Volume III – Hydrologic Analysis and Flow Control BMPs 2-12
• Tributary drainage area is greater than 3/4 acre or there is greater than 15,000 square feet of impervious surface contributing to the facility.
A mounding analysis may also be required by the Administrator for conditions other than those listed above if any of the following conditions are present:
• Hydrologic Soil Group C or D soils with an estimated infiltration rate of less than 0.5 inches/hour.
• The potential impact to downstream properties and/or critical areas is high as a result of a facility failure.
• Urban environment (> 4 units per acre).
• Facility is within 100-feet of a steep slope (>15%) with soils having less than a 1 inch/hour infiltration rate.
• When soils work indicates there may be a perched low permeability layer above the water table.
An exemption from the mounding analysis may be granted if the geotechnical professional can demonstrate to the satisfaction of the Administrator that it is not necessary. This demonstration shall be based on site specific information that in the judgment of the geotechnical professional mitigates against the requirement to conduct a mounding analysis. Examples of circumstances that the Administrator will consider in granting an exemption include:
• Soils are classified as outwash with an estimated design infiltration rate of greater than 5 in/hr.
• Soils are uniform and easily characterized as outwash. Risk of low permeability lenses is low.
• Site topography, etc. indicates no substantial risk to slopes, wetlands, structures etc. in the event groundwater breaches the surface.
• Other studies of groundwater mounding for the same or adjacent sites indicate that mounding would not be a concern.
If it is determined that an Infiltration Receptor Characterization is not required for a project, continue to Step 4.
Monitor Groundwater Levels
A minimum of three groundwater monitoring wells shall be installed per infiltration facility that will establish a three-dimensional relationship for the groundwater table. Seasonal groundwater levels must be monitored at the site through at least one wet season (December 1 through April 30). Where longer term groundwater monitoring information is available, normalize the single wet season observations to historic groundwater records in the region.
December 2016 Volume III – Hydrologic Analysis and Flow Control BMPs 2-13
Monitoring wells shall be installed and monitored in accordance with the following requirements:
• Well shall be screened across the water table.
• Maximum screen and sand pack length of 15 feet.
• Weekly water level monitoring resulting in a minimum of 16 measurements over 4 months.
Document Characterization
A geotechnical report will be developed in Step 5. This report shall include the following information to characterize the infiltration receptor (unsaturated and saturated soil receiving the stormwater):
• Depth to groundwater and to bedrock/impermeable layers.
• Seasonal variation of groundwater table based on well water levels and observed mottling of soils. Provide an estimated seasonal high groundwater level and an estimated maximum high groundwater level taking into account historical and seasonal groundwater table fluctuations.
• Existing groundwater flow direction and gradient
• Volumetric water holding capacity of the infiltration receptor soils. The volumetric water holding capacity is the storage volume in the soil layer directly below the infiltration facility and above the seasonal high groundwater mark, bedrock, hardpan, or other low permeability layer.
• Consider the potential for both unconfined and confined aquifers, or confining units, at the site that may influence the proposed infiltration facility as well as the groundwater gradient.
• Determine ambient ground water quality, if that is a concern.
• Horizontal hydraulic conductivity of the saturated zone to assess the aquifer’s ability to laterally transport the infiltrated water
• Approximation of the lateral extent of infiltration receptor
• Impact of the infiltration rate and proposed added volume from the project site on local groundwater mounding, flow direction, and water table; and the discharge point or area of the infiltrating water determined by hydrogeologic methods.
• Location of the project within the Salmon Creek Basin requires specific groundwater characterization elements be met and reference to the Salmon Creek

December 2016 Volume III – Hydrologic Analysis and Flow Control BMPs 2-14
Basin Plan and Interim Site Development Standards for New Development in Salmon Creek Basin should be referred to for specific requirements.
• State whether location is suitable for infiltration and recommend a method for estimating the design infiltration rate (simple or detailed, in-situ or gradation based).
Mounding Analysis
If a mounding analysis is required, the geotechnical professional shall develop an approach and obtain its acceptance from Thurston County prior to initiating the study. Simple, conservative methods of estimating groundwater mounding are available and may be acceptable with the use of conservative parameters to demonstrate that risks from groundwater mounding are acceptable. The methodology, approach, software program, input data, calibration requirements and output format for the mounding analysis shall be proposed by the geotechnical professional in the geotechnical report for acceptance by Thurston County.
The purpose of the mounding analysis is to identify the impact of groundwater mounding on the estimated design infiltration rate, the seasonal high groundwater elevation at the property boundary and at any on-site or off-site structures, critical areas, or other site features that might be impacted by groundwater mounding.
The results of the mounding analysis will be reported by the geotechnical professional as part of the Infiltration Receptor Characterization and shall include the following determinations:
• A minimum separation of at least 3-feet to seasonal high groundwater will be maintained from the bottom of the facility with mounding.
• There will be no breakout of groundwater to the surface in the vicinity of the project as a result of mounding.
• That a minimum separation to groundwater from the estimated lowest elevation of any basement, building foundation, road, or other structure will be at least 3-feet.
• That there will be no intrusion of the groundwater mound into any existing or proposed drainfield or reserve area and that there will be no greater than a 6-inch increase in groundwater elevation beneath any septic drainfield or reserve area as a result of groundwater mounding.
• That the increase in groundwater elevation at the property boundaries of the project will not result in impacts to adjacent property owners. Generally demonstrating that the increase in groundwater level at the property boundary is less than 1-foot due to mounding would meet this criterion unless there are special circumstances.
December 2016 Volume III – Hydrologic Analysis and Flow Control BMPs 2-15
Step 4: Determine Method of Analysis
Thurston County requires consideration of infiltration facilities for sites where conditions are appropriate. Some sites may not be appropriate for infiltration due to soil characteristics, groundwater levels, steep slopes, or other constraints.
The design infiltration rate for a proposed infiltration facility shall be calculated based on either the Simple Method or Detailed Method as described in this section.
Simple Method
The Simple Method was derived from high ground water and shallow pond sites in western Washington, and in general will produce conservative designs. The Simple Method (Section 2.3.3) should be considered a suitable method of calculating design infiltration rates in the following circumstances:
• When determining the trial geometry of the infiltration facility,
• For small or low impact facilities
• For facilities where a more conservative design is acceptable.
• High infiltration capacity soils (NRCS [SCS] soil types A or B)
• For small facilities serving short plats or commercial developments with less than one acre of contributing area
• Where other infiltration facilities are performing successfully at nearby locations
• Low risk of flooding and property damage in the event of clogging or other failure of the infiltration system
Where the combination of depth to ground water/low permeability layer and soil type results in the possibility of groundwater mounding effects the Simple Method should not be applied. The suitability of the Simple Method should be discussed in the geotechnical report.
Detailed Method
The detailed method of analysis is more suitable when it is unclear if a site is well-suited to infiltration and in cases where failure of an infiltration facility would create a high risk of flooding and/or property damage. The detailed method of analysis, described in Section 2.3.4, includes more intensive field testing and soils investigation and analyses than the Simple Method and takes into account the depth to groundwater. Sites that have ANY of the following conditions should be considered for use of the detailed method:
• Low infiltration capacity soils (NRCS [SCS] soil types C or D)
• History of unsuccessful infiltration facility performance, or no history of successful infiltration performance at nearby locations

December 2016 Volume III – Hydrologic Analysis and Flow Control BMPs 2-16
• A large contributing drainage area (greater than 1-acre)
• Shallow groundwater levels (Less than 50 feet to seasonal high groundwater)
• High risk of flooding and property damage in the event of clogging or other failure.
The County may allow the Simple Method in circumstances that might warrant the detailed method if it is demonstrated that the infiltration facility could be converted to a detention facility of adequate size if the infiltration facility were to fail.
Step 5: Conduct Simple or Detailed Analysis
Based on the results of Step 3 and 4, conduct a simple analysis (Section 2.3.3), or a detailed analysis (Section 2.3.4).
Simple Analysis Procedures
All proposed infiltration projects must evaluate soils, determine the design infiltration rate, prepare a geotechnical report, and estimate the volume of stormwater to be infiltrated.
The Simple Method of calculating a design infiltration rates includes several alternative methods as follows:
• Field Testing by In-Situ Methods (must incorporate safety factors) including:
o Split Double Ring Infiltrometer
o Ecology Pilot Infiltration Test (PIT)
o Single Ring Falling Head Infiltration Method (US EPA 1980) as Modified by Thurston County.
• USDA Soil Textural Classification
• ASTM Gradation Testing
Soil Testing
Test holes or test pits must be dug according to the following guidelines (see Table 2.2):
• Test hole or test pit explorations shall be conducted during mid to late in the wet season (with the wet season defined as December 1 through April 30).
• Collect representative samples from each soil type and/or unit to a depth of 6 feet below the proposed base of the infiltration facility or 2.5 times the estimated depth of the infiltration pond, whichever is greater. See Table 2.2 for required number of test pits or test holes by facility type.

December 2016 Volume III – Hydrologic Analysis and Flow Control BMPs 2-17
• Soil characterization for each soil unit (soils of the same texture, color, density, compaction, consolidation and permeability) encountered should include:
o Grain size distribution (ASTM D422 or equivalent AASHTO specification).
o Textural class (USDA).
o Percent clay content (include type of clay, if known).
o Color/mottling.
o Variations and nature of stratification.
o Cation exchange capacity (CEC) and organic matter content (if facility may be considered to provide treatment as well as flow control).
• For small-scale infiltration facilities (contributing drainage area is less than 7,500 square feet), only one testing location is required.
• The required number of test pits/test holes may be modified by the Administrator or designee if provided adequate evidence of consistent subsurface conditions.
• Prepare detailed logs for each test pit or test hole and a map showing the location of the test pits or test holes. Logs must include the depth, soil descriptions, depth to water, evidence of seasonal high groundwater elevation, existing ground surface elevation, proposed pond bottom elevation, and presence of stratification that may impact the infiltration design. Elevations shall be referenced to a vertical datum such as NGVD 29. Use the soil evaluation report forms in Appendix I-F.
December 2016 Volume III – Hydrologic Analysis and Flow Control BMPs 2-18
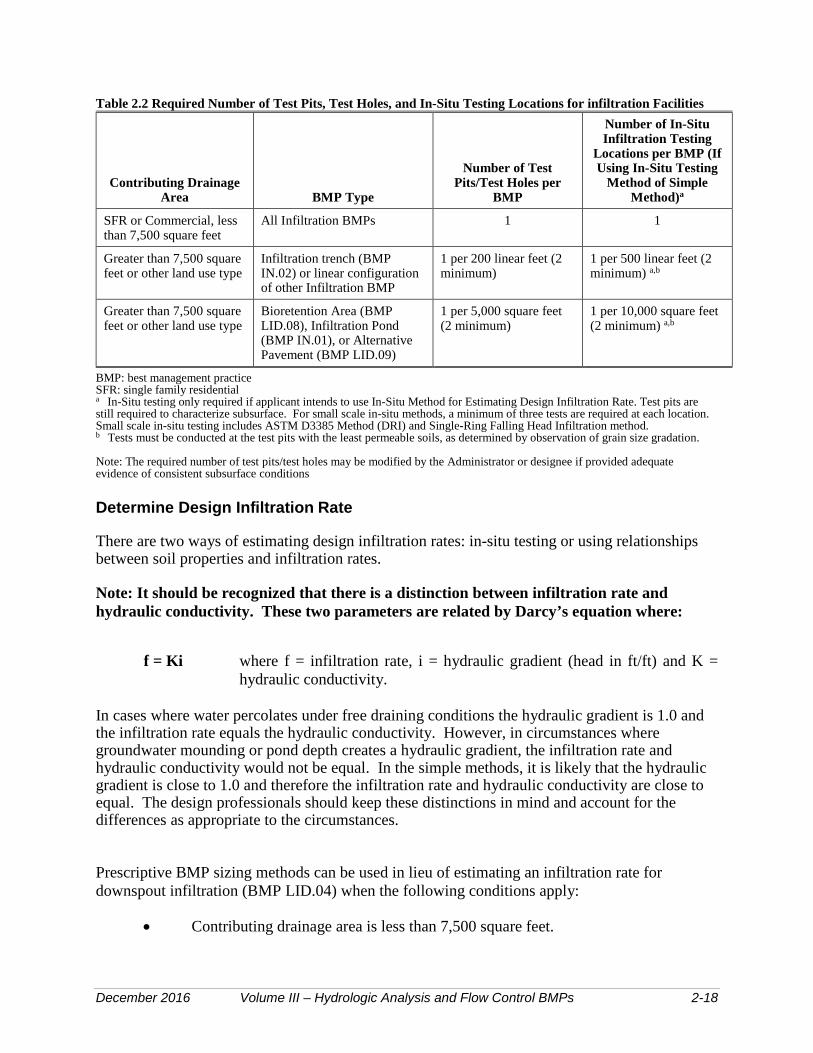
Table 2.2 Required Number of Test Pits, Test Holes, and In-Situ Testing Locations for infiltration Facilities
Contributing Drainage Area BMP Type
Number of Test Pits/Test Holes per
BMP
Number of In-Situ Infiltration Testing
Locations per BMP (If Using In-Situ Testing
Method of Simple Method)a
SFR or Commercial, less than 7,500 square feet
All Infiltration BMPs 1 1
Greater than 7,500 square feet or other land use type
Infiltration trench (BMP IN.02) or linear configuration of other Infiltration BMP
1 per 200 linear feet (2 minimum)
1 per 500 linear feet (2 minimum) a,b
Greater than 7,500 square feet or other land use type
Bioretention Area (BMP LID.08), Infiltration Pond (BMP IN.01), or Alternative Pavement (BMP LID.09)
1 per 5,000 square feet (2 minimum)
1 per 10,000 square feet (2 minimum) a,b
BMP: best management practice SFR: single family residential a In-Situ testing only required if applicant intends to use In-Situ Method for Estimating Design Infiltration Rate. Test pits are still required to characterize subsurface. For small scale in-situ methods, a minimum of three tests are required at each location. Small scale in-situ testing includes ASTM D3385 Method (DRI) and Single-Ring Falling Head Infiltration method. b Tests must be conducted at the test pits with the least permeable soils, as determined by observation of grain size gradation. Note: The required number of test pits/test holes may be modified by the Administrator or designee if provided adequate evidence of consistent subsurface conditions Determine Design Infiltration Rate
There are two ways of estimating design infiltration rates: in-situ testing or using relationships between soil properties and infiltration rates.
Note: It should be recognized that there is a distinction between infiltration rate and hydraulic conductivity. These two parameters are related by Darcy’s equation where:
f = Ki where f = infiltration rate, i = hydraulic gradient (head in ft/ft) and K =
hydraulic conductivity.
In cases where water percolates under free draining conditions the hydraulic gradient is 1.0 and the infiltration rate equals the hydraulic conductivity. However, in circumstances where groundwater mounding or pond depth creates a hydraulic gradient, the infiltration rate and hydraulic conductivity would not be equal. In the simple methods, it is likely that the hydraulic gradient is close to 1.0 and therefore the infiltration rate and hydraulic conductivity are close to equal. The design professionals should keep these distinctions in mind and account for the differences as appropriate to the circumstances.
Prescriptive BMP sizing methods can be used in lieu of estimating an infiltration rate for downspout infiltration (BMP LID.04) when the following conditions apply:
• Contributing drainage area is less than 7,500 square feet.

December 2016 Volume III – Hydrologic Analysis and Flow Control BMPs 2-19
• Property is a single family residential lot or commercial development.
• Soils are characterized by a soils professional (including a septic system designer) as one of the soil types used to establish the design criteria of BMP LID.04 (e.g., infiltration trenches limited to loam, sandy loam, etc.).
• For prescriptive drywells sized using Table 2.2 of Volume V the project must either be located outside of the Thurston County Phase II NPDES permit boundary or not be subject to Flow Control (MR#7).
These prescriptive methods are included in the BMP descriptions in Volume V.
The two following general methods of estimating the design infiltration rate can be used:
Method 1 – In-Situ Testing Methods
• Ecology Pilot Infiltration Test (PIT) is a large-scale test of infiltration. The PIT (described in Appendix III-A) is the preferred method of determining infiltration rate in Thurston County, and can be used for any infiltration BMP. The PIT method requires a substantial amount of water, which may not be available at some sites. If the test is not feasible for this reason, the alternative methods described below can be used.
• Single-Ring Falling-Head Infiltration method (US EPA 1980), as modified in Appendix III-A or as modified by Clark County (2015) is an acceptable in-situ method when the PIT method cannot be conducted due to site constraints, or the availability of sufficient water.
• Small-Scale (PIT). This test applies to infiltration facilities with drainage areas less than one acre and may be used to demonstrate infeasibility of bioretention, permeable pavement, or rain gardens in meeting Core Requirement #5.
• Double-Ring Infiltrometer method (ASTM D3385) is an acceptable in-situ method when the PIT method cannot be conducted due to site constraints, or the availability of sufficient water.
Method 2 – Soil Property Relationships
• USDA Soil Textural Classification method (USDA 1993). This method is applicable to sites with soils classified as loam, sandy loam, loamy sand, sand, sandy gravel or gravelly sand, and is described in Appendix III-A. This method only applies to projects sites that trigger Core Requirement #1 through #5 (not #1 through #10). This method may not be used to demonstrate infeasibility of bioretention, permeable pavement, or rain gardens in meeting Core Requirement #5.
• ASTM Gradation Testing method (ASTM D422). This method is applicable to sites with soils classified as sand or sandy gravel, and is described in Appendix
December 2016 Volume III – Hydrologic Analysis and Flow Control BMPs 2-20
III-A. This method may not be used to demonstrate infeasibility of bioretention, permeable pavement, or rain gardens in meeting Core Requirement #5.
If conducting in-situ testing of infiltration rates, see Table 2.3 for guidelines on the frequency of in-situ infiltration tests.
Determine Infiltration Rate of Engineered Treatment Soils
If the Bioretention Soil Mix (BSM) (Section 2.2.5.6.6, Bioretention Soil Mix, of Volume V) is used, assume a default short term infiltration rate of 12 inches per hour and apply appropriate correction factors to obtain a design infiltration rate. The applied correction factor shall be 2 or 4 depending upon the drainage area. Use a factor of 2 as the applied correction factor if the contributing area has less than 5,000 square feet of pollution generating impervious surface and less than 10,000 square feet of impervious surface; otherwise a correction factor of 4 shall be applied (i.e. multiply the short term infiltration rate by a factor of 0.25 or 0.5). If custom engineered soils other than the BSM are used for the treatment soils the following procedure will be used to determine the design infiltration rate for the facility and inputs for hydrologic modeling (WWHM). For other engineered soils the long term infiltration rate shall be determined as follows:
1. The infiltration rate used for hydrologic modeling and facility sizing shall be the lower of the long-term infiltration rate of the engineered soils or the short term infiltration rate of the underlying soils.
2. The long term infiltration rate of the engineered soils can be assumed to be 6 inches per hour with an applied correction factor of 2 or 4 depending upon the drainage area if the engineered soils meet the soil specifications for a bioretention facility as described in Section 2.2.5.6.6, Bioretention Soil Mix, of Volume V. For other engineered soils the long term infiltration rate will be based on ASTM 2434 Standard Test Method for Permeability of Granular Soils (Constant Head) with a compaction rate of 85 percent of maximum density using ASTM 1557 Test Method (Modified Proctor) with an applied correction factor of 2 or 4 depending upon the drainage area. (see above).
3. The short term rate for the underlying soils will be based on the calculated rate as determined by the methods described in this Chapter without application of the adjustment factor for clogging of the soils. This is based on the assumption that the treatment soil layer removes the silt and sediment that would have resulted in clogging of the underlying soils.
4. Use the lower infiltration rate of the two determined above in the hydrologic model and use an infiltration reduction factor of 1.
Prepare Geotechnical Report
A geotechnical report shall be prepared by or under the direct supervision of, and stamped by either a professional engineer with geotechnical expertise, or a licensed geologist, engineering geologist, or hydrogeologist. The report must summarize site characteristics and demonstrates
December 2016 Volume III – Hydrologic Analysis and Flow Control BMPs 2-21
that sufficient permeable soil for infiltration exists. In addition to the information required by Step 3 – Infiltration Receptor Characterization (as applicable), at a minimum, the report must contain the following:
• Figure showing the following:
o Topography within 500 feet of the proposed facility
o Locations of any water supply wells within 500 feet of the proposed facility
o Location of groundwater protection areas, aquifer recharge areas, or 1-, 5-, and 10-year times of travel zones for designated wellhead protection areas.
o Location of high groundwater hazard or flood plain areas in the project vicinity.
o Locations of test pits or test holes.
• Results of soils tests including but not limited to: detailed soil logs, visual grain size analysis, grain-size distribution (required if using the grain size analysis method to estimate infiltration rates), percent clay content (include type of clay, if known), color/ mottling, variations and nature of stratification
• Description of local site geology, including soil or rock units likely to be encountered at soil sampling depths, the seasonal high groundwater elevation, and an estimate of the maximum historical groundwater elevation.
• Detailed documentation of the design infiltration rate determination, as specified above
• State whether location is suitable for infiltration and recommend a design infiltration rate.
Estimate Volume of Stormwater
Use the Western Washington Hydrologic Model (WWHM), MGSFlood, or other approved continuous simulation runoff model to generate a runoff inflow file that will be used to size the infiltration facility. The facility must either:
• Infiltrate all of the flow volume as specified by the inflow file without any overflow, or
• Infiltrate a sufficient amount of the flow volume such that any overflow/bypass meets the flow duration standard in Core Requirement #7 – Flow Control, or

December 2016 Volume III – Hydrologic Analysis and Flow Control BMPs 2-22
• Be designed as a combined infiltration/detention facility such that any discharge to surface water from the facility meets the flow duration standards in Core Requirement #7 – Flow Control.
In addition, the overflow/bypass must meet the LID performance standard if it is the option chosen to meet Core Requirement #5.
If the facility is designed to meet runoff treatment requirements of Core Requirement #6, it must infiltrate the 91st percentile, 24-hour runoff volume indicated by an approved continuous runoff model.
For downspout infiltration (BMP LID.04) a simplified sizing table can be used if the facility meets soils requirements and contributing drainage area thresholds. Simplified sizing methods are presented in the corresponding BMP description in Volume V.
Detailed Analysis Procedure
This detailed approach was obtained from Massmann (2003). Procedures for the detailed approach are as follows (see Figure 2.2):

December 2016 Volume III – Hydrologic Analysis and Flow Control BMPs 2-23
Estimate volume ofstormwater, Vdesign
o Continuous Hydrograph
Choose trial geometry based on siteconstraints of assume f = 0.5 in./hr.
Perform subsurface site characterization and datacollection, including location of water table.
Estimate saturated hydraulicconductivity:
o Soil grain size & CFTo Field tests & CFT
For projectsneeding
moundinganalysis,perform
computersimulation to
obtain Q usingMODRET,
withcontinuoushydrograph,
soilstratigraphy,ground water
data, hydraulicconductivity,
and CFT asinput.
Performcomputer
designinfiltration
facility usingWWHM orMGSFLOOD
withcontinuoushydrograph,
soilstratigraphy,ground water
data, andinfiltration
rate data asinput.
Calculate infiltration rateusing a stage-discharge
relationship usingMODRET
Calculate hydraulic gradient using Equation 3. Ifthe calculated value is greater than 1.0, considerwater table to be deep and use i = 1.0 max. Sincei is a function of water depth in pond, i must be
embedded in the stage discharge relationship usedin a runoff model
Estimate the infiltration rate for the stage dischargerelationship (Equation 5).
Adjust infiltration rates for pond aspect ratio toestimate long-term infiltration rate (Equations 6 & 7).
Size facility to maximum depth/minimumfreeboard to accommodate Vdesign
Construct facility.Maintain facility and verify performance.
Retrofit facility if performance is inadequate.
Figure 2.2 Engineering Design Steps for Final Design of Infiltration Facilities Using the Detailed Method (from Ecology [2012])
December 2016 Volume III – Hydrologic Analysis and Flow Control BMPs 2-24
Develop a Trial Infiltration Facility Geometry Based on Length, Width, and Depth
To accomplish this, either assume an infiltration rate based on previously available data, or use a default infiltration rate of 0.5 inches/hour. Use this trial geometry to help locate the facility, and for planning purposes in developing the geotechnical subsurface investigation plan.
Conduct a Geotechnical Investigation
A geotechnical investigation must be conducted to evaluate the site’s suitability for infiltration, to establish the infiltration rate for design, and to evaluate slope stability, foundation capacity, and other geotechnical design information needed to design and assess constructability of the facility. Geotechnical investigation requirements are provided below.
The depth, number of test holes or test pits, and sampling described below should be increased if a licensed engineer with geotechnical expertise (P.E.), or a licensed geologist or hydrogeologist judges that conditions are highly variable and make it necessary to increase the depth or the number of explorations to accurately estimate the infiltration system’s performance. The exploration program described below may be decreased if the licensed professional judges that conditions are relatively uniform, or design parameters are known to be conservative based on site specific data or experience, and the borings/test pits omitted will not influence the design or successful operation of the facility.
• For infiltration basins (ponds), at least one test pit or test hole per 5,000 ft2 of basin infiltrating surface (two minimum).
• For infiltration trenches, at least one test pit or test hole per 200 feet of trench length (two minimum).
• Subsurface explorations (test holes or test pits) to a depth below the base of the infiltration facility of at least 5 times the maximum design depth of water proposed for the infiltration facility, or at least 2 feet into the saturated zone (whichever is less).
• Continuous sampling to a depth below the base of the infiltration facility of 2.5 times the maximum design depth of water proposed for the infiltration facility, or at least 2 feet into the saturated zone, but not less than 6 feet. Samples obtained must be adequate for the purpose of soil gradation/classification testing. For large infiltration facilities serving drainage areas of 10 acres or more, perform soil grain size analyses on layers up to 50 feet deep (or no more than 10 feet below the water table).
• Conduct Infiltration Receptor Characterization as described in Step 3 if required.
• Laboratory testing as necessary to establish the soil gradation characteristics and other properties as necessary, to complete the infiltration facility design. At a minimum, one-grain size analysis per soil stratum in each test hole must be conducted within 2.5 times the maximum design water depth, but not less than 6 feet. When assessing the hydraulic conductivity characteristics of the site, soil

December 2016 Volume III – Hydrologic Analysis and Flow Control BMPs 2-25
layers at greater depths must be considered if the licensed professional conducting the investigation determines that deeper layers will influence the rate of infiltration for the facility, requiring soil gradation/classification testing for layers deeper than indicated above.
Prepare Geotechnical Report
A report must be prepared by or under the direction supervision of and stamped by either a professional engineer with geotechnical expertise, or a licensed geologist, engineering geologist, or hydrogeologist The report must summarize site characteristics and demonstrate that sufficient permeable soil for infiltration exists. In addition to information required in Step 3 – Infiltration Receptor Characterization (as applicable), at a minimum, the report must contain the following:
• Figure showing the following:
o Topography within 500 feet of the proposed facility
o Locations of any water supply wells within 500 feet of the proposed facility
o Location of groundwater protection areas, aquifer recharge areas, or 1-, 5-, and 10-year times of travel zones for designated wellhead protection areas
o Location of high groundwater hazard areas and flood plains in the vicinity of the project
o Locations of test pits or test holes
• Results of soils tests, including detailed soil logs, visual grain size analysis, grain-size distribution (required if using the grain size analysis method to estimate infiltration rates), percent clay content (include type of clay, if known), color/ mottling, variations and nature of stratification
• Description of local site geology, including soil or rock units likely to be encountered at soil sampling depths, the seasonal high groundwater elevation, and an estimate of the maximum groundwater depth
• Detailed documentation of the design infiltration rate determination, as specified in this Chapter
• State whether location is suitable for infiltration and recommend a design infiltration rate
• The stratification of the soil/rock below the infiltration facility, including the soil gradation (and plasticity, if any) characteristics of each stratum
• The depth to the ground water table and to any bedrock/ impermeable layers

December 2016 Volume III – Hydrologic Analysis and Flow Control BMPs 2-26
• Seasonal variation of the ground water table
• The existing ground water flow direction and gradient
• The hydraulic conductivity or the infiltration rate for the soil/rock at the infiltration facility
• The porosity of the soil below the infiltration facility but above the water table
• The lateral extent of the infiltration receptor
• Impact of the infiltration rate and volume on flow direction and water table at the project site, and the potential discharge point or area of the infiltrating water.
Determine Design Infiltration Rate
Procedures for determining the design infiltration rate of the site soils are included in Appendix III-A.
As with the simple analysis described above, if engineered soils are used for the treatment soils, the lower of the long-term infiltration rate of the engineered soils and the short term infiltration rate of the underlying soils shall be used for facility sizing.
Sizing of Infiltration Facilities
Design Criteria – Sizing Facilities
• The size of the infiltration facility can be determined using a continuous runoff model by routing the inflow runoff file through the proposed infiltration facility. In general, an infiltration facility would have two discharge modes. The primary mode of discharge from an infiltration facility is infiltration into the ground. However, when the infiltration capacity of the facility is reached, additional runoff to the facility will cause the facility to overflow. If a project is subject to Core Requirement #7 (Flow Control), overflows from an infiltration facility must comply with the flow control standard. Infiltration facilities designed to meet Core Requirement #6 (Runoff Treatment) must not overflow more than 9 percent of the total volume of runoff in the inflow runoff file. However, if the facility is an infiltration basin (BMP IN.01) configured as an off-line facility, it must be sized as follows: Off-line, upstream of detention facility (or without detention facility): A flow splitter shall be designed to send all flows at or below the 15-minute water quality flow rate, as predicted by an approved continuous runoff model to the treatment facility. Within the WWHM, the flow splitter icon is placed ahead of the pond icon which represents the infiltration basin. The treatment facility must be sized to infiltrate all the runoff sent to it (no overflows from the treatment facility are allowed).
• Off-line, downstream of detention facility: A flow splitter shall be designed to send all flows at or below the 2-year flow frequency from the detention pond, as
December 2016 Volume III – Hydrologic Analysis and Flow Control BMPs 2-27
predicted by an approved continuous runoff model, to the infiltration basin. Within the WWHM, the flow splitter icon is placed ahead of the pond icon which represents the infiltration basin. The treatment facility must be sized to infiltrate all the runoff sent to it (no overflows from the treatment facility are allowed).
For infiltration facilities designed for runoff treatment, document that the 91st percentile, 24-hour runoff volume (indicated by WWHM or MGS Flood) can infiltrate through the infiltration basin surface within 48 hours (using the long-term infiltration rate). This can be calculated using a horizontal projection of the infiltration basin mid-depth dimensions and the estimated long-term infiltration rate. This drawdown restriction is intended to meet the following objectives:
• aerate vegetation and soil to keep the vegetation healthy
• enhance the biodegradation of pollutants and organics in the soil.
In order to determine compliance with the flow control requirements, the Western Washington Hydrology Model (WWHM), or an appropriately calibrated continuous simulation runoff model based on HSPF, must be used. When using WWHM for simulating flow through an infiltrating facility, the facility is represented by using the Pond Icon and entering the pre-determined infiltration rates. Below are the procedures for sizing a pond to completely infiltrate 100 percent of runoff.
For 100 Percent Infiltration
• Input dimensions of your infiltration pond.
• Input infiltration rate and safety (rate reduction) factor. In general, the rate reduction factor is 1 if the design infiltration rate is used with the applicable adjustment factors described in Appendix III-A. If amended soils or engineered soils are used for treatment in the bottom of the facility, an adjustment factor would be applied to the infiltration rate as described in Volume V.
• Input a riser height and diameter (any flow through the riser indicates that you have less than 100 percent infiltration and must increase your infiltration pond dimensions).
• Run only HSPF for Developed Mitigated Scenario (if that is where you put the infiltration pond). It is not necessary to run duration.
• Go back to your infiltration pond and look at the Percentage Infiltrated at the bottom right. If less than 100 percent infiltrated, increase pond dimension until you get 100 percent.

December 2016 Volume III – Hydrologic Analysis and Flow Control BMPs 3-1
Chapter 3 - Conveyance Systems and Hydraulic Structures 3.1 Overview
This chapter presents acceptable methods for analysis and design of conveyance systems. It also discusses hydraulic structures linking the conveyance system to runoff treatment and flow control facilities. The chapter is organized as follows:
• Design and analysis methods (Sections 3.2 through 3.6)
• Pipe systems (Section 3.7)
• Outfalls (Section 3.8)
• Flow spreaders
• Culverts (Section 3.9)
• Open conveyances (Section 3.10)
• Private Drainage Systems (Section 3.11)
• Floodplains/floodways (covered in TCC 17.15 and TCC 24).
Where space and topography permit, open conveyances are the preferred means of collecting and conveying stormwater.
3.2 Design Event Storm Frequency
Ideally, every conveyance system and hydraulic structure would be designed for the largest possible amount of flow. Since this would require unusually large structures and be too costly, hydraulic structure designs are analyzed using a specific storm frequency. When selecting a storm frequency, consideration is given to potential adjacent property damage, potential hazard and inconvenience to the public, the number of users, and initial construction cost of the conveyance system or hydraulic structure.
The design event recurrence interval is related to the probability that such an event will occur in any one-year period. For example, a peak flow having a 25-year recurrence interval has a 4 percent probability of being equaled or exceeded in any future year (100/25 = 4). A peak flow having a 2-year recurrence interval has a 50 percent probability of being equaled or exceeded in any future year (100/2 = 50). The greater the recurrence interval, the lower the probability that the event will occur in any given year.
Conveyance systems shall be designed to convey the peak flows from the following storm events:
December 2016 Volume III – Hydrologic Analysis and Flow Control BMPs 3-2
• The project's internal piped conveyance system shall be designed for a 25-year, 24-hour storm event. In areas where the County determines there is a high risk of damage or vital service interruption, a backwater analysis of the peak flows from the 100-year, 24-hour storm events shall be conducted.
• All open channel conveyance systems shall be designed for the 100-year, 24-hour storm event.
• Piped conveyance under public roads and arterials shall convey a 25-year, 24-hour storm event under fully developed basin conditions. Additional criteria:
o In the urban area inside of the long-term urban growth management boundary (boundary is depicted on current zoning maps available at the County) the outside driving lane of public roads and streets must not have water over more than 50 percent of the lane for a design event of a 25-year, 24-hour storm.
o In the area outside of the long-term urban growth management boundary, the design event shall be the 100-year, 24-hour storm.
o In areas where the County determines there is a high risk of damage or vital service interruption (e.g., more than 6 inches of standing water in the streets), the Administrator or designee may specify up to the 100-year, 24-hour event as the design event.
• Natural channel bridges and culverts shall be designed to convey at least the 100-year, 24-hour storm event under fully developed drainage basin conditions based on the tributary area zoning. Culvert and bridge designs must also meet applicable fish passage and scour criteria.
3.3 Determination of Design Flows
All existing and proposed conveyance systems shall be analyzed and designed using peak flows from hydrographs developed through single event storm hydrologic analyses described in Section 2.1.3 or from a continuous simulation hydrologic model using 15 minute time steps. See Chapter 2 and Appendix III-B for more information.
EXCEPTION: For drainage subbasins 25 acres or less, and having a time of concentration of less than 100 minutes, peak flows for analyzing the capacity of conveyance elements may be determined using the Rational Method (see Chapter 2 and Appendix III-B).
3.4 Open Channel Flow – Hydraulic Analysis
Two hydraulic analysis methods are used to analyze and design conveyance systems:
• The Uniform Flow Analysis Method (Section 3.4.1 below), commonly referred to as the Manning's equation, is used for the design of open conveyances (Section

December 2016 Volume III – Hydrologic Analysis and Flow Control BMPs 3-3
3.10) and new pipe systems (Section 3.7), as well as for analysis of existing pipe systems. Manning’s equation is only valid for pipe flow when the pipe is flowing less than full. If the pipe is surcharged, the backwater method must be used.
• The Backwater Analysis Method (Section 3.4.2 below), is used to analyze the capacity of both proposed and existing pipe systems when a pipe is surcharged. If the County determines that, as a result of the project, runoff for any event up to and including the 100-year, 24-hour event would exceed the pipes’ un-surcharged capacity, a backwater (pressure sewer) analysis shall be required. Results shall be submitted in tabular and graphic format showing hydraulic and energy gradient.
Uniform Flow Analysis - Manning’s Equation
Manning’s equation can be used for open channel flow or for a pipe that is flowing less than full. Manning’s equation is expressed as:
5.067.0486.1 SRn
V ××=
Where:
V = velocity (feet per second),
n = Manning’s roughness factor (-)
R = hydraulic radius (area/wetted perimeter; feet), and
S = Channel slope (feet/foot)
Manning’s equation can also be expressed in terms of discharge (Q):
5.067.0486.1 SRAn
Q ×××=
Where A = cross-sectional area of flow (square feet).
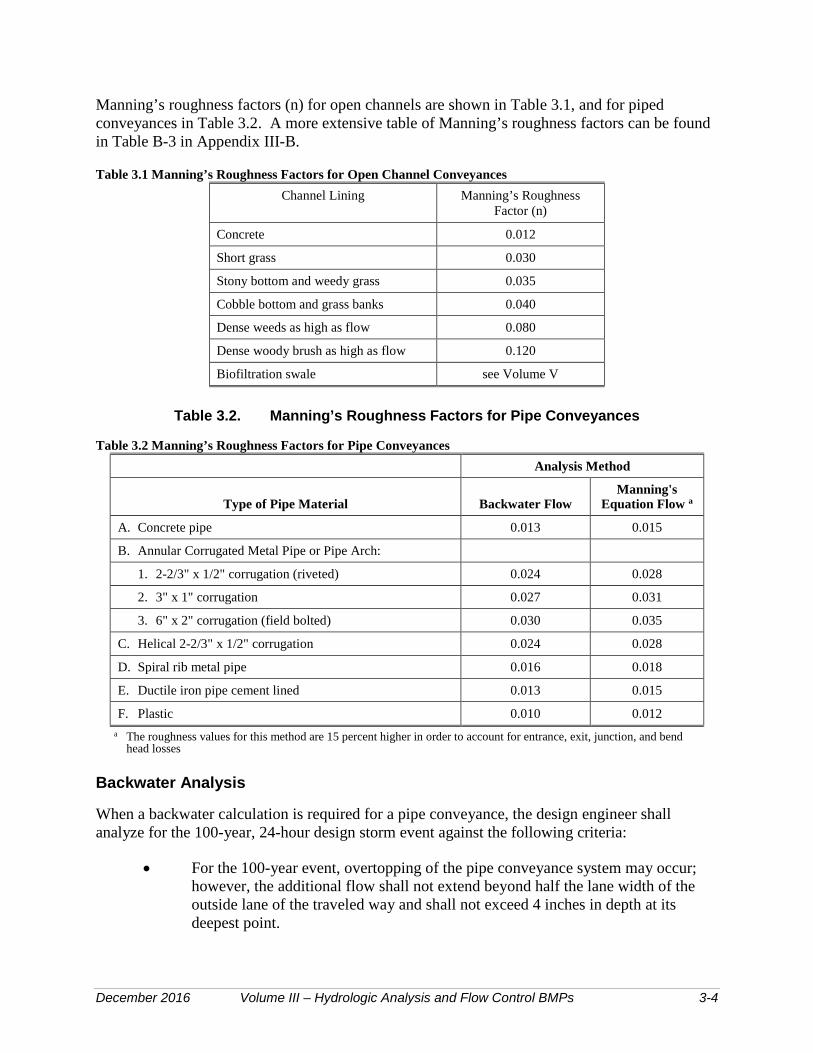
December 2016 Volume III – Hydrologic Analysis and Flow Control BMPs 3-4
Manning’s roughness factors (n) for open channels are shown in Table 3.1, and for piped conveyances in Table 3.2. A more extensive table of Manning’s roughness factors can be found in Table B-3 in Appendix III-B.
Table 3.1 Manning’s Roughness Factors for Open Channel Conveyances Channel Lining Manning’s Roughness
Factor (n)
Concrete 0.012
Short grass 0.030
Stony bottom and weedy grass 0.035
Cobble bottom and grass banks 0.040
Dense weeds as high as flow 0.080
Dense woody brush as high as flow 0.120
Biofiltration swale see Volume V
Table 3.2. Manning’s Roughness Factors for Pipe Conveyances
Table 3.2 Manning’s Roughness Factors for Pipe Conveyances Analysis Method
Type of Pipe Material Backwater Flow Manning's
Equation Flow a
A. Concrete pipe 0.013 0.015
B. Annular Corrugated Metal Pipe or Pipe Arch:
1. 2-2/3" x 1/2" corrugation (riveted) 0.024 0.028
2. 3" x 1" corrugation 0.027 0.031
3. 6" x 2" corrugation (field bolted) 0.030 0.035
C. Helical 2-2/3" x 1/2" corrugation 0.024 0.028
D. Spiral rib metal pipe 0.016 0.018
E. Ductile iron pipe cement lined 0.013 0.015
F. Plastic 0.010 0.012 a The roughness values for this method are 15 percent higher in order to account for entrance, exit, junction, and bend
head losses Backwater Analysis
When a backwater calculation is required for a pipe conveyance, the design engineer shall analyze for the 100-year, 24-hour design storm event against the following criteria:
• For the 100-year event, overtopping of the pipe conveyance system may occur; however, the additional flow shall not extend beyond half the lane width of the outside lane of the traveled way and shall not exceed 4 inches in depth at its deepest point.

December 2016 Volume III – Hydrologic Analysis and Flow Control BMPs 3-5
• Off-channel storage on private property is allowed with recording of the proper easements (see Section 3.6). The additional flow shall be analyzed by open channel flow methods.
A backwater profile analysis computer program such as the King County Backwater (KCBW) computer program prepared by the King County Department of Natural Resources and Parks, Water and Land Resources Division is recommended over manual calculations. The BPIPE subroutine of KCBW may be used for quick computation of backwater profiles, given a range of flows through the existing or proposed pipe system. This program is available free of charge from King County.
3.5 Conveyance System Route Design and Off-Site Drainage
All pipe shall be located under the pavement flow line or lie outside of the pavement. Perpendicular crossings and cul-de-sacs are exempted from this requirement. New conveyance system alignments that are not in dedicated tracts or right-of-way shall be located in drainage easements that are adjacent and parallel to property lines. The width of the permanent easement will be completely within a single parcel or tract. Topography and existing conditions are the only conditions under which a drainage easement that is not adjacent and parallel to a property line may be placed. Requirements for conveyance system tracts and easements are discussed in Section 3.6 below.
EXCEPTION: Streams and natural drainage channels cannot be relocated to meet this routing requirement.
Development projects are required to handle off-site drainage in the same manner as exists in the predeveloped condition. In other words, after development of the subject site, off-site flows shall be infiltrated within or passed through the project site in the same proportion as occurred prior to development. The area and existing use of the off-site land area should be included in any modeling performed to design new facilities. If the adjacent site is undeveloped, model the off-site land area as if it were developed with a detention facility discharging per the Core Requirements of this manual and factor the future flow into the design of the facilities. To avoid this analysis, it would be preferable to collect and bypass off-site drainage around the site or infiltrate it prior to the flow being combined with on-site drainage. If the off-site drainage is to be infiltrated on site, the infiltration facilities shall be sized to accommodate the correct proportion of off-site flows.
Off-site pass-through flows shall be routed separately across the development site. They shall not be routed through the project’s conveyance, runoff treatment, or flow control systems. Storage and treatment of off-site pass-through flows is not required.
However, if the Project Engineer and the Administrator or designee agree that separate handling of off-site flows is impracticable, then off-site flows may be routed through the project’s stormwater management systems. Those systems affected by the off-site flows shall be sized as if the off-site flows were generated within the development project’s boundaries.
December 2016 Volume III – Hydrologic Analysis and Flow Control BMPs 3-6
3.6 Easements, Access, and Dedicated Tracts
All man-made drainage facilities and conveyances, and all natural channels (on the project site) used for conveyance of altered flows due to development shall be located within easements or dedicated tracts as required by the County. Easements shall contain the natural features and facilities and shall allow County access for purposes of inspection, maintenance, repair or replacement, flood control, water quality monitoring, and other activities permitted by law.
The easement shall include easement boundary markers which shall be fiberglass utility markers with a reflective easement tag, located at each corner of the easement, at angle points and at least every 100-ft along the length of the easement. Contact Thurston County Water Resources Division for additional information on easement marker requirements.
Maintenance Access to Stormwater Facilities
All drainage facilities such as detention or wet ponds or infiltration systems whether privately maintained or maintained by the County shall be located in separate tracts. Conveyance systems and dedicated stormwater dispersion areas can be in easements with County acceptance.
The dedicated tract for a stormwater facility shall include a minimum 20-foot wide access from a public street or right-of-way. If the development is served by private roads or is gated, then the Proponent shall provide for County access through the gate or private roads to access stormwater facilities. This may include providing a pass code to the Administrator or other means acceptable to the County.
An easement shall be granted through the tract for access to the stormwater facility and shall not be included as part of any individual lots within a subdivision. Access easements across individual lots for access to a stormwater facility are discouraged and shall only be allowed with specific acceptance of Thurston County (including the Administrator or designee) and only upon demonstration that measures are in place to ensure that the easement will not be encroached upon by the lot owner.
The access shall be surfaced with a minimum 12-foot width of crushed rock or other approved surface to allow year-round equipment access to the facility and delineated by a gate, fencing or some other measure to indicate to adjacent property owners that an easement exists. See individual BMP descriptions in Volume V for additional stormwater facility access requirements.
Drainage facilities that are designed to function as multi-use recreational facilities shall be located in separate tracts or in designated open space and shall be privately maintained and owned, unless accepted by and dedicated to the County.
Maintenance vehicle access, i.e., vactor truck, must be provided for all manholes, catch basins, vaults, or other underground drainage facilities. Maintenance shall be through an access easement (see requirements above) or dedicated tract. Drainage structures for conveyance, other than open channels, must have vehicular access.

December 2016 Volume III – Hydrologic Analysis and Flow Control BMPs 3-7
Access to Conveyance Systems
All publicly and privately maintained conveyance systems shall be located in dedicated tracts, drainage easements, or public rights-of-way in accordance with this manual. Exception: Roof downspout, minor yard, and footing drains unless they serve other adjacent properties.
Conveyance systems to be maintained and operated by Thurston County must be located in a dedicated tract or drainage easement granted to the County. Any new conveyance system on private property conveying drainage from other private properties must be located in a dedicated tract or private drainage easement granted to the stormwater contributors.
Any easement for access to a conveyance system shall include measures to ensure that the easement will not be encroached upon by adjacent lot owners such as delineation by a gate, fencing, signage or some other measure to indicate to adjacent property owners that an easement exists.
All drainage tracts and easements must have a minimum width of 20 feet. All pipes and channels must be located within the easement in accordance with Table 3.3. If circumstances require the location of the pipe or channel within the easement to differ from the requirements of Table 3.3, then, at a minimum each pipe face or top channel edge shall be no closer than 5 feet from its adjacent easement boundary. Easements or Tract widths shown in Table 3.3 are minimums for drainage facilities and may be increased depending on pipe/channel size, depth or other factors.
Table 3.3 Minimum Easement Widths for Conveyance Systems for Access, Inspection and Maintenance Conveyance Width Easement/Tract Width
Channels ≤ 30 feet wide Channel Width + 20 feet from top, one side
Channels > 30 feet wide Channel Width + 20 feet from top, both sides
Pipes/Outfalls ≤ 36 inches 20 feet centered on pipe
Pipes/Outfalls ≤ 60 inches 20 feet centered on pipe*
Pipes/Outfalls > 60 inches 30 feet centered on pipe*
* May be greater, depending on depth and number of pipes in easement. Discharge to Private Property
When the proposed project site discharges to an adjacent property where no public drainage facility or no defined drainage course exists (e.g., a natural channel such as a Department of Natural Resources (DNR) Type “Ns” rated stream), the Proponent shall obtain an easement from the adjacent property owner(s) to establish a drainage way to connect to a defined drainage system. In the absence of such an easement, the discharge from stormwater management facilities shall be distributed along the property line in approximately the same flow pattern as before development. A quantitative downstream analysis shall be conducted to determine any potential impacts of the distributed flow to downstream property.
The Administrator or designee may, under highly unusual circumstances, excuse the Proponent from requirements of this section (e.g., adjacent property is a wetland and is not a closed basin,

December 2016 Volume III – Hydrologic Analysis and Flow Control BMPs 3-8
and discharge to the wetland would not significantly alter the hydrology, degrade wetland functions and values, or reduce the value of the property).
3.7 Pipe System Design Criteria
Pipe systems are networks of storm drain pipes, catch basins, manholes, and inlets designed and constructed to convey storm and surface water. The hydraulic design of new storm drain pipes is limited to gravity flow; however, in analyzing existing systems, it may be necessary to address pressurized conditions.
Analysis Methods
Two methods of hydraulic analysis (using Manning's Equation) are used for pipe system analysis (see Section 3.4):
• Uniform Flow Analysis Method (Section 3.4.1), commonly referred to as the Manning's Equation.
• Backwater Analysis Method (Section 3.4.2).
When using the Manning's Equation for design, each pipe within the system shall be sized and sloped so that its barrel capacity at normal full flow is equal or greater than the required conveyance capacity as identified in Section 3.2. Pipes should not be designed to surcharge.
Nomographs may also be used for sizing the pipes. For pipes flowing partially full, the actual velocity may be estimated from engineering nomographs by calculating Qfull and Vfull and using the ratio of Qdesign/Qfull to find V and d (depth of flow). Appendix III-C includes several nomographs that may be useful for culvert sizing.
Acceptable Pipe Sizes
Storm drainage pipe are subject to the following minimum diameters:
• Private drainage system ≥8 inches for pipes other than French drains, foundation drains and downspout drains. See the Uniform Plumbing Code for minimum sizes and cleanout locations for other pipes such as French drains and downspout pipes,
• Public right-of-way = 12 inches
The Administrator or designee may waive these minimums in cases where topography and existing drainage systems make it impractical to meet the standard. For culverts, see Section 3.10.
Pipe Materials
All storm drainage pipe, except as otherwise provided for in these standards, shall be as per current WSDOT Standard Specifications 9-05. When extreme slope conditions or other unusual topographic conditions exist, pipe materials and methods such as, but not limited to, PVC,

December 2016 Volume III – Hydrologic Analysis and Flow Control BMPs 3-9
HDPE, or ductile iron pipe should be used. See the WSDOT Hydraulics Manual for minimum and maximum depth of cover criteria.
Pipe Slope and Velocity
Minimum velocity is 2 feet per second at design flow. The County may waive these minimums when topography and existing drainage systems make it impractical.
Maximum slopes, velocities, and anchor spacings are shown in Table 3.4. If velocities exceed 15 feet per second for the conveyance system design event, provide anchors at bends and junctions.
Table 3.4 Maximum Pipe Slopes and Velocities Pipe Material Pipe Slope Above Which Pipe
Anchors Required Max. Slope
Allowed Max. Velocity @
Full Flow
PVC(1), CPEP-singlewall(1) Corrugated Metal Pipe(1)
20% (1 anchor per 100 LF of pipe)
30% (3)
30 fps
Concrete(1) or CPEP-smooth interior(1) 10%
(1 anchor per 50 LF of pipe)
20% (3) 30 fps
Ductile Iron (4) 40%
(1 anchor per pipe section)
None None
HDPE (2) 50%
(1 anchor per 100 LF of pipe – cross slope installations may be allowed with additional anchoring and analysis)
None None
NOTES: (1) Not allowed in landslide hazard areas. (2) Butt-fused pipe joints required. Above ground installation is required on slopes greater than 40% to minimize
disturbance to steep slopes. (3) Maximum slope of 20% allowed for these pipe materials with no joints (one section) if structures are provided at
each end and the pipes are properly grouted or otherwise restrained to the structures. (4) Restrained joints required on slopes greater than 25%. Above-ground installation is required on slopes greater than
40% to minimize disturbance to steep slopes: KEY: PVC = Polyvinyl chloride pipe HDPE = High density polyethylene fps = Feet per second Downsizing of pipes is only allowed under special conditions (i.e. no hydraulic jump can occur; downstream pipe slope is significantly greater than the upstream slope; velocities remain in the 3 to 8 feet per second range, etc.).
Downsizing of downstream culverts within a closed system with culverts 18 inches in diameter or smaller will not be permitted.

December 2016 Volume III – Hydrologic Analysis and Flow Control BMPs 3-10
Pipes on Steep Slopes
Steep slopes (greater than 30 percent) shall require all drainage to be piped from the top to the bottom in HDPE pipe (butt fused) or ductile iron pipe welded or mechanically restrained. Pipes may be installed in trenches with standard bedding on slopes up to 20 percent. In order to minimize disturbance to slopes greater than 20 percent, it is recommended that pipes be placed at grade with proper pipe anchorage and support. If slopes exceed 40 percent, then pipe shall be installed above ground and anchored (see Table 3.4). Additional anchoring design may be required for these pipes.
Pipe System Layout Criteria
Pipes must be laid true to line and grade with no curves, bends, or deflections in any direction (except for HDPE and ductile iron with flanged restrained mechanical joint bends, not greater than 30°, on steep slopes).
A break in grade or alignment or changes in pipe material shall occur only at catch basins or manholes.
Connections to a pipe system shall be made only at catch basins or manholes. No wyes or tees are allowed except on private roof/footing/yard drain systems on pipes 8 inches in diameter, or less, with clean-outs upstream of each wye or tee.
Provide 6 inches minimum vertical and 3 feet minimum horizontal clearance (outside surfaces) between storm drain pipes and other utility pipes and conduits. Development Standards for Water and Sewer Systems, Thurston County will apply for crossings of or parallel runs with Thurston County sewer lines and for crossings of water lines. Additional requirements for crossings of septic transport lines or water supply lines may apply. Contact the Thurston County Environmental Health Division or the local water purveyor for these requirements. Contact the Environmental Health Division of the Thurston County Department of Public Health and Social Services at 360-867-2673 for more information.
Suitable pipe cover over storm pipes in road rights-of-way shall be calculated for HS-20 loading by the Project Engineer. Pipe cover is measured from the finished grade elevation to the top of the outside surface of the pipe. Pipe manufacturer recommendations are acceptable, if verified by the Project Engineer.
Except as indicated above, pipes or conveyances that traverse the marine intertidal zone and connect to outfalls should be buried at a depth sufficient to avoid exposure of the line during storm events or future changes in beach elevation. If non-native material is used to bed the pipe, such material should be covered with at least 3 feet of native bed material or equivalent
PVC SDR 35 minimum cover shall be 3 feet in areas subject to vehicular traffic; maximum cover shall be 30 feet or per the manufacturer's recommendations and as verified with calculations from the Project Engineer.
Pipe cover in areas not subject to vehicular loads, such as landscape planters and yards, may be reduced to a 1 foot minimum.

December 2016 Volume III – Hydrologic Analysis and Flow Control BMPs 3-11
Access barriers are required on all pipes 18 inches and larger exiting a closed pipe system. Debris barriers (trash racks) are required on all pipes entering a pipe system.
Where a minimal fall is necessary between inlet and outlet pipes in a structure, pipes must be aligned vertically by one of the following in order of preference:
• Match pipe crowns
• Match 80 percent diameters of pipes
• Match pipe inverts
Where inlet pipes are higher than outlet pipes, drop manhole connections may be required or increased durability in the structure floor may be required.
High Density Polyethylene (HDPE) pipe systems longer than 100 feet must be anchored at the upstream end if the slope exceeds 25 percent and the downstream end placed in a minimum 4 foot long section of the next larger pipe size. This sliding sleeve connection allows for the high thermal expansion/contraction coefficient of the pipe material. These sleeve connections should be located as close to the discharge end of the outfall system as is practical.
Pipe Structure Criteria
Catch Basins and Manholes
All catch basins and manholes shall meet current WSDOT Standard Specifications and Plans. The following criteria shall be used when designing a conveyance system which uses catch basins or manholes.
Unless otherwise required by the County, Type 1 catch basins shall be used at the following locations or for the following situations:
• When overall structure height does not exceed 8 feet, or when invert does not exceed 5 feet.
• When pipe sizes do not exceed 18 inches and connect at right angles to the long side of the structure; or 12 inches connecting to the short side.
• When all pipes tying into the structure connect at or very near to right angles.
Unless otherwise required by the County, Type 1L catch basins must be used at the following locations or for the following situations:
• When overall structure height does not exceed 8 feet or when invert does not exceed 5 feet.
• When any pipes tying into the structure exceed 18 inches connecting to the long side, or 15 inches connecting to the short side at or very near to right angles.

December 2016 Volume III – Hydrologic Analysis and Flow Control BMPs 3-12
Unless otherwise required by the County, Type 2 (48-inch minimum diameter) catch basins shall be used at the following locations or for the following situations:
• When overall structure height does not exceed 15 feet.
• When all pipes tying into the structure do not exceed the limits set forth by the manufacturers. Type 2 catch basins over 4 feet in height shall have standard ladders. Ladders shall not cover inlet or outlet pipes.
Where an approved connection of a private storm drainage system into a County system occurs, a minimum of a Type 1 catch basin shall be used in Thurston County.
Maximum spacing on main storm sewers between access structures, whether catch basins or manholes, shall be 300 feet (Table 3.5).
Table 3.5 Maximum Surface Runs Between Inlet Structures on the Paved Roadway Surface in Thurston County
Roadway Slope (%)
Thurston County Max. Spacing (ft)
0.5 to 1.0 150
1.0 to 3.0 200
>3.0 300
Catch basin (or manhole) diameter shall be determined by pipe diameter and orientation at the junction structure. A plan view of the junction structure, drawn to scale, is required when more than four pipes enter the structure on the same plane, or if angles of approach and clearance between pipes is of concern. The plan view (and sections if necessary) must insure a minimum distance (of solid concrete wall) between pipe openings of 8 inches for 48-inch and 54-inch diameter catch basins and 12 inches for 72-inch and 96-inch diameter catch basins.
Catch basin evaluation of structural integrity for H-20 loading will be required for multiple junction catch basins and other structures which exceed the recommendations of the manufacturers.
The WSDOT Hydraulics Manual can be used to determine inlet grate capacity when capacity is of concern. When verifying capacity, assume grate areas on slopes are 80 percent free of debris, and “vaned” grates are 95 percent free. In sags or low spots, assume grates are 50 percent free of debris, and “vaned” grates are 75 percent free.
The maximum slope of the ground surface shall be 3:1 for a radius of 5 feet around a catch basin grate.
Catch basins shall be provided within 50 feet of the entrance to a pipe system to provide for silt and debris removal.
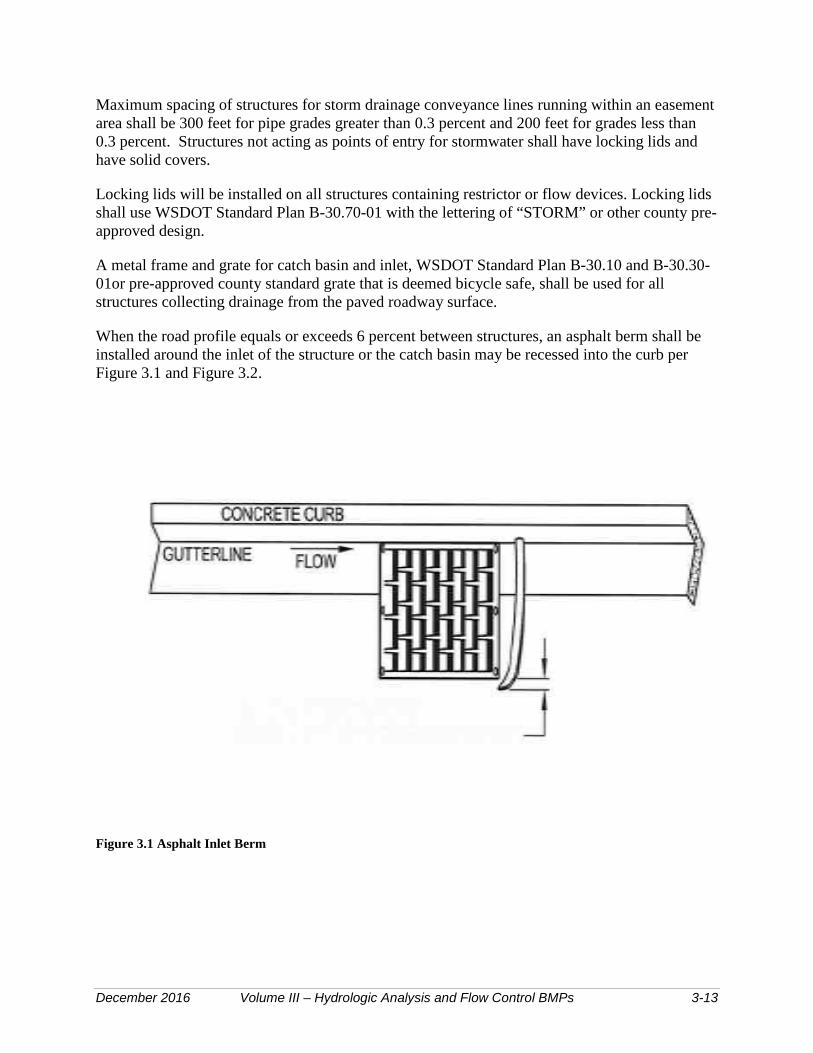
December 2016 Volume III – Hydrologic Analysis and Flow Control BMPs 3-13
Maximum spacing of structures for storm drainage conveyance lines running within an easement area shall be 300 feet for pipe grades greater than 0.3 percent and 200 feet for grades less than 0.3 percent. Structures not acting as points of entry for stormwater shall have locking lids and have solid covers.
Locking lids will be installed on all structures containing restrictor or flow devices. Locking lids shall use WSDOT Standard Plan B-30.70-01 with the lettering of “STORM” or other county pre-approved design.
A metal frame and grate for catch basin and inlet, WSDOT Standard Plan B-30.10 and B-30.30-01or pre-approved county standard grate that is deemed bicycle safe, shall be used for all structures collecting drainage from the paved roadway surface.
When the road profile equals or exceeds 6 percent between structures, an asphalt berm shall be installed around the inlet of the structure or the catch basin may be recessed into the curb per Figure 3.1 and Figure 3.2.
Figure 3.1 Asphalt Inlet Berm

December 2016 Volume III – Hydrologic Analysis and Flow Control BMPs 3-14
Figure 3.2 Recessed Curb Inlet (From Pierce County Standard Plan 10.0)
Table 3.6 presents the allowable structures and pipe sizes allowed by size of structure. All catch basins, inlets, etc., shall be marked as shown in Volume IV, Figure 4.24.

December 2016 Volume III – Hydrologic Analysis and Flow Control BMPs 3-15
Table 3.6 Allowable Structure and Pipe Sizes Maximum Pipe Diameter
Catch Basin Type (1) Spiral Rib CPEP, HDPE, PVC (2)
(Inches)
Concrete and Ductile Iron (Inches)
Inlet (4) 12 12
Type 1 (3) 15 15
Type IL (3) 18 18
Type 2-48-inch dia. 30 24
Type 2-54-inch dia. 36 30
Type 2-72-inch dia. 54 48
Type 2-96-inch dia. 72 72
(1) Catch basins, including manhole steps, ladder, and handholds shall conform to the WSDOT Standard Plans or an approved equal based upon submittal for approval.
(2) Maintain the minimum side wall thickness per WSDOT standards.
(3) Maximum 5 vertical feet allowed between grate and invert elevation.
(4) Normally allowed only for use in privately maintained drainage systems and must discharge to a catch basin immediately downstream.
NOTE: The applicant shall check with the County to determine the allowable pipe materials. Flow Splitter Designs
Many runoff treatment facilities can be designed as flow-through or on-line systems with flows above the water quality design flow or volume simply passing through the facility at a lower pollutant removal efficiency. However, it is sometimes desirable to restrict flows to runoff treatment facilities and bypass the remaining higher flows around them through off-line facilities. This can be accomplished by splitting flows in excess of the water quality design flow upstream of the facility and diverting higher flows to a bypass pipe or channel. The bypass typically enters a detention pond or the downstream receiving drainage system, depending on flow control requirements. In most cases, it is a designer’s choice whether runoff treatment facilities are designed as on-line or off-line; an exception is oil/water separators, which must be designed off-line.
A crucial factor in designing flow splitters is to ensure that low flows are delivered to the treatment facility up to the water quality design flow rate. Above this rate, additional flows are diverted to the bypass system with minimal increase in head at the flow splitter structure to avoid surcharging the runoff treatment facility under high flow conditions. Flow splitters may be used for purposes other than diverting flows to runoff treatment facilities. However, the following discussion is generally focused on using flow splitters in association with runoff treatment facilities.
Flow splitters are typically manholes or vaults with concrete baffles. In place of baffles, the splitter mechanism may be a half tee section with a solid top and an orifice in the bottom of the
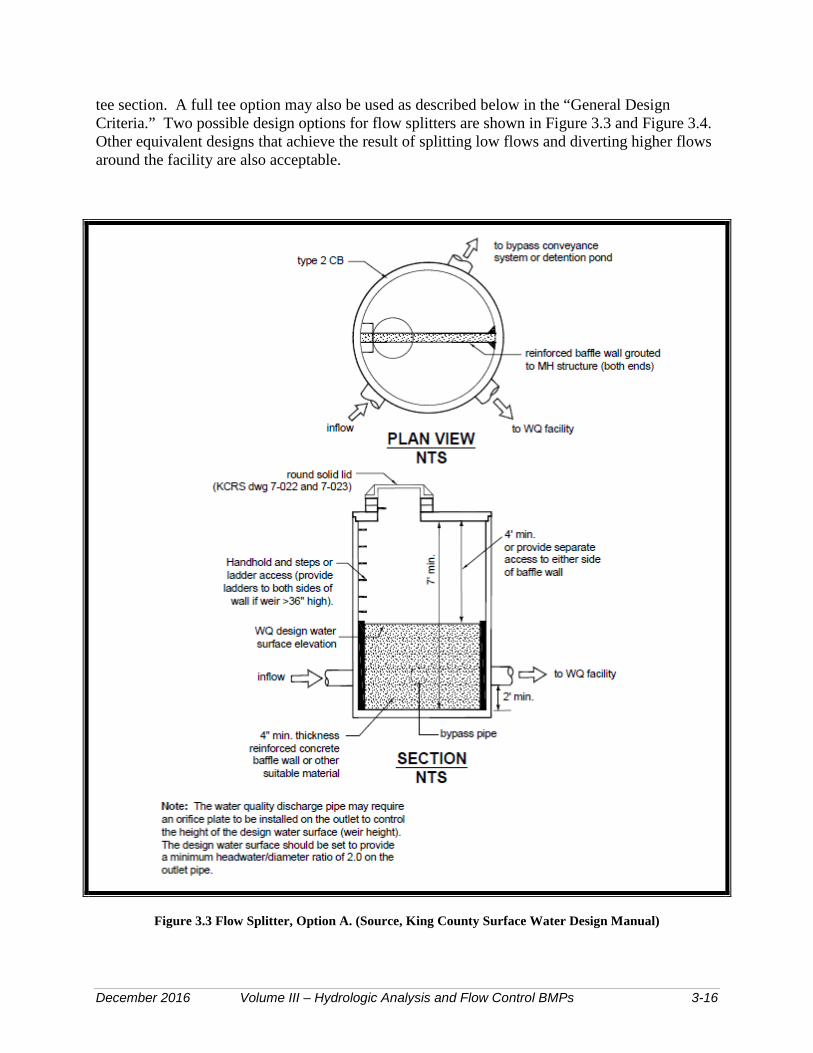
December 2016 Volume III – Hydrologic Analysis and Flow Control BMPs 3-16
tee section. A full tee option may also be used as described below in the “General Design Criteria.” Two possible design options for flow splitters are shown in Figure 3.3 and Figure 3.4. Other equivalent designs that achieve the result of splitting low flows and diverting higher flows around the facility are also acceptable.
Figure 3.3 Flow Splitter, Option A. (Source, King County Surface Water Design Manual)

December 2016 Volume III – Hydrologic Analysis and Flow Control BMPs 3-17
Figure 3.4 Flow Splitter, Option B. (Source, King County Surface Water Design Manual)
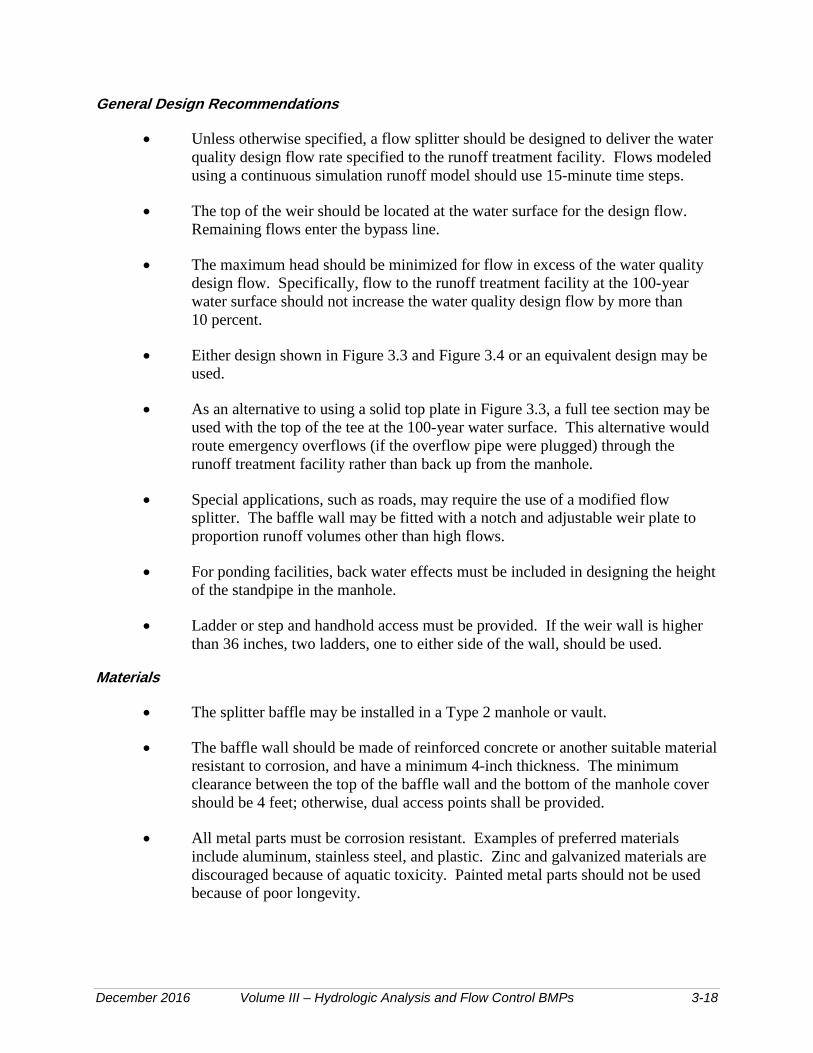
December 2016 Volume III – Hydrologic Analysis and Flow Control BMPs 3-18
General Design Recommendations
• Unless otherwise specified, a flow splitter should be designed to deliver the water quality design flow rate specified to the runoff treatment facility. Flows modeled using a continuous simulation runoff model should use 15-minute time steps.
• The top of the weir should be located at the water surface for the design flow. Remaining flows enter the bypass line.
• The maximum head should be minimized for flow in excess of the water quality design flow. Specifically, flow to the runoff treatment facility at the 100-year water surface should not increase the water quality design flow by more than 10 percent.
• Either design shown in Figure 3.3 and Figure 3.4 or an equivalent design may be used.
• As an alternative to using a solid top plate in Figure 3.3, a full tee section may be used with the top of the tee at the 100-year water surface. This alternative would route emergency overflows (if the overflow pipe were plugged) through the runoff treatment facility rather than back up from the manhole.
• Special applications, such as roads, may require the use of a modified flow splitter. The baffle wall may be fitted with a notch and adjustable weir plate to proportion runoff volumes other than high flows.
• For ponding facilities, back water effects must be included in designing the height of the standpipe in the manhole.
• Ladder or step and handhold access must be provided. If the weir wall is higher than 36 inches, two ladders, one to either side of the wall, should be used.
Materials
• The splitter baffle may be installed in a Type 2 manhole or vault.
• The baffle wall should be made of reinforced concrete or another suitable material resistant to corrosion, and have a minimum 4-inch thickness. The minimum clearance between the top of the baffle wall and the bottom of the manhole cover should be 4 feet; otherwise, dual access points shall be provided.
• All metal parts must be corrosion resistant. Examples of preferred materials include aluminum, stainless steel, and plastic. Zinc and galvanized materials are discouraged because of aquatic toxicity. Painted metal parts should not be used because of poor longevity.

December 2016 Volume III – Hydrologic Analysis and Flow Control BMPs 3-19
3.8 Outfalls
All piped discharges to streams, rivers, ponds, lakes, or other open bodies of water are designated outfalls and shall provide for energy dissipation to prevent erosion at or near the point of discharge. Properly designed outfalls are critical to reducing the risk of adverse impacts of concentrated discharges from on-site and downstream pipe systems and culverts. Outfall systems include rock splash pads, flow dispersal trenches, gabion or other energy dissipaters, and tightline systems. A tightline system is typically a continuous length of pipe used to convey flows down a steep or sensitive slope with appropriate energy dissipation at the discharge end.
Outfalls to streams, wetlands, or other waters of the State may be subject to review through the SEPA process, Shorelines Management Act, Thurston County Critical Areas Ordinance requirements and other applicable regulations, as well as subject to state or federal requirements including hydraulic and permitting requirements of the Washington State Department of Fish and Wildlife, Army Corps of Engineers or Washington State Department of Natural Resources. The requirements of these other reviews and permitting processes shall take precedence where more restrictive than those stated herein.
General Design Criteria for Outfall Features
Outfalls shall be designed to pass the peak flow from the design event for conveyances (Section 3.2) and to suffer no structural damage or undercutting during the 100-year, 24-hour storm event. The Project Engineer shall present calculations showing the velocity, discharge, and flow path of the 100-year, 24-hour event. For outfalls downstream of a flow control BMP, the unmitigated 100-year, 24-hour event flow shall be used.
The standard for outfall design is as shown in Figure 3.5. This design is limited to slopes of 2:1 or flatter where native vegetation is well established or where slope armoring is engineered to the Administrator or designee's satisfaction. For sites where the Project Engineer determines, and the Administrator or designee agrees, that the standard is impractical because of lack of space, danger of erosion, etc., alternate outfall designs shown in Figures 3.6 and 3.7 may be used. Other outfall designs will be allowed upon acceptance of the Administrator or designee.
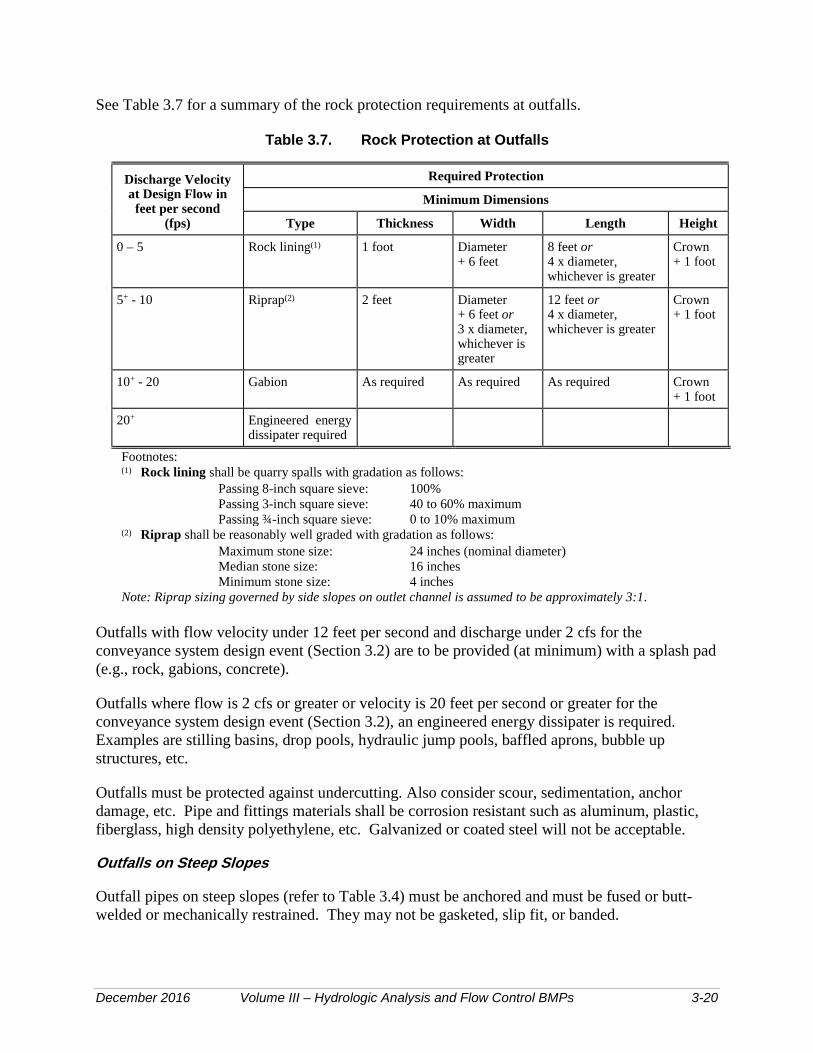
December 2016 Volume III – Hydrologic Analysis and Flow Control BMPs 3-20
See Table 3.7 for a summary of the rock protection requirements at outfalls.
Table 3.7. Rock Protection at Outfalls
Discharge Velocity at Design Flow in
feet per second (fps)
Required Protection
Minimum Dimensions
Type Thickness Width Length Height
0 – 5 Rock lining(1) 1 foot Diameter + 6 feet
8 feet or 4 x diameter, whichever is greater
Crown + 1 foot
5+ - 10 Riprap(2) 2 feet Diameter + 6 feet or 3 x diameter, whichever is greater
12 feet or 4 x diameter, whichever is greater
Crown + 1 foot
10+ - 20 Gabion As required As required As required Crown + 1 foot
20+ Engineered energy dissipater required
Footnotes: (1) Rock lining shall be quarry spalls with gradation as follows:
Passing 8-inch square sieve: 100% Passing 3-inch square sieve: 40 to 60% maximum Passing ¾-inch square sieve: 0 to 10% maximum
(2) Riprap shall be reasonably well graded with gradation as follows:
Maximum stone size: 24 inches (nominal diameter) Median stone size: 16 inches Minimum stone size: 4 inches
Note: Riprap sizing governed by side slopes on outlet channel is assumed to be approximately 3:1. Outfalls with flow velocity under 12 feet per second and discharge under 2 cfs for the conveyance system design event (Section 3.2) are to be provided (at minimum) with a splash pad (e.g., rock, gabions, concrete).
Outfalls where flow is 2 cfs or greater or velocity is 20 feet per second or greater for the conveyance system design event (Section 3.2), an engineered energy dissipater is required. Examples are stilling basins, drop pools, hydraulic jump pools, baffled aprons, bubble up structures, etc.
Outfalls must be protected against undercutting. Also consider scour, sedimentation, anchor damage, etc. Pipe and fittings materials shall be corrosion resistant such as aluminum, plastic, fiberglass, high density polyethylene, etc. Galvanized or coated steel will not be acceptable.
Outfalls on Steep Slopes
Outfall pipes on steep slopes (refer to Table 3.4) must be anchored and must be fused or butt-welded or mechanically restrained. They may not be gasketed, slip fit, or banded.

December 2016 Volume III – Hydrologic Analysis and Flow Control BMPs 3-21
On steep slopes, High Density Polyethylene (HDP) pipe may be laid on the surface or in a shallow trench, anchored, protected against sluicing, and hand compacted.
HDP outfall systems must be designed to address the material limitations as specified by the manufacturer, in particular thermal expansion and contraction. The coefficient of thermal expansion and contraction for HDP is on the order of 0.001-inch per foot per Fahrenheit degree. Sliding connections to address this thermal expansion and contraction must be located as close to the discharge end of the outfall system as is practical.
HDP systems longer than 100 feet must be secured at the upstream end and the downstream end placed in a four-foot section of the next larger pipe size. This sliding sleeve connection allows for high thermal expansion/contraction.
HDP shall comply with the requirements of Type III C5P34 as tabulated in ASTM D1248 and have the PPI recommended designation of PE3408 and have an ASTM D3350 cell classification of 345434C or 345534C. The pipe shall have a manufacturer's recommended hydrostatic design stress rating of 800 psi based on a material with a 1,600 psi design basis determined in accordance with ASTM D2837-69. The pipe shall have a suggested design working pressure of 50 psi at 73.4 degrees F and SDR of 32.5.
Outfall Pipe Energy Dissipation
Outfall pipes that discharge directly into a channel or water body shall be provided at a minimum with a rock splash pad (Figure 3.5). See Table 3.7 for minimum rock protection at outfalls.
Due to HDP pipe's ability to transmit flows of very high energy, special consideration for energy dissipation must be made. A sample gabion mattress energy dissipater for this purpose has been provided as Figure 3.6. This mechanism may not be adequate to address flows of very high energy: therefore, a more engineered energy dissipater structure as described above, may be warranted.
Mechanisms which reduce velocity prior to discharge from an outfall are encouraged. Examples are drop manholes and rapid expansion into pipes of much larger diameter.
The following sections provide general design criteria for various types of Outfall Features.
General Design Criteria to Protect Aquatic Species and Habitat
Outfall structures should be located where they minimize impacts to fish, shellfish, and their habitats. However, new pipe outfalls are also opportunities for low-cost fish habitat improvements. For example, an alcove of low-velocity water can be created by constructing the pipe outfall and energy dissipater back from the stream edge and digging a channel, over-widened to the upstream side, from the outfall to the stream (as shown in Figure 3.8). Overwintering juvenile and migrating adult salmonids may use the alcove as shelter during high flows. Potential habitat improvements should be discussed with the Washington Department of Fish and Wildlife area habitat biologist prior to inclusion in design.

December 2016 Volume III – Hydrologic Analysis and Flow Control BMPs 3-22
Bank stabilization, bioengineering, and habitat features may be required for disturbed areas. Outfalls that discharge to the Puget Sound or a major waterbody may require tide gates. For more information see the Thurston County Critical Areas Ordinance at http://www.co.thurston.wa.us/planning/critical_areas/criticalareas_home.htm and the Shoreline Master Program at http://www.co.thurston.wa.us/planning/shoreline/shoreline_qa.htm. For design guidance see the Washington Department of Fish and Wildlife Marine Shoreline Design Guidelines at http://wdfw.wa.gov/publications/01583/ or the Integrated Streambank Protection Guidelines at http://wdfw.wa.gov/publications/00046/.
Flow Dispersal Trench
The flow dispersal trenches shown in Figure 3.6 and Figure 3.7 should only be used when an outfall is necessary to disperse concentrated flows across uplands where no conveyance system exists, and the natural (existing) discharge is unconcentrated. The 100-year peak discharge rate per dispersal trench shall be less than or equal to 0.5 cfs. Other flow dispersal BMPs are described in Volume V.

December 2016 Volume III – Hydrologic Analysis and Flow Control BMPs 3-23
Figure 3.5 Pipe/Culvert Outfall Discharge Protection
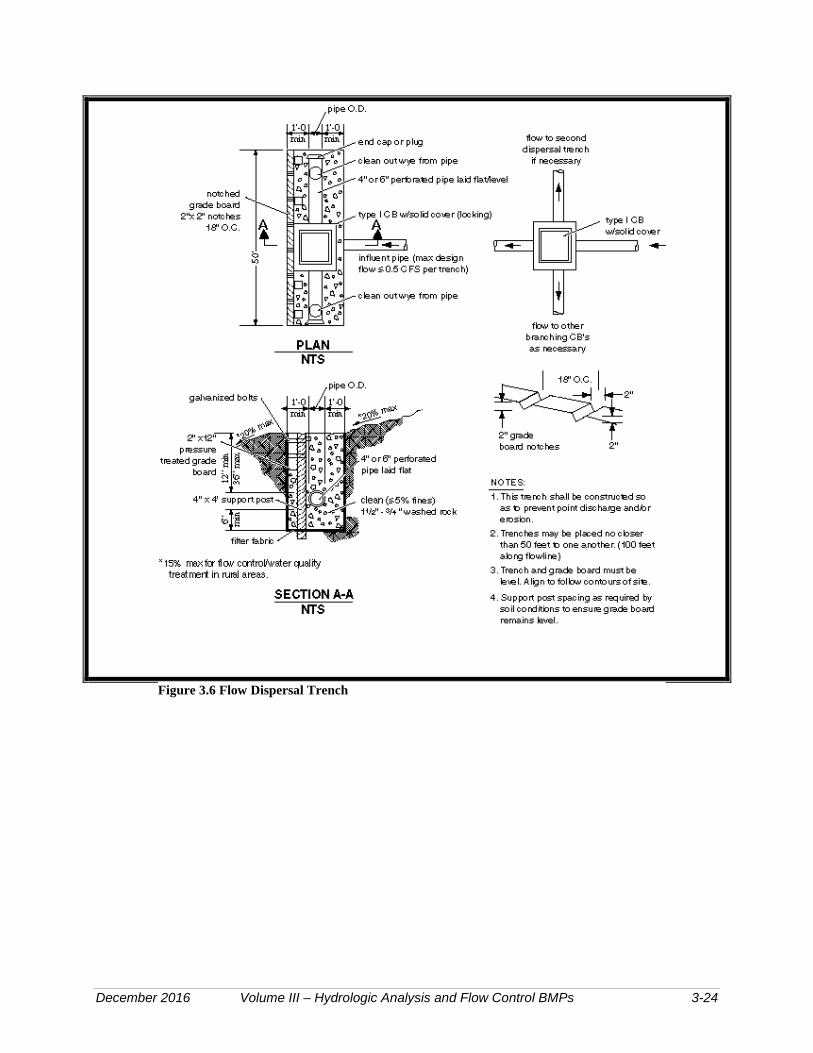
December 2016 Volume III – Hydrologic Analysis and Flow Control BMPs 3-24
Figure 3.6 Flow Dispersal Trench
December 2016 Volume III – Hydrologic Analysis and Flow Control BMPs 3-25
Figure 3.7 Alternative Flow Dispersal Trench
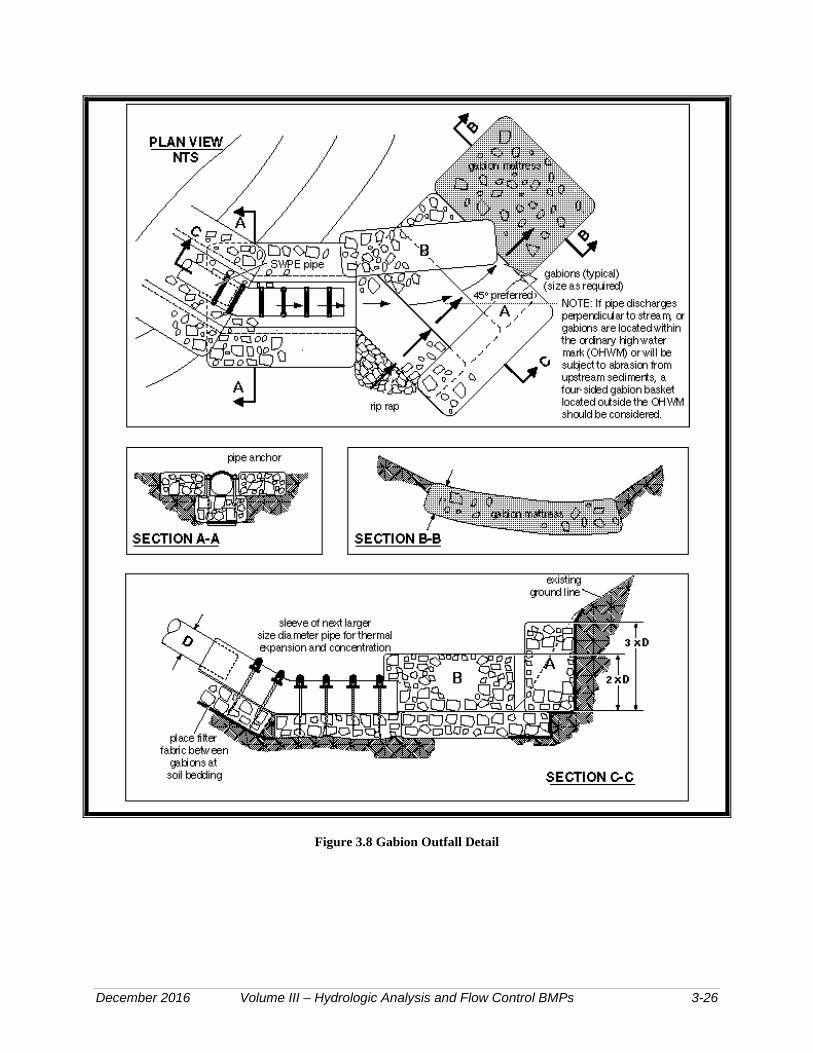
December 2016 Volume III – Hydrologic Analysis and Flow Control BMPs 3-26
Figure 3.8 Gabion Outfall Detail

December 2016 Volume III – Hydrologic Analysis and Flow Control BMPs 3-27
Figure 3.9. Diffuser TEE (an example of energy dissipating end feature)
Figure 3.10 Fish Habitat Improvement at New Outfalls
3.9 Flow Spreading Options Flow spreaders function to uniformly spread flows across the inflow portion of several types of stormwater management facilities (e.g., sand filters, biofiltration swales, filter strips, bioretention areas). There are five flow spreader options presented in this section:
• Option A – Anchored plate
• Option B – Concrete sump box
• Option C – Notched curb spreader
• Option D – Through-curb ports
• Option E – Interrupted curb.
Options A through C can be used for spreading flows that are concentrated. Any one of these options can be used when spreading is required by the facility design criteria. Options A through C can also be used for unconcentrated flows, and in some cases must be used, such as to correct for moderate grade changes along a filter strip.

December 2016 Volume III – Hydrologic Analysis and Flow Control BMPs 3-28
Options D and E are only for flows that are already unconcentrated and enter a filter strip, bioretention area or continuous inflow biofiltration swale. Other flow spreader options are possible with approval from the Administrator or designee.
General Design Criteria
• Where flow enters the flow spreader through a pipe, it is recommended that the pipe be submerged to the extent practical to dissipate energy as much as possible.
• For higher inflows (velocities greater than 5 feet per second for the 100-year recurrence interval storm), a Type 1 catch basin should be positioned in the spreader and the inflow pipe should enter the catch basin with flows exiting through the top grate. The top of the grate should be lower than the level spreader plate, or if a notched spreader is used, lower than the bottom of the V-notches.
Option A – Anchored Plate (Figure 3.11)
• An anchored plate flow spreader should be preceded by a sump having a minimum depth of 8 inches and minimum width of 24 inches. If not otherwise stabilized, the sump area should be lined to reduce erosion and to provide energy dissipation.
• The top surface of the flow spreader plate should be level, projecting a minimum of 2 inches above the ground surface of the water quality facility, or V-notched with notches 6 to 10 inches on center and 1 to 6 inches deep (use shallower notches with closer spacing). Alternative designs may also be used.
• A flow spreader plate should extend horizontally beyond the bottom width of the facility to prevent water from eroding the side slope. The horizontal extent should be such that the bank is protected for all flows up to the 100-year recurrence interval flow or the maximum flow that will enter the water quality facility.
• Flow spreader plates should be securely fixed in place.
• Flow spreader plates may be made of either wood, metal, fiberglass reinforced plastic, or other durable material. If wood, pressure treated 4- by 10-inch lumber or landscape timbers are acceptable.
• Anchor posts should be 4-inch square concrete, tubular stainless steel, or other material resistant to decay.
Option B – Concrete Sump Box (Figure 3.12)
• The wall of the downstream side of a rectangular concrete sump box should extend a minimum of 2 inches above the treatment bed. This serves as a weir to spread the flows uniformly across the bed.

December 2016 Volume III – Hydrologic Analysis and Flow Control BMPs 3-29
• The downstream wall of a sump box should have “wing walls” at both ends. Side walls and returns should be slightly higher than the weir so that erosion of the side slope is minimized.
• Concrete for a sump box can be either cast-in-place or precast, but the bottom of the sump should be reinforced with wire mesh for cast-in-place sumps.
• Sump boxes should be placed over bases that consists of 4 inches of crushed rock, five-eighths-inch minus to help assure the sump remains level.
Option C – Notched Curb Spreader (Figure 3.13)
Notched curb spreader sections should be made of extruded concrete laid side-by-side and level. Typically five “teeth” per 4-foot section provide good spacing. The space between adjacent “teeth” forms a V-notch.
Option D –Through-Curb Ports (Figure 3.14)
Unconcentrated flows from paved areas entering filter strips, bioretention areas, or continuous inflow biofiltration swales can use curb ports or interrupted curbs (Option E) to allow flows to enter the strip or swale. Curb ports use fabricated openings that allow concrete curbing to be poured or extruded while still providing an opening through the curb to admit water to the water quality facility.
Openings in the curb should be at regular intervals but at least every 6 feet (minimum). The width of each curb port opening should be a minimum of 11 inches. Approximately 15 percent or more of the curb section length should be in open ports, and no port should discharge more than about 10 percent of the flow.
Option E – Interrupted Curb (No Figure)
Interrupted curbs are sections of curb placed to have gaps spaced at regular intervals along the total width (or length, depending on facility) of the treatment area. At a minimum, gaps should be every 6 feet to allow distribution of flows into the treatment facility before they become too concentrated. The opening should be a minimum of 12 inches. As a general rule, no opening should discharge more than 10 percent of the overall flow entering the facility.

December 2016 Volume III – Hydrologic Analysis and Flow Control BMPs 3-30
Figure 3.11 Flow Spreader Option A: Anchored Plate. (Source: Stormwater Management Manual for Western Washington)
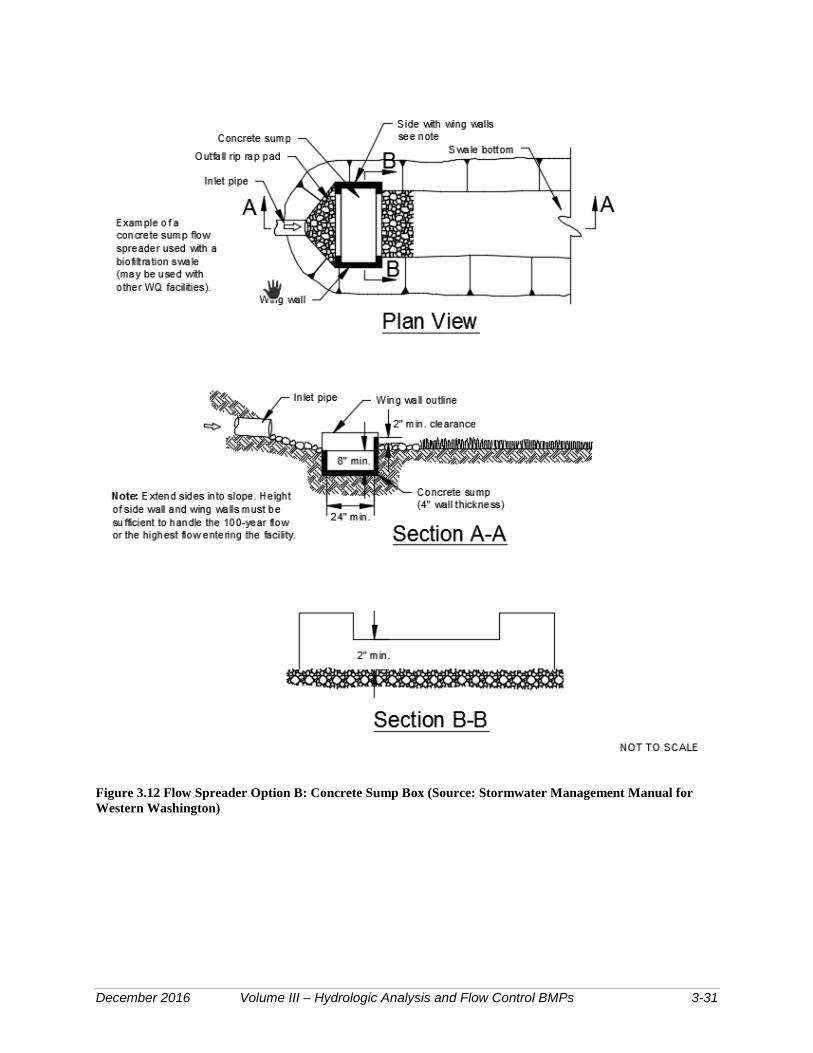
December 2016 Volume III – Hydrologic Analysis and Flow Control BMPs 3-31
Figure 3.12 Flow Spreader Option B: Concrete Sump Box (Source: Stormwater Management Manual for Western Washington)
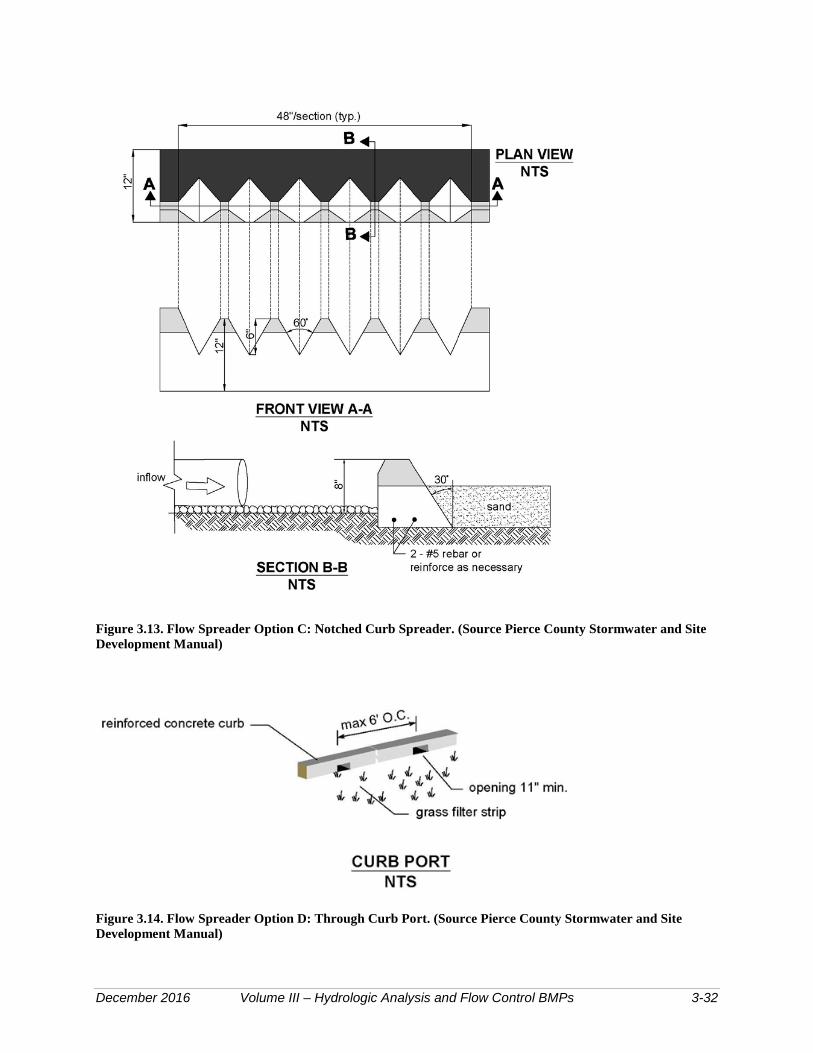
December 2016 Volume III – Hydrologic Analysis and Flow Control BMPs 3-32
Figure 3.13. Flow Spreader Option C: Notched Curb Spreader. (Source Pierce County Stormwater and Site Development Manual)
Figure 3.14. Flow Spreader Option D: Through Curb Port. (Source Pierce County Stormwater and Site Development Manual)

December 2016 Volume III – Hydrologic Analysis and Flow Control BMPs 3-33
3.10 Culvert Criteria Culverts are single runs of pipe that are open at both ends and have no structures, such as manholes or catch basins.
Approved pipe materials are detailed in Section 3.7.3. Galvanized or aluminized pipe is not permitted in marine environments or where contact with salt water may occur, even infrequently through backwater events.
Culvert Design Criteria
Flow capacity shall be determined by analyzing inlet and outlet control for headwater depth. Nomographs used for culvert design shall be included in the submitted Drainage Report. Appendix III-C also includes several nomographs useful for culvert sizing.
All culverts shall be designed to convey the flows per Section 3.2. The maximum design headwater depth shall be 1.5 times the diameter of the culvert, with no saturation of roadbeds. Minimum culvert diameters are as follows:
• For cross culverts under public roadways – minimum 18 inches, 12 inches if grade and cover do not allow for 18 inches, with County acceptance.
• For roadside culverts, including driveway culverts – minimum 12 inches.
• For culverts on private property – minimum 8 inches.
Inlets and outlets shall be protected from erosion by rock lining, riprap, or bio-stabilization as detailed in Table 3.8, Channel Protection.
Debris and access barriers are required on inlet and outlet ends of all culverts equal to or greater than 18 inches in diameter. Culverts equal to or greater than 36 inches in diameter or within stream corridors are exempt.
Minimum culvert velocity shall be 2 feet per second and maximum culvert velocity shall be 15 feet per second. Thirty (30) feet per second may be used with an engineered outlet protection design. There is no maximum velocity for ductile iron or HDPE pipe, but outlet protection shall be provided.
All CPEP and PVC culverts and pipe systems shall have concrete or rock headwalls at exposed pipe ends.
Bends are not permitted in culvert pipes.
The following minimum cover shall be provided over culverts:
• 2 feet under roads.
• 1 foot under roadside applications and on private property, exclusive of roads.
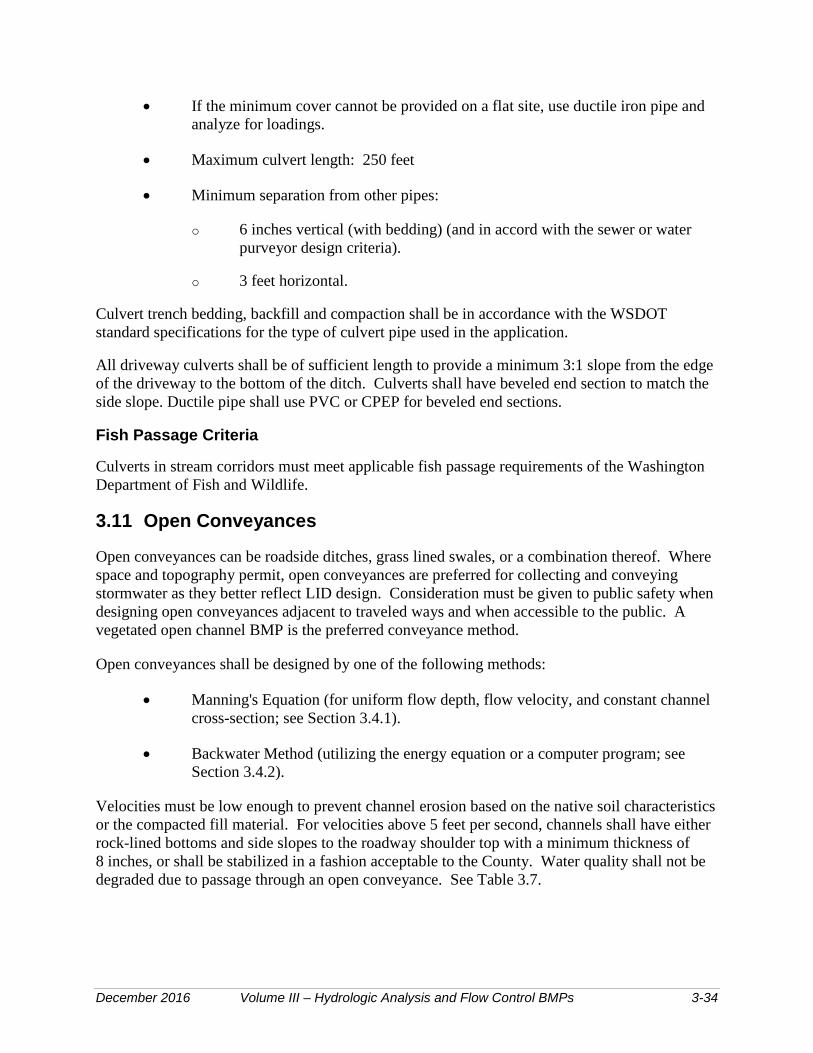
December 2016 Volume III – Hydrologic Analysis and Flow Control BMPs 3-34
• If the minimum cover cannot be provided on a flat site, use ductile iron pipe and analyze for loadings.
• Maximum culvert length: 250 feet
• Minimum separation from other pipes:
o 6 inches vertical (with bedding) (and in accord with the sewer or water purveyor design criteria).
o 3 feet horizontal.
Culvert trench bedding, backfill and compaction shall be in accordance with the WSDOT standard specifications for the type of culvert pipe used in the application.
All driveway culverts shall be of sufficient length to provide a minimum 3:1 slope from the edge of the driveway to the bottom of the ditch. Culverts shall have beveled end section to match the side slope. Ductile pipe shall use PVC or CPEP for beveled end sections.
Fish Passage Criteria
Culverts in stream corridors must meet applicable fish passage requirements of the Washington Department of Fish and Wildlife.
3.11 Open Conveyances
Open conveyances can be roadside ditches, grass lined swales, or a combination thereof. Where space and topography permit, open conveyances are preferred for collecting and conveying stormwater as they better reflect LID design. Consideration must be given to public safety when designing open conveyances adjacent to traveled ways and when accessible to the public. A vegetated open channel BMP is the preferred conveyance method.
Open conveyances shall be designed by one of the following methods:
• Manning's Equation (for uniform flow depth, flow velocity, and constant channel cross-section; see Section 3.4.1).
• Backwater Method (utilizing the energy equation or a computer program; see Section 3.4.2).
Velocities must be low enough to prevent channel erosion based on the native soil characteristics or the compacted fill material. For velocities above 5 feet per second, channels shall have either rock-lined bottoms and side slopes to the roadway shoulder top with a minimum thickness of 8 inches, or shall be stabilized in a fashion acceptable to the County. Water quality shall not be degraded due to passage through an open conveyance. See Table 3.7.
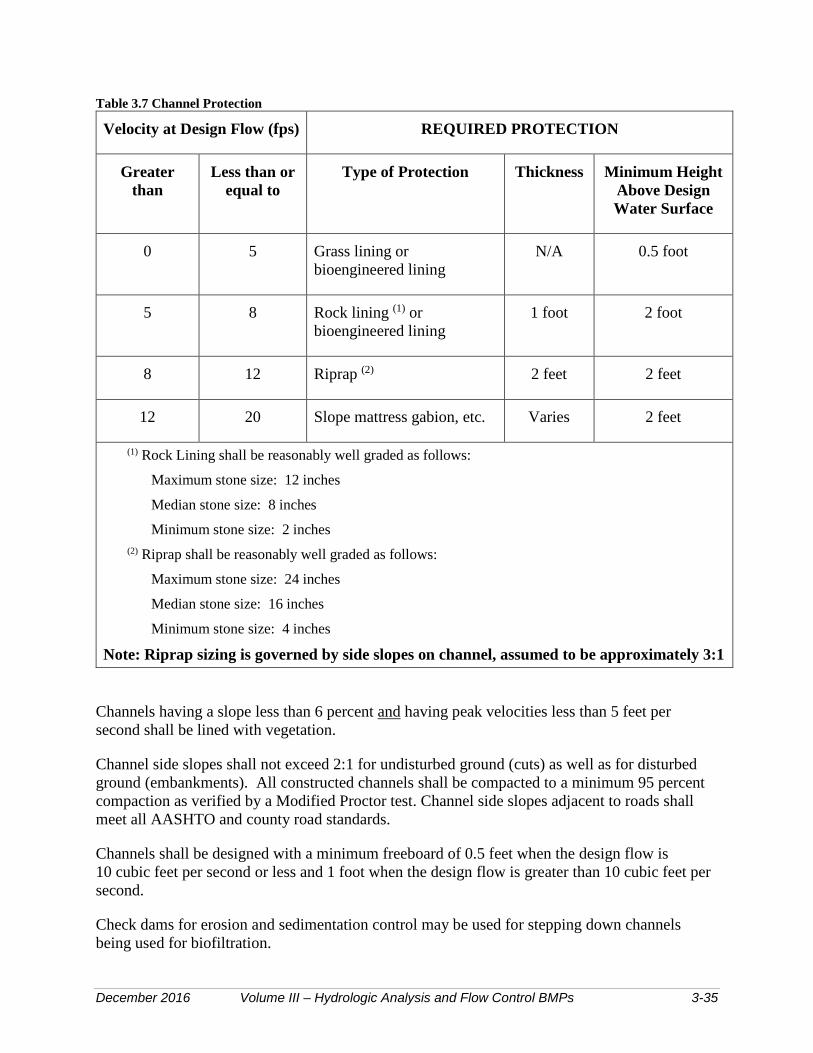
December 2016 Volume III – Hydrologic Analysis and Flow Control BMPs 3-35
Table 3.7 Channel Protection
Velocity at Design Flow (fps) REQUIRED PROTECTION
Greater than
Less than or equal to
Type of Protection Thickness Minimum Height Above Design Water Surface
0 5 Grass lining or bioengineered lining
N/A 0.5 foot
5 8 Rock lining (1) or bioengineered lining
1 foot 2 foot
8 12 Riprap (2) 2 feet 2 feet
12 20 Slope mattress gabion, etc. Varies 2 feet
(1) Rock Lining shall be reasonably well graded as follows:
Maximum stone size: 12 inches
Median stone size: 8 inches
Minimum stone size: 2 inches (2) Riprap shall be reasonably well graded as follows:
Maximum stone size: 24 inches
Median stone size: 16 inches
Minimum stone size: 4 inches
Note: Riprap sizing is governed by side slopes on channel, assumed to be approximately 3:1
Channels having a slope less than 6 percent and having peak velocities less than 5 feet per second shall be lined with vegetation.
Channel side slopes shall not exceed 2:1 for undisturbed ground (cuts) as well as for disturbed ground (embankments). All constructed channels shall be compacted to a minimum 95 percent compaction as verified by a Modified Proctor test. Channel side slopes adjacent to roads shall meet all AASHTO and county road standards.
Channels shall be designed with a minimum freeboard of 0.5 feet when the design flow is 10 cubic feet per second or less and 1 foot when the design flow is greater than 10 cubic feet per second.
Check dams for erosion and sedimentation control may be used for stepping down channels being used for biofiltration.
December 2016 Volume III – Hydrologic Analysis and Flow Control BMPs 3-36
3.12 Private Drainage Systems
The engineering analysis for a private drainage system is the same as a County system.
Discharge Locations
Stormwater cannot discharge directly onto County roads or into a County system without prior County approval3, with the exception of single family residences. Discharges to a County system shall be into a structure such as an inlet, catch basin, manhole, through an approved sidewalk underdrain or curb drain, or into an existing or created County ditch. Concentrated drainage will not be allowed to discharge across sidewalks, curbs, or driveways.
All buildings are required to have roof downspouts and subsurface drains directed to either an infiltration system, dispersion system, or to the storm drainage system.
Drainage Stub-outs
If drainage outlets (stub outs) are to be provided for each individual lot, the stub outs shall conform to the requirements outlined below. Note that all applicable Core Requirements in Volume I, in particular Core Requirement #5, must also be addressed for the project site.
• Each outlet shall be suitably located at the lowest elevation on the lot, so as to service all future roof downspouts and footing drains, driveways, yard drains, and any other surface or subsurface drains necessary to render the lots suitable for their intended use. Each outlet shall have free-flowing, positive drainage to an approved storm water conveyance system or to an approved outfall location.
• Outlets on each lot shall be located with a 5-foot-high, 2" x 4" stake marked "storm" or "drain." For stub-outs to a surface drainage, the stub-out shall visibly extend above surface level and be secured to the stake.
• The developer and/or contractor is responsible for coordinating the locations of all stub-out conveyance lines with respect to the utilities (e.g., power, gas, telephone, television).
• All individual stub-outs shall be privately owned and maintained by the lot home owner including from the property line to the riser on the main line.
3 A County connection authorization form must be completed and submitted for approval.

December 2016 Volume III – Hydrologic Analysis and Flow Control BMPs Ref-1
Volume III References Chin, D.A., Water Resources Engineering, Prentice Hall, New Jersey, 2000.
Chow, V.T., Handbook of Applied Hydrology, McGraw Hill Book Co., New York, 1964.
Clark County Department of Public Works, Stormwater Management Manual, 2008. < http://www.co.clark.wa.us/water-resources/SWMP/stormwater%20public%20involvment.html >
Department of Ecology, Stormwater Management Manual for the Puget Sound Basin, February, 1992.
Dinacola, R.S., Characterization and Simulation of Rainfall-Runoff Relations for Headwater Basins in Western King and Snohomish Counties, Washington, USGS Water Resources Investigations Report 89-4052, 1989.
Department of Ecology. Guidance for UIC Wells that Manage Stormwater, December, 2006. Publication Number 05-10-067 also available online at http://www.ecy.wa.gov/biblio/0510067.html.
Ferguson, Bruce K., Stormwater Infiltration, Lewis Publishers, 1994.
Horner, Richard Fundamentals of Urban Runoff Management-Technical and Institutional Issues, 1994.
Huber, Wayne, and Robert Dickinson, Stormwater Management Model Version 4 Part A: User's Manual, Environmental Research Laboratory, Athens, GA, 1988.
King County Runoff Time Series (KCRTS), King County Department of Natural Resources, Personal Communication, 1999.
Massmann, Joel & Carolyn Butchart, U. of Washington Infiltration Characteristics, Performance, and Design of Storm Water Facilities, March 2000.
NOAA Atlas 2, Precipitation Frequency Atlas of the Western United States, Volume IX-Washington.
Rawls, W.J., Brakensiek, D.L. and Saxton, K.E. Estimation of Soil Properties. Transactions of the American Society of Agricultural Engineers, Vol. 25, No. 5, pp. 1316-1320, 1982.
Stubdaer, J.M., The Santa Barbara Urban Hydrograph Method, National Symposium on Urban Hydrology and Sediment Control, University of Kentucky, Lexington, KY, 1975.
USDA-SCS, Technical Release No. 20 (TR-20) Model Project Formulation, 1982.
USDA-SCS, Technical Release No. 55: Urban Hydrology for Small Watersheds, 1986.
USEPA, Hydrological Simulation Program - Fortran HSPF Users’ Manual for Release 9, EPA 600/3-84-066, Environmental Research Laboratory, Athens, GA, June 1984.
Wiltsie, Edward, Stormwater Facilities Performance Study, Infiltration Pond Testing and Data Evaluation, August 10, 1998
December 2016 Volume III – Hydrologic Analysis and Flow Control BMPs Ref-2
Additional Resources Barfield, B.J., and Warner, R.C., and Haan, C.T. Applied Hydrology and Sedimentology for
Disturbed Areas. Oklahoma Technical Press, Stillwater, Oklahoma, 1983.
Bentall, R., Methods of Collecting and Interpreting Ground Water Data, U.S. G. S. Water Supply Paper 1544-H., 1963, 97 p.
Bianchi, W.C. and D.C. Muckel, Ground Water Recharge Hydrology, ARS 41-161, USDA, 1970, 62 p.
Bouwer, Herman., Groundwater Hydrology, McGraw-Hill Book Company, Inc., N.Y., 1978.
Camp Dresser & McKee, Larry Walker Associates, Uribe and Associates, and Resource Planning Associates. California Storm Water Best Management Practice Handbooks. March 1993.
Caraco, D., Claytor, R., Stormwater BMP Design Supplement for Cold Climates USEPA, December 1997.
Davis, S.N. and R.J. DeWiest, Hydrogeology. John Wiley and Sons, N.Y., 1966.
Ferguson, Bruce K., Stormwater Infiltration, Lewis Publishers, 1994.
Ferris, J.G., D.B. Knowles, R.H. Brown, and R.W. Stallman, Theory of Aquifer Tests, USGS, Water Supply Paper No. 1536-E.
Gaus, Jennifer J., Soils of Stormwater Infiltration Basins in the Puget Sound Region: Trace Metal Form and Concentration and Comparison to Washington State Department of Ecology Guidelines, Master of Science, U. of Washington, 1993.
Hannon, J.B., Underground Disposal of Storm Water Runoff, Design Guidelines Manual, California Department of Transportation, U.S. Department of Transportation, Washington, DC (FHWA-TS-80-218), February 1980.
Harrington, Bruce W., Design and Construction of Infiltration Trenches, Seminar-Urban Watershed Management, How to Design Urban Stormwater Best Management Practices, ASCE, July, 1994.
Hilding, Karen, A Survey of Infiltration Basins in the Puget Sound Regions, Masters Project, U. of California, 1993.
Jacobson, Michael A., Summary and Conclusions from Applied Research on Infiltration Basins and Recommendations for Modifying the Washington Department of Ecology Stormwater Management Manual for the Puget Sound Basin. University of Washington, Center for Urban Water Resources Management. May 1993.
King County, Washington, Surface Water Design Manual, September 1, 1998.

December 2016 Volume III – Hydrologic Analysis and Flow Control BMPs Ref-3
Klochak, John R., An Investigation of the Effectiveness of Infiltration Systems in Treating Urban Runoff, Master of Science, U. of Washington, 1992.
Konrad, C.P., Jensen, B.W., Burges, S.J, Reinelt, L.E. On-Site Residential Stormwater Management Alternatives. Center for Urban Water Resources, University of Washington. September 1995.
Livingston, E. H., Infiltration Practices: The Good, the Bad, and the Ugly, National Conference on Urban Runoff Management, Chicago, Ill. 1993.
Moore, John, Seepage: A System for Early Evaluation of the Pollution Potential of Agriculture Groundwater Environments, SCS, 1988.
Pettyjohn, W.A., Introduction to Artificial Ground Water Recharge, USEPA, Ada, Oklahoma, National Waterwell Association, Worthington, Ohio, 1981, 44 p.
Rawls, W.J., D.L. Brakensiek, and K.E. Saxton, Estimation of Soil Properties. Transactions of the American Society of Agricultural Engineers, Vol. 25, No. 5, pp. 1316-1320, 1982.
Schueler, Thomas, et al., A Current Assessment of Urban Best Management Practices, March, 1992.
Soil Conservation Service, SCS National Engineering Handbook Section 8, Engineering Geology, USDA, 1978.
Soil Conservation Service, USDA, SCS National Engineering Handbook, Section 18 Ground Water, 1968.
Soil Conservation Service, USDA, SCS Technical Release No. 36, Ground Water Recharge, Engineering Division, 1967, 22 p.
Todd, D.K., Ground Water Hydrology, John Wiley and Sons, Inc., N.Y., 1959.
Urbonas and Stahre, “Stormwater Best Management Practices”, Prentiss-Hall, 1993.
WEF Manual of Practice #23 Urban Runoff Quality Management, Water Environment Federation & ASCE, 1998.
Wenzel, L.K., Methods of Determining Permeability of Water Bearing Materials, USGS Water Supply Paper 887, 1942.
Wiltsie, Edward, Stormwater Facilities Performance Study, Infiltration Pond Testing and Data Evaluation, August 10, 1998.
Woodward-Clyde, BMP Design Recommendations, November 1995.
December 2016 Volume III – Hydrologic Analysis and Flow Control BMPs A-1
Appendix III-A Methods for Determining Design Infiltration Rates This appendix provides details on methods to estimate the design infiltration rate for infiltration facilities. The methods described include:
• Simple Method 1 – Field Testing Procedures
• Simple Method 2 – Soil Property Relationships
• Method 3 – Soil Grain Size Analysis Method
Simple Method 1 – Field Testing Procedures (In-Situ)
1. Excavate to the bottom elevation of the proposed infiltration facility.
2. Measure the infiltration rate of the underlying soil using either the EPA falling head percolation test procedure as modified for Thurston County (described below), the EPA falling head percolation test procedure as modified by Clark County (2015) (refer to Clark County Drainage Manual), the double ring infiltrometer test (ASTM D3385)(not described here, use ASTM procedure), or the Department of Ecology large and small scale Pilot Infiltration Test (PIT) described below and presented in the Stormwater Management Manual for Western Washington (Ecology 2012).
3. Fill test hole or apparatus with water and maintain at depths above the test elevation for saturation periods specific to the appropriate test.
4. Following the saturation period, the infiltration rate shall be determined in accordance with the specified test procedures.
5. Perform at least three small-scale tests for each proposed infiltration facility location or the minimum required number of infiltration tests at the proposed infiltration facility location as specified in Volume III, Chapter 2, Section 2.3.3 and by recommendations of the geotechnical professional.
6. Determine a representative infiltration rate.
For all field testing procedures, apply safety factor to obtain design infiltration rate (see next section).
Safety Factor for Field Measurements
The following equation incorporates safety factors to account for uncertainties related to testing, depth to the water table or impervious strata, infiltration receptor geometry, and long-term reductions in permeability due to biological activity and accumulation of fine sediment. Note that the safety factors below may not apply to the infiltration testing conducted for bioretention,

December 2016 Volume III – Hydrologic Analysis and Flow Control BMPs A-2
permeable pavement and/or rain gardens (see Volume V, Sections 2.2.5 and 2.2.6 for additional information). This equation estimates the maximum design infiltration rate, Idesign. Depending on site conditions, additional reduction of the design infiltration rate may be appropriate. In no case may the design infiltration rate exceed 30 inches/hour.
Idesign = Imeasured x Ftesting x Fgeometry x Fplugging
Ftesting accounts for uncertainties in the testing methods.
• For the full scale PIT method, Ftesting = 0.75;
• For the small-scale PIT method, Ftesting = 0.50;
• For smaller-scale infiltration tests such as the double-ring infiltrometer test, Ftesting = 0.40;
• For grain size analysis, Ftesting = 0.40;
• For the EPA method, the SDI (ASTM D3385) method, Ftesting = 0.50.
These values are intended to represent the difference in each test’s ability to estimate the actual saturated hydraulic conductivity. The assumption is the larger the scale of the test, the more reliable the result. Ftesting accounts for uncertainties in the testing methods.
Fgeometry accounts for the influence of facility geometry and depth to the water table or impervious strata on the actual infiltration rate. A shallow water table or impervious layer reduces the effective infiltration rate of a large pond, but this would not be reflected in a small scale test. Fgeometry must be between 0.25 and 1.0 as determined by the following equation: Fgeometry = 4 D/W + 0.05
Where: D = Depth from the bottom of the proposed facility to the maximum wet season water table or nearest impervious layer, whichever is less
W = Width of facility
If Fgeometry is calculated as greater than 1, use 1, if calculated value is less than 0.25, use 0.25.
Fplugging accounts for reductions in infiltration rates over the long term due to plugging of soils. This factor is:
• 0.7 for loams and sandy loams
• 0.8 for fine sands and loamy sands
• 0.9 for medium sands

December 2016 Volume III – Hydrologic Analysis and Flow Control BMPs A-3
• 1.0 for coarse sands or cobbles, or any soil type in an infiltration facility preceded by a water quality facility (not including a pre-treatment unit or forebay for course sediment removal).
Falling Head Percolation Test Procedure (as Modified for Thurston County)4
Note: This test may not be used to demonstrate infeasibility of bioretention, permeable pavement, or rain gardens in meeting Core Requirement #5.
1. Number and Location of Tests
A minimum of three tests shall be performed within the area proposed for an infiltration facility. Tests shall be spaced uniformly throughout the area. For larger facilities or if soil conditions are highly variable, more tests may be required (see minimum testing requirements in Volume III).
2. Preparation of Test Hole (as modified for Thurston County)
The diameter of each test hole is 8 inches, dug or bored to the proposed bottom elevation of the infiltration facility or to the most limiting soil horizon. To expose a natural soil surface, the bottom of the hole is scratched with a sharp pointed instrument and the loose material is removed from the test hole. A 6-inch-inner-diameter, 4-foot long, PVC pipe is set into the hole and pressed 6 inches into the soil, then 2 inches of 1/2- to 3/4-inch rock are placed in the pipe to protect the bottom from scouring when water is added.
3. Soaking Period
The pipe is carefully filled with at least 12 inches of clear water. The depth of water must be maintained for at least 4 hours and preferably overnight if clay soils are present. A funnel with an attached hose or similar device may be used to prevent water from washing down the sides of the hole. Automatic siphons or float valves may be employed to automatically maintain the water level during the soaking period. It is extremely important that the soil be allowed to soak for a sufficiently long period of time to allow the soil to swell if accurate results are to be obtained.
In sandy soils with little or no clay, soaking is not necessary. If, after filling the pipe twice with 12 inches of water, the water seeps completely away in less than 10 minutes, the test can proceed immediately.
4. Percolation Rate Measurement
Except for sandy soils, percolation rate measurements are made at least 15 hours but no more than 30 hours after the soaking period began. The water level is adjusted to 6 inches above the gravel (or 8 inches above the bottom of the hole). At no time during the test is the water level allowed to rise more than 6 inches above the gravel. Immediately after adjustment, the water level is measured from a fixed reference point to the nearest 1/16th-inch, at 30 minute intervals.
4 (Source: EPA, On-site Wastewater Treatment and Disposal Systems, 1980)

December 2016 Volume III – Hydrologic Analysis and Flow Control BMPs A-4
The test is continued until two successive water level drops do not vary by more than 1/16th-inch within a 90 minute period. At least three measurements are to be made.
After each measurement, the water level is readjusted to the 6-inch level. The last water level drop is used to calculate the percolation rate.
In sandy soils or soils in which the first 6 inches of water added after the soaking period seeps away in less than 30 minutes, water level measurements are made at 10-minute intervals for a 1-hour period. The last water level drop is used to calculate the percolation rate.
5. Percolation Rate Calculation
The percolation rate is calculated for each test site by dividing the time interval used between measurements by the magnitude of the last water level drop. This calculation results in a percolation rate in minutes/inch. To calculate the percolation rate for the area, average the rates obtained from each hole. (If tests in the area vary by more than 20 minutes/inch, variations in soil type are indicated. Under these circumstances, percolation rates should not be averaged.) The percolation rate in minutes/inch should be converted to infiltration rate in inches/hour and then to compute the design infiltration rate (Idesign), the final infiltration rates must then be adjusted by the appropriate correction factors outlined previously.
Example: If the last measured drop in water level after 30 minutes is 5/8-inch, then:
percolation rate = (30 minutes)/(5/8 inch) = 48 minutes/inch. Convert this to inches per hour by inverting & multiplying by 60: infiltration rate – 1/48*60 = 1.25 inches/hour. (At a minimum, a safety factor “Ftesting” of 0.5 is be applied to all field methods for determining infiltration rates.)
Washington Department of Ecology Infiltration PIT Method The Large-Scale Pilot Infiltration Test (PIT) consists of a relatively large-scale infiltration test to better approximate infiltration rates for design of stormwater infiltration facilities. The PIT reduces some of the scale errors associated with relatively small-scale tests such as the Modified Falling Head Percolation Test, double ring infiltrometer or “stove-pipe” infiltration tests. It is not a standard test but rather a practical field procedure recommended by Ecology’s Technical Advisory Committee. It is the preferred method for estimating the measured (initial) saturated hydraulic conductivity (Ksat) of the soil profile beneath the proposed infiltration facility. Following is a step-by-step description of the testing procedure.
Infiltration Test
1. Excavate the test pit to the depth of the bottom of the proposed infiltration facility. Lay back the slopes sufficiently to avoid caving and erosion during the test.
2. The horizontal surface area of the bottom of the test pit should be approximately 100 square feet.
3. Accurately document the size and geometry of the test pit.

December 2016 Volume III – Hydrologic Analysis and Flow Control BMPs A-5
4. Install a vertical measuring rod (minimum 5 feet long) marked in half-inch increments in the center of the pit bottom.
5. Use a rigid 6-inch diameter pipe with a splash plate on the bottom to convey water to the pit and reduce side-wall erosion or excessive disturbance of the pond bottom. Excessive erosion and bottom disturbance will result in clogging of the infiltration receptor and yield lower than actual infiltration rates.
6. Add water to the pit at a rate that will maintain a water level between 3 and 4 feet above the bottom of the pit. A rotameter can be used to measure the flow rate into the pit.
Note: A water level of 3 to 4 feet provides for easier measurement and flow stabilization control. However, the depth must not exceed the proposed maximum depth of water expected in the completed facility.
7. Every 15 to 30 minutes, record the cumulative volume and instantaneous flow rate in gallons per minute necessary to maintain the water level at the same point (between 3 and 4 feet) on the measuring rod.
8. Add water to the pit until 1 hour after the flow rate into the pit has stabilized (constant flow rate; a goal of 5 percent variation or less variation in the total flow) while maintaining the same pond water level (usually 6 hours). The total of the pre-soak time plus one hour after the flow rate has stabilized should be no less than 6 hours.
9. After the flow rate has stabilized, turn off the water and record the rate of infiltration in inches per hour from the measuring rod data, until the pit is empty. Consider running this falling head phase of the test several times to estimate the dependency of infiltration rate with head.
Data Analysis
Calculate and record the infiltration rate in inches per hour in 30 minute or one-hour increments until 1 hour after the flow has stabilized.
Note: Use statistical/trend analysis to obtain the hourly flow rate when the flow stabilizes. This would be the lowest hourly flow rate.
To compute the design infiltration rate (Idesign), apply appropriate correction factors outlined previously.
Example:
The area of the bottom of the test pit is 8.5 feet by 11.5 feet.
Water flow rate was measured and recorded at intervals ranging from 15 to 30 minutes throughout the test. Between 400 minutes and 1,000 minutes, the flow rate stabilized between

December 2016 Volume III – Hydrologic Analysis and Flow Control BMPs A-6
10 and 12.5 gallons per minute or 600 to 750 gallons per hour. Divide the flow rate by the area of the test pit and convert to inches per hour to get an average of (9.8 + 12.3) / 2 = 11.1 inches per hour.
To compute the design infiltration rate (Idesign), the infiltration rate must then be adjusted by the appropriate correction factors outlined previously.
Small-Scale Pilot Infiltration Test
A smaller-scale PIT can be used in any of the following instances:
The drainage area to the infiltration site is less than one acre. This test applies to infiltration facilities with drainage areas less than one acre and may be used to demonstrate infeasibility of bioretention, permeable pavement, or rain gardens in meeting Core Requirement #5.
The site has conditions that make a large-scale PIT infeasible, such as high infiltration rates or lack of a water source that provides a sufficient volume of water to perform the test, and the site geotechnical investigation suggests uniform subsurface characteristics.
Infiltration Test
6. Excavate the test pit to the estimated surface elevation of the proposed infiltration facility. In the case of bioretention, excavate to the estimated elevation at which the imported soil mix will lie on top of the underlying native soil. For permeable pavement, excavate to the elevation at which the imported subgrade materials, or the pavement itself, will contact the underlying native soil. If the native soils (road subgrade) will have to meet a minimum subgrade compaction requirement, compact the native soil to that requirement prior to testing. Note that the permeable pavement design guidance recommends compaction not exceed 90 – 92 percent. Finally, lay back the slopes sufficiently to avoid caving and erosion during the test. Alternatively, consider shoring the sides of the test pit.
7. The horizontal surface area of the bottom of the test pit should be 12 to 32 square feet. It may be circular or rectangular, but accurately document the size and geometry of the test pit.
8. Install a vertical measuring rod adequate to measure the ponded water depth and that is marked in half-inch increments in the center of the pit bottom.
9. Use a rigid pipe with a splash plate on the bottom to convey water to the pit and reduce side-wall erosion or excessive disturbance of the pond bottom. Excessive erosion and bottom disturbance will result in clogging of the infiltration receptor and yield lower than actual infiltration rates. Use a 3 inch diameter pipe for pits on the smaller end of the recommended surface area, and a 4 inch pipe for pits on the larger end of the recommended surface area.
December 2016 Volume III – Hydrologic Analysis and Flow Control BMPs A-7
10. Pre-soak period: Add water to the pit so that there is standing water for at least 6 hours. Maintain the pre-soak water level at least 12 inches above the bottom of the pit.
11. At the end of the pre-soak period, add water to the pit at a rate that will maintain a 6-12 inch water level above the bottom of the pit over a full hour. The depth should not exceed the proposed maximum depth of water expected in the completed facility.
12. Every 15 minutes, record the cumulative volume and instantaneous flow rate in gallons per minute necessary to maintain the water level at the same point (between 6 – 12 inches) on the measuring rod. The specific depth should be the same as the maximum designed ponding depth (usually 6 – 12 inches).
13. After one hour, turn off the water and record the rate of infiltration (the drop rate of the standing water) in inches per hour from the measuring rod data, until the pit is empty.
14. A self-logging pressure sensor may also be used to determine water depth and drain-down.
Data Analysis
See the explanation under the guidance for large-scale pilot infiltration tests.
Simple Method 2 – Soil Property Relationships
USDA Soil Textural Classification
Infiltration rates may be estimated from soil grain size distribution (gradation) data using the United States Department of Agriculture (USDA) textural analysis approach. Conduct the grain size distribution test in accordance with the USDA test procedure (Soil Survey Manual, USDA, October 1993, page 136). This manual only considers soil passing the #10 sieve (2 mm) (US Standard) to determine percentages of sand, silt, and clay for use in Figure A-1. This method may only be applied to projects sites inside the NPDES boundary that trigger Core Requirement #1 through #5 or any project outside the NPDES boundary, and that are underlain by hydrologic soil group A soils (as defined by the NRCS Web Soil Survey and field verified by a qualified professional).
Short-term (field) infiltration rates, required correction factors, and design (long-term) infiltration rates based on gradations from soil samples and textural analysis are summarized in Table A.1. With prior acceptance of Thurston County, the correction factors may be reduced (to a minimum of 2.0) if there is little soil variability, there will be a high degree of long-term facility maintenance, and there is adequate pre-treatment to reduce total suspended solids in influent stormwater.

December 2016 Volume III – Hydrologic Analysis and Flow Control BMPs A-8
Table A.1. Recommended Infiltration Rates based on USDA Soil Textural Classification
*Short-Term Infiltration Rate
(in./hr) Correction Factor,
CF
Estimated Design (Long-term) Infiltration Rate
(in./hr)
Clean sandy gravels and gravelly sands (i.e., 90% of the total soil sample is retained in the #10 sieve)
20 2 10
Sand 8 4 2
Loamy Sand 2 4 0.5
Sandy Loam 1 4 0.25
Loam 0.5 4 0.13
Source: Stormwater Management Manual for Western Washington (Ecology 2005). *From WEF/ASCE, 1998.
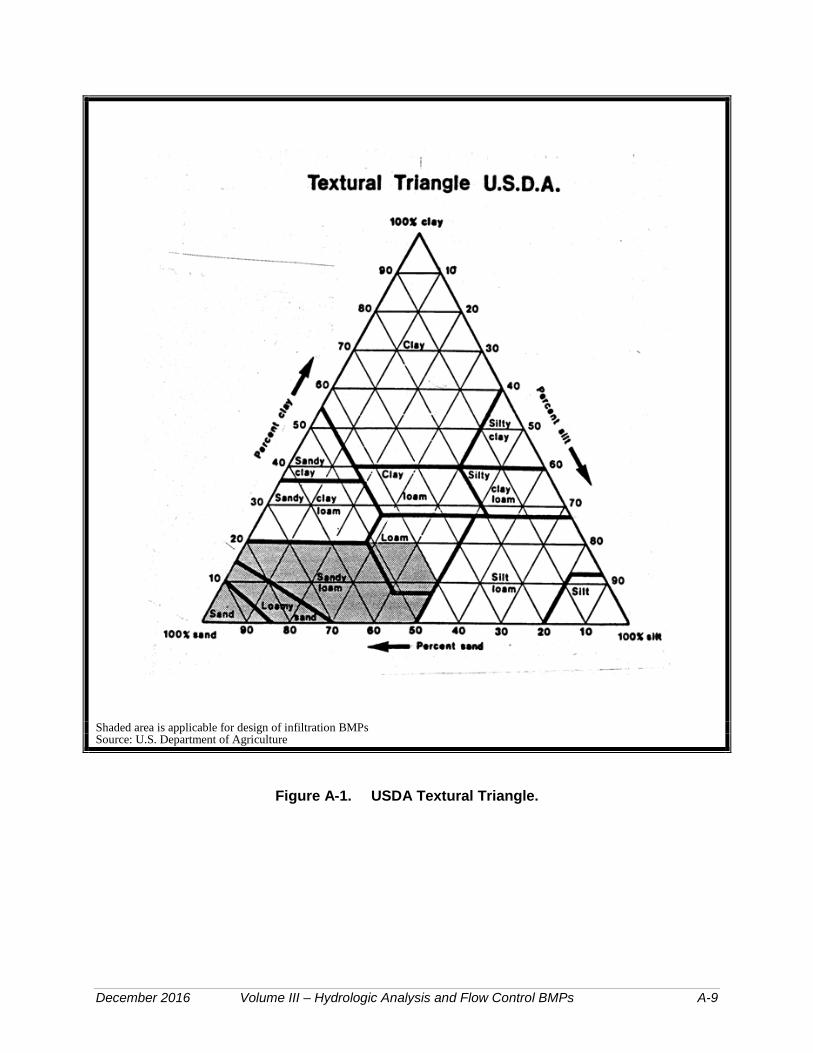
December 2016 Volume III – Hydrologic Analysis and Flow Control BMPs A-9
Shaded area is applicable for design of infiltration BMPs Source: U.S. Department of Agriculture
Figure A-1. USDA Textural Triangle.

December 2016 Volume III – Hydrologic Analysis and Flow Control BMPs A-10
Method 3 - Soil Grain Size Analysis Method
The detailed method described below is based on Massmann (2003).
Determine the Saturated Hydraulic Conductivity
For each defined layer below the pond to a depth below the pond bottom of 2.5 times the maximum depth of water in the pond, but not less than 6 feet, estimate the saturated hydraulic conductivity (Ksat) in centimeters per second (cm/s) using the following relationship (see Massmann 2003, and Massmann et al. 2003). For infiltration facilities serving drainage areas of 10 acres or more, perform soil grain size analyses on layers up to 50 feet deep (or no more than 10 feet below the water table).
( ) finessat fDDDK 08.2013.0015.090.157.1log 90601010 −−++−= (1)
Where, D10, D60 and D90 are the grain sizes in millimeters (mm) for which 10 percent, 60 percent and 90 percent of the sample is more fine and ffines is the fraction of the soil (by weight) that passes the US #200 sieve. (Ksat is in cm/s)
For bioretention areas, analyze each defined layer below the top of the final bioretention area subgrade to a depth of at least 3 times the maximum ponding depth, but not less than 3 feet (1 meter). For permeable pavement, analyze for each defined layer below the top of the final subgrade to a depth of at least 3 times the maximum ponding depth within the base (reservoir) course, but not less than 3 feet (1 meter).
If the licensed professional conducting the investigation determines that deeper layers will influence the rate of infiltration for the facility, soil layers at greater depths must be considered when assessing the site’s hydraulic conductivity characteristics. Massmann (2003) indicates that where the water table is deep, soil or rock strata up to 100 feet below an infiltration facility can influence the rate of infiltration. Note that only the layers near and above the water table or low permeability zone (e.g., a clay, dense glacial till, or rock layer) need to be considered, as the layers below the ground water table or low permeability zone do not significantly influence the rate of infiltration.
Also note that this equation for estimating hydraulic conductivity assumes minimal compaction consistent with the use of tracked (i.e., low to moderate ground pressure) excavation equipment. If the soil layer being characterized has been exposed to heavy compaction, or is heavily over consolidated due to its geologic history (e.g., overridden by continental glaciers), the hydraulic conductivity for the layer could be approximately an order of magnitude less than what would be estimated based on grain size characteristics alone (Pitt 2003). In such cases, compaction effects must be taken into account when estimating hydraulic conductivity. For clean, uniformly graded sands and gravels, the reduction in Ksat due to compaction will be much less than an order of magnitude. For well-graded sands and gravels with moderate to high silt content, the reduction in Ksat will be close to an order of magnitude. For soils that contain clay, the reduction in Ksat could be greater than an order of magnitude.

December 2016 Volume III – Hydrologic Analysis and Flow Control BMPs A-11
For critical designs (facilities that pose a high risk of flooding and property damage in the event of clogging or other failure), the in-situ saturated conductivity of a specific layer can be obtained through the use of a pilot infiltration test (PIT) as described above. Note that some field tests provide a direct estimate of infiltration rate, which is the product of hydraulic conductivity and hydraulic gradient (see Equation 5). In this case, the infiltration rate must be divided by the hydraulic gradient to calculate the hydraulic conductivity. This issue will need to be evaluated on a case-by-case basis when interpreting the results of field tests to ensure an accurate estimate of Ksat. It is important to recognize that the gradient in the test may not be the same as the gradient likely to occur in the full-scale infiltration facility in the long-term (i.e., when ground water mounding is fully developed).
Once the saturated hydraulic conductivity for each layer has been identified, determine the effective average saturated hydraulic conductivity below the pond. Hydraulic conductivity estimates from different layers can be combined into an equivalent hydraulic conductivity (Kequiv) using the harmonic mean:
∑=
i
iequiv
Kd
dK (2)
Where:
d is the total depth of the soil column
di is the thickness of layer “i” in the soil column
Ki is the saturated hydraulic conductivity of layer “i” in the soil column.
The depth of the soil column, d, typically would include all layers between the pond bottom and the water table. However, for sites with very deep water tables (>100 feet) where ground water mounding to the base of the pond is not likely to occur, it is recommended that the total depth of the soil column in Equation 2 be limited to approximately 20 times the depth of pond, but not more than 50 feet. This is to ensure that the most important and relevant layers are included in the hydraulic conductivity calculations. Deep layers that are not likely to affect the infiltration rate near the pond bottom should not be included in Equation 2.
Equation 2 may over-estimate the effective hydraulic conductivity value at sites with low conductivity layers immediately beneath the infiltration pond. For sites where the lowest conductivity layer is within five feet of the base of the pond, it is suggested that this lowest hydraulic conductivity value be used as the equivalent hydraulic conductivity rather than the value from Equation 2. Using the layer with the lowest Ksat is advised for designing bioretention areas or permeable pavement surfaces.
The harmonic mean given by Equation 2 is the appropriate effective hydraulic conductivity for flow that is perpendicular to stratigraphic layers, and will produce conservative results when flow has a significant horizontal component such as could occur due to ground water mounding.
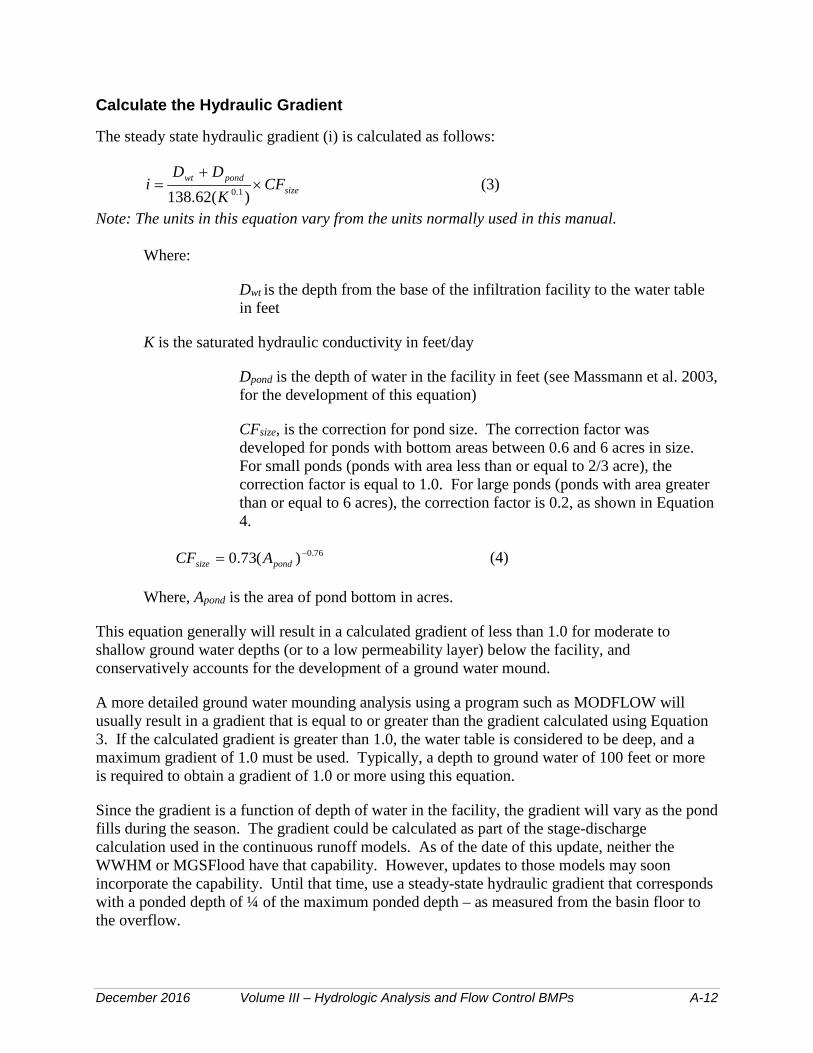
December 2016 Volume III – Hydrologic Analysis and Flow Control BMPs A-12
Calculate the Hydraulic Gradient
The steady state hydraulic gradient (i) is calculated as follows:
sizepondwt CF
KDD
i ×+
=)(62.138 1.0 (3)
Note: The units in this equation vary from the units normally used in this manual.
Where:
Dwt is the depth from the base of the infiltration facility to the water table in feet
K is the saturated hydraulic conductivity in feet/day
Dpond is the depth of water in the facility in feet (see Massmann et al. 2003, for the development of this equation)
CFsize, is the correction for pond size. The correction factor was developed for ponds with bottom areas between 0.6 and 6 acres in size. For small ponds (ponds with area less than or equal to 2/3 acre), the correction factor is equal to 1.0. For large ponds (ponds with area greater than or equal to 6 acres), the correction factor is 0.2, as shown in Equation 4.
76.0)(73.0 −= pondsize ACF (4)
Where, Apond is the area of pond bottom in acres.
This equation generally will result in a calculated gradient of less than 1.0 for moderate to shallow ground water depths (or to a low permeability layer) below the facility, and conservatively accounts for the development of a ground water mound.
A more detailed ground water mounding analysis using a program such as MODFLOW will usually result in a gradient that is equal to or greater than the gradient calculated using Equation 3. If the calculated gradient is greater than 1.0, the water table is considered to be deep, and amaximum gradient of 1.0 must be used. Typically, a depth to ground water of 100 feet or more is required to obtain a gradient of 1.0 or more using this equation.
Since the gradient is a function of depth of water in the facility, the gradient will vary as the pond fills during the season. The gradient could be calculated as part of the stage-discharge calculation used in the continuous runoff models. As of the date of this update, neither the WWHM or MGSFlood have that capability. However, updates to those models may soon incorporate the capability. Until that time, use a steady-state hydraulic gradient that corresponds with a ponded depth of ¼ of the maximum ponded depth – as measured from the basin floor to the overflow.

December 2016 Volume III – Hydrologic Analysis and Flow Control BMPs A-13
Calculate the Infiltration Rate using Darcy’s Law
KidzdhKf =
= (5)
Where:
f is the specific discharge or infiltration rate of water through a unit cross-section of the infiltration facility (L/t)
K is the hydraulic conductivity (L/t)
dh/dz (= “i”) is the hydraulic gradient (L/L)
Adjustments to Infiltration Rate
Adjustments to the infiltration rate calculated above are required to adjust for biofouling, siltation and pond aspect ratio.
To account for reductions in the rate resulting from long-term siltation and biofouling, take into consideration the degree of long-term maintenance and performance monitoring anticipated, the degree of influent control (e.g., pre-settling ponds biofiltration swales, etc.), and the potential for siltation, litterfall, moss buildup, etc. based on the surrounding environment.
It should be assumed that an average to high degree of maintenance will be performed on these facilities. A low degree of maintenance should be considered only when there is no other option (e.g., access problems). The infiltration rate estimated in the step above is multiplied by the reduction factors summarized in Table A.3.
Table A.3. Infiltration Rate Reduction Factors to Account for Biofouling and Siltation Effects for Ponds (Massmann, 2003)
Potential for Biofouling Degree of Long-Term Maintenance/Performance Monitoring
Infiltration Rate Reduction Factor, CFsilt/bio
Low Average to High 0.9
Low Low 0.6
High Average to High 0.5
High Low 0.2
The values in this table assume that final excavation of the facility to the finished grade is deferred until all disturbed areas in the upgradient drainage area have been stabilized or protected (e.g., construction runoff is not allowed into the facility after final excavation of the facility).
Ponds located in shady areas where moss and litterfall from adjacent vegetation can build up on the pond bottom and sides, the upgradient drainage area will remain in a disturbed condition

December 2016 Volume III – Hydrologic Analysis and Flow Control BMPs A-14
long-term, and no pretreatment (e.g., pre-settling ponds, biofiltration swales, etc.) is provided, are one example of a situation with a high potential for biofouling.
A low degree of long-term maintenance includes, for example, situations where access to the facility for maintenance is very difficult or limited, or where there is minimal control of the party responsible for enforcing the required maintenance. A low degree of maintenance should be considered only when there is no other option.
Adjustment for Pond Aspect Ratio
Adjust the infiltration rate for the effect of pond aspect ratio by multiplying the infiltration rate determined above by the aspect ratio correction factor CFaspect as shown in the following equation:
98.002.0 += raspect ACF (6)
Where, Ar is the aspect ratio for the pond (length/width). In no case shall CFaspect be greater than 1.4. The final infiltration rate will therefore be as follows:
biosiltaspect CFCFiKf /×××= (7)
The rates calculated based on Equation 7 are long-term design rates. No additional reduction factor or factor of safety is needed.

December 2016 Volume III – Hydrologic Analysis and Flow Control BMPs B-1
Appendix III-B Design Aids Single Event Model Guidance
The only approved use of a single event model is for the sizing of conveyance systems. Approved continuous simulation runoff models will be used for the design of water quality and quantity BMPs.
SBUH or SCS Methods
The applicant shall use the Western Washington SCS “curve numbers” included in Table B.4, not the SCS national curve numbers. Individual curve numbers for a drainage area may be averaged into a “composite” curve number for use with SCS or SBUH methods. The NRCS (formerly SCS) has, for many years, conducted studies of the runoff characteristics for various land types. After gathering and analyzing extensive data, NRCS has identified relationships between land use, soil type, vegetation cover, interception, infiltration, surface storage, and runoff. These relationships have been characterized by a single runoff coefficient called a “curve number.” The National Engineering Handbook – Section 4: Hydrology (NEH-4, SCS, August 1972) contains a detailed description of the development and use of the curve number method.
The curve numbers can be found in Urban Hydrology for Small Watersheds, Technical Release 55 (TR-55), June 1986, published by the NRCS. The combination of these two factors is called the “soil-cover complex.” The soil-cover complexes have been assigned to one of four hydrologic soil groups, according to their runoff characteristics. NRCS has classified over 4,000 soil types into these four soil groups. Table B.5 shows the hydrologic soil group of most soils in Thurston County and provides a brief description of the four groups. For details on other soil types, the NRCS publication described above (TR-55, 1986).
Isopluvial Maps
National Oceanic and Atmospheric Administration (NOAA) isopluvial maps for western Washington are included below. The design engineer shall use the best engineering judgment in selecting the runoff totals for the project site.
Time of Concentration
Time of concentration (Tc) is the sum of travel times for sheet flow, shallow concentrated flow, and channel flow. For lakes and submerged wetlands, travel time can be determined with storage routing techniques if the stage-storage versus discharge relationship is known or may be assumed to be zero.
Sheet Flow
With sheet flow, the friction value (ns) is used. This is a modified Manning's effective roughness coefficient that includes the effect of raindrop impact, drag over the plane surface, obstacles such as litter, crop ridges and rocks, and erosion and transportation of sediment. These ns values are

December 2016 Volume III – Hydrologic Analysis and Flow Control BMPs B-2
for very shallow flow depths of about 0.1 foot and are used only for travel lengths up to 300 feet. Table B.2 gives Manning's ns values for sheet flow for various surface conditions.
For sheet flow of up to 300 feet, use Manning's kinematic solution to directly compute Tt.
0.42 (nsL)0.8 Tt = ____________
(P2)0.527(So)0.4
Where: Tt = Travel time (min),
ns = Sheet flow Manning's effective roughness coefficient (Table B.2),
L = Flow length (ft),
P2 = 2-year, 24-hour rainfall (in), and
so = Slope of hydraulic grade line (land slope, ft/ft)
The maximum allowable distance for sheet flow shall be 300 feet. The remaining overland flow distance shall be shallow concentrated flow until the water reaches a channel.
Shallow Concentrated Flow
After a maximum of 300 feet, sheet flow is assumed to become shallow concentrated flow. The average velocity for this flow can be calculated using the ks values from Table B.2 in which average velocity is a function of watercourse slope and type of channel.
The average velocity of flow, once it has measurable depth, shall be computed using the following equation:
V = k √so
Where: V = Velocity (ft/s)
k = Time of concentration velocity factor (ft/s)
so = Slope of flow path (ft/ft)
"k" is computed for various land covers and channel characteristics with assumptions made for hydraulic radius using the following rearrangement of Manning's equation:
k = (1.49(R)0.667)/n
where: R = An assumed hydraulic radius
n = Manning's roughness coefficient for open channel flow (see Table B-3)

December 2016 Volume III – Hydrologic Analysis and Flow Control BMPs B-3
Open Channel Flow
Open channels are assumed to begin where surveyed cross section information has been obtained, where channels are visible on aerial photographs, or where lines indicating streams appear (in blue) on United States Geological Survey (USGS) quadrangle sheets. The kc values from Table B.2 used in the Velocity Equation above or water surface profile information can be used to estimate average flow velocity.
Lakes or Wetlands
This travel time is normally very small and can be assumed as zero. Where significant attenuation may occur due to storage effects, the flows should be routed using a "level pool routing" technique.
Limitations
The following limitations apply in estimating travel time (Tt).
• Manning's kinematic solution should not be used for sheet flow longer than300 feet.
• In watersheds with storm drains, carefully identify the appropriate hydraulic flowpath to estimate Tc.
• Consult a standard hydraulics textbook to determine average velocity in pipes foreither pressure or nonpressure flow.
• A culvert or bridge can act as a reservoir outlet if there is significant storagebehind it. A hydrograph should be developed to this point and a level poolrouting technique used to determine the outflow rating curve through the culvertor bridge.
Design Storm Hyetographs
The standard design hyetograph is the SCS Type 1A 24-hour rainfall distribution, resolved into 6-minute time intervals (see Table B.8). Various interpretations of the hyetograph are available and may differ slightly from distributions used in other unit hydrograph based computer simulations. Other distributions will be accepted with adequate justification and as long as they do not increase the allowable release rates.
For project sites with tributary drainage areas above elevation 1,000 feet MSL, an additional total precipitation must be added to the total depth of rainfall for the 25-, 50-, and 100-year design storm events to account for the potential average snow melt which occurs during major storm events.
The MSL "factor" is computed as follows:
Ms (in inches) = 0.004 (MBel - 1000)

December 2016 Volume III – Hydrologic Analysis and Flow Control BMPs B-4
Where: Ms = Rainfall amount to be added to Pr
MBel = The mean tributary basin elevation above sea level (in feet)
Sub-Basin Delineation
Within an overall drainage basin, it may be necessary to delineate separate sub-basins based on similar land uses and/or runoff characteristics or when hydraulically "self-contained" areas are found to exist. When this is necessary, separate hydrographs shall be generated, routed, and recombined, after travel time is considered, into a single hydrograph to represent runoff flows into the quantity or quality control facility.
Hydrograph Phasing Analysis
Where flows from multiple basins or subbasins having different runoff characteristics and/or travel times combine, the design engineer shall sum the hydrographs after shifting each hydrograph according to its travel time to the discharge point of interest. The resultant hydrograph shall be either routed downstream as required in the downstream analysis see (Volume 1 Chapter 3 [Drainage Report section 8]), or routed through the control facility.
Included in this appendix are the 2-, 10-, 25-,and 100-year, 24-hour design storm and mean annual precipitation isopluvial maps for Western Washington. These have been taken from NOAA Atlas 2 “Precipitation - Frequency Atlas of the Western United States, Volume IX, Washington. The Applicant shall use the NOAA Isopluvials for selection of the design storm precipitation.
Rational Method
The only approved use of the Rational Method is for the sizing of conveyance systems. This method is applicable to smaller drainage basins, 25 acres in size or less. This method provides an estimate of peak discharge (Qp in cubic feet per second [cfs]) using the following formula:
Where: C = runoff coefficient (unitless),
A = area of watershed (acres), and
I = rainfall intensity (inches per hour) for a chosen frequency expressed as:
Where: m, n are regression coefficients (unitless), and
Tc = time of concentration (in hours).
CIAQp =
( )ncTmI =

December 2016 Volume III – Hydrologic Analysis and Flow Control BMPs B-5
Runoff coefficient (C) values are listed in Table B-6 for a range of land cover types. Regression coefficients (m, n) for determining rainfall intensity can be found in Table B-7. Time of concentration (Tc) is calculated as described in the Single Event Model Guidance section above.

December 2016 Volume III – Hydrologic Analysis and Flow Control BMPs B-6
Source: NOAA
Western Washington Isopluvial 2-year, 24-hour

December 2016 Volume III – Hydrologic Analysis and Flow Control BMPs B-7
Western Washington Isopluvial 5-year, 24-hour
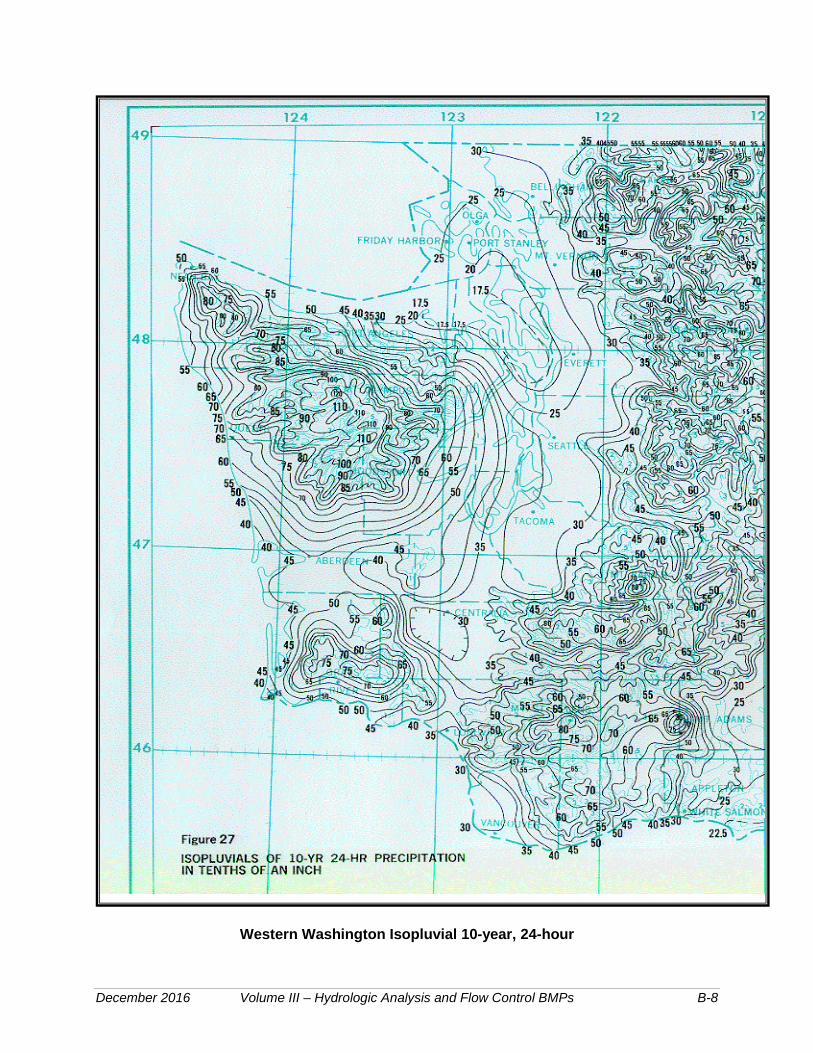
December 2016 Volume III – Hydrologic Analysis and Flow Control BMPs B-8
Western Washington Isopluvial 10-year, 24-hour
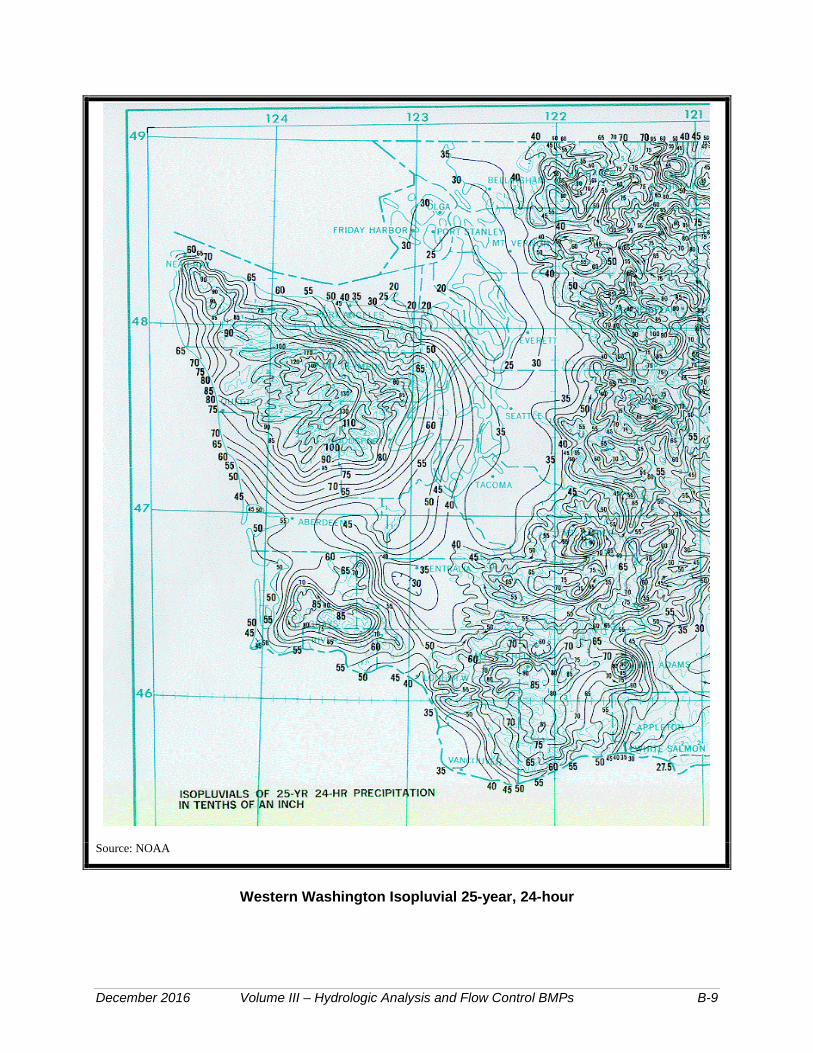
December 2016 Volume III – Hydrologic Analysis and Flow Control BMPs B-9
Source: NOAA
Western Washington Isopluvial 25-year, 24-hour

December 2016 Volume III – Hydrologic Analysis and Flow Control BMPs B-10
Western Washington Isopluvial 50-year, 24-hour
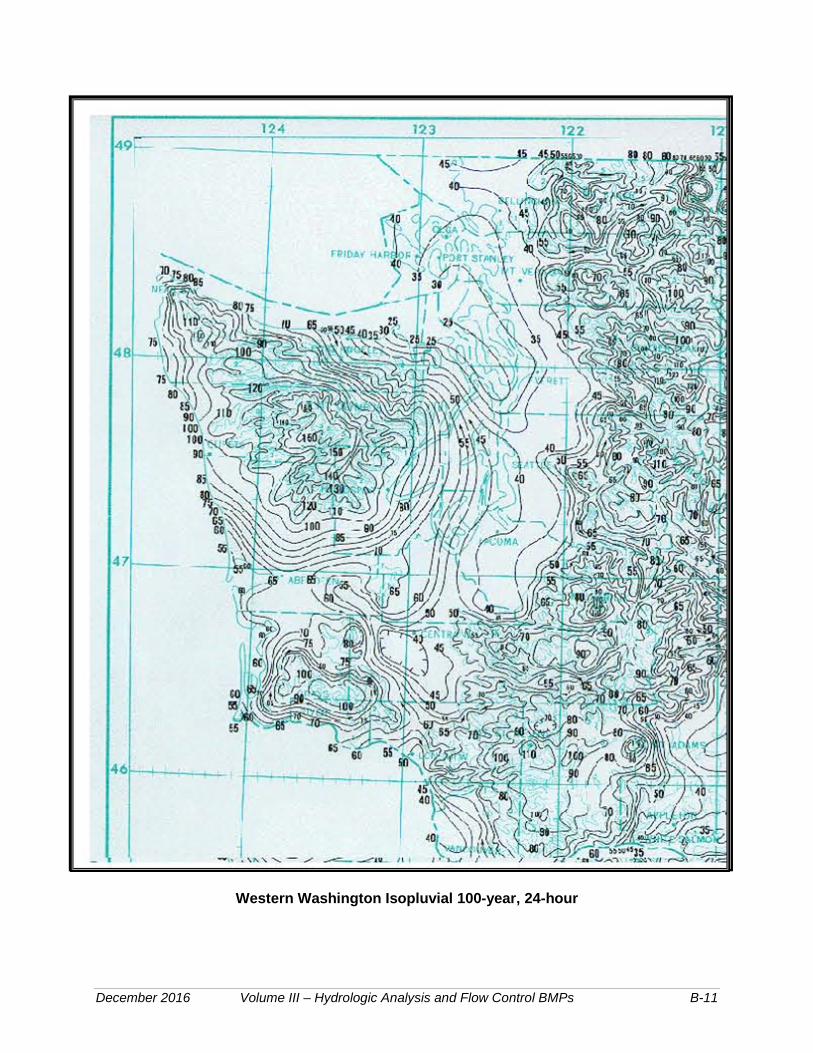
December 2016 Volume III – Hydrologic Analysis and Flow Control BMPs B-11
Western Washington Isopluvial 100-year, 24-hour
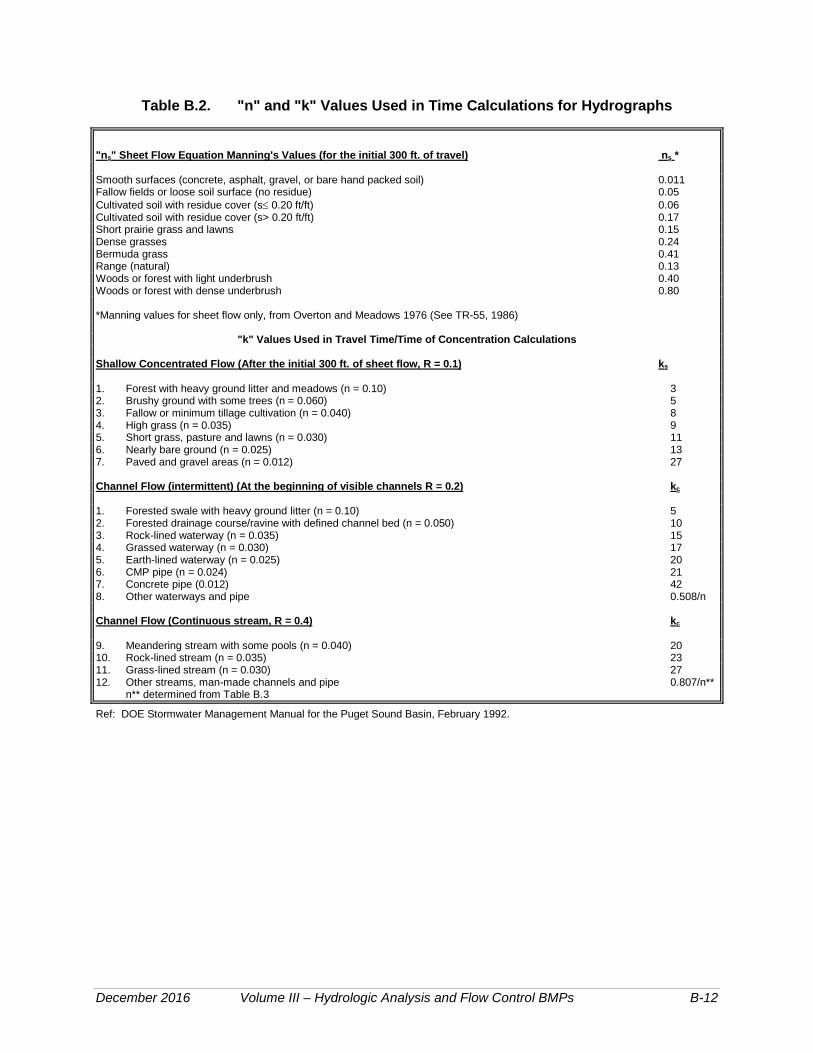
December 2016 Volume III – Hydrologic Analysis and Flow Control BMPs B-12
Table B.2. "n" and "k" Values Used in Time Calculations for Hydrographs
"ns" Sheet Flow Equation Manning's Values (for the initial 300 ft. of travel) ns *
Smooth surfaces (concrete, asphalt, gravel, or bare hand packed soil) 0.011 Fallow fields or loose soil surface (no residue) 0.05 Cultivated soil with residue cover (s≤ 0.20 ft/ft) 0.06 Cultivated soil with residue cover (s> 0.20 ft/ft) 0.17 Short prairie grass and lawns 0.15 Dense grasses 0.24 Bermuda grass 0.41 Range (natural) 0.13 Woods or forest with light underbrush 0.40 Woods or forest with dense underbrush 0.80
*Manning values for sheet flow only, from Overton and Meadows 1976 (See TR-55, 1986)
"k" Values Used in Travel Time/Time of Concentration Calculations
Shallow Concentrated Flow (After the initial 300 ft. of sheet flow, R = 0.1) ks
1. Forest with heavy ground litter and meadows (n = 0.10) 3 2. Brushy ground with some trees (n = 0.060) 5 3. Fallow or minimum tillage cultivation (n = 0.040) 8 4. High grass (n = 0.035) 9 5. Short grass, pasture and lawns (n = 0.030) 11 6. Nearly bare ground (n = 0.025) 13 7. Paved and gravel areas (n = 0.012) 27
Channel Flow (intermittent) (At the beginning of visible channels R = 0.2) kc
1. Forested swale with heavy ground litter (n = 0.10) 5 2. Forested drainage course/ravine with defined channel bed (n = 0.050) 10 3. Rock-lined waterway (n = 0.035) 15 4. Grassed waterway (n = 0.030) 17 5. Earth-lined waterway (n = 0.025) 20 6. CMP pipe (n = 0.024) 21 7. Concrete pipe (0.012) 42 8. Other waterways and pipe 0.508/n
Channel Flow (Continuous stream, R = 0.4) kc
9. Meandering stream with some pools (n = 0.040) 20 10. Rock-lined stream (n = 0.035) 23 11. Grass-lined stream (n = 0.030) 27 12. Other streams, man-made channels and pipe 0.807/n**
n** determined from Table B.3
Ref: DOE Stormwater Management Manual for the Puget Sound Basin, February 1992.
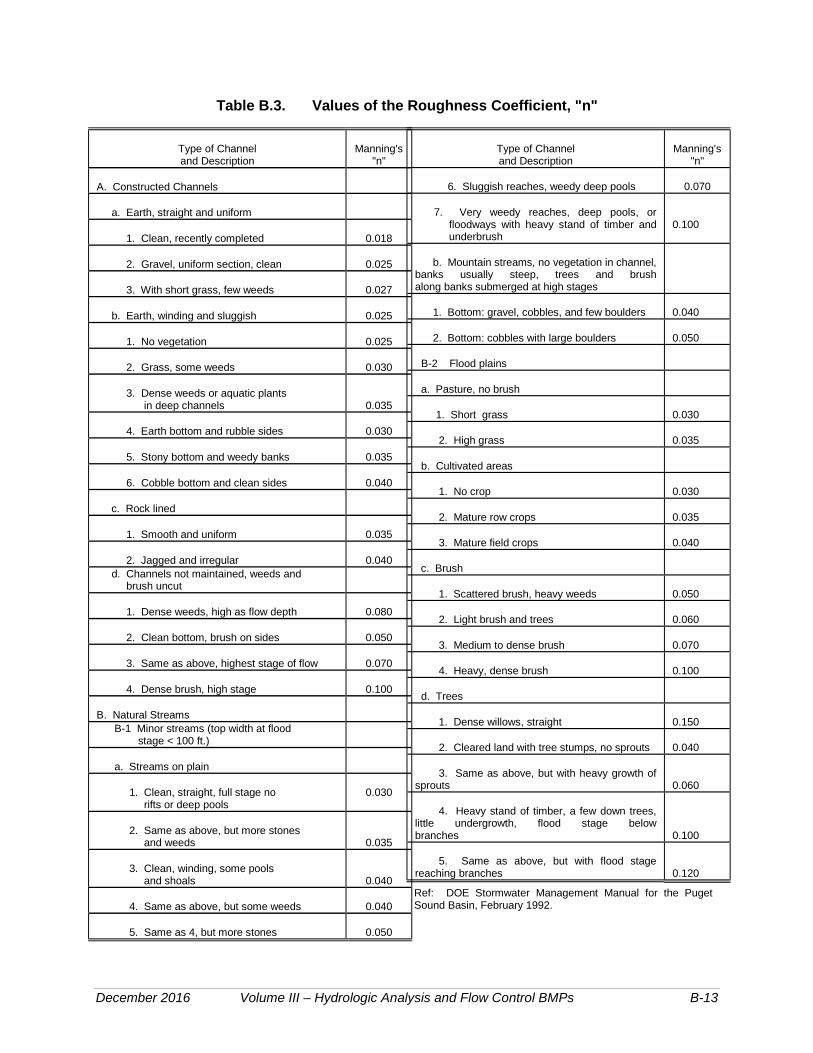
December 2016 Volume III – Hydrologic Analysis and Flow Control BMPs B-13
Table B.3. Values of the Roughness Coefficient, "n"
Type of Channel and Description
Manning's "n"
A. Constructed Channels
a. Earth, straight and uniform
1. Clean, recently completed 0.018
2. Gravel, uniform section, clean 0.025
3. With short grass, few weeds 0.027
b. Earth, winding and sluggish 0.025
1. No vegetation 0.025
2. Grass, some weeds 0.030
3. Dense weeds or aquatic plantsin deep channels 0.035
4. Earth bottom and rubble sides 0.030
5. Stony bottom and weedy banks 0.035
6. Cobble bottom and clean sides 0.040
c. Rock lined
1. Smooth and uniform 0.035
2. Jagged and irregular 0.040 d. Channels not maintained, weeds and
brush uncut
1. Dense weeds, high as flow depth 0.080
2. Clean bottom, brush on sides 0.050
3. Same as above, highest stage of flow 0.070
4. Dense brush, high stage 0.100
B. Natural Streams B-1 Minor streams (top width at flood
stage < 100 ft.)
a. Streams on plain
1. Clean, straight, full stage norifts or deep pools
0.030
2. Same as above, but more stonesand weeds 0.035
3. Clean, winding, some poolsand shoals 0.040
4. Same as above, but some weeds 0.040
5. Same as 4, but more stones 0.050
Type of Channel and Description
Manning's "n"
6. Sluggish reaches, weedy deep pools 0.070
7. Very weedy reaches, deep pools, orfloodways with heavy stand of timber and underbrush
0.100
b. Mountain streams, no vegetation in channel,banks usually steep, trees and brush along banks submerged at high stages
1. Bottom: gravel, cobbles, and few boulders 0.040
2. Bottom: cobbles with large boulders 0.050
B-2 Flood plains
a. Pasture, no brush
1. Short grass 0.030
2. High grass 0.035
b. Cultivated areas
1. No crop 0.030
2. Mature row crops 0.035
3. Mature field crops 0.040
c. Brush
1. Scattered brush, heavy weeds 0.050
2. Light brush and trees 0.060
3. Medium to dense brush 0.070
4. Heavy, dense brush 0.100
d. Trees
1. Dense willows, straight 0.150
2. Cleared land with tree stumps, no sprouts 0.040
3. Same as above, but with heavy growth ofsprouts 0.060
4. Heavy stand of timber, a few down trees,little undergrowth, flood stage below branches 0.100
5. Same as above, but with flood stagereaching branches 0.120
Ref: DOE Stormwater Management Manual for the Puget Sound Basin, February 1992.

THURSTON COUNTY DRAINAGE DESIGN AND EROSION CONTROL MANUAL
December 2016 Volume III – Hydrologic Analysis and Flow Control BMPs B-14
Table B.4. Runoff Curve Numbers for Selected Agricultural, Suburban, and Urban Areas
(Sources: TR 55, 1986, and Stormwater Management Manual, 1992.) CNs for hydrologic soil group
Cover type and hydrologic condition. A B C D Curve Numbers for Pre-Development Conditions
Pasture, grassland, or range-continuous forage for grazing: Fair condition (ground cover 50% to 75% and not heavily grazed). 49 69 79 84 Good condition (ground cover >75% and lightly or only occasionally grazed) 39 61 74 80 Woods: Fair (Woods are grazed but not burned, and some forest litter covers the soil). 36 60 73 79 Good (Woods are protected from grazing, and litter and brush adequately cover the soil). 30 55 70 77
Curve Numbers for Post-Development Conditions Open space (lawns, parks, golf courses, cemeteries, landscaping, etc.)1 Fair condition (grass cover on 50% - 75% of the area). 77 85 90 92 Good condition (grass cover on >75% of the area) 68 80 86 90 Impervious areas: Open water bodies: lakes, wetlands, ponds etc. 100 100 100 100 Paved parking lots, roofs2, driveways, etc. (excluding right-of-way) 98 98 98 98 Permeable Pavement (See Volume V to decide which condition below to use) Landscaped area 77 85 90 92 50% landscaped area/50% impervious 87 91 94 96 100% impervious area 98 98 98 98 Paved 98 98 98 98 Gravel (including right-of-way) 76 85 89 91 Dirt (including right-of-way) 72 82 87 89 Pasture, grassland, or range-continuous forage for grazing: Poor condition (ground cover <50% or heavily grazed with no mulch). 68 79 86 89 Fair condition (ground cover 50% to 75% and not heavily grazed). 49 69 79 84 Good condition (ground cover >75% and lightly or only occasionally grazed) 39 61 74 80 Woods: Poor (Forest litter, small trees, and brush are destroyed by heavy grazing or regular burning). 45 66 77 83 Fair (Woods are grazed but not burned, and some forest litter covers the soil). 36 60 73 79 Good (Woods are protected from grazing, and litter and brush adequately cover the soil). 30 55 70 77 Single family residential3: Should only be used for Average Percent Dwelling Unit/Gross Acre subdivisions > 50 acres impervious area3,4
1.0 DU/GA 15 Separate curve number 1.5 DU/GA 20 shall be selected for 2.0 DU/GA 25 pervious & impervious 2.5 DU/GA 30 portions of the site or 3.0 DU/GA 34 basin 3.5 DU/GA 38 4.0 DU/GA 42 4.5 DU/GA 46 5.0 DU/GA 48 5.5 DU/GA 50 6.0 DU/GA 52 6.5 DU/GA 54 7.0 DU/GA 56 7.5 DU/GA 58
PUDs, condos, apartments, commercial %impervious Separate curve numbers shall businesses, industrial areas & must be be selected for pervious and & subdivisions < 50 acres computed impervious portions of the site For a more detailed and complete description of land use curve numbers refer to chapter two (2) of the Soil Conservation Service’s Technical Release No. 55 , (210-VI-TR-55, Second Ed., June 1986).
1 Composite CNs may be computed for other combinations of open space cover type. 2Where roof runoff and driveway runoff are infiltrated or dispersed according to the requirements in Volume V, the average percent impervious area may be adjusted in accordance with the procedure described under “Flow Credit for Roof Downspout Infiltration” and “Flow Credit for Roof Downspout Dispersion” . 3Assumes roof and driveway runoff is directed into street/storm system. 4All the remaining pervious area (lawn) are considered to be in good condition for these curve numbers.

THURSTON COUNTY DRAINAGE DESIGN AND EROSION CONTROL MANUAL
December 2016 Volume III – Hydrologic Analysis and Flow Control BMPs B-15
Table B.5. Major Soil Groups in Thurston County
Soil Type * Hydrologic Soil Group Soil Type * Hydrologic Soil Group ALDERWOOD C MUKILTEO C/D BALDHILL B NEWBERG B BAUMGARD B NISQUALLY B BELLINGHAM C NORMA D BOISTFORT B OLYMPIC B BUNKER B PHEENEY C CAGEY C PILCHUCK C CATHCART B PITS * CENTRALIA B PRATHER C CHEHALIS B PUGET D DELPHI B PUYALLUP B DUPONT D RAINIER C DYSTRIC XEROCHREPTS C ROCK OUTCROP * ELD B RAUGHT B EVERETT A RIVERWASH D EVERSON D SALKUM B GALVIN D SCAMMAN D GILES B SCHNEIDER B GODFREY D SEMIAHMOO C GROVE A SHALCAR D HOOGDAL C SHALCAR VARIANT D HYDRAQUENTS D SKIPOPA D INDIANOLA A SPANA D JONAS B SPANAWAY B KAPOWSIN D SULTON C KATULAS C TACOMA D LATES C TENINO C MAL C TISCH D MASHEL B VAILTON B MAYTOWN C WILKESON B MCKENNA D XERORTHENTS C MELBOURNE B YELM C
*See the description of the map unitSoils Table Notes: Hydrologic Soil Group Classifications, as Defined by the NRCS (formerly Soil Conservation Service): A = (Low runoff potential) Soils having low runoff potential and high infiltration rates, even when thoroughly wetted. They
consist chiefly of deep, well to excessively drained sands or gravels and have a high rate of water transmission (greater than 0.30 in/hr.).
B = (Moderately low runoff potential). Soils having moderate infiltration rates when thoroughly wetted and consist chiefly of moderately deep to deep, moderately well to well drained soils with moderately fine to moderately coarse textures. These soils have a moderate rate of water transmission (0.15-0.3 in/hr.).
C = (Moderately high runoff potential). Soils having low infiltration rates when thoroughly wetted and consist chiefly of soils with a layer that impedes downward movement of water and soils with moderately fine to fine textures. These soils have a low rate of water transmission (0.05-0.15 in/hr.).
D = (High runoff potential). Soils having high runoff potential. They have very low infiltration rates when thoroughly wetted and consist chiefly of clay soils with a high swelling potential, soils with a permanent high water table, soils with a hardpan or clay layer at or near the surface, and shallow soils over nearly impervious material. These soils have a very low rate of water transmission (0-0.05 in/hr.).
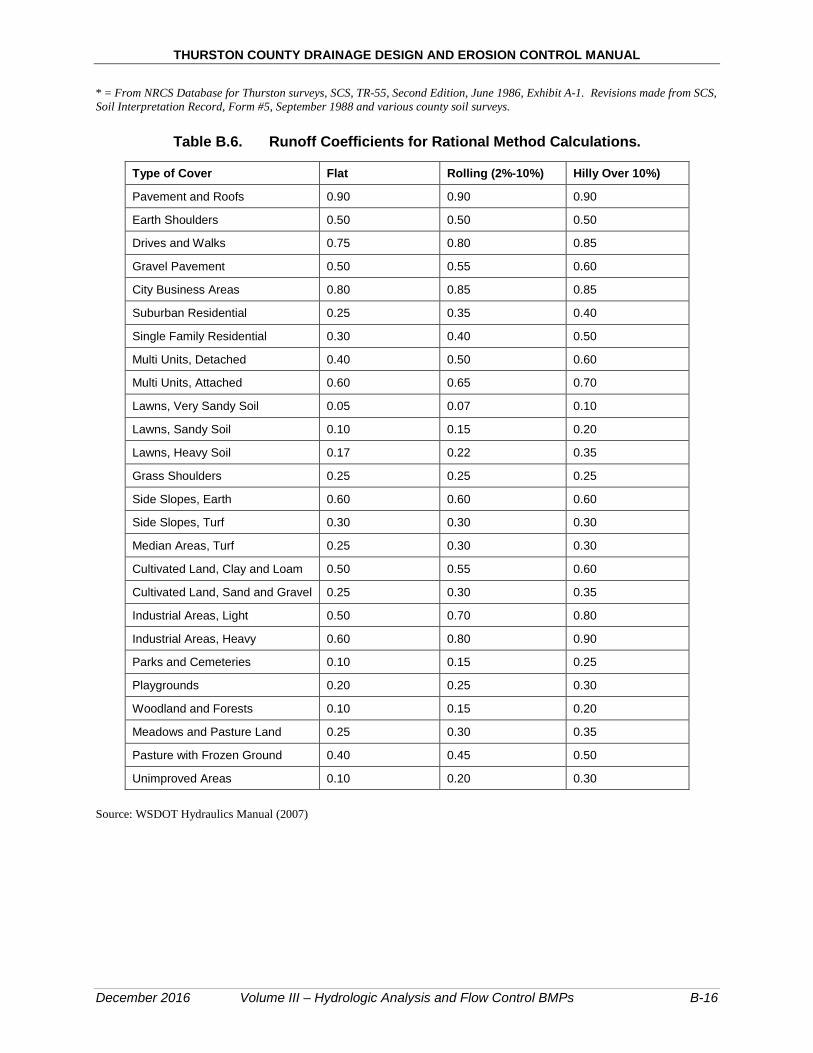
THURSTON COUNTY DRAINAGE DESIGN AND EROSION CONTROL MANUAL
December 2016 Volume III – Hydrologic Analysis and Flow Control BMPs B-16
* = From NRCS Database for Thurston surveys, SCS, TR-55, Second Edition, June 1986, Exhibit A-1. Revisions made from SCS,Soil Interpretation Record, Form #5, September 1988 and various county soil surveys.
Table B.6. Runoff Coefficients for Rational Method Calculations.
Type of Cover Flat Rolling (2%-10%) Hilly Over 10%)
Pavement and Roofs 0.90 0.90 0.90
Earth Shoulders 0.50 0.50 0.50
Drives and Walks 0.75 0.80 0.85
Gravel Pavement 0.50 0.55 0.60
City Business Areas 0.80 0.85 0.85
Suburban Residential 0.25 0.35 0.40
Single Family Residential 0.30 0.40 0.50
Multi Units, Detached 0.40 0.50 0.60
Multi Units, Attached 0.60 0.65 0.70
Lawns, Very Sandy Soil 0.05 0.07 0.10
Lawns, Sandy Soil 0.10 0.15 0.20
Lawns, Heavy Soil 0.17 0.22 0.35
Grass Shoulders 0.25 0.25 0.25
Side Slopes, Earth 0.60 0.60 0.60
Side Slopes, Turf 0.30 0.30 0.30
Median Areas, Turf 0.25 0.30 0.30
Cultivated Land, Clay and Loam 0.50 0.55 0.60
Cultivated Land, Sand and Gravel 0.25 0.30 0.35
Industrial Areas, Light 0.50 0.70 0.80
Industrial Areas, Heavy 0.60 0.80 0.90
Parks and Cemeteries 0.10 0.15 0.25
Playgrounds 0.20 0.25 0.30
Woodland and Forests 0.10 0.15 0.20
Meadows and Pasture Land 0.25 0.30 0.35
Pasture with Frozen Ground 0.40 0.45 0.50
Unimproved Areas 0.10 0.20 0.30
Source: WSDOT Hydraulics Manual (2007)

THURSTON COUNTY DRAINAGE DESIGN AND EROSION CONTROL MANUAL
December 2016 Volume III – Hydrologic Analysis and Flow Control BMPs B-17
Table B.7. Regression Coefficients for Rational Method Calculations.
2-year MRI
5-year MRI
10-year MRI
25-year MRI
50-year MRI
100-year MRI
Location m n m n m n m n m n m n
Olympia 3.82 0.466 4.86 0.472 5.62 0.474 6.63 0.477 7.40 0.478 8.17 0.480
Centralia and Chehalis
3.63 0.506 4.85 0.518 5.76 0.524 7.00 0.530 7.92 0.533 8.86 0.537
Tacoma 3.57 0.516 4.78 0.527 5.70 0.533 6.93 0.539 7.86 0.542 8.79 0.545 Source: WSDOT Hydraulics Manual (2007). MRI: Mean Recurrence Interval (frequency).
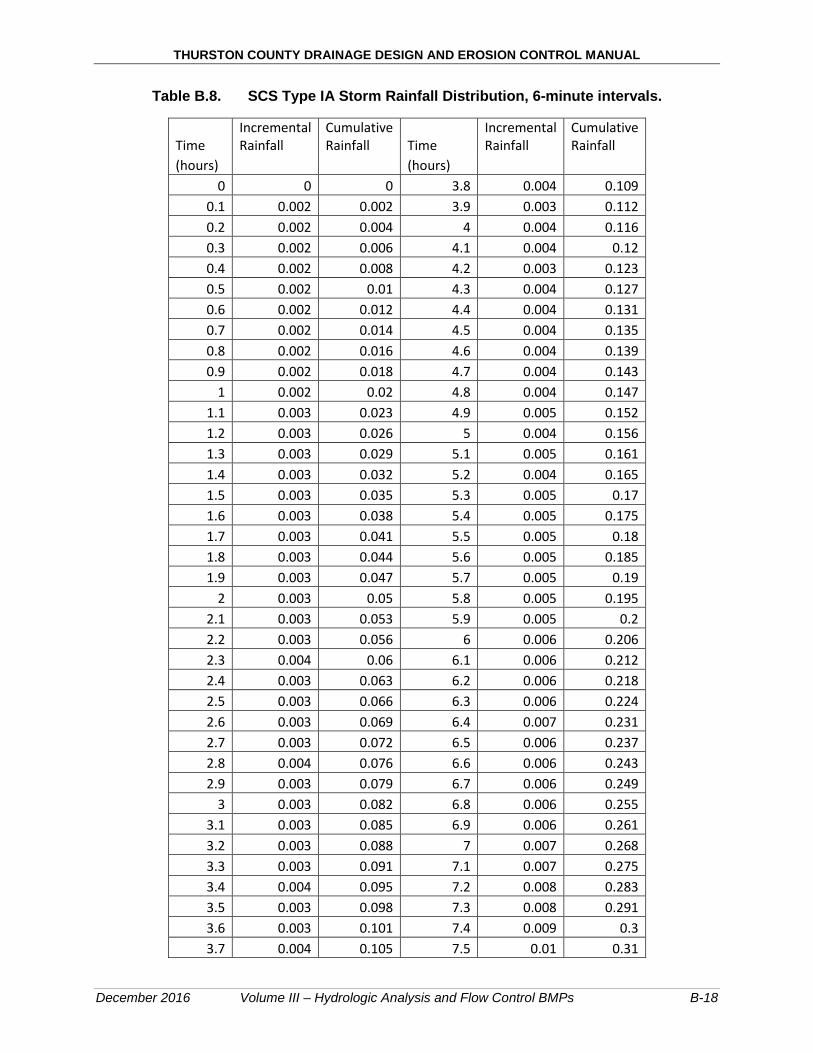
THURSTON COUNTY DRAINAGE DESIGN AND EROSION CONTROL MANUAL
December 2016 Volume III – Hydrologic Analysis and Flow Control BMPs B-18
Table B.8. SCS Type IA Storm Rainfall Distribution, 6-minute intervals.
Time Incremental Rainfall
Cumulative Rainfall Time
Incremental Rainfall
Cumulative Rainfall
(hours) (hours) 0 0 0 3.8 0.004 0.109
0.1 0.002 0.002 3.9 0.003 0.112 0.2 0.002 0.004 4 0.004 0.116 0.3 0.002 0.006 4.1 0.004 0.12 0.4 0.002 0.008 4.2 0.003 0.123 0.5 0.002 0.01 4.3 0.004 0.127 0.6 0.002 0.012 4.4 0.004 0.131 0.7 0.002 0.014 4.5 0.004 0.135 0.8 0.002 0.016 4.6 0.004 0.139 0.9 0.002 0.018 4.7 0.004 0.143
1 0.002 0.02 4.8 0.004 0.147 1.1 0.003 0.023 4.9 0.005 0.152 1.2 0.003 0.026 5 0.004 0.156 1.3 0.003 0.029 5.1 0.005 0.161 1.4 0.003 0.032 5.2 0.004 0.165 1.5 0.003 0.035 5.3 0.005 0.17 1.6 0.003 0.038 5.4 0.005 0.175 1.7 0.003 0.041 5.5 0.005 0.18 1.8 0.003 0.044 5.6 0.005 0.185 1.9 0.003 0.047 5.7 0.005 0.19
2 0.003 0.05 5.8 0.005 0.195 2.1 0.003 0.053 5.9 0.005 0.2 2.2 0.003 0.056 6 0.006 0.206 2.3 0.004 0.06 6.1 0.006 0.212 2.4 0.003 0.063 6.2 0.006 0.218 2.5 0.003 0.066 6.3 0.006 0.224 2.6 0.003 0.069 6.4 0.007 0.231 2.7 0.003 0.072 6.5 0.006 0.237 2.8 0.004 0.076 6.6 0.006 0.243 2.9 0.003 0.079 6.7 0.006 0.249
3 0.003 0.082 6.8 0.006 0.255 3.1 0.003 0.085 6.9 0.006 0.261 3.2 0.003 0.088 7 0.007 0.268 3.3 0.003 0.091 7.1 0.007 0.275 3.4 0.004 0.095 7.2 0.008 0.283 3.5 0.003 0.098 7.3 0.008 0.291 3.6 0.003 0.101 7.4 0.009 0.3 3.7 0.004 0.105 7.5 0.01 0.31

THURSTON COUNTY DRAINAGE DESIGN AND EROSION CONTROL MANUAL
December 2016 Volume III – Hydrologic Analysis and Flow Control BMPs B-19
Time Incremental
Rainfall Cumulative
Rainfall Time Incremental
Rainfall Cumulative
Rainfall (hours) (hours)
7.6 0.021 0.331 11.4 0.004 0.641 7.7 0.024 0.355 11.5 0.004 0.645 7.8 0.024 0.379 11.6 0.004 0.649 7.9 0.024 0.403 11.7 0.004 0.653
8 0.022 0.425 11.8 0.004 0.657 8.1 0.014 0.439 11.9 0.003 0.66 8.2 0.013 0.452 12 0.004 0.664 8.3 0.01 0.462 12.1 0.004 0.668 8.4 0.01 0.472 12.2 0.003 0.671 8.5 0.008 0.48 12.3 0.004 0.675 8.6 0.009 0.489 12.4 0.004 0.679 8.7 0.009 0.498 12.5 0.004 0.683 8.8 0.007 0.505 12.6 0.004 0.687 8.9 0.008 0.513 12.7 0.003 0.69
9 0.007 0.52 12.8 0.004 0.694 9.1 0.007 0.527 12.9 0.003 0.697 9.2 0.006 0.533 13 0.004 0.701 9.3 0.006 0.539 13.1 0.004 0.705 9.4 0.006 0.545 13.2 0.003 0.708 9.5 0.005 0.55 13.3 0.004 0.712 9.6 0.006 0.556 13.4 0.004 0.716 9.7 0.005 0.561 13.5 0.003 0.719 9.8 0.006 0.567 13.6 0.003 0.722 9.9 0.005 0.572 13.7 0.004 0.726 10 0.005 0.577 13.8 0.003 0.729
10.1 0.005 0.582 13.9 0.004 0.733 10.2 0.005 0.587 14 0.003 0.736 10.3 0.005 0.592 14.1 0.003 0.739 10.4 0.004 0.596 14.2 0.004 0.743 10.5 0.005 0.601 14.3 0.003 0.746 10.6 0.005 0.606 14.4 0.003 0.749 10.7 0.004 0.61 14.5 0.004 0.753 10.8 0.005 0.615 14.6 0.003 0.756 10.9 0.005 0.62 14.7 0.003 0.759
11 0.004 0.624 14.8 0.004 0.763 11.1 0.004 0.628 14.9 0.003 0.766 11.2 0.005 0.633 15 0.003 0.769 11.3 0.004 0.637 15.1 0.003 0.772
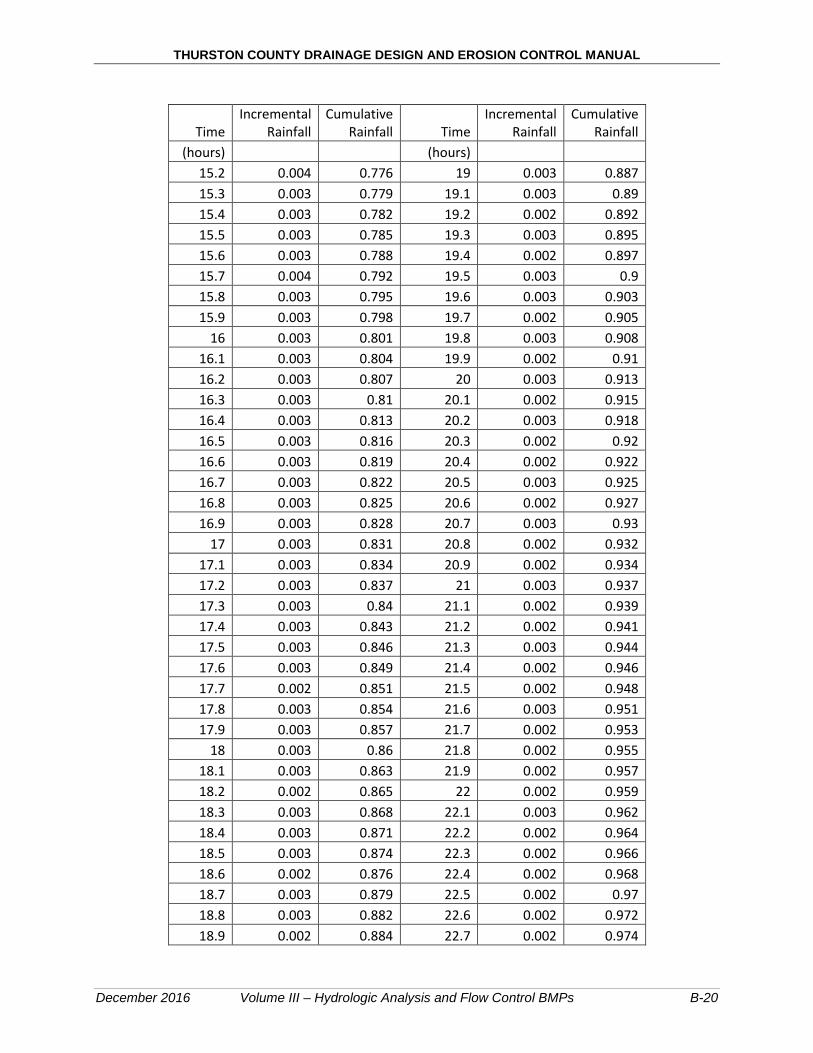
THURSTON COUNTY DRAINAGE DESIGN AND EROSION CONTROL MANUAL
December 2016 Volume III – Hydrologic Analysis and Flow Control BMPs B-20
Time Incremental
Rainfall Cumulative
Rainfall Time Incremental
Rainfall Cumulative
Rainfall (hours) (hours)
15.2 0.004 0.776 19 0.003 0.887 15.3 0.003 0.779 19.1 0.003 0.89 15.4 0.003 0.782 19.2 0.002 0.892 15.5 0.003 0.785 19.3 0.003 0.895 15.6 0.003 0.788 19.4 0.002 0.897 15.7 0.004 0.792 19.5 0.003 0.9 15.8 0.003 0.795 19.6 0.003 0.903 15.9 0.003 0.798 19.7 0.002 0.905
16 0.003 0.801 19.8 0.003 0.908 16.1 0.003 0.804 19.9 0.002 0.91 16.2 0.003 0.807 20 0.003 0.913 16.3 0.003 0.81 20.1 0.002 0.915 16.4 0.003 0.813 20.2 0.003 0.918 16.5 0.003 0.816 20.3 0.002 0.92 16.6 0.003 0.819 20.4 0.002 0.922 16.7 0.003 0.822 20.5 0.003 0.925 16.8 0.003 0.825 20.6 0.002 0.927 16.9 0.003 0.828 20.7 0.003 0.93
17 0.003 0.831 20.8 0.002 0.932 17.1 0.003 0.834 20.9 0.002 0.934 17.2 0.003 0.837 21 0.003 0.937 17.3 0.003 0.84 21.1 0.002 0.939 17.4 0.003 0.843 21.2 0.002 0.941 17.5 0.003 0.846 21.3 0.003 0.944 17.6 0.003 0.849 21.4 0.002 0.946 17.7 0.002 0.851 21.5 0.002 0.948 17.8 0.003 0.854 21.6 0.003 0.951 17.9 0.003 0.857 21.7 0.002 0.953
18 0.003 0.86 21.8 0.002 0.955 18.1 0.003 0.863 21.9 0.002 0.957 18.2 0.002 0.865 22 0.002 0.959 18.3 0.003 0.868 22.1 0.003 0.962 18.4 0.003 0.871 22.2 0.002 0.964 18.5 0.003 0.874 22.3 0.002 0.966 18.6 0.002 0.876 22.4 0.002 0.968 18.7 0.003 0.879 22.5 0.002 0.97 18.8 0.003 0.882 22.6 0.002 0.972 18.9 0.002 0.884 22.7 0.002 0.974

THURSTON COUNTY DRAINAGE DESIGN AND EROSION CONTROL MANUAL
December 2016 Volume III – Hydrologic Analysis and Flow Control BMPs B-21
Time Incremental
Rainfall Cumulative
Rainfall (hours)
22.8 0.002 0.976 22.9 0.002 0.978
23 0.002 0.98 23.1 0.002 0.982 23.2 0.002 0.984 23.3 0.002 0.986 23.4 0.002 0.988 23.5 0.002 0.99 23.6 0.002 0.992 23.7 0.002 0.994 23.8 0.002 0.996 23.9 0.002 0.998
24 0.002 1
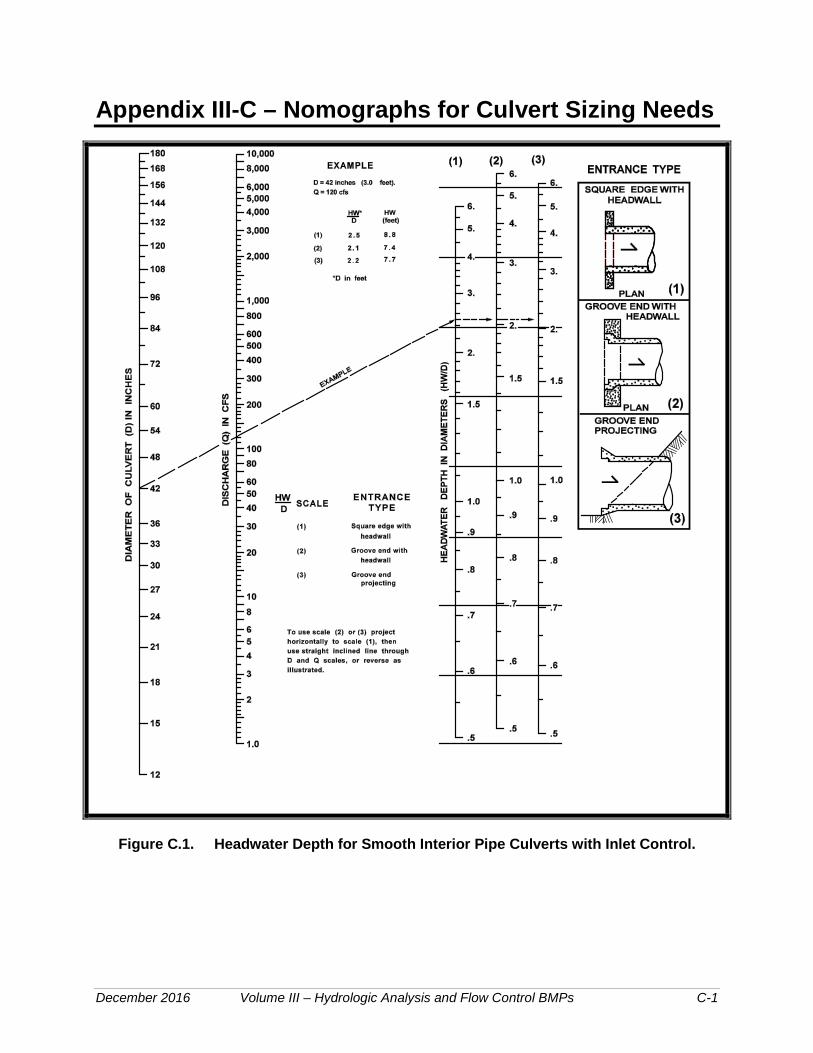
December 2016 Volume III – Hydrologic Analysis and Flow Control BMPs C-1
Appendix III-C – Nomographs for Culvert Sizing Needs
Figure C.1. Headwater Depth for Smooth Interior Pipe Culverts with Inlet Control.
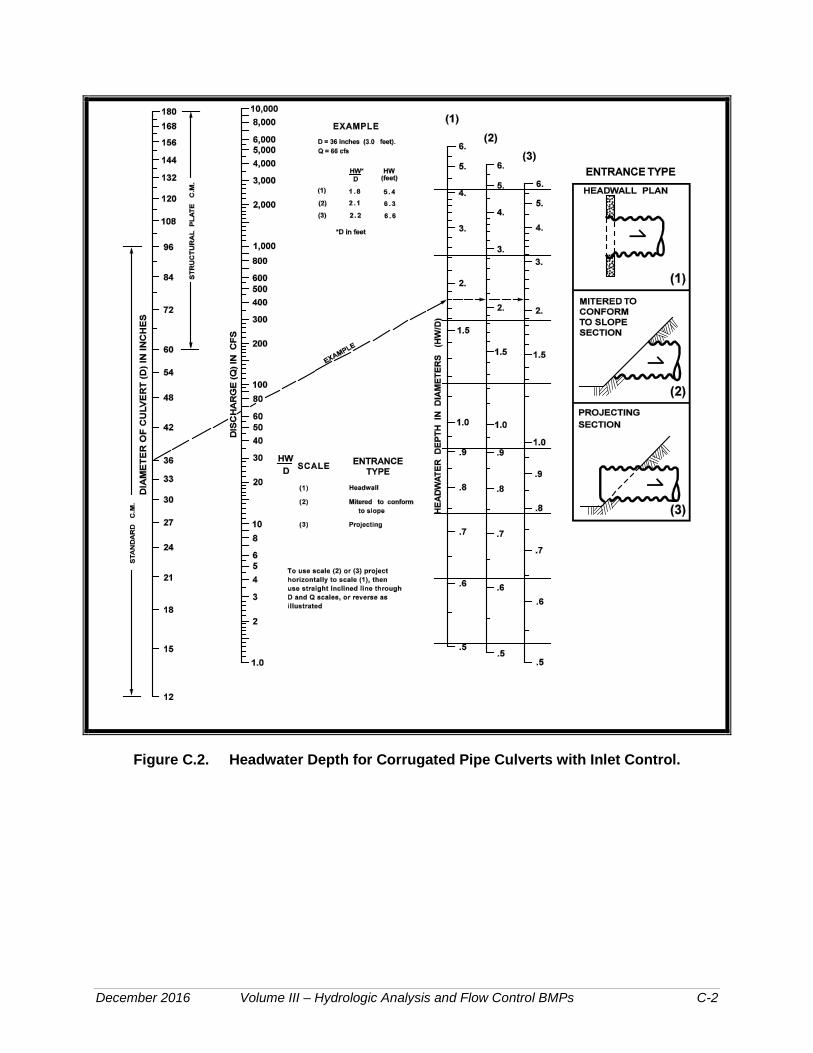
December 2016 Volume III – Hydrologic Analysis and Flow Control BMPs C-2
Figure C.2. Headwater Depth for Corrugated Pipe Culverts with Inlet Control.
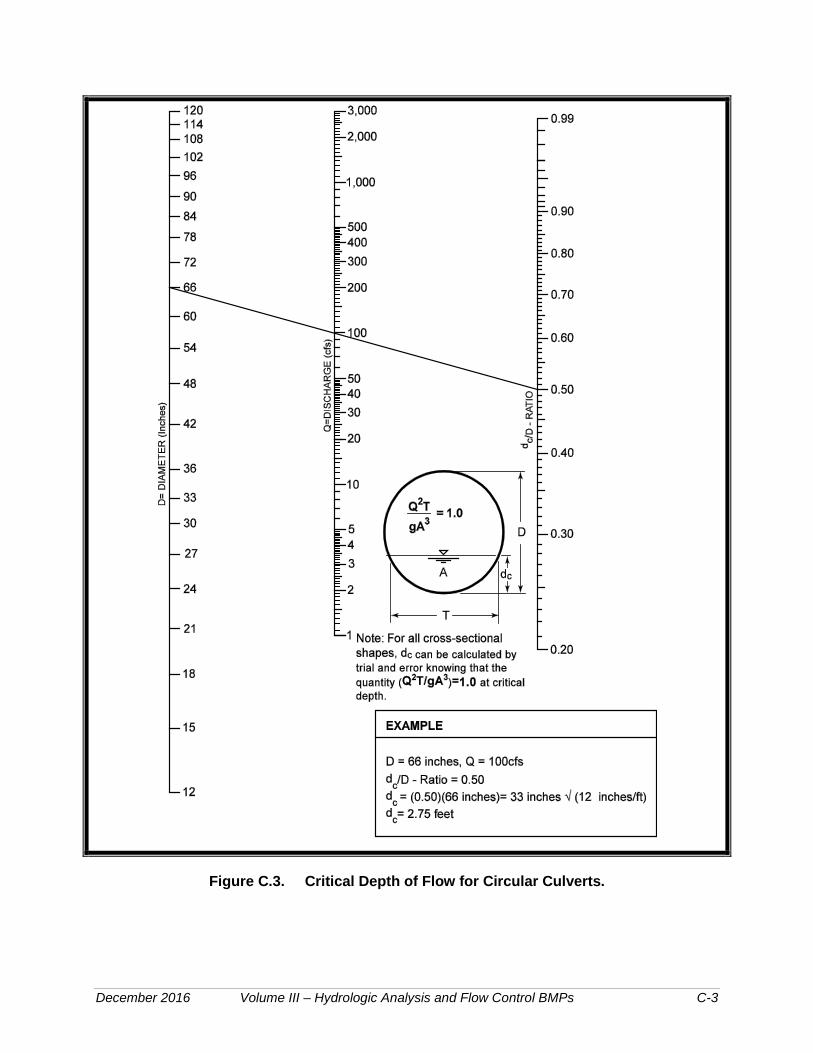
December 2016 Volume III – Hydrologic Analysis and Flow Control BMPs C-3
Figure C.3. Critical Depth of Flow for Circular Culverts.
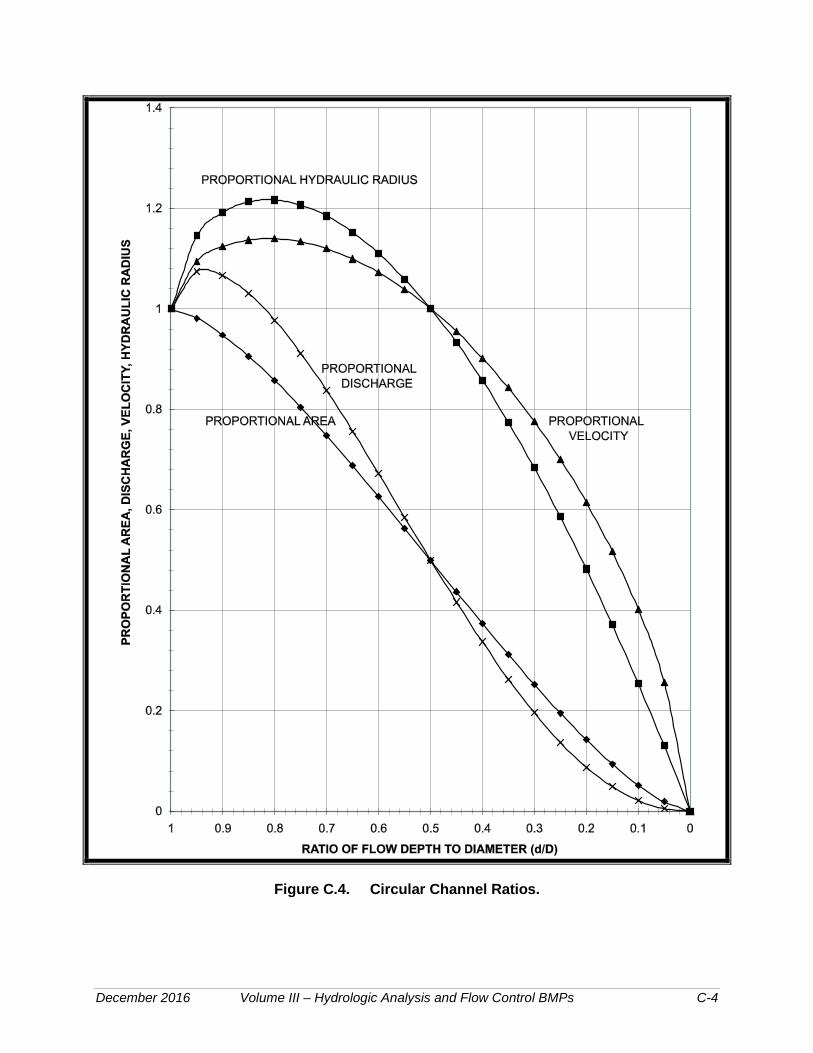
December 2016 Volume III – Hydrologic Analysis and Flow Control BMPs C-4
Figure C.4. Circular Channel Ratios.

December 2016 Volume III – Hydrologic Analysis and Flow Control BMPs D-1
Appendix III-D – On-site Stormwater Management BMP Infeasibility Criteria The following tables present infeasibility criteria that can be used to justify not using various on-site stormwater management BMPs for consideration in the List #1 or List #2 option of Core Requirement #5. This information is also included under the detailed descriptions of each BMP, but is provided here in this appendix for additional clarity and efficiency. Where any inconsistencies or lack of clarity exists, the requirements in the main text of each volume shall be applied. If a project is limited by one or more of the infeasibility criteria specified below, but still wishes to use the given BMP, they may propose a functionally equivalent design to the county for review and approval.
Lawn and Landscaped Areas BMP Infeasibility Criteria Soil Preservation and Amendment
• Structural and Engineered soils on slopes, cuts or fill areas where a geotechnical engineer has recommended alternative soil restoration methods.
• Site setbacks and design criteria provided in Volume V, Appendix E cannot be achieved.
Roofs BMP Infeasibility Criteria Full Dispersion • Site setbacks and design criteria provided in Volume V, Appendix
E cannot be achieved. • A 65 to 10 ratio of forested or native vegetation area to
impervious area cannot be achieved. • A minimum forested or native vegetation flowpath length of 100
feet (25 feet for sheet flow from a non-native pervious surface) cannot be achieved.
Bioretention or Rain Gardens
• Note: criteria with setback distances are as measured from the bottom edge of the bioretention soil mix.
• Site setbacks provided in Volume V, Appendix E cannot be achieved.
• Citation of any of the following infeasibility criteria must be based on an evaluation of site-specific conditions and a written recommendation from an appropriate licensed professional (e.g., engineer, geologist, hydrogeologist):
• Where professional geotechnical evaluation recommends infiltration not be used due to reasonable concerns about erosion, slope failure, or downgradient flooding.
• Within 50 feet from the top of slopes that are greater than 20% and over 10 feet of vertical relief.
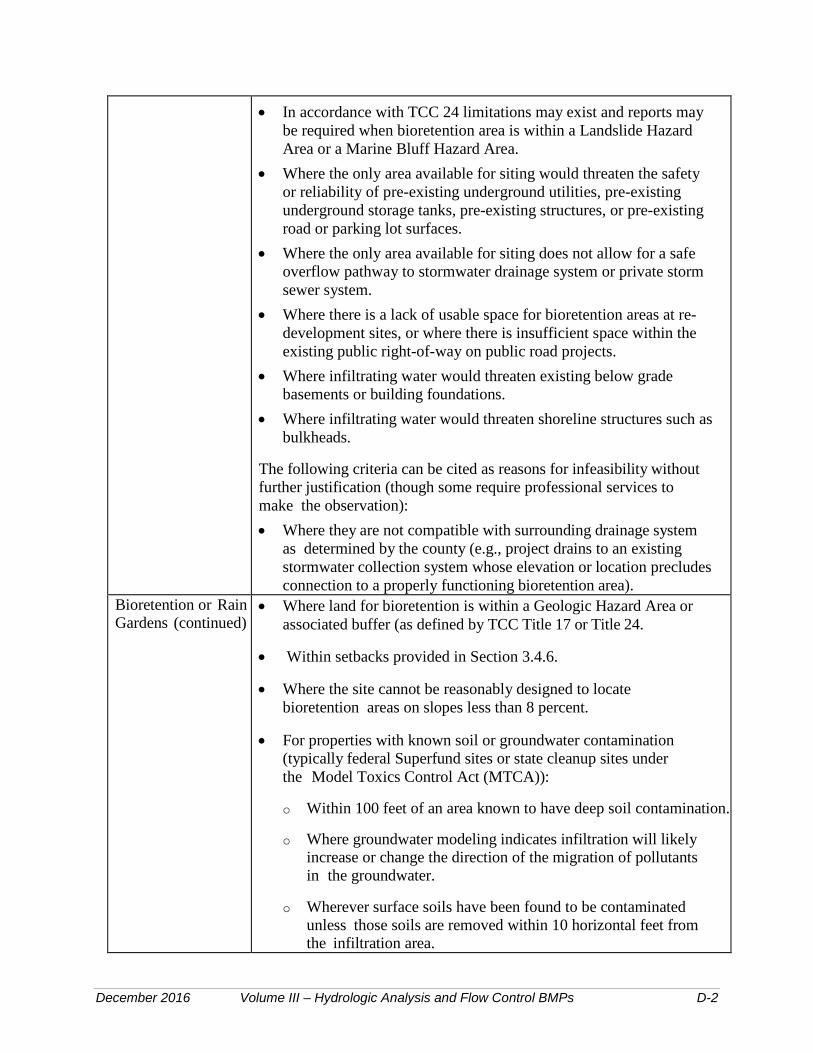
December 2016 Volume III – Hydrologic Analysis and Flow Control BMPs D-2
• In accordance with TCC 24 limitations may exist and reports may be required when bioretention area is within a Landslide Hazard Area or a Marine Bluff Hazard Area.
• Where the only area available for siting would threaten the safety or reliability of pre-existing underground utilities, pre-existing underground storage tanks, pre-existing structures, or pre-existing road or parking lot surfaces.
• Where the only area available for siting does not allow for a safe overflow pathway to stormwater drainage system or private storm sewer system.
• Where there is a lack of usable space for bioretention areas at re- development sites, or where there is insufficient space within the existing public right-of-way on public road projects.
• Where infiltrating water would threaten existing below grade basements or building foundations.
• Where infiltrating water would threaten shoreline structures such as bulkheads.
The following criteria can be cited as reasons for infeasibility without further justification (though some require professional services to make the observation): • Where they are not compatible with surrounding drainage system
as determined by the county (e.g., project drains to an existing stormwater collection system whose elevation or location precludes connection to a properly functioning bioretention area).
Bioretention or Rain Gardens (continued)
• Where land for bioretention is within a Geologic Hazard Area or associated buffer (as defined by TCC Title 17 or Title 24.
• Within setbacks provided in Section 3.4.6.
• Where the site cannot be reasonably designed to locate bioretention areas on slopes less than 8 percent.
• For properties with known soil or groundwater contamination (typically federal Superfund sites or state cleanup sites under the Model Toxics Control Act (MTCA)):
o Within 100 feet of an area known to have deep soil contamination.
o Where groundwater modeling indicates infiltration will likely increase or change the direction of the migration of pollutants in the groundwater.
o Wherever surface soils have been found to be contaminated unless those soils are removed within 10 horizontal feet from the infiltration area.

December 2016 Volume III – Hydrologic Analysis and Flow Control BMPs D-3
o Any area where these facilities are prohibited by an approved cleanup plan under the state Model Toxics Control Act or Federal Superfund Law, or an environmental covenant under Chapter 64.70 RCW.
• Within 100 feet of a closed or active landfill or a drinking water supply well.
• Within 10 feet of small on-site sewage disposal drainfield, including reserve areas, and grey water reuse systems (per WAC 246-272A-0210). This requirement may be modified by the Thurston County Health Department if site topography clearly prohibits flows from intersecting the drainfield or where site conditions (soil permeability, distance between systems, etc.) indicate that this is unnecessary. For setbacks from a “large on-site sewage disposal system”, see Chapter 246-272B WAC.
• Within 10 feet of an underground storage tank and connecting underground pipes when the capacity of the tank and pipe system is 1100 gallons or less. (As used in these criteria, an underground storage tank means any tank used to store petroleum products, chemicals, or liquid hazardous wastes of which 10 percent or more of the storage volume (including volume in the connecting piping system) is beneath the ground surface.
Bioretention or Rain Gardens (continued)
• Where field testing indicates potential bioretention/rain garden sites have a measured (a.k.a., initial) native soil saturated hydraulic conductivity less than 0.30 inches per hour. A small-scale or large- scale PIT in accordance with Appendix III-A shall be used to demonstrate infeasibility of bioretention areas. If the measured native soil infiltration rate is less than 0.30 in/hour, bioretention/rain garden BMPs are not required to be evaluated as an option in List #1 or List #2. In these slow draining soils, a bioretention area with an underdrain may be used to treat pollution-generating surfaces to help meet Core Requirement #6, Runoff Treatment. If the underdrain is elevated within a base course of gravel, it will also provide some modest flow reduction benefit that will help achieve Core Requirement #7.
• Within 100 feet of an underground storage tank and connecting underground pipes when the capacity of the tank and pipe system is greater than 1,100 gallons.
Downspout Infiltration Systems
• Site setbacks and design criteria provided in Volume V, Appendix E cannot be achieved.
• The lot(s) or site does not have outwash or loam soils. • There is not at least 12 inches or more of permeable soil from the
proposed bottom (final grade) of the infiltration system to the
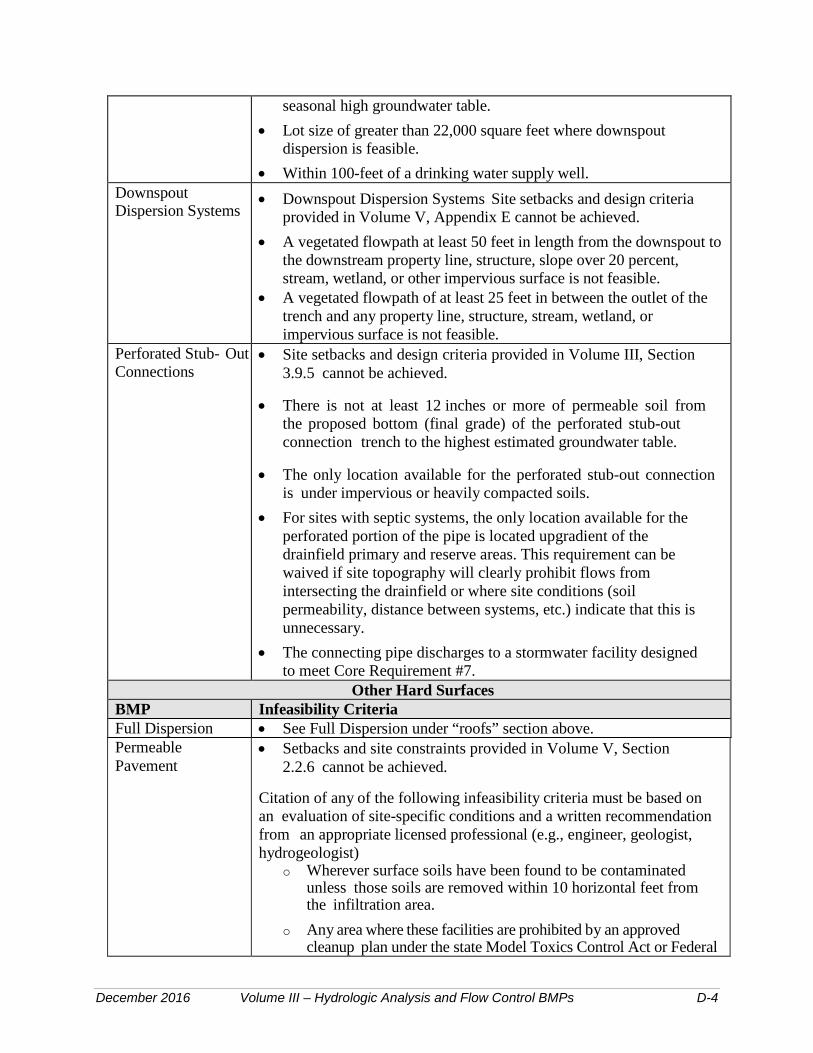
December 2016 Volume III – Hydrologic Analysis and Flow Control BMPs D-4
seasonal high groundwater table. • Lot size of greater than 22,000 square feet where downspout
dispersion is feasible. • Within 100-feet of a drinking water supply well.
Downspout Dispersion Systems
• Downspout Dispersion Systems Site setbacks and design criteria provided in Volume V, Appendix E cannot be achieved.
• A vegetated flowpath at least 50 feet in length from the downspout to the downstream property line, structure, slope over 20 percent, stream, wetland, or other impervious surface is not feasible.
• A vegetated flowpath of at least 25 feet in between the outlet of the trench and any property line, structure, stream, wetland, or impervious surface is not feasible.
Perforated Stub- Out Connections
• Site setbacks and design criteria provided in Volume III, Section 3.9.5 cannot be achieved.
• There is not at least 12 inches or more of permeable soil from the proposed bottom (final grade) of the perforated stub-out connection trench to the highest estimated groundwater table.
• The only location available for the perforated stub-out connection is under impervious or heavily compacted soils.
• For sites with septic systems, the only location available for the perforated portion of the pipe is located upgradient of the drainfield primary and reserve areas. This requirement can be waived if site topography will clearly prohibit flows from intersecting the drainfield or where site conditions (soil permeability, distance between systems, etc.) indicate that this is unnecessary.
• The connecting pipe discharges to a stormwater facility designed to meet Core Requirement #7.
Other Hard Surfaces BMP Infeasibility Criteria Full Dispersion • See Full Dispersion under “roofs” section above. Permeable Pavement
• Setbacks and site constraints provided in Volume V, Section 2.2.6 cannot be achieved.
Citation of any of the following infeasibility criteria must be based on an evaluation of site-specific conditions and a written recommendation from an appropriate licensed professional (e.g., engineer, geologist, hydrogeologist)
o Wherever surface soils have been found to be contaminated unless those soils are removed within 10 horizontal feet from the infiltration area.
o Any area where these facilities are prohibited by an approved cleanup plan under the state Model Toxics Control Act or Federal

December 2016 Volume III – Hydrologic Analysis and Flow Control BMPs D-5
Superfund Law, or an environmental covenant under Chapter 64.70 RCW.
• Within 100 feet of a closed or active landfill or drinking water supply well.
• Within 10 feet of any underground storage tank and connecting underground pipes, regardless of tank size. As used in these criteria, an underground storage tank means any tank used to store petroleum products, chemicals, or liquid hazardous wastes of which 10 percent or more of the storage volume (including volume in the connecting piping system) is beneath the ground surface.
• At multi-level parking garages, and over culverts and bridges.
• Where the site design cannot avoid putting pavement in areas likely to have long-term excessive sediment deposition after construction (e.g., construction and landscaping material yards).
• Where the site cannot reasonably be designed to have a porous asphalt surface at less than 5 percent slope, or a pervious concrete surface at less than 10 percent slope, or a permeable interlocking concrete pavement surface (where appropriate) at less than12 percent slope. Grid systems upper slope limit can range from 6 to 12 percent; check with manufacturer and local supplier.
• Where professional geotechnical evaluation recommends infiltration not be used due to reasonable concerns about erosion, slope failure, or downgradient flooding.
• In accordance with PCC Title 18E limitations may exist and reports may be required when permeable pavement is within 300 feet of a landslide hazard area or within 200 feet of an erosion hazard area.
• Where infiltrating and ponded water below the new permeable pavement area would compromise adjacent impervious pavements.
• Where infiltrating water below a new permeable pavement area would threaten existing below grade basements or building foundations.
• Where infiltrating water would threaten shoreline structures such as bulkheads.
• Down slope of steep, erosion prone areas that are likely to deliver sediment.
• Where fill soils are used that can become unstable when saturated.
• Excessively steep slopes where water within the aggregate base layer or at the subgrade surface cannot be controlled by detention structures and may cause erosion and structural failure, or where
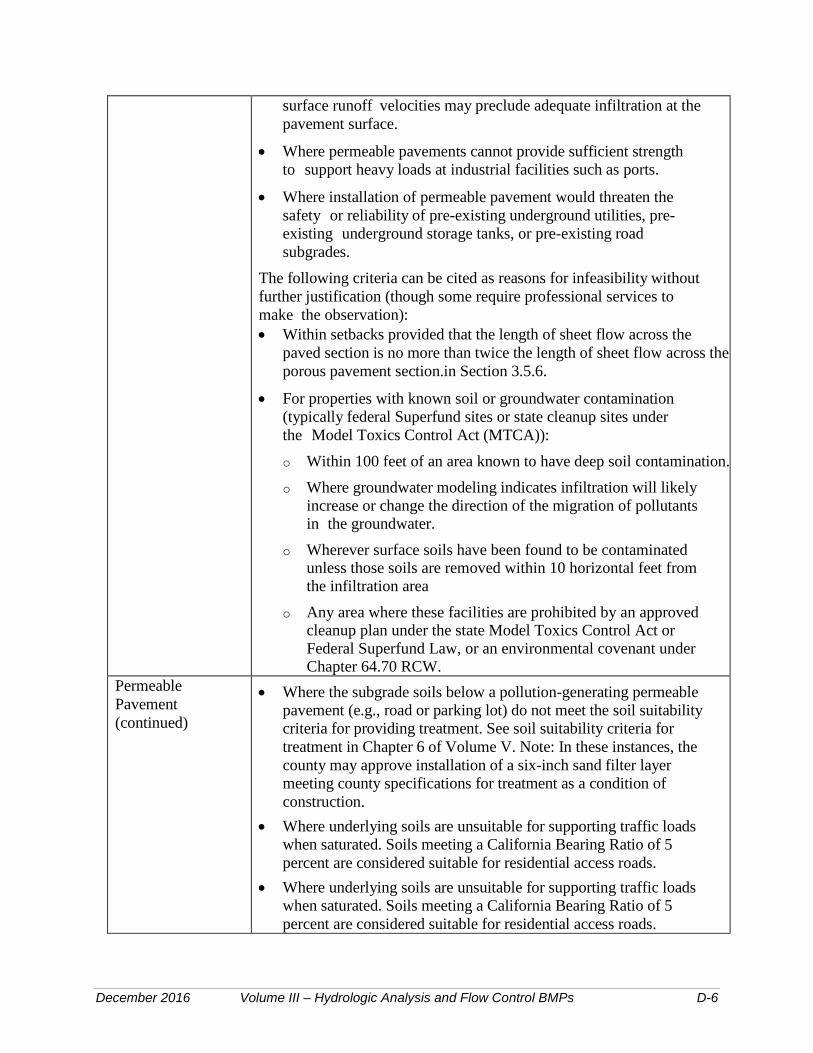
December 2016 Volume III – Hydrologic Analysis and Flow Control BMPs D-6
surface runoff velocities may preclude adequate infiltration at the pavement surface.
• Where permeable pavements cannot provide sufficient strength to support heavy loads at industrial facilities such as ports.
• Where installation of permeable pavement would threaten the safety or reliability of pre-existing underground utilities, pre-existing underground storage tanks, or pre-existing road subgrades.
The following criteria can be cited as reasons for infeasibility without further justification (though some require professional services to make the observation): • Within setbacks provided that the length of sheet flow across the
paved section is no more than twice the length of sheet flow across the porous pavement section.in Section 3.5.6.
• For properties with known soil or groundwater contamination (typically federal Superfund sites or state cleanup sites under the Model Toxics Control Act (MTCA)): o Within 100 feet of an area known to have deep soil contamination. o Where groundwater modeling indicates infiltration will likely
increase or change the direction of the migration of pollutants in the groundwater.
o Wherever surface soils have been found to be contaminated unless those soils are removed within 10 horizontal feet from the infiltration area
o Any area where these facilities are prohibited by an approved cleanup plan under the state Model Toxics Control Act or Federal Superfund Law, or an environmental covenant under Chapter 64.70 RCW.
Permeable Pavement (continued)
• Where the subgrade soils below a pollution-generating permeable pavement (e.g., road or parking lot) do not meet the soil suitability criteria for providing treatment. See soil suitability criteria for treatment in Chapter 6 of Volume V. Note: In these instances, the county may approve installation of a six-inch sand filter layer meeting county specifications for treatment as a condition of construction.
• Where underlying soils are unsuitable for supporting traffic loads when saturated. Soils meeting a California Bearing Ratio of 5 percent are considered suitable for residential access roads.
• Where underlying soils are unsuitable for supporting traffic loads when saturated. Soils meeting a California Bearing Ratio of 5 percent are considered suitable for residential access roads.
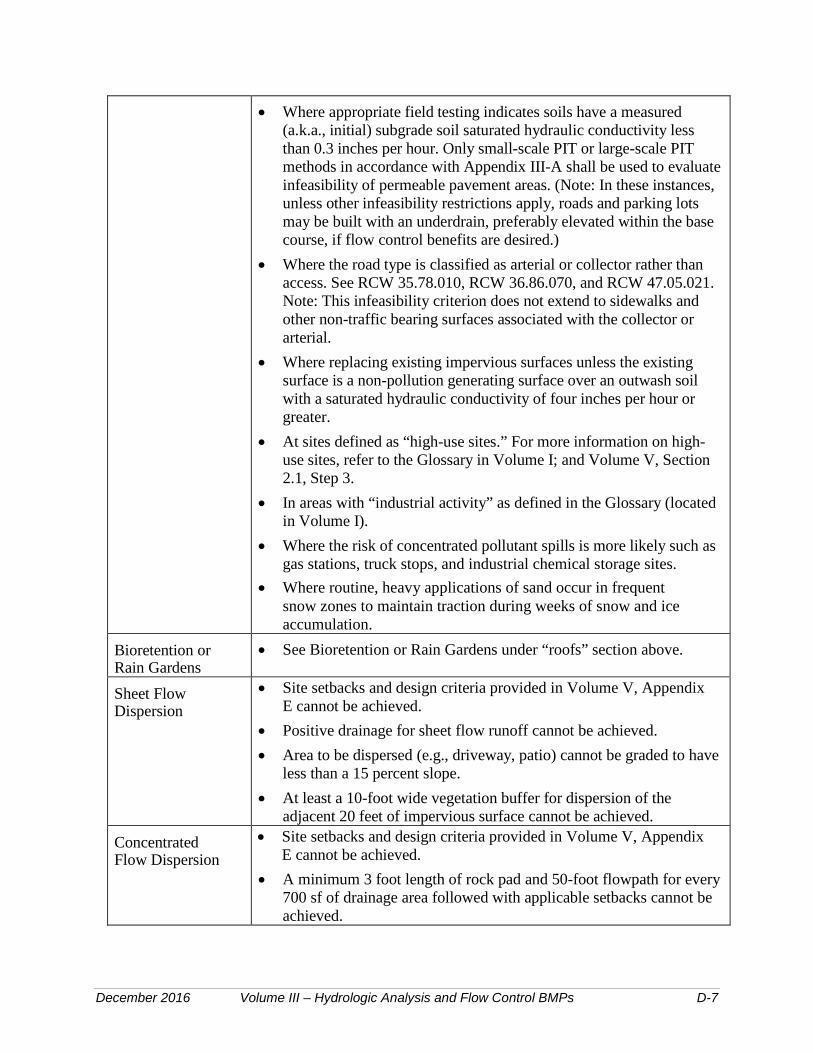
December 2016 Volume III – Hydrologic Analysis and Flow Control BMPs D-7
• Where appropriate field testing indicates soils have a measured (a.k.a., initial) subgrade soil saturated hydraulic conductivity less than 0.3 inches per hour. Only small-scale PIT or large-scale PIT methods in accordance with Appendix III-A shall be used to evaluate infeasibility of permeable pavement areas. (Note: In these instances, unless other infeasibility restrictions apply, roads and parking lots may be built with an underdrain, preferably elevated within the base course, if flow control benefits are desired.)
• Where the road type is classified as arterial or collector rather than access. See RCW 35.78.010, RCW 36.86.070, and RCW 47.05.021. Note: This infeasibility criterion does not extend to sidewalks and other non-traffic bearing surfaces associated with the collector or arterial.
• Where replacing existing impervious surfaces unless the existing surface is a non-pollution generating surface over an outwash soil with a saturated hydraulic conductivity of four inches per hour or greater.
• At sites defined as “high-use sites.” For more information on high-use sites, refer to the Glossary in Volume I; and Volume V, Section 2.1, Step 3.
• In areas with “industrial activity” as defined in the Glossary (located in Volume I).
• Where the risk of concentrated pollutant spills is more likely such as gas stations, truck stops, and industrial chemical storage sites.
• Where routine, heavy applications of sand occur in frequent snow zones to maintain traction during weeks of snow and ice accumulation.
Bioretention or Rain Gardens
• See Bioretention or Rain Gardens under “roofs” section above.
Sheet Flow Dispersion
• Site setbacks and design criteria provided in Volume V, Appendix E cannot be achieved.
• Positive drainage for sheet flow runoff cannot be achieved. • Area to be dispersed (e.g., driveway, patio) cannot be graded to have
less than a 15 percent slope. • At least a 10-foot wide vegetation buffer for dispersion of the
adjacent 20 feet of impervious surface cannot be achieved. Concentrated Flow Dispersion
• Site setbacks and design criteria provided in Volume V, Appendix E cannot be achieved.
• A minimum 3 foot length of rock pad and 50-foot flowpath for every 700 sf of drainage area followed with applicable setbacks cannot be achieved.

This page intentionally left blank.