three-north shelter forest program ... - atmos-chem … · x. zhang et al.: long-term increasing...
TRANSCRIPT

Atmos. Chem. Phys., 16, 6949–6960, 2016www.atmos-chem-phys.net/16/6949/2016/doi:10.5194/acp-16-6949-2016© Author(s) 2016. CC Attribution 3.0 License.
Three-North Shelter Forest Program contribution to long-termincreasing trends of biogenic isoprene emissions in northern ChinaXiaodong Zhang1, Tao Huang1, Leiming Zhang2, Yanjie Shen1, Yuan Zhao1, Hong Gao1, Xiaoxuan Mao1,Chenhui Jia1, and Jianmin Ma1,3
1Key Laboratory for Environmental Pollution Prediction and Control, Gansu Province Collegeof Earth and Environmental Sciences, Lanzhou University, Lanzhou, China2Air Quality Research Division, Environment Canada, Toronto, Ontario, Canada3CAS Center for Excellence in Tibetan Plateau Earth Sciences, Beijing, China
Correspondence to: Jianmin Ma ([email protected])and Tao Huang ([email protected])
Received: 21 November 2015 – Published in Atmos. Chem. Phys. Discuss.: 21 January 2016Revised: 3 May 2016 – Accepted: 18 May 2016 – Published: 7 June 2016
Abstract. To assess the long-term trends of isoprene emis-sions in northern China and the impact of the Three-NorthShelter Forest Program (TNRSF) on these trends, a databaseof historical biogenic isoprene emissions from 1982 to 2010was developed for this region using a biogenic emissionmodel for gases and aerosols. The total amount of the bio-genic isoprene emissions during the 3 decades was 4.4 Tgin northern China and 1.6 Tg in the TNRSF, with annualemissions ranging from 132 000 to 176 000 t yr−1 and from45 000 to 70 000 t yr−1, respectively, in the two regions. Iso-prene emission fluxes have increased substantially in manyareas of the TNRSF over the last 3 decades due to the grow-ing trees and vegetation coverage, especially in the cen-tral north China region where the highest emission inclinereached to 58 % from 1982 to 2010. Biogenic isoprene emis-sions produced from anthropogenic forests tended to surpassthose produced from natural forests, such as boreal forests innortheastern China. The estimated isoprene emissions sug-gest that the TNRSF has altered the long-term emission trendin north China from a decreasing trend during 1982 to 2010(slope=−0.533, R2
= 0.05) to an increasing trend for thesame period of time (slope= 0.347, R2
= 0.014), providingstrong evidence for the change in the emissions of biogenicvolatile organic compounds (BVOCs) induced by the humanactivities on decadal or longer timescales.
1 Introduction
While trees and plants can efficiently remove pollutants fromthe atmosphere (Nowak et al., 2006, 2014; Myles et al.,2012; Camporn, 2013; Fenn et al., 2013; Adon et al., 2013;Zhang et al., 2015), they also play a role in air pollutionthrough atmospheric chemistry. It has been widely acknowl-edged that terrestrial ecosystems release large quantities ofreactive biogenic volatile organic compounds (BVOCs) intothe atmosphere as a significant product of biosynthetic ac-tivities of trees and plants (Purves et al., 2004; Zemankovaand Brechler, 2010). BVOCs play important roles in tropo-spheric chemistry, carbon budget, and global climate change(Purves et al., 2004; Nichol and Wong, 2011; Aydin et al.,2014). For example, BVOCs are precursors of surface ozoneformation in the presence of nitrogen oxide (NOx) (Penuelaset al., 2009; Penuelas and Staudt, 2010). It has been shownthat VOC emissions from biogenic sources have far exceededthose from anthropogenic sources (Guenther et al., 1995; Ay-din et al., 2014).
Among the three dominant VOCs (isoprene, monoter-penes, oxygenated compounds) contributing to BVOC emis-sion fluxes, isoprene accounts for 70 % of the total BVOCemissions globally (Guenther et al., 2006; Helmig et al.,2013; Aydin et al., 2014) and about 50 % in China (Songet al., 2012; Li et al., 2013). In particular, terrestrial plantfoliage is thought to be the major source of atmosphericisoprene which releases over 90 % of isoprene from global
Published by Copernicus Publications on behalf of the European Geosciences Union.
6950 X. Zhang et al.: Long-term increasing trends of biogenic isoprene emissions
forests (Lamb et al., 1987; Guenther et al., 2006). Exten-sive investigations have been conducted over the past severaldecades to assess BVOC emissions and their potential influ-ences on tropospheric chemistry and the carbon cycle (Lambet al., 1987; Geron et al., 2006; Müller et al., 2008; Changet al., 2009; Pacifico et al., 2009; Zemankova and Brechler,2010; Guo et al., 2013; Calfapietra et al., 2013). Efforts havebeen also made to measure and simulate BVOC emissionsin China (Wei et al., 2007; Chen et al., 2009; Song et al.,2012; Li et al., 2013). A recent study by Song et al. (2012)revealed that the annual BVOC emissions in eastern Chinawas 11.3× 10⁶ t, of which 44.9 % was isoprene, followedby monoterpenes at 31.5 %, and other VOCs at 23.6 %. Thestudy also showed high isoprene emissions in boreal forestsin northeastern China, on the Qinling–Ta-pa mountains incentral China, and in southern China. Li et al. (2013) esti-mated China’s total BVOC emissions as 42.5 Tg in 2003, ofwhich 55 % was isoprene emission.
BVOC emissions are often thought to be static on decadalor longer timescales because forest coverage from regionalto global scales is assumed to be at steady state (Sander-son et al., 2003; Purves et al., 2004). However, there areconcerns for the potential impacts of climate change andchanges in underlying vegetation coverage on isoprene emis-sions because leaf-level emission intensity depends on bio-logical and meteorological conditions (Turner et al., 1991;Constable et al., 1999; Ashworth et al., 2010; Arneth et al.,2008, 2011). Several modeling studies were conducted toassess the interactions between biogenic isoprene emissionsand climate change as well as the human activities (Consta-ble et al., 1999; Sanderson et al., 2003). Using the USDA(the United States Department of Agriculture) Forest Ser-vice Inventory Analysis (FIA), Purves et al. (2004) estimateddecadal changes in BVOC emissions in the eastern US be-tween the 1980s and 1990s caused by changes in the extent,structure, and species composition of forests. They attributedthese changes to human-induced deforestation and reforesta-tion. Arneth et al. (2008, 2011) compared the responses ofthe simulated BVOC emissions derived using different mod-els to climate and vegetation changes. They found that in-creasing forest area could add several tens of percent to fu-ture isoprene emissions. Climate change could also exert in-fluences on isoprene emissions via the changes in tempera-ture and CO2. The latter can benefit forest productivity andleaf growth via fertilization effect. Steiner et al. (2002) sim-ulated the effect of human-induced land use changes due tourbanization and agriculture on BVOC emissions. Their re-sults revealed that the increasing anthropogenic emissions ofVOCs subject to urbanization overall enhanced total VOCemissions. Most of the existing studies were carried out usingclimate models subject to projected climate and land coverchange scenarios.
The three northern regions shelter forest (TNRSF) pro-gram in China, also known as “the Green Great Wall”, beganin 1978 and will terminate in 2050. Figure 1 illustrates the
TNRSF regions, including 11 provinces and two megacities,Beijing and Tianjin, as highlighted in the figure caption andmarked in the figure. The program aims to increase China’sforest coverage from 5 % in the 1970s to 15 % by 2050. Bythe end of the fourth phase of the program in 2010, the vege-tation coverage over the TNRSF had already reached 12.4 %(Wang et al., 2011; Central Government of China, 2012).The program has achieved great successes in mitigating lo-cal ecological environment and climate, despite the debateson the effectiveness of the TNRSF in improving the ecolog-ical environments in northern China and negative influencesof the program on groundwater storage in arid and semi-aridregions (Pang, 1992; Cheng and Gu, 1992; Parungo et al.,1994; Hu et al., 2001; Zhong et al., 2001; Ding et al., 2005;Liu et al., 2008; Yan et al., 2011; Zheng and Zhu, 2013;Fang et al., 2001; Tan et al., 2007; Zhang et al., 2013). Re-cently, the TNRSF impact on air quality was also investigated(Zhang et al., 2015), which showed that the increased veg-etation coverage in the TNRSF has increased its efficiencyin removing air contaminants from the atmosphere as sup-ported by the increasing modeled dry deposition velocitiesand fluxes of sulfur dioxide (SO2) and NOx in many placesof the region during the past 3 decades.
Given its unique status in large-scale artificial afforestationin the human history, the TNRSF might provide significantinsights into understanding human-induced biogenic VOCemissions on a long-term scale. In the present study, a frame-work combining satellite remote sensing data, a biogenicemission model, and uncertainty analysis was first developedto estimate BVOC emissions in northern China. Seasonal andannual biogenic isoprene emission inventories were then de-veloped from 1982 to 2010. Finally, the potential influencesof the development and expansion of the TNRSF on the long-term trends of the biogenic isoprene emissions were investi-gated to discern evidence of decadal or longer-term changesin BVOC emissions from large-scale forest restorations in-duced by the human activities. The newly generated histori-cal isoprene emissions inventories over northern China willalso be useful for assessing past, current, and future air qual-ity and climate issues.
2 Methodology
2.1 BVOC emission model
The MEGAN2.1 (Model of Emissions of Gases and Aerosolsfrom Nature version 2.1) (Guenther et al., 2012) which isan updated version of MEGAN2.0 (Guenther et al., 2006)and MEGAN2.02 (Sakulyanontvittaya et al., 2008), was usedhere to estimate BVOC emissions in northern China. Thisnew version includes additional compounds, emission types,and various controlling processes. For BVOC emissions,MEGAN2.1 is primarily driven by biological and meteo-rological factors, including vegetation type with which the
Atmos. Chem. Phys., 16, 6949–6960, 2016 www.atmos-chem-phys.net/16/6949/2016/
X. Zhang et al.: Long-term increasing trends of biogenic isoprene emissions 6951
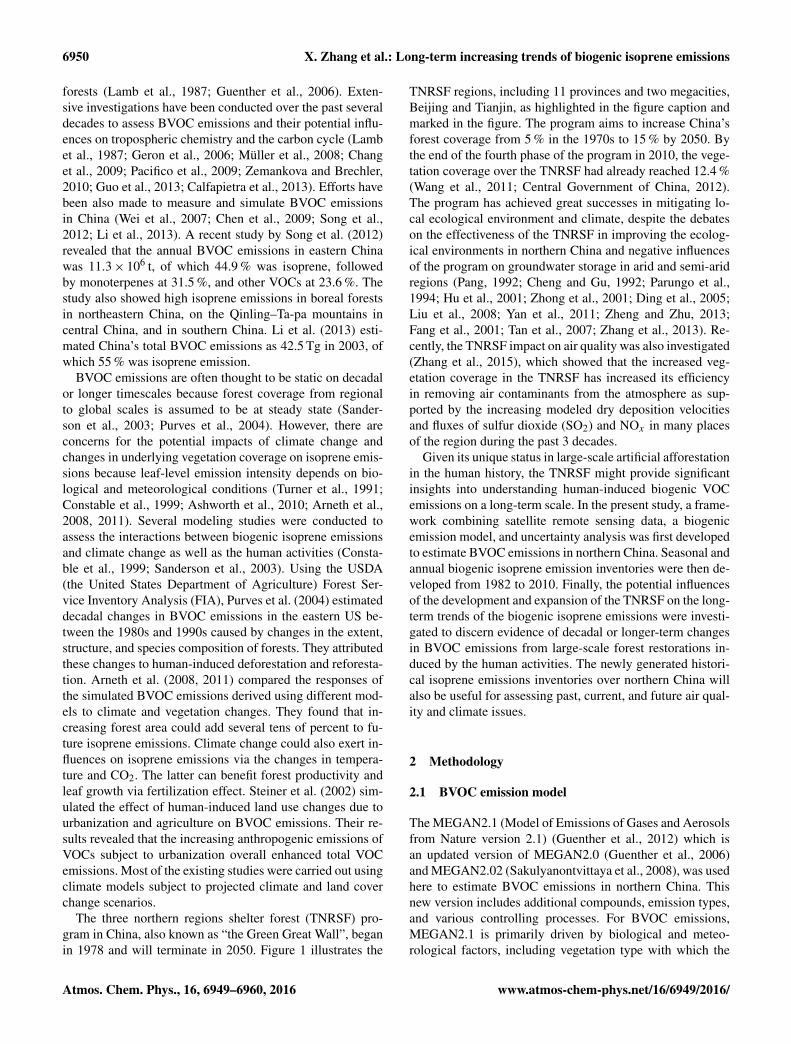
Figure 1. The Three-North Shelter Forest Program (TNRSF) in northern China (defined also by green color in the inner figure (right lowercorner of Fig. 1) and three regions of the TNRSF. The northwest China region of the TNRSF, defined by grey color, includes Xinjiang,Gansu, the north of Qinghai, Ningxia, west inner Mongolia, and the north of Shaanxi, many places in this part of the TNRSF, particularly inGansu, Ningxia, and west inner Mongolia, are not covered by forest but by shrubs; the central north China region, defined by orange goldcolor, includes the north of the Shanxi and Hebei provinces, Beijing, Tianjin, and central inner Mongolia; the northeast China region, definedby brass color, includes east inner Mongolia, parts of the Liaoning, Jilin, and Heilongjiang provinces. Red, blue, and yellow circles in theinner figure indicate three small areas in the TNRSF, farmland, and the boreal forest from which isoprene emission flux are extracted forcomparison (see Results and Discussions sections). Two megacities, Beijing and Tianjin in the central north China region, are also indicated.
emission factors of BVOCs are assigned, air and leaf temper-atures, light, leaf age and leaf area index (LAI), solar radia-tion/photosynthetically active radiation (PAR), wind speed,humidity, and soil moisture (Guenther et al., 2006, 2012;Pfister et al., 2008; Arneth et al., 2011). MEGAN2.1 was setup over northern China with a grid spacing of 0.25◦× 0.25◦
latitude/longitude to produce gridded daily and monthlyemission fluxes. Meteorological data used in the MEGAN2.1employed the 6-hourly objectively analyzed data from the1◦× 1◦ latitude/longitude NCEP (National Centers for Envi-ronmental Prediction, 2016) Final Operational Global Anal-ysis. These data were then interpolated into the TNRSF gridson the spatial resolution of 0.25× 0.25 latitude/longitude.PAR was calculated from solar radiation provided by thebig-leaf dry deposition model (Zhang et al., 2002). Twenty-two land types were used, including an additional crop typewhich was not specified in the MEGAN2.1. These land typesat each model grid were identified using the surface rough-ness lengths estimated from satellite remote sensing data(Zhang et al., 2015). Guenther et al. (2012) reported the dif-ferences in MEGAN2.1 modeled annual isoprene emissionsas a result of changing plant functional type (PFT) (24 %),
LAI (29 %), and meteorology (15 %) input data. This sug-gests that LAI is one of crucial variables in the model.
2.2 LAI
LAI data with 0.25◦× 0.25◦ latitude/longitude resolutionfrom 1982 to 2010 were derived from the satellite remotesensing data of the normalized difference vegetation index(NDVI) for the same period. Detailed descriptions of the pro-cedures generating LAI data for the TNRSF region were pre-sented in Zhang et al. (2015).
2.3 Uncertainty analysis
Although the BVOC emissions model was well establishedfor different vegetation types, there were uncertainties in theestimate of BVOC emission fluxes. Some of these uncertain-ties are generated from inaccurate emission factors, empiri-cal algorithms, and input data used in the model (Hanna etal., 2005; Guenther et al., 2012). Situ et al. showed that, inaddition to the emission factors, PAR and temperature alsocreated large uncertainties in the MEGAN model (Situ etal., 2014). A Monte Carlo technique was used to evaluate
www.atmos-chem-phys.net/16/6949/2016/ Atmos. Chem. Phys., 16, 6949–6960, 2016

6952 X. Zhang et al.: Long-term increasing trends of biogenic isoprene emissions
Figure 2. Domain-averaged annual emission flux (micromoles m−2 h−1) of isoprene over the TNRSF from 1982 to 2010. Red dotted lineindicates linear trend of emission fluxes and shading stands for ±1 standard deviation of emission fluxes.
uncertainties of modeled isoprene emissions by MEGAN2.1(Hanna et al., 2005; Guenther et al., 2006, 2012; Situ et al.,2014). In the uncertainty analysis, each input parameter inMEGAN2.1 for isoprene emissions, including LAI, leaf tem-perature (a function of air temperature), PAR, emission fac-tors, several empirical coefficients related to past leaf tem-peratures, and solar zenith, was treated as a random vari-able with a normal distribution. The MEGAN2.1 model forBVOC emissions was run repeatedly 100 000 times at the95 % confidence level based on the coefficients of variation(CV, %) of these input parameters. The Monte Carlo simu-lations showed that the isoprene emissions reached approxi-mately a normal distribution, ranging from 0.05 to 5.29 mi-cromole m−2 h−1 with the variation from 97 to 211 %. De-tails for the uncertainty analysis are presented in the Supple-ment (Table S1, Fig. S1).
3 Results
3.1 Isoprene emission inventory in TNRSF
Figure 2 shows the TNRSF domain-averaged annual bio-genic isoprene emissions (micromoles m−2 h−1) aggregatedfrom monthly values. The magnitudes of isoprene emissionsestimated in the present study agree with China’s BVOCemission inventory established previously, particularly in thenatural forests (Song et al., 2012; Li et al., 2013), as elab-orated below. A long-term increasing trend up to 2007,although with fluctuations in certain years, was observed(Fig. 2). The emissions in the central north region of theTNRSF exhibited the strongest increasing trend with thehighest emission increase by 58 % over the 30-year period.
Figure S2 illustrates the MEGAN2.1 simulated isopreneemission fluxes across the TNRSF in 1982, the early stageof the TNRSF construction, and 2010, the end of the fourthphase (2001–2010) of the program, respectively. Comparedwith the emission fluxes in 1982, higher isoprene emissions
in the central north China region and lower emission fluxesin the northeast region and eastern inner Mongolia region ofthe TNRSF were identified in 2010. The differences in thebiogenic isoprene emissions between 1982 and 2010 werecalculated as Edif = E2010−E1982. The spatial pattern ofEdif (Fig. 3) is consistent with the emission fluxes in 1982and 2010, as shown in Fig. S2a and b. Positive differencesof Edif were observed in the mountainous areas of westXinjiang, Shaanxi, eastern Gansu provinces, and the centralnorth China region, suggesting increasing isoprene emissionsassociated with the expansion of the TNRSF in these regions.
As mentioned previously in the Introduction, in additionto forest expansion, biogenic isoprene emissions are also as-sociated with climate change via changes in mean tempera-ture (Sanderson et al., 2003) and PAR (Guenther et al., 2006,2012; Situ et al., 2014). Since the influence of climate changeon BVOC is beyond the scope of this article, we shall notassess detailed associations between climate change (meantemperature) and isoprene emissions from the TNRSF. Nev-ertheless, in Sect. 4, we shall briefly discuss the potential in-fluence of the changes in annual mean air temperature andPAR on long-term trends of biogenic isoprene emissions inthe TNRSF.
3.2 Isoprene emission trend in the TNRSF andnorthern China
Decadal or longer time trends in isoprene emissions over theTNRSF and northern China can provide some insights intothe impact of the large-scale artificial afforestation on BVOCemissions – the knowledge that is needed to address air qual-ity, climate, and ecosystem issues. Figure 4 illustrates mod-eled isoprene emission fluxes (micromoles m−2 h−1) in 2000(Fig. 4a), after 20 years of construction of the TNRSF, andthe slopes (trends) of the linear regression relationship be-tween isoprene emissions and the time sequence of 1982–2010 (Fig. 4b) over northern China, respectively. High iso-prene emissions can be found in the regions extending from
Atmos. Chem. Phys., 16, 6949–6960, 2016 www.atmos-chem-phys.net/16/6949/2016/

X. Zhang et al.: Long-term increasing trends of biogenic isoprene emissions 6953
Figure 3. Differences of emission flux (E2010−E1982, micromoles m−2 h−1) of isoprene between 1982 and 2010. The emission fluxes inthese 2 years are shown in Fig. S2a and b in the Supplement.
Figure 4. (a) Gridded annual isoprene biogenic emissions (micromoles m−2 h−1) in the year 2000 over northern China with spac-ing 1/4◦× 1/4◦ latitude/longitude; (b) slopes of linear regression relationships between annual mean isoprene emission flux (micro-moles m−2 h−1) and the time sequence (or linear trend) from 1982 to 2010 across northern China.
the northeast Qinghai province to the Ta-pa Mountains, theboreal forest in northeast China, central north China, andthe Tianshan Mountain and Pamirs in the Xinjiang province.The spatial pattern of the estimated emissions in northeast-ern China is similar to Song et al. (2012)’s results from2008 to 2010 (Song et al., 2012). They showed high isopreneemissions from the boreal forest in northeastern China andQinling–Ta-pa mountains.
The total annual isoprene emission, summed from annualemissions of the model grids that fall within the TNRSFdomain, ranged from 45 000 to 70 000 t yr−1 during 1982–2010 for the whole TNRSF (the area encircled by the bluesolid line in Fig. 4), and from 132 000 to 176 000 t yr−1 forall of northern China (Fig. 4). This is equivalent to a totalemission of 1.6 and 4.4 Tg, respectively, for the two regionsduring the past 3 decades from 1982 to 2010. It is worth
www.atmos-chem-phys.net/16/6949/2016/ Atmos. Chem. Phys., 16, 6949–6960, 2016

6954 X. Zhang et al.: Long-term increasing trends of biogenic isoprene emissions
Figure 5. Slopes of linear regression relationships between summer mean isoprene emission flux (micromoles m−2 h−1) and the time se-quence (or linear trend) from 1982 to 2010 across the TNRSF.
noting that, although the TNRSF accounts for 59 % of thetotal area of northern China and 42 % of mainland China(Zhang et al., 2015), it covers almost all arid and semi-aridregions in northern China. Vegetation coverage in these re-gions was still sparse after 30 years of construction of theTNRSF, and shrubs, instead of trees, are major plant typesin the northwest China region of the TNRSF. The isopreneemissions are considerably low in these regions, as shownby Figs. 4 and 5. In addition, as shown by Fig. 4, the re-gion of northern China defined in this study extends virtu-ally to 30◦ N. Although the isoprene emissions in the TNRSFonly accounted for 37 % of the total emissions in northernChina, the relatively strong increasing trend (Fig. 2) in theTNRSF (slope= 0.881, R2
= 0.335) has reversed the neg-ative trend (slope=−0.533, R2
= 0.05) of the total annualisoprene emissions in northern China, which did not takethe isoprene emissions in the TNRSF into consideration, tothe positive trend (slope= 0.347, R2
= 0.014) from 1982 to2010 in northern China, as shown in Fig. S3.
To highlight the contribution of the TNRSF to the increas-ing isoprene emissions, the trend of the gridded isopreneemissions over the TNRSF was further investigated. As ex-pected, the estimated monthly emission fluxes showed dra-matic seasonal variations with the largest values in summerand the lowest values in winter, consistent with the seasonalchanges in LAI over the TNRSF (figure not shown). Figure 5presents the gridded trends of the summer biogenic isopreneemissions across the TNRSF from 1982 to 2010. The sum-mer emission fluxes exhibited a similar annual pattern to theannual emissions (Fig. 4b) but were greater than the annualemissions, as shown by Fig. 5. Positive trends of the emis-sions were observed in the mountainous and surrounding ar-eas of the Junggar Basins (north Xinjiang), eastern Qing-hai province in the northwest China region of the TNRSF,the central north China region, and the western Liaoningprovince in the northeast China region of the TNRSF. Theseprovinces and locations are marked in Fig. 1. In particu-lar, the largest positive trends can be observed in the areasnorth of the two megacities – Beijing and Tianjin. These twomegacities have been targeted as key cities to be protected by
the TNRSF from sandstorms from the north. Extensive treeplanting activities have been promoted to the north of thesetwo megacities (Central Government of China, 2012).
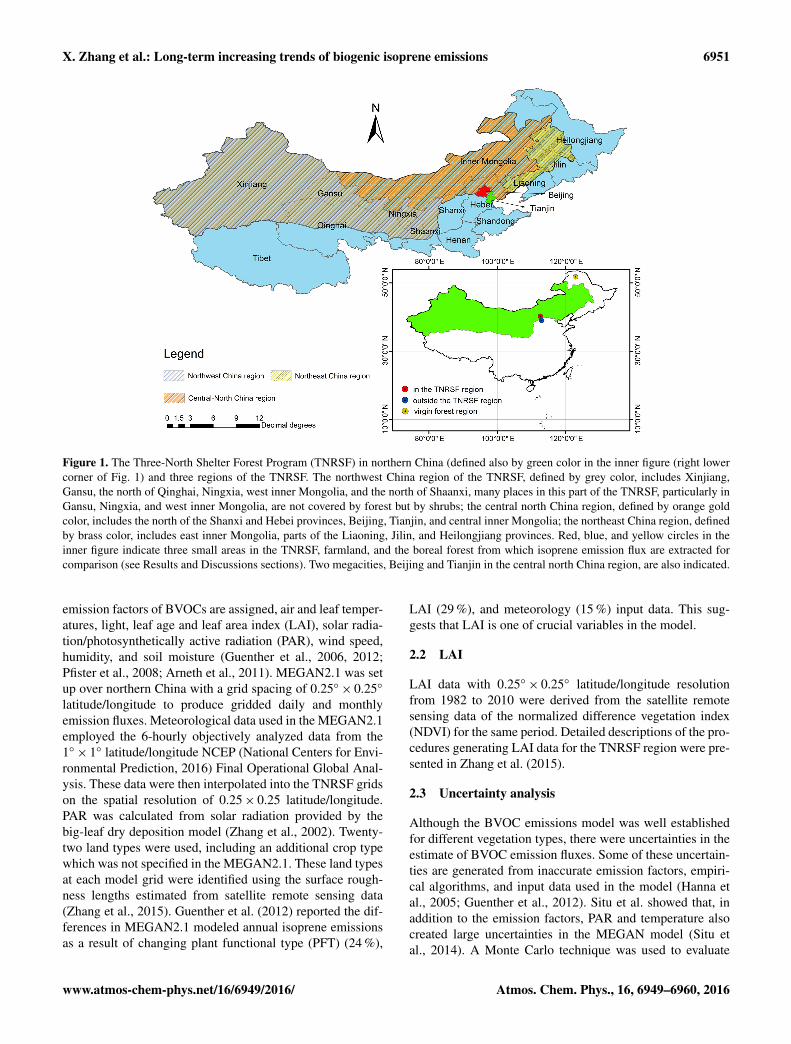
Figure 6 shows the isoprene emissions from 1982 to 2010averaged over northwest China, the central north China, andthe northeast China regions of the TNRSF, respectively. Itcan be identified again that the domain-averaged isopreneemissions in the central north China region of the TNRSFexhibited a clear increasing trend with the slope of 0.0004(R2= 0.35, p = 0.002), whereas statistically insignificant
and relatively weak trends of isoprene emissions were foundin the northeast China (slope= 0.00003, R2
= 0.032, p =
0.484) and northwest China (slope= 0.00009, R2= 0.27,
p = 0.012) regions of the TNRSF, respectively. The increaseof isoprene emissions over the central north China regioncan be attributed to continuous expansion of forest coverage.Compared with the central north region of the TNRSF, theforests in the northeast China region are mixed with natu-ral forests. These natural forests already reached the steadystate before the 1980s, so they would not contribute to the in-creasing trend of biogenic isoprene emissions. As shown byFig. 4b, the isoprene emissions in most places of northeastChina show almost no trends. The northwest China regionof the TNRSF is arid and semi-arid area with low precipita-tion. Shrubs, instead of trees, were planted in many placesof this part of the TNRSF regions, resulting in low biogenicisoprene emissions.
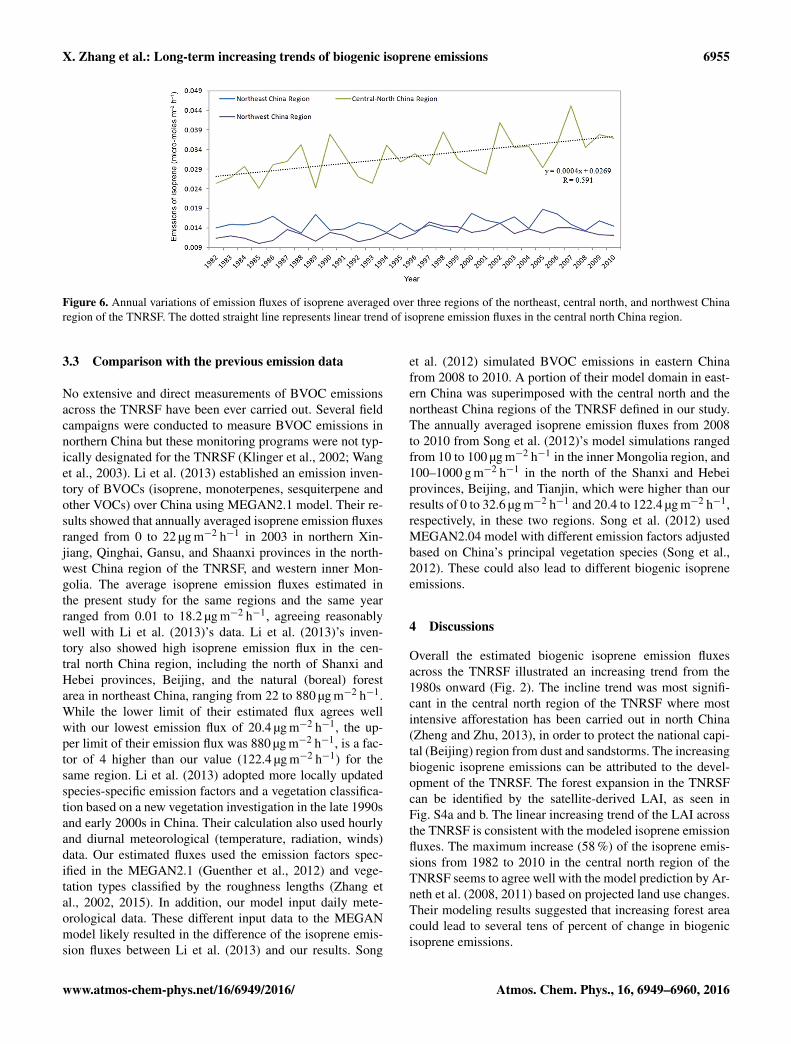
Trends of isoprene emissions were also compared betweenthose within and outside the TNRSF and in natural forests.Three small areas were selected for the comparison, eachconsisting of four grid points, in the central north China re-gion of the TNRSF (marked by the red circle in the inner mapof Fig. 1), a farmland outside the TNRSF (blue circle), andin the boreal forest of northeast China (the Greater Khinganmountains, marked by a yellow circle in Fig. 1), respectively.Trends in annually averaged isoprene emissions from thesethree small areas are shown in Fig. 7. A significant increasingtrend is only seen in the area within the TNRSF. The levels ofisoprene emissions in the other two small areas were almostuniformly distributed for the last 3 decades.
Atmos. Chem. Phys., 16, 6949–6960, 2016 www.atmos-chem-phys.net/16/6949/2016/
X. Zhang et al.: Long-term increasing trends of biogenic isoprene emissions 6955
Figure 6. Annual variations of emission fluxes of isoprene averaged over three regions of the northeast, central north, and northwest Chinaregion of the TNRSF. The dotted straight line represents linear trend of isoprene emission fluxes in the central north China region.
3.3 Comparison with the previous emission data
No extensive and direct measurements of BVOC emissionsacross the TNRSF have been ever carried out. Several fieldcampaigns were conducted to measure BVOC emissions innorthern China but these monitoring programs were not typ-ically designated for the TNRSF (Klinger et al., 2002; Wanget al., 2003). Li et al. (2013) established an emission inven-tory of BVOCs (isoprene, monoterpenes, sesquiterpene andother VOCs) over China using MEGAN2.1 model. Their re-sults showed that annually averaged isoprene emission fluxesranged from 0 to 22 µg m−2 h−1 in 2003 in northern Xin-jiang, Qinghai, Gansu, and Shaanxi provinces in the north-west China region of the TNRSF, and western inner Mon-golia. The average isoprene emission fluxes estimated inthe present study for the same regions and the same yearranged from 0.01 to 18.2 µg m−2 h−1, agreeing reasonablywell with Li et al. (2013)’s data. Li et al. (2013)’s inven-tory also showed high isoprene emission flux in the cen-tral north China region, including the north of Shanxi andHebei provinces, Beijing, and the natural (boreal) forestarea in northeast China, ranging from 22 to 880 µg m−2 h−1.While the lower limit of their estimated flux agrees wellwith our lowest emission flux of 20.4 µg m−2 h−1, the up-per limit of their emission flux was 880 µg m−2 h−1, is a fac-tor of 4 higher than our value (122.4 µg m−2 h−1) for thesame region. Li et al. (2013) adopted more locally updatedspecies-specific emission factors and a vegetation classifica-tion based on a new vegetation investigation in the late 1990sand early 2000s in China. Their calculation also used hourlyand diurnal meteorological (temperature, radiation, winds)data. Our estimated fluxes used the emission factors spec-ified in the MEGAN2.1 (Guenther et al., 2012) and vege-tation types classified by the roughness lengths (Zhang etal., 2002, 2015). In addition, our model input daily mete-orological data. These different input data to the MEGANmodel likely resulted in the difference of the isoprene emis-sion fluxes between Li et al. (2013) and our results. Song
et al. (2012) simulated BVOC emissions in eastern Chinafrom 2008 to 2010. A portion of their model domain in east-ern China was superimposed with the central north and thenortheast China regions of the TNRSF defined in our study.The annually averaged isoprene emission fluxes from 2008to 2010 from Song et al. (2012)’s model simulations rangedfrom 10 to 100 µg m−2 h−1 in the inner Mongolia region, and100–1000 g m−2 h−1 in the north of the Shanxi and Hebeiprovinces, Beijing, and Tianjin, which were higher than ourresults of 0 to 32.6 µg m−2 h−1 and 20.4 to 122.4 µg m−2 h−1,respectively, in these two regions. Song et al. (2012) usedMEGAN2.04 model with different emission factors adjustedbased on China’s principal vegetation species (Song et al.,2012). These could also lead to different biogenic isopreneemissions.
4 Discussions
Overall the estimated biogenic isoprene emission fluxesacross the TNRSF illustrated an increasing trend from the1980s onward (Fig. 2). The incline trend was most signifi-cant in the central north region of the TNRSF where mostintensive afforestation has been carried out in north China(Zheng and Zhu, 2013), in order to protect the national capi-tal (Beijing) region from dust and sandstorms. The increasingbiogenic isoprene emissions can be attributed to the devel-opment of the TNRSF. The forest expansion in the TNRSFcan be identified by the satellite-derived LAI, as seen inFig. S4a and b. The linear increasing trend of the LAI acrossthe TNRSF is consistent with the modeled isoprene emissionfluxes. The maximum increase (58 %) of the isoprene emis-sions from 1982 to 2010 in the central north region of theTNRSF seems to agree well with the model prediction by Ar-neth et al. (2008, 2011) based on projected land use changes.Their modeling results suggested that increasing forest areacould lead to several tens of percent of change in biogenicisoprene emissions.
www.atmos-chem-phys.net/16/6949/2016/ Atmos. Chem. Phys., 16, 6949–6960, 2016
6956 X. Zhang et al.: Long-term increasing trends of biogenic isoprene emissions
Figure 7. Annual variation and trend of isoprene emission flux spatially averaged over three small areas in and outside the TNRSF in centralnorth China and the natural (boreal) forest region as marked in Fig. 1. The left-hand side y axis scales the trend of isoprene emission fluxesin the TNRSF region and boreal forest in northeast China and the right-hand side y axis scales the emission flux from the farmland outsidethe TNRSF.
As shown above, the significant incline trend of the annualtotal isoprene emissions in the TNRSF has affected the long-term trend of the emissions in northern China. This impliesthat the increasing emission trends across the TNRSF couldalter the large-scale BVOC emissions not only in the TNRSFbut also in northern China considering that the TNRSF oc-cupies 59 % of northern China and 42 % of all of mainlandChina. Future impacts of the TNRSF on BVOC emissionsmay be even stronger with continuous increases of vegeta-tion coverage till the end of the program in 2050.
While BVOC emissions vary on short timescales, theglobal BVOC emissions are often assumed to change littleon a long-term (e.g., decadal) scale (Purves et al., 2004; Sin-delarova et al., 2014) considering the steady state of globalforests. Since BVOCs can partition onto or form particles inthe atmosphere after oxidation, their emissions could affectaerosol formation, cloud condensation nuclei, and climate(Makkonen et al., 2012; Penuelas and Staudt, 2010). Iden-tification of the impact of climate change on BVOC emis-sions is not straightforward if regional or global forests reacha steady state. The evidence identified in this study suggestedthat the human-induced BVOC emissions via large-scale af-forestation exert strong influence on long-term BVOC emis-sions and should be taken into consideration in projectedclimate change scenarios, at least on a regional scale, suchas in northern China. As a precursor of secondary organicaerosols and tropospheric ozone, the significant incline ofbiogenic isoprene emissions also carries significant implica-tions to the air quality in northern China. Heavy air pollutionin the Beijing–Tianjin–Hebei area (Fig. 1) has been widelyknown nationally and internationally, characterized by year-round high levels of fine particular matter (PM2.5) and highsurface ozone concentrations in the summertime. The Chi-nese government has decided to extend the TNRSF as oneof the primary measures to reduce and remove air pollutantsfrom the Beijing–Tianjin–Hebei area (Chinese Environmen-tal Protection Agency, 2013). As shown in Figs. 5 and 6, the
TNRSF in the central north region covering a large part ofthe Beijing–Tianjin–Hebei area has already gained the mostrapid development as compared to the other two northern re-gions of the TNRSF (Fig. 1), leading to marked incline ofisoprene emissions. However, it is not yet clear if and howthe extension of the TNRSF could otherwise improve localair quality. Our previous study suggested that the TNRSFplayed a moderate role in removing SO2 and NOx (Zhanget al., 2015). Under the rapidly increasing NOx emissionsin the past decade due to the rapidly increasing number ofprivate vehicles in the Beijing–Tianjin–Hebei area, it is nec-essary to assess the interactions between BVOC emissionsfrom the TNRSF and local air quality in this region.
In addition to its long-term trend, isoprene emissions alsoexhibited short-term interannual fluctuations, as also ob-served in Fig. 2. Factors causing the fluctuations or interan-nual changes in the emission fluxes depend on meteorolog-ical and biological processes. Afforestation and deforesta-tion often took place during the course of the TNRSF con-struction due to favorable or unfavorable weather and cli-mate conditions for tree growth. For example, 10–50 % oftrees planted since the late 1970s in the central north re-gion of the TNRSF were reported dead since 2007 (Zhanget al., 2013; Tan and Li, 2015), causing visible decline ofthe forest coverage and isoprene emissions in this regionafter 2007, as shown in Fig. 2. The lower isoprene emis-sions in 2010 in the northeast China region and eastern in-ner Mongolia region of the TNRSF as compared with thosein 1982 were inconsistent with the increasing trend of theemissions. The forest coverage in the northeast China re-gion did not show considerable change between 1982 and2010. On the other hand, lower annual temperatures (e.g., byaround 1 ◦C) in 2010 were evident over the northeast Chinaregion of the TNRSF than those in 1982, as shown by thedifferences of annual surface temperatures (SATs, ◦C) be-tween 1982 and 2010 (Tdif = T2010−T1982, Fig. S5a), whichlikely caused lower biogenic emissions in 2010 (Purves et al.,
Atmos. Chem. Phys., 16, 6949–6960, 2016 www.atmos-chem-phys.net/16/6949/2016/

X. Zhang et al.: Long-term increasing trends of biogenic isoprene emissions 6957
2004; Arneth et al., 2008, 2011). Negative Tdif in the north-east China region of the TNRSF corresponded nicely to neg-ative Edif (Fig. 3), indicating the strong association betweenSATs and isoprene emissions. In addition, compared with theincreasing trend of LAI in the northeastern China region ofthe TNRSF (Fig. S4a), no statistically significant increasingtrends of the isoprene emissions are discerned in this region.Figure S5b displays the trend of annual SATs in the northeastChina region of the TNRSF from 1982 to 2010. Overall theSATs exhibited a decreasing trend, caused mostly by declin-ing SATs since the late 1990s. Since temperature plays a keyrole in canopy BVOC emissions (Guenther et al., 2012; Li etal., 2013), the lack of the incline trend of the isoprene emis-sion fluxes in the northeast China region of the TNRSF mightbe attributable to the decreasing SAT from the late 1990s.
Another environmental factor that may exert the influenceon the trend of isoprene emissions is solar radiation/PAR(Situ et al., 2014). Analogous to the response of the BVOCemissions to temperature, increasing radiation could also en-hance the isoprene emissions, or vice versa, particularly ona daily or monthly basis. To elucidate potential associationbetween the long-term trend of biogenic isoprene emissionsand PAR, we estimated the trend of the flux of PAR (Guen-ther et al., 1995) over the TNRSF from 1982 to 2010. Resultsare shown in Fig. S6. Positive trends can be observed in thenorthwest China region of the TNRSF (Xinjiang, Gansu) andinner Mongolia. In contrast to the positive trends of isopreneemissions in the central north China region of the TNRSF,PAR in this region exhibited negative trends. Hu et al. (2010)have calculated the long-term changes in PAR in Beijing us-ing a broadband global solar radiation data set. Their resultrevealed a significant declining trend of PAR from the late20th century. They attributed the decrease of PAR to increas-ing aerosol emissions from large amounts of fossil fuel com-bustion due to rapid economic development and industrial-ization in north China, including the Beijing–Tianjin–Hebeiregion, in the past several decades. The increase in anthro-pogenic aerosol particles can both absorb and scatter solarradiation in the atmosphere, contributing to the decreasingPAR. Within and proximate to north China where most heavyindustries in China are located, the central north China regionis the mostly contaminated area in the TNRSF by particulatematter and other air pollutants. Higher aerosol loading to thisregion was at least partially responsible for the decrease inthe trend of PAR. This means that, while PAR contributessignificantly to daily and monthly changes as well as spatialdistribution in biogenic isoprene emissions in the TNRSF,it is unlikely to overwhelm the long-term trend of isopreneemissions.
The comparison between the isoprene emission trends andthe emissions in 2000 in northern China also carries a signif-icant implication for the human-induced BVOC emissions.As shown in Fig. 4b, the trend of isoprene emissions from1982 to 2010 over northern China showed a rather differentspatial pattern from its emissions in 2000 (Fig. 4a). No signif-
icant trends were observed in the boreal forest in northeast-ern China, though a larger amount of isoprene was emittedfrom the forest in this region in 2000. This implies that thisnatural forest was likely under a steady state from which thebiogenic isoprene emissions were not altered on the decadalbasis (Sanderson et al., 2003; Purves et al., 2004).
Although the Qinling–Ta-pa mountains exhibited the high-est emissions in 2000 (Fig. 4a), negative trends of the bio-genic isoprene emissions dominated this area, indicating thedeclining of the emissions over the period of 1982–2010.This is consistent with the decreasing vegetation coverageduring this period in this region, as shown by the negativetrends of the LAI in northern China (Fig. S4). On the otherhand, most positive trends of LAI can be identified in thecentral north region and along the foot of Tianshan Moun-tain in west China (see the areas encircled by the solid blueline in Fig. 4). This manifests that the TNRSF exerts stronginfluences on biogenic VOC emissions, particularly on theirdecadal variation, though the magnitude of emissions mightnot be higher than that from natural forests in northeastChina (Fig. 4a). Results further imply that the TNRSF isvery likely the major source contributing to the increasingbiogenic isoprene emissions over the past 30 years and formany years to come in northern China. Climate change hasbeen thought also to play an important role in the changesin the biogenic emissions of isoprene on decadal or longertimescales because it can alter temperature and vegetationcoverage (Turner et al., 1991; Sanderson et al., 2003). It isunknown if and to what extent the increasing vegetation cov-erage and temperature over the TNRSF were induced by cli-mate change. Evidence shows that the human-induced af-forestation contributed mostly to the increased vegetationcoverage over the TNRSF and northern China (Wang et al.,2011), as shown by Fig. S4a, and hence to the increased bio-genic isoprene emissions.
Among the three small areas within the TNRSF, in thefarmland, and in the boreal forest of northeast China (Fig. 7),the emission values increased by nearly 5 times from 1982 to2010 in the area within the TNRSF with the slope of 0.0018(R2= 0.55). On the other hand, no statistically significant
increasing trends of biogenic isoprene emissions were foundin the farmland and the boreal forest, though the higher emis-sions were observed in the boreal forest. More interestingly,the biogenic isoprene emissions in the selected small area ofthe central north China region tend to surpass the isopreneemissions in the boreal forest from 2004 onward. This canbe partly attributed to rapidly growing forest coverage andhigher temperatures in this region as compared to northeast-ern China. The large area of foliage trees planted in this re-gion also played a role for relatively high and increasing iso-prene emissions as compared with the boreal forests in north-eastern China where coniferous trees are major tree specieswhich release relatively lower isoprene to the atmosphere ascompared to broadleaf trees in the selected area in the centralnorth China region of the TNRSF (Guenther et al., 2012).
www.atmos-chem-phys.net/16/6949/2016/ Atmos. Chem. Phys., 16, 6949–6960, 2016

6958 X. Zhang et al.: Long-term increasing trends of biogenic isoprene emissions
5 Conclusions
Gridded monthly and annual biogenic isoprene emissions innorthern China were modeled for the period of 1982–2010and were then applied to assess the long-term trends of thebiogenic isoprene emissions in the TNRSF in order to dis-criminate the signals of the human activities in decadal andlonger-term trends of BVOCs on large spatial scales. Signifi-cant impacts of the TNRSF on the BVOC emissions in north-ern China were identified during the past 3 decades. Annualisoprene emissions in many places of the TNRSF region, es-pecially in the central north China region, exhibited an inclin-ing trend. The maximum increase in the isoprene emissionflux reached 58 % between 1982 and 2010, indicating impor-tant roles of the human activities on BVOC emissions. Thecomparison of isoprene emission fluxes among the centralnorth China region of the TNRSF, farmland, and the borealforest in northeastern China outside the TNRSF revealed thatthe biogenic isoprene emissions in some areas of the centralnorth China region of the TNRSF produced by man-madeforests have surpassed the emissions from the natural forests.This suggests that the TNRSF was a main contributor to thedecadal or longer-term changes in BVOCs in northern China.The impact of the TNRSF on BVOC emissions is expectedto be stronger in the coming years along with continuous de-velopment of the TNRSF program till 2050. Since BVOCsare a major precursor of tropospheric ozone, future studiesare needed to investigate how the increased BVOCs in theTNRSF contribute to ozone formation, especially in the caseof concurrently increasing NOx emissions in northern China.
6 Data availability
The meteorological data used in the MEGAN2.1 model com-piled by NCEP Final Operational Global Analysis are avail-able at http://rda.ucar.edu/datasets/ds083.2/ (National Cen-ters for Environmental Prediction, 2016).
The Supplement related to this article is available onlineat doi:10.5194/acp-16-6949-2016-supplement.
Acknowledgements. This work is supported by the NationalNatural Science Foundation of China through grants 41371478 and41371453.
Edited by: A. B. Guenther
References
Adon, M., Galy-Lacaux, C., Delon, C., Yoboue, V., Solmon, F., andKaptue Tchuente, A. T.: Dry deposition of nitrogen compounds(NO2, HNO3, NH3), sulfur dioxide and ozone in west and centralAfrican ecosystems using the inferential method, Atmos. Chem.Phys., 13, 11351–11374, doi:10.5194/acp-13-11351-2013, 2013.
Arneth, A., Schurgers, G., Hickler, T., and Miller, P. A.: Effectsof species composition, land surface cover, CO2 concentrationand climate on isoprene emissions from European forests, PlantBiol., 10, 150–162, 2008.
Arneth, A., Schurgers, G., Lathiere, J., Duhl, T., Beerling, D.J., Hewitt, C. N., Martin, M., and Guenther, A.: Global ter-restrial isoprene emission models: sensitivity to variability inclimate and vegetation, Atmos. Chem. Phys., 11, 8037–8052,doi:10.5194/acp-11-8037-2011, 2011.
Ashworth, K., Wild, O., and Hewitt, C. N.: Sensitivity of iso-prene emissions estimated using MEGAN to the time resolu-tion of input climate data, Atmos. Chem. Phys., 10, 1193–1201,doi:10.5194/acp-10-1193-2010, 2010.
Aydin, Y. M., Yaman, B., Koca, H., Dasdemir, O., Kara, M., Altiok,H., Dumanoglu, Y., Bayram, A., Tolunary, D., Odabasi, M., andElbir, T.: Biogenic volatile organic compound (BVOC) emissionsfrom forested areas in Turkey: Determination of specific emis-sion rates for thirty-one tree species, Sci. Total Environ., 490,239–253, 2014.
Calfapietra, C., Fares, S., Manes, F., Morani, A., Sgrigna, G., andLoreto, F.: Role of biogenic volatile organic compounds (BVOC)emitted by urban trees on ozone concentration in cities: A review,Environ. Pollut., 183, 71–80, 2013.
Camporn, S. J.: Ecophysiological Responses of Plants to Air Pol-lution, Manchester Metropolitan University, Manchester, UK,doi:10.1002/9780470015902.a0003206.pub2, 2013.
Central Government of China: Forest cover area from artifcial af-forestation in the Three Northern Regions Shelter Forest re-gions, available at: http://www.gov.cn/jrzg/2012-08/27/content_2211594.htm (last access: 3 June 2016), 2012 (in Chinese).
Chang, K. H., Yu, J. Y., Chen, T. F., and Lin, Y, P.: Estimating Tai-wan biogenic VOC emission: Leaf energy balance consideration,Atmos. Environ., 43, 5092–5100, 2009.
Chen, Y., Li, D. W., Shi, Y., and He, X.: Emission rate of bio-genic volatile organic compounds from urban trees in Shenyang,China, Journal of Northeast Forestry University, 37, 47–49, 2009(in Chinese).
Cheng, D. and Gu, J.: Influence of the Three Northern RegionsShelter Forest on micro-scale climate, in: Ecological Benefit andPhysical Characteristics of Atmospheric Boundary-layer of theThree Northern Regions Shelter Forest, edited by: Zhu, T., Me-teorological Publisher of China, Beijing, China, 209–216, 1992(in Chinese).
Chinese Environmental Protection Agency: Action plans for imple-menting air pollution control strategy, available at: http://www.zhb.gov.cn/gkml/hbb/bwj/201309/t20130918_260414.htm (lastaccess: 3 June 2016), 2013 (in Chinese).
Constable, J. V. H., Guenther, A. B., Schimel, D. S., and Monson, R.K.: Modelling changes in VOC emissions in response to climatechange in the continental United States, Glob. Change Biol., 5,791–806, 1999.
Atmos. Chem. Phys., 16, 6949–6960, 2016 www.atmos-chem-phys.net/16/6949/2016/

X. Zhang et al.: Long-term increasing trends of biogenic isoprene emissions 6959
Ding, Y., Li, Q., and Dong, W.: A numerical assessment of effect offorest coverage on regional climate in China, J. Meteorol. Res.,63, 613–621, 2005 (in Chinese).
Fang, J. Y., Chen, A. P., Peng, C. H., Zhao, S. Q., and Ci, L. J.:Changes in forest biomass carbon storage in China between 1949and 1998, Science, 292, 2320–2322, 2001.
Fenn, M. E., Ross, C. S., Schilling, S. L., Baccus, W. D., Larrabee,M. A., and Lofgren, R. A.: Atmospheric deposition of nitro-gen and sulfur and preferential canopy consumption of nitratein forests of the Pacific Northwest, USA, Forest Ecol. Manag.,302, 240–253, 2013.
Geron, C., Guenther, A., Greenberg, J., Karl, T., and Rasmussen, R.:Biogenic volatile organic compound emissions fromdesert vege-tation of the southwestern US, Atmos. Environ., 40, 1645–1660,2006.
Guenther, A., Hewitt, C. N., Erickson, D., Fall, R., Geron, C.,Graedel, T., Harley, P., Klinger, L., Lerdau, M., Mckay, W. A.,Pierce, T., Scholes, B., Steinbrecher, R., Tallamraju, R., Tay-lor, J., and Zimmerman, P.: A global-model of natural volatileorganic-compound emissions, J. Geophys. Res.-Atmos, 100, 73–92, 1995.
Guenther, A., Karl, T., Harley, P., Wiedinmyer, C., Palmer, P. I.,and Geron, C.: Estimates of global terrestrial isoprene emissionsusing MEGAN (Model of Emissions of Gases and Aerosols fromNature), Atmos. Chem. Phys., 6, 3181–3210, doi:10.5194/acp-6-3181-2006, 2006.
Guenther, A. B., Jiang, X., Heald, C. L., Sakulyanontvittaya, T.,Duhl, T., Emmons, L. K., and Wang, X.: The Model of Emissionsof Gases and Aerosols from Nature version 2.1 (MEGAN2.1): anextended and updated framework for modeling biogenic emis-sions, Geosci. Model Dev., 5, 1471–1492, doi:10.5194/gmd-5-1471-2012, 2012.
Guo, P. P., Guo, K. J., Ren, Y., Shi, Y., Chang, J., Tani, A., and Ge,Y.: Biogenic volatile organic compound emissions in relation toplant carbon fixation in a subtropical urban-rural complex, Land-scape Urban Plan., 119, 74–84, 2013.
Hanna, S. R., Russell, A. G., Wilkinson, J. G., Vukovich, J., andHansen, D. A.: Monte Carlo estimation of uncertainties in BEIS3emission outputs and their effects on uncertainties in chemicaltransport model predictions, J. Geophys. Res., 110, 372–384,2005.
Helmig, D., Daly, R. W., Milford, J., and Guenther, A.: Seasonaltrends of biogenic terpene emissions, Chemosphere, 93, 35–46,2013.
Hu, D., Wang, R., and Liu, G.: Long-term trends in photosynthet-ically active radiation in Beijing, Adv. Atmos. Sci., 27, 1380–1388, 2010.
Hu, H., Wang, H., Lu, X., and Qiu, Z.: Assessment of influence ofshelter forest on climate in arid and semi-arid regions in China, J.Nanjing Forestry University (Natural science), 25, 77–82, 2001(in Chinese).
Klinger, L. F., Li, Q. J., Guenther, A., B., Greenberg, J. P., Baker,B., and Bai, J.: Assessment of volatile organic compound emis-sions from ecosystems of China, J. Geophy. Res., 107, 4603,doi:10.1029/2001JD001076, 2002.
Lamb, B., Guenther, A., Gay, D., and Westberg, H.: A national in-ventory of biogenic hydrocarbon emissions, Atmos. Environ., 21,1695–1705, 1987.
Li, L. Y., Chen, Y., and Xie, S. D.: Spatio-temporal variation of bio-genic volatile organic compounds emissions in China, Environ.Pollut., 182, 157–168, 2013.
Liu, Y. Q., Stanturf, J. A., and Lu, H. Q.: Modeling the potential ofthe northern China Forest Shelterbelt in improving hydroclimateconditions, J. Am. Water Resour. As., 44, 1176–1192, 2008.
Makkonen, R., Asmi, A., Kerminen, V.-M., Boy, M., Arneth, A.,Guenther, A., and Kulmala, M.: BVOC-aerosol-climate interac-tions in the global aerosol-climate model ECHAM5.5-HAM2,Atmos. Chem. Phys., 12, 10077–10096, doi:10.5194/acp-12-10077-2012, 2012.
Müller, J.-F., Stavrakou, T., Wallens, S., De Smedt, I., Van Roozen-dael, M., Potosnak, M. J., Rinne, J., Munger, B., Goldstein, A.,and Guenther, A. B.: Global isoprene emissions estimated usingMEGAN, ECMWF analyses and a detailed canopy environmentmodel, Atmos. Chem. Phys., 8, 1329–1341, doi:10.5194/acp-8-1329-2008, 2008.
Myles, L., Heuer, M. W., Meyers, T. P., and Hoyett, Z. J: A com-parison of observed and parameterized SO2 dry deposition overa grassy clearing in Duke Forest, Atmos. Environ., 49, 212–218,2012.
National Centers for Environmental Prediction: Final operationalGlobal Analysis, available at: http://rda.ucar.edu/datasets/ds083.2/, last access: 3 June 2016.
Nichol, J. and Wong, M. S.: Estimation of ambient BVOC emissionsusing remote sensing techniques, Atmos. Environ., 45, 2937–2943, 2011.
Nowak, D. J., Crane, D. E., and Stevens, J. C.: Air pollution removalby urban trees and shrubs in the United States, Urban For. UrbanGree., 4, 115–123, 2006.
Nowak, D. J., Hirabayashi, S., Bodine, A., and Greenfield, E.: Treeand forest effects on air quality and human health in the UnitedStates, Environ. Pollut., 193, 119–129, 2014.
Pacifico, F., Harrison, S. P., Jones, C. D., and Sitch, S.: Isopreneemissions and climate, Atmos. Environ., 43, 6121–6135, 2009.
Pang, Q.: Construction of the Three Northern Regions Shelter For-est in China, Forestry Publisher of China, Beijing, China, 1992(in Chinese).
Parungo, F., Li, Z., Li, X., Yang, D., and Harris, J.: Gobi dust stormsand the Great Green Wall, Geophys. Res. Lett., 21, 999–1002,1994.
Penuelas, J. and Staudt, M.: BVOCs and global change, TrendsPlant Sci., 15, 133–144, 2010.
Penuelas, J., Rutishauser, T., and Filella, I.: Phenology feedbackson climate change, Science, 324, 887–888, 2009.
Pfister, G. G., Emmons, L. K., Hess, P. G., Lamarque, J. F., Or-lando, J. J., Walters, S., Guenther, A., Palmer, P. I., and Lawrence,P. J.: Contribution of isoprene to chemical budgets: A modeltracer study with the NCAR CTM MOZART-4, J. Geophys.Res.-Atmos., 113, 79–88, 2008.
Purves, D. W., Caspersen, J. P., Moorcroft, P. R., Hurtt, G. C., andPacala, S. W.: Human-induced changes in US biogenic volatileorganic compound emissions: evidence from long-term forest in-ventory data, Glob. Change Biol., 10, 1737–1755, 2004.
Sakulyanontvittaya, T., Duhl, T., Wiedinmyer, C., Helmig, D.,Matsunaga, S., Potosnark, M., Miford, J., and Guenther, A.:Monoterpene and sesquiterpene emission estimates for theUnited States, Environ. Sci. Technol., 42, 1623–1629, 2008.
www.atmos-chem-phys.net/16/6949/2016/ Atmos. Chem. Phys., 16, 6949–6960, 2016

6960 X. Zhang et al.: Long-term increasing trends of biogenic isoprene emissions
Sanderson, M. G., Jones, C. D., Collins, W. J., Johnson, C. E.,and Derwent, R. G.: Effect of climate change in isoprene emis-sions and surface ozone levels, Geophys. Res. Lett., 30, 159–171,2003.
Sindelarova, K., Granier, C., Bouarar, I., Guenther, A., Tilmes, S.,Stavrakou, T., Müller, J.-F., Kuhn, U., Stefani, P., and Knorr, W.:Global data set of biogenic VOC emissions calculated by theMEGAN model over the last 30 years, Atmos. Chem. Phys., 14,9317–9341, doi:10.5194/acp-14-9317-2014, 2014.
Situ, S., Wang, X., Guenther, A., Zhang, Y. L., Wang, X. M., Huang,M. J., Fan, Q., and Xiong, Z.: Uncertainties of isoprene emissionsin the MEGAN model estimated for a coniferous and broad-leaved mixed forest in Southern China, Atmos. Environ., 98,105–110, 2014.
Song, Y. Y., Zhang, Y. Y., Wang, Q. G., and An, J. L.: Estima-tion of biogenic VOCs emissions in Eastern China based onremote sensing data, Acta Scientiae Circumstantiae, 32, 2216–2227, 2012 (in Chinese).
Steiner, A., Luo, C., Huang, Y., and Chameides, W. L.: Past andpresent-day biogenic volatile organic compound emissions inEast Asia, Atmos. Environ., 36, 4895–4905, 2002.
Tan, K., Piao, S., Peng, C., and Fang, J.: Satellite-based estimationof biomass carbon stocks for northeast China’s forests between1982 and 1999, Forest Ecol. Manag., 240, 114–121, 2007.
Tan, M. and Li, X.: Does the Green Great Wall effectively decreasedust storm intensity in China? A study based on NOAA NDVIand weather station data, Land Use Policy, 43, 42–47, 2015.
Turner, D. P., Wones, A. G., Pross, D., and Phillips, D. L.: Climatechange and global isoprene emissions, Paper 91-126. 3, GlobalClimate Change: Papers from the 84th Annual General Meetingof the Air and Waste Management Association, 16–21 June 1991,Vancouver, Canada, 1991.
Wang, Q., Zhang, B., Dai, S. P., Zou, Y., Ma, Z. H., and Zhang, Y.N.: Dynamic changes in vegetation coverage in the Three North-ern Regions Shelter Forest Program based on GIMMS AVHRRNDVI, Resour. Sci., 33, 1613–1620, 2011 (in Chinese).
Wang, Z. H., Bai, Y. H., and Zhang, S. Y.: A biogenic volatile or-ganic compounds emission inventory for Beijing, Atmos. Envi-ron. 37, 3771–3782, 2003.
Wei, X. L., Li, Y. S., Lam, K. S., Wang, A. Y., and Wang, T. J.:Impact of biogenic VOC emissions on a tropical cyclone-relatedozone episode in the Pearl River Delta region, China, Atmos.Environ., 41, 7851–7864, 2007.
Yan, Q. L., Zhu, J. J., Hu, Z. B., and Sun, O. J.: Environmentalimpacts of the Shelter Forests in Horqin sandy land, NortheastChina, J. Environ. Qual., 40, 815–824, 2011.
Zemankova K. and Brechler, J.: Emissions of biogenic VOC fromforest ecosystems in central Europe: Estimation and comparisonwith anthropogenic emission inventory, Environ. Pollut., 158,462–469, 2010.
Zhang, L., Moran, M. D., Makar, P. A., Brook, J. R., and Gong,S.: Modelling gaseous dry deposition in AURAMS: a unified re-gional air-quality modelling system, Atmos. Environ., 36, 537–560, 2002.
Zhang, X., Huang, T., Zhang, L., Gao, H., Shen, Y., and Ma, J.:Trends of deposition fluxes and loadings of sulfur dioxide andnitrogen oxides in the artificial Three Northern Regions Shel-ter Forest across northern China, Environ. Pollut., 207, 238–247,2015.
Zhang, Y., Wang, X., and Qin, S.: Carbon stocks and dynamics inthe three-north protection forest program, China, Austrian J. For-est Sci., 130, 25–43, 2013.
Zheng, X. and Zhu, J.: Estimation of shelter forest area in ThreeNorthern Regions Shelter Forest Program region based on multi-sensor remote sensing data, Chin. J. Appl. Ecol., 24, 2257–2264,2013.
Zhong, Z., Wang, H., Xiong, W., and Sha, W.: A numerical investi-gation of association between environment and the Three North-ern Regions Shelter Forest: Model evaluation and verification, J.PLA University of Technology, 2, 7–12, 2001 (in Chinese).
Atmos. Chem. Phys., 16, 6949–6960, 2016 www.atmos-chem-phys.net/16/6949/2016/