three essays on systems thinking and dynamic modeling in ... · three essays on systems thinking...
TRANSCRIPT

Three Essays on Systems Thinking and Dynamic Modeling in Obesity Prevention
Interventions
Seyed Mohammad Jalali
Dissertation submitted to the faculty of the Virginia Polytechnic Institute and State
University in partial fulfillment of the requirements for the degree of
Doctor of Philosophy
in
Industrial and Systems Engineering
Hazhir Rahmandad, Chair
Konstantinos P. Triantis
Navid Ghaffarzadegan
Alice S. Ammerman
July 31, 2015
Falls Church, VA
Keywords: obesity prevention interventions, health interventions, dissemination and
implementation, childhood obesity, social influence, weight-related behaviors,
organizational processes, endogenous dynamics, system dynamics, systematic review,
qualitative modeling, case studies

Three Essays on Systems Thinking and Dynamic Modeling in Obesity Prevention
Interventions
Seyed Mohammad Jalali
ABSTRACT
Essay #1 - Parental Social Influence in Childhood Obesity Interventions: a
Systematic Review
The objective of this study is to understand the pathways through which social influence
at the family level moderates childhood obesity interventions. We conducted a systematic
review of obesity interventions in which parents’ behaviors are targeted to change
children’s obesity outcomes, due to the potential social and environmental influence of
parents on the nutrition and physical activity behaviors of children. Results for existing
mechanisms that moderate parents’ influence on children’s behavior are discussed and a
causal pathway diagram is developed to map out social influence mechanisms that affect
childhood obesity. We provide health professionals and researchers with
recommendations to leverage family-based social influence mechanisms for increasing
the efficacy of the obesity intervention programs.
Essay #2 - Dynamics of Obesity Interventions inside Organizations: a Case Study of
Food Carry-Outs in Baltimore
A large number of obesity prevention interventions, from upstream (policy and
environmental) to downstream (individual level), have been put forward to curb the
obesity trend; however, not all those interventions have been successful. Overall
effectiveness of obesity prevention interventions relies not only on the average efficacy
of a generic intervention, but also on the successful Reach, Effectiveness, Adoption,
Implementation, and Maintenance (RE-AIM) of that intervention. In this study, we aim to
understand how effectiveness of organizational level obesity prevention interventions
depends on dynamics of AIM. We focus on an obesity prevention intervention,
implemented in food carry-outs in low-income urban areas of Baltimore city, which aims
to improve dietary behavior for adults through better food access to healthier foods and
point-of-purchase prompts. Building on data from interviews and the literature we

iii
develop a dynamic model of the key processes of AIM. We first develop a contextualized
map of causal relationships integral to the dynamics of AIM, and then quantify those
mechanisms using a system dynamics simulation model. With simulation analysis, we
show how as a result of several reinforcing loops that span stakeholder motivation,
communications, and implementation quality and costs, small changes in the process of
AIM can make a big difference in impact. We present how the dynamics surrounding
communication, motivation, and depreciation of interventions can create tipping
dynamics in AIM. Specifically, small changes in allocation of resources to an
intervention could have a disproportionate long-term impact if those additional resources
can turn stakeholders into allies of the intervention, reducing the depreciation rates and
enhancing sustainability. We provide researchers with a set of recommendations to
increase the sustainability of the interventions.
Essay #3 - Dynamics of Implementation and Maintenance of Organizational Health
Interventions: Case Studies of Obesity Interventions
In this study, we present case studies to explore the dynamics of implementation and
maintenance of obesity interventions. We analyze how specific obesity prevention
interventions are built and eroded, how the building and erosion mechanisms are
interconnected, and why we can see significantly different erosion rates across otherwise
similar organizations. We use multiple comparative case studies to provide empirical
information on the mechanisms of interest, and use qualitative systems modeling to
integrate our evolving understanding into an internally consistent and transparent theory
of the phenomenon. Our preliminary results identify reinforcing feedback mechanisms,
including design of organizational processes, motivation of stakeholders, and
communication among stakeholders, which influence implementation and maintenance of
intervention components. Over time, these feedback mechanisms may drive a wedge
between otherwise similar organizations, leading to distinct configurations of
implementation and maintenance processes.

iv
Acknowledgements
There are many people to thank for their support over the years. First and foremost, I owe
a great debt of gratitude to my family, without whom none of this would be possible,
especially to my beloved wife, beautiful Dr. Simin Falsafi for her unconditional love and
faith in me. Living in two cities to attend different schools for four years has not been
easy for both of us and I am extremely thankful for her patience. Through all the
frustrations, she has managed to support me in whatever ways were necessary to keep my
life balanced, and she is always there for me. Thank you for allowing me to take this
opportunity to follow my dreams. And I cannot thank my parents enough for their
limitless sacrifices in raising me and their invaluable support from thousands of miles
away during my studies. And thanks to my in-laws for offering a hand whenever needed.
I am truly blessed to have my family and I dedicate this dissertation to them. Love you
all!
I would like to sincerely thank Hazhir Rahmandad for all his advice and support. I
feel extremely thrilled to have him as my advisor, mentor, and friend. Hazhir has been
very attentive to and supportive of my research interests. His door was always open to
me; even when his schedule was packed with meetings, he never refused to meet with
me. In fact, whenever I had struggled for days on a daunting research problem and felt
like I was at the end of my tether, a short meeting with him was like a breath of fresh air,
and his hints and encouragement boosted my energy. Hazhir has an infinite supply of
innovative ideas along with boundless passion and dedication to impactful research. I
benefited from his ideas in and beyond this dissertation. Besides his research capabilities,
I am also always inspired by his personality, kindness and professionalism. I certainly
could not have gotten this far without his wonderful support. He made my PhD life
productive and enjoyable and I could not ask for a better mentor.
I would also thank the other committee members for their guidance. Alice
Ammerman pointed me in the right direction in my interdisciplinary research. Her
insights increased the quality of my work and made it sound more intuitive for the
audience in public health. Kostas Triantis provided me with great feedback and made me
explore different aspects of my research, especially on connecting it to my future career.
Navid Ghaffarzadegan also provided me with valuable advice. I benefitted from Navid

v
only during the last year of my PhD program, but his technical expertise and policy-
oriented thinking have been very helpful and I learned a lot from him during this short
time. Working with my committee has been a pleasure and I look forward to continuing
to do so in the future.
I am thankful to have been able to visit the MIT Sloan School of Management during
the last two years of my PhD program. John Sterman and Nelson Repenning gave me a
chance to assist them in their EMBA System Dynamics course, where I not only learned
a lot from them but also made many professional connections. My visit to MIT has been
a wonderful learning opportunity and I will never forget this special period in my
academic life.
I am also indebted to others who supported me in getting this far, especially Navid
Nezafati, Kamran Paynabar, Robert Creese, Wafiq Iskander, and Majid Jaridi. Navid and
Kamran always believed in me and encouraged me to realize my potential. I learned
about being professional and goal-oriented in my work and research from Navid during
my undergraduate part-time work in Tehran. I used to hear that a vision should be
compelling, much bigger than what one can actually achieve; but Kamran inspired me,
making me believe that any vision can be achieved with hard work and passion. During
my undergraduate studies and afterwards, these two wonderful mentors and friends
motivated me to apply for graduate school. Robert and Wafik were extremely supportive
and gave me a chance to study in the U.S., at West Virginia University. Majid then
helped me get aligned with my new environment and supported my admission to Virginia
Tech.
Last but not least, I should thank the National Collaborative on Childhood Obesity
Research (NCCOR) Envision’s Comparative Modeling Network (CompMod) program
and the NIH Office of Behavioral and Social Sciences Research (OBSSR) for providing
financial support and assisting me in continuing my education. Also, thanks to the
interviewees and other field study participants who contributed to the quality and breadth
of this dissertation.

vi
Table of contents
Chapter 1 - Introduction .................................................................................................. 1
1.1 Problem context .......................................................................................................... 1
1.2 Research contributions ................................................................................................ 1
1.2.1 Essay #1 ................................................................................................................. 1
1.2.2 Essay #2 ................................................................................................................. 2
1.2.3 Essay #3 ................................................................................................................. 2
1.3 References .................................................................................................................. 4
Chapter 2 - Parental Social Influence in Childhood Obesity Interventions: a
Systematic Review ............................................................................................................. 5
2.1 Abstract ...................................................................................................................... 5
2.2 Introduction ................................................................................................................ 5
2.3 Research methods ....................................................................................................... 6
2.3.1 Search strategy ....................................................................................................... 6
2.3.2 Inclusion/exclusion criteria .................................................................................... 7
2.3.3 Review process and search results .......................................................................... 7
2.3.4 Data analysis .......................................................................................................... 9
2.3.5 Social influence mechanisms ............................................................................... 11
2.4 Analysis .................................................................................................................... 20
2.4.1 Components of intervention programs ................................................................. 20
2.4.2 Targeted parental behaviors and intermediate mechanisms .................................. 21
2.4.3 Social influence mechanisms ............................................................................... 22
2.4.4 Outcomes ............................................................................................................. 23
2.4.5 Alternative behavior change techniques ............................................................... 24
2.5 Discussion and conclusion ........................................................................................ 25
2.6 Acknowledgements................................................................................................... 27
2.7 References ................................................................................................................ 28
Chapter 3 - Dynamics of Obesity Interventions inside Organizations: a Case Study
of Food Carry-Outs in Baltimore .................................................................................. 35
3.1 Abstract .................................................................................................................... 35
3.2 Background............................................................................................................... 36
3.2.1 Obesity prevention interventions .......................................................................... 36
3.2.2 Dynamics of adoption, implementation, and maintenance ................................... 37

vii
3.2.3 Building on the organization behavior and strategy literature .............................. 39
3.2.4 Dynamic modelling and endogenous perspective ................................................. 40
3.2.5 Case study, a food environment intervention ....................................................... 40
3.3 Methods .................................................................................................................... 41
3.3.1 Data collection ..................................................................................................... 41
3.3.2 Data analysis and modelling ................................................................................. 42
3.4 Results ...................................................................................................................... 43
3.4.1 Key feedback mechanisms ................................................................................... 43
3.4.2 Building confidence in the model ......................................................................... 48
3.4.3 Simulation analysis .............................................................................................. 49
3.5 Discussion................................................................................................................. 53
3.6 List of abbreviations ................................................................................................. 55
3.7 Acknowledgements................................................................................................... 56
3.8 References ................................................................................................................ 57
Chapter 4 - Dynamics of Implementation and Maintenance of Organizational
Health Interventions: Case Studies of Obesity Interventions ..................................... 65
4.1 Abstract .................................................................................................................... 65
4.2 Introduction .............................................................................................................. 65
4.3 Study Design and Empirical Setting ......................................................................... 68
4.3.1 Baltimore Healthy Carry-Outs (BHC) .................................................................. 69
4.3.2 Shape North Carolina (Shape NC) ....................................................................... 69
4.3.3 North Carolina Prevention Partners (NCPP) ........................................................ 70
4.4 Data and Methods ..................................................................................................... 70
4.5 Modeling .................................................................................................................. 72
4.5.1 Resources and motivation .................................................................................... 73
4.5.2 Communication and design quality ...................................................................... 76
4.5.3 Stakeholder alignment .......................................................................................... 81
4.5.4 Effects of costs and benefits on motivation .......................................................... 83
4.5.5 Self-funding ......................................................................................................... 85
4.5.6 Non-dynamic factors affecting motivation ........................................................... 87
4.5.7 Depreciation and Maintenance ............................................................................. 88
4.6 Analysis .................................................................................................................... 91
4.6.1 Shape NC ............................................................................................................. 91
4.6.2 NCPP ................................................................................................................... 93

viii
4.7 Discussion................................................................................................................. 95
4.8 Acknowledgements................................................................................................... 97
4.9 References ................................................................................................................ 98
Chapter 5 – Conclusion ................................................................................................ 101
5.1 References .............................................................................................................. 105

ix
List of figures
Figure 2-1. Study selection process .................................................................................... 8
Figure 2-2. Causal loop relations ...................................................................................... 10
Figure 3-1. Potential program impact trajectories ............................................................ 38
Figure 3-2. Effect of costs and benefits on motivation. .................................................... 45
Figure 3-3. Effect of motivation of stakeholders and communication among stakeholders
on design quality. .............................................................................................................. 46
Figure 3-4. Mechanisms affecting the maintenance of interventions. .............................. 48
Figure 3-5. Implemented components (A), communication sufficiency (B), motivation of
stakeholders to implement (C), and perceived benefits (D). ............................................ 52
Figure 4-1. Basic stock and flow structure of implemented components ......................... 72
Figure 4-2. Effects of motivation and resources on implementation ................................ 76
Figure 4-3. Effect of communication on motivation ........................................................ 81
Figure 4-4. Effect of communication on stakeholder alignment ...................................... 82
Figure 4-5. Effects of costs and benefits on motivation ................................................... 85
Figure 4-6. Self-funding mechanism ................................................................................ 87
Figure 4-7. Examples of non-dynamic factors (green parameters) affecting motivation . 88
Figure 4-8. Effects of motivation, communication, and design quality on maintenance of
intervention ....................................................................................................................... 91

x
List of tables
Table 2-1. Excluded studies in the second full text review ................................................ 9
Table 2-2. Behavior change through social influence ...................................................... 11
Table 2-3. Characteristics of 21 reviewed studies ............................................................ 12
Table 2-4. Summary of 21 reviewed studies .................................................................... 14
Table 4-5. Summary of the interviews .............................................................................. 71

1
Chapter 1 - Introduction
1.1 Problem context
Obesity has become a global epidemic, causing approximately 3.4 million deaths worldwide [1].
In the United States, more than 17% of the youth and one-third of the adults are obese [2],
costing about $147 billion annual medical costs [3]. To curb the obesity trend, a large number of
interventions have been designed and implemented; however, complexity of the obesity crisis
potentially challenges the effectiveness of the interventions [4]. We believe that systems science
methods are well suited to addressing many of the challenges in obesity prevention interventions.
In essay one, we conduct a systematic review for social influence in family-based obesity
interventions and enhance our review with a simple causal loop diagram. In essays two and
three, we use system dynamics modeling to understand the dynamics of obesity interventions.
We argue that, similar to quality and process improvement, community-level obesity prevention
interventions have organizational characteristics forming many organizational dynamics. These
organizational dynamics, associated with the success level of implementation and maintenance
of interventions, have received little attention in the literature. Essay two aims to understand the
dynamics of adoption, implementation, and maintenance of an intervention implemented in two
food carry-out restaurants in Maryland. In a more aggregated study, essay three aims to study the
dynamics of organizational interventions in two interventions implemented in the Carolinas.
Building on interventions in two complex organizations, child daycare centers and hospitals, the
model developed in the third essay extends that in the second essay, which helps increase the
generalizability of the results. Research contributions in each study are presented in the next
section.
1.2 Research contributions
1.2.1 Essay #1
In this study, we conducted a systematic review of obesity prevention interventions, published
between January 2000 and end of 2013, in which parents’ behaviors are targeted to change
children’s obesity outcomes, due to the potential social and environmental influence of parents

2
on the nutrition and physical activity behaviors of children. After reviewing 21 identified papers,
we provided an in depth table of findings. Along with following protocols and best practices for
systematic reviews, we extended the common reviewing toolbox and summarized the findings
from 21 articles in an aggregated causal pathway diagram of the social influence mechanisms.
The diagramming method, adopted from systems thinking and system dynamics, provides a
graphical summary of the key mechanisms identified in the literature, highlights the areas in
need of further empirical research, and sets the stage for statistical modeling as well as meta-
analyses. Our analysis and discussions, mainly developed based on this diagram, have been
enhanced by incorporating detailed feedback from several experts in family studies and obesity
research.
We provide health professionals and researchers with recommendations to leverage family-
based social influence mechanisms for increasing the efficacy of the obesity intervention
programs. This essay, co-authored with Zahra Sharafi, Hazhir Rahmandad, and Alice
Ammerman, is currently being revised for Obesity Reviews.
1.2.2 Essay #2
In this study, we aimed to understand the dynamics of implementation of obesity prevention
interventions, focusing on an intervention in Baltimore city. The project started with field-work,
conducting interviews with interventionists and other stakeholders involved in the intervention.
Based on qualitative analysis of the interview data and the literature, we developed a dynamic
model enabling us to study dynamic mechanisms of implementation of the intervention and
various trade-offs in endogenous mechanisms. These trade-offs are particularly between
designing and implementing intervention components vs. communicating with stakeholders to
build confidence, increase motivation, and improve the quality of intervention.
1.2.3 Essay #3
In this study, we extend the second essay by focusing on two more intervention programs in
child daycare centers and hospitals in the Carolinas. We extensively use interview data to
develop a causal loop diagram and study various organizational processes, especially those
affecting the erosion of intervention programs. While prior research has largely focused on
intervention development processes as the source of differential outcomes, research on the

3
maintenance of interventions is in the early stages and promises to be a complementary avenue
for understanding organizational performance.
We particularly focus on similar interventions across similar organizations to control for
possible alternative explanations. We present how otherwise similar organizations may end up
with very different paths to success due to small early differences, even when the elements of the
interventions are relatively well-known. We also discuss how those small differences can be
amplified and lead to very different erosion rates. Moreover, observing various rates for erosion
of intervention components across child daycare centers and hospitals helps better elucidate how
the underlying mechanisms may vary across various organizations. Overall, heterogeneity among
the organizations presented in this essay and the second essay increases the generalizability of
the results.

4
1.3 References
1. DeFraites, R. and M. Vythilingam, DoD Deployment Mental Health Assessments: A
Review and Update. Falls Church, VA: Force Health Protection and Readiness, 2011.
2. Ogden, C.L., et al., Prevalence of childhood and adult obesity in the United States, 2011-
2012. JAMA, 2014. 311(8): p. 806-814.
3. Finkelstein, E.A., et al., Annual medical spending attributable to obesity: payer-and
service-specific estimates. Health affairs, 2009. 28(5): p. w822-w831.
4. Hammond, R.A., Complex systems modeling for obesity research. Preventing chronic
disease, 2009. 6(3).

5
Chapter 2 - Parental Social Influence in Childhood
Obesity Interventions: a Systematic Review
2.1 Abstract
The objective of this study is to understand the pathways through which social influence at the
family level moderates childhood obesity interventions. We conducted a systematic review of
obesity interventions in which parents’ behaviors are targeted to change children’s obesity
outcomes, due to the potential social and environmental influence of parents on the nutrition and
physical activity behaviors of children. Results for existing mechanisms that moderate parents’
influence on children’s behavior are discussed and a causal pathway diagram is developed to
map out social influence mechanisms that affect childhood obesity. We provide health
professionals and researchers with recommendations to leverage family-based social influence
mechanisms for increasing the efficacy of the obesity intervention programs.
Keywords: social influence, childhood obesity, weight-related behaviors, family-based
intervention.
2.2 Introduction
Despite substantial efforts and much research, childhood obesity continues to be a significant
public health concern. Beyond biological and genetic causes of obesity, a growing consensus
among researchers (e.g., [1-5]) points to the significant role of social factors in weight-related
behaviors. A variety of weight-related behaviors associated with eating patterns, sedentary life
style and physical activity (e.g., [6-9]) can be influenced by social norms, family environments,
and relationships [2]. Such influences have been shown to impact individuals’ body weight [10,
11]. For instance, a study by Dowda et al. [12] suggests that youth between the age of 8 and 16
years who have at least one overweight parent are more likely to be overweight compared with
youth who do not have an overweight parent. Christakis and Fowler [4] estimate that an obese
sibling or spouse can increase the probability of becoming obese by 40% and 37% respectively.
Reviewing studies on the role of social influence in the obesity epidemic, Hammond [2]
concludes that social influence is an important area of continued research and is promising for
informing intervention design.

6
Although some obesity interventions leverage social influences to enhance the effectiveness
of the intervention, there is much room for designing interventions that better leverage social
influence to impact weight-related behaviors. For example, Bahr, et al. [10] argue that inefficacy
of obesity interventions is partially due to the fact that overweight and obese individuals are
usually considered in isolation from their surrounding social context. However, teasing out the
effect of social influence from other influences on behavior is complicated as the majority of
obesity interventions that leverage social influence also have a direct effect on weight-related
behavior.
In this study, we review parent-based social influence mechanisms in obesity interventions in
the family setting. In this context, we focus on social influence that captures how children’s
weight-related opinions, emotions, and behaviors are influenced by parents. We specifically
focus on the family setting because family relations represent psychologically close ties and have
significant potential to influence obesity [13-15]. For instance, parents can significantly impact
children’s health behavior through modeling of behavior, rewarding desirable behaviors,
providing concrete resources to support certain behaviors, among others [16]. The family setting
is ripe for observing these mechanisms in action and their potential impact on weight-related
behaviors. Moreover, to avoid confounding the mechanisms of social influence with other
influence pathways in obesity interventions, we focus on studies that leverage a specific kind of
family social influence, targeting parents to help with children’s weight-related outcomes rather
than intervening directly with the children.
2.3 Research methods
2.3.1 Search strategy
We conducted a systematic review to study the effects and potential mechanisms of parent-based
influence in obesity interventions in the family setting. The studies should include an
intervention that only includes parents and outcomes that include children’s eating and physical
activity behaviors. This design limits the review to studies that only capture social influence
without confounding direct effect of intervention on children’s behavior. We looked for relevant
papers in public health and social science journals listed in PubMed and Web of Science. Search
terms included: (family or family-based or parents or parent-focused or parent-led or family

7
members) and (weight or overweight or obesity) and (intervention or trial or treatment or
prevention), and any variation of those key terms.
2.3.2 Inclusion/exclusion criteria
Peer-reviewed full-text papers written in English published between January 2000 and end of
2013 were included. The inclusion and exclusion criteria were fully specified in the review
protocol before conducting the review. Papers had to include an obesity intervention (prevention
or treatment) directly targeting parents to influence the weight outcomes of children (e.g.,
intervening with parents with the distal goal of influencing children’s weight status). Papers were
excluded if they did not report weight and/or weight-related behavior outcomes for children;
were reviews or meta-analyses; did not target family interactions; involved medications or
medical procedures, individuals with eating disorders, or individuals in institutional settings.
2.3.3 Review process and search results
The review process is illustrated in Figure 2-1. Using our keywords, we identified 1,021 papers
from PubMed and 1,690 papers from Web of Science. After removing 462 duplicate papers,
titles and abstracts of 2,249 papers were collected and screened by two reviewers. After
excluding non-obesity interventions, review papers, and studies not implemented within the
family setting (1,530 papers), 719 papers remained. We then focused on study purpose, design,
and results; when compared with our inclusion criteria, 635 papers were subsequently excluded
(e.g., studies in which the effect of social influence could not be traced to specific family
members; studies that did not measure the effect of the intervention on targeted family
members). Consequently, we reviewed the full text of 84 papers and excluded 58 papers that did
not provide any measure of the effect of intervention on children, or were duplicate publication
of the same intervention (Table 2-1). Finally, 21 papers satisfied our inclusion criteria; which
presented the effects of parent-led interventions on children (mean child age equal to 8 years).
Both treatment interventions (13 papers) and prevention (8 papers) are included. Eighteen studies
targeted both parents, three studies focused on mothers, and no study on fathers. Seven studies
are implemented in Australia, six in the United States, two in Israel, two in the United Kingdom,
and four in Belgium, Germany, Switzerland, and the Netherlands. Summaries of the
interventions are included in Table 2-3 and Table 2-4.

8
Figure 2-1. Study selection process
During the search process, we also looked for interventions that directly targeted any family
member to influence the weight outcomes of another family member. We found only one paper
[17] presented the effects of targeting a spouse on the untreated spouse’s behavior. We did not
include this study in our review to avoid increasing the heterogeneity of our sample.
PubMed, Journal Articles, 2000-2013
“Obesity + intervention + family”
1,021 papers
WoS, Journal Articles, 2000-2013
“Obesity + intervention + family”
1,690 papers
Duplicate papers (462) removal
2,249 Papers identified for review
Title/Abstract review
2,249 Papers Exclusion:
- non-obesity intervention,
- review papers,
- or not implemented in the family setting
1,530 Papers excludedReview of study purpose, design,
and results, 719 Papers Exclusion:
- effect of social influence cannot be traced to specific
family members,
- or no measure of the effect of the intervention on targeted
family members.
635 Papers excludedRelevant papers for full text review
84 Papers
Exclusion (in the first review):
- no measure of the effect of the intervention on targeted
family members
58 Papers excluded
Studies fulfilled all of the inclusion
criteria
21 Papers
Exclusion (in the second review):
- no measure of the effect of the intervention on targeted
family members,
- effect of social influence cannot be traced to specific
family members,
- duplicate publication of the same intervention.
- or effects of a targeted spouse on the untreated one (only
one paper).
5 Papers excluded

9
Table 2-1. Excluded studies in the second full text review Study Reasons for exclusion
MacGarvey et al. 2004 [18] No measure of the effect of intervention on the targeted family members
Janicke et al. 2008 [19] No weight-related behavior outcomes
Okely et al. 2010 [20] Reported in Collins et al. 2011 [21].
Dalton et al. 2011 [22] No measure of the effect of intervention on the targeted family members
Ostbye et al. 2012 [23] Children directly engaged in some portions of the parent-focused intervention.
2.3.4 Data analysis
Data were extracted from each paper to provide a detailed understanding of the intervention and
its impact. Study objectives, country of study, intervention type, duration, design, participants,
family members directly/indirectly targeted, key findings and outcomes were extracted from
each paper. We also coded for whether one or both parents were targeted, targeted behavior, and
social influence mechanisms (see below).
After reviewing selected papers, we summarized the results using a causal pathway diagram
of the social influence mechanisms (see Figure 2-2). Figure 2-2 captures the distinct causal
mechanisms identified in the reviewed articles as potentially moderating the impact of parental
interventions on childhood obesity. The diagram builds on the Social Ecological Models (SEM)
for understanding childhood obesity [24, 25]. The causal pathway diagramming method is
adopted from systems’ modeling toolbox [26-28] and has diverse applications, including
literature reviews [29]. These diagrams provide a graphical summary of the key mechanisms
identified in the literature, facilitate teasing out the empirical support for alternative pathways,
highlight the areas in need for further empirical research, and set the stage for future quantitative
statistical and systems modeling as well as meta-analyses. Due to the small sample size and high
heterogeneity among the studies a quantitative aggregation of results using meta-regression was
ruled out.

10
Figure 2-2. Causal loop relations
[30]
[30, 31]
[30, 32, 33]
[31]
[32] [33, 34]
[34-36] [37]
[33, 35, 38-
40]
[39] [30]
[30, 31]
[30, 36, 37, 41, 42]
[30] [30]
[35, 42, 43] [33, 44]
[42]
[30, 37,
40, 42] [45] [38] [32] [36]
[39]
[46] [42, 46] [31, 47] [30, 48] [30, 48] [39]
[39]
[41, 46]
[44, 46]
[34, 43, 49]
[32, 35,
38, 46]
[45] [21, 30, 32]
[30-33]

11
2.3.5 Social influence mechanisms
Different interventions leveraged diverse activities and behaviors, underlying the need for an
organizing framework to categorize different social influence pathways used in each study. We
therefore coded interventions for three core social influence mechanisms including: 1) a
supportive social environment; 2) modeling healthy eating and activity patterns; and 3) praise
and encouragement for desirable behaviors. Within each core mechanism, we identified specific
behavior change techniques distilled from Abraham and Michie’s taxonomy [50]. For additional
external validity, we mapped these techniques onto Kelman’s variants of social influence [51,
52] (see Table 2-2). For each intervention the behavior change techniques used and the targeted
parent(s) are identified in Table 2-3.
Table 2-2. Behavior change through social influence
Core Social
Influence
Mechanisms
Behavior Change
Techniques1
Observed
in papers
Table 2-3
Descriptions [50]
Kalman’s
varieties of
social influence
[51, 52]
Supportive social
environment
Plan social support or social change (I)
15 papers 71%
“Prompting consideration of how others could
change their behavior to offer the person help or (instrumental) social support, including
"buddy" systems and/or providing social
support”
Internalization Compliance
Provide instruction
and guidance (II)
2 papers
10%
“Telling the person how to perform a behavior
and/or preparatory behaviors” -
Provide feedback on
performance (III)
3 papers
14%
“Providing data about recorded behavior or
evaluating performance in relation to a set
standard or others’ performance, i.e., the
person received feedback on their behavior.”
-
Prompt intention formation (IV)
4 papers 19%
“Encouraging the person to decide to act or
set a general goal, for example, to make a behavioral resolution such as ‘I will take more
exercise next week”.
Internalization
Model healthy
eating and activity
patterns
Prompt identification
as a role model (V)
13 papers
62%
“Indicating how the person may be an
example to others and influence their behavior
or provide an opportunity for the person to set
a good example”.
Identification
Praise and
encouragement
for desirable
behaviors
Provide contingent
rewards (VI)
1 paper
5%
“Praise, encouragement, or material rewards
that are explicitly linked to the achievement of specified behaviors”.
Compliance
Provide general
encouragement (VII)
6 papers
29%
“Praising or rewarding the person for effort or
performance without this being contingent on
specified behaviors or standards of
performance”.
Compliance
1 The numbers associated with behavior change techniques are used in Table 2-3

12
Table 2-3. Characteristics of 21 reviewed studies
Paper Type1 Age of child2 Age of parent3 Target
behavior4 Behavior
change5 Family composition
Epstein et al. 2001 [46] T IF&V: 8.8 (1.8)
DF&S: 8.6 (1.9)
39.1 (4.1)
42.2 (4.8)
EB I, III, VI IF&V: 12 mothers and 1 father
DF&S: 11 mothers and a father
Wardle et al. 2003 [40] P 4.4 (0.8) 36.4 (4.7) EB VII 148 (95%) mothers and 8 (5%) fathers
Golan and Crow 2004 [35]6
T 8.9 (0.3) Mothers: 7.5(1.0) Fathers: 1.2(1.1)
PS V Both parents are included7.
Golan et al. 2006 [33] T PO: 8·7 (1.9)
PC: 8·7 (2.0)
38.3 (4.7)
41.3 (5.6)
EB, PA I, V, VII PO (14 families): 13 fathers and 14 mothers
PC (18 families): 18 mothers and 15 fathers
Golley et al. 2007 [32] T 8.2 (1.1) N/A8 EB II Both parents are included.
Haire-Joshu et al. 2008
[43]
P 2.9 20 to 59 EB IV 95% are mothers. Parents are more likely to be white, younger; less educated,
and have lower income than control group parents. 70.4% of subjects in
intervention group (n=605) and 74.6% of subjects in control group (n=701) are
married or living with partner.
Janicke et al. 2008 [39] T PO: 11.0
FB: 11.4
41.0
40.4
EB, PA I, V Both parents are included.
Munsch et al. 2008 [41] T MO: 10.6 (1.5)
MC: 10.3 (1.4)
38.8 (6.0)
40.9 (4.4)
EB, PA I, V, VII Only mothers are included. Four fathers eligible for the treatment are excluded.
Resnick et al. 2009 [31] T 8.5 N/A EB, PA I, V Both parents are included.
West et al. 2010 [30] T 8.6 (1.7) 39.1 (5.2) EB, PA,
PS
I, V Intervention group (n=52): Original biological parents: 42; One original, one
step parent: 1; Sole parent: 9
Waitlist control (n=49): Original biological parents: 38; One original, one step
parent: 1; Sole parent: 10
Boutelle et al. 2011 [37] T PO: 10.8 (1.3)
PC: 10.1 (1.1)
44.6 (4.7)
41.0 (5.3)
EB, PA,
PS
I, II Both parents are included.
Collins et al. 2011 [21] T D: 8.2 (1.2) A: 8.3 (1.0)
D+A: 8.1 (1.2)
N/A EB, PA I, V, VII Both parents are included.
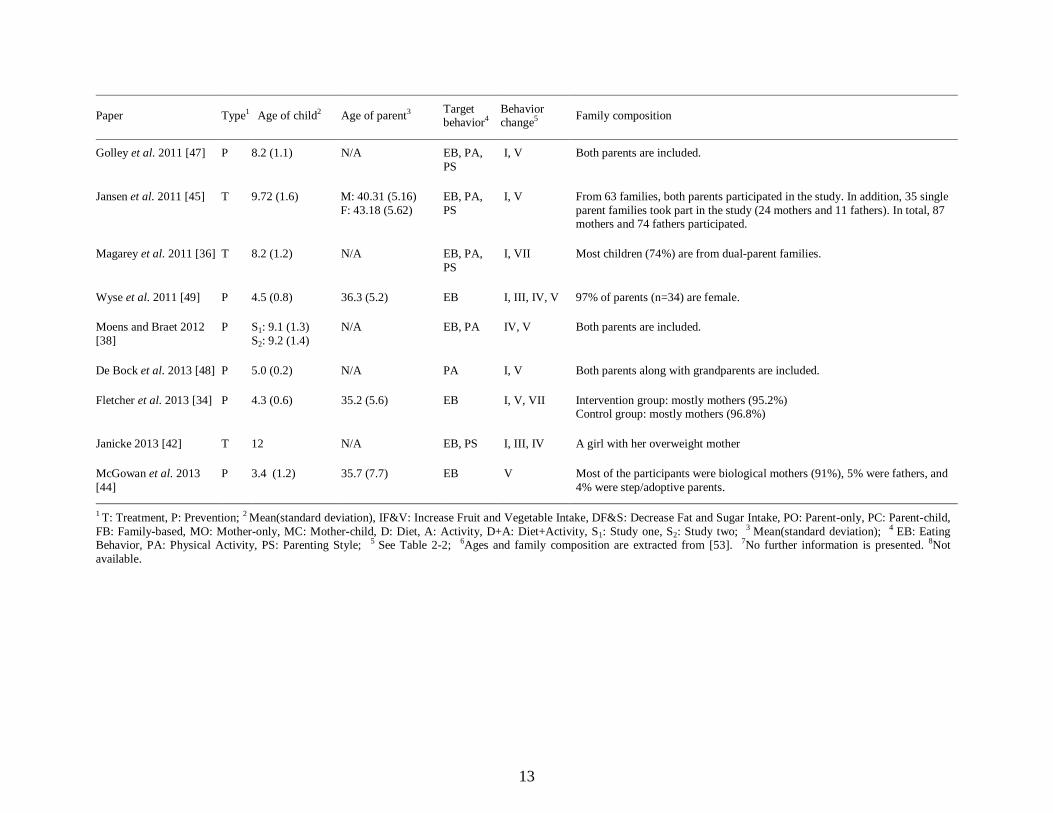
13
Paper Type1 Age of child2 Age of parent3 Target behavior4
Behavior change5
Family composition
Golley et al. 2011 [47] P 8.2 (1.1) N/A EB, PA,
PS
I, V Both parents are included.
Jansen et al. 2011 [45] T 9.72 (1.6) M: 40.31 (5.16)
F: 43.18 (5.62)
EB, PA,
PS
I, V From 63 families, both parents participated in the study. In addition, 35 single
parent families took part in the study (24 mothers and 11 fathers). In total, 87 mothers and 74 fathers participated.
Magarey et al. 2011 [36] T 8.2 (1.2) N/A EB, PA,
PS
I, VII Most children (74%) are from dual-parent families.
Wyse et al. 2011 [49] P 4.5 (0.8) 36.3 (5.2) EB I, III, IV, V 97% of parents (n=34) are female.
Moens and Braet 2012
[38]
P S1: 9.1 (1.3)
S2: 9.2 (1.4)
N/A EB, PA IV, V Both parents are included.
De Bock et al. 2013 [48] P 5.0 (0.2) N/A PA I, V Both parents along with grandparents are included.
Fletcher et al. 2013 [34] P 4.3 (0.6) 35.2 (5.6) EB I, V, VII Intervention group: mostly mothers (95.2%) Control group: mostly mothers (96.8%)
Janicke 2013 [42] T 12 N/A EB, PS I, III, IV A girl with her overweight mother
McGowan et al. 2013
[44]
P 3.4 (1.2) 35.7 (7.7) EB V Most of the participants were biological mothers (91%), 5% were fathers, and
4% were step/adoptive parents.
1 T: Treatment, P: Prevention; 2 Mean(standard deviation), IF&V: Increase Fruit and Vegetable Intake, DF&S: Decrease Fat and Sugar Intake, PO: Parent-only, PC: Parent-child,
FB: Family-based, MO: Mother-only, MC: Mother-child, D: Diet, A: Activity, D+A: Diet+Activity, S1: Study one, S2: Study two; 3 Mean(standard deviation); 4 EB: Eating Behavior, PA: Physical Activity, PS: Parenting Style; 5 See Table 2-2; 6Ages and family composition are extracted from [53]. 7No further information is presented. 8Not
available.

14
Table 2-4. Summary of 21 reviewed studies Study,
country Objective, Type, Duration, Participants, Study design Findings Results summary / *** Quantitative results
Epst
ein e
t al.
2001 [
46
]
Unit
ed S
tate
s
Objective: Evaluate the effect of a parent-focused behavioral intervention on parent and
child eating changes and on % overweight changes in families that contains at least one
obese parent and a non-obese child.
Intervention type: Treatment, randomized behavioral weight-control program
Intervention duration: 6 months; follow-up at 6 and 12 months
Participants: 30 families, one obese parent and a non-obese child (6-11 years)
Study Design: Comprehensive behavioral weight-control program for parents;
encourage increased fruit/vegetable intake or decreased intake of high-fat/high-sugar
foods.
Focus on what can be eaten (versus what
cannot) may increase adherence to caloric
restrictions for weight control.
Targeting fruit/vegetable intake in children
increases intake of nutritionally dense foods
AND decreases intake of low nutrient dense
foods.
Reduction in high-fat/high-sugar intake in
children can be achieved by focusing on
parent change.
Reduction in high-fat/high-sugar food intake in children
of both groups; significant change in food patterns
*** Group: Fruits and vegetables (Servings per day):
Increase Fruit and Vegetable: 0.72 ± 1.11
Decrease Fat and Sugar: -0.55 ± 1.31 (significant
between-group differences over time)
Group: High-fat/high-sugar (Servings per day):
Increase Fruit and Vegetable:-4.50 ± 7.97
Decrease Fat and Sugar: -8.50 ± 7.58 (p <0.001)
War
dle
et
al.
2003 [
40]
Unit
ed K
ingdom
Objective: Evaluate effectiveness of in-home parent intervention to increase child
preference for previously disliked vegetable.
Intervention type: Prevention, exposure-based randomized controlled trial
Intervention duration: 14 consecutive days taste test + 2- and 8-week follow up
Participants: 156 parents of 2 to 6 years old children
Study Design: Parents assigned to one of three groups: (a) training in ‘exposure’
feeding, (b) general nutritional information, or (c) no treatment. Target vegetable
selected based on low ranking on preference test. Parents assigned to the exposure group
given guidance on offering child a taste of target vegetable for 14 consecutive days.
Daily exposure to previously disliked
vegetable increases child’s liking and
consumption of target vegetable.
The effect is strongest in the exposure
group (showed a significant increase),
weakest in the information group and
intermediate in the control group.
Anecdotally, parents and children enjoyed
the ‘tasting games’ and frequently used the
exposure technique for other foods after the
study.
Increase children’s liking and consumption of that
vegetable
*** Means (SEM) of consumption of target vegetables:
Exposure group: Pre-intervention: 4.1 (1.4) ; Post-
intervention: 9.0 (1.7)
Information group: Pre-intervention: 5.7 (2.1); Post-
intervention: 7.3 (1.8)
Control group: Pre-intervention: 5.7 (1.5); Post-
intervention: 7.7 (1.6)
Effects on preference ranking: Exposure group: 30%
ranked their target vegetable as the most liked vs.
Control group: 5% vs. Information group: 2%
Gola
n a
nd C
row
2004 [
35]
Isra
el
Objective: Evaluate long-term change in child overweight in a parent-only vs. child only
health-centered intervention.
Intervention type: Treatment
Intervention duration: 1 year + follow-up at years 1, 2, and 7
Participants: 2 parent-only groups (15 families each), 2 child-only groups (15 children
each). Children age 7-12 in original intervention
Study Design: Parent-only Group: 14 1-hour support and educational group sessions.
Topics included setting limits, nutrition education, eating and activity behavior
modification, decreasing stimulus exposure, parental modeling, etc. Child-only Group:
30 1-hour group sessions. Topics included physical activity, eating behavior
modification, stimulus control, self-monitoring, etc.
Over the long term, targeting parents
improved child weight outcomes better than
targeting children. Mean reduction in
percent overweight is greater at all follow-
up points in children of the parent-only
group compared with those in the children-
only group.
Reduction in percent overweight in children of the
parent-only group after 7 years
*** 7 years after the program terminated, mean
reduction in children’s overweight:
Parent-only group: 29% (p<0.05)
Children-only group: 20.2% (p<0.05)
Gola
n e
t al.
2006 [
33]
Isra
el
Objective: Evaluate relative efficacy of targeting parents alone v. parents and obese
children together to treat childhood obesity
Intervention type: Treatment, randomized health-centered intervention
Intervention duration: 6-month + follow-up at the 1-year
Participants: 32 families, with at least one child age 6 to 11 years more than 20%
overweight
Study Design: Parents encouraged fostering authoritative parenting style. 16 1-hour
support/education group sessions for each group. In addition, 40–50 min individual
sessions once per month for each family (both groups), during the 6 month intervention.
Children (6–11 years) who attended
intervention sessions with parents lost less
weight than children whose parents were
targeted alone. Parents-only produced
significant reduction in the child %
overweight at 6 and 12 months. Parents’
weight status does not change in either
group.
Reduction in percent overweight of children in the
parent-only group
*** Parents-only group (BMI z):
Baseline: 2.0 to termination (after 6 months): 1.6
(change: 0.4, P<0.05); Overweight percentage: 47±22.1
to 37.5±22.0 (change: -9.5, P<0.05)
Parent and child group (BMI z): Baseline: 2.1 to
termination: 2.0 (NS); Overweight percentage:
48.5±18.1 to 46.1±17.8 (change: -2.4, NS)

15
Study, country
Objective, Type, Duration, Participants, Study design Findings Results summary / *** Quantitative results G
oll
ey e
t al.
2007 [
32]
Aust
rali
a Objective: Evaluate relative effectiveness of parenting-skills training as a key strategy
for the treatment of overweight children.
Intervention type: Treatment, assessor-blinded, randomized controlled trial
Intervention duration: 5 month + follow-up at months 6 and 12
Participants: 111 overweight, children age 6 to 9 years
Study Design: 3 Parenting-skills training alone (P): parents participate in the Positive,
Parenting Program (Triple P), 4 weekly 2-hour group sessions followed by 4 weekly,
then 3 monthly, 15- to 20-minute individual telephone sessions. Parenting-skills training
+ intensive lifestyle education (P+DA): Complete the Triple P program described above
plus an additional 7 intensive lifestyle support group sessions following completion of
the 4 weekly parenting sessions (every 2 weeks at first, then monthly). Children in the
P+DA group simultaneously attend structured activity sessions developed by physical
activity experts. Three group design; third group is waitlist controls (WLC).
3 groups (P, P+DA, and control group)
have a significant reduction in BMI z score
over 12 months.
Significant reductions in BMI seen in
intervention boys, but not intervention girls
or waitlisted controls. After 12 months, the
BMI z score reduced by ~10% in P+DA
versus ~5% P or waitlist controls
Reduction in BMI z score for both parenting-skills
training groups (more reduction in P+DA)
*** BMI z score change between 12 months and
baseline:
P+DA: -0.24 ± 0.43
P: -0.15 ± 0.47
Control group: -0.13 ± 0.40
BMI z score decrease of children over 12 months:
P+DA: 45%
P group: 24%
WLC group: 19%
Hai
re-J
osh
u e
t al.
2008 [
43]
Unit
ed S
tate
s
Objective: Test effectiveness of a home-based intervention for parents to foster a
positive fruit–vegetable (FV) environment for their preschool child; examine whether
changes in parent behavior are associated with improvements in child intake.
Intervention type: Prevention, group randomized nested cohort
Intervention duration: 7 months (range of 6 to 11 months)
Participants: 1306 parents and children (ages 2 to 5 years)
Study Design: High 5 for Kids (H5-KIDS) developed in partnership with Parents As
Teachers (PAT). Parent educators deliver a standardized curriculum (social cognitive
theory-based) via at least five home visits, on-site group activities, and a tailored
newsletters and materials for families.
H5-KIDS parents and normal weight
children increased FV intake.
Overweight children more likely to
consume high calorie snack foods or
sweetened drinks which may limit intake
and preference for FV.
Increase of FV servings in normal weight children but
not overweight children
*** Mean change of daily FV intake (parents):
Both overweight and normal weight, Control group:
0.06 (p=0.05); Intervention group: 0.24 (p=0.05)
Mean change of daily FV intake (children):
Both overweight and normal weight Control group: -
0.05 (p=0.2); Intervention group: 0.01 (p=0.2)
Mean change of FV intake:
Overweight children only, Control group: 0.09
(p=0.48); Intervention group: -0.07 (p=0.48)
Mean change of FV intake:
Normal weight children only, Control group: -0.11
(p=0.02); Intervention group: 0.23 (p=0.02)
Janic
ke
et a
l. 2
008 [
39]
Unit
ed S
tate
s
Objective: Assess effectiveness of parent-only vs. family-based interventions for
pediatric weight management in underserved rural setting.
Intervention type: Treatment, three-arm randomized controlled clinical trial
Intervention duration: 4 month + follow up at 10 months
Participants: 64 families with overweight/obese 8 to 14 years old children
Study Design: Study arms: (1) a behavioral family-based (FB) intervention: Parent and
child dyads participated in simultaneous but separate groups, (2) a behavioral parent-only
(PO) intervention: Only the participating parent(s) attended group meetings, or (3) a
waitlist control.
Both PO and FB interventions
demonstrated improvement in weight status
compared with control. Children <11 years,
those in the PO had about 50% greater
decrease in weight status at follow-up
relative to those in FB.
Decrease in BMI z score of children in PO group; Not
significant difference in weight status change between
PO and FB
*** An overall mean decrease of BMI z score:
Children in the PO intervention: 0.090 (0.039)
Children in the FB intervention: 0.115 (0.046)

16
Study, country
Objective, Type, Duration, Participants, Study design Findings Results summary / *** Quantitative results M
unsc
h e
t al.
2008 [
41]
Sw
itze
rlan
d
Objective: Investigate whether treatment of mothers only is as effective as a mother-
child treatment in a randomized controlled clinical trial to reduce child overweight.
Intervention type: Treatment, Cognitive behavioral therapy (CBT) randomized
controlled trial.
Intervention duration: 10 weekly 120-min sessions and 6 monthly sessions
Participants: 31 families in the mother-child (MC) group and 25 families in the mother-
only (MO) group (child age 8 to 12 years)
Study Design: In both conditions mothers receive CBT. Children in MO attend
relaxation training of equal frequency/duration to the child CBT training in MC. Mothers
encouraged to follow basic food rules for family meals, model physical activity, and
focus on coping with social stigmatization of obesity for their child.
Overweight percentage between baseline
and 6-month follow-up is reduced by 1.9%
(MC) and 4.5% (MO) based on a linear
mixed model.
Both treatments are efficacious with respect
to the reduction of overweight in children
between baseline and 6-month follow-up
and that these reductions are similar
between the two treatments.
Reduction in child percent overweight; no difference
between the parent-only and parent-child interventions
*** Child BMI (MC):
Baseline: 29.64; End of treatment: 29.60; End of
follow-up: 29.70
Child BMI (MO):
Baseline: 27.34 (SE=1.69); End of treatment: 27.40
(SE=1.69); End of follow-up: 27.21(SE=.70)
Res
nic
k e
t al.
2009 [
31]
Unit
ed S
tate
s
Objective: Pilot an easy-to-use parent outreach model that could ultimately be used by
school nurses, pediatricians, community health agencies, and community health workers
to reduce child overweight/obesity.
Intervention type: Treatment, pilot parent-directed trial
Intervention duration: 36-hr training program over 6 days, 1-year follow-up
Participants: 46 parents of overweight/obese elementary school students (mean age 8.5
years)
Study Design: Parents from two schools randomly assigned to either Materials Group
(M) or Materials plus Personal Encounters Group (M + PE). M receives mailed
educational materials and P+PE receive educational materials through interactions with
community health workers. Parents in both groups receive identical materials.
~50% parents reported confidence in
knowing ways to improve child’s
nutritional habits, and ~66% reported
confidence in knowing/ talking about ways
to increase child’s activity at baseline.
Modest reductions in BMI found for
children who watched <2 hr TV/day after
study completion compared with children
who watched>2 hr TV/day at baseline.
Reduction in BMI for children
*** Post-Intervention Overall:
child BMI percentile: 90.6 ± 10.0 (p = .005)
Baseline Overall:
child BMI percentile: 94.1 ± 4.3
There are no significant between-group differences in
the reduction of BMI (between M and M + PE groups).
Wes
t et
al.
2010 [
30]
Aust
rali
a
Objective: Evaluate the effects on child weight of a parent-only parenting and child
weight-related behavior intervention, relative to a waitlist control.
Intervention type: Treatment, randomized clinical trial
Intervention duration: 12-week + 1 year follow-up
Participants: 101 families with overweigh/obese children age 4 to 11
Study Design: The lifestyle-specific parenting program consists of nine 90-min group
sessions to enhance parents’ commitment to change and three 20-min telephone sessions
to review parents’ implementation of strategies, and address challenges. All sessions use
an active skills training process within a self-regulation framework (e.g., goals and
progress evaluation). Parents receive a workbook summarizing session content and
suggested between-session tasks.
The intervention has significant effects on
child body size, weight-related problem
behavior, parenting self-efficacy, and
ineffective parenting. 25% of parents report
reductions in child weight-related problem
behavior. 33% of families show significant
decreases in ineffective parenting, and 14%
children show clinically significant
decreases in weight. 10% of children move
from obese to overweight.
Reductions in children BMI z score and weight-related
problem behavior
*** Intervention group:
child BMI z-score: 2.15 (pre) to 2.04 (post) and 1.96
(after 1 year)
Control group:
child BMI z-score: 2.11(pre) to 2.10 (post)
Boute
lle
et a
l. 2
011 [
37
]
Unit
ed S
tate
s
Objective: Determine whether a Parent-only (PO) intervention is not inferior to a parent
and child (PC) treatment for childhood obesity.
Intervention type: Treatment, randomized clinical trial
Intervention duration: 5-month + 6-month follow-up
Participants: 80 parent–child dyads (overweight/obese children age 8 to 12 year) (40
pairs PO; 40 pairs PC)
Study Design: 60-min separate child and parent sessions. Parents in the PO group
coached on how to assist children in weight monitoring and behavior change. Program
included dietary modification (traffic-light diet), increased physical activity, behavioral
change skills, and parenting skills specific for children who are overweight.
Child weight loss and physical activity in
PO group not inferior to PC group. PO
potentially more cost-effective and easier to
disseminate.
Decrease in BMI-z score of children in PO and PC
groups; PO child weight loss, parent weight loss and
child physical activity not inferior to the PC.
*** Child BMI-Z score in Parent-only:
Pre-treatment: 2.29 (0.38); Post-treatment: 2.16 (0.54);
Follow-up: 2.10 (0.68),
Child BMI-Z score in Parent–child:
Pre-treatment: 2.25 (0.34); Post-treatment: 2.06 (0.40),
n=28; Follow-up: 2.08 (0.41), n=28

17
Study, country
Objective, Type, Duration, Participants, Study design Findings Results summary / *** Quantitative results C
oll
ins
et a
l. 2
011 [
21]
Aust
rali
a Objective: Evaluate the impact of a child-centered physical-activity plus parent-centered
dietary-modification program on child BMI-z score
Intervention type: Treatment, three-arm assessor-blinded randomized control trial
Intervention duration: 6-month + 6-, 12-, and 24-month follow-up
Participants: 165 overweight prepubertal children (68 boys) age 5.5 - 9.9 years
Study Design: 3 arm intervention (1) parent-centered dietary-modification program
(Diet), (2) child-centered physical-activity skill-development program (Activity), and a
combination of programs (Activity + Diet). Each arm: 1) 10 weekly 2-hour face-to-face
session with homework activities; 2) 3-monthly relapse-prevention telephone sessions to
review parent goals.
All groups achieved clinically significant
reductions in BMI z score and waist
circumference at 24 months.
Parent Diet program is more efficacious
than child Activity program, although not
different from Activity + Diet suggesting
childhood obesity treatment could focus
exclusively on parental modification of
child dietary intake.
All groups reduction BMI z score (greatest effects
through inclusion of a parent-centered diet program)
*** BMI z score, adjusted for gender, 24-month
difference from baseline by treatment group (P<0.001):
the diet-only group: -0.35 (-0.48 to -0.22)
activity-only group: -0.19 (-0.30 to -0.07)
the activity and diet group: -0.24 (-0.35 to -0.13)
all groups -0.26 (-0.33 to -0.19)
BMI z score, adjusted for gender, between-group
differences from baseline (P=0.04):
the diet-only group: -0.17 (-0.34 to 0.01)
activity-only group: -0.05 (-0.21 to 0.11)
the activity and diet group: 0.11 (-0.06 to 0.28)
Goll
ey e
t al.
2011 [
47
]
Aust
rali
a
Objective: To describe the impact of a parent-led, family-focused child weight
management program on the food intake and activity patterns of pre-pubertal children
Intervention type: Prevention, an assessor-blinded, randomized controlled trial
Intervention duration: 6 month + 6 month follow-up
Participants: 11 (64% female) overweight, pre-pubertal children age 6 to 9 years
Study Design: The parenting-skills training alone (P) and P + activity education (DA)
groups attended an eight-week standardized general parenting program. Parents in the P
+ DA arm attended additional seven lifestyle education sessions based on the Australian
food selection guide. Parents in the P and wait list control groups (WLC) received a
‘lifestyle recommendations’ pamphlet.
Intake of extra foods (i.e., energy-dense
nutrient-poor foods) was lower in both
intervention groups at 6 and 12 months.
Intervention achieved a reduction in
children’s intake of extra foods without
compromising intake of nutrient-rich foods.
Reduction in children’s intake of energy-dense, nutrient-
poor foods and an increase in the time reported spent in
active play
*** Reducing children’s intake of extra foods:
P + DA: Baseline: 3.5 (2.5-4.5); 6 months: 2.0 (1.5-2.5);
12 months: 2.0 (2.0-3.0)
P: Baseline: 3.0 (2.4-3.4); 6 months: 1.5 (1.5-2.0);
12 months: 2.3 (1.5-3.0)
WLC: Baseline: 3.0 (2.0-3.5); 12 months: 2.5 (1.9-4.0)
Janse
n e
t al.
2011 [
45]
Net
her
lands
Objective: Evaluate whether a treatment aimed solely at obese children’s parents results
in positive effects on the children’s weight status
Intervention type: Treatment, a randomized controlled trial
Intervention duration: 10 weeks + 3 month
Participants: Parents of 98 overweight or obese children, age 7 to 13 years
Study Design: Parents attended eight sessions spread over 10 weeks. The purpose of the
sessions was to teach parents to think of alternatives and possible solutions, rather than to
purely present information. A substantial part was devoted to enhancing parenting
tactics.
Child BMI percentile decreased 2.4% in
the treatment group, whereas there was no
change in the waiting-list control group.
The parents’ treatment had significant effects on child
and parent BMI.
*** BMI percentile child:
Treatment group (n = 59):
Pre-treatment: 96.8±2.93; Post-treatment: 94.5±6.52; 3 Month follow-up: 94.7±6.58
WLC group (n = 39):
Pre-treatment: 95.9 ±3.38; Post-treatment: 96.0 ±3.64; 3
Month follow-up: 95.7±3.90

18
Study, country
Objective, Type, Duration, Participants, Study design Findings Results summary / *** Quantitative results M
agar
ey e
t al.
2011 [
36]
Aust
rali
a Objective: Evaluate a healthy lifestyle (HL) intervention to reduce adiposity in children
aged 5 to 9 years; assess effect of added parenting skills training.
Intervention type: Treatment, single-blinded randomized controlled trial
Intervention duration: 6-month + 6, 12, 18, 24 months
Participants: 169 pre-pubertal moderately obese children, age 5 to 9 years
Study Design: Both arms parent-only: 12 (P+HL group) or 8 (HL group) 90- to 120-
minute group sessions (and 4 telephone sessions, delivered over 6 months with tapered
frequency (weekly, bimonthly, then monthly). The Positive Parenting Program (Triple P)
was delivered in 4 sessions to P+HL parents before the lifestyle (HL) component (to
encourage parents to anticipate and manage high-risk situations with respect to a positive
energy balance). HL sessions focused on information only.
10% reduction in BMI z scores from
baseline to 6 months (maintained at 24
months with no additional intervention.)
Reduction in BMI scores in pre-pubertal children
*** Mean BMI z Score:
P+HL:
Baseline (n=85): 2.77±0.58
After 24 month (n=52): 2.38 ±0.67
HL:
Baseline (n=84): 2.68±0.65
After 24 month (n=54): 2.26±0.84
Wyse
et
al.
2011 [
49]
Aust
rali
a
Objective: Examine efficacy of a brief telephone-based parent intervention to increase
fruit/vegetable consumption in children aged 3–5 years’ examine feasibility of
intervention delivery and parent acceptability.
Intervention type: Prevention, pre–post study design with no comparison group.
Intervention duration: 4 weeks + 1 week follow-up
Participants: 34 parents of children age 3 to 5 years
Study Design: Four 30 minute weekly telephone calls plus instructional resources. Three
focus areas: availability and accessibility of foods within the home, role modeling
fruit/vegetable consumption, and supportive family eating routines.
Variety and/or frequency of children’s
fruit/vegetable consumption significantly
increased. Increased vegetable/fruit
consumption corresponded with non-
significant decrease in the variety and
frequency of children’s consumption of
non-core foods. Parents willing to receive
and continue with an intervention.
Increase of variety and/or frequency of children’s fruit
and vegetable consumption
*** CDQ, Children's dietary questionnaire, fruit and
vegetable subscale (P=0.027):
Pre-intervention: 15.5 (5.1)
Post-intervention: 18.1 (4.1)
Moen
s, B
raet
2012 [
38]
Bel
giu
m
Objective: Evaluate a parent-led intervention to reduce child BMI.
Intervention type: Treatment, a cluster-randomized controlled trial
Intervention duration: 6 month + 12-month
Participants: 50 families with overweight children, age 6 to 12 years
Study Design: Six 2-hour group sessions over 5-months. Dietician and a psychologist
provide lifestyle education behavior.
Children in the intervention group: decrease
in adjusted BMI of 7% post-intervention;
weight loss maintained at the one-year
follow-up.
For the obese children more intensive
treatment is required.
Positive changes in children’s eating behavior and
positive increase in familial health principles
*** The decrease in adjusted BMI from baseline to the
6-month measurement was comparable in both groups
Intervention group: M1 = 147.57% and M2 = 142.55%;
Waitlist group: M1 = 139.45% and M2 = 135.92%)
(Only significant in the intervention group, t(30) = 2.44,
p = .021).
De
Bock
et
al.
2013
[48]
Ger
man
y
Objective: To assess whether a participatory parent-focused approach using parents as
agents of behavioral change enhances the efficacy of a preschool physical activity (PA)
intervention
Intervention type: Prevention, a cluster randomized controlled trial
Intervention duration: 6 months (but continued for a total of up to 9 months) + 12
months follow-up
Participants: parents of 433 preschool children age 4 to 6 years
Study Design: In control group, parents received a state-sponsored program consisting
of twice-weekly 1-hour gym classes over 6 months. In intervention group, parents are
motivated to develop and implement their own project ideas for promoting children’s
PA. The external gym trainers in intervention group received additional training and
served as intervention facilitators helping to coordinate parent activities, encouraging
participation, and documenting the intervention implementation.
Compared to children enrolled in the
standard, expert-driven program alone,
children who received a combination of
the participatory intervention and the
expert-driven non-participatory program
were significantly less sedentary and
more physically active after 12 months.
Half a year after program termination,
children in the participatory arm had 4%
more accelerometry counts and spent 11
(1.7%) fewer minutes in sedentary
behavior during wake times.
Promote PA and reduce sedentary behavior in
preschoolers
*** Sedentary behavior, minutes/day
Intervention Group: Baseline: 631.3±68.3; 6 months:
629.9±62.6; 12 months: 623.9±66.8
Control Group: Baseline: 631.4±63.2; 6 months:
633.3±63.5; 12 months: 628.1±67.1
Mean accelerometry, counts/15 seconds/day
Intervention Group: Baseline: 31.4±8.1; 6 months:
32.2±8.7; 12 months: 32.95±10.78
Control Group: Baseline: 31.8±9.7; 6 months: 31.8±9.4;
12 months: 32.6±11.6

19
Study, country
Objective, Type, Duration, Participants, Study design Findings Results summary / *** Quantitative results F
letc
her
et
al.
2013 [
34]
Aust
rali
a
Objective: To assess the effectiveness of a telephone-based intervention in reducing
child consumption of non-core foods, and to examine parent and home food environment
mediators of change in child consumption
Intervention type: Prevention, a clustered randomized controlled trial
Intervention duration: 2 months + 6 months follow-up
Participants: 394 parents of preschool-aged children, age 3 to 5 years
Study Design: Parents in the intervention group received four telephone contacts and
print materials targeting parent and home food environment characteristics, while parents
in the control group received generic print materials only.
Child consumption of non-core foods was
reduced at 2 months, however this was
not maintained at 6 months. Child access
to non-core foods in the home, and child
feeding strategies are significant
mediators, which representing the
primary causal pathways by which the
intervention influenced the consumption
of non-core foods.
Improve short-term dietary behavior in preschool age
children
*** Child non-core food consumption:
Intervention Group:
Baseline: 2.48±0.08; 2 months: 2.24±0.07; 6 months:
2.29±0.09
Control Group:
Baseline: 2.59±0.08; 2 months: 2.57±0.11; 6 months:
2.47±0.10
Janic
ke
2013 [
42]
Unit
ed S
tate
s
Objective: To describe behavioral parent-only intervention to promote healthier
lifestyle habits and reduce weight status in an obese 12-year-old female participant.
Intervention type: Treatment, case example of a randomized controlled trial
Intervention duration: 4 month + 10 month follow-up
Participants: A 12-year-old girl with her mother
Study Design: The intervention included 12 group sessions over 4 months. Behavioral
strategies such as including self-monitoring, goal setting, performance feedback,
reinforcement, stimulus control, and instruction in behavioral parenting strategies were
applied.
The child lost 17 pounds and grew 1.7
inches in height. Her quality of dietary
intake was improved. She also experienced
a drop in the number of self-reported
unhealthy weight control behaviors.
Improvement in the child’s quality of dietary intake and a
drop in the number of self-reported unhealthy weight
control behaviors
***BMI z-score decrease:
At 6-month follow-up: 0.6
Mean daily caloric intake:
Baseline: 2,066; At 6-month follow-up: 1,664
McG
ow
an e
t al.
2013 [
44]
Unit
ed K
ingdom
Objective: To promote habit formation for three parental feeding behaviors: serving
fruit/ vegetables, serving healthy snacks, and serving non-sweetened drinks
Intervention type: Prevention, a cluster-randomized, controlled exploratory trial
Intervention duration: 8 week (follow-up measures were completed at the final home
visit)
Participants: 126 parents of children age 2 to 6 years
Study Design: The intervention was delivered over the course of 4 visits to the family in
home. Researchers worked through an intervention booklet in each visit, lasting about an
hour. The booklet introduced the concept of habit formation along with tips for habit
formation.
Significant effects on children’s intake of
vegetables, healthy snacks and water were
reported. Changes in parental automaticity
of feeding behaviors correlated with
children’s food intake.
Modification in parental feeding behaviors, change
children’s diets positively, and well acceptance by
parents
*** Change in children’s serving of vegetables per day:
Intervention Group: +0.8±1.3; Control Group: +0.1±0.8
Change in Healthy snack occasions per day: Intervention
Group: +1.0±2.1; Control Group:
-0.2±2.1
Change in Water occasions per day: Intervention Group:
+0.6±1.0; Control Group: +0.1±0.9

20
2.4 Analysis
The analysis focuses on teasing out the components of interventions, mechanisms of impact, and
the outcomes to inform social influence processes and future intervention designs. Table 2-4
provides a detailed review of these studies, including their design, findings, and quantitative
outcomes. Given the level of detail in Table 2-4, Figure 2-2 is developed to help illustrate the
findings in this section. Insights gained from these studies are summarized as potential causal
mechanisms that connect different interventions to outcomes of interest, improving eating and
activity behaviors (Figure 2-2). We relied both on the explicit reports of mechanisms in the
original studies (solid lines in Figure 2-2) and our judgment about likely additional pathways
(dashed lines). Figure 2-2 is divided into five layers that span conceptual steps involved in these
mechanisms: 1) Components of intervention programs, 2) Targeted parental behaviors, 3)
Intermediate mechanisms (actions that transfer the effects of intervention programs from the
parents to the indirectly targeted family member, i.e., children), 4) Social influence mechanisms
which include the psychological consequences of the intermediate mechanisms, and 5) Outcomes
(e.g., improved child’s eating and activity behaviors). Below we discuss these five layers in more
detail, noting that the causal pathways span across these layers and thus they are easier to follow
along with the Figure 2-2 diagram.
2.4.1 Components of intervention programs
Three distinct components, education, physical activity, and eating behavior, can be identified as
part of the interventions we reviewed (the bottom layer in Figure 2-2). Some interventions focus
more on one component than others, yet they all include these three elements to some extent.
These components each activate several additional mechanisms relevant to understanding how
social interventions work. We first summarize the intervention components and then discuss the
pathways through which they impact children’s obesity outcomes.
Parental Education
Parental education is a significant element in many of the interventions, though it is often
accompanied by other components [54]. Parental education aims to improve parents’ own
weight-related behavior as well as their feeding style. For example, changes in parental
responsibility for child feeding [55] encouraging nutritional variety and balance, and modeling

21
[56] have been reported. In the reviewed interventions, some educational components enhance
parents’ understanding of their own and children’s behaviors [32, 35, 38, 46], parenting tactics
(e.g., teaching parents to ignore undesirable behaviors and reward desirable behaviors) [45], and
improve parents’ competence in managing children’s behavior [21, 30, 32]. Moreover, some
interventions include components related to individual self-control and goal setting to enhance
parenting skills [39].
Physical Activity and Eating Behavior
Many interventions also aimed to change parents’ weight-related behaviors. Interventions with
physical activity components attempted to: increase daily steps [39], get parents involved in
sports [30, 48], reduce TV watching time [31, 47], and engage parents in active play [30, 48].
Interventions with eating behavior components targeted improving parents’ eating habits through
planned family meals [33, 34], recommending core food servings [32], modifying recipes [30,
32, 33], reading nutrition labels [30, 31], shopping for more healthful foods at grocery stores
[31], encouraging decreased intake of high-fat and high-sugar foods [41, 46], increasing fruit and
vegetable availability at home [34, 43, 49], and increasing intake of nutritionally dense healthy
foods [44, 46].
2.4.2 Targeted parental behaviors and intermediate mechanisms
The capabilities, routines, and knowledge resulting from the above components enhance a set of
parental behaviors in relationship with children [30, 36], which together we call quality of
parenting style. These include taking responsibility for adopting healthier lifestyle habits at home
[30], caring about a healthy home environment [33, 44], parental effort to instill a desire for
healthy behavior in children [42], and support for children’s attempts to adopt healthy behaviors
[30, 36, 37, 41, 42].
By taking responsibility for adoption of healthy lifestyle habits parents may become more
motivated to participate in intervention components [30]. That responsibility also enhances
parents’ caring about children’s weight status [39], leading to better monitoring and feedback to
change children’s behavior, one of the social influence mechanisms relevant to children’s
outcomes. Moreover, increased quality of parenting may lead to children’s enhanced self-
efficacy and increased desire to have healthy behaviors [42] and ultimately result in creating a
supportive social environment at home [33, 35, 38-40].

22
Parental education can increase parents’ competency to manage children’s behavior,
improving parents’ confidence in helping children change their habits [32] and enhancing
parents’ own motivation to continue participation in the intervention [30]. Motivated parents also
show higher quality of parenting style [30]. In fact, there is a potential virtuous cycle (reinforcing
feedback loop) in which parents gain confidence, become more committed to the intervention,
and therefore perform better in their parenting style, paving the way for further successes and
confidence building.
Changing parents’ own weight-related behaviors moderates home environment, access, and
children’s modeling of behaviors. Different studies have targeted different subsets of parents’
activities, from reducing TV watching hours to increasing fruits and vegetable availability.
Parental education also reinforces parental weight-related behavior change as parents learn more
about the importance of their own and the children’s behaviors [38]. Once actively pursued,
these parent’s healthy eating and activity behaviors, together with improved parenting style, lead
to healthier home environments [33, 35, 42-44]. Home environment, as a psychosocial
antecedent for children’s obesity [57], has the potential to change children’s attitude toward
different foods and activity level [58, 59]. Through modeling effects as well as access, healthy
home environment could also regulate children’s “obesogenic” behaviors such as regularity of
participation in family meals, television viewing habits, and healthy food consumption [33].
2.4.3 Social influence mechanisms
In the preceding section, we identified three core social influence mechanisms that moderate how
parental interventions influence children’s behaviors. We discuss these mechanisms below.
Praising and encouraging desirable behaviors
As parental attention increases monitoring of children’s weight-related behaviors, parents can
provide praise and encouragement for desirable behaviors (and potentially punish undesirable
ones). This type of social influence, also referred as compliance [51] (see Table 2-2), is not
typically associated with enduring changes; in the absence of other influences, compliance often
requires continued rewards and punishments to sustain the target behavior [60]. Ultimately,
children must develop the ability to follow healthy eating and physical activity behaviors without
much external feedback.

23
Modeling of healthy eating and activity patterns
Modeling is one of the main mechanisms in which behaviors transfer through social relations,
and has been strongly recommended for obesity interventions [61, 62]. Social modeling occurs
because people, often unconsciously, adjust their behaviors to match their valued social ties. This
type of social influence (modeling) is also called identification [51, 60] (see Table 2-2), and
provides a pathway to more sustained change in children’s behavior. The key to activating this
pathway is parental behavior change which provides a healthy home environment and
opportunities for children to imitate parents’ healthy behaviors [63]. Given the reduction in the
amount of time children spend with their parents and the adoption of role models outside of
home as children age, identification is likely strongest for younger children [60], leading to the
recommendation of using social influence for younger children [60]. However long-term follow
up studies are needed to track if the modeled behaviors among younger children last into
adulthood and whether this mechanism includes an age effect separate from the amount of time
children spend with parents.
Supportive social environment
Providing a social environment supportive of healthy behaviors provides a third pathway to
social influence. This mechanism is partially encouraged by the healthy home environment.
Moreover, in a supportive environment parents would help children form their values and beliefs
so that they actively choose healthy behaviors. This mechanism allows for the internalization
(see Table 2-2) of the target behaviors, and is hypothesized to be the longest lasting type of
social influence and best suited for older children [60].
In our sample parent interventions most frequently targeted building supportive environments
(see letters I-IV in Table 2-2 and Table 2-3) to promote healthy child weight, followed by
providing general encouragement as positive reinforcement. Parent interventions were least
likely to target contingent rewards (such as offering a toy in exchange for making healthier food
choices) as positive reinforcement.
2.4.4 Outcomes
Our main outcomes of interest are children’s eating and physical activity behaviors, which
directly influence obesity outcomes. The reviewed studies showed various levels of impact on

24
children’s obesity outcomes and weight-related behaviors. Eight papers [21, 30, 32, 33, 36, 37,
39, 42] reported reductions in BMI z-score (mean [range] of -0.25 [-0.6,-0.1]), two papers
reported reductions in BMI percentile by 3.5% (P=0.005) [31] and 2.4% (P<0.001) [45], and one
paper reported 7% (P=0.001) decrease in adjusted BMI (actual BMI/percentile 50 of BMI for age
and gender x 100) [38]. Reductions in percentage overweight were reported as 4% (P<0.001)
[41] and 14% (P<0.05) after one year (29% (P<0.05) after seven years) [35]; however, one study
reported no change in the percentage of overweight over one year [46]. Moreover, several papers
report changes in food consumption patterns including an increase in the frequency and variety
of fruit and vegetable consumption (P=0.03) [49], increases in intake of vegetables (P=0.003),
healthy snacks (P=0.009) and water (P=0.03) [44], increase in the willingness to eat vegetable
(P<0.01) [40], decrease in the consumption of non-core foods at two months (P<0.01, however
not maintained at six months) [34], and a decrease in the intake of energy-dense, nutrient-poor
foods (P=0.02) [47]. One study reported positive effects of parents’ fruit and vegetable intake
(P=0.001) and availability of fruit and vegetable (P=0.01) on children’s fruit and vegetable
intake [43]. Reported physical activity outcomes included a decrease in sedentary behavior (11
min/day, P=0.01) and an increase in the accelerometry counts (1.4 counts/15 seconds, P=0.02)
[48].
2.4.5 Alternative behavior change techniques
Seven of the behavior change techniques summarized in Table 2-2 include social influence
mechanisms and were utilized to varying degrees in the studies we reviewed (see Table 2-2 for
descriptions of these techniques and their associations with the core social influence
mechanisms). Among the techniques that targeted supportive social environments, the behavior
change technique of plan social support or social change was most prevalent, being observed in
71% of the interventions (15 papers). Three other techniques were not widely utilized: provide
instruction and guidance (10%, two papers), provide feedback on performance (14%, three
papers), and prompt intention formation (19%, four papers). It should also be noted that a
supportive social environment needs proper and effective parenting style (see [64-66] for more
discussion), while only 27% of the interventions (4 papers) focused specifically on the parenting
style (see Table 2-3). Among the rest of the behavior change techniques, the potential technique
of prompt identification as a role model was observed frequently (62%; 13 papers). Lastly,

25
provide contingent rewards and provide general encouragement were observed in 5% (one
paper) and 29% (six papers) of interventions, respectively.
2.5 Discussion and conclusion
The choice of direct and indirect change agents within the family has recently received some
attention in obesity research, e.g., see [57, 67-71]. A few family based interventions target
parents aiming to induce behavioral change in children. We provided a simple graphical
summary (Figure 2-2) of the key social influence mechanisms identified in the 21 reviewed
papers in which children are targeted indirectly. We also mapped out three core social
mechanisms to seven behavior chance techniques and their use in the interventions (Table 2-2
and Table 2-3). Analyzing these mechanisms, we identified the provision of a supportive social
environment for children as potentially the most beneficial social influence mechanism for older
children, and the modeling of healthy behavior as especially useful for younger children [60].
The choice of existing intervention designs, however, is not explicitly connected to these
recommendations, and may be better explained by feasibility constraints and other goals the
studies have pursued. Therefore, significant diversity can be observed in the current designs and
outcomes. The limited number of studies and heterogeneity in the designs and reported outcomes
did not allow for insights from quantitative assessment of specific pathways. The reports on
these interventions also did not provide enough detail to enable comparative cost-benefits
analysis, an important need for designing cost-effective interventions.
In addition to the social influence mechanisms and the causal relations discussed in the
analysis section, findings from the included studies provide insights on how to improve the
efficacy of interventions. Specific recommendations adopted from the reviewed studies include
targeting families with young children, (children younger than 11 years) [33, 36, 39]; starting
treatment from early stages of obesity [38, 43] as more intensive interventions are usually
required for obese children; focusing on what can be eaten versus what cannot be eaten [46]; and
focusing on health-centered rather than weight-centered approaches [35, 46]. These
recommendations are in line with focusing on providing a supportive social environment that
leads to internalization of healthy behaviors in the family, rather than more narrowly defined
obesity treatment goal.

26
Moreover, additional benefits are observed in treating parents as the direct agents of change
in the family setting rather than treating the children directly (for more discussions on the roles
of mother and father, see [72, 73] and [74], respectively). These benefits relate more to the
logistics and sustainability of interventions than to social influence mechanisms. First, focusing
on parents reduces children’s perception of having a health problem and the stigmatization that
goes with being “an overweight patient” [35]. As a result, children are less likely to resist the
lifestyle changes that accompany the intervention [39]. Moreover, parents usually have an easier
time attending the intervention sessions without the children [39, 40], and the sessions are more
productive in terms of problem solving and discussion time among participating parents [39]. In
addition, including fewer change agents reduces the costs of the intervention [30, 31, 37] and
makes the intervention more feasible for some, especially among underserved rural communities
[33]. The logistical benefits also enhance parents’ motivation to participate, increasing
intervention’s sustainability and parents’ commitment. Nevertheless, the current literature
provides limited cost data to enable a systematic comparison of cost-benefits against alternative
interventions.
There is considerable interest among obesity researchers in understanding the influence of
systems on nutrition and physical activity behaviors. This goes more “upstream” from the family
and addresses the outer levels of the socio-ecologic model including community and
organizational (e.g., school, faith-based organizations, and community recreation programs)
factors as well as policy and environmental change at the local, state, and national level [25, 75].
However, one can also consider systems change within the family, where parental
training/education could lead to structuring the home environment so that the “healthy choice is
the easy choice”. Here the influence on a child’s behavior is likely a combination of
reinforcement, modeling and internalization as well as a more direct impact of having access to
healthy food and equipment/space promoting physical activity, and not having access to
tempting foods and sedentary behavior promoting devices (TV, computer games). One can even
make the argument that families can have organizational “policies” that create health promoting
environments. Children benefit both from directly experiencing this environment as well as
learning how to structure one for themselves when they are able to make their own decisions.
During the search process, we did not limit our review to studies in which only children are
targeted indirectly, but we considered any combination of family members. Interestingly, we

27
found only one paper that presents the effects of a targeted spouse on the untreated partner, and
we did not find any other combinations (within our inclusion criteria). This shows a potential
research need for exploring the targeting of other combinations of family members, e.g., between
spouses, among siblings, extended family members (e.g., grandparents), or even targeting
children to change parents’ outcomes.
Our review may be limited in selecting only the peer-reviewed studies published in English
and focusing on a narrowly defined category of interventions. Nevertheless, the current review
suggests the interventions that mainly utilize social influence pathways are potentially promising
and offers a template for their mechanisms of impact. Much remains to be understood about the
relative impact of such interventions in comparison with alternatives, and their best study
designs.
2.6 Acknowledgements
We would like to express our sincere gratitude to Kirsten Davison, Nancy Butte, Joanna
Buscemi, and Allison Doub for their feedback and detailed suggestions. We thank Linden Maya
Thayer for her excellent assistance in developing the summary table of the reviewed articles.
Partial financial support for this research was provided through National Institutes of Health
Office of Behavioral and Social Sciences Research and NHLBI, grant 1R21HL113680-01.

28
2.7 References
1. Koehly, L.M. and A. Loscalzo, Adolescent Obesity and Social Networks. Preventing
Chronic Disease, 2009. 6(3).
2. Hammond, R.A., Social influence and obesity. Current Opinion in Endocrinology
Diabetes and Obesity, 2010. 17(5): p. 467-471.
3. Ali, M.M., A. Amialchuk, and F.W. Heiland, Weight-Related Behavior among
Adolescents: The Role of Peer Effects. Plos One, 2011. 6(6).
4. Christakis, N.A. and J.H. Fowler, The spread of obesity in a large social network over 32
years. New England Journal of Medicine, 2007. 357(4): p. 370-379.
5. Burke, M.A. and F. Heiland, Social dynamics of obesity. Economic Inquiry, 2007. 45(3):
p. 571-591.
6. Salvy, S.J., et al., Influence of peers and friends on children's and adolescents' eating and
activity behaviors. Physiology & Behavior, 2012. 106(3): p. 369-378.
7. Pachucki, M.A., P.F. Jacques, and N.A. Christakis, Social Network Concordance in Food
Choice Among Spouses, Friends, and Siblings. American Journal of Public Health, 2011.
101(11): p. 2170-2177.
8. Liao, Y., et al., Which type of sedentary behaviour intervention is more effective at
reducing body mass index in children? A meta-analytic review. Obesity Reviews, 2014.
15(3): p. 159-168.
9. Prince, S.A., et al., A comparison of the effectiveness of physical activity and sedentary
behaviour interventions in reducing sedentary time in adults: a systematic review and
meta-analysis of controlled trials. Obes Rev, 2014. 15(11): p. 905-19.
10. Bahr, D.B., et al., Exploiting Social Networks to Mitigate the Obesity Epidemic. Obesity,
2009. 17(4): p. 723-728.
11. Hammond, R.A. and J.T. Ornstein, A model of social influence on body mass index. Ann
N Y Acad Sci, 2014.
12. Dowda, M., et al., Environmental influences, physical activity, and weight status in 8-to
16-year-olds. Archives of Pediatrics & Adolescent Medicine, 2001. 155(6): p. 711-717.
13. Leahey, T.M., et al., Social Influences Are Associated With BMI and Weight Loss
Intentions in Young Adults. Obesity, 2011. 19(6): p. 1157-1162.

29
14. Marsh, S., et al., Family-based interventions for reducing sedentary time in youth: a
systematic review of randomized controlled trials. Obesity Reviews, 2014. 15(2): p. 117-
133.
15. Anzman, S.L., B.Y. Rollins, and L.L. Birch, Parental influence on children's early eating
environments and obesity risk: implications for prevention. Int J Obes (Lond), 2010.
34(7): p. 1116-24.
16. Evans, A.E., et al., Changing the home nutrition environment - Effects of a nutrition and
media literacy pilot intervention. Family & Community Health, 2006. 29(1): p. 43-54.
17. Gorin, A.A., et al., Weight loss treatment influences untreated spouses and the home
environment: evidence of a ripple effect. Int J Obes (Lond), 2008. 32(11): p. 1678-84.
18. McGarvey, E., et al., Feasibility and benefits of a parent-focused preschool child obesity
intervention. Am J Public Health, 2004. 94(9): p. 1490-5.
19. Janicke, D.M., et al., Sensible Treatment of Obesity in Rural Youth (STORY): Design and
methods. Contemporary Clinical Trials, 2008. 29(2): p. 270-280.
20. Okely, A.D., et al., Multi-site randomized controlled trial of a child-centered physical
activity program, a parent-centered dietary-modification program, or both in overweight
children: the HIKCUPS study. J Pediatr, 2010. 157(3): p. 388-94, 394 e1.
21. Collins, C.E., et al., Parent diet modification, child activity, or both in obese children: an
RCT. Pediatrics, 2011. 127(4): p. 619-27.
22. Dalton, W.T., 3rd, et al., Parent-Led Activity and Nutrition (PLAN) for healthy living:
design and methods. Contemp Clin Trials, 2011. 32(6): p. 882-92.
23. Ostbye, T., et al., Parent-focused change to prevent obesity in preschoolers: results from
the KAN-DO study. Prev Med, 2012. 55(3): p. 188-95.
24. McLeroy, K.R., et al., An ecological perspective on health promotion programs. Health
Educ Q, 1988. 15(4): p. 351-77.
25. Davison, K.K. and L.L. Birch, Childhood overweight: a contextual model and
recommendations for future research. Obes Rev, 2001. 2(3): p. 159-71.
26. Sterman, J., Business dynamics : systems thinking and modeling for a complex world.
2000, Boston: Irwin/McGraw-Hill. xxvi, 982 p.

30
27. Jalali, M., et al. Dynamics of Obesity Interventions inside Organizations. in The 32nd
International Conference of the System Dynamics Society. 2014. System Dynamics
Society.
28. Rahmandad, H. and N. Sabounchi, Building and estimating a dynamic model of weight
gain and loss for individuals and populations. Proceedings from The 29th International
Conference of the System Dynamics Society, 2011.
29. Hu, K., et al., Factors influencing the risk of falls in the construction industry: a review
of the evidence. Construction Management and Economics, 2011. 29(4): p. 397-416.
30. West, F., et al., Randomised clinical trial of a family-based lifestyle intervention for
childhood obesity involving parents as the exclusive agents of change. Behav Res Ther,
2010. 48(12): p. 1170-9.
31. Resnick, E.A., et al., The CHEER study to reduce BMI in Elementary School students: a
school-based, parent-directed study in Framingham, Massachusetts. J Sch Nurs, 2009.
25(5): p. 361-72.
32. Golley, R.K., et al., Twelve-month effectiveness of a parent-led, family-focused weight-
management program for prepubertal children: a randomized, controlled trial.
Pediatrics, 2007. 119(3): p. 517-25.
33. Golan, M., V. Kaufman, and D.R. Shahar, Childhood obesity treatment: targeting
parents exclusively v. parents and children. Br J Nutr, 2006. 95(5): p. 1008-15.
34. Fletcher, A., et al., A randomised controlled trial and mediation analysis of the 'Healthy
Habits', telephone-based dietary intervention for preschool children. International
Journal of Behavioral Nutrition and Physical Activity, 2013. 10.
35. Golan, M. and S. Crow, Targeting parents exclusively in the treatment of childhood
obesity: long-term results. Obes Res, 2004. 12(2): p. 357-61.
36. Magarey, A.M., et al., A Parent-Led Family-Focused Treatment Program for Overweight
Children Aged 5 to 9 Years: The PEACH RCT. Pediatrics, 2011. 127(2): p. 214-222.
37. Boutelle, K.N., G. Cafri, and S.J. Crow, Parent-Only Treatment for Childhood Obesity: A
Randomized Controlled Trial. Obesity, 2011. 19(3): p. 574-580.
38. Moens, E. and C. Braet, Training parents of overweight children in parenting skills: a
12-month evaluation. Behav Cogn Psychother, 2012. 40(1): p. 1-18.

31
39. Janicke, D.M., et al., Comparison of parent-only vs family-based interventions for
overweight children in underserved rural settings: outcomes from project STORY. Arch
Pediatr Adolesc Med, 2008. 162(12): p. 1119-25.
40. Wardle, J., et al., Increasing children's acceptance of vegetables; a randomized trial of
parent-led exposure. Appetite, 2003. 40(2): p. 155-162.
41. Munsch, S., et al., Randomized controlled comparison of two cognitive behavioral
therapies for obese children: mother versus mother-child cognitive behavioral therapy.
Psychother Psychosom, 2008. 77(4): p. 235-46.
42. Janicke, D.M., Treatment of Pediatric Obesity Using a Parent-Only Approach: A Case
Example. Health Psychology, 2013. 32(3): p. 345-350.
43. Haire-Joshu, D., et al., High 5 for Kids: the impact of a home visiting program on fruit
and vegetable intake of parents and their preschool children. Prev Med, 2008. 47(1): p.
77-82.
44. McGowan, L., et al., Healthy feeding habits: efficacy results from a cluster-randomized,
controlled exploratory trial of a novel, habit-based intervention with parents. American
Journal of Clinical Nutrition, 2013. 98(3): p. 769-777.
45. Jansen, E., S. Mulkens, and A. Jansen, Tackling childhood overweight: treating parents
exclusively is effective. International Journal of Obesity, 2011. 35(4): p. 501-509.
46. Epstein, L.H., et al., Increasing fruit and vegetable intake and decreasing fat and sugar
intake in families at risk for childhood obesity. Obes Res, 2001. 9(3): p. 171-8.
47. Golley, R.K., A.M. Magarey, and L.A. Daniels, Children's food and activity patterns
following a six-month child weight management program. International Journal of
Pediatric Obesity, 2011. 6(5-6): p. 409-414.
48. De Bock, F., et al., A participatory physical activity intervention in preschools: a cluster
randomized controlled trial. Am J Prev Med, 2013. 45(1): p. 64-74.
49. Wyse, R., et al., A pilot study of a telephone-based parental intervention to increase fruit
and vegetable consumption in 3-5-year-old children. Public Health Nutrition, 2011.
14(12): p. 2245-2253.
50. Abraham, C. and S. Michie, A taxonomy of behavior change techniques used in
interventions. Health Psychol, 2008. 27(3): p. 379-87.

32
51. Kelman, H.C., Compliance, identification, and internalization: Three processes of
attitude change. The Journal of conflict resolution, 1958. 2(1): p. 51-60.
52. Kelman, H.C., Interests, relationships, identities: three central issues for individuals and
groups in negotiating their social environment. Annu Rev Psychol, 2006. 57: p. 1-26.
53. Golan, M., et al., Parents as the exclusive agents of change in the treatment of childhood
obesity. Am J Clin Nutr, 1998. 67(6): p. 1130-5.
54. Nichols, J.L., Changing public behavior for better health: is education enough? Am J
Prev Med, 1994. 10(3 Suppl): p. 19-22.
55. Birch, L.L. and A.E. Doub, Learning to eat: birth to age 2 y. Am J Clin Nutr, 2014.
99(3): p. 723s-8s.
56. Musher-Eizenman, D. and S. Holub, Comprehensive Feeding Practices Questionnaire:
validation of a new measure of parental feeding practices. J Pediatr Psychol, 2007. 32(8):
p. 960-72.
57. Knowlden, A.P. and M. Sharma, Systematic review of family and home-based
interventions targeting paediatric overweight and obesity. Obesity Reviews, 2012. 13(6):
p. 499-508.
58. Golan, M., et al., Parents as the exclusive agents of change in the treatment of childhood
obesity. American Journal of Clinical Nutrition, 1998. 67(6): p. 1130-1135.
59. Patrick, H. and T.A. Nicklas, A review of family and social determinants of children's
eating patterns and diet quality. Journal of the American College of Nutrition, 2005.
24(2): p. 83-92.
60. Aronson, E., The social animal, Seventh edition. The social animal, Seventh edition.
1995: W. H. Freeman and Co., 37th Floor, 41 Madison Ave., New York, New York
10010, USA; W. H. Freeman and Co. Ltd., 20 Beaumont Street, OX1 2NQ Oxford,
England, UK. xx+515p.
61. Gibson, E.L., et al., A narrative review of psychological and educational strategies
applied to young children's eating behaviours aimed at reducing obesity risk. Obesity
Reviews, 2012. 13: p. 85-95.
62. Summerbell, C.D., et al., Evidence-based recommendations for the development of
obesity prevention programs targeted at preschool children. Obesity Reviews, 2012. 13:
p. 129-132.

33
63. Chartrand, T.L. and R. van Baaren, Human Mimicry, in Advances in Experimental Social
Psychology, Vol 41, M.P. Zanna, Editor. 2009. p. 219-274.
64. van der Kruk, J.J., et al., Obesity: a systematic review on parental involvement in long-
term European childhood weight control interventions with a nutritional focus. Obesity
Reviews, 2013. 14(9): p. 745-760.
65. Baranowski, T., et al., Houston... We have a problem! Measurement of parenting. Child
Obes, 2013. 9 Suppl: p. S1-4.
66. Hughes, S.O., et al., Revisiting a neglected construct: parenting styles in a child-feeding
context. Appetite, 2005. 44(1): p. 83-92.
67. Sung-Chan, P., et al., Family-based models for childhood-obesity intervention: a
systematic review of randomized controlled trials. Obesity Reviews, 2013. 14(4): p. 265-
278.
68. Jull, A. and R. Chen, Parent-only vs. parent-child (family-focused) approaches for weight
loss in obese and overweight children: a systematic review and meta-analysis. Obesity
Reviews, 2013. 14(9): p. 761-768.
69. Yavuz, H.M., et al., Interventions aimed at reducing obesity in early childhood: a meta-
analysis of programs that involve parents. J Child Psychol Psychiatry, 2014.
70. Golley, R.K., et al., Interventions that involve parents to improve children's weight-
related nutrition intake and activity patterns - what nutrition and activity targets and
behaviour change techniques are associated with intervention effectiveness? Obes Rev,
2011. 12(2): p. 114-30.
71. Skouteris, H., et al., Parental influence and obesity prevention in pre-schoolers: a
systematic review of interventions. Obesity Reviews, 2011. 12(5): p. 315-328.
72. Jackson, D., et al., Overweight and obese children: mothers' strategies. Journal of
Advanced Nursing, 2005. 52(1): p. 6-13.
73. Spruijt-Metz, D., et al., Relation between mothers' child-feeding practices and children's
adiposity. The American Journal of Clinical Nutrition, 2002. 75(3): p. 581-586.
74. Khandpur, N., et al., Fathers' child feeding practices: a review of the evidence. Appetite,
2014. 78: p. 110-21.

34
75. Harrison, K., et al., Toward a Developmental Conceptualization of Contributors to
Overweight and Obesity in Childhood: The Six-Cs Model. Child Development
Perspectives, 2011. 5(1): p. 50-58.

35
Chapter 3 - Dynamics of Obesity Interventions inside
Organizations: a Case Study of Food Carry-Outs in
Baltimore
3.1 Abstract
A large number of obesity prevention interventions, from upstream (policy and environmental)
to downstream (individual level), have been put forward to curb the obesity trend; however, not
all those interventions have been successful. Overall effectiveness of obesity prevention
interventions relies not only on the average efficacy of a generic intervention, but also on the
successful Reach, Effectiveness, Adoption, Implementation, and Maintenance (RE-AIM) of that
intervention. In this study, we aim to understand how effectiveness of organizational level
obesity prevention interventions depends on dynamics of AIM. We focus on an obesity
prevention intervention, implemented in food carry-outs in low-income urban areas of Baltimore
city, which aims to improve dietary behavior for adults through better food access to healthier
foods and point-of-purchase prompts. Building on data from interviews and the literature we
develop a dynamic model of the key processes of AIM. We first develop a contextualized map of
causal relationships integral to the dynamics of AIM, and then quantify those mechanisms using
a system dynamics simulation model. With simulation analysis, we show how as a result of
several reinforcing loops that span stakeholder motivation, communications, and implementation
quality and costs, small changes in the process of AIM can make a big difference in impact. We
present how the dynamics surrounding communication, motivation, and depreciation of
interventions can create tipping dynamics in AIM. Specifically, small changes in allocation of
resources to an intervention could have a disproportionate long-term impact if those additional
resources can turn stakeholders into allies of the intervention, reducing the depreciation rates and
enhancing sustainability. We provide researchers with a set of recommendations to increase the
sustainability of the interventions.
Keywords: Obesity prevention interventions, dissemination and implementation, motivation,
communication

36
3.2 Background
In the United States, obesity has been recognized as a major public health challenge for over two
decades. Two-thirds of the adults and one third of the children are either overweight or obese [1,
2]. Excess weight is associated with many leading causes of morbidity and mortality, including
increased risk for type II diabetes, hypertension, stroke, arthritis, and certain cancers, as well as
all-cause mortality [3, 4].
At its core, obesity is the result of imbalance of energy intake and energy expenditure in the
body, yet multiple factors, from individual biology [5], to built environment [6-8], social
environment [9, 10], and economics [11, 12] interact to determine individual energy intake and
expenditure. Consistent with this socio-ecologic framework [13], a large number of
interventions, from upstream (policy) to downstream (individual level), have been put forward to
curb the trend (e.g., see [14-16]). However complexity of the obesity problem makes it
challenging to design and the implement successful prevention interventions [17].
Although there is a large and growing literature documenting potentially effective
interventions, this literature often focuses on well-supported and thus more successful instances
of various interventions. Yet, in assessing the potential real-world impact of an intervention
much depends on the fraction of instances where the implementation is successful, and sustained.
The variation in the successful implementation and maintenance of interventions depends, partly,
on the organizational dynamics unfolding during and after the implementation of an intervention
[18]. The overall goal of this paper is to enhance our understanding of organizational dynamics
that impact the effectiveness of obesity prevention interventions. Through case-based modelling
this study contributes to our understanding of the dynamics of program adoption,
implementation, and maintenance and thus helps explain why some instances of an obesity
prevention and treatment program prove more effective than others. Specifically, we show how
small changes in an intervention can make the difference between failure and success and make
the interventions sustainable.
3.2.1 Obesity prevention interventions
Interventions translate theoretical research findings into practical procedures to improve health
outcomes based on known causal mechanisms related to the outcome of interest [19]. Obesity is
largely the result of life styles that promote unhealthy eating and limited physical activity.

37
Therefore, intervention strategies are moving upstream, with an aim to modify the
organizational/community settings in which individuals live, study, and work, in order to limit
individuals’ exposure to obesogenic environments and facilitate healthier choices [20-22].
Obesity prevention interventions vary in the populations they target, the organizations they
involve, the resources they require, and their mechanisms of impact; yet many of them share the
need to bring together multiple stakeholders to implement new processes and routines within
specific organizational and community contexts. The multi-stakeholder, organizationally
complex nature of these organizational interventions distinguishes them from individual-level
interventions. The real-world effectiveness of organizational interventions depends not only on
the “Efficacy” of the intervention in an idealized setting, but also on how well each instance of
the intervention (i.e., each program) “Reaches” the right population, is “Adopted” by the relevant
stakeholders, is “Implemented” in the organizational setting, and is “Maintained” over time to
maximize the overall program effectiveness (the RE-AIM framework [23]). In fact, a review of
the published literature from 1999 to 2010 [24] finds that obesity and physical activity
interventions are among the most frequent users of the RE-AIM framework.
3.2.2 Dynamics of adoption, implementation, and maintenance
A key feature of the RE-AIM framework is the shift from short term efficacy to longer-term
effectiveness [25-27]. Efficacy is a measure of how the intervention performs under ideal
conditions, while effectiveness is a measure of how an intervention performs under real-world
conditions [25]. The efficacy of many lifestyle interventions aimed at obesity and related chronic
diseases such as diabetes is well established [28]. Overall effectiveness of these interventions,
however, relies not only on the average efficacy of the intervention, but also on the successful
Adoption, Implementation, and Maintenance (AIM) of each instance of that intervention (i.e.,
each program or organizational level policy change) within the responsible organizational and
community context [29]. In practice, much variability in overall effectiveness of interventions
arises from variations in AIM. Evidence from a few controlled trials of multiple programs of the
same intervention suggests significant variations across programs are common [30, 31].
Figure 3-1 reflects how multiple instances of the same intervention (i.e., same inherent efficacy)
applied to similar population groups (i.e., similar reach) can show different trajectories of overall
effectiveness due to their varying levels of AIM.

38
Figure 3-1. Potential program impact trajectories
For example, one can imagine differences in the implementation process that lead one
organization to receive early technical assistance while the other receives none. In the absence of
that support, the second program fails to develop the required knowledge and capabilities, does
not receive any positive feedback from its effort, and thus builds little motivation to be
maintained by organizational stakeholders. Such mechanisms could lead to significantly diverse
results across different instances of AIM for the same intervention. Understanding the sources of
variation in AIM is therefore central to enhancing the effectiveness of existing interventions and
designing more effective new interventions.
Common effectiveness research methods, such as randomized controlled trials (RCTs),
usually focus on measuring efficacy and therefore try to minimize the program variations across
AIM by selecting motivated, resource rich, and well-trained organizational participants.
Therefore, by design, RCTs may indeed exclude from analysis the very factors that explain
important variations in actual effectiveness of different programs [32-34]. These shortcomings
have motivated recent interest in more holistic frameworks to evaluate interventions on
dimensions other than efficacy alone (e.g., see [35-39]). Even though there have been several
models and frameworks for implementation of obesity prevention interventions, existing
research does not capture the feedback loops between key variables in the system and does not
attempt to quantify the key mechanisms of AIM.
Partially Successful
Time
Imp
act
Imp
lem
enta
tio
n S
tart
Fully Successful
Maximum Potential Impact
Start and Fizzle

39
AIM is a dynamic process that engages multiple stakeholders with different motivations and
perspectives in an interactive process of decision making, action, and learning [40]. Variations in
effectiveness could partly be explained by how these dynamics unfold differently across multiple
programs due to different institutional arrangements, resources, and path dependencies. This may
be part of the explanation why the multitude of policies and interventions aimed at reducing
obesity have so far failed to curb the increasing trends [41].
3.2.3 Building on the organization behavior and strategy literature
One innovative feature of this study is that it draws on theories in organization behavior and
strategy to study the effectiveness of chronic disease interventions. Strategy literature has found
the differences in configurations of organizational resources as what explains much
heterogeneity in organizational performance [42-44]. Getting to successful configurations of
resources is a complex process fraught with many pitfalls, in which some organizations succeed
while others fail [45-47]. Building on strategy literature, we look for organizational resources
and capabilities which are instrumental in AIM processes of obesity prevention interventions.
A second insight from the organizational literature involves the dynamic trade-offs in
building alternative resources. These trade-offs increase the failure risk in many settings [48].
For example, organizations are susceptible to focusing on doing what they know best and
ignoring new emerging opportunities [49, 50]. They also routinely under-value investments with
long-term payoffs [51, 52]. For instance, empirical studies provide strong support for many of
quality and process improvement programs [53, 54], yet organizations often fail to fully realize
these benefits because resources are withdrawn from the program before full results are
observed, initial enthusiasm overwhelms the training capacity to keep the program effective, or
seeking short-term gains the system is overloaded with demand and is pushed into a firefighting
mode of operation [55-58]. Similar to quality and process improvement initiatives, many health
care interventions may be beneficial over long run, but require initial investments and delays
before benefits materialize. Therefore, here we ask: What are the mechanisms for building and
sustaining the resources central to an intervention’s effectiveness? What are the common failure
modes that derail successful development and maintenance of those resources? What are the
main leverage points to increase success chances in a program’s life-cycle?

40
Third, by explicitly considering the AIM of programs, this study builds on the current public
health intervention assessment methods such as RE-AIM [23, 59-61], yet goes beyond those by
using dynamic modelling to study dynamics of program success and failure. This perspective,
combined with model-based experimentation, allows us to develop more holistic theory, evaluate
existing and new programs and provide more operational recommendations.
3.2.4 Dynamic modelling and endogenous perspective
We develop a dynamic model to understand how effectiveness of organizational level obesity
prevention interventions depends on the endogenous dynamics of AIM. Dynamic modeling and
simulation is a potential tool to understand the complexity of a system and is increasingly used in
the public health in general and obesity literature in particular [62-69]. Dynamic simulation
models often take an endogenous perspective: they focus on the interactions among concepts
within the boundary of the system that lead to behaviors we are interested to understand. This
focus does not negate the importance of exogenous drivers of behavior, but is motivated by three
considerations [70]: First, endogenous perspective often provides a richer understanding of the
phenomenon, because it does not pass down the explanation to external factors. Second,
endogenous perspective brings to the forefront the interactions among various stakeholders that
relate to success and failure of AIM, and thus informs modifications that should be sought in
response to various signals in the process of implementing and sustaining an intervention.
Finally, endogenous dynamics allow us to tease out how otherwise similar organizations can
move to different outcomes, a major focus in our study of AIM. In our context, the value of
simulation is not to produce specific predictions, but to provide a range of likely scenarios and
insights into what dynamics drive those scenarios [18]. Simulation modeling enforces internal
consistency in the resulting explanations and allows for quantitative analysis of various trade-
offs. In fact, such models could be used as training micro-worlds [71] to enhance stakeholders’
mutual understanding, commitment, and skills in successfully implementing and maintaining an
intervention. We develop a dynamic model based on a pilot environmental intervention,
Baltimore Healthy Carry-outs (BHC) which is described next.
3.2.5 Case study, a food environment intervention
The BHC intervention was designed and conducted in food carry-outs in low-income
neighbourhoods of Baltimore (median household income about $20,000 [72]), where fast food

41
and carry-out restaurants are the main prepared food sources [73, 74]. The carry-outs are similar
to fast-food restaurants but have different physical layouts. They often store, cook, and sell foods
behind floor-to-ceiling glass partitions. Many owners may speak English as a second language.
Consequently, customers do not interact much with the storeowner or the seller. Storeowners
usually know what foods are popular and adjust their menu accordingly. Customers often do not
have many healthy options or the choice to request a customized healthier meal [72].
The scope of the BHC intervention was to design the following strategies: improving menu
boards and labelling to promote healthier items, promoting healthy sides and beverages,
introducing new items, and introducing healthier combo meals [75]. It was implemented by
researchers from Johns Hopkins University in a controlled trial across four carry-outs which
were compared against four matching control carry-outs.
3.3 Methods
In this section we discuss the data collection, data analysis and modelling that are the main
components of our research method. Progress on these steps was iterative in nature, as, for
example, preliminary analysis exposed new data needs. We present the model and simulation
analysis in the Results section.
3.3.1 Data collection
Data was collected through interviews with the key stakeholders in two of the intervention carry-
outs after the original intervention implementation had ended. We selected two carry-outs with
different levels of success with implementing the BHC intervention. Variations across the cases
offer useful insights into how AIM processes can diverge.
We interviewed the lead interventionist and two of the carry-out owners in Baltimore city
that had participated in the intervention. We also interviewed two experts from the Baltimore
City Planning Department (the two experts were familiar with the food environment in Baltimore
and the BHC intervention). Some stakeholders were interviewed more than once. Interviewers
began with four key questions and probed further [76, 77]: Did the intervention work? Under
what circumstances did the intervention work (or did not work)? How did the intervention work?
For whom did the intervention work? Additional questions covered various related categories
including program history, initial steps in implementation, communication among stakeholders,

42
trust, motivation, post-implementation processes, outputs, financial matters, and success and
failure instances. Interview data was augmented by archival data and reports from the original
implementation of the intervention.
3.3.2 Data analysis and modelling
The goal of analysis was to weave together the case study data into a dynamic model that
provides a picture of dynamics relevant to AIM of interventions in the BHC and beyond. All
interviews were coded to extract 1) key concepts related to perceived intervention effectiveness;
2) mechanisms of AIM; 3) time-line of events within a program; and 4) quantitative metrics
where available.
The coded interviews were then combined and synthesized with the archival and
observational data based on their common themes to identify the causal mechanisms likely
relevant to the dynamics of AIM. This synthesis generated a set of dynamic hypotheses, also
called a causal loop diagram, that provides a qualitative overview of the potentially relevant
mechanisms. Next, these dynamic hypotheses were refined through additional data collection
and building of a simulation model. First, we conducted four interviews with an interventionist,
the lead interventionist, and the two Baltimore city experts to get their feedback on the
qualitative model draft and elicit further insights and estimates for some of the parameters
needed for quantifying the model.
The next step of analysis entailed quantifying these mechanisms into a detailed simulation
model. Quantification of the causal loop diagrams into a simulation model provides a few
concrete benefits. First, it enforced internal consistency in conclusions drawn from a complex
web of causal pathways, a task our brains are not well-equipped to do without the assistance of
computational tools [78-81]. Moreover, quantification allows us to assess the plausibility of
various dynamic hypotheses, narrowing down a more complex set of hypotheses to the ones
more likely to play a role in actual case histories. Building of the simulation model was also
assisted by the previous literature on the intervention as well as broader literature on modelling
organizational dynamics (e.g., [56, 82, 83]). These sources are especially useful for quantifying
key metrics such as efficacy and organizational decision making parameters, as well as process
and timeline of interventions. The modelling process included iterations between refining the
mechanisms captured qualitatively and quantifying and simulating those mechanisms.

43
In this study, we focus on the sustainability of the intervention components as the main
measure of success, while we acknowledge other aspects (e.g., effectiveness and costs-benefits)
are relevant to defining success. We note that the BHC intervention components had a positive
impact on the healthy food sales and as a result the intervention should be considered potentially
efficacious [84]. Our focus on AIM dynamics allows us to better understand the mechanisms that
would impact the ultimate effectiveness of the BHC and similar programs.
3.4 Results
In this section, we present the core mechanisms of the model developed based on the data
gathered from the interviews and other data sources. Given the limited space, we first provide a
brief overview of the two cases, specifying the basic modes of behavior our modelling work
elaborates on. We then demonstrate the feedback loops relevant to modelling AIM that were
explicated in the analysis process. These feedback loops were identified as the most important
mechanisms after simulating a larger set of hypotheses in our computational model. Next, we
show simulation results that demonstrate the key outcomes of the hypothesized mechanisms and
offer insights into the sources of variation in AIM. Additional details including the full
simulation model are provided in an online appendix. In presenting the mechanisms, we draw on
the BHC examples, but provide a more generic terminology and discussion to highlight the
transferability of the insights to other interventions that include multiple stakeholders. After
discussing the key feedbacks we present some simulation analysis.
3.4.1 Key feedback mechanisms
Intervention components, implementation and motivation- An interventions can be seen as a
project with a deadline, comprised of various components. Execution of these components, such
as designing and installing a new menu board, informs the progress of implementation phase and
depends on the time allocated to implementation by the interventionists, the quality of their
effort, and the motivation of carry-out owners to actively contribute to the intervention. In fact,
in the absence of any cooperation by carry-out owners, no implementation is feasible. Figure 3-2
summarizes these mechanisms, showing in a box the stock1 of “Implemented Components” that
grows with the valve-like flow variable “Implementation rate”. In the BHC intervention,
1 A stock variable represents accumulations and sources of inertia in a system.

44
interventionists emphasized building rapport with carry-out owners and making changes that
place minimal burden on the staff to maintain the motivation of stakeholders when implementing
the intervention.
The first feedback loops in our setting emerge when we consider the impact of implemented
components on the carry-out operations. Some components may lead to new costs, e.g., for
acquiring healthier ingredients and finding new suppliers. Benefits may also ensue, including
financial benefits due to increased sales or incentives for participation in the study, reputational
benefits, and the personal satisfaction of making a contribution to community health. One carry-
out owner elaborates:
“There was some personal satisfaction, since some customers could’ve thought that our
carry-out is a pretty clean/good carry-out, seeing that we were participating in a research study.
So that was beneficial for me.”
An increase in motivation due to observation of such benefits can lead to further
implementation of components, and thus even more benefits, in a reinforcing process
(Figure 3-2, reinforcing loop 1 (R1)). On the other hand, if the carry-out owner perceives the
costs to exceed those benefits, then a balancing loop may dominate which reduces motivation in
response to progress, and slows down further implementation (Figure 3-2, balancing loop 1
(B1)). An intervention that, in net, does not benefit the carry-out owner, has little chance of
successful implementation, let alone maintenance. Yet, even objectively beneficial interventions
may not succeed. When it comes to the relative strength of these two loops, perception is more
important than facts. For example, in one of the carry-outs, we noticed that the perception of the
owner did not match the analysis of sales data: sales data tracked by the interventionist showed
significant benefits as a result of the intervention but the owner had come to believe the opposite.

45
Figure 3-2. Effect of costs and benefits on motivation. Successful implementation depends on the competition between a reinforcing loop (R1: Seeing the Impact) and a balancing loop
(B1: Costly Program). If R1 dominates, successful implementation is possible.
Design quality and communication among stakeholders- Design quality is an important
aspect of any intervention. A well-designed intervention is less costly to carry-out owners, may
include more benefits, and would be easier to implement and maintain. The quality of design
partially depends on the skills and knowledge of the interventionist, which was high in the BHC
case. Moreover, the intervention should be customized based on the characteristics of each
program, and that requires ample communication between the interventionist and the carry-out
owner. Carry-out owner’s motivation was a major determinant of their availability for
communication, and in the BHC case the owners started with high-levels of motivation. For
example, initially the BHC interventionists wanted to refer to new items on the menu as
“Healthy”, yet carry-out owner feedback suggested that the term Healthy is not appealing in the
community, and “Fresh” was chosen instead. On the other hand, design problems that are not
fixed can lead to various issues in implementation and hurt the motivation of stakeholders. For
instance, adding watermelons to the menu during the summer was one of the intervention
components and sales data suggested it was profitable [84]; however, it resulted in trash removal
problems for the carry-out owner which led to the scrapping of this component: “in the case of
the watermelons, during the summer time, even if we wanted to sell those, a lot of garbage would
come out of it. Here in [this area of] Baltimore City, there isn’t a place to throw garbage. You
can’t put a garbage can outside.”
Implemented
ComponentsImplementation
rate
+
Motivation of
stakeholders
+
B1
Costly program
Perceived
Benefits+
Cost to
owner
+
-
R1
Seeing
the Impact
Interventionist time
on implementationInterventionist quality
++

46
Taken together, communication and design quality create another reinforcing loop
(Communication Helps Design, (R2), in Figure 3-3): increased motivation facilitates better
communication, which improves design and keeps the stakeholders motivated. Reinforcing loops
can amplify small differences between two programs: if one, by chance, faces an early design
problem, that can reduce motivation and communication, and saw the seeds of future problems.
Figure 3-3. Effect of motivation of stakeholders and communication among stakeholders on
design quality. Small problems in design can lead to loss of motivation, reduced communication, and more design problems as implementation
progresses.
Note that motivation is also impacted by other factors such as individual knowledge and
beliefs about the intervention and self-efficacy to carry out the intervention [85]. While such
characteristics have a potential impact on motivation, we do not explicitly include them in our
discussion of endogenous mechanisms because they usually do not dynamically change as part
of the AIM processes.
Implemented
ComponentsImplementation
rate
Design Quality
+
Motivation of
stakeholders
+
+
+
Communication
helps design
R2
B1
Costly program
Communication
among stakeholders
+
Perceived
Benefits+
Cost to
owner
+
-
Quality of
Interventionist Effort
+
R1
Seeing
the Impact

47
Intervention maintenance - Intervention maintenance is possibly the most challenging but least
measured dimension of the AIM [25]. Long term impact of many interventions cannot be fully
assessed due to limited follow up horizons for collecting maintenance data, especially in
community-based interventions [86]. Interventions are not maintained when their components
deteriorate, depreciate, or are otherwise scrapped, and are not renewed. From wear and tear of
signs and menus, to changes in prices that may reduce the attractiveness of “fresh” items, these
depreciation processes continually reduce the number of ‘Implemented Components’. Yet, the
depreciation rate is also endogenous, as it depends on motivation, communication, and design
problem (Figure 3-4). Communication can help remind the stakeholders about the need for
sustaining changes and fixing emerging problems. High quality of designs foresees, and corrects
for, the most common modes of failure and thus includes lower baseline depreciation rates.
Finally, we find that motivated stakeholders are more likely to sustain the changes without
external prompts. These mechanisms create three additional reinforcing loops, as successful
implementation raises motivations, improves communication, and design, and thus allows for
sustaining the gains more effectively.
The feedback loops we discussed summarize the key endogenous mechanisms we found
relevant in understanding the dynamics of AIM in our case study. However, a fully operational
simulation model of the AIM dynamics required us to include additional detail in specifying each
mechanism quantitatively and include various exogenous drivers, such as the amount of
interventionist time available to the intervention. Given the limited space here, in an online
supplement we provide a fully documented model that follows a set of minimum reporting
requirements [87].

48
Figure 3-4. Mechanisms affecting the maintenance of interventions. The depreciation rate is influenced by motivation, design quality, and communication, creating three additional reinforcing loops
that can drive a wedge between successful and unsuccessful maintenance of programs.
3.4.2 Building confidence in the model
Any model is a simplification of reality, and as such it should be tested for its usefulness for the
purpose of the modelling project. We conduct various tests to build confidence in the usefulness
of our model in understanding the endogenous dynamics of AIM. First, structure and behavior
validity tests were conducted [88]. Mechanisms represented in the model were confirmed in
interviews with the stakeholders including interventionists and experts from the Baltimore City
Planning Department. In formulating each equation, we test it against different input values to
ensure it represents the logic portrayed in the data [89], and is robust in extreme conditions. Unit
consistency was also enforced in model equations. Extreme condition tests were then conducted
to reveal subtle flaws which are not easy to capture by direct inspection or baseline behavior
[70]. These tests specify expected model behaviors under extreme conditions not seen in the field
Implemented
ComponentsDepreciation
rateImplementation
rate
Design Quality
+
Motivation of
stakeholders
+
+
+
Communication
helps design
R2
B1
Costly program
Communication
among stakeholders
+
Perceived
Benefits+
- - -
R2
R3
Maintenance
reminders
Designed
not to last
Cost to
owner
+
-
R4
Left to die
Quality of
Interventionist Effort
+
R1
Seeing
the Impact

49
data, e.g., if motivation of stakeholders is zero, no intervention components should be
implemented, or if the quality of effort of interventionists is at the maximum possible level and
communication among stakeholders is sufficient, there should few design problems. Behavior
reproduction tests were used to assess model’s ability to reproduce the key reference modes
observed in various cases and helped build further confidence in model’s usefulness [90]. While
these tests provide some confidence in the qualitative insights generated from our cases, the
purpose of this study is building theory. Therefore, in the absence of detailed quantitative data
for a larger number of cases, one should be cautious about generalizing the findings or seeking
operational advice from our model.
3.4.3 Simulation analysis
Our simulation results point to a nonlinear dynamic with potentially important implications
for understanding variations in AIM. Specifically, we find that small differences in allocation of
interventionist resources to design, implementation, or communication can lead to significant
differences in AIM outcomes. To demonstrate, consider two identical organizations with
identical interventions, composed of various components (e.g., improving menu boards,
introducing healthier combo meals, and identifying fresh items on the menu). The only
difference between the two simulated organizations is the amount of interventionist time
allocated to each, which is 8% higher in one case. The project’s adoption, implementation, and
maintenance unfold over multiple months: during the first year the focus is on the design of the
intervention, the next seven months are mostly focused on implementation, and then the
sustainability of the intervention is measured once the interventionists largely leave the scene,
offering only some follow up time afterwards. Figure 3-5 (A) shows our main outcome variable,
the number of intervention components effectively at work in the simulated organizations. This
number is zero for the first months as much of the effort goes into designing the intervention.
Implementation starts after about 10 months and speeds up to completely unroll the intervention
(i.e., implement its 20 components2) by month 19. By this time, both simulated organizations
show a solid implementation, and if they were actual organizations, they would likely be
considered success stories for this intervention. However, what happens afterwards, i.e.,
2 The number of components can vary to scale the size of the intervention against resources and other constraints,
the number 20 is somewhat arbitrary, and is only chosen to be consistent with the overall timeline of the cases.

50
maintenance, is key to the long-term effectiveness of each program, and here a small difference
in the resources allocated by the interventionist makes a huge difference. One organization keeps
most of the components in place, while the other gradually loses most of the components. Why
would a small difference (allocation of 8% more interventionist during implementation and
maintenance phases) have such a major impact?
Early on, the design and implementation processes unfold almost identically for both
organizations, and both have enough resources and support to complete the tasks on schedule.
The differences become visible only in the maintenance phase. Once implemented, the
components are subject to depreciation, for example, menu boards may fall and not be replaced
and healthy items may be dropped from the offering. The rate at which such deterioration
happens, and the speed with which the required fixes are applied (or ignored) distinguish
between organizations that maintain the intervention in the long-run and those that revert back to
the old ways of doing things.
A few reinforcing loops are essential for explaining the observed differences in depreciation
and re-implementation rates. First, “R2-Maintenance Reminders” highlights the importance of
continued communication between interventionists and organizational stakeholders. While the
effort needed for keeping this communication is modest, it does provide reminders and support
for keeping the depreciation rates low, e.g., by fixing any emerging problems before they lead to
complete loss of a component. Low depreciation, in return, allows for keeping the intervention at
its most efficacious state. The intervention thus shows more benefits to the organization,
motivates the stakeholders (e.g., carryout owners) to keep the communication up with the
interventionists, and thus maintains the program in a desired state. On the other hand, a shortfall
in communication early after the end of implementation phase can increase the depreciation rate,
reduce the components standing, cause disillusionment with the program, and further cut down
on communication. A similar mechanism unfolds in “R4-Left to die”, as lost motivation
increases depreciation, reduces the success of the program, and thus further erodes the
motivation of organizational stakeholders. The third feedback loop connects motivation and
communication: a shortfall in communication erodes motivation; that will then require even
more communication for fixing task-related issues as well as rebuilding the interpersonal trust
and collaborative atmosphere. As a result, the current communication levels fall even further
behind what is required, completing a vicious cycle. As these loops take over the dynamics, the

51
unlucky organization falls behind, requires even more time from the interventionist for fixing the
problems, which leaves even less time for communication, further strengthening the feedback
loops that are affected by the sufficiency of communication. After a few months, the gap
between the two otherwise similar organizations becomes very wide and the chances of reviving
the intervention in the unsuccessful program remote.
In our simulation experiment the initial shortfall in communication is triggered by slightly
less interventionist time available after implementation is complete (4.8 vs. 5.2 hours per month).
However, this small shortfall is amplified through the feedback loops above, leading to the
widely different outcomes at the end. Interestingly, for a little while after the completion of
implementation phase, the organization with lower interventionist time seems to do even better,
because lower communication translates into less cost for the organization, making the
intervention even more appealing as long as little depreciation has happened. The real costs are
only revealed once the depreciation requires more interventionist time for fixes and thus reduces
the sufficiency of communication below acceptable levels.
Note that the exact numbers generated in our simulations are not consequential for the main
qualitative finding, that dynamics of AIM include a tipping point which leads to widely different
outcomes for small changes. Lack of attention to the underlying dynamics can lead to erosion of
an intervention after it was implemented in a vicious cycle of lower motivation and
communication, faster erosion, and thus less beneficial intervention. For the intervention to
work, a minimum level of communication should be maintained throughout, so that motivation is
above a threshold that allows for active support of the implemented components by the owner.
Such support will then slow down the erosion of the existing components after the active
implementation phase is over, thus significantly reducing the ongoing costs of restoring the
implemented components. This allows the owner and the interventionists to sustain the
intervention with limited investment, while keeping up the beneficial impacts, maintaining
motivation, and thus locking the system in a fortunate alternative equilibrium (see Figure 3-5).

52
Figure 3-5. Implemented components (A), communication sufficiency (B), motivation of
stakeholders to implement (C), and perceived benefits (D).
Baseline (blue line) is based on 24 hours effort of interventionists per month. More effort (red line) is based on 26 hours effort of interventionists per month. The big difference between the outputs of these two scenarios relates to the tipping threshold, e.g., a
level of interventionists’ efforts that once exceeded causes a sustained intervention. Dmnl: Dimensionless.
(A)
(B)
(C)
(D)

53
3.5 Discussion
Overall, transporting interventions from laboratory settings to community settings is challenging.
When the implementation of interventions fails, it is important to know whether the failure
occurred because the intervention was not successfully implemented or if it was ineffective [91].
In many cases, in fact, intervention is theoretically effective but not properly implemented and
maintained. In this study, we developed a system dynamics model of the BHC intervention
showing how the dynamics surrounding communication, motivation, and depreciation of
interventions can create tipping dynamics in AIM. Specifically, small changes in allocation of
resources to an intervention could have a disproportionate long-term impact if those additional
resources can turn stakeholders into allies of the intervention, reducing the depreciation rates and
enhancing sustainability.
The model we develop is stylistic and simple. Real world interventions include many subtle
variations and building a fully calibrated model may not be feasible due to data limitations, or
may only be viable after the intervention has fully unfolded and the opportunity to improve the
situation is lost. Yet our simple model provides a few ideas to help monitor and improve the
design and implementation of interventions in order to avoid the dynamics that lead to poor long
term maintenance of interventions. Specifically, we found that the quality of the intervention
design plays a key role throughout the process. Reviews of research show that health
interventions that are designed based on theory or theoretical constructs are more effective that
those lacking such foundation [92]. Lack of theoretical and practical bases (or poor choice of
theory [93]) in the design process leads not only to the ineffectiveness of the innovations in the
intervention but also to the ineffectiveness of the implementation process [94, 95]. We showed
that a well-designed intervention sustains stakeholder motivation and limits later deterioration;
therefore, changes that increase the quality of original design are critical for the long-term
success of AIM. Those changes could include the use of more skilled and situationally informed
interventionists. They could also include more communication early in the design process with
key stakeholders to iterate on the elements of the intervention and to foresee and fix potential
problems and gain stakeholder buy in.
Another area for improvement is monitoring of stakeholder motivation. This variable plays a
key role in the tipping dynamics we identify, if it goes below a threshold, the intervention will

54
become exceedingly costly to maintain. Interventionists should be as sensitive to this motivation
level as to the design and implementation of tasks. Intervention design steps may also need to
include components that explicitly boost motivation. Again, communication plays an important
role in enhancing stakeholder motivation, and thus needs to be prioritized.
Interventionists need to be sensitive to financial or other incentives that stakeholders value,
and incorporate them in the design of the intervention to increase the chances that once
implemented, the intervention can cross the self-sustaining threshold. For example, in the BHC
intervention, certificate from the mayor and the city of the Baltimore was a successful practice.
One of the carry-out owners mentioned: “According to them [interventionists], the certificate
was for my contribution to the community with my food. Food that was fresh and good for the
community. That made me feel good when I didn’t feel like I wasn’t doing that well. It’s not
really about the money to me. I get a lot out of just spending time for a lot of people, finding jobs
for people. I like to provide. This is right up my alley. To be recognized for my contribution to
the community was really good.”
In addition, finding different mechanisms to motivate stakeholders, especially in the middle
of the process (after early honey-moon and before they see the actual benefits) can help. These
mechanisms can be frequent site visits by interventionists, asking about ongoing problems and
coming up with solutions before tasks are abandoned, and providing data on the benefits (and
setting up measurement procedures to track benefits from early on).
A third leverage point is how the design influences intervention depreciation rates.
Intervention components that can easily become part of the daily routines in an organization
(such as the menu board in the BHC intervention which require limited attention for the
maintenance) are much easier to sustain than those that will require conscious and constant
attention (such as restocking of baked chips). If organizational routines are to be changed as part
of the intervention, structures such as physical layout, supply chains, and decision making
processes should be thought through and explicitly designed so that they are consistent with the
changes in the core organizational routines. Inconsistencies in those arrangements are likely to
increase the speed of depreciation of implemented components and diminish motivation over
time. The implementation process should also focus on training and empowering organizational
stakeholders so that they will appreciate and maintain the components in the absence of the

55
interventionist. Only when the new routines are fully integrated in the organizational culture and
processes, can one expect long term sustainment of new interventions.
A common trade-off that our model highlights is the trade-off between designing and
implementing intervention components vs. communicating with stakeholders to help build
confidence and improve the quality of the intervention. Given that many interventionists are
more familiar with the former, there may be a built in bias in the AIM processes against adequate
investment in the communication processes central to AIM dynamics. Overcoming that bias and
tuning communication levels to address both the motivation and the quality considerations is an
important leverage point for training successful interventionists.
This research provides preliminary evidence on tipping dynamics in health intervention
design, implementation and maintenance. The research can be extended in several directions.
Closer integration of quantitative data with the model will enhance confidence in the results.
Findings could also be expanded by creating a clear set of recommendations to enhance
interventions similar to the BHC intervention. More specific monitoring and performance
evaluation metrics could be developed and integrated into protocols for design and
implementation of interventions so that corrective action can be taken based on signals observed
in each case. Dissemination of a successful intervention design in different organizations may
include some interesting dynamics that go beyond the scope of the current paper but are
important for overall effectiveness of health interventions. Future case studies could also explore
these dynamics in other interventions and organizational settings, expanding the empirical basis
for the dynamics, introducing new mechanisms, and offering testing grounds for implications of
this research. Large scale studies may also use data from larger intervention programs to assess
outcomes based on more nuance models that capture the dynamics we discuss explicitly. Despite
these limitations, we hope the current study provides a first step towards better understanding
organizational interventions that target the prevention of obesity and other chronic conditions.
3.6 List of abbreviations
RE-AIM: reach, effectiveness, adoption, implementation, and maintenance. AIM: adoption,
implementation, and maintenance. RCTs: randomized controlled trials. BHC: Baltimore healthy
carry-outs. R loop: reinforcing loop. B loop: balancing loop.

56
3.7 Acknowledgements
Financial Support Provided through National Collaborative on Childhood Obesity Research
(NCCOR) Envision’s Comparative Modeling Network (CompMod) program and NIH Office of
Behavioral and Social Sciences Research (OBSSR) grant 1R21HL113680-01.

57
3.8 References
1. Schiller, J.S., et al., Early release of selected estimates based on data from the January-
September 2004 National Health Interview Survey. 2005, National Center for Health
Statistics. .
2. Ogden, C.L., et al., Prevalence of overweight and obesity in the United States, 1999-
2004. Jama-Journal of the American Medical Association, 2006. 295(13): p. 1549-1555.
3. Must, A., et al., The disease burden associated with overweight and obesity. Jama-
Journal of the American Medical Association, 1999. 282(16): p. 1523-1529.
4. Calle, E.E., et al., Overweight, obesity, and mortality from cancer in a prospectively
studied cohort of US adults. New England Journal of Medicine, 2003. 348(17): p. 1625-
1638.
5. Haemer, M., T. Huang, and S. Daniels, The effect of neurohormonal factors, epigenetic
factors, and gut microbiota on risk of obesity. Preventing Chronic Disease, 2009. 6(3).
6. White, M., Food access and obesity. Obesity Reviews, 2007. 8: p. 99-107.
7. Epstein, L.H., et al., A randomized trial of the effects of reducing television viewing and
computer use on body mass index in young children. Archives of Pediatrics & Adolescent
Medicine, 2008. 162(3): p. 239-245.
8. Jones, A., et al., Tackling obesities: future choices — obesogenic environments —
evidence review. 2007, Government Office for Science, Foresight Programme: London
(GB).
9. Adams, A.K., R.A. Quinn, and R.J. Prince, Low recognition of childhood overweight and
disease risk among Native-American caregivers. Obesity Research, 2005. 13(1): p. 146-
152.
10. Adam, T.C. and E.S. Epel, Stress, eating and the reward system. Physiology & Behavior,
2007. 91(4): p. 449-458.
11. Darmon, N., E. Ferguson, and A. Briend, Do economic constraints encourage the
selection of energy dense diets? Appetite, 2003. 41(3): p. 315-322.
12. Drewnowski, A. and N. Darmon, The economics of obesity: dietary energy density and
energy cost. American Journal of Clinical Nutrition, 2005. 82(1): p. 265s-273s.

58
13. Institute of Medicine (U.S.). Committee on Prevention of Obesity in Children and
Youth., et al., Preventing childhood obesity : health in the balance. 2005, Washington,
D.C.: National Academies Press. xix, 414 p.
14. Campbell-Scherer, D.L., et al., Implementation and evaluation of the 5As framework of
obesity management in primary care: design of the 5As Team (5AsT) randomized control
trial. Implement Sci, 2014. 9: p. 78.
15. James, L.C. and J.C. Linton, Handbook of obesity intervention for the lifespan. 2009,
New York, NY: Springer. x, 143 p.
16. Siegel, J.M., et al., A worksite obesity intervention: results from a group-randomized
trial. Am J Public Health, 2010. 100(2): p. 327-33.
17. Hammond, R.A., Complex systems modeling for obesity research. Preventing chronic
disease, 2009. 6(3).
18. Maglio, P.P., M.J. Sepulveda, and P.L. Mabry, Mainstreaming modeling and simulation
to accelerate public health innovation. Am J Public Health, 2014. 104(7): p. 1181-6.
19. Hawe, P. and L. Potvin, What is population health intervention research? Can J Public
Health, 2009. 100(1): p. Suppl I8-14.
20. Sharma, M., International school-based interventions for preventing obesity in children.
Obes Rev, 2007. 8(2): p. 155-67.
21. Summerbell, C.D., et al., Interventions for preventing obesity in children. Cochrane
Database Syst Rev, 2005(3): p. CD001871.
22. Economos, C.D. and S. Irish-Hauser, Community interventions: A brief overview and
their application to the obesity epidemic. Journal of Law Medicine & Ethics, 2007. 35(1):
p. 131-+.
23. Glasgow, R.E., T.M. Vogt, and S.M. Boles, Evaluating the public health impact of health
promotion interventions: the RE-AIM framework. Am J Public Health, 1999. 89(9): p.
1322-7.
24. Gaglio, B., J.A. Shoup, and R.E. Glasgow, The RE-AIM framework: a systematic review
of use over time. Am J Public Health, 2013. 103(6): p. e38-46.
25. Planas, L.G., Intervention design, implementation, and evaluation. Am J Health Syst
Pharm, 2008. 65(19): p. 1854-63.

59
26. Glasgow, R.E., E. Lichtenstein, and A.C. Marcus, Why don't we see more translation of
health promotion research to practice? Rethinking the efficacy-to-effectiveness
transition. Am J Public Health, 2003. 93(8): p. 1261-7.
27. Glasgow, R.E., et al., The RE-AIM framework for evaluating interventions: what can it
tell us about approaches to chronic illness management? Patient Educ Couns, 2001.
44(2): p. 119-27.
28. Brown, T., et al., Systematic review of long term lifestyle interventions to prevent weight
gain and morbidity in adults. Obesity Reviews, 2009. 10(6): p. 627-638.
29. Glasgow, R.E. and K.M. Emmons, How can we increase translation of research into
practice? Types of evidence needed. Annual Review of Public Health, 2007. 28: p. 413-
433.
30. Gortmaker, S.L., et al., Reducing obesity via a school-based interdisciplinary
intervention among youth - Planet health. Archives of Pediatrics & Adolescent Medicine,
1999. 153(4): p. 409-418.
31. Gittelsohn, J., et al., A Food Store Intervention Trial Improves Caregiver Psychosocial
Factors and Children's Dietary Intake in Hawaii. Obesity, 2010. 18: p. S84-S90.
32. Starfield, B., Quality-of-care research: internal elegance and external relevance. JAMA,
1998. 280(11): p. 1006-8.
33. Thompson, S.E., B.A. Smith, and R.E. Bybee, Factors influencing participation in
Worksite Wellness Programs among minority and underserved populations. Family &
Community Health, 2005. 28(3): p. 267-273.
34. Green, L.W. and R.E. Glasgow, Evaluating the relevance, generalization, and
applicability of research - Issues in external validation and translation methodology.
Evaluation & the Health Professions, 2006. 29(1): p. 126-153.
35. Spence, J.C. and R.E. Lee, Toward a comprehensive model of physical activity.
Psychology of Sport and Exercise, 2003. 4(1): p. 7-24.
36. Swinburn, B., T. Gill, and S. Kumanyika, Obesity prevention: a proposed framework for
translating evidence into action. Obesity Reviews, 2005. 6(1): p. 23-33.
37. Hendriks, A.-M., et al., Proposing a conceptual framework for integrated local public
health policy, applied to childhood obesity - the behavior change ball. Implementation
Science, 2013. 8.

60
38. Damschroder, L.J. and J.C. Lowery, Evaluation of a large-scale weight management
program using the consolidated framework for implementation research (CFIR).
Implementation Science, 2013. 8.
39. Sweet, S.N., et al., Operationalizing the RE-AIM framework to evaluate the impact of
multi-sector partnerships. Implement Sci, 2014. 9: p. 74.
40. Hovmand, P., et al., Combining Group Model Building and Participatory Rural
Appraisal in Southeast Rural India, in Proceedings of the 28th International Conference
of the System Dynamics Society, T. Moon, Editor. 2010: Seoul, Korea.
41. Rossner, S., Obesity: the disease of the twenty-first century. International Journal of
Obesity, 2002. 26: p. S2-S4.
42. Grant, R.M., Contemporary strategy analysis : concepts, techniques, applications. 4th ed.
2002, Malden, Mass.: Blackwell Business. xii, 551.
43. Barney, J., Firm Resources and Sustained Competitive Advantage. Journal of
Management, 1991. 17(1): p. 99-120.
44. Peteraf, M.A., The Cornerstones of Competitive Advantage - a Resource-Based View.
Strategic Management Journal, 1993. 14(3): p. 179-191.
45. Dierickx, I. and K. Cool, Asset Stock Accumulation and Sustainability of Competitive
Advantage. Management Science, 1989. 35(12): p. 1504-1511.
46. Eggers, J.P. and S. Kaplan, Cognition and Renewal: Comparing CEO and
Organizational Effects on Incumbent Adaptation to Technical Change. Organization
Science, 2009. 20(2): p. 461-477.
47. Zollo, M. and S.G. Winter, Deliberate learning and the evolution of dynamic capabilities.
Organization Science, 2002. 13(3): p. 339-351.
48. Warren, K., Competitive strategy dynamics. 2002, Chichester: Wiley. xiii, 330 p.
49. Levitt, B. and J.G. March, Organizational Learning. Annual Review of Sociology, 1988.
14: p. 319-340.
50. Leonard-Barton, D., Core Capabilities and Core Rigidities - a Paradox in Managing
New Product Development. Strategic Management Journal, 1992. 13: p. 111-125.
51. Rahmandad, H., Effect of delays on complexity of organizational learning. Management
Science, 2008. 54(7): p. 1297-1312.

61
52. Sterman, J.D., Learning in and about complex systems. System Dynamics Review, 1994.
10(2-3): p. 91-330.
53. Easton, G.S. and S.L. Jarrell, The effects of total quality management on corporate
performance: An empirical investigation. The Journal of Business, 1998. 71(2): p. 253.
54. Hendricks, K.B. and V.R. Singhal, The Long-Run Stock Price Performance of Firms with
Effective TQM Programs. Management Science, 2001. 47(3): p. 359-368.
55. Repenning, N.P. and J.D. Sterman, Nobody ever gets credit for fixing problems that never
happened: Creating and sustaining process improvement. California Management
Review, 2001. 43(4): p. 64-+.
56. Sterman, J.K., N.P. Repenning, and F. Kofman, Unanticipated side effects of successful
quality programs: Exploring a paradox of organizational improvement. Management
Science, 1997. 43: p. 503-521.
57. Repenning, N.P., Understanding fire fighting in new product development. The Journal of
Product Innovation Management, 2001. 18: p. 285-300.
58. Repenning, N.P. and J.D. Sterman, Capability traps and self-confirming attribution
errors in the dynamics of process improvement. Administrative Science Quarterly, 2002.
47(2): p. 265-295.
59. Green, L.W. and M.W. Kreuter, Health program planning : an educational and
ecological approach. 4th ed. 2005, New York: McGraw-Hill.
60. Brownson, R.C., J.G. Gurney, and G.H. Land, Evidence-based decision making in public
health. J Public Health Manag Pract, 1999. 5(5): p. 86-97.
61. Heller, R.F. and J. Page, A population perspective to evidence based medicine: "evidence
for population health". J Epidemiol Community Health, 2002. 56(1): p. 45-7.
62. Levy, D.T., et al., Simulation models of obesity: a review of the literature and
implications for research and policy. Obesity Reviews, 2011. 12(5): p. 378-394.
63. Fallah-Fini, S., et al., Modeling US Adult Obesity Trends: A System Dynamics Model for
Estimating Energy Imbalance Gap. American Journal of Public Health, 2014. 104(7): p.
1230-1239.
64. Rahmandad, H. and N.S. Sabounchi, Modeling and estimating individual and population
obesity dynamics, in Social Computing, Behavioral-Cultural Modeling and Prediction.
2012, Springer. p. 306-313.

62
65. Hammond, R.A. and J.T. Ornstein, A model of social influence on body mass index.
Annals of the New York Academy of Sciences, 2014: p. n/a-n/a.
66. Struben, J., D. Chan, and L. Dube, Policy insights from the nutritional food market
transformation model: the case of obesity prevention. Annals of the New York Academy
of Sciences, 2014: p. n/a-n/a.
67. Rahmandad, H., Human Growth and Body Weight Dynamics: An Integrative Systems
Model. PloS one, 2014. 9(12): p. e114609.
68. Shoham, D.A., et al., Modeling Social Norms and Social Influence in Obesity. Current
Epidemiology Reports, 2015: p. 1-9.
69. Milstein, B., J. Homer, and G. Hirsch, Analyzing national health reform strategies with a
dynamic simulation model. Am J Public Health, 2010. 100(5): p. 811-9.
70. Sterman, J., Business dynamics : systems thinking and modeling for a complex world.
2000, Boston: Irwin/McGraw-Hill. xxvi, 982 p.
71. Sterman, J.D., Learning in and about complex systems. System Dynamics Review, 1994.
10(2‐3): p. 291-330.
72. Lee, S.H., et al., Characteristics of prepared food sources in low-income neighborhoods
of Baltimore City. Ecol Food Nutr, 2010. 49(6): p. 409-30.
73. Gittelsohn, J., et al., Understanding the Food Environment in a Low-Income Urban
Setting: Implications for Food Store Interventions. Journal of Hunger & Environmental
Nutrition, 2008. 2(2-3): p. 33-50.
74. Gittelsohn, J., et al., Process evaluation of Baltimore Healthy Stores: a pilot health
intervention program with supermarkets and corner stores in Baltimore City. Health
Promot Pract, 2010. 11(5): p. 723-32.
75. Lee-Kwan, S.H., et al., Development and implementation of the Baltimore healthy carry-
outs feasibility trial: process evaluation results. BMC Public Health, 2013. 13: p. 638.
76. Pawson, R. and N. Tilley, Realistic evaluation. 1997, London ; Thousand Oaks, Calif.:
Sage. xvii, 235 p.
77. Redfern, S. and S. Christian, Achieving change in health care practice. Journal of
Evaluation in Clinical Practice, 2003. 9(2): p. 225-238.
78. Sweeney, L.B. and J.D. Sterman, Bathtub dynamics: initial results of a systems thinking
inventory. System Dynamics Review, 2000. 16(4): p. 249-286.

63
79. Cronin, M.A., C. Gonzalez, and J.D. Sterman, Why don’t well-educated adults
understand accumulation? A challenge to researchers, educators, and citizens.
Organizational Behavior and Human Decision Processes, 2009. 108(1): p. 116-130.
80. Sterman, J.D., Modeling managerial behavior: Misperceptions of feedback in a dynamic
decision making experiment. Management science, 1989. 35(3): p. 321-339.
81. Abdel-Hamid, T., et al., Public and health professionals’ misconceptions about the
dynamics of body weight gain/loss. System Dynamics Review, 2014. 30(1-2): p. 58-74.
82. Repenning, N.P., A dynamic model of resource allocation in multi-project research and
development systems. System Dynamics Review, 2000. 16(3): p. 173-212.
83. Rahmandad, H. and D. Weiss, Dynamics of concurrent software development. System
Dynamics Review, 2009. 25(3): p. 224-249.
84. Lee-Kwan, S.H., et al., Environmental Intervention in Carryout Restaurants Increases
Sales of Healthy Menu Items in a Low-Income Urban Setting. Am J Health Promot, 2014.
85. Damschroder, L.J., et al., Fostering implementation of health services research findings
into practice: a consolidated framework for advancing implementation science.
Implementation Science, 2009. 4.
86. Dzewaltowski, D.A., et al., Behavior change intervention research in community
settings: how generalizable are the results? Health Promot Int, 2004. 19(2): p. 235-45.
87. Rahmandad, H. and J.D. Sterman, Reporting guidelines for simulation-based research in
social sciences. System Dynamics Review, 2012. 28(4): p. 396-411.
88. Barlas, Y., Formal aspects of model validity and validation in system dynamics. System
Dynamics Review, 1996. 12(3): p. 183-210.
89. Morecroft, J.D.W., Rationality in the Analysis of Behavioral Simulation Models.
Management Science, 1985. 31(7): p. 900-916.
90. Barlas, Y., Multiple Tests for Validation of System Dynamics Type Simulation Models.
European Journal of Operations Research, 1989. 42(1): p. 59-87.
91. Proctor, E., et al., Outcomes for Implementation Research: Conceptual Distinctions,
Measurement Challenges, and Research Agenda. Administration and Policy in Mental
Health and Mental Health Services Research, 2011. 38(2): p. 65-76.

64
92. Glanz, K. and D.B. Bishop, The role of behavioral science theory in development and
implementation of public health interventions. Annu Rev Public Health, 2010. 31: p. 399-
418.
93. Davies, P., A. Walker, and J. Grimshaw, A systematic review of the use of theory in the
design of guideline dissemination and implementation strategies and interpretation of the
results of rigorous evaluations. Implementation Science, 2010. 5: p. 14.
94. Klein, K.J. and A.P. Knight, Innovation implementation - Overcoming the challenge.
Current Directions in Psychological Science, 2005. 14(5): p. 243-246.
95. Klein, K.J. and J.S. Sorra, The Challenge of Innovation Implementation. The Academy of
Management Review, 1996. 21(4): p. 1055-1080.

65
Chapter 4 - Dynamics of Implementation and
Maintenance of Organizational Health Interventions:
Case Studies of Obesity Interventions
4.1 Abstract
In this study, we present case studies to explore the dynamics of implementation and
maintenance of obesity interventions. We analyze how specific obesity prevention interventions
are built and eroded, how the building and erosion mechanisms are interconnected, and why we
can see significantly different erosion rates across otherwise similar organizations. We use
multiple comparative case studies to provide empirical information on the mechanisms of
interest, and use qualitative systems modeling to integrate our evolving understanding into an
internally consistent and transparent theory of the phenomenon. Our preliminary results identify
reinforcing feedback mechanisms, including design of organizational processes, motivation of
stakeholders, and communication among stakeholders, which influence implementation and
maintenance of intervention components. Over time, these feedback mechanisms may drive a
wedge between otherwise similar organizations, leading to distinct configurations of
implementation and maintenance processes.
Keywords: implementation and maintenance, health interventions, obesity prevention
interventions, system dynamics, endogenous dynamics, system dynamics, qualitative modeling,
case studies
4.2 Introduction
One of the biggest health challenges in the U.S. is obesity; two-thirds of adults and one-third of
children are overweight or obese [1, 2]. Despite extensive public health efforts to control and
reduce obesity, it still remains a critical crisis in the U.S. One of the main efforts has been the
development and implementation of obesity prevention interventions in local communities and
businesses. These organizational interventions are often successful in the short term; however,

66
their sustainability over the long term has been questioned. There are three distinct reasons for
the importance and complexity of understanding the sustainability of obesity interventions:
1) Health consequences of obesity: Excess weight is associated with many leading causes
of morbidity and mortality, including increased risk of type 2 diabetes, hypertension,
stroke, arthritis, and certain cancers, among others [3, 4].
2) Economic impact of obesity: The obesity epidemic has a potential economic impact in
the U.S. Overall health expenditures in the U.S. from 2009 to 2012 were 17.7% of the
GDP, the highest rate among 221 countries and more than twice the average for all
countries (6.9%) [5]. The economic impacts associated with the obesity epidemic include
medical, productivity, transportation, and human capital costs, which makes obesity-
linked costs a noticeable portion of total national health expenditures [6].
3) Complexity of organizational health interventions: Social systems are complex and
implementing health related interventions within organizations is specifically complex
[7]. Such interventions require changes in work processes that are often in a complex
zone where uncertainty and lack of agreement are common [8]. We particularly select
interventions involving multiple stakeholders, and this selection further increases the
organizational complexity of implementation and maintenance of interventions.
Given the motivations of the study, we provide qualitative evidence for understanding the
dynamics of implementation and maintenance of organizational obesity prevention interventions.
The studies were conducted in three different setting including hospitals and child daycare
centers in the Carolinas, and food carry-out restaurants in Maryland. These projects included
design and development, along with deployment and implementation of the interventions.
To increase the generalizability of this study, we selected three organizations with different
levels of complexity, where complexity is highest in hospitals, moderate in child daycare centers,
and lowest in food carry-out restaurants. We particularly focus on: 1) endogenous dynamics of
implementation and maintenance of obesity interventions, 2) organizational interventions with
multiple stakeholders, 3) trade-offs in building alternative resources within each organization.
They are further discussed below.
1) Endogenous dynamics: The selected intervention programs provide health organizations
with capabilities that have the potential to tackle obesity in a target population and

67
provide additional benefits. A general belief is that the level of these capabilities (e.g.,
capabilities achieved by installing an outdoor playground in a child daycare center) is
degraded over time and irrespective of other factors, but recent theories in the strategic
management literature present the idea that such erosion could also be a result of
systematic and endogenous dynamics within the organization [9]. These theories contend
that, in addition to exogenous factors, capabilities can erode based on endogenous
dynamics, which can take an organization from efficient to inferior capabilities. These
endogenous dynamics could result from unfavorable temporal trade-offs between
performance and robustness and long delays between the ‘better’ and ‘worse’ parts of
temporal trade-offs [9].
2) Multiple stakeholders: Health organizations often have multiple stakeholders, making it
difficult to trace the shortcomings of dynamics of implementation and maintenance of
obesity interventions and tease out the sources of those shortcomings. Multiple
stakeholders not only have different goals and perceptions, but their goals and
perceptions may also change dynamically over time [10]. The organizational sciences
literature also shows that there is often no agreement in perceptions of success factors
among stakeholders, e.g., see Davis [11]. In addition, research shows that the allocation
of clear stakeholder responsibilities is often problematic [e.g., 12]. We contend that even
if stakeholder roles and responsibilities are clearly defined in the development of
interventions, other pitfalls in organizational processes driven by endogenous dynamics
may turn cooperative or complementary interactions into conflicting interactions, which
can potentially cause the erosion of intervention components. The organizational
literature also stresses the importance of interactions and communication among
stakeholders, but without an understanding of the underlying dynamics of such
interactions, it would be hard to assess the consequences of insufficient interactions. In
fact, the literature shows that even simple organizational systems, if they include time
delays and multiple feedback relationships, can create complicated outcomes, which
therefore become hard to anticipate via intuition [13].
3) Trade-offs in building alternative resources: There are usually trade-offs in building
alternative resources that increase the complexity of managers’ decisions for allocating
effort to those resource investment [14]. For example, organizations are susceptible to

68
focusing on doing what they know best and ignoring emerging opportunities [15, 16].
They also routinely undervalue investments with long-term payoffs [17, 18]. Empirical
studies provide strong support for many quality and process improvement programs [19,
20]. Yet organizations often fail to fully realize these benefits because: Resources are
withdrawn from programs before complete results are observed; initial enthusiasm
overwhelms the training capacity for keeping the programs effective; or seeking short-
term gains overloads the system with demand and the organizations are pushed into a
firefighting mode of operation [21-24]. Similar to quality and process improvement
initiatives, many organizational health interventions may be beneficial over the long haul,
but require initial investments and delays before the benefits materialize.
To address the concerns discussed above, we develop a causal loop diagram, building on
organizational processes from case study evidence, to study the dynamics of implementation and
maintenance of obesity interventions. The rest of this section is organized as follows. Study
design and empirical setting is discussed in Section 4.3; Section 4.4 discusses data collection and
research methods; Section 4.5 presents modeling, including the main mechanisms of the model;
and Section 4.6 explains the heterogeneities across the case studies based on the endogenous
dynamics in the developed model. The discussion is presented in Section 4.7.
4.3 Study Design and Empirical Setting
Studying the microfoundations and sources of variations in implementation and erosion of
interventions calls for a few design characteristics. First, a focus on similar interventions across
similar organizations is needed to control for possible alternative explanations. Second,
observing various rates of erosion of intervention components across these cases may better
elucidate how the underlying mechanisms vary across organizations. Finally, heterogeneity
among the organizations under study would increase the generalizability of the results.
We used a polar case study design with three pairs of organizations. Each pair includes two
similar organizations and the same intervention. In one of the two cases in each pair, the
organization has been successful in implementing and maintaining the intervention; in the other,
the organization has been less successful in sustaining the intervention. The three pairs of
organizations vary in size and complexity. Moreover, we focus on well-defined interventions that
require coordination among different stakeholders for their implementation, a common feature of

69
most complex organizational processes. Additional comparability was achieved by focusing on
interventions that are all related to health outcomes at the organization and community levels.
4.3.1 Baltimore Healthy Carry-Outs (BHC)
The first pair of cases comes from the adoption and maintenance of the Baltimore Healthy Carry-
Outs (BHC) initiative [25]. This initiative provided a random sample of small food carry-out
vendors in a poor Baltimore neighborhood with assistance and incentives to implement healthier
menu options and eating opportunities for the local community. The carry-out vendors were
interested in this initiative because it distinguished them from the competition and also benefited
the local community. Researchers from Johns Hopkins Bloomberg School of Public Health
worked with the carry-out vendors to design and implement the intervention, which included
changes in menu items, raw material suppliers, marketing and presentation of stores, and pricing
of items. The BHC case was thoroughly discussed in Chapter 3.
4.3.2 Shape North Carolina (Shape NC)
The second pair of cases looks at the Shape North Carolina (Shape NC) program, an initiative to
introduce healthier food and more physical activity into child daycare organizations in the state.
Changes in food provision, physical layout, and activity planning for children are designed in
collaboration with Shape NC partners and provide the participating child daycare centers with
improved market position, parental support, and local government support [26]. The intervention
brings together previously developed programs in the state and integrates them with new
research-based models. There are several major stakeholders involved in the Shape NC project,
including Smart Start and Blue Shield of NC Foundation, NC Partnership for Children, Blue
Cross, and researchers from UNC-Chapel Hill. The implementation approach aims to be both
top-down and bottom-up. It is a community-based program and local experts in each community
(at the county level) provide technical assistance in adopting, implementing, and maintaining the
intervention. After multiple meetings with the project managers, we selected two child daycare
centers from two counties with different levels of success in implementation and maintenance of
the intervention—we call the successful center S1 and the less successful one S2.

70
4.3.3 North Carolina Prevention Partners (NCPP)
Finally, larger organizations are targeted in the third pair of cases, where hospitals partner up
with North Carolina Prevention Partners (NCPP), a nonprofit that focuses on implementing
healthier cafeteria food, more physical activity, and smoking policies in large organizations,
among others. The implementation of these changes requires adjusting various vendors and
organizational regulations, and introducing new layouts and incentives for various participants
[27]. In return, the hospitals expect reductions in employee health costs, improved morale, and
better experiences for patients, which all contribute to long-term competitiveness. The NCPP
conducts assessments for food establishments such as restaurants and cafés in hospitals and
issues “Apple” certificates representing healthy organizations. There are three different Apple
certificates: Red (indicating that the place provides ‘healthy and delicious’ foods), Yellow
(working towards Red), and Green (getting started). Particularly for hospitals, it is an excellence
award showing that they provide healthy food choices and a healthy environment, not only to
employees but also to patients and visitors. For this project, we selected two hospitals. Hospital
one (N1), with over 600 beds, is a nonprofit general hospital, recognized as one of the top 50
hospitals in the U.S. It was the first hospital in the state to achieve the Red Apple. Hospital two
(N2), with over 50 beds, is also a nonprofit general hospital with no Apple certificate.
While the cases vary significantly in the size of the organizations involved, they share a focus
on interventions that require collaboration among internal and external stakeholders and focus on
processes that enhance health outcomes. These similarities allow us to compare and contrast the
processes of implementation and erosion of intervention components.
4.4 Data and Methods
We selected the cases in consultation with the external stakeholders involved in implementing
these interventions (i.e., Johns Hopkins researchers working on BHC, the Blue Cross and Blue
Shield of NC Foundation and the NC Partnership for Children, Inc. on Shape NC, and the
nonprofit NC Prevention Partners on NCPP; from here on we will call these external
stakeholders). Cases were selected such that enough time had passed since inception of the
programs to allow for observation of erosion mechanisms in action. In each case, we conducted
interviews (mostly in person and a few on the phone) with the main stakeholders involved in the
implementation and day-to-day enactment of the intervention components. Interviews focused on

71
understanding the components, how they were adopted and implemented, the parts that had been
institutionalized, and challenges in maintaining them. Where available, archival data on the
history of the cases were used to augment the interviews. Table 4-5 provides a summary of the
interviews conducted to date.
Table 4-5. Summary of the interviews
Organization Interviewees
Number
of
interviews
Interviews
length
(min)
Baltimore Healthy Carry-outs (BHC)
Consultants 5 225
Internal stakeholders – case 1 1 50
Internal stakeholders – case 2 1 60
Shape North Carolina (Shape NC)
Consultants 11 695
Internal stakeholders – case 1 (S1)* 8 230
Internal stakeholders – case 2 (S2)**
4 190
North Carolina Prevention Partners
(NCPP)
Consultants 5 400
Internal stakeholders – case 1 (N1)* 3 140
Internal stakeholders – case 2 (N2)**
6 170
Total 44 2,160 *S1 and N1: successful cases; **S2 and N2: unsuccessful cases
Interviews for BHC were conducted by the author, and interviews for Shape NC and NCPP
were conducted by the author and a joint researcher (PhD student) from the University of North
Carolina at Chapel Hill. The research protocol was fully approved by the Virginia
Tech Institutional Review Board (IRB number: 11-947). Interviewees included: 1)
Interventionists as external stakeholders who designed and implemented the interventions; 2)
internal stakeholders engaged in the implementation of the interventions—store owners for BHC,
center owners, CEOs, or department directors and their key staff for Shape NC and NCPP. All
interviewees were informed of the purpose and procedures of the research, and assured that the
information would be confidential. They signed a consent form and received compensation of
$35 per hour of interview for their time. A spreadsheet tracked interview information, including
name, gender, ethnicity, and organizational role of interviewees, as well as date, duration, and
location of the interviews. Interviews were recorded and transcribed into text. All transcriptions
were then saved in MAXQDA 113 for qualitative data analysis.
3 MAXQDA, software for qualitative data analysis, 1989-2015, VERBI Software – Consult – Sozialforschung
GmbH, Berlin, Germany.

72
Data analysis began with coding the interviews for common themes related to
implementation and maintenance of the interventions [28], following standards for qualitative
research [29]. Coding of interviews was conducted by the two authors; any disagreements or
concerns about the extracted data were discussed until consensus was reached. Coding helped in
learning the mechanisms of implementation and maintenance through identifying key variables
and relationships among the variables. For example, ‘financial benefits’ (earned from
implemented components) and ‘motivation of internal stakeholders to implement’ are two
variables extracted from the interviews, and the relationship between these two variables was
that ‘financial benefits’ had a positive effect on ‘motivation of internal stakeholders to
implement.’ More variables and mechanisms that have an impact on implementation and
maintenance are discussed in the following sections. The emerging relationships among the
extracted variables were then integrated into an evolving causal loop diagram [30]. The resulting
causal loop diagrams embedded the key relevant mechanisms important for understanding how
the interventions were implemented and how they eroded.
4.5 Modeling
Similar to any project, an intervention includes several components that need to be implemented.
However, not all implemented components are sustainable, and they may deteriorate over time.
We assume that the intervention components are effective, in the sense that if properly
implemented and maintained, they have a positive health impact. Therefore, it is the role of
adoption, implementation and maintenance to make the intervention successful and sustainable.
Figure 4-1 simply shows the basic stock and flow of the implemented components. We review
the interview codes and capture the dynamic mechanisms affecting both the inflow and outflow
of the stock, implementation rate and depreciation rate. In this section on modeling, most
examples come from successful cases. In the following section on analysis, unsuccessful cases
are discussed more.
Figure 4-1. Basic stock and flow structure of implemented components
Implemented
componentsDepreciation rateImplementation rate

73
4.5.1 Resources and motivation
Sufficient resources and motivated stakeholders are two necessary factors for implementation.
The effects of resources and motivation on implementation are discussed as follows—examples
are presented from each case study.
Shape NC:
Unlike the BHC, implementation of Shape NC is expensive. For example, building an outdoor
playground requires financial resources. Both Shape NC centers (successful case S1 and
unsuccessful case S2) received the same initial grant to implement the intervention ($3,000). The
initial grant was crucial and helped the centers involved in the project. The grant was not enough
to support the implementation of all components, but it helped the centers get started. One of the
staff at S1 elaborates:
Financially, the first grant was $3,000 which helped us get started. We won't have been
able to get started if we didn't have that little push.
Another necessary resource for implementation is interventionists who help the centers
implement the intervention. Without the effort and knowledge of the interventionists, the
implementation would not be feasible. We consider financial resources and the efforts of
interventionists to be key resources needed for implementation.
Resources are essential to implementing the intervention components; however, motivation is
another needed element, without which ample resources are not of much help in kicking off and
continuing the implementation. In Shape NC, competition was a key motivator for the center
owners to join the project. The director of S1 discusses:
Forever we have always tried to get a leg up on other centers, because we felt like in
order to get the children, we needed to be something a little different.
One of the staff at the local hub, an external stakeholder, says of the director of S1:
Sometimes it comes from—not because she knew about it but because she came to a
meeting and someone else said this is what we are doing. So then she'll go out and figure
out how to get that done in her center, so it is kind of that competitive. Her
competitiveness is motivating her to do more… She is competitive. That is the first thing
that comes to my mind when I think of Ms. [A.].

74
She was lower stars and she didn't care about increasing her stars [an assessment
measure for the centers], because she knew she already had quality, she didn't care about
the star rating system, but when that NC pre-k program came, she was like, what!? And
sure enough she got it together. They had to apply to be the model early learning site—
she made sure she had every piece that had to be in it. So she competed with 5 or 6
centers that applied and she made sure she had everything above what they could do so
she could be that model learning center. So that competitive nature.
Furthermore, leadership support and involvement in the project is key to facilitating
implementation. The level of support of organizational leaders goes back to their motivation. If
leaders do not see the intervention as impactful, not only might they not support the project, but
they even might be against it. This dynamic mechanism is already captured in the effect of
motivation on implementation. We observed two completely different approaches to leadership
support at S1 and S2. The director of S1 runs the child daycare center as a business center, so she
potentially cares about competition with other centers in the community. In contrast, S2 was a
center owned by a church and competition was not a big factor in motivation there. These
different approaches by the leaders define the different initial motivation level of internal
stakeholders.
NCPP:
Interventionists from NCPP were also the key agents in helping the hospitals implement the
intervention. One of the staff at the successful hospital (N1) elaborates:
I think they [interventionists] have been pretty helpful. There are a lot of things that
we’ve done on our own. But we’ve used them as just an extra piece. I think we will
continue to use it a lot more, because I know they built the toolkit, they’ve built a lot more
resources, they have lots of webinars that they provide, and I think just continuing to
communicate that to the rest of our staff internally so they know it’s there. I think it’s
going to be helpful, because you don’t have to reinvent the wheel every time.
In addition to the efforts of interventionists, competitive advantage served as a driver of
motivation in the NCPP intervention as well. One of the staff at hospital N1 mentions:
…we all felt it was the right thing to do. And I think quite frankly you don’t want to be the
hospital that is not on the map, because they have a map of North Carolina that shows

75
the hospitals that are and that aren’t [involved in the wellness program, the
intervention]. I think if you were the leadership of the hospitals that aren’t, I think it
might put some pressure on you to be the ones that are. Does that make sense? Because
one of the things I learned about healthcare, I got into healthcare about ten year ago. I
never realized really how competitive it is. It is very competitive. So you don’t want to be
the hospital that’s in the market that doesn’t promote wellness because the one down the
street is.
Along with competitive advantage, contribution to the health of community was a strong
driver of motivation at NCPP; it was mentioned by several interviewees. One of the staff at N1
says:
…one thing that we are doing now more than in the early days, and this is part of our
attempt or work to move from just the hospital, to expand from the hospital sector to
other sectors. So now we are working to bring the program to whole communities. We
look at the hospital to become an anchor for that community.
Another staff at N1 elaborates, particularly on community leadership:
I think we had a real commitment. As a community hospital, we very much want to
represent to our community a healthy way of living, and we thought it is important to I
guess be a mirror to our community. So it was important to our CEO, it was important to
our wellness leadership that we partner with NC Prevention Partners to make a
statement and to give us a pathway to becoming a healthier organization and being
healthier for our customers.
The impact of leadership support was strong enough to distinguish the successful hospital N1
from the unsuccessful hospital N2. We further discuss this difference in the analysis section
(Section 4.6.2). One of the staff members at hospital N2 says:
…getting the directors on board with the staff and saying, ‘Hey, look, this is gonna
launch. This is gonna benefit you.’ I think that’s the only way we can upscale it, because
if you just email people, ‘Oh, this is happening, such and such.’ Okay, they most of the
time just delete it...
One of the staff at the local hub of S2 believes that the commitment of directors is the factor
that makes some child daycare centers more successful than others:

76
…having a strong leader who is willing to do what it takes and be inspirational and
motivating and facilitating into the roadblocks that they run into and of course staff who
buys into that vision.
Therefore, the two key factors affecting implementation are resources and motivation. As
discussed earlier, we consider resources to be interventionists’ efforts and financial resources.
We also particularly focus on motivation, capture it as a stock variable, and study possible
mechanisms that change it. Figure 4-2 presents the effects of motivation and resources on
implementation.
Figure 4-2. Effects of motivation and resources on implementation
It should be noted that we focus on motivation of internal stakeholders and assume that
external stakeholders stay motivated. In fact, we observed highly motivated interventionists.
However, we acknowledge that in other settings external stakeholders might become less
motivated about the intervention over time. For the sake of simplicity, we only discuss the
motivation of internal stakeholders in the model.
4.5.2 Communication and design quality
To keep the internal stakeholders motivated, a proper level of communication is needed between
them and the interventionists. It helps not only to build trust among the stakeholders but also to
Implemented
componentsDepreciation rateImplementation rate
Motivation of
internal
stakeholders
Motivation
change rate
Financial
Resources
++
Grant to start the
project
+
Interventionists
effort (time)
+

77
address some of the issues in the design and adoption of the intervention—the design process
requires sufficient communication among the stakeholders. Another important component that
affects the quality of design and adoption of the intervention is the quality of effort of
interventionists. If sufficient resources are available and internal stakeholders are excited about
the program, yet the efforts of interventionists are of poor quality, the implementation process
will face potential challenges. Thus, communication among stakeholders and the quality of effort
of interventionists affect design quality. Examples to support these mechanisms are presented
below.
Shape NC:
One of the staff at S1 mentions:
It [our relationship with the technical assistants—interventionists] has been like a glove,
we work very closely together. A lot of times they push me, because sometimes I get busy
doing other things and [Ms.] R. [the key interventionist] gets me back on track; we
should be doing this, change this, etc. She has been very instrumental with that and
probably one of the key components to the whole program being successful is the
partnership office.
As discussed earlier, communication also helps improve implementation by reducing errors
and facilitating implementation processes. Staff and interventionists at both centers highlight the
need for sufficient communication. The director of center S1 elaborates:
Of course [Ms.] R. [the key interventionist] is phenomenal; she's worth her weight in
gold! She has come out and sits down with me for a few minutes and I am thinking, you
know I can't go this next step. I just really don't want to go out and beg for more money
or more help. She will say, Ms. A., you just have to... By the time she gets through, I'm
thinking this is going to be a piece of cake! I go do whatever we need to do and I don't
always make the best decisions with the people that we hire, but we look pretty good out
there and kids love it. That is name of the game.
In a more explicit example, one of the interventionists of S1 explains a design issue in
serving healthy meals:
Actually really the biggest killers are the teachers. If they say, eww... I'm not going to try
that. Then the kids react the same… The little bit of stuff you hear from the kids is the

78
food, but mostly it’s because they heard a teacher say they didn't want to eat something.
If you get the teachers on board and get them to introduce it and be excited about it and
have taste testing parties.
This design issue was raised and solved through the communication between the
interventionists and internal stakeholders—training sessions for teachers were accordingly
planned. Moreover, quality of efforts of interventionists affects the adoption and later the
implementation of the intervention. If the quality level is low, more problems are encountered
later in the intervention implementation process. Quality is rarely perfect, so the implementation
of some intervention components can often be problematic. In Shape NC, technical assistants
(TAs) who were the key interventionists directly in touch with the center owners and staff were
highly trained, so we can expect that the quality of their efforts was at a good level. One of the
staff at the local hub mentions:
…in the beginning, we really focused on the working and training and as the hours grew
I think we put a little more of a hands off rule specially this last year, because I think they
[TAs] feel more confident in their field compared to the previous years and they had a lot
more experience behind them.
Another staff member also elaborates:
They [the TAs] have learned to believe in the program so strongly... I've done this
training for every employee that I've had.
Also, the culture of sharing is noticeable among the interventionists, which helps improve the
quality of their efforts. Another staff member at the local hub says:
Everyone is very willing to share resources. If you need something that you don't know,
you can just email them and if they don't have it they will find it. So, I think we have a
good system for sharing resources and I try to come back and share it with all of the TA
girls, so it can spread throughout the county.
NCPP:
One of the staff at hospital N1 elaborates:
…they [interventionists] are great at answering as soon we have questions. I think we get
an e-mail every week or two with maybe an upcoming webinar or anything that may be of
interest to us. So, I’d say maybe once a week, once every two weeks we’re in contact with

79
them… We communicate a little more often around the times that we take the
assessments, because we’re gathering information, preparing slides and getting things
ready to show that we’ve met certain requirements to earn an A in those areas.
Given the large organizational size of NCPP compared with Shape NC, there was a higher
demand for communication among the internal stakeholders. One of the staff at N1 explains:
We have the e-mail blasts that go out every week, weekly reminding people that you have
the opportunity to earn points, don’t forget to go in and track your exercise, bulletin
boards, [and] staff meetings.
One of the interventionists at N2 explains how they communicated with their upper level
stakeholders—state-level stakeholders who funded the program—in the design of the
intervention.
When we were first designing the intervention, we’ve always had a very open, qualitative
approach, where we read the science, we write it down, but then we spend a lot of time
with our stakeholders, saying, really, what do you need? Like what are your stresses,
what are your frustrations, what are your pain points? And then put the two together, so
that it’s a little bit more user-friendly, and it really meets their interests, instead of just
our goals.
However, there was not much communication between the interventionists and internal
stakeholders at hospital N2. This lack of communication can potentially reduce the quality of
intervention component, which later reduces the motivation of internal stakeholders. We
observed several design issues mostly for physical activity components at hospital N2. One of
the staff members says:
I think for our program here, you can either participate here at the gym, or you can do it
at home and be part of the wellness program… You don’t have to be linked in here, but
that seems like the biggest issue. Concern-wise, I think, the few people that I’ve
mentioned, like insurance benefits and stuff like that [incentives for the wellness
program]… [but] I think some people feel like it kind of steps into their personal lives too
much.

80
Another staff member also adds:
I think the biggest challenge I could see… as far as I enjoy exercising, but the biggest
challenge for me, and motivational factor for me is the transition with the weather or the
seasons to still keep people motivated... So you just incorporate it into your daily routine,
[but] I could see [it] as a really big challenge, because they drew people in at the first
part of the year, but then with the warm weather, it’s kind of like, how do you keep them
engaged? So I think that’s been one piece that hasn’t quite been figured out yet.
These two design issues were not discussed with the interventionists and they remained
unsolved. The director of the wellness program at N2 mentions another design issue in a physical
activity component, which was raised and discussed with the interventionists and they could plan
for other alternatives:
Like the first year, we started something called Walking Wednesdays, which was
supposed to be, the idea was, that every Wednesday employees would gather and walk
during their break time. Complete flop...! You know, it became too difficult to coordinate
that sort of things, so we pretty quickly found out. This is not effective; this is not a good
use of time for our staff. Let’s pull back and put in something else that’ll work a little bit
better.
He further explains how these design issues, along with an issue in the design of incentives
for the wellness program, can reduce the motivation of internal stakeholders and hospital staff
members:
I think some of the wellness challenges, as I mentioned, have been a little bit flops. Not a
little bit, they’ve been flops! I do think some different incentives will be a big help, even if
they’re not directly tied to insurance premiums, if we made the incentives a little more
relatable to insurance cost, I think that would be a big step in the right direction as far as
incentives go. The incentives we have now just frankly do not motivate everybody. They’ll
only be motivators for some people, which I guess is true of any incentive, but I think
having some more incentives will just give a broader spectrum of people to incentivize or
to motivate.

81
It should be noted that to keep the communication at a desirable level, stakeholders need to
be motivated enough to communicate, otherwise communication decreases. This completes loop
R1, Figure 4-3.
Figure 4-3. Effect of communication on motivation
4.5.3 Stakeholder alignment
Shape NC:
Stakeholder alignment is another component that helps reduce errors in the adoption and
implementation of the intervention. A staff member at the local hub elaborates:
The owner may say they want it but the director may not be fulfilling the extent of the
intentions made. And the owners aren’t in the loop; it is the directors [who] are in
charge. The directors are the ones on [the] go but the owners are the ones who can put a
brake on the project. The owner may switch the bandwagon––we have seen that a lot.
Another staff member at the local hub explains:
I think motivation was high but it dipped when it came to how to implement the project,
because they weren’t quite sure what was going on and what happened. So, potentially, I
think the motivation varied but now everybody seems pretty motivated. They were pretty
Implemented
componentsDepreciation rateImplementation rate
Motivation of
internal
stakeholders
Motivation
change rate
Financial
Resources
+
Communication
among stakeholders
+
R1
Design quality+
+
Communication
needed to keep
motivation up
+
Grant to start the
project
+
Interventionists
effort (time)
+
+
Quality of effort of
interventionists+

82
jazzed and excited and had really good positive stories to share. I think motivation is
back up top.
Once the motivation dipped down because of conflict among stakeholders, communication
helped them raise and deal with the issues. Hence, communication among stakeholders increases
stakeholder alignment, which eventually results in increased motivation of internal stakeholders.
This mechanism is presented in loop R2, Figure 4-4.
NCPP:
In NCPP, stakeholder alignment was not a major issue—there were some differences in
perceptions and intentions of the wellness program director and the CEO at hospital N2, and we
discuss this in more detail in Section 4.6.2.
Figure 4-4. Effect of communication on stakeholder alignment
Implemented
componentsDepreciation rateImplementation rate
Motivation of
internal
stakeholders
Motivation
change rate
Financial
Resources
+
Communication
among stakeholders
+
R1
Design quality+
+
Communication
needed to keep
motivation up
+
Grant to start the
project
+
Interventionists
effort (time)
+
+
Quality of effort of
interventionists+
Stakeholder
alignment
R2
Stakeholders'alignment
+
+

83
4.5.4 Effects of costs and benefits on motivation
As a result of the intervention implementation, internal stakeholders might observe new costs
and benefits. A major benefit for the organization was competitive advantage as well as having
an impact on the health of the community. There were also major costs of implementation of the
intervention components, such as installing an outdoor playground in Shape NC.
Shape NC:
The director of S1 discusses this:
I would like to do what [Ms.] R. [the key interventionist] has suggested. It seems like
we'll have a cook for a while and then they are gone, but what I'd really like to do is have
a tasting on a Friday afternoon and do some new recipe and let parents have a taste.
Have parents come and taste the new recipes and ask them if they think their kid would
like it and give them the recipe to make at home… That would be good advertisement.
NCPP:
The implementation of the intervention imposed significant costs on the hospitals. Not only was
the implementation costly, but also the projection of the consequences of some of the
components did not seem beneficial to some staff. The program director at hospital N1
elaborates:
Everybody told me we were going to lose money, that the sales were going to hurt,
because people want French fries; I said don’t worry about that. We actually increased
revenue. It’s been pretty good…. We looked at it after six months and we were up about
18% on our growth. Overall since we took over five years ago we’ve been up to around
$2,000,000 revenue of the year. And that’s just [for] serving better food, and brought in a
whole new customer base. If you looked at the snapshot of the customers who were eating
six years ago, it was heavy environmental services maintenance guys who want fried
food, fried chicken, that kind of crowd. And when we introduced healthier food, we
started seeing more doctors, more nurses, [and] more outside people who were eating,
because it was a healthy way to go. So we brought in a new customer-base by adding
healthier foods.

84
Another staff member at hospital N1 mentions:
We did a whole renovation, and we were going to invest that money to get rid of the fried
food, we certainly needed to be able to support that. [When] it comes down to money, you
don’t want to do something that will really hurt your business and you’re just left
hanging out there if this wasn’t a good idea. And we wanted to make sure that the idea
we were doing was a good idea, both financially and nutritionally and all those things.
Therefore, the internal stakeholders compare the costs and benefits (we added the variable
‘net benefits’ in the model, net benefits=benefits-costs), and if they observe more benefits than
costs (when net benefit is positive and loop R3 dominates loop B1 in Figure 4-5), they will be
more motivated and consequently will collaborate in implementing remaining components and
maintaining those previously implemented. However, this mechanism is dynamic and might
change over time. For example, if implementation gets more and more expensive such that the
costs are not worth the outcomes, the perception of the owners tends towards being against the
program, making them less motivated to contribute. It should be also noted that the perception of
the net benefits does not change motivation immediately—this delay itself can be another
complexity in the model. Figure 4-5 presents these mechanisms:

85
Figure 4-5. Effects of costs and benefits on motivation
4.5.5 Self-funding
As already discussed, implementation is costly, and both child daycare centers and hospitals
need sufficient financial resources to move forward and implement the intervention components.
This requires that internal stakeholders invest in the intervention and self-fund the
implementation—in addition to grants from external stakeholders, if any.
Shape NC:
By seeing the impact of the intervention, center owners become more motivated to implement,
and may be willing to provide financial resources if the initial grant does not cover all
implementation costs. The director of S1 elaborates:
A lot more money should be put into this than what is being put in now. I've always liked
to break new ground, which is what I've done. But I've spent way more money than I
received, but it has been well worth it to this point.
Implemented
componentsDepreciation rateImplementation rate
Motivation of
internal
stakeholders
Motivation
change rate
Financial
Resources
+
Communication
among stakeholders
+
R1
Design quality+
+
Communication
needed to keep
motivation up
Benefits
Costs+
+
Net benefits +
-
Perceived net
benefits
+
+
+
B1
Costlyprogram
R3
Seeing
impact
Grant to start the
project
+
Interventionists
effort (time)
+
+
Stakeholder
alignment+
+
R2
Stakeholders'alignment
Quality of effort of
interventionists+

86
I've put my own personal funds in and move money to this out of the budget. Not
everybody can do that. But the more you put into a program the more you get out of it.
They also need checks and balances—you need to make sure that the money that you are
putting in is really doing what it needs to do. In some instances it is not, and that is a
waste.
I would say that I have spent probably three times the amount of my own money of the
scholarship that we've received.
One of the staff at S1 adds:
Ms. A. [the director] went way above and beyond that as far as spending. She built a well
just to water the plants—it takes away from her water bill, but by the time you figure out
how much she spent on that vs. the cost of the well, it was probably no comparison. But it
is out there and it is wonderful. It is great the kids can turn it on and we don't get excited
if the water is running a little longer than it should. They've learned to water their plants.
So that little bit of a financial thing [initial grant] was like the carrot out there. Just kind
of got us started. By no means did it support everything that we did.
NCPP:
The initial grant at Shape NC helped the centers get started, but NCPP did not offer any financial
support to the hospitals. This highlights the importance of the effect of motivation, such that if
internal stakeholders, particularly hospital administrators, are not motivated enough to fund the
project, implementation of the resource-based intervention components (such as renewing the
hospital restaurant) may not be feasible. While motivated administration at N1 provided financial
resources for the implementation of the intervention components, less motivated administration
at N2 did not provide any financial support. The program director at N2 elaborates:
We really have had no resources to allocate. We don’t have a budget for wellness per se.
Now, of course our department has a budget, but there never has been a particular
amount set aside for employee wellness specifically. So all of the things that we have
tried to do since the beginning have been low to really no cost movements.
The self-funding mechanism is presented in Figure 4-6, loop R4.

87
Figure 4-6. Self-funding mechanism
4.5.6 Non-dynamic factors affecting motivation
Motivation is also impacted by other factors, such as individual knowledge and beliefs about
capability and self-efficacy for carrying out the new processes [31]. Other factors affecting the
motivation of internal stakeholders could be novelty and the curiosity of leaders (owners/admins)
about implementation results and their concern about the health of the community—examples
presented for motivation (Section 4.5.1) and self-funding (Section 4.5.5) mechanisms support
these two factors. While such characteristics have a potential impact on motivation, we do not
explicitly include them in our discussion of endogenous mechanisms because they usually do not
change dynamically during the evolution of an intervention. These parameters are added in
Figure 4-7.
Implemented
componentsDepreciation rateImplementation rate
Motivation of
internal
stakeholders
Motivation
change rate
Financial
Resources
+
Communication
among stakeholders
+
R1
Design quality+
+
Communication
needed to keep
motivation up
Benefits
Costs+
+
Net benefits +
-
Perceived net
benefits
+
+
+
B1
Costlyprogram
R3
Seeing
impact
Grant to start the
project
+
Interventionists
effort (time)
+
+
Stakeholder
alignment+
+
R2
Stakeholders'alignment
Quality of effort of
interventionists+
Self-funding
+
+R4
Self-funding

88
Figure 4-7. Examples of non-dynamic factors (green parameters) affecting motivation
4.5.7 Depreciation and Maintenance
Up to this point, all the mechanisms presented affect the implementation of interventions.
Intervention maintenance emerged as another critical factor. Implemented components erode
when they deteriorate, depreciate, or are otherwise scrapped, and are not renewed—these
processes continually reduce the number of implemented components. Yet the depreciation rate
is also endogenous, as it depends on other factors. Through the interview data from internal
stakeholders and interventionists, we learned of three key factors: motivation, communication
among stakeholders, and design problems. We find that motivated internal stakeholders are more
likely to internalize and sustain changes without external prompts (R5, Figure 4-8).
Communication can help remind internal stakeholders of the need to sustain changes and fix
emerging problems (loop R6, Figure 4-8). Finally, high-quality designs foresee and correct for
Implemented
componentsDepreciation rateImplementation rate
Motivation of
internal
stakeholders
Motivationchange rate
Financial
Resources
+
Communication
among stakeholders
+
R1
Design quality+
+
Communication
needed to keep
motivation up
Benefits
Costs+
+
Net benefits +
-
Perceived net
benefits
+
+
+
B1
Costlyprogram
R3
Seeing
impact
Grant to start the
project
+
Interventionists
effort (time)
+
+
Stakeholder
alignment+
+
R2
Stakeholders'alignment
Quality of effort of
interventionists+
Self-funding
+
+R4
Self-funding
Curiosity ofleaders about
implementationresults
Concern aboutthe health ofcommunity
+
+

89
the most common modes of failure and thus include lower baseline depreciation rates (R7,
Figure 4-8).
Shape NC:
To keep the program successful, intervention components must not only be properly
implemented but also maintained, otherwise they will deteriorate over time. We already
indicated that communication is needed to identify implementation errors and consequently
results in more progress in implementation. Lack of communication not only makes
implementation problematic, but also increases depreciation of those components already
implemented. One of the interventionists says:
…the frustration and the motivation at the beginning and the lack of communication just
sour it all and it never recovered. And when we select folks, there is this criterion but you
have got centers, directors or owners who may not be that good at communicating.
In fact, communication can help remind internal stakeholders of the need to sustain changes
and fix emerging problems until intervention components are fully institutionalized and
transformed into organizational routines. Moreover, motivated owners are more likely to sustain
the changes without external prompts, and the quality of implementation influences the baseline
depreciation rates.
An example from S1 shows how a small design problem was about to deteriorate an
intervention component, where the implementation of a garden for kids focused only on children
and not on teachers. However, with more communication through training, the issue was
resolved. One of the interventionist further elaborates the story:
Now with the garden, there's some enthusiasm, there's motivation from the teachers.
Whereas some time back, I was not seeing much motivation from the teachers. After the
training, now I'm seeing teachers like little bees running around outside with the kids.
They are playing soccer and it is kind of weird how it happened. I saw a big shift when
they opened up the fencing and allowed more space, more free spaces for kids and
teachers to move.
NCPP:
The three mechanisms affecting the depreciation of implemented components were more
noticeable in Shape NC than in NCPP. NCPP interventionists paid close attention to the

90
maintenance while designing the intervention components. One of the key interventionists
elaborates:
We’ve designed the program in order for them to easily maintain things over time,
because one of the things that we encourage is that they continue to take the assessments
to make sure that they’re maintaining that high level once they’ve achieved it.
Hospital N1 had not noticed as much depreciation by the time of the interviews, and hospital
N2 was not able to implement many of the intervention components. The program director at N1
was fairly aware of the effect of motivation on maintenance. He elaborates:
[The main challenges to maintain the program is] just to keep people interested and
excited. You want to do something that is different enough each year to keep them
engaged, but you don’t want to change it so much that they go, ‘Uh, here we go again’,
but something new, something completely different. We just learnt this one, now we’re
starting something new.
One of the staff at N1 nicely summarizes the effect of motivation:
[To be successful] I think you’ve got to have buy-in in that. I think that goes back to the
culture, but I think you need to understand why you’re doing this, what’s the benefit of
doing it, in that you stick with it, dig your heals in the ground, this is it, this is what we’re
doing, this is our program, and then eventually it will become a culture thing.
Another staff member at N1 answers the question, “Was there any part of the program which
was not maintained well”:
Not really! Honestly, it’s just continued to grow bigger and bigger and bigger, and
haven’t seen it backslide at all.
The preceding two examples support the hypothesis that once new practices, intervention
components, are institutionalized and transformed into organizational routines, they will sustain
and emerging problems will be fixed. The three factors affecting depreciation rate are presented
in Figure 4-8.

91
Figure 4-8. Effects of motivation, communication, and design quality on maintenance of
intervention
4.6 Analysis
The focus in Section 4.5 was on the relationship between the key variables to develop the casual
loop diagram. In this section, we explain how the dynamic mechanisms in the model and trade-
offs in the endogenous mechanisms can distinguish successful cases (child daycare center S1 and
hospital N1) from the unsuccessful ones (child daycare center S2 and hospital N2).
4.6.1 Shape NC
In a nutshell, high motivation of internal stakeholders was the key to success at S1 because it
encouraged original implementation and reduced future depreciation, allowing for sustainability
and growth of the intervention and its financial benefits to materialize. Here we describe the
mechanisms that helped increase and maintain the level of motivation of internal stakeholders.
Implemented
components
Depreciation rateImplementation rate
Motivation of
internal
stakeholders
Motivationchange rate
Financial
Resources
+
Communication
among stakeholders
+
R1
Design quality+
+
Communication
needed to keep
motivation up
Benefits
Costs+
+
Net benefits +
-
Perceived net
benefits
+
+
+
B1
Costlyprogram
R3
Seeing
impact
Grant to start the
project
+
Interventionists
effort (time)
+
+
Stakeholder
alignment+
+
R2
Stakeholders'alignment
Quality of effort of
interventionists+
Self-funding
+
+R4
Self-funding
Curiosity ofleaders about
implementationresults
Concern aboutthe health ofcommunity
+
+
R6
Freequently
reminded to keep up
R5
Designednot to last
R7
Left to die
-
<Motivation of internal stak
eholders>
-
-

92
Expanding on examples discussed in Sections 4.5.1, personal characteristics of the center owner
(competitiveness and leadership interest) and situational factors (facility attractiveness and
leadership role in the community) created a desirable initial level of motivation. Over the course
of implementation, internal staff realized the impacts of the implemented components. In fact,
comparing the perceived benefits (e.g., making center S1 the leader in the child daycare business
in the community) with the costs of the intervention, their overall perception of the intervention
was that it was a beneficial program (where loop R3 dominates loop B1 in the model,
Figure 4-5). Therefore, the initial high motivation of the internal stakeholders, particularly the
center owner, was maintained. With her and the staff motivated and excited about the program,
they were willing to communicate with the interventionists, receive advice from them and solve
possible issues throughout the implementation processes (loop R1, Figure 4-3).
Motivated internal stakeholders at S1 helped customize the intervention components, which
facilitated further maintenance. This required more communication between the internal
stakeholders and interventionists to fix the issues and plan for additional implementation of
modifications, which eventually transformed the intervention components into organizational
routines.
Once the intervention components were institutionalized, the internal stakeholders continued to
maintain the intervention with or without the help of interventionists. A staff member at S1
mentions:
We re-hauled the entire playground, added the trike path, planted fruit trees and other
trees, [and] had parent work days. We come out on Saturdays some days. Just want
needs to be done, step by step. We've had about four work days where we built things out
here without the children... We try to keep the staff motivated, because at first they didn't
really get it, but now they are adding it to their lesson plans and thinking about it all the
time. They picking books that have fruits and vegetables and fresh foods in them—farm
books and things like that, instead of your typical fantasy princess stuff.
The initial motivation of internal stakeholders in center S2 was not as high as in center S1. If
the center directors are not motivated enough about the intervention, they may affect the
perceptions of the staff and eventually they will not commit to better implementation and
maintenance of the implemented components. One of the staff at the local hub of S2 elaborates

93
on the commitment of directors and how it can make some child daycare centers more successful
than others:
…if you have a director X and center Y, and church you probably know this but [the]
church based child care doesn’t have high requirements for profit and they give them a
pass on certain things. So it’s different to see where the center director gets it and gets on
board with it to where you have had a good relationship with the local partnership and
they are prompt to do these kinds of things.
4.6.2 NCPP
Similar to child daycare center S1 in Shape NC, internal stakeholders at hospital N1 joined the
project with high initial motivation. Their motivation was then maintained over time by
communication with interventionists, fixing the issues, and seeing the impact of the intervention.
In section 4.5.1, we noted some examples of benefits to hospital from implementing the
intervention, such as competitiveness and community leadership.
Consequently, with motivated internal stakeholders at N1 the intervention was maintained
well and the internal stakeholders implemented further practices. Moreover, the motivation of
internal stakeholders accompanied by hospital administrative support enhanced implementation
and maintenance of the intervention. The motivation of administration is an essential factor,
particularly in large, complex organizations like hospitals. For example, given that there was no
initial grant to start the intervention, self-funding was a necessary factor to cover program costs.
Without the support of hospital administration, funding would not have been secured.
Overall in the NCPP project, external stakeholders were faced with lack of leadership support
in several hospitals, so much so that they tried to get verbal confirmation of administration
support for the program. One of the interventionists mentions:
Something that we require hospitals to do before they start working with us is to sign a
CEO commitment form. That form basically says: ‘Yes, personally I support this but also
I am going to put in my strategic plan, we’re going to work on this as an organization,
and there are the people that want to work on it from my hospital.’ Having that
leadership support is just so important, and as we go out and we visit hospitals and see
what they’re doing on the ground, and seeing the CEO support, we definitely see those

94
hospitals as moving forward more quickly than hospitals that have just mediocre or no
support for the wellness program.
Chief executive officers or directors may have different leadership skills and strategies, yet
their support is tied to their motivation and affected by endogenous organizational mechanisms,
i.e., the feedback loops affecting motivation in the model. With motivated internal stakeholders
along with the support of administration, the hospital practices intervention components and
gradually such components integrate with organizational processes and are routinely maintained.
The wellness program at hospital N1 experienced the transformation of new practices into
organizational routines. One of the internal stakeholders elaborates:
The wellness program is just a part of our life here. People are used to it, they’re very
committed to completing their preventive items, and that is still a part of the wellness
program with vitality, there is a prevention component to that.
This transformation facilitates the maintenance so much that interventionists, along with
internal stakeholders, believed that maintenance was not as hard as implementation. One of the
internal stakeholders says:
I think it’s pretty easy to maintain [the program] once you get there. Getting there could
be challenging for some people.
While high motivation reinforces several dynamic mechanisms in the model that lead to
better implementation and eventually better maintenance of the intervention, low motivation can
act in the opposite manner. Stakeholders who are not motivated might not communicate with the
interventionists as often as needed, causing them to face more challenges along the way to
implementation, which eventually decreases their motivation. Consequently, reduction in
financial and leadership support for implementation results in not fully or properly implementing
the intervention components. Internal stakeholders then perceive the program as a whole as not
beneficial, and such negative perceptions of the program feeds back to their motivation and
makes the situation even worse. This was the situation in hospital N2. The director of the
intervention at hospital N2 answers to the question, “Why did the hospital decide to join the
program at the beginning”:
I really don’t know! I’ve never been able to find out the actual answer. I think it was just
because somebody had brought it up in a meeting, and the CEO at that time was like,

95
‘Okay!’ and didn’t really know anything about it, because I actually went back to my HR
director… maybe two years ago, around the end of the first year of the program, when I
had been trying to offer a lot of proposals for things to do, and was not really getting
anywhere, and she said, I’m talking about the CEO, said, ‘he doesn’t care. He doesn’t
know what’s going on. He doesn’t have any interest in it.’… She was being nice to me,
telling me that information. She just said, ‘You know, you do with it what you feel like you
need to do.’
Hospital N2 tries the best they can to save money, even by laying off employees. Employees
are also so busy with their daily tasks that they do not have any additional time to spend, e.g., on
attending wellness programs. In fact, since the implementation was not properly done, the
intervention components never turned into organizational routines.
4.7 Discussion
In each case, the introduction of a new practice entails designing and implementing various
components, such as physical components (e.g., playground) and incentives (e.g., for employees
to exercise or quitting smoking). The design and implementation in each case can be seen as a
project comprised of various components. Execution of these components informs the progress
of the implementation phase and depends on the time allocated to implementation by the
interventionists, the quality of their efforts, and more importantly the motivation of internal
stakeholders to actively contribute to the project. Besides implementation, the maintenance of
newly implemented components is key to the long-term value of the intervention: the new
practices only have the potential for impacting organizational performance if they last. Our
qualitative modeling work elucidates a few exogenous factors (such as quality of efforts of
interventionists and the existence of program grants), as well as some endogenous mechanisms,
that moderate implementation and erosion rates.
Based on several endogenous reinforcing mechanisms, we present that early differences in
the implementation of interventions can end up with very different paths to success. For instance,
initial high motivation of internal stakeholders makes the organization become more motivated
to communicate with the interventionists, provide financial support for implementation, and
institutionalize the new practices, and thus see lower costs for maintaining them, further
increasing the perceived benefits, compared to another organization that started off on the wrong
foot. Also, for one organization, lack of initial motivation may limit the bandwidth of

96
communication, reduce the quality of design, reduce the stakeholder alignment, and lead to much
rework and wasted resources in the implementation phase, while another organization thrives. In
addition to making implementation problematic, these early differences can also be amplified
and lead to very different erosion rates. For instance, internal stakeholders who are less
motivated will be less likely to communicate with the interventionists (e.g., to raise emerging
issues) and hardly internalize and sustain changes without external prompts.
Furthermore, design quality emerged as an important aspect of the studied interventions
because a well-designed intervention matches the requirements for the organization at hand and
thus is less costly to organizations, may include more benefits, and is easier to implement and
maintain (see examples in Sections 4.5.2 and 4.5.7). The quality of design partially depends on
the skills and knowledge of the designers (in our cases, the interventionists), but more
importantly on the communication between designers and internal stakeholders. In fact, the
customization of the intervention based on the characteristics of each organization requires
ample communication between the interventionists and internal stakeholders. Communication
between internal stakeholders and interventionists sets the tone for whether new practices are
taken up and modified to best fit the organization’s internal and external environment, or are
ignored or even actively resisted. Taken together, communication and design quality create
potential reinforcing loops: increased motivation facilitates better communication, which
improves design, enhances perceived benefits, and keeps the internal stakeholders motivated.
In all our cases, motivation of internal stakeholders emerged as a critical part of explaining
performance heterogeneity across similar organizations. As discussed earlier, reinforcing loops
can amplify differences between two programs, if one faces initial lack of leadership support that
reduces motivation and communication and sows the seeds of future problems. Variations in the
development of each intervention were observed, but much of the difference in longer-term
performance levels could be better explained by the motivation of internal stakeholders. We
present several endogenous mechanisms which change the motivation dynamically over the
course of implementation, i.e., communication between internal stakeholders and
interventionists, intervention design quality, stakeholder alignment, and impact of implemented
components.
Our analysis points to a few reinforcing mechanisms, moderated by motivation,
communication, and design quality, which impact both initial implementation and erosion of

97
intervention components. We suggest that these reinforcing mechanisms can create path
dependencies in capability evolution trajectories (capabilities achieved due to the implemented
interventions) across organizations, leading to heterogeneity in performance, even when the
elements of the intervention are relatively well-known. Similar dynamic mechanisms were
presented for the BHC case in Chapter 3. The basic design, implementation, and maintenance of
new organizational processes are shared in developing many health interventions. In fact, there is
much variability in the three interventions and organizational contexts explored here. Therefore,
qualitatively, the dynamics discussed will be relevant to many settings. Yet the quantitative
analysis will be more dependent on the organizational context and indicates which loops will
dominate the dynamics in which organizational settings.
Finally, the endogenous perspective we employed offers a distinct way of interpreting
organizational performance and change. In this perspective, organizations may diverge into
different performance trajectories, not because the actual payoff landscape is very rugged [32]
and finding the best configuration is computationally intractable [33], but because actions taken
by organizational members and results observed complement each other in endogenous feedback
processes. While the strategic importance of some reinforcing processes, such as learning curves
[34] and network effects [35], are well established, we think this explanatory engine can be
fruitful in understanding a much wider set of phenomena in strategy, particularly in the health
literature. The feedback processes among communication, motivation, and design are just a few
examples. Using this perspective, researchers can identify and quantify the various feedback
processes relevant to each health organization setting, and managers can seek to activate specific
feedback loops in their favor and leverage those to distinguish their organization from the
competition.
4.8 Acknowledgements
Financial Support Provided through National Collaborative on Childhood Obesity Research
(NCCOR) Envision’s Comparative Modeling Network (CompMod) program and NIH Office of
Behavioral and Social Sciences Research (OBSSR) grant 1R21HL113680-01.

98
4.9 References
1. Schiller, J.S., et al., Early release of selected estimates based on data from the January-
September 2004 National Health Interview Survey. 2005, National Center for Health
Statistics. .
2. Ogden, C.L., et al., Prevalence of overweight and obesity in the United States, 1999-
2004. Jama-Journal of the American Medical Association, 2006. 295(13): p. 1549-1555.
3. Must, A., et al., The disease burden associated with overweight and obesity. Jama-
Journal of the American Medical Association, 1999. 282(16): p. 1523-1529.
4. Calle, E.E., et al., Overweight, obesity, and mortality from cancer in a prospectively
studied cohort of US adults. New England Journal of Medicine, 2003. 348(17): p. 1625-
1638.
5. World Development Indicators, Health expenditure, total (% of GDP). 2014, Online
Databank, The World Bank.
6. Hammond, R.A. and R. Levine, The economic impact of obesity in the United States.
Diabetes, metabolic syndrome and obesity : targets and therapy, 2010. 3: p. 285-295.
7. Begun, J.W., B. Zimmerman, and K. Dooley, Health care organizations as complex
adaptive systems. Advances in health care organization theory, 2003. 253: p. 288.
8. Plsek, P.E. and T. Greenhalgh, The challenge of complexity in health care. Bmj, 2001.
323(7313): p. 625-628.
9. Rahmandad, H. and N. Repenning, Capability erosion dynamics. Strategic Management
Journal, 2015: p. n/a-n/a.
10. Elias, A.A., L.S. Jackson, and R.Y. Cavana, Changing positions and interests of
stakeholders in environmental conflict: A New Zealand transport infrastructure case.
Asia Pacific Viewpoint, 2004. 45(1): p. 87-104.
11. Davis, K., Different stakeholder groups and their perceptions of project success.
International Journal of Project Management, 2014. 32(2): p. 189-201.
12. De Schepper, S., M. Dooms, and E. Haezendonck, Stakeholder dynamics and
responsibilities in Public–Private Partnerships: A mixed experience. International
Journal of Project Management, 2014. 32(7): p. 1210-1222.
13. Repenning, N.P., A simulation-based approach to understanding the dynamics of
innovation implementation. Organization Science, 2002. 13(2): p. 109-127.

99
14. Warren, K., Competitive strategy dynamics. 2002, Chichester: Wiley. xiii, 330 p.
15. Levitt, B. and J.G. March, Organizational Learning. Annual Review of Sociology, 1988.
14: p. 319-340.
16. Leonard-Barton, D., Core Capabilities and Core Rigidities - a Paradox in Managing
New Product Development. Strategic Management Journal, 1992. 13: p. 111-125.
17. Rahmandad, H., Effect of delays on complexity of organizational learning. Management
Science, 2008. 54(7): p. 1297-1312.
18. Sterman, J.D., Learning in and about complex systems. System Dynamics Review, 1994.
10(2-3): p. 91-330.
19. Easton, G.S. and S.L. Jarrell, The effects of total quality management on corporate
performance: An empirical investigation. The Journal of Business, 1998. 71(2): p. 253.
20. Hendricks, K.B. and V.R. Singhal, The Long-Run Stock Price Performance of Firms with
Effective TQM Programs. Management Science, 2001. 47(3): p. 359-368.
21. Repenning, N.P. and J.D. Sterman, Nobody ever gets credit for fixing problems that never
happened: Creating and sustaining process improvement. California Management
Review, 2001. 43(4): p. 64-+.
22. Sterman, J.K., N.P. Repenning, and F. Kofman, Unanticipated side effects of successful
quality programs: Exploring a paradox of organizational improvement. Management
Science, 1997. 43: p. 503-521.
23. Repenning, N.P., Understanding fire fighting in new product development. The Journal of
Product Innovation Management, 2001. 18: p. 285-300.
24. Repenning, N.P. and J.D. Sterman, Capability traps and self-confirming attribution
errors in the dynamics of process improvement. Administrative Science Quarterly, 2002.
47(2): p. 265-295.
25. Lee-Kwan, S.H., et al., Development and implementation of the Baltimore healthy carry-
outs feasibility trial: process evaluation results. BMC Public Health, 2013. 13: p. 638.
26. North Carolina Institute of Medicine, Promoting Healthy Weight for Young Children: A
Blueprint for Preventing Early Childhood Obesity in North Carolina. 2013, North
Carolina Institute of Medicine: Morrisville, NC.
27. Kolasa, K.M., et al., Moving toward healthier-eating environments in hospitals. Nutrition
Today, 2010. 45(2): p. 54-63.

100
28. Glaser, B.G. and A.L. Strauss, The discovery of grounded theory; strategies for
qualitative research. 1967, Chicago,: Aldine Pub. Co. x, 271 p.
29. Patton, M.Q. and M.Q. Patton, Qualitative research and evaluation methods. 3 ed. 2002,
Thousand Oaks, Calif.: Sage Publications. xxiv, 598, 65 p.
30. Sterman, J., Business dynamics : systems thinking and modeling for a complex world.
2000, Boston: Irwin/McGraw-Hill. xxvi, 982 p.
31. Damschroder, L.J., et al., Fostering implementation of health services research findings
into practice: a consolidated framework for advancing implementation science.
Implement Sci, 2009. 4: p. 50.
32. Levinthal, D.A., Adaptation on Rugged Landscapes. Management Science, 1997. 43(7):
p. 934-950.
33. Denrell, J., C. Fang, and S.G. Winter, The economics of strategic opportunity. Strategic
Management Journal, 2003. 24(10): p. 977-990.
34. Argote, L. and D. Epple, Learning-Curves in Manufacturing. Science, 1990. 247(4945):
p. 920-924.
35. Arthur, W.B., Competing Technologies, Increasing Returns, and Lock In by Historical
Events. Economic Journal, 1989. 99(1): p. 116-131.

101
Chapter 5 – Conclusion
Obesity has been recognized as a major public health challenge for over two decades in the U.S.
Despite Much research and substantial efforts to control and reduce obesity, it continues to be a
critical issue. Over the last two decades, public health research institutes have designed and
implemented many obesity prevention programs, with great attention to family- and community-
based initiatives; however, the effectiveness of these programs over the long run has been
questioned. In this dissertation, we took advantage of systems science methods to address some
of the challenges in this area of obesity research.
The complexity of the problems under study in this dissertation is beyond the understanding
of the human brain. In fact, research already shows that our brains are not well-equipped to infer
a complex web of causal pathways accurately without the assistance of computational tools [1-
4]. From this complexity emerges the use of systems science, which not only helps provide a
simplified version of reality, but also helps understand the consequences of any changes in
baselines. Systems science approaches can potentially help identify and quantify nonlinear
relationships among system components, feedback loops between component parts, and time-
delayed effects, among others [5]. The use of systems science as a branch of industrial and
systems engineering and management sciences in health research is not at all new. However, its
use in obesity prevention interventions is relatively new, particularly in understanding the
dynamics of organizational health interventions. We provide preliminary evidence on the
dynamics of the implementation and maintenance of such interventions. We also discuss study
limitations and areas for future research in each essay, but in a nutshell, closer integration of
quantitative data with our models can enhance confidence in our results.
For the first essay ( Chapter 2), we conducted a systematic review of parent-based social
influence mechanisms in obesity interventions in the family setting. We not only followed the
best practices for systematic reviews, but also extended the common reviewing toolbox and
summarized the findings from 21 articles in a causal pathway diagram. The diagram, adopted
from systems thinking and system dynamics, offers a structured graphical summary of the key
mechanisms identified in the literature. We coded the reviewed interventions for three core social

102
influence mechanisms: 1) a supportive social environment; 2) modeling healthy eating and
activity patterns; and 3) praise and encouragement for desirable behaviors. We then focused on
teasing out the components of interventions, mechanisms of impact, and outcomes to inform
social influence mechanisms and future intervention designs; these mechanisms are summarized
in the causal loop diagram. The diagram helps identify how intervention components pass
through the three core social influence mechanisms. Given our discussion of the durability of the
three social influence mechanisms, intervention developers can target those components to pass
through the most durable social influences. The diagram also provides a big picture of the current
contributions in the literature and can help highlight the areas in need of further empirical
research. In addition to the causal diagram and the review of social influence mechanisms, we
provide insights from the reviewed articles to improve the efficacy of interventions, such as
targeting families with young children, starting treatment from the early stages of obesity,
focusing on what can be eaten vs. what cannot be eaten [6], and focusing on health-centered
rather than weight-centered approaches [6, 7]. Moreover, treating parents as the direct agents of
change in the family setting has additional benefits that can help in the following ways: dealing
with children’s stigmatization about being “overweight patients” [7]; making attending the
intervention sessions without the children easier for parents [8, 9]; increasing the productivity of
sessions in terms of problem solving and discussion time [9]; and decreasing costs of
interventions with fewer change agents [10-12]. These benefits increase the motivation of
parents to participate, which further helps increase the sustainability of interventions and parents’
commitment. Overall, our review suggests that interventions that mainly utilize social influence
pathways are potentially promising, and we offer a template for their mechanisms of impact.
However, much remains to be understood about the best study designs and the relative impact of
such interventions in comparison with alternatives.
In the second essay ( Chapter 3), we discuss the great heterogeneity in the impact of
implementation of obesity prevention interventions in communities. To understand this
heterogeneity, we focused on an obesity prevention intervention, implemented in food carry-outs
in low-income urban areas of Baltimore, that aims to improve the dietary behavior of adults
through better access to healthier foods and point-of-purchase prompts. Based on qualitative
analysis of interview data and the literature, we developed a dynamic model enabling us to study
the dynamic mechanisms of implementation of the intervention and various trade-offs in

103
endogenous mechanisms. We present how the dynamics surrounding communication,
motivation, and depreciation of interventions can create tipping dynamics in the Adoption,
Implementation, and Maintenance (AIM) process. Specifically, small changes in allocation of
resources to an intervention could have a disproportionate long-term impact, if those additional
resources can turn stakeholders into allies of the intervention, reducing the depreciation rates and
enhancing sustainability. For example, in our simulation analysis, the dynamics mechanisms
create non-linearities in the model and a tipping point on the level of interventionists’ efforts,
which leads to widely different outcomes of small changes; once the level of interventionists’
efforts exceeds the tipping threshold, the intervention is sustainable. We also discuss how quality
of the intervention design, communication among stakeholders, and stakeholder motivation can
affect intervention depreciation. A well-designed intervention sustains stakeholder motivation
and limits later deterioration; therefore, changes that increase the quality of the original design
are critical for the long-term success of AIM. Moreover, our model highlights the common trade-
off between designing and implementing intervention components and communicating with
stakeholders to help build confidence and improve the quality of the intervention. Given that
many interventionists are more familiar with the former, there may be a built-in bias in the AIM
process against adequate investment in the communication processes central to AIM dynamics.
Overcoming that bias and tuning communication levels to address both motivation and quality
considerations is an important leverage point for training successful interventionists.
In the third essay ( Chapter 4), we presented two additional case studies to understand the
dynamics of implementation and maintenance of organization health interventions, particularly
obesity prevention interventions. We used interview data extensively to develop a causal loop
diagram and outlined how endogenous mechanisms can affect the implementation and
sustainability of intervention programs. In our analysis based on the dynamic mechanisms in the
diagram, high motivation of internal stakeholders is the key to success, because it encourages the
original implementation and reduces future depreciation, allowing for sustainability and growth
of the intervention and materialization of financial benefits. Moreover, initial high motivation of
internal stakeholders makes the organization more motivated to communicate with the
interventionists, provide financial support for implementation, and institutionalize the new
practices, and thus see lower costs for maintaining them, further increasing the perceived
benefits, compared to another organization that starts off on the wrong foot. Furthermore, lack of

104
initial motivation for one organization may limit the bandwidth of communication, reduce the
quality of design, reduce the stakeholder alignment, and lead to much rework and wasted
resources in the implementation phase, while another organization thrives. In addition to making
implementation problematic, these early differences (e.g., differences in motivation of
stakeholders) can also be amplified and lead to very different erosion rates. For instance, internal
stakeholders who are not much motivated will be less likely to communicate with the
interventionists (e.g., to raise emerging issues) and will hardly internalize and sustain changes
without external prompts. Our analysis points to a few reinforcing mechanisms—moderated by
motivation, communication, and design quality—that impact both initial implementation and
erosion of intervention components. These reinforcing loops can amplify differences between
two intervention programs, if one faces initial lack of leadership support that reduces motivation
and communication and sows the seeds of future problems. Overall, heterogeneity among the
case studies presented in the second and third essays increases the generalizability of the results;
however, in the absence of detailed quantitative data for a larger number of cases, one should be
cautious about generalizing the findings or seeking operational advice from our model.

105
5.1 References
1. Sweeney, L.B. and J.D. Sterman, Bathtub dynamics: initial results of a systems thinking
inventory. System Dynamics Review, 2000. 16(4): p. 249-286.
2. Cronin, M.A., C. Gonzalez, and J.D. Sterman, Why don’t well-educated adults
understand accumulation? A challenge to researchers, educators, and citizens.
Organizational Behavior and Human Decision Processes, 2009. 108(1): p. 116-130.
3. Sterman, J.D., Modeling managerial behavior: Misperceptions of feedback in a dynamic
decision making experiment. Management science, 1989. 35(3): p. 321-339.
4. Abdel-Hamid, T., et al., Public and health professionals’ misconceptions about the
dynamics of body weight gain/loss. System Dynamics Review, 2014. 30(1-2): p. 58-74.
5. Mabry, P.L., et al., Systems Science: A Revolution in Public Health Policy Research.
American Journal of Public Health, 2010. 100(7): p. 1161-1163.
6. Epstein, L.H., et al., Increasing fruit and vegetable intake and decreasing fat and sugar
intake in families at risk for childhood obesity. Obes Res, 2001. 9(3): p. 171-8.
7. Golan, M. and S. Crow, Targeting parents exclusively in the treatment of childhood
obesity: long-term results. Obes Res, 2004. 12(2): p. 357-61.
8. Wardle, J., et al., Increasing children's acceptance of vegetables; a randomized trial of
parent-led exposure. Appetite, 2003. 40(2): p. 155-162.
9. Janicke, D.M., et al., Comparison of parent-only vs family-based interventions for
overweight children in underserved rural settings: outcomes from project STORY. Arch
Pediatr Adolesc Med, 2008. 162(12): p. 1119-25.
10. Resnick, E.A., et al., The CHEER study to reduce BMI in Elementary School students: a
school-based, parent-directed study in Framingham, Massachusetts. J Sch Nurs, 2009.
25(5): p. 361-72.
11. West, F., et al., Randomised clinical trial of a family-based lifestyle intervention for
childhood obesity involving parents as the exclusive agents of change. Behav Res Ther,
2010. 48(12): p. 1170-9.
12. Boutelle, K.N., G. Cafri, and S.J. Crow, Parent-Only Treatment for Childhood Obesity: A
Randomized Controlled Trial. Obesity, 2011. 19(3): p. 574-580.