three agulhas rings observed during the benguela current ... · south atlantic, and in the benguela...
TRANSCRIPT
JOURNAL OF GEOPHYSICAL RESEARCH, VOL. 104, NO. C9, PAGES 20,971-20,985, SEPTEMBER 15, 1999
Three Agulhas rings observed during the Benguela Current Experiment
Silvia L. Garzoli, • Philip L. Richardson, 2 Christopher M. Duncombe Rae, 3 David M. Fratantoni, 2 Gustavo J. Gofii, • and Andreas J. Roubicek •
Abstract. A field program to study the circulation of the Benguela Current and its extension into the southeastern Atlantic Ocean has completed the survey and instrument deployment phase. We report here new observations of three Agulhas rings north and west of Cape Town, South Africa. Three mesoscale anticyclonic rings initially identified by means of TOPEX/POSEIDON altimetry were surveyed with expendable bathythermographs, conductivity-temperature-depth-oxygen profiles, direct current measurements from a lowered acoustic Doppler current profiler, a hull-mounted acoustic Doppler current profiler, and satellite-tracked surface drifters. Characteristics of the rings are presented, and their origins are discussed. Two are typical Agulhas rings surveyed at different times after their generation; the third Agulhas ring has an anomalous water mass structure whose most likely origin is the Subtropical Front.
1. Introduction
The South Atlantic Ocean is a major conduit for warm upper layer water that flows northward across the equator in compensation for the colder southward flowing North Atlantic Deep Water. Gordon et al. [1992] concluded that the major proportion of deep water exported from the North Atlantic is balanced by northward flow of lower thermocline and inter- mediate water through the South Atlantic Ocean. This large- scale thermohaline circulation, the so-called conveyor belt [Broecker, 1991], is responsible for the northward heat flux through the South Atlantic. Within the subtropical region the northward heat flux estimates range from 0.5-1.3 PW [Peterson and Stramma, 1991; Saunders and King, 1995].
The Benguela Current is a broad, northward flow adjacent to southwestern Africa that forms the eastern limb of the
South Atlantic Subtropical Gyre. At 30øS the entire current is confined between the African coast and the Walvis Ridge near the Greenwich meridian. The Benguela Current has two pri- mary sources of water, the South Atlantic Current and Indian Ocean Water that rounds the southern tip of Africa via the Agulhas Current [Gordon et al., 1992].
Indian Ocean Water enters the South Atlantic by both a ring-shedding process at the western end of the Agulhas Ret- roflection and by intermittent streams or plumes of Indian Ocean Water. Ship and satellite data have revealed the pres- ence of numerous large (300- to 400-km diameter) rings of Agulhas Water embedded in the Benguela Current [i.e., Olson and Evans, 1986; Lutjeharms and van Ballegooyen, 1988; Gor- don and Haxby, 1990; Duncombe Rae, 1991]. These rings form as the western part of the Agulhas Retroflection pinches off
•Atlantic Oceanographic and Meteorological Laboratory, NOAA, Miami, Florida.
2Woods Hole Oceanographic Institution, Woods Hole, Massachu- setts.
3Sea Fisheries Research Institute, Cape Town, South Africa.
Copyright 1999 by the American Geophysical Union.
Paper number 1999JC900060. 0148-0227/99/1999JC900060509.00
from the main current. The fate of Agulhas rings and their importance to northward transport of intermediate water are important issues.
Several studies provide estimates of the volume and heat transport carried by these rings from the Indian Ocean to the Atlantic Ocean. On the basis of hydrographic data, Gordon [1985] and Gordon et al. [1987] suggested a net transfer be- tween 5 to 15 Sv (1 Sv = 10 6 m 3 s-•). Gordon and Haxby [1990] used hydrographic data to estimate the transport of Indian Ocean Water by Agulhas rings to be between 10 and 15 Sv. Byrne et al. [1995] used maps of surface height anomalies derived from Geosat data to track six Agulhas rings per year and estimated a total value of at least 5 Sv of Indian Ocean
Water entering the South Atlantic via those rings. van Balle- gooyen et al. [1994] observed a total of 14 anticyclonic rings generated by the Agulhas Current over the 2-year period of their study. They estimated a volume flux of Indian Ocean Water warmer than 10øC into the South Atlantic via the Agul- has eddy field of 6.3 Sv and a corresponding heat flux of 0.045 PW.
From 1992 to 1994 the Benguela Sources and Transports Experiment (BEST) [Garzoli and Gordon, 1996] studied the flow of the eastern boundary of the South Atlantic Subtropical Gyre. One of the main results of that program was the confir- mation that transients, mostly in the form of Agulhas rings, are a major component of the Benguela Current. Observations revealed that at 30øS the Benguela Current transport consisted of a nearly steady flow confined between the South African coast and approximately 4øE (amounting to 10 Sv in the mean) and a more transient flow (3 Sv in the mean) between 4øE and the Walvis Ridge [Garzoli and Gordon, 1996]. Duncombe Rae et al. [1996] concluded that a minimum of four to six rings of Agulhas origin entered the Cape Basin per year during BEST and were responsible for the transfer of 0.007 PW and 2.6-3.8 Sv between the two basins. Gofii et al. [1997] used BEST data and TOPEX/POSEIDON-derived maps of upper layer thick- ness to estimate that five, four, and six rings were shed from the Agulhas Current during 1993, 1994, and 1995, respectively, with an average of 1 Sv contributed by each to the volume transport of the Benguela Current. Arhan et al. [this issue]
20,971
-10' -fi" 0 ø G' 1l¾ 1R' -15'" ='=" "==' --" ==" '=== =='= ===' --" '"' "==' === ........... .•
ß .•, , •;..• ....... ..•..,•..... ........ . .......... . .......... •..• .......... . ............... : .......... ..,...•....
-20' --•.6•?,.4:• , "::' • •,. '"':'. ...... J 20' I" --" • DRIFTERS ' f--_'%;.;{.Y_'. t.. ,,. "•;•.:.:•. ' ' .......... ' J •,•,• MOORINGS ?.,•' ,"." ' '5 \ N, '"•;•?!.. ß ,x;•:• ' '>" ,/'"' t ' ' '-, ", ", '%1..
.;?.. • _ ,, ,?,o ; i t, 7 .:
.... •'"'- ' t ",t N •, •::• ..
.•.1. .'i:'"'. • •i -,.• . .. ,,,•'; •.il•. I .... •':•.. ' •,. ,/'•,,,• I •,•, •¾ ' .:...;..,. ,-'. ,/T I \'•",. l'k
:.•.:...• j.-- , ! • : '?• I " :;:::: / t :•t ....... [ "• --• •** ..... •:. •,•'..•..:.•:.•<-'•-•-'.%,. .:t• .....
o •.;,.. ..•} • • •, • \ .... :. :..: I ... :" "• • kt•? t ' "-..,':, ....... •.. ". - -. ' ..:,, •-'•t ,.-•,.• I ""-'k ....
ß ½-, ,• '- ....
,, .•:.x':.'-'.. '•' - J • ',,- "•..' •• ]/*;';t.,,•.Z•• . i Cape Town ..... -,,-, ! o _ LL.•, ' • '' •• - ,:, ""
.40ø•:• ....... •':•-'•__i:•;.•/•: • .., •':.":;•..::• • .: • • -• •'•: -..• ...... .• ........ •.;.40 ø -10' - 5 ....... 5 .... I I- ' ........ 115" ..... 20--
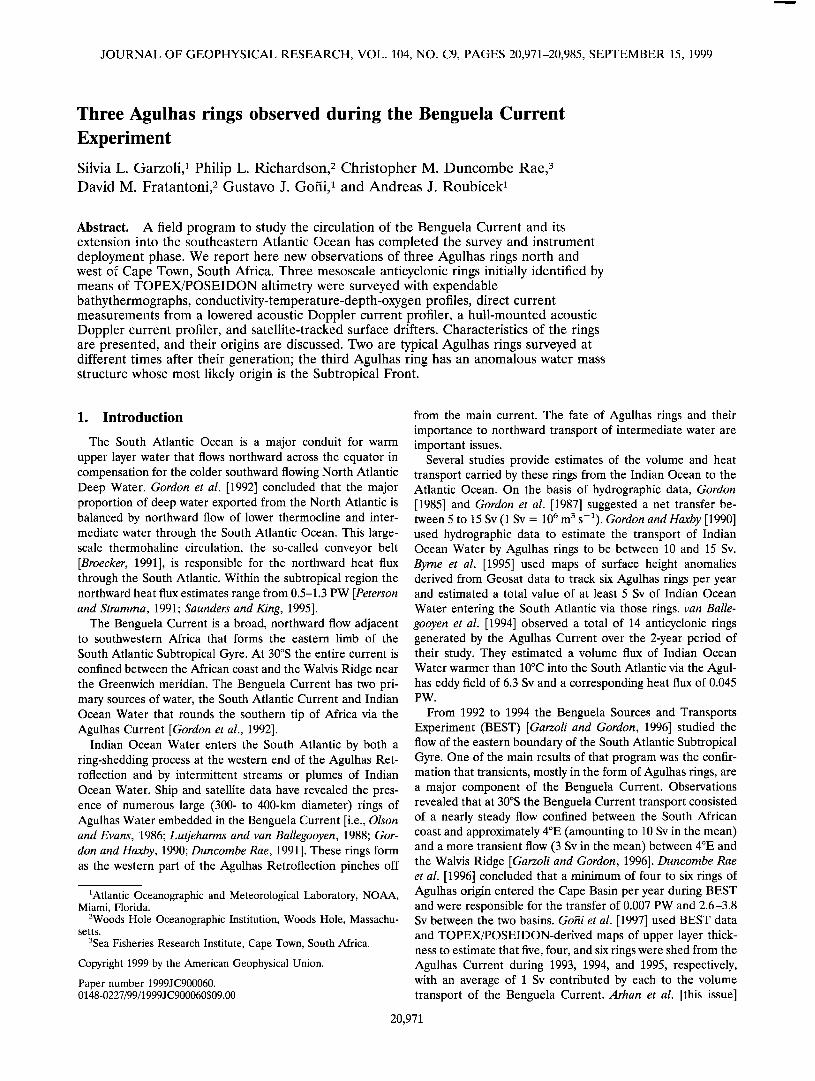
Figure 1. Cruise track and location of the stations occupied during the R/V Seward Johnson cruise, Sep- tember 4-30, 1997. The RAFOS and ALFOS floats will drift for 2 years. Three Agulhas rings were found and surveyed near 31.0øS, 9.4øE; 31.5øS, 2.3øW; and 29.8øS, 6.1øW.
....•..• . •....•-:;.'-; ' -.-..
30oS •. . ..• :.. .... •.• • • .% •.•.;;--; • "•. . .....
• ..... ;'•v• .• ..... e ..... ß ß • .... •.-,, •. .-..
f ..:'• , "-•?"• • .•."Ex• '•;"•,•x © . L. & '..E ".: •; •-'•' 'RING 3 •
• •.•:•- • ½• '• •T•'-;• % •" •a. '• ' {•' •-•". •- • • '•2 ' '• .. . .:• • ...... ,•/,'- -•x ..... .• x•. >-• ...•
10øW 0 ø 10øE 20øE 30øE
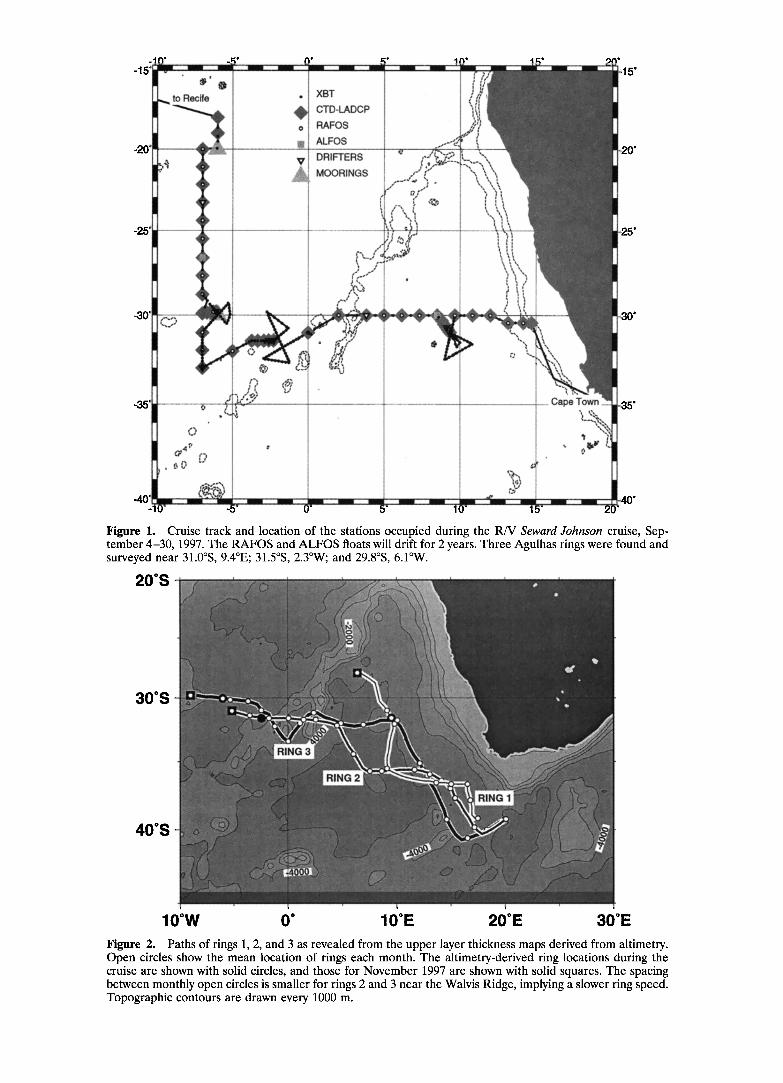
Figure 2. Paths of rings 1, 2, and 3 as revealed from the upper layer thickness maps derived from altimetry. Open circles show the mean location of rings each month. The altimetry-derived ring locations during the cruise are shown with solid circles, and those for November 1997 are shown with solid squares. The spacing between monthly open circles is smaller for rings 2 and 3 near the Walvis Ridge, implying a slower ring speed. Topographic contours are drawn every 1000 m.
GARZOLI ET AL.: AGULHAS RINGS IN BENGUELA CURRENT 20 973
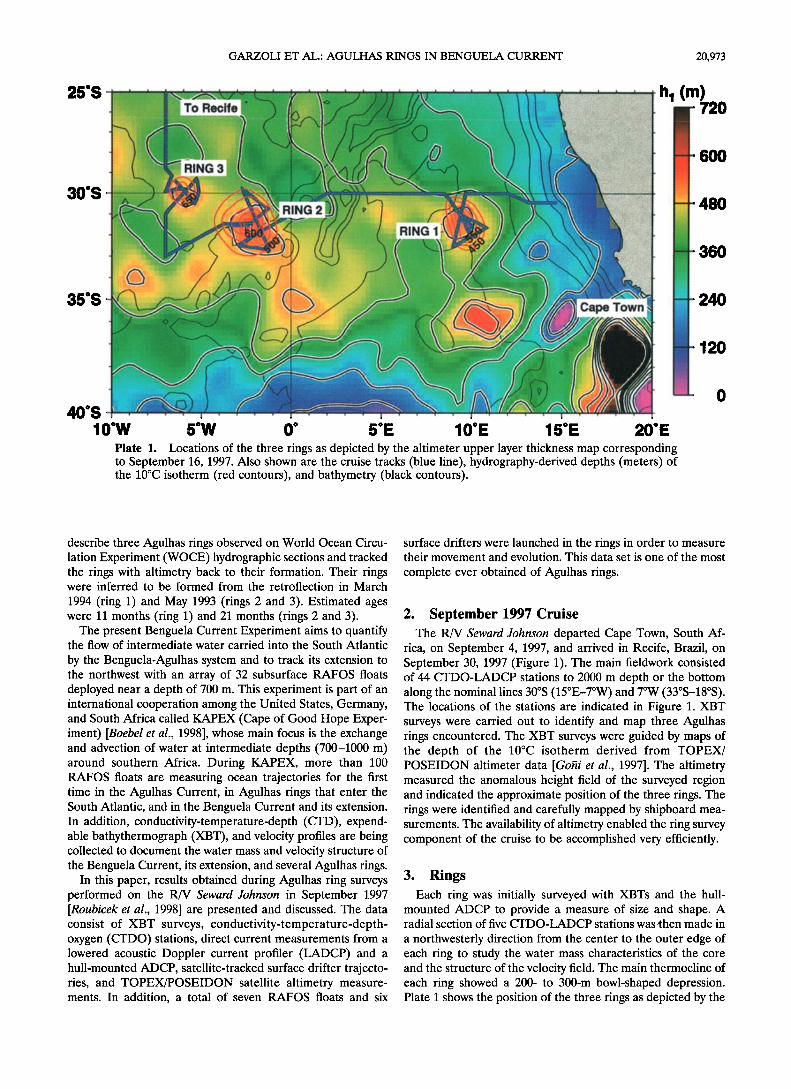
10øW 5øW 0 ø 5øE 10øE 15øE 20øE Plate 1. Locations of the three rings as depicted by the altimeter upper layer thickness map corresponding to September 16, 1997. Also shown are the cruise tracks (blue line), hydrography-derived depths (meters) of the 10øC isotherm (red contours), and bathymetry (black contours).
(m) 720
600
480
360
240
ß 12o
describe three Agulhas rings observed on World Ocean Circu- lation Experiment (WOCE) hydrographic sections and tracked the rings with altimetry back to their formation. Their rings were inferred to be formed from the retroflection in March
1994 (ring 1) and May 1993 (rings 2 and 3). Estimated ages were 11 months (ring 1) and 21 months (rings 2 and 3).
The present Benguela Current Experiment aims to quantify the flow of intermediate water carried into the South Atlantic
by the Benguela-Agulhas system and to track its extension to the northwest with an array of 32 subsurface RAFOS floats deployed near a depth of 700 m. This experiment is part of an international cooperation among the United States, Germany, and South Africa called KAPEX (Cape of Good Hope Exper- iment) [Boebel et al., 1998], whose main focus is the exchange and advection of water at intermediate depths (700-1000 m) around southern Africa. During KAPEX, more than 100 RAFOS floats are measuring ocean trajectories for the first time in the Agulhas Current, in Agulhas rings that enter the South Atlantic, and in the Benguela Current and its extension. In addition, conductivity-temperature-depth (CTD), expend- able bathythermograph (XBT), and velocity profiles are being collected to document the water mass and velocity structure of the Benguela Current, its extension, and several Agulhas rings.
In this paper, results obtained during Agulhas ring surveys performed on the R/V Seward Johnson in September 1997 [Roubicek et al., 1998] are presented and discussed. The data consist of XBT surveys, conductivity-temperature-depth- oxygen (CTDO) stations, direct current measurements from a lowered acoustic Doppler current profiler (LADCP) and a hull-mounted ADCP, satellite-tracked surface drifter trajecto- ries, and TOPEX/POSEIDON satellite altimetry measure- ments. In addition, a total of seven RAFOS floats and six
surface drifters were launched in the rings in order to measure their movement and evolution. This data set is one of the most
complete ever obtained of Agulhas rings.
2. September 1997 Cruise The R/V Seward Johnson departed Cape Town, South Af-
rica, on September 4, 1997, and arrived in Recife, Brazil, on September 30, 1997 (Figure 1). The main fieldwork consisted of 44 CTDO-LADCP stations to 2000 m depth or the bottom along the nominal lines 30øS (15øE-7øW) and 7øW (33øS-18øS). The locations of the stations are indicated in Figure 1. XBT surveys were carried out to identify and map three Agulhas rings encountered. The XBT surveys were guided by maps of the depth of the 10øC isotherm derived from TOPEX/ POSEIDON altimeter data [Go•i et al., 1997]. The altimetry measured the anomalous height field of the surveyed region and indicated the approximate position of the three rings. The rings were identified and carefully mapped by shipboard mea- surements. The availability of altimetry enabled the ring survey component of the cruise to be accomplished very efficiently.
3. Rings Each ring was initially surveyed with XBTs and the hull-
mounted ADCP to provide a measure of size and shape. A radial section of five CTDO-LADCP stations was then made in
a northwesterly direction from the center to the outer edge of each ring to study the water mass characteristics of the core and the structure of the velocity field. The main thermocline of each ring showed a 200- to 300-m bowl-shaped depression. Plate 1 shows the position of the three rings as depicted by the
20,974 GARZOLI ET AL.: AGULHAS RINGS IN BENGUELA CURRENT
. Ring ø 30øS
32øS
e o
o
ADCPo 25-200 rn Velocity ø ø XBT Depth of 10 ø Isotherm
TOPEX bpper Layer Thickness (Sep 07) o
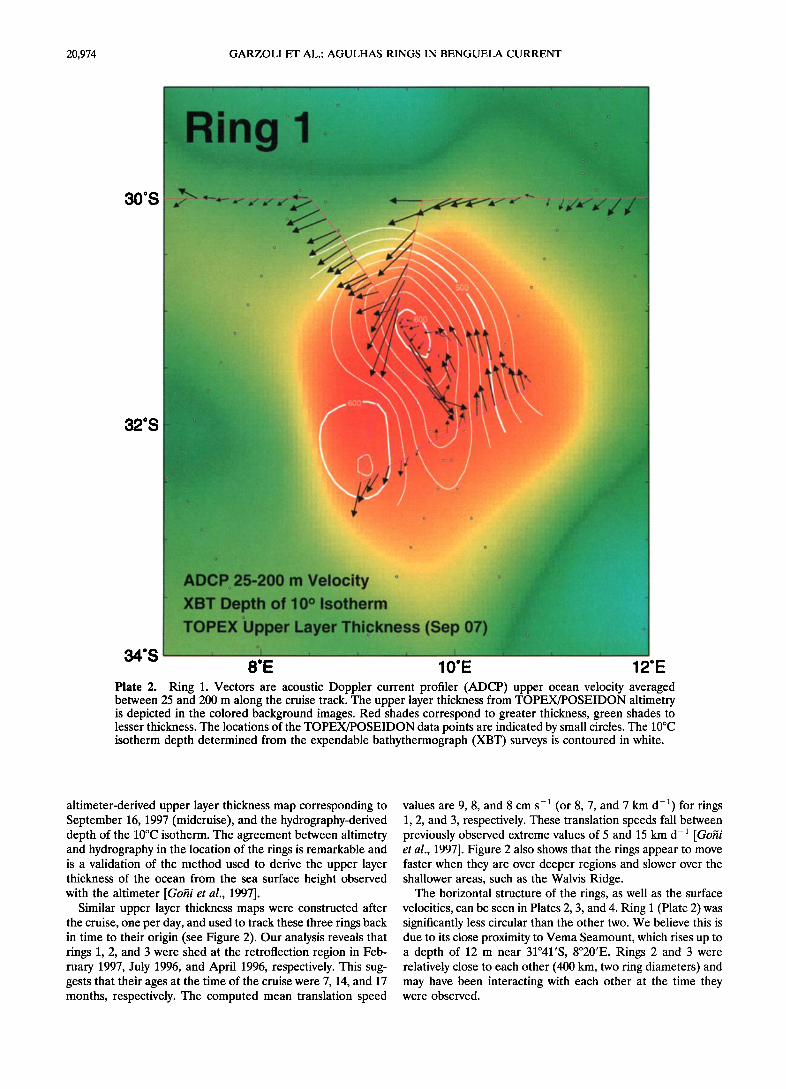
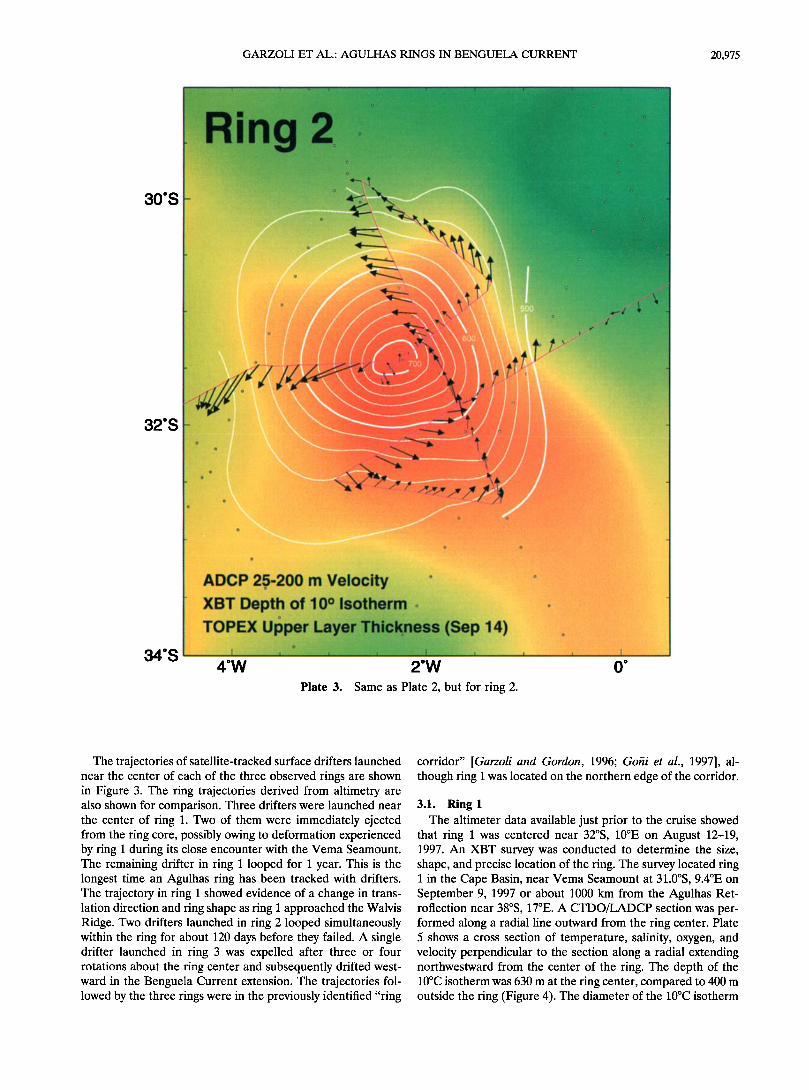
34øS 8OE 10øE 12øE Plate 2. Ring l. Vectors are acoustic Doppler current profiler (ADCP) upper ocean velocity averaged between 25 and 200 m along the cruise track. The upper layer thickness from TOPEX/POSEIDON altimetry is depicted in the colored background images. Red shades correspond to greater thickness, green shades to lesser thickness. The locations of the TOPEX/POSEIDON data points are indicated by small circles. The 10øC isotherm depth determined from the expendable bathythermograph (XBT) surveys is contoured in white.
altimeter-derived upper layer thickness map corresponding to September 16, 1997 (midcruise), and the hydrography-derived depth of the 10øC isotherm. The agreement between altimetry and hydrography in the location of the rings is remarkable and is a validation of the method used to derive the upper layer thickness of the ocean from the sea surface height observed with the altimeter [Go•i et al., 1997].
Similar upper layer thickness maps were constructed after the cruise, one per day, and used to track these three rings back in time to their origin (see Figure 2). Our analysis reveals that rings 1, 2, and 3 were shed at the retroflection region in Feb- ruary 1997, July 1996, and April 1996, respectively. This sug- gests that their ages at the time of the cruise were 7, 14, and 17 months, respectively. The computed mean translation speed
values are 9, 8, and 8 cm s -• (or 8, 7, and 7 km d-I) for rings 1, 2, and 3, respectively. These translation speeds fall between previously observed extreme values of 5 and 15 km d -• [Gogi et al., 1997]. Figure 2 also shows that the rings appear to move faster when they are over deeper regions and slower over the shallower areas, such as the Walvis Ridge.
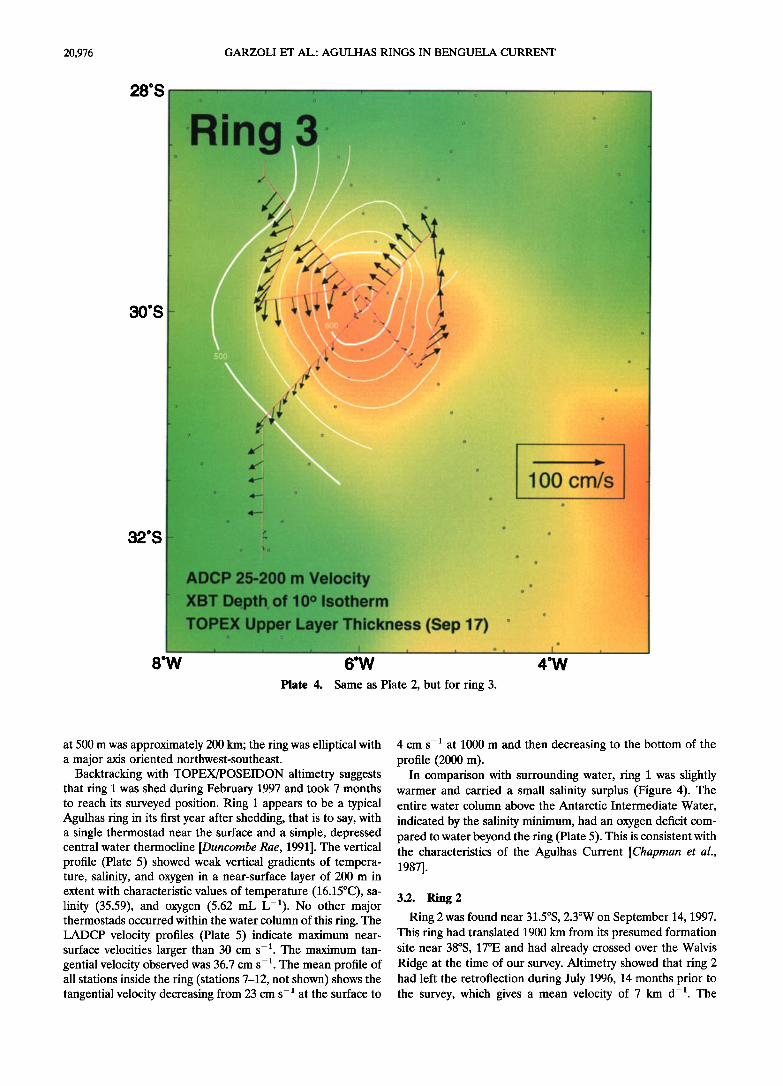
The horizontal structure of the rings, as well as the surface velocities, can be seen in Plates 2, 3, and 4. Ring 1 (Plate 2) was significantly less circular than the other two. We believe this is due to its close proximity to Vema Seamount, which rises up to a depth of 12 m near 31ø41'S, 8ø20'E. Rings 2 and 3 were relatively close to each other (400 km, two ring diameters) and may have been interacting with each other at the time they were observed.
GARZOLI ET AL.: AGULHAS RINGS IN BENGUELA CURRENT 20,975
30øS
32øS
34øS , ,
in
o
*-1
ADCP 2•5-200 rn Velocity XBT Depth of 10 ø Isotherm o
TOPEX Ul•per Layer Thickeness (Sep 14) , I i
o
4øW 2 øW
Plate 3. Same as Plate 2, but for ring 2.
,
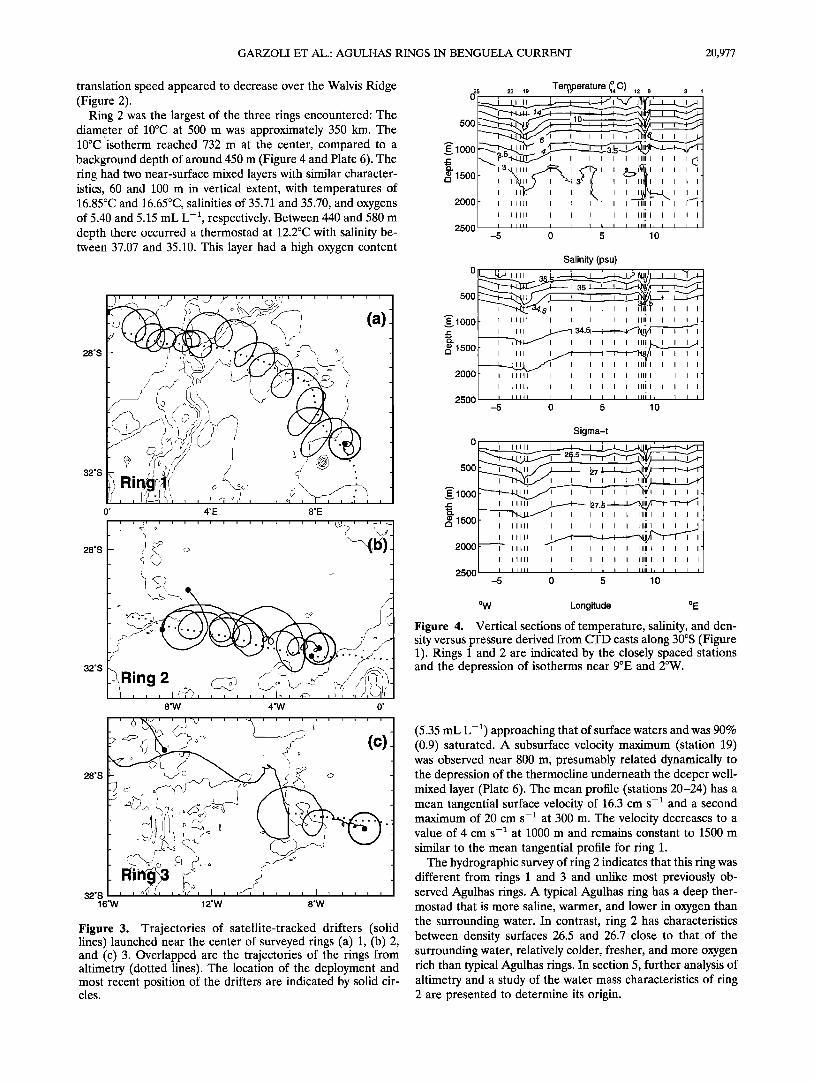
The trajectories of satellite-tracked surface drifters launched near the center of each of the three observed rings are shown in Figure 3. The ring trajectories derived from altimetry are also shown for comparison. Three drifters were launched near the center of ring 1. Two of them were immediately ejected from the ring core, possibly owing to deformation experienced by ring 1 during its close encounter with the Vema Seamount. The remaining drifter in ring 1 looped for 1 year. This is the longest time an Agulhas ring has been tracked with drifters. The trajectory in ring 1 showed evidence of a change in trans- lation direction and ring shape as ring 1 approached the Walvis Ridge. Two drifters launched in ring 2 looped simultaneously within the ring for about 120 days before they failed. A single drifter launched in ring 3 was expelled after three or four rotations about the ring center and subsequently drifted west- ward in the Benguela Current extension. The trajectories fol- lowed by the three rings were in the previously identified "ring
corridor" [Garzoli and Gordon, 1996; Gohi et al., 1997], al- though ring 1 was located on the northern edge of the corridor.
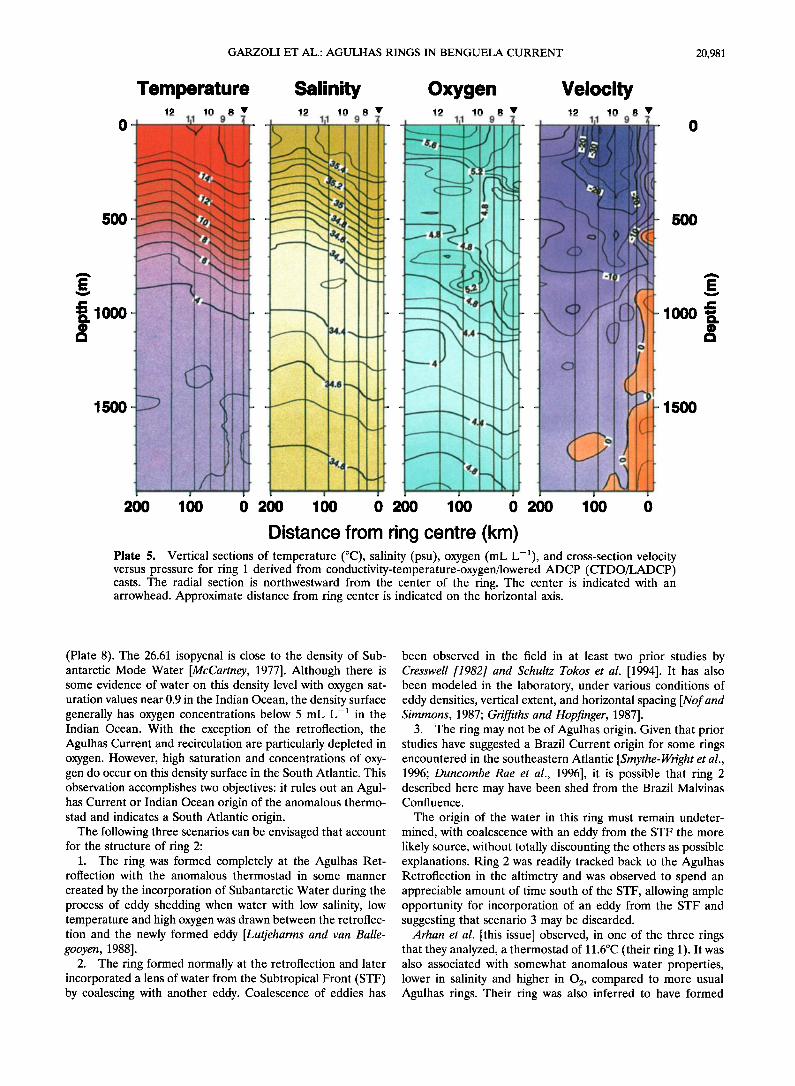
3.1. Ring 1 The altimeter data available just prior to the cruise showed
that ring 1 was centered near 32øS, 10øE on August 12-19, 1997. An XBT survey was conducted to determine the size, shape, and precise location of the ring. The survey located ring 1 in the Cape Basin, near Vema Seamount at 31.0øS, 9.4øE on September 9, 1997 or about 1000 km from the Agulhas Ret- roflection near 38øS, 17øE. A CTDO/LADCP section was per- formed along a radial line outward from the ring center. Plate 5 shows a cross section of temperature, salinity, oxygen, and velocity perpendicular to the section along a radial extending northwestward from the center of the ring. The depth of the 10øC isotherm was 630 m at the ring center, compared to 400 m outside the ring (Figure 4). The diameter of the 10øC isotherm
20,976 GARZOLI ET AL.: AGULHAS RINGS IN BENGUELA CURRENT
i
',ng
30os -
o
32øS
8'W
ADCP 25-200 rn Velocity XBT Depth of 10 o Isotherm
TOPEX Upper Layer Thickness (Sep 17) o
t ......... I ................... t i ! ..... o t
60W
Plate 4. Same as Plate 2, but for ring 3.
100 cm/s
o
o
at 500 m was approximately 200 km; the ring was elliptical with a major axis oriented northwest-southeast.
Backtracking with TOPEX/POSEIDON altimetry suggests that ring 1 was shed during February 1997 and took 7 months to reach its surveyed position. Ring 1 appears to be a typical Agulhas ring in its first year after shedding, that is to say, with a single thermostad near the surface and a simple, depressed central water thermocline [Duncombe Rae, 1991]. The vertical profile (Plate 5) showed weak vertical gradients of tempera- ture, salinity, and oxygen in a near-surface layer of 200 m in extent with characteristic values of temperature (16.15øC), sa- linity (35.59), and oxygen (5.62 mL L-•). No other major thermostads occurred within the water column of this ring. The LADCP velocity profiles (Plate 5) indicate maximum near- surface velocities larger than 30 cm s -•. The maximum tan- gential velocity observed was 36.7 cm s -•. The mean profile of all stations inside the ring (stations 7-12, not shown) shows the tangential velocity decreasing from 23 cm s- • at the surface to
4 cm s -• at 1000 m and then decreasing to the bottom of the profile (2000 m).
In comparison with surrounding water, ring 1 was slightly warmer and carried a small salinity surplus (Figure 4). The entire water column above the Antarctic Intermediate Water,
indicated by the salinity minimum, had an oxygen deficit com- pared to water beyond the ring (Plate 5). This is consistent with the characteristics of the Agulhas Current [Chapman et al., 19871 .
3.2. Ring 2
Ring 2 was found near 31.5øS, 2.3øW on September 14, 1997. This ring had translated 1900 km from its presumed formation site near 38øS, 17øE and had already crossed over the Walvis Ridge at the time of our survey. Altimetry showed that ring 2 had left the retroflection during July 1996, 14 months prior to the survey, which gives a mean velocity of 7 km d -•. The
GARZOLI ET AL.: AGULHAS RINGS IN BENGUELA CURRENT 20,977
translation speed appeared to decrease over the Walvis Ridge (Figure 2).
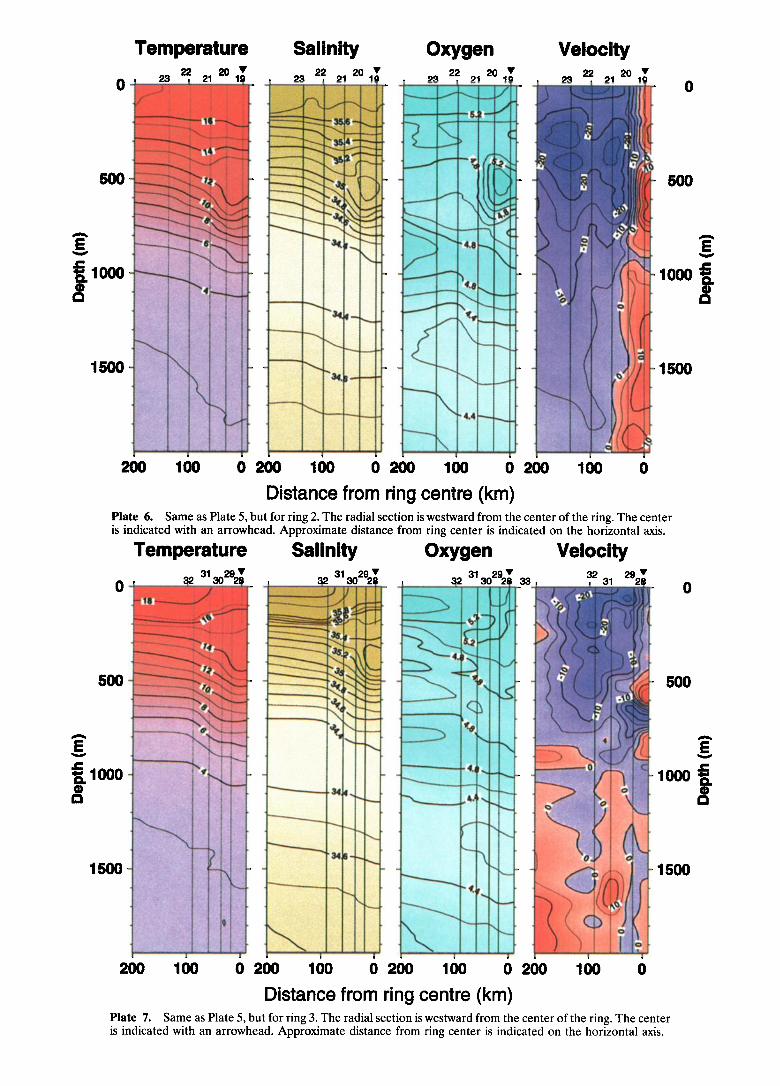
Ring 2 was the largest of the three rings encountered: The diameter of 10øC at 500 m was approximately 350 km. The 10øC isotherm reached 732 m at the center, compared to a background depth of around 450 m (Figure 4 and Plate 6). The ring had two near-surface mixed layers with similar character- istics, 60 and 100 m in vertical extent, with temperatures of 16.85øC and 16.65øC, salinities of 35.71 and 35.70, and oxygens of 5.40 and 5.15 mL L -z, respectively. Between 440 and 580 m depth there occurred a thermostad at 12.2øC with salinity be- tween 37.07 and 35.10. This layer had a high oxygen content
32øS
Figure 3. Trajectories of satellite-tracked drifters (solid lines) launched near the center of surveyed rings (a) 1, (b) 2, and (c) 3. Overlapped are the trajectories of the rings from altimetry (dotted lines). The location of the deployment and most recent position of the drifters are indicated by solid cir- cles.
25 23 19 Teml•perature ½4 C) 12 6 3 1 ø
ooo
1500 , , i ,, , ,
2000 I I IIII I I I I I I I1• I I I I ....
I Illil I I i I I II1•1 I I I
2500 I I IIII I I I I I I In• i, I I I I -5 0 5 10
5OO
ooo
500
2000
250O
Salinity (psu)
,, ,,
I II III I I I I I I IIIII I I I I I
I II III I I I I I I IIIII I I I I I ...
I IIIII I I I I I I •H,I, I I I I
-5 0 5 10
500
1000
1500
2000' '
2500
Sigma-t
øW Longitude øE
Figure 4. Vertical sections of temperature, salinity, and den- sity versus pressure derived from CTD casts along 30øS (Figure 1). Rings 1 and 2 are indicated by the closely spaced stations and the depression of isotherms near 9øE and 2øW.
(5.35 mL L -z) approaching that of surface waters and was 90% (0.9) saturated. A subsurface velocity maximum (station 19) was observed near 800 m, presumably related dynamically to the depression of the thermocline underneath the deeper well- mixed layer (Plate 6). The mean profile (stations 20-24) has a mean tangential surface velocity of 16.3 cm s -z and a second maximum of 20 cm s -z at 300 m. The velocity decreases to a value of 4 cm s -z at 1000 m and remains constant to 1500 m
similar to the mean tangential profile for ring 1. The hydrographic survey of ring 2 indicates that this ring was
different from rings 1 and 3 and unlike most previously ob- served Agulhas rings. A typical Agulhas ring has a deep ther- mostad that is more saline, warmer, and lower in oxygen than the surrounding water. In contrast, ring 2 has characteristics between density surfaces 26.5 and 26.7 close to that of the surrounding water, relatively colder, fresher, and more oxygen rich than typical Agulhas rings. In section 5, further analysis of altimetry and a study of the water mass characteristics of ring 2 are presented to determine its origin.
20,978 GARZOLI ET AL.: AGULHAS RINGS IN BENGUELA CURRENT
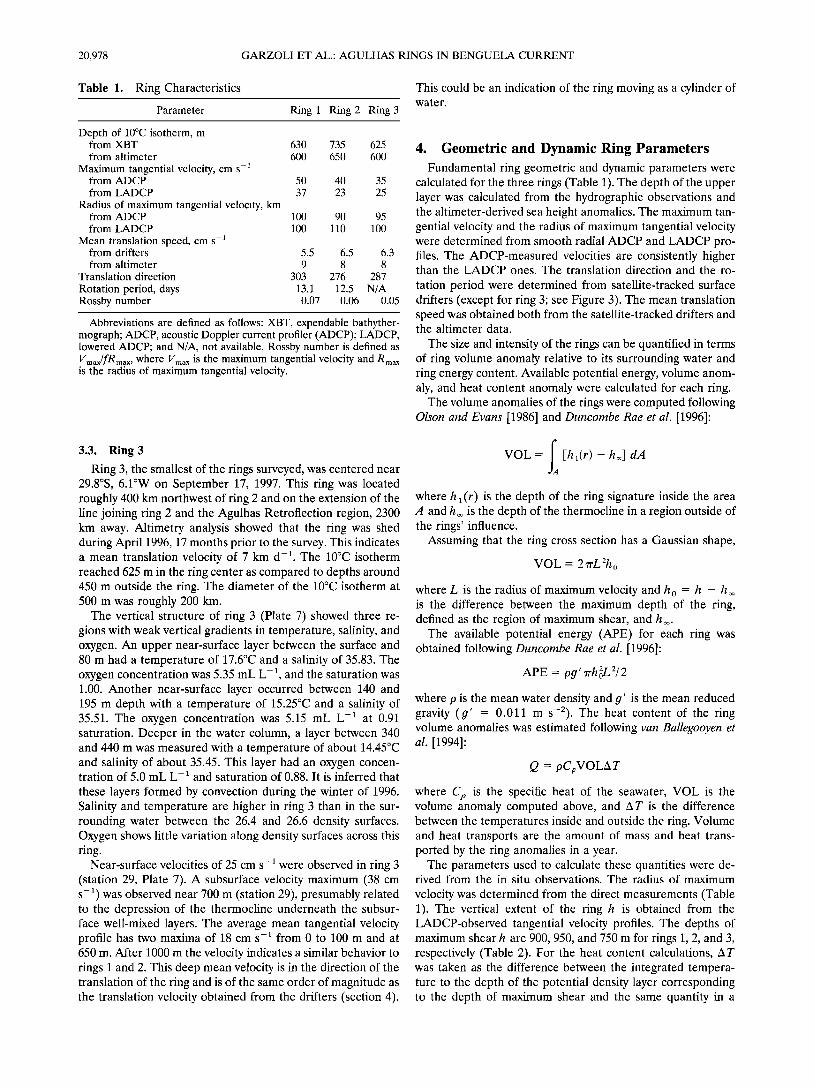
Table 1. Ring Characteristics
Parameter Ring 1 Ring 2 Ring 3
Depth of 10øC isotherm, m from XBT 630 735 625
from altimeter 600 650 600
Maximum tangential velocity, cm s -• from ADCP 50 40 35
from LADCP 37 23 25
Radius of maximum tangential velocity, km from ADCP 100 90 95 from LADCP 100 110 100
Mean translation speed, cm s -• from drifters 5.5 6.5 6.3
from altimeter 9 8 8
Translation direction 303 276 287
Rotation period, days 13.1 12.5 N/A Rossby number 0.07 0.06 0.05
Abbreviations are defined as follows: XBT, expendable bathyther- mograph; ADCP, acoustic Doppler current profiler (ADCP); LADCP, lowered ADCP; and N/A, not available. Rossby number is defined as Vmax/fg .... where Vma x is the maximum tangential velocity and Rma x is the radius of maximum tangential velocity.
This could be an indication of the ring moving as a cylinder of water.
4. Geometric and Dynamic Ring Parameters Fundamental ring geometric and dynamic parameters were
calculated for the three rings (Table 1). The depth of the upper layer was calculated from the hydrographic observations and the altimeter-derived sea height anomalies. The maximum tan- gential velocity and the radius of maximum tangential velocity were determined from smooth radial ADCP and LADCP pro- files. The ADCP-measured velocities are consistently higher than the LADCP ones. The translation direction and the ro-
tation period were determined from satellite-tracked surface drifters (except for ring 3; see Figure 3). The mean translation speed was obtained both from the satellite-tracked drifters and the altimeter data.
The size and intensity of the rings can be quantified in terms of ring volume anomaly relative to its surrounding water and ring energy content. Available potential energy, volume anom- aly, and heat content anomaly were calculated for each ring.
The volume anomalies of the rings were computed following Olson and Evans [1986] and Duncombe Rae et al. [1996]:
3.3. Ring 3
Ring 3, the smallest of the rings surveyed, was centered near 29.8øS, 6.1øW on September 17, 1997. This ring was located roughly 400 km northwest of ring 2 and on the extension of the line joining ring 2 and the Agulhas Retroflection region, 2300 km away. Altimetry analysis showed that the ring was shed during April 1996, 17 months prior to the survey. This indicates a mean translation velocity of 7 km d -•. The 10øC isotherm reached 625 m in the ring center as compared to depths around 450 m outside the ring. The diameter of the 10øC isotherm at 500 m was roughly 200 km.
The vertical structure of ring 3 (Plate 7) showed three re- gions with weak vertical gradients in temperature, salinity, and oxygen. An upper near-surface layer between the surface and 80 m had a temperature of 17.6øC and a salinity of 35.83. The oxygen concentration was 5.35 mL L-•, and the saturation was 1.00. Another near-surface layer occurred between 140 and 195 m depth with a temperature of 15.25øC and a salinity of 35.51. The oxygen concentration was 5.15 mL L -• at 0.91 saturation. Deeper in the water column, a layer between 340 and 440 m was measured with a temperature of about 14.45øC and salinity of about 35.45. This layer had an oxygen concen- tration of 5.0 mL L- • and saturation of 0.88. It is inferred that
these layers formed by convection during the winter of 1996. Salinity and temperature are higher in ring 3 than in the sur- rounding water between the 26.4 and 26.6 density surfaces. Oxygen shows little variation along density surfaces across this ring.
Near-surface velocities of 25 cm s-• were observed in ring 3 (station 29, Plate 7). A subsurface velocity maximum (38 cm s-•) was observed near 700 m (station 29), presumably related to the depression of the thermocline underneath the subsur- face well-mixed layers. The average mean tangential velocity profile has two maxima of 18 cm s -• from 0 to 100 m and at 650 m. After 1000 m the velocity indicates a similar behavior to rings 1 and 2. This deep mean velocity is in the direction of the translation of the ring and is of the same order of magnitude as the translation velocity obtained from the drifters (section 4).
VOL = f• [h•(r) - h=] dA where h•(r) is the depth of the ring signature inside the area A and ha is the depth of the thermocline in a region outside of the rings' influence.
Assuming that the ring cross section has a Gaussian shape,
VOL = 2 •rL 2h 0
where L is the radius of maximum velocity and ho = h - is the difference between the maximum depth of the ring, defined as the region of maximum shear, and
The available potential energy (APE) for each ring was obtained following Duncombe Rae et al. [1996]:
APE = 9•7' •rh•L 2/2
where p is the mean water density and •7' is the mean reduced gravity (•7' = 0.011 m s-a). The heat content of the ring volume anomalies was estimated following van Ballegooyen et al. [1994]:
Q = 9C'pVOLAT
where C e is the specific heat of the seawater, VOL is the volume anomaly computed above, and AT is the difference between the temperatures inside and outside the ring. Volume and heat transports are the amount of mass and heat trans- ported by the ring anomalies in a year.
The parameters used to calculate these quantities were de- rived from the in situ observations. The radius of maximum
velocity was determined from the direct measurements (Table 1). The vertical extent of the ring h is obtained from the LADCP-observed tangential velocity profiles. The depths of maximum shear h are 900, 950, and 750 m for rings 1, 2, and 3, respectively (Table 2). For the heat content calculations, AT was taken as the difference between the integrated tempera- ture to the depth of the potential density layer corresponding to the depth of maximum shear and the same quantity in a
GARZOLI ET AL.: AGULHAS RINGS IN BENGUELA CURRENT 20,979
Table 2. Hydrographic Observations
L, km h, m h•, m rr VOL, X 1012 m 3 TvoL, Sv Q, x 1020 J Tq, PW APE, x l0 is J
Ring 1 100 900 400 27.157 31.4 1 0.88 0.003 43 Ring 2 110 950 400 27.079 41.8 1 1.31 0.004 52 Ring 3 100 750 450 26.987 18.8 0.5 0.77 0.002 15
L is the radius of maximum velocity, h is the depth of maximum shear, h • is the depth of the unperturbed thermocline outside the ring area, rr is the density of the water at the maximum shear depth, VOL is the volume anomaly of the ring, Tvo L is the volume transport (1 Sv: 10 6 m 3 s-I), Q is the heat content anomaly, Tq is the heat transport (1 PW = l0 is W), and APE is the available potential energy.
region outside the area of influence of the ring. Results are shown in Table 2.
According to Table 2, the amount of mass entering the Atlantic and carried by the rings is 1, 2, and 0.5 Sv for rings 1, 2, and 3, respectively. On the basis of previous estimates of the number of rings shed at the retroflection (four to six per year) and a mean volume transport of 0.8 Sv per ring, the contribu- tion of the rings' transport to the interocean exchange of water ranges from 3 to 5 Sv. The heat transported by rings 1, 2, and 3 is 0.003, 0.004, and 0.002 PW, respectively. These transport estimates are to be considered a lower limit because of the
location at which the rings were surveyed and the time elapsed after they were shed from the retroflection, more than 1 year in the last two cases. A rough estimate from Byrne et al. [1995] determined that at least 50% of the sea surface height anomaly has disappeared at these distances from the shedding area. In addition, after more than a year, most of the heat transported by the rings may have been lost. As much as twice these values (6 to 10 Sv and 0.006 PW per year) are more reasonable estimates of the contributions of the rings to the interocean exchange of mass and heat.
The available potential energy of the rings (Table 2) is 43, 52, and 15 x 10 •s J for rings 1, 2, and 3, respectively. Previous estimates of rings in the region [van Balegooyen et al., 1994; Duncombe Rae et al., 1996; Gogi et al., 1997] ranged from 1 to 71 x 10 •s J with an average of 24 x 10 •s J.
It is not always possible to calculate these parameters from in situ observations. The altimeter data provide an indepen- dent way in which the sea height anomaly along with climato- logical data can provide a good proxy to estimate these param- eters. In what follows the same variables were calculated from
the altimeter-derived sea height anomaly field, which was used to estimate the depth of the 10øC isotherm. Here h o is ob- tained as the difference between the maximum depth of the upper layer (in this case represented by the depth of the 10øC isotherm) in the ring and in a region outside the ring influence (h•) at the time of the hydrographic observations. L is the radius of maximum velocity, which is given by the length scale of the Gaussian fit of the altimeter-derived upper layer thick- ness section of the ring. The maximum altimeter-derived upper
layer thickness depths at the time of the hydrographic obser- vations were 605,655, and 600 for rings 1, 2, and 3, respectively (Table 1). These estimates are slightly smaller than the ob- served XBT values since the altimeter ground tracks were not probably crossing the center of the rings during the XBT ob- servations. The volume transport anomalies of each ring en- tering the South Atlantic were estimated by dividing the vol- ume anomaly by the number of seconds in a year, with values of 0.4, 0.4, and 0.3 Sv for rings 1-3, respectively. The available potential energy of the rings was computed from the altimeter- derived sea height anomaly data [Gogi et al., 1997] to be 10, 17, and 3 x 10 •s J for rings !, 2, and 3, respectively. The heat content with respect to the 10øC isotherm, Q, was computed [Shay et al., 1999] by considering AT as the difference between the 10øC isotherm and temperature of the surrounding waters, taken here as 15øC, to compare with previous estimates of van Ballegooyen et al. [1994]. In this case, h is the difference be- tween the depth of the 10øC and 15øC isotherms. The heat transport values calculated for the three rings are 0.005, 0.006, and 0.003 PW for rings 1, 2, and 3, respectively. It is interesting to note that the calculations from the satellite underestimate
the volume transport and APE by half and that the heat con- tent is larger. The latest is due to the method used that assumes always a difference of temperature of 5øC between the interior of the rings and the surrounding waters. The estimates of all the altimeter-derived parameters are shown in Table 3.
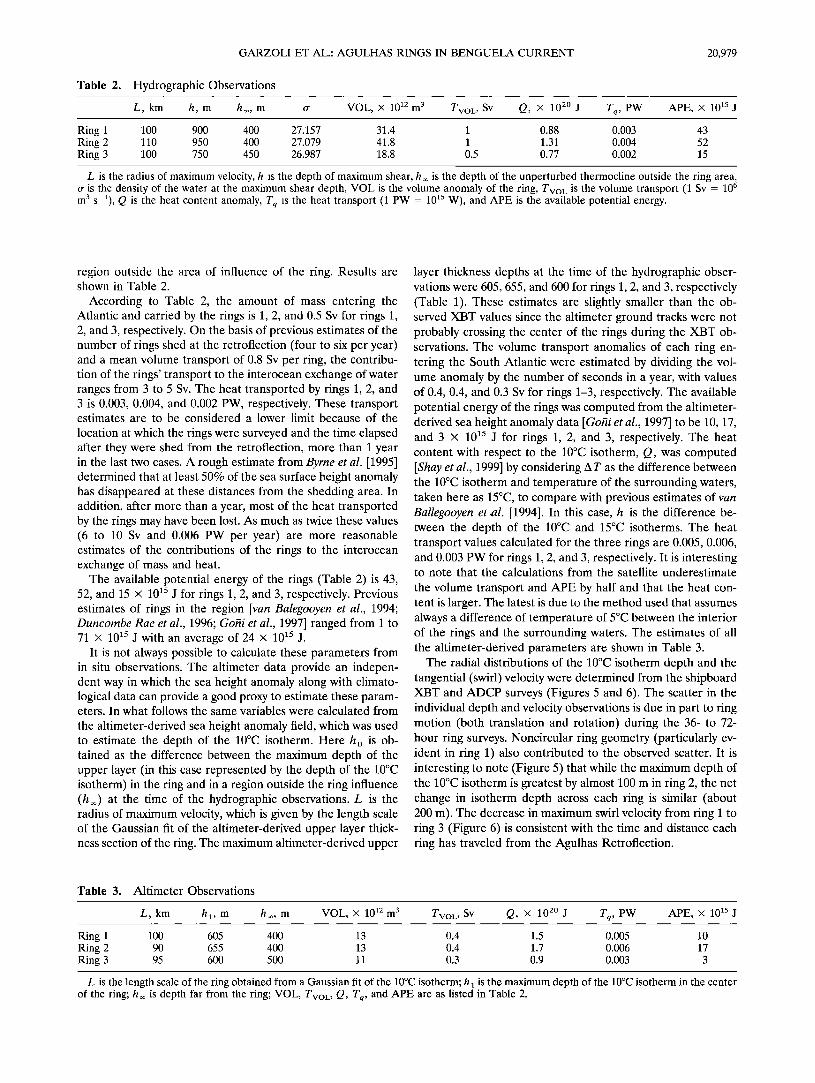
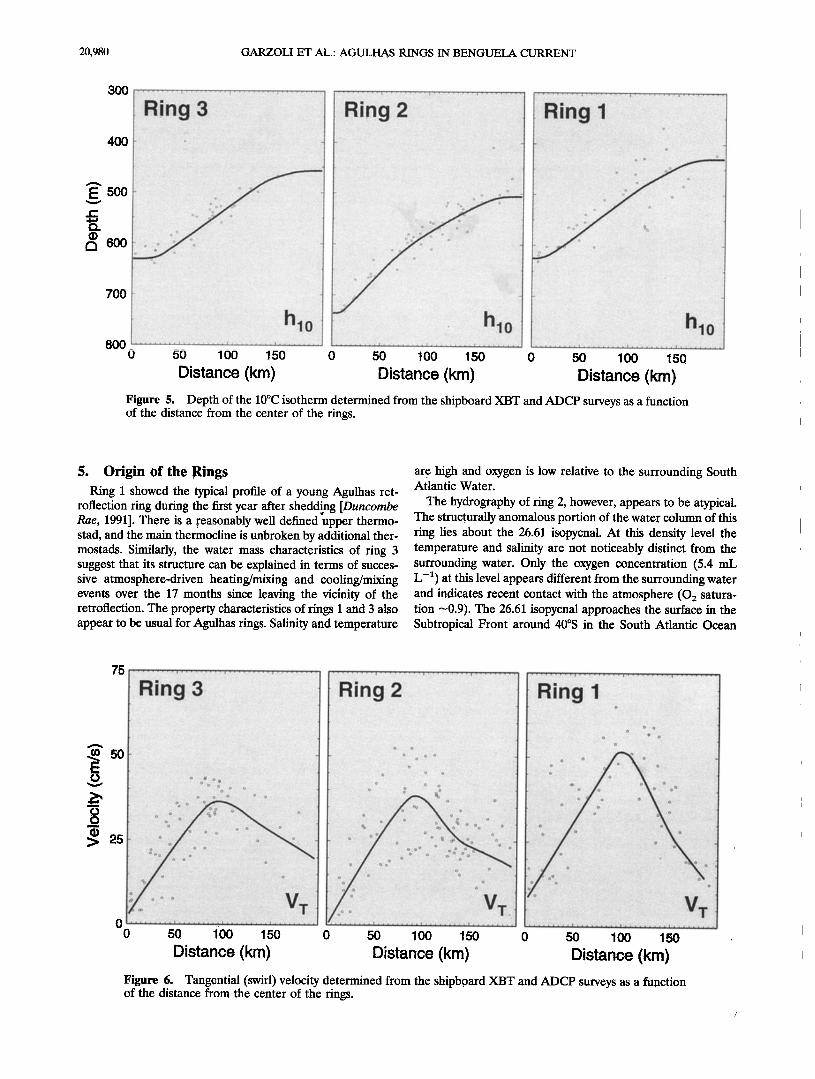
The radial distributions of the 10øC isotherm depth and the tangential (swirl) velocity were determined from the shipboard XBT and ADCP surveys (Figures 5 and 6). The scatter in the individual depth and velocity observations is due in part to ring motion (both translation and rotation) during the 36- to 72- hour ring surveys. Noncircular ring geometry (particularly ev- ident in ring 1) also contributed to the observed scatter. It is interesting to note (Figure 5) that while the maximum depth of the 10øC isotherm is greatest by almost 100 m in ring 2, the net change in isotherm depth across each ring is similar (about 200 m). The decrease in maximum swirl velocity from ring 1 to ring 3 (Figure 6) is consistent with the time and distance each ring has traveled from the Agulhas Retroflection.
Table 3. Altimeter Observations
L, km hi, m h•, m VOL, X 1012 m 3 Tvor, Sv Q, X 10 2o J Tq, PW APE, X l0 is J
Ring 1 100 605 400 13 0.4 1.5 0.005 10 Ring 2 90 655 400 13 0.4 1.7 0.006 17 Ring 3 95 600 500 11 0.3 0.9 0.003 3
L is the length scale of the ring obtained from a Gaussian fit of the 10øC isotherm; h i is the maximum depth of the 10øC isotherm in the center of the ring; h• is depth far from the ring; VOL, Tvo•, Q, Tq, and APE are as listed in Table 2.
20,980 GARZOLI ET AL.: AGULHAS RINGS IN BENGUELA CURRENT
3O0
4OO
500
600
700
800
i.
•::•5:f -•*•:'•' : .......... ':•..•'•::•'::•:• 'i•.d:::•-•':?;':•:'d•;.:'½ ':.
0 50 • 00 • 50 0 50 • 00 • 50 0 50 • 00 • 50
Distance (km) Distance (km) Distance (km) Figure 5. Depth of the 10øC isotherm determined from the shipboard XBT and ADCP surveys as a function of the distance from the center of the rings.
5. Origin of the Rings Ring 1 showed the typical profile of a young Agulhas ret-
roflection ring during the first year after shedding [Duncombe Rae, 1991]. There is a ,.reasonably well defined upper thermo- stad, and the main thermocline is unbroken by additional ther- mostads. Similarly, the water mass characteristics of ring 3 suggest that its structure can be explained in terms of succes- sive atmosphere-driven heating/mixing and cooling/mixing events over the 17 months since leaving the vicinity of the retroflection. The property characteristics of rings 1 and 3 also appear to be usual for Agulhas rings. Salinity and temperature
are high and oxygen is low relative to the surrounding South Atlantic Water.
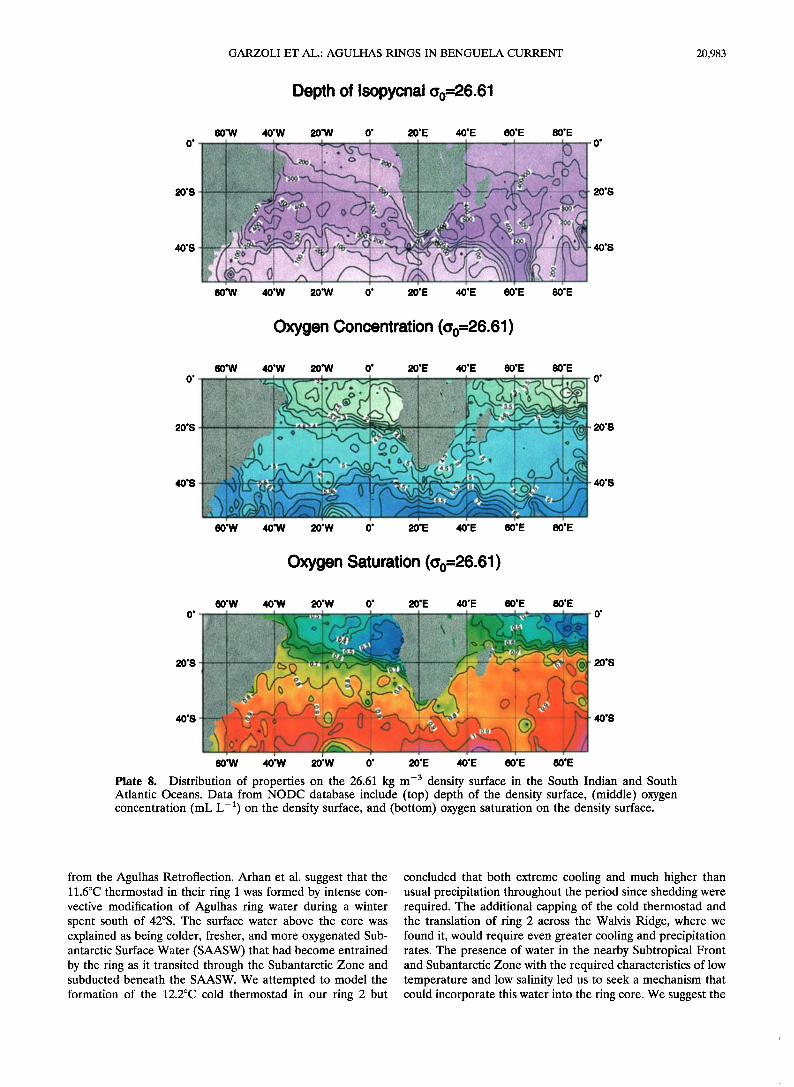
The hydrography of ring 2, however, appears to be atypical. The structurally anomalous portion of the water column of this ring lies about the 26.61 isopycnal. At this density level the temperature and salinity are not noticeably distinct from the surrounding water. Only the oxygen concentration (5.4 mL L -•) at this level appears different from the surrounding water and indicates recent contact with the atmosphere (0 2 satura- tion ---0.9). The 26.61 isopycnal approaches the surface in the Subtropical Front around 40øS in the South Atlantic Ocean
75
• 50
o
• 25
." .•;::: '•i
. ::'?-•.•::.- -:•?;•:•.:?;•:•:•:.4-:)•;•?•:::•', ' -.
0 so • 00 • so 0 so • 00 • 50 0 50 • 00 • 50
Distance (km) Distance (km) Distance (km) Figure 6. Tangential (swirl) velocity determined from the shipboard XBT and ADCP surveys as a function of the distance from the center of the rings.
GARZOLI ET AL.: AGULHAS RINGS IN BENGUELA CURRENT 20,981
500
1000
1500
Temperature Salinity Oxygen Velocity 12 10 8 ß
11 9 7
,• ,
12 10 8 ß 12 10 8 ß I 9 11 9
12 10 8 ß 11 9 7
500
lOOO
1500
200 100 0 200 100 0 200 100 0 200 100 0
Distance from ring centre (km) Plate 5. Vertical sections of temperature (øC), salinity (psu), oxygen (mL L-•), and cross-section velocity versus pressure for ring 1 derived from conductivity-temperature-oxygen/lowered ADCP (CTDO/LADCP) casts. The radial section is northwestward from the center of the ring. The center is indicated with an arrowhead. Approximate distance from ring center is indicated on the horizontal axis.
(Plate 8). The 26.61 isopycnal is close to the density of Sub- antarctic Mode Water [McCartney, 1977]. Although there is some evidence of water on this density level with oxygen sat- uration values near 0.9 in the Indian Ocean, the density surface generally has oxygen concentrations below 5 mL L -• in the Indian Ocean. With the exception of the retroflection, the Agulhas Current and recirculation are particularly depleted in oxygen. However, high saturation and concentrations of oxy- gen do occur on this density surface in the South Atlantic. This observation accomplishes two objectives: it rules out an Agul- has Current or Indian Ocean origin of the anomalous thermo- stad and indicates a South Atlantic origin.
The following three scenarios can be envisaged that account for the structure of ring 2:
1. The ring was formed completely at the Agulhas Ret- roflection with the anomalous thermostad in some manner
created by the incorporation of Subantarctic Water during the process of eddy shedding when water with low salinity, low temperature and high oxygen was drawn between the retroflec- tion and the newly formed eddy [Lutjeharms and van Balle- gooyen, 1988].
2. The ring formed normally at the retroflection and later incorporated a lens of water from the Subtropical Front (STF) by coalescing with another eddy. Coalescence of eddies has
been observed in the field in at least two prior studies by Cresswell [1982] and Schultz Tokos et al. [1994]. It has also been modeled in the laboratory, under various conditions of eddy densities, vertical extent, and horizontal spacing [Nor and Simmons, 1987; Griffiths and Hopfinger, 1987].
3. The ring may not be of Agulhas origin. Given that prior studies have suggested a Brazil Current origin for some rings encountered in the southeastern Atlantic [Smythe-Wright et al., 1996; Duncombe Rae e! al., 1996], it is possible that ring 2 described here may have been shed from the Brazil Malvinas Confluence.
The origin of the water in this ring must remain undeter- mined, with coalescence with an eddy from the STF the more likely source, without totally discounting the others as possible explanations. Ring 2 was readily tracked back to the Agulhas Retroflection in the altimetry and was observed to spend an appreciable amount of time south of the STF, allowing ample opportunity for incorporation of an eddy from the STF and suggesting that scenario 3 may be discarded.
Arhan et al. [this issue] observed, in one of the three rings that they analyzed, a thermostad of 11.6øC (their ring 1). Itwas also associated with somewhat anomalous water properties, lower in salinity and higher in O2, compared to more usual Agulhas rings. Their ring was also inferred to have formed
Temperature Salinity Oxygen 22 20 • • 2O
23 21 1'
500-
1500
5OO
1000
Velocity 22 20 •
23 21 19 0
ß It'
lOOO
1500
200 100 0 200 100 0 200 100 0 200 100 0
Distance from ring centre (kin) Plate 6. Same as Plate 5, but for ring 2. The radial section is westward from the center of the ring. The center is indicated with an arrowhead. Approximate distance from ring center is indicated on the horizontal axis.
Salinity Oxygen
1500
Temperature 31 30292 • J- "2
Velocity 32 31 292•'
' i ø 5O0
o c 1000•
1500
Iø
Plate 7. Same as Plate 5, but for ring 3. The radial section is westward from the center of the ring. The center is indicated with an arrowhead. Approximate distance from ring center is indicated on the horizontal axis
Distance from ring centre (km)
200 100 0 200 100 0 200 100 0 200 100 0
GARZOLI ET AL.: AGULHAS RINGS IN BENGUELA CURRENT 20,983
Depth of Isopycnal Oo=26.61
20'S
60'W 40'W 20'W 0 ø 20øE 40øE 60'E 80øE
60'W 40'W 20'W O' 20'E 40'E 60'E 80'E
Oxygen Concentration (Oo=26.61)
20'S
40'S
60'W 40'W 20'W O' 20'E 40'E 60'E 80'E
60'W 40'W 20'W O' 20'E 40'E 60'E 80'E
Oxygen Saturation (Oo=26.61)
20 'S ....... •
40'S •
60'W 40'W 20'W O' 20'E 40'E 60'E 80'E
Plate 8. Distribution of properties on the 26.61 kg m -3 density surface in the South Indian and South Atlantic Oceans. Data from NODC database include (top) depth of the density surface, (middle) oxygen concentration (mL L -1) on the density surface, and (bottom) oxygen saturation on the density surface.
from the Agulhas Retroflection. Arhan et al. suggest that the 11.6øC thermostad in their ring 1 was formed by intense con- vective modification of Agulhas ring water during a winter spent south of 42øS. The surface water above the core was explained as being colder, fresher, and more oxygenated Sub- antarctic Surface Water (SAASW) that had become entrained by the ring as it transited through the Subantarctic Zone and subducted beneath the SAASW. We attempted to model the formation of the 12.2øC cold thermostad in our ring 2 but
concluded that both extreme cooling and much higher than usual precipitation throughout the period since shedding were required. The additional capping of the cold thermostad and the translation of ring 2 across the Walvis Ridge, where we found it, would require even greater cooling and precipitation rates. The presence of water in the nearby Subtropical Front and Subantarctic Zone with the required characteristics of low temperature and low salinity led us to seek a mechanism that could incorporate this water into the ring core. We suggest the
20,984 GARZOLI ET AL.: AGULHAS RINGS IN BENGUELA CURRENT
merging of ring 2 and an eddy of Subtropical Front water accomplished this without the need for extreme cooling and precipitation. That two out of the six observed rings contained these cold thermostads suggests that they are more common than previously realized. It must be left for future work to docu- ment the mechanism(s) that caused these cold thermostads.
6. Summary and Discussion Rings shed from the Agulhas Current and carried into the
Atlantic as transient components of the Benguela Current are important contributors to interocean heat, salt, and mass trans- ports. The three rings sampled during September 1997 as part of the Benguela Current Experiment add new insight to the origins and physical properties of these energetic features. The rings were measured by a combination of techniques and were backtracked to their formation region with altimetry. The three rings share some common characteristics but also have some significant structural differences. Within each ring the maximum swirl velocity was located at a radius of approxi- mately 100 km. The magnitude of this maximum velocity ap- peared to decrease roughly proportional to the inferred ages of the rings.
Ring 1 had characteristics typical of Agulhas rings in their first year after shedding [Duncombe Rae, 1991]. The vertical structure of ring 3 can be explained in terms of successive atmosphere-driven heating/mixing and cooling/mixing cycles during the ring's 17-month life.
Ring 2 had embedded into its main core at depths from 440 to 580 m a thermostad of low-temperature (12.2øC), low- salinity (35.07 to 35.10), and high-oxygen concentration. Ther- mostads of temperatures between 13 ø and 14øC have been previously observed in these rings. Rings with thermostads between 13 ø and 14øC and saltier than Agulhas rings have been previously identified as Brazil rings [Smythe-Wright et al., 1996; Duncombe Rae et al., 1996]. The oxygen concentration and saturation within the anomalous thermostad of ring 2 are also different from those observed in Agulhas rings. In this case, three possible sources for the thermostad were examined: vor- tex stretching during shedding, merging with water from south of the STF, or incorporation of bottom water from the nearby Agulhas Bank. The origin was not resolved conclusively. High saturation and concentrations of oxygen such as found in ring 2 are observed in the South Atlantic. The analysis presented leads to the conclusion that ring 2 is of Agulhas origin and later incorporated a lens of water from the Subtropical Front by coalescing with another eddy. Further understanding of how these rings translate into the interior and their ultimate role in the meridional overturning circulation will be possible once the RAFOS floats deployed in their cores end their mission and provide further data.
Acknowledgments. The scientific party wishes to acknowledge the invaluable support of Captain Vince Seiler and the crew of the R/V Seward Johnson, who helped make the cruise a success. The authors wish to acknowledge the scientific collaboration of the members of KAPEX, O. Boebel, J. Lutjeharms, T. Rossby, and W. Zenk, and their helpful comments during the planning stage of this experiment. We especially thank O. Boebel and W. Zenk for deploying one of the U.S. sound sources, which enabled us to spend more time on the ring survey. We are very grateful to Doug Wilson and Ryan Smith (NOAA AOML) for their help in reprocessing the LADCP data and to Warren Krug for his support with the XBT software. Near-real-time altimeter data were provided by Robert Cheney (NOAA/NODC). M. Arhan, H. Mercier, and J. R. E. Lutjeharms generously gave us a preprint of their
paper, which also describes three Agulhas rings. Gail Derr and Veta Green prepared the manuscript for publication. This program was funded by a grant from the National Science Foundation, OCE95- 28574, and received additional support from NOAA/AOML/PhOD.
References
Arhan, M., H. Mercier, and J. R. E. Lutjeharms, The disparate evo- lution of three Agulhas rings in the South Atlantic Ocean, J. Geo- phys. Res., this issue.
Boebel, O., C. M. Duncombe Rae, S. L. Garzoli, J. R. E. Lutjeharms, P. L. Richardson, T. Rossby, C. Schmid, and W. Zenk, KAPEX: Observing the intermediate flow at the tip of Africa, Eos Trans. AGU, 79, 1, 7, and 8, 1998.
Broecker, W. S., The great ocean conveyor, Oceanography, 4(2), 79- 89, 1991.
Byrne, D. A., A. L. Gordon, and W. F. Haxby, Agulhas eddies: A synoptic view using GEOSAT ERM data, J. Phys. Oceanogr., 25, 902-917, 1995.
Chapman, P., C. M. Duncombe Rae, and B. R. Allanson, Nutrients, chlorophyll, and oxygen relationships in the surface layers at the Agulhas Retroflection, Deep Sea Res., Part A, 34(8), 1399-1416, 1987.
Cresswell, L. G. R., The coalescence of two east Australian Current warm-core eddies, Science, 215, 161-164, 1982.
Duncombe Rae, C. M., Agulhas Retroflection rings in the South At- lantic Ocean: An overview, S. Aft. J. Mar. Sci., 11,327-344, 1991.
Duncombe Rae, C. M., S. L. Garzoli, and A. L. Gordon, The eddy field of the southeast Atlantic Ocean: A statistical census from the Ben-
guela Sources and Transports Project, J. Geophys. Res., 101, 11,949- 11,964, 1996.
Garzoli, S. L., and A. L. Gordon, Origins and variability of the Ben- guela Current, J. Geophys. Res., 101,987-906, 1996.
Gofii, G. J., S. L. Garzoli, A. J. Roubicek, D. B. Olson, and O. B. Brown, Agulhas ring dynamics from TOPEX/POSEIDON satellite altimeter data, J. Mar. Res., 55(5), 861-883, 1997.
Gordon, A. L., Indian-Atlantic transfer of thermocline water at the Agulhas Retroflection, Sciences N.Y., 227(4690), 1030-1033, 1985.
Gordon, A. L., and W. F. Haxby, Agulhas eddies invade the South Atlantic: Evidence from Geosat altimeter and shipboard conductiv- ity-temperature-depth survey, J. Geophys. Res., 95, 3117-3125, 1990.
Gordon, A. L., J. R. E. Lutjeharms, and M. L. Grundlingh, Stratifica- tion and circulation at the Agulhas Retroflection, Deep Sea Res., Part A, 34, 565-599, 1987.
Gordon, A. L., R. F. Weiss, W. M. Smethie, and M. J. Warner, Thermocline and Intermediate Water communication between the
South Atlantic and Indian Oceans, J. Geophys. Res., 97, 7223-7240, 1992.
Griffiths, R. W., and E. J. Hopfinger, Coalescing of geostrophic vor- tices, J. Fluid Mech., 178, 73-97, 1987.
Lutjeharms, J. R. E., and R. C. van Ballegooyen, The retroflection of the Agulhas Current, J. Phys. Oceanogr., 18, 1570-1583, 1988.
McCartney, M. S., Subantarctic Mode Water, inA Voyage of Discovery, George Deacon: 70th Anniversary Volume, edited by M. Angel, pp. 103-119, Pergamon, Tarrytown, N.Y., 1977.
Nof, D., and L. Simmons, Laboratory experiments in the merging of nonlinear anticyclonic eddies, J. Phys. Oceanogr., 17, 343-357, 1987.
Olson, D. B., Rings in the ocean, Annu. Rev. Earth Planet. Sci., 19, 133-183, 1991.
Olson, D. B., and R. H. Evans, Rings of the Agulhas Current, Deep Sea Res., Part A, 33, 27-42, 1986.
Peterson, R. G., and L. Stramma, Upper-circulation in the South Atlantic Ocean, Prog. Oceanogr., 26, 1-73, 1991.
Roubicek, A. J., S. L. Garzoli, P. L. Richardson, C. M. Duncombe Rae, and D. M. Fratantoni, Benguela Current Experiment, R/V Seward Johnson Cruise SJ9705, NOAA Data Rep., ERL AOML-33, 215 pp., Atlantic Oceanogr. and Meteorol. Lab., Miami, Fla., 1998.
Saunders, P.M., and B. A. King, Oceanic fluxes on the WOCE All section, J. Phys. Oceanogr., 25, 1942-1958, 1995.
Schultz Tokos, K. L., H.-H. Hinrichsen, and W. Zenk, Merging and migration of two eddies, J. Phys. Oceanogr., 24, 2129-2141, 1994.
Shay, L. K., G. J. Goni, and P. G. Black, Effects of a warm oceanic feature on Hurricane Opal, Mon. Weather Rev., in press, 1999.
Smythe-Wright, D., A. L. Gordon, P. Chapman, and M. S. Jones, CAC-113 shows Brazil eddy crossing the South Atlantic to the Agul- has Retroflection region, J. Geophys. Res., 101,885-895, 1996.
GARZOLI ET AL.: AGULHAS RINGS IN BENGUELA CURRENT 20,985
van Ballegooyen, R. C., M. L. Grundlingh, and J. R. E. Lutjeharms, Eddy fluxes of heat and salt from the southwest Indian Ocean into the southeast Atlantic Ocean: A case study, J. Geophys. Res., 99, 14,053-14,070, 1994.
C. M. Duncombe Rae, Sea Fisheries Research Institute, P. Bag X2, Rogge Bay, 8012 Cape Town, South Africa.
D. M. Fratantoni and P. L. Richardson, Woods Hole Oceanographic
Institution, Woods Hole, MA 02543. S. L. Garzoli, G. J. Gofii, and A. J. Roubicek, Atlantic Oceano-
graphic and Meteorological Laboratory, NOAA, 4301 Rickenbacher Causeway, Miami, FL 33149. ([email protected])
(Received April 17, 1998; revised February 1, 1999; accepted February 25, 1999.)