threatened birds forest flood blue duck … · biogeographic unit would capture an average of 73%...
TRANSCRIPT
25Discussion document, December 2004
CATCHM ENT
AREA
TRAN S -
F ORM ED
D IS T IN CT -
IVENES S
CATCHM ENT
R ICHN ES S
F L OW
INTEG RITY
COVER B D
REMAIN ING
W Q B D
REMAIN ING
EXOT IC F I SH
THRE AT ENED
F I S H
B L U E D U CK
THRE AT ENED
B IRD S
F L OOD
F ORES T
THRE AT ENED
P L AN TS
TOTA L
THRE AT ENED
S P P .
EU CL ID IAN
D IS TAN CE
Tra
nsf
orm
ed
dis
tin
ctiv
enes
s 0
.17
Cat
chm
ent
rich
nes
s 0
.89
0
.26
Flo
w i
nte
grit
y �0
.35
�0
.01
�0
.29
Co
ver
BD
rem
ain
ing
�0.0
4
�0.0
1
0.0
0
0.0
3
WQ
BD
rem
ain
ing
�0.0
7
0.0
1
�0.0
1
0.0
3
0.7
9
Exo
tic
fish
�0
.69
�0
.15
�0
.64
0
.30
0
.09
0
.09
Th
reat
ened
fis
h
0.3
3
0.1
6
0.3
7
�0.0
4
0.0
6
0.0
5
�0.2
5
Blu
e d
uck
0
.56
0
.18
0
.61
�0
.24
0
.11
0
.10
�0
.40
0
.24
Th
reat
ened
bir
ds
0.3
9
0.1
8
0.4
4
�0.0
9
�0.0
3
�0.0
4
�0.2
8
0.2
9
0.3
1
Flo
od
fo
rest
0
.68
0
.21
0
.67
�0
.18
0
.11
0
.09
�0
.53
0
.36
0
.53
0
.27
Th
reat
ened
pla
nts
0
.43
0
.16
0
.46
�0
.04
�0
.05
�0
.03
�0
.34
0
.36
0
.24
0
.47
0
.35
To
tal t
hre
aten
ed s
pp
.
sco
res
0.6
6
0.2
5
0.7
1
�0.1
5
0.0
3
0.0
2
�0.5
0
0.5
6
0.5
8
0.7
1
0.6
6
0.8
4
Eucl
idea
n d
ista
nce
�0
.65
0
.25
�0
.55
0
.20
�0
.05
�0
.03
0
.40
�0
.19
�0
.31
�0
.17
�0
.41
�0
.24
�0
.36
Her
itag
e va
lue
sco
re
0.3
1
0.2
2
0.3
7
0.0
1
0.4
2
0.3
7
�0.1
3
0.4
8
0.4
3
0.2
0
0.4
9
0.3
1
0.4
9
�0.2
2
TA
BLE
4.
C
OR
RE
LAT
ION
MA
TR
IX O
F V
AR
IAB
LES
USE
D T
O D
ET
ER
MIN
E N
AT
UR
AL
HE
RIT
AG
E V
ALU
E.
26 Chadderton et al. �Creating a candidate list of Rivers of National Importance
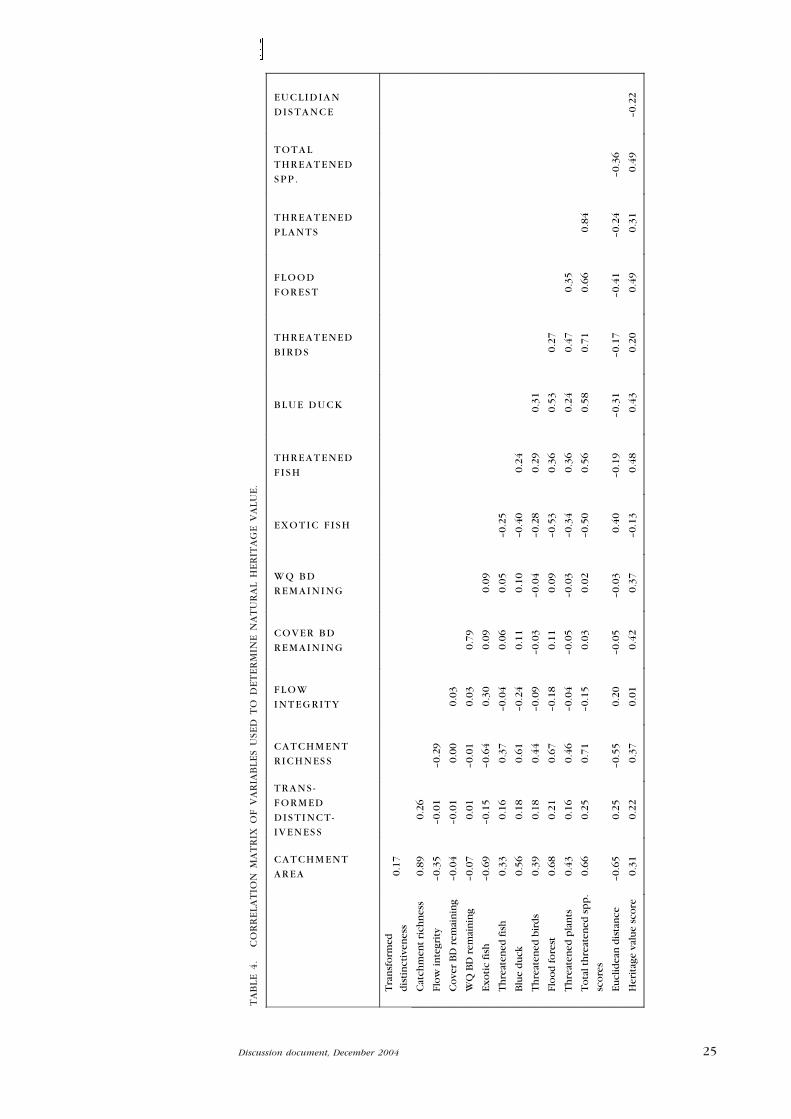
distinctive (or unique) river reach types with few special features (Fig. 2F) and
low catchment condition. These highly distinctive systems must be included on
the candidate list in order to protect the full range of biodiversity. Numbers of
threatened species and catchment area (Fig. 2F) were also correlated (Table 4)
with the highest weighted threatened species scores occurring in larger
catchments. However, there were also many large catchments that had few
special features, so bigger was not always better.
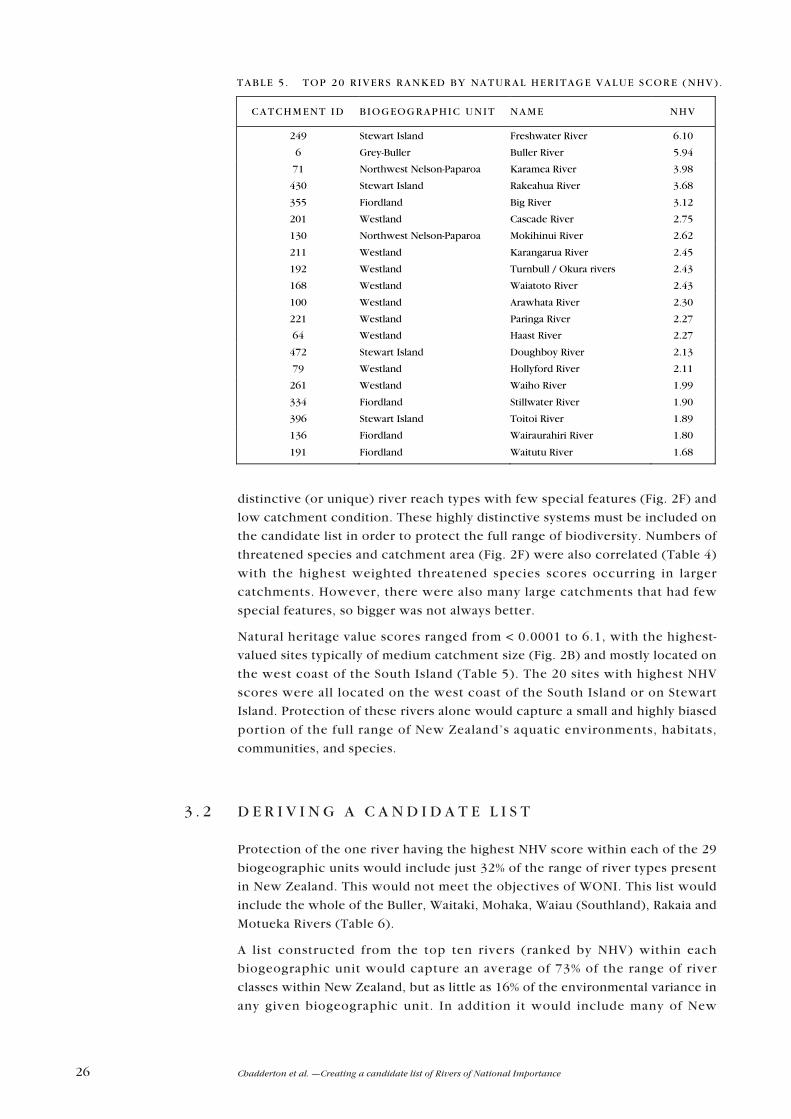
Natural heritage value scores ranged from < 0.0001 to 6.1, with the highest-
valued sites typically of medium catchment size (Fig. 2B) and mostly located on
the west coast of the South Island (Table 5). The 20 sites with highest NHV
scores were all located on the west coast of the South Island or on Stewart
Island. Protection of these rivers alone would capture a small and highly biased
portion of the full range of New Zealand�s aquatic environments, habitats,
communities, and species.
3 . 2 D E R I V I N G A C A N D I D A T E L I S T
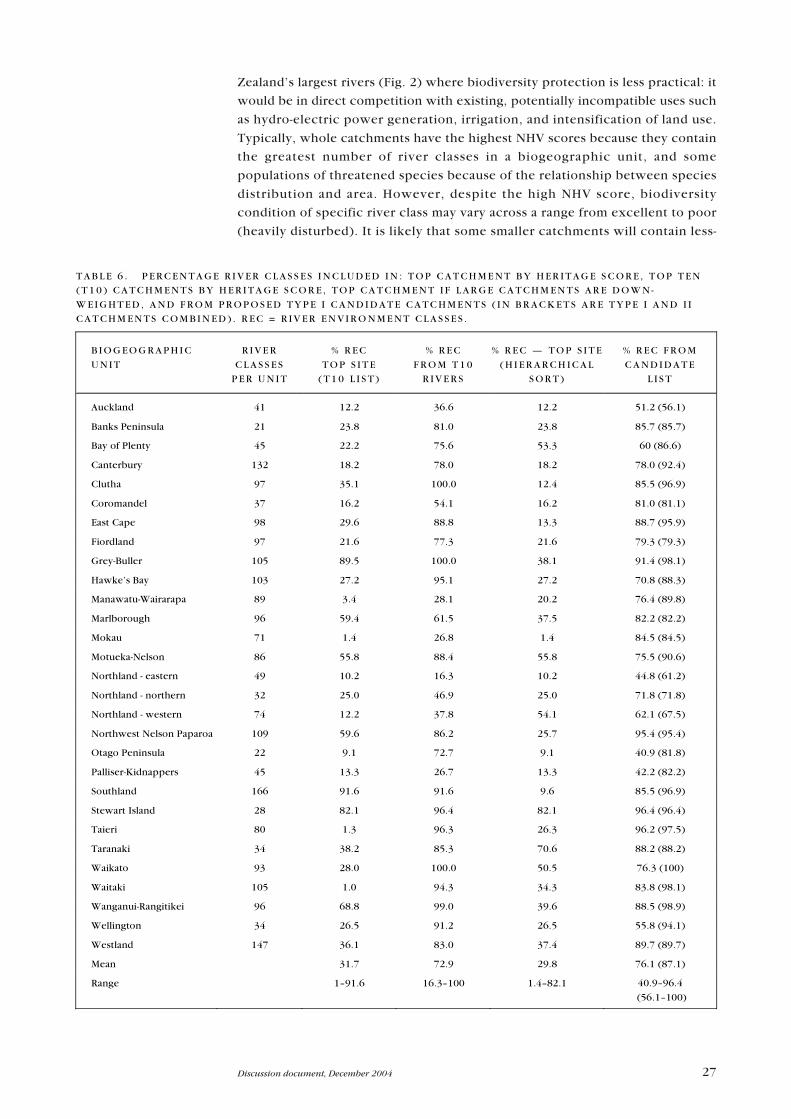
Protection of the one river having the highest NHV score within each of the 29
biogeographic units would include just 32% of the range of river types present
in New Zealand. This would not meet the objectives of WONI. This list would
include the whole of the Buller, Waitaki, Mohaka, Waiau (Southland), Rakaia and
Motueka Rivers (Table 6).
A list constructed from the top ten rivers (ranked by NHV) within each
biogeographic unit would capture an average of 73% of the range of river
classes within New Zealand, but as little as 16% of the environmental variance in
any given biogeographic unit. In addition it would include many of New
TABLE 5 . TOP 2 0 R IVERS RANKED BY NATUR AL HE R ITAG E VAL UE SCOR E (NHV ) .
CATCHM ENT ID B IOGEOG RAP HIC UNIT NAME NHV
249 Stewart Island Freshwater River 6.10
6 Grey-Buller Buller River 5.94
71 Northwest Nelson-Paparoa Karamea River 3.98
430 Stewart Island Rakeahua River 3.68
355 Fiordland Big River 3.12
201 Westland Cascade River 2.75
130 Northwest Nelson-Paparoa Mokihinui River 2.62
211 Westland Karangarua River 2.45
192 Westland Turnbull / Okura rivers 2.43
168 Westland Waiatoto River 2.43
100 Westland Arawhata River 2.30
221 Westland Paringa River 2.27
64 Westland Haast River 2.27
472 Stewart Island Doughboy River 2.13
79 Westland Hollyford River 2.11
261 Westland Waiho River 1.99
334 Fiordland Stillwater River 1.90
396 Stewart Island Toitoi River 1.89
136 Fiordland Wairaurahiri River 1.80
191 Fiordland Waitutu River 1.68
27Discussion document, December 2004
Zealand�s largest rivers (Fig. 2) where biodiversity protection is less practical: it
would be in direct competition with existing, potentially incompatible uses such
as hydro-electric power generation, irrigation, and intensification of land use.
Typically, whole catchments have the highest NHV scores because they contain
the greatest number of river classes in a biogeographic unit, and some
populations of threatened species because of the relationship between species
distribution and area. However, despite the high NHV score, biodiversity
condition of specific river class may vary across a range from excellent to poor
(heavily disturbed). It is likely that some smaller catchments will contain less-
T A B L E 6 . P E R C E N T A G E R I V E R C L A S S E S I N C L U D E D I N : T O P C A T C H M E N T B Y H E R I T A G E S C O R E , T O P T E N
( T 1 0 ) C A T C H M E N T S B Y H E R I T A G E S C O R E , T O P C A T C H M E N T I F L A R G E C A T C H M E N T S A R E D O W N -
W E I G H T E D , A N D F R O M P R O P O S E D T Y P E I C A N D I D A T E C A T C H M E N T S ( I N B R A C K E T S A R E T Y P E I A N D I I
C A T C H M E N T S C O M B I N E D ) . R E C = R I V E R E N V I R O N M E N T C L A S S E S .
B I O G E O G R A P H I C
U N I T
R I V E R
C L A S S E S
P E R U N I T
% R E C
T O P S I T E
( T 1 0 L I S T )
% R E C
F R O M T 1 0
R I V E R S
% R E C � T O P S I T E
( H I E R A R C H I C A L
S O R T )
% R E C F R O M
C A N D I D A T E
L I S T
Auckland 41 12.2 36.6 12.2 51.2 (56.1)
Banks Peninsula 21 23.8 81.0 23.8 85.7 (85.7)
Bay of Plenty 45 22.2 75.6 53.3 60 (86.6)
Canterbury 132 18.2 78.0 18.2 78.0 (92.4)
Clutha 97 35.1 100.0 12.4 85.5 (96.9)
Coromandel 37 16.2 54.1 16.2 81.0 (81.1)
East Cape 98 29.6 88.8 13.3 88.7 (95.9)
Fiordland 97 21.6 77.3 21.6 79.3 (79.3)
Grey-Buller 105 89.5 100.0 38.1 91.4 (98.1)
Hawke�s Bay 103 27.2 95.1 27.2 70.8 (88.3)
Manawatu-Wairarapa 89 3.4 28.1 20.2 76.4 (89.8)
Marlborough 96 59.4 61.5 37.5 82.2 (82.2)
Mokau 71 1.4 26.8 1.4 84.5 (84.5)
Motueka-Nelson 86 55.8 88.4 55.8 75.5 (90.6)
Northland - eastern 49 10.2 16.3 10.2 44.8 (61.2)
Northland - northern 32 25.0 46.9 25.0 71.8 (71.8)
Northland - western 74 12.2 37.8 54.1 62.1 (67.5)
Northwest Nelson Paparoa 109 59.6 86.2 25.7 95.4 (95.4)
Otago Peninsula 22 9.1 72.7 9.1 40.9 (81.8)
Palliser-Kidnappers 45 13.3 26.7 13.3 42.2 (82.2)
Southland 166 91.6 91.6 9.6 85.5 (96.9)
Stewart Island 28 82.1 96.4 82.1 96.4 (96.4)
Taieri 80 1.3 96.3 26.3 96.2 (97.5)
Taranaki 34 38.2 85.3 70.6 88.2 (88.2)
Waikato 93 28.0 100.0 50.5 76.3 (100)
Waitaki 105 1.0 94.3 34.3 83.8 (98.1)
Wanganui-Rangitikei 96 68.8 99.0 39.6 88.5 (98.9)
Wellington 34 26.5 91.2 26.5 55.8 (94.1)
Westland 147 36.1 83.0 37.4 89.7 (89.7)
Mean 31.7 72.9 29.8 76.1 (87.1)
Range 1�91.6 16.3�100 1.4�82.1 40.9�96.4
(56.1�100)
28 Chadderton et al. �Creating a candidate list of Rivers of National Importance
Fig
ure
3.
T
op
ten
riv
ers
for
each
bio
geo
gra
ph
ic u
nit
, ra
nk
ed b
y N
atu
ral
Her
itag
e V
alu
e(N
HV
) sc
ore
s.
Fig
ure
4.
M
inim
um
riv
er c
atch
men
ts r
equ
ired
to
acc
ou
nt
for
up
to
70
% (
dar
k g
reen
) an
d8
0%
(l
igh
t g
reen
) o
f al
l ri
ver
clas
ses
wit
hin
ea
ch
bio
geo
gra
ph
ic
un
it,
der
ived
fr
om
a
hie
rarc
hic
al s
ort
th
at d
ow
n-w
eig
hte
d l
arg
e ca
tch
men
ts.
29Discussion document, December 2004
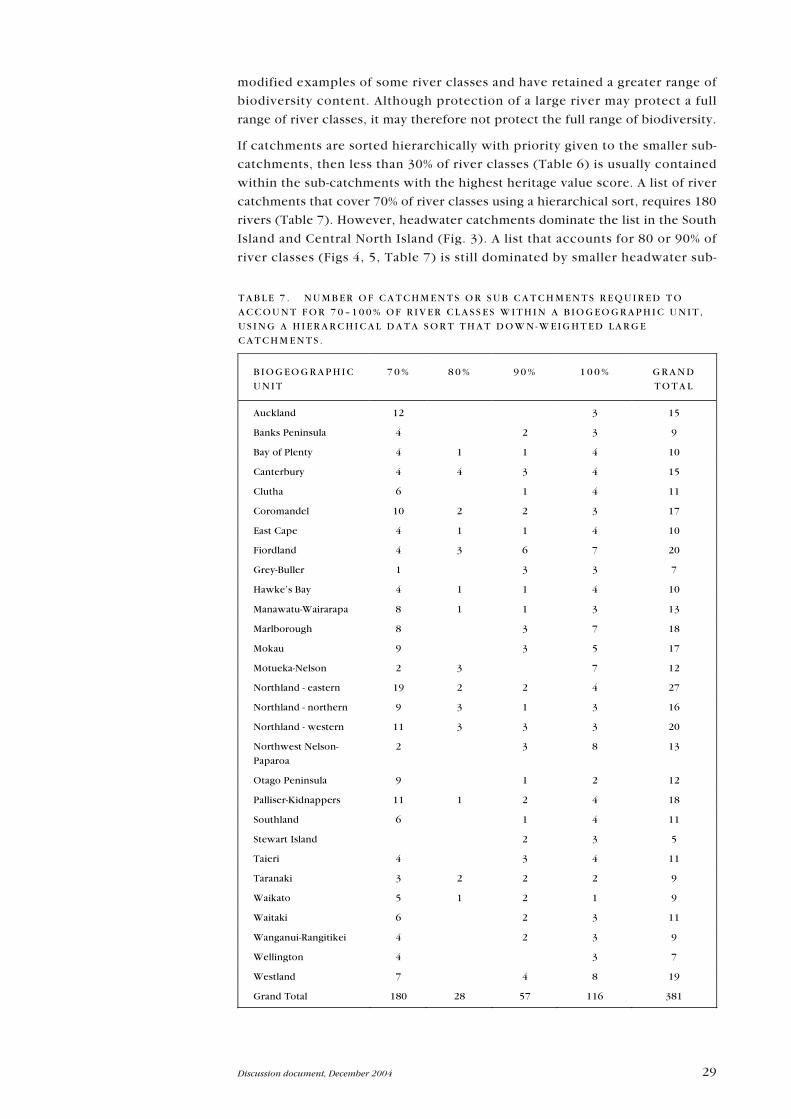
T A B L E 7 . N U M B E R O F C A T C H M E N T S O R S U B C A T C H M E N T S R E Q U I R E D T O
A C C O U N T F O R 7 0 � 1 0 0 % O F R I V E R C L A S S E S W I T H I N A B I O G E O G R A P H I C U N I T ,
U S I N G A H I E R A R C H I C A L D A T A S O R T T H A T D O W N - W E I G H T E D L A R G E
C A T C H M E N T S .
B I O G E O G R A P H I C
U N I T
7 0 % 8 0 % 9 0 % 1 0 0 % G R A N D
T O T A L
Auckland 12 3 15
Banks Peninsula 4 2 3 9
Bay of Plenty 4 1 1 4 10
Canterbury 4 4 3 4 15
Clutha 6 1 4 11
Coromandel 10 2 2 3 17
East Cape 4 1 1 4 10
Fiordland 4 3 6 7 20
Grey-Buller 1 3 3 7
Hawke�s Bay 4 1 1 4 10
Manawatu-Wairarapa 8 1 1 3 13
Marlborough 8 3 7 18
Mokau 9 3 5 17
Motueka-Nelson 2 3 7 12
Northland - eastern 19 2 2 4 27
Northland - northern 9 3 1 3 16
Northland - western 11 3 3 3 20
Northwest Nelson-
Paparoa
2 3 8 13
Otago Peninsula 9 1 2 12
Palliser-Kidnappers 11 1 2 4 18
Southland 6 1 4 11
Stewart Island 2 3 5
Taieri 4 3 4 11
Taranaki 3 2 2 2 9
Waikato 5 1 2 1 9
Waitaki 6 2 3 11
Wanganui-Rangitikei 4 2 3 9
Wellington 4 3 7
Westland 7 4 8 19
Grand Total 180 28 57 116 381
modified examples of some river classes and have retained a greater range of
biodiversity content. Although protection of a large river may protect a full
range of river classes, it may therefore not protect the full range of biodiversity.
If catchments are sorted hierarchically with priority given to the smaller sub-
catchments, then less than 30% of river classes (Table 6) is usually contained
within the sub-catchments with the highest heritage value score. A list of river
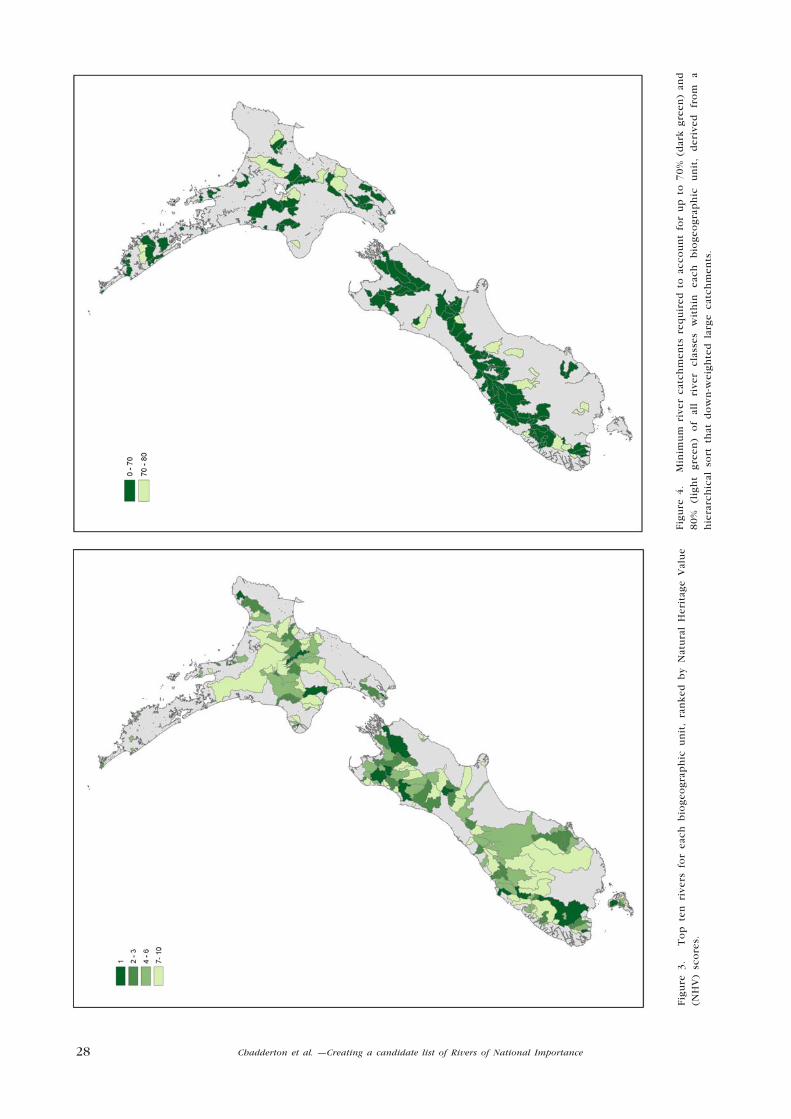
catchments that cover 70% of river classes using a hierarchical sort, requires 180
rivers (Table 7). However, headwater catchments dominate the list in the South
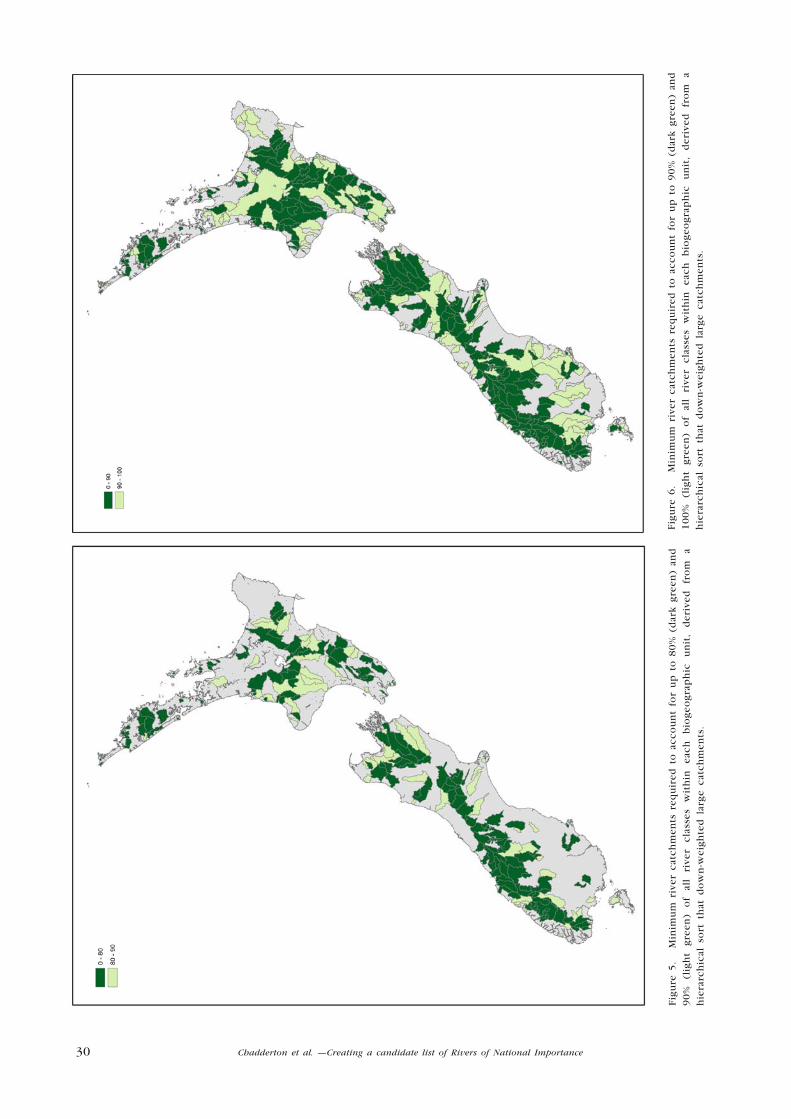
Island and Central North Island (Fig. 3). A list that accounts for 80 or 90% of
river classes (Figs 4, 5, Table 7) is still dominated by smaller headwater sub-
30 Chadderton et al. �Creating a candidate list of Rivers of National Importance
Fig
ure
5.
M
inim
um
riv
er c
atch
men
ts r
equ
ired
to
acc
ou
nt
for
up
to
80
% (
dar
k g
reen
) an
d9
0%
(l
igh
t g
reen
) o
f al
l ri
ver
clas
ses
wit
hin
ea
ch
bio
geo
gra
ph
ic
un
it,
der
ived
fr
om
a
hie
rarc
hic
al s
ort
th
at d
ow
n-w
eig
hte
d l
arg
e ca
tch
men
ts.
Fig
ure
6.
M
inim
um
riv
er c
atch
men
ts r
equ
ired
to
acc
ou
nt
for
up
to
90
% (
dar
k g
reen
) an
d1
00
%
(lig
ht
gre
en)
of
all
rive
r cl
asse
s w
ith
in
each
b
iog
eog
rap
hic
u
nit
, d
eriv
ed
fro
m
ah
iera
rch
ical
so
rt t
hat
do
wn
-wei
gh
ted
lar
ge
catc
hm
ents
.
31Discussion document, December 2004
catchments and/or smaller rivers arising from hill country. The large
Canterbury braided rivers, and lower reaches of the larger rivers like the
Waikato, Wairau and Waiua (Southland) need to be included for the list to cover
100% of the river classes (Fig. 6), as the lower reaches of these rivers contain
distinctive river classes. In order to incorporate the last 10% of river classes, the
number of catchment or sub catchments required increases by 30% from 265
catchments to 381 catchments (Table 7). This approach still fails to adequately
cater for threatened species, because some of the best populations occur in
more modified catchments.
HIERARCHICAL SORT TOP 10 TYPE I CANDIDATE LIST BIOGEOGRAPHIC
UNIT CATCHMENTS AREA (ha) CATCHMENTS AREA (ha) CATCHMENTS AREA (ha)
Auckland 15 53,052 10 8 825 10 8 374
Banks Peninsula 9 19,999 10 15 752 6 16 534
Bay of Plenty 8 541,572 10 414 401 5 126 520
Canterbury 24 1,935,928 10 1 268 877 7 1 032 378
Clutha 16 1,607,773 10 4 033 818 7 879 570
Coromandel 17 73,760 10 37 203 13 62 344
East Cape 15 965,160 10 558 509 7 475 423
Fiordland 20 271,397 10 221 602 7 216 628
Grey-Buller 10 973,863 10 1 913 728 5 467 481
Hawke�s Bay 11 828,818 10 1 112 410 5 495 170
Manawatu-Wairarapa 16 1,780,120 10 52 293 9 270 627
Marlborough 20 1,336,601 10 529 393 9 781 172
Mokau 17 403,916 10 14 920 10 179 120
Motueka-Nelson 14 417,882 10 354 793 5 158 212
Northland - eastern 28 186,465 10 9 876 14 16 660
Northland - northern 16 21,283 10 16 240 11 14 093
Northland - western 15 374,544 10 26 639 10 75 380
Northwest Nelson-
Paparoa
15 451,378 10 414 518 8 365 406
Otago Peninsula 5 10,482 10 7 150 8 2 091
Palliser-Kidnappers 18 342,468 10 10 435 9 11 143
Southland 27 2,647,015 10 1 240 867 9 584 016
Stewart Island 5 65,708 10 86 525 4 62 113
Taieri 14 1,036,212 10 920 525 9 482 145
Taranaki 7 93,023 10 66 941 9 75 849
Waikato 11 1,970,584 10 1 657 122 6 317 392
Waitaki 22 1,954,190 10 1 375 504 8 510 777
Wanganui-Rangitikei 12 1,947,641 10 2 136 836 6 922 052
Wellington 5 85,268 10 92 075 6 28 215
Westland 20 951,842 10 638 279 12 734 111
Grand total 432 23,347,942 290 19 236 053 234 9 370 998
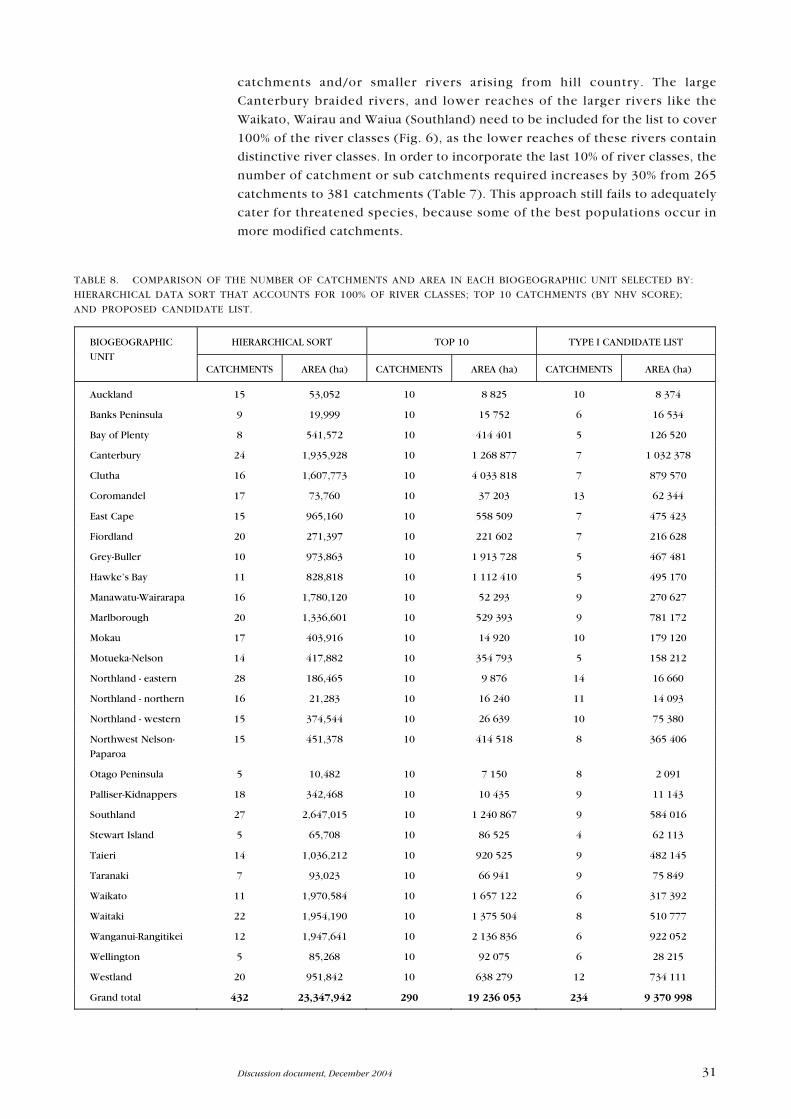
TABLE 8. COMPARISON OF THE NUMBER OF CATCHMENTS AND AREA IN EACH BIOGEOGRAPHIC UNIT SELECTED BY:
HIERARCHICAL DATA SORT THAT ACCOUNTS FOR 100% OF RIVER CLASSES; TOP 10 CATCHMENTS (BY NHV SCORE);
AND PROPOSED CANDIDATE LIST.
32 Chadderton et al. �Creating a candidate list of Rivers of National Importance
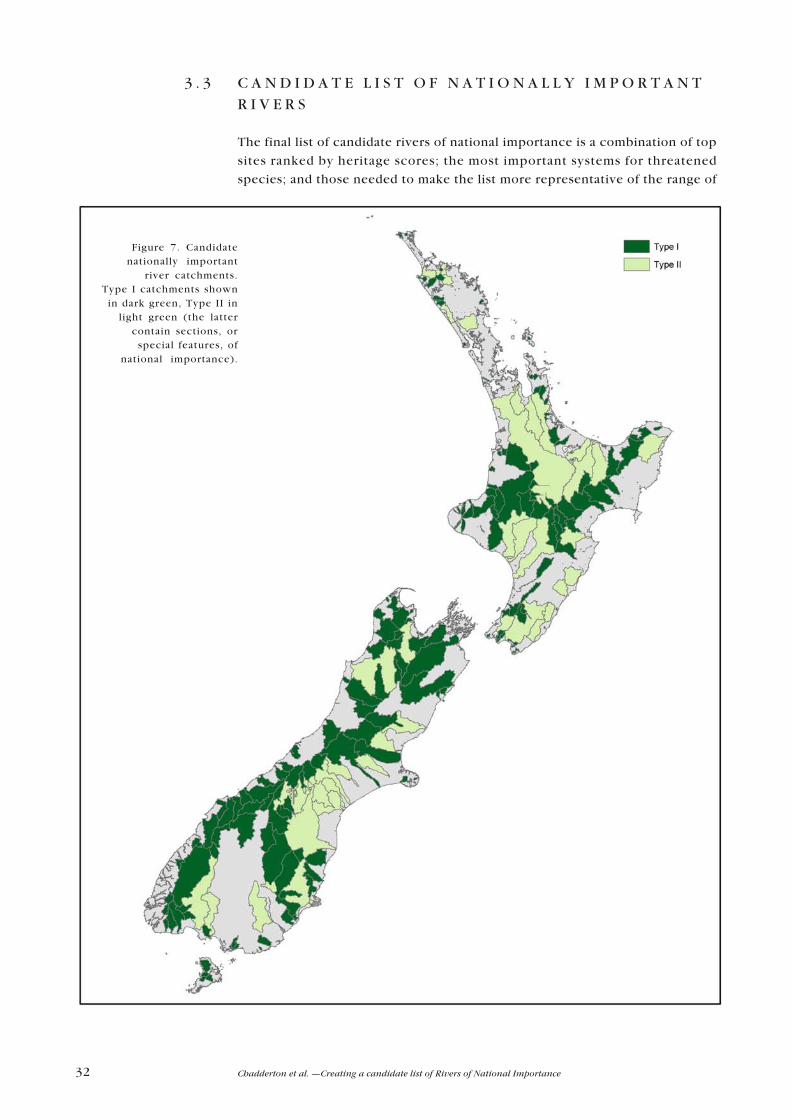
3 . 3 C A N D I D A T E L I S T O F N A T I O N A L L Y I M P O R T A N T
R I V E R S
The final list of candidate rivers of national importance is a combination of top
sites ranked by heritage scores; the most important systems for threatened
species; and those needed to make the list more representative of the range of
Figure 7. Candidatenationally important
river catchments.Type I catchments shown
in dark green, Type II inlight green (the latter
contain sections, orspecial features, of
national importance).
33Discussion document, December 2004
river classes present within each biogeographic unit. The Type I list includes
177 rivers and 57 sub catchments (5% of the river assessed), with an average of
8 rivers (or sub-catchments) per biogeographic unit (range 4�14). A further 46
catchments are listed as Type II rivers: they include several major catchments
(e.g. Waikato, Rangitikei, Whanganui, Motueka, Wairua, Buller, Taieri, Waitaki
Waimakariri, and Waiau (Southland): Fig. 7) that contain nationally important
sections in their lower reaches.
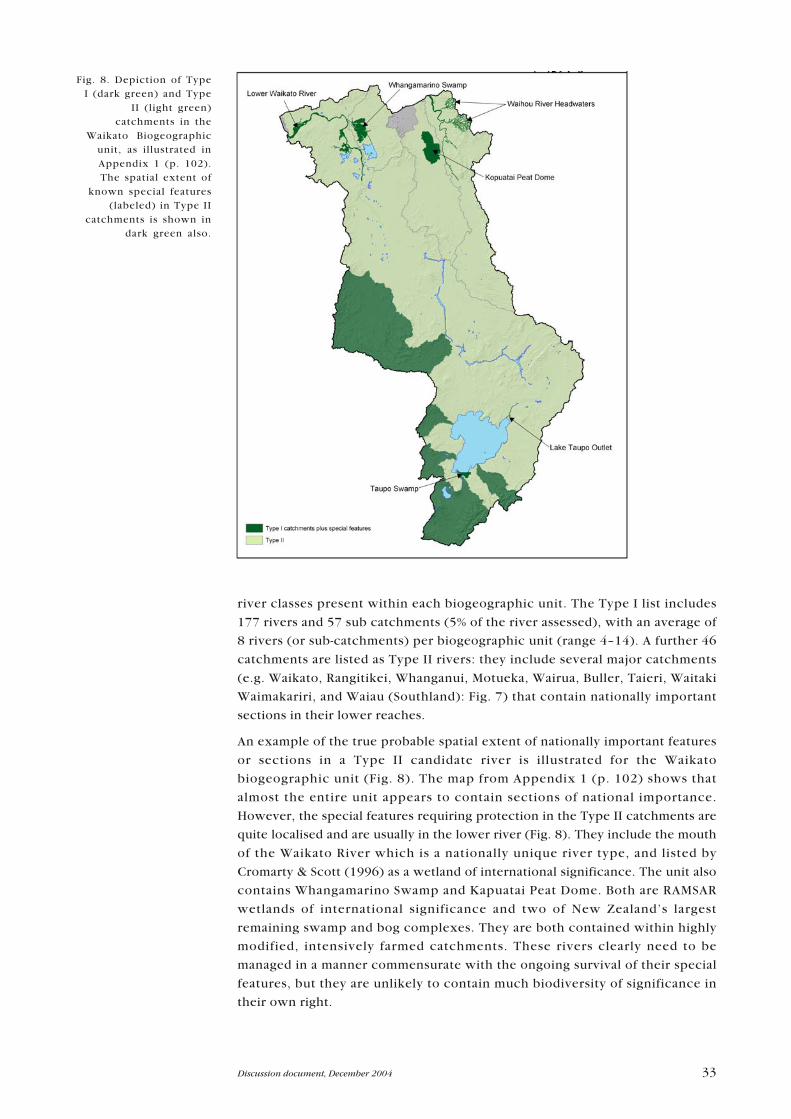
An example of the true probable spatial extent of nationally important features
or sections in a Type II candidate river is illustrated for the Waikato
biogeographic unit (Fig. 8). The map from Appendix 1 (p. 102) shows that
almost the entire unit appears to contain sections of national importance.
However, the special features requiring protection in the Type II catchments are
quite localised and are usually in the lower river (Fig. 8). They include the mouth
of the Waikato River which is a nationally unique river type, and listed by
Cromarty & Scott (1996) as a wetland of international significance. The unit also
contains Whangamarino Swamp and Kapuatai Peat Dome. Both are RAMSAR
wetlands of international significance and two of New Zealand�s largest
remaining swamp and bog complexes. They are both contained within highly
modified, intensively farmed catchments. These rivers clearly need to be
managed in a manner commensurate with the ongoing survival of their special
features, but they are unlikely to contain much biodiversity of significance in
their own right.
Fig. 8. Depiction of TypeI (dark green) and Type
II (light green)catchments in the
Waikato Biogeographicunit, as illustrated inAppendix 1 (p. 102).The spatial extent of
known special features(labeled) in Type II
catchments is shown indark green also.
34 Chadderton et al. �Creating a candidate list of Rivers of National Importance
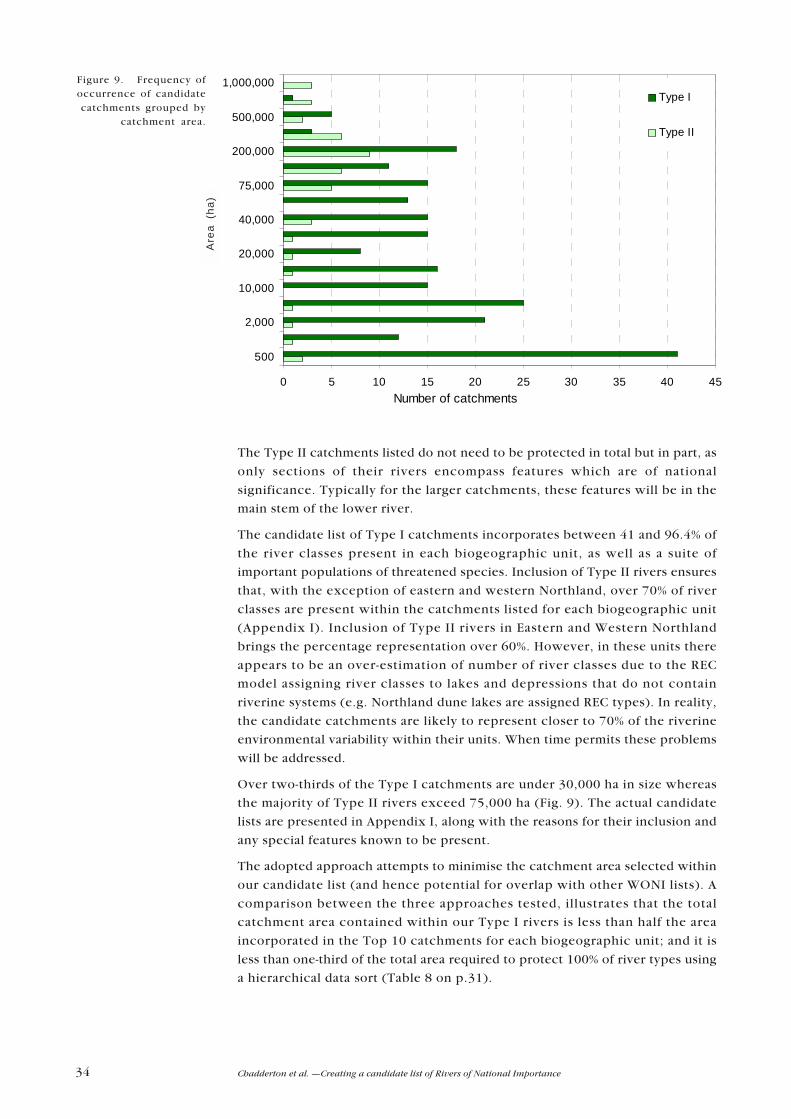
Figure 9. Frequency ofoccurrence of candidatecatchments grouped by
catchment area.
0 5 10 15 20 25 30 35 40 45
500
2,000
10,000
20,000
40,000
75,000
200,000
500,000
1,000,000
Area
((ha
)
Number of catchments
Type I
Type II
The Type II catchments listed do not need to be protected in total but in part, as
only sections of their rivers encompass features which are of national
significance. Typically for the larger catchments, these features will be in the
main stem of the lower river.
The candidate list of Type I catchments incorporates between 41 and 96.4% of
the river classes present in each biogeographic unit, as well as a suite of
important populations of threatened species. Inclusion of Type II rivers ensures
that, with the exception of eastern and western Northland, over 70% of river
classes are present within the catchments listed for each biogeographic unit
(Appendix I). Inclusion of Type II rivers in Eastern and Western Northland
brings the percentage representation over 60%. However, in these units there
appears to be an over-estimation of number of river classes due to the REC
model assigning river classes to lakes and depressions that do not contain
riverine systems (e.g. Northland dune lakes are assigned REC types). In reality,
the candidate catchments are likely to represent closer to 70% of the riverine
environmental variability within their units. When time permits these problems
will be addressed.
Over two-thirds of the Type I catchments are under 30,000 ha in size whereas
the majority of Type II rivers exceed 75,000 ha (Fig. 9). The actual candidate
lists are presented in Appendix I, along with the reasons for their inclusion and
any special features known to be present.
The adopted approach attempts to minimise the catchment area selected within
our candidate list (and hence potential for overlap with other WONI lists). A
comparison between the three approaches tested, illustrates that the total
catchment area contained within our Type I rivers is less than half the area
incorporated in the Top 10 catchments for each biogeographic unit; and it is
less than one-third of the total area required to protect 100% of river types using
a hierarchical data sort (Table 8 on p.31).
Are
a (h
a)
35Discussion document, December 2004
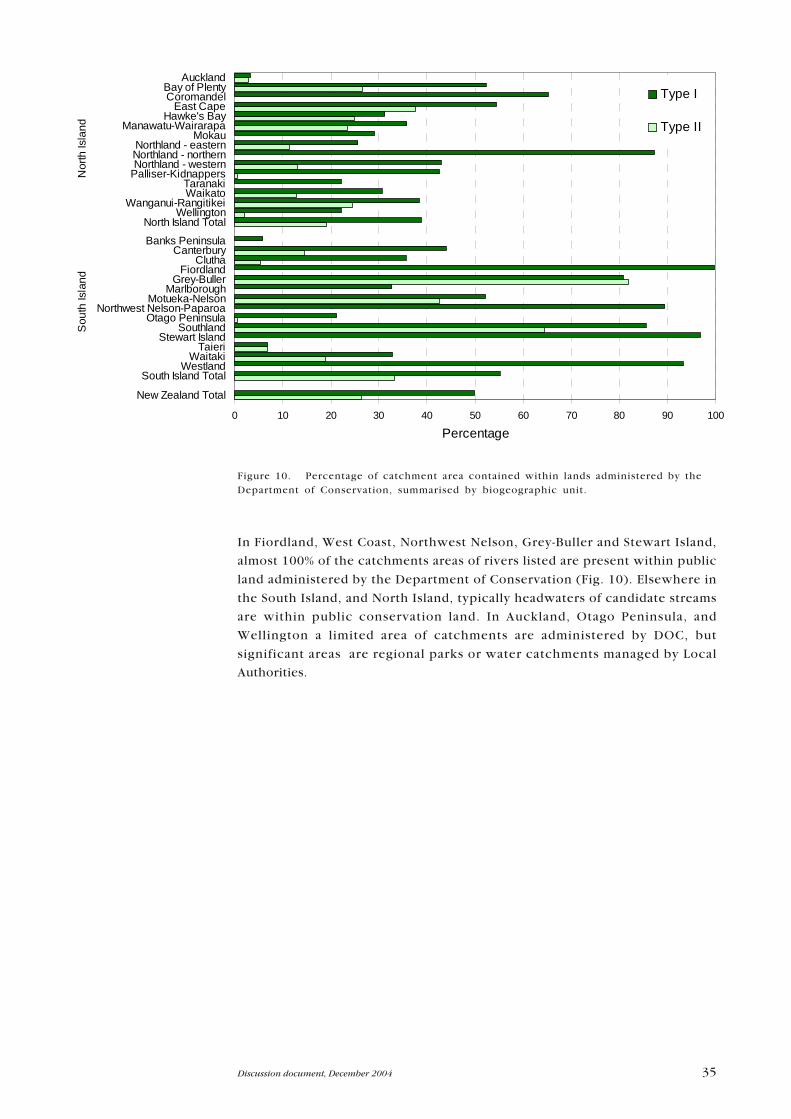
Figure 10. Percentage of catchment area contained within lands administered by theDepartment of Conservation, summarised by biogeographic unit.
0 10 20 30 40 50 60 70 80 90 100
New Zealand Total
South Island TotalWestland
WaitakiTaieri
Stewart IslandSouthland
Otago PeninsulaNorthwest Nelson-Paparoa
Motueka-NelsonMarlborough
Grey-BullerFiordland
CluthaCanterbury
Banks Peninsula
North Island TotalWellington
Wanganui-RangitikeiWaikatoTaranaki
Palliser-KidnappersNorthland - westernNorthland - northernNorthland - eastern
MokauManawatu-Wairarapa
Hawke's BayEast Cape
CoromandelBay of Plenty
AucklandS
outh
Isla
ndN
orth
Isla
nd
Percentage
Type I
Type II
In Fiordland, West Coast, Northwest Nelson, Grey-Buller and Stewart Island,
almost 100% of the catchments areas of rivers listed are present within public
land administered by the Department of Conservation (Fig. 10). Elsewhere in
the South Island, and North Island, typically headwaters of candidate streams
are within public conservation land. In Auckland, Otago Peninsula, and
Wellington a limited area of catchments are administered by DOC, but
significant areas are regional parks or water catchments managed by Local
Authorities.
36 Chadderton et al. �Creating a candidate list of Rivers of National Importance
4. Discussion
4 . 1 A S S E S S M E N T F R A M E W O R K
We adopted a technical assessment framework as this approach enabled a
comprehensive, consistent and objective list to be developed. This approach
lends itself to further learning, improvement and exploration of alternative
assumptions in the future.
The underlying data, models and processes presented are a precursor to the
Natural Heritage Management Systems (NHMS), a long-term improvement
programme that aims to provide the data and necessary tools to support the
Department of Conservation (DOC) with its natural heritage conservation
business. These and other tools will be developed as part of a broader
government agency partnership between DOC, Ministry for the Environment
(MfE), regional councils, and iwi. Hence the WONI natural heritage databases,
models and results will continue to be refined and extended as survey and
monitoring data, models and data management systems are improved. One
priority is to move beyond the limitations of our catchment-scale analysis by
developing systems that allow analyses such as WONI to be undertaken from the
scale of the river reach, up to whole catchments in a fully connected network.
There are some significant impediments to defining national priorities for
freshwater biodiversity protection. These include the absence of any freshwater
database describing observations of a full range of indigenous biodiversity; large
spatial and taxonomic gaps in survey data across the country, taxonomic
deficiencies and limitation in survey and inventory techniques (Collier et al.
2000). Collectively, these factors confound any direct assessment of the state of
biodiversity (i.e. based on biotic distribution data). Any assessment of
importance based on current biotic data sets alone, would be biased and carry
significant risk of overlooking systems essential for protecting the full range of
remaining indigenous biodiversity. To avoid these pitfalls, we used spatially
explicit (GIS) measures of environmental pattern as a surrogate for biotic
variablity, and pressure indices as surrogates for the state of native biodiversity.
It was possible to define and compile these data much more consistently and
comprehensively across New Zealand than is currently possible with existing
data describing observations of freshwater biota.
This assessment of natural heritage value was based on the principle that
measures of human-induced disturbance pressure, physical pattern and
biogeography, can be used to provide an index of indigenous biodiversity value.
There is support for these relationships within the current literature that
demonstrate that the greatest threats to freshwater communities in New
Zealand are the loss and reduced quality of habitats caused by human-induced
modification (see Collier & Winterbourn 2000 for current reviews). These
include modifications to catchments, riparian and channel environments, water
quality, river flows and introduction of exotic species (Collier 1993; Collier et al.
2000; Quinn 2000; Chadderton & Allibone 2000; Townsend et al. 2003;
Chadderton et al. 2003b).
37Discussion document, December 2004
The number of candidate rivers of national importance for biodiversity is
primarily driven by three features of our model:
� The number of biogeographic units recognised
� The classification resolution used for river environment classes (i.e. the
number of river classes recognised)
� How much of the full range of biodiversity is represented in the list.
The list of rivers will be longer as more biogeographic units and distinct river
environment types are recognised. It is therefore important that the resolution
of biogeographic units and river environments is a reasonable reflection of
freshwater biological pattern. If classification resolution is excessive, then the
number of units will overstate actual biological variation and more rivers will be
listed than are actually needed to represent the full range of biological diversity.
The converse will over-estimate the actual level of biodiversity protection
provided by the list. The WONI project timeframes prevented assessment of
these issues in detail. But, as noted in Sections 2.1 and 2.4, we have not been
overly conservative. The resolutions of both the biogeographic classification
and the river typology are more likely to under-estimate than over-estimate
actual biological variation.
These issues are compounded by the rule-based way in which the river
environment classification was constructed. This assumes that all river classes
are equally different, yet this is most unlikely to be true. It is possible that some
river classes not included in our candidate list could be highly distinctive, and
represent a significant proportion of the full range of freshwater biodiversity.
This risk is greatest for large lowland rivers which are probably under-
represented in the list. We intend to test this issue after completing a
multivariate riverine classification in 2005, which will enable distinctiveness and
environmental distance to be measured.
4 . 2 T H E C A N D I D A T E L I S T O F R I V E R S O F N A T I O N A L
I M P O R T A N C E
Biological diversity encompasses the variability among living organisms from all
sources and the ecological complexes of which they are part; this includes
diversity within species (genotypic and phenotypic), between species and of
ecosystems (Richmond 1999). Therefore in order to meet our goal of protecting
a full range of biodiversity, the final candidate list had to include and provide for:
� Viable populations of all indigenous species and sub species
� A full range of remaining natural habitats, environments and ecosystem
processes which yield biological pattern, and ecosystem structure.
Our candidate list for Waters of National Importance attempts to reconcile the
diversity of our river ecosystem types with the collective habitat needs of New
Zealand�s freshwater biodiversity. We effectively have to consider the needs of
160 water-dependent bird species, 38 species of freshwater plant and 38
species of fish, as well as hundreds of species and subspecies of freshwater
invertebrates and microscopic plants (diatoms). The challenge of capturing an
adequate range of species is complicated by the variable distribution patterns of
38 Chadderton et al. �Creating a candidate list of Rivers of National Importance
these taxa, in space and time. At one extreme, some endemic invertebrate
species are found only in a few catchments within a single biogeographic unit
(e.g. Bank Peninsula has at least 6 endemic species: Harding 2003).
Paradoxically, there are migratory bird species that depend upon different river
systems for just a few days of the year, and even rivers in another region during
alternate seasons or stages of their life cycle (e.g. braided river birds: O�Donnell
in press).
To provide for the full range of biodiversity, we needed to include a combination
of distinctive, threatened, and least disturbed representative systems (Collier et
al. 2003). The latter systems are priorities for protection as they are likely to
have retained most indigenous biodiversity content. In contrast, the more
distinctive systems and threatened environments are likely to contain sites
where indigenous biodiversity is at peril. Hence to conserve a full range of
biological and genetic diversity, it is necessary to protect a wide range of
habitats (Ponder et al. 1996). This requires both the identification of areas of
special value (biodiversity hotspots) and the assessment of complementarity
(Reid 1998; Margules & Pressey 2000). For these reasons the WONI biodiversity
list is a combination of the least disturbed representative and distinctive river
systems, plus a range of catchments that contain rare and special features or
threatened species.
The simplest approach to developing a candidate list would have been to choose
the highest ranking river in each biogeographic unit. However, this approach
would not sustain the full range of New Zealand�s natural freshwater biological
diversity, as it accounts for only a small percentage of the range of river
ecosystem types and associated biodiversity. It is also unlikely to adequately
protect many threatened species. The final candidate list therefore took a
combination in each biogeographic unit, of the most natural sites (highest
heritage value scores), catchments that made the greatest contributions to the
range of river environment classes, and systems with significant populations of
threatened species. A total of 177 whole-river catchments and 57 sub-catchment
units were identified that incorporate an average of 76% of all river environment
classes. With the inclusion of a further 46 (Type II) river catchments that
contain sections or special features of national significance, our lists appears to
cover almost 90% of river classes and a viable range of key sites for most
threatened species.
The Type II list includes a number major catchments (e.g. Waikato, Rangitikei,
Whanganui, Motueka, Wairua, Buller, Taieri, Waitaki, Waimakariri, and Waiau
(Southland), Aparima). These contain nationally important wetlands, lakes or
estuaries or populations of threatened species often in their lower reaches and
or main stems. It also includes a number of medium-sized catchments (e.g.
Tarawera River) where the values are located within their headwaters, but the
catchment framework does not allow these areas to be delineated at greater
resolution. The key issue here is that, in order to conserve these values, the
entire catchment would not need to be protected. This is well illustrated by the
mouth of the Waikato River, a unique river form listed by Cromarty & Scott
(1996) as a wetland of international significance. Protection of the entire
Waikato catchment would not be required in order to conserve the special
features at the Waikato River mouth.
39Discussion document, December 2004
A range of protection mechanisms could be used to secure these Waters of
National Importance; methods will depend upon both land tenure and the
nature of a system�s ecological values. The majority of headwaters reaches are
within public lands managed for conservation, or in some instances they are
water catchments or regional parks managed by local authorities. In the South
Island (particularly Fiordland, Westland, Nelson) and Stewart Island, the
catchments listed are almost entirely within the conservation estate. Protecting
these may simply require appropriate rules in regional plans and riparian
management. In other South Island areas (like the Clutha and Taieri
biogeographic units), the High Country Tenure review process may offer a
means to increase the levels of legal protection. The potential value of statutory
mechanisms will be explored at a latter stage of the WONI process; such
exploration is beyond the scope of the present report.
4 . 3 S T R E N G T H S O F T H E W O N I A S S E S S M E N T
Our work represents the first attempt to identify nationally important rivers
systems for indigenous biodiversity. It is quite unlike previous efforts to identify
New Zealand�s most important wild and scenic rivers (e.g. NWASCO) that
largely only considered recreation, landscape and acclimatised fish values.
The present assessment successfully identified the most natural and
representative river systems that contain a reasonably comprehensive range of
New Zealand�s freshwater ecosystems, communities and species including
threatened species. The list is objective; the framework and approach allows for
further testing and refinement.
The WONI databases and candidate list also offer a framework to inform and
improve planning and management of freshwater natural heritage at regional to
national scales. At the very least, it provides a multi-scale context for assessing
the significance of particular catchments for biodiversity maintenance.
Underlying models are explicit and offer predictions that can be tested and so
facilitate learning. The database provides a basis from which the level of
investment required to halt the decline in freshwater biodiversity can be
estimated; management effort can be directed to those catchments where the
best value from biodiversity investment is likely to be obtained.
The assessment demonstrates the efficacy and power of a spatially explicit
approach using data describing environments and human-induced disturbance
pressure. These concepts are being developed in the department�s National
Heritage Management Systems programme as described by Stephens et al.
(2002). The WONI project demonstrates another application of conservation
assessment concepts (i.e. the identification of catchments that contribute most
to New Zealand�s remaining freshwater biodiversity). The challenge now is to
thoroughly test the results, quantify inadequacies, design systems and better
models, and focus survey and monitoring effort to fill data gaps. All these
elements are required for the WONI assessment to be improved and for the
value of its learning opportunities to be fully realised.
40 Chadderton et al. �Creating a candidate list of Rivers of National Importance
4 . 4 W E A K N E S S E S O F T H E W O N I A S S E S S M E N T
It is important to note that on current knowledge, full protection of this list will
not achieve Goal Three of the New Zealand Biodiversity Strategy, i.e. protection
of the full range of biodiversity. Based on our model, achieving Goal Three for
New Zealand�s rivers would probably require 381 river and sub-catchments to
be fully protected from further degradation. However, limitations in our river
catchment data mean that the redundancy (i.e. unnecessary conservation effort)
in these 381 catchments would be significant.
Budget and time constraints precluded development of a network system to
allow continuous analysis from headwaters to the river mouth. One
consequence of this problem was that lower reaches of large catchments could
not be analysed separately from their upper catchments. Hence heritage value
scores for large rivers were a product of their entire catchment, resulting in high
heritage values that overshadowed smaller rivers and sub-catchments. This
might have resulted in a list comprising all New Zealand�s major rivers. We
overcame this problem by sorting catchments hierarchically to down-weight
parent catchments. However, this procedure may have created another
problem: exclusion of some lower main-stem river reaches that contain
nationally important biodiversity. Time constraints have prevented exploration
of this possibility and its consequences.
Even within Type I catchments (our primary candidate list), there are likely to
be areas that are not nationally important because of the catchment scale
assessment (cf. river reach scale). Many tributaries and headwater sections will
have been included in the list because another part of the catchment contains
river classes that make the candidate list more representative. This implies
duplication and some redundancy within some listed catchments, hence
overestimation of the area required to protect a full range of values. This issue
will remain until New Zealand�s river network can be properly analysed as a
spatial network.
The gap between protection of the ideal (100% of river classes) and the
percentage protected in our current list (76%) is probably overstated. This
results from an artifact caused by the digital elevation models used to delineate
rivers, where some lakes and depressions are defined as catchments and then
assigned river classes. Especially in the Auckland and Northland units, and some
high-country areas of the South Island, the number of river classes is probably
overstated due to the presence of dune lakes, volcanic craters, or glacial cirques.
Time constraints prevented correction of these errors.
There are no national or local population estimates for most threatened native
species. Consequently our WONI rankings place little emphasis on any single
population of highly threatened species. Clearly, if the loss of a population
would lead to, or dramatically increase the probability of extinction, then (in
accordance with Goal Three of the New Zealand Biodiversity Strategy to halt the
decline) its protection would be of national importance. Absence of data to
index population significance means that we have been unable to account for
the irreplaceability of populations of threatened species. Therefore some
critical populations of threatened species are not represented in the WONI list.
These issues can only be overcome with the development and implementation
41Discussion document, December 2004
of comprehensive biodiversity survey and monitoring programmes supported
by national databases. These are presently beyond the resources of both this
project and the Department.
Our model inadequately accounts for the connectivity and buffer functions that
some rivers provide to nationally important wetlands, lakes and estuaries. The
current list is incomplete, reflecting acknowledged shortcomings of previous
assessments (e.g. Cromarty & Scott 1996) and our inability to develop a suitable
typology for lakes (unpublished data). We have therefore applied minimal
weight to buffering and connectivity services provided by rivers to these
ecosystems. This issue will be re-visited once a more comprehensive and
objectively derived list of nationally important wetlands, lakes and estuaries has
been produced during later stages of the WONI project.
Few unmodified river systems completely free of exotic fish, remain on the New
Zealand mainland (Chadderton 1990; Jowett et al. 1998; Chadderton & Allibone
2000). Those that do remain are highly significant, for two reasons:
� Scientifically � as critical role models for future restoration of other rivers
(Zedler et al. 1997; Chadderton & Allibone 2000)
� Intrinsically � as the most complete examples of New Zealand�s remaining
freshwater biodiversity.
Detection of systems without exotic species was hampered by large gaps in
survey effort. Areas apparently free of all exotic fish species on the South Island
West Coast, Fiordland and East Cape North Island, are more likely to represent
absence of survey effort rather than absence of exotic fish. Yet these isolated
areas are also likely to contain the largest remaining systems free of exotic
species. Where such systems could be positively identified, they were
incorporated directly into the list of candidate rivers on this criterion alone (e.g.
Company Creek, Westland National Park).
The Department of Conservation�s NHMS programme will provide some
opportunity to improve the databases we require for this type of assessment. In
particular, an Inventory and Monitoring project aims to improve the quality and
coverage of biodiversity and pressure data. The Bioweb database project will
offer curation services, provide a single data access portal and promote
improved data standards. We hope that the NHMS programme will eventually
attract resources to build and sustain the skills and capability required to
develop, test, improve and use models for applying conservation and
biodiversity assessment concepts; and so realise the potential value that these
concepts offer.
42 Chadderton et al. �Creating a candidate list of Rivers of National Importance
5. Acknowledgements
We are indebted to a wide variety of people without whose help this project
would not have been completed. Numerous staff from Department of
Conservation, Fish & Game Councils and Regional Councils provided data, and
passed a critical eye over pressure measures, and commented upon the
candidate lists, often at short notice. Chris Richmond set up the project,
provided the policy context, and was a crucial sounding board and reviewer of
the project outcomes. Murray Williams, Colin O�Donnell and Jo Sim developed
the lists of nationally important rivers for aquatic birds. Richard Allibone
compiled the threatened-fish data, with help from Eric Graynoth (eels). Andrew
Townsend produced the list of threatened aquatic plants (helped by
conservancy botanists) and Leigh Bull pulled this, the Hochstetter�s frog and the
blue duck data out of Bioweb. Joanna Drabsch spatially referenced the point
source discharge data. Rob McColl and Bob Wilcock provided advice on nutrient
loading, and Russell Death and Mike Joy on pressure/biodiversity relationships.
Brenton Wilson, Margaret McTainsh and Lynette Hartley provided GIS support,
and Jenny Christies modelling advice. Adam Smith rescued us numerous times
from Excel problems. Thanks to Rod Hay and Margaret for hosting us in our
days of need. Thanks also to John Leathwick and Kevin Collier for letting us
plagiarise innumerable sections of their earlier report. Tracie Dean reviewed
and checked the penultimate drafts, and Jaap Jasperse provided
�unprecedented� editing and formatting under very tight time frames.
Finally thanks to Ned Norton, Mark Weatherhead, Helen Hurren, Ude Shanker
and Ton Snelder, for their patience, and hard work in developing many of the
databases used in this analysis.
43Discussion document, December 2004
6. References
( C O M B I N E D F O R M A I N T E X T A N D A P P E N D I X 1 )
Abell, R.; Olson, D.M.; Dinerstein, E.; Hurley, P.; Diggs, J.T.; Eichbaum, W.; Walters, S.;
Wettengel, W.; Allnutt, T.; Loucks, C.; Hedao, P. (2000). Freshwater ecoprovinces
of North America: a conservation assessment. Island Press. Washington, DC, USA.
319 p.
Allibone, R.M. (2002). Dealing with biodiversity dwarf galaxias style. Water &
Atmosphere 10(1): 18�19.
Anonymous (2000). New Zealand�s biodiversity strategy: our chance to turn the tide.
Department of Conservation & Ministry for the Environment, Wellington, New
Zealand.
Boothroyd, I. (2000). Biogeography and biodiversity. In: Collier, K.J.; Winterbourn, M.J.
(eds), New Zealand stream invertebrates: ecology and implications for
management. New Zealand Limnological Society, 415 p.
Briggs, R.M.; Okada, T.; Itaya, I.; Shibuya, H.; Smith, I.E.M. (1994). K-Ar ages,
paleomgnetism, and geochemistry of the South Auckland volcanic field, North
Island, New Zealand. New Zealand Journal of Geology and Geophysics 37: 143�
153.
Chadderton, W.L. (1990). The ecology of Stewart Island freshwater communities.
Unpublished MSc thesis. University of Canterbury, Christchurch.
Chadderton, W.L.; Allibone, R.M. (2000). Habitat use and longitudinal distribution
patterns of native fish from a near pristine Stewart Island, New Zealand Stream.
New Zealand Journal of Marine and Freshwater Research 34: 487�499.
Chadderton, W.L.; Grainger, N.; Dean, T. (2003a). Prioritising control of invasive
freshwater fish. In: Managing invasive feshwater fish in New Zealand. Proceedings
of a workshop hosted by the Department of Conservation, 10�12 May 2001,
Hamilton.
Chadderton, W.L.; Ryan, P.A.; Winterbourn, M.J. (2003b). Distribution, ecology, and
conservation status of freshwater Idoteidae (Isopoda) in southern New Zealand.
Journal of Royal Society of New Zealand 33: 529�548.
Champion, P.; Clayton, J.; Rowe, D. (2002). Lake managers� handbook. Ministry for the
Environment. 49 p.
Collier, K.J. (1993). Review of the status, distribution, and conservation of freshwater
invertebrates in New Zealand. New Zealand Journal of Marine and Freshwater
Research 27: 339�356.
Collier, K.J.; Clarkson, B.D.; Chadderton, L. (2003). Criteria and frameworks for assessing
natural heritage value of nationally important freshwater and estuarine ecosystems.
NIWA Client Report HAM2002-033.
Collier, K.J.; Fowles, C.R.; Hogg, I.D. (2000). Management, education and conservation.
In: Collier, K.J.; Winterbourn, M.J. Eds, New Zealand stream invertebrates: ecology
and implications for management. New Zealand Limnological Society, 415 p.
Collier, K.J.; Winterbourn, M.J. Eds (2000). New Zealand stream invertebrates: ecology
and implications for management. New Zealand Limnological Society, 415 p.
Cromarty, P.; Scott, D.A. Eds (1996). A directory of wetlands in New Zealand. Department
of Conservation, Wellington, New Zealand
Davey, M.L.; O�Brien, L.; Ling, N.; Gleeson, D.M. (2003). Population genetic structure of
the Canterbury mudfish (Neochanna burrowsius): biogeography and conservation
implications. New Zealand Journal of Marine and Freshwater Research 37: 13�
21.
44 Chadderton et al. �Creating a candidate list of Rivers of National Importance
David, B., Chadderton, W.L., Closs, G., Barry, B., Markwitz, A. (2004). Evidence of flexible
recruitment strategies in coastal populations of giant kokopu. DOC Internal series
160.
de Lange, P.J.; Norton, D.A.; Heenan, P.B.; Courtney, S.P.; Molloy, B.P.J; Ogle, C.C.;
Rance, B.D.; Johnson, P.N.; Hitchmough, R. (in press). Threatened and uncommon
plants of New Zealand. New Zealand Journal of Botany.
Death, R.G.; Joy, M.K. (2004). Invertebrate community structure in �pristine� streams of
the Manuatu-Whanganui region, New Zealand: the effect of regional versus local
influences. Freshwater Biology 49: 982�997.
Duggan, I.C.; Collier, K.J.; Champion, P.D.; Croker, G.F.; Davies-Colley, R.J.; Lambert,
P.W.; Nagels, J.W.; Wilcock, R.J. (2002). Ecoregional differences in macrophyte
and macroinvertebrate communities between Westland and Waikato�are all New
Zealand lowland streams the same? New Zealand Journal of Marine and
Freshwater Research 36: 831�845.
Fleming, C.A. (1989). The Geological History of new Zealand and its life. Auckland
university Press. 141 p.
Gemmell, N.J.; Bowsher, J.H.; Gomas, K.P. (2003). Genetic affinities of Hochstetter�s frog
(Leiopelma hochstetteri) populations in the Bay of Plenty. DOC Science Internal
Series 141. Department of Conservation, Wellington. 19 p.
Graynoth, E.; Niven, K. (2004). Longfinned female eel habitat in the West Coast and
Southland. Science for Conservation 238 . Department of Conservation,
Wellington. 33 p.
Harding, J.S. (1992). Discontinuities in the distribution of invertebrates in impounded
South Island rivers, New Zealand. Regulated rivers: Research & Management 7 :
327�335.
Harding, J.S. (2003). Historic deforestation and the fate of endemic species in streams.
New Zealand Journal of Marine and Freshwater Research 37: 333�345.
Harding, J.S.; Winterbourn, M.J. (1997). New Zealand ecoregions: a classification for use
in stream conservation and management. Department of Conservation Technical
Series No. 11.
Harding, J.S.; Winterbourn, M.J.; McDiffett, W.F. (1997). Stream faunas and ecoregions in
South Island, New Zealand: do they correspond? Archiv fuer Hydrobiologie 140:
289�307.
Henderson, I. (1985). Systematic studies of New Zealand Trichoptera and critical analysis
of systematic methods. Unpublished PhD thesis, Victoria University of Wellington.
Hickey, C.W. (2000). Ecotoxicology: laboratory and field approaches. In: Collier, K.J.;
Winterbourn, M.J. Eds, New Zealand stream invertebrates: ecology and
implications for management. New Zealand Limnological Society, 415 p.
Hitchings, T.R. (2001). The Canterbury Museum mayfly collection and database (Insecta:
Ephemeroptera). Records of the Canterbury Museum 15: 11�32.
Hitchmough, R. Comp. (2002). New Zealand threat classification system lists. Department
of Conservation, Threatened Species Occasional Publication 23.
Hogg, I.D.; Willmann-Huerner, P.; Stevens, M.I. (2002): Population genetic structures of
two New Zealand stream insects: Archichauliodes diversus (Megaloptera) and
Coloburiscus humeralis (Ephemeroptera). New Zealand Journal of Marine and
Freshwater Research 36: 491�501.
Jellyman, D.J. (1984). Distribution and biology of freshwater fish in the Clutha river.
Fisheries Environmental Report 46. 68 p.
Jowett, I. (2000). Flow management. In: Collier, K.J.; Winterbourn, M.J. Eds , New
Zealand stream invertebrates: ecology and implications for management. New
Zealand Limnological Society, 415 p.
Jowett, I.G.; Hayes, J.W.; Deans, N.; Eldon, G.A. (1998). Comparison of fish communities
and abundance in unmodified streams of Kahurangi National Park with other areas
45Discussion document, December 2004
of New Zealand. New Zealand Journal of Marine and Freshwater Research 32:
307�322.
Leathwick, J.R.; Collier, K.C.; Chadderton, W.L. (2003). Identifying freshwater
ecosystems with nationally important natural heritage values: Development of a
biogeographic framework. Unpublished NIWA Client report: HAM2003-146.
Leathwick, J.R.; Mitchell, N.D. (1992). Forest pattern, climate and volcanism in central
North Island, New Zealand. Journal of Vegetation Science 3: 603�616.
Ling, N.; Gleeson, D.; Willis, K.; Binzegger, S.U. (2001). Creating and destroying species:
the �new� biodiversity and evolutionary significant units among New Zealand�s
galaxiid fishes. Journal of Fish Biology 59: 209�222.
Main, M.R. (1989). Distribution and post-glacial dispersal of freshwater fishes in South
Westland, New Zealand. Journal of the Royal Society of New Zealand 19: 161�169.
Margules, C.R.; Pressey, R.L. (2000). Systematic conservation planning. Nature 405: 243�
253.
McDowall, R.M. (1990). New Zealand freshwater fishes. A natural history and guide.
Heinemann reed. 553 p.
McDowall, R.M.; Chadderton, W.L. (1999). Galaxias gollumoides (Teleostei: Galaxiidae),
a new fish species from Stewart Island, with notes on other non-migratory
freshwater fishes present on the island. Journal of Royal Society of New Zealand
29 : 77�88.
McDowall, R.M. (1995). Effects of Taupo eruption endure in fish populations. Water and
Atmosphere 3: 22�23.
McDowall, R.M. (1996). Volcanism and freshwater fish biogeography in the northeastern
North Island of New Zealand. Journal of Biogeography 23: 139�148.
McDowall, R.M.; Waters, J.M. (2002). A new longjaw Galaxias (Teleostei: Galaxiidae)
from the Kauru River, North Otago, New Zealand. New Zealand Journal of
Zoology 29 : 41�52.
McDowall, R.M.; Waters, J.M. (2003). A new species of Galaxias (Teleostei: Galaxiidae)
from the Mackenzie Basin, New Zealand. Journal of the Royal Society of New
Zealand 33: 675�691.
McGlone, M.S. (1988). New Zealand. Pp. 557�599 in Huntley, B.; Webb, T. III (Eds),
Vegetation History. Kluwer Academic Publishers.
McIntosh, A.R. (2000). Aquatic predator-prey interactions. In: Collier, K.J.; Winterbourn,
M.J. Eds , New Zealand stream invertebrates: ecology and implications for
management. New Zealand Limnological Society, 415 p.
McLellan, I.D. (1990). Distribution of stoneflies in New Zealand. In: Campbell, I.C. Ed.,
Mayflies and stoneflies. Kluwer Academic Publishers, pp. 135�140.
Molloy, J.; Bell, B.D.; Clout, M.; de Lange, P.; Gibbs, G.; Given, D.; Norton, D; Smith, N.;
Stephens, T. (2002). Classifying species according to threat of extinction.
Threatened Species Occasional Publication 22 . Department of Conservation,
Wellington.
Norton, N.; Weatherhead, M.; Snelder, T.; Hurren, H.; Chadderton, L.; Brown, D. (2004).
New Zealand Waters of National Importance: Developing a biodiversity framework
for rivers and lakes. Unpublished NIWA Client report.
O�Donnell, C.F.J. (1985). Lake Ellesmere. A wildlife habitat of international importance.
Fauna survey unit report 40 . 219 p.
O�Donnell, C.J.F. (1992). Birdlife of the Ashburton River, Canterbury, New Zealand. Canterbury
Conservancy Technical Report No. 1. Department of Conservation.
O�Donnell, C.F.J. (2000). The significance of river and open water habitats for indigenous
birds of Canterbury New Zealand. Unpublished report for Environment Canterbury.
O�Donnell C.F.J. (in press). River bird communities. Freshwaters of New Zealand. New
Zealand Hydrological and Limnological Societies, Christchurch.
46 Chadderton et al. �Creating a candidate list of Rivers of National Importance
O�Donnell, C.F.J.; Moore, S.M. (1983). The wildlife and conservation of braided river
systems in Canterbury. New Zealand Wildlife Service Fauna Survey Unit Report
No. 33. Department of Internal Affairs, Wellington.
Patrick, B.H.; Rance, B.D.; Barratt, B.I.P. (1992). Alpine insects and plants of Stewart
Island. Rakiura Ecological province. Department of Conservation [Southland
Conservancy], Miscellaneous Series 9.
Ponder, W.F.; Eggler, P.; Colgan, D.J. (1996). Genetic differentiation of aquatic snails
(Gastropoda: Hydrobiidae) from artesian springs in arid Australia. Biological
Journal of Linnean Society 56: 553�596.
Quinn, J. (2000). Effects of pastoral development. In: Collier, K.J.; Winterbourn, M.J. Eds,
New Zealand stream invertebrates: ecology and implications for management. New
Zealand Limnological Society, 415 p.
Reid, W.V. (1998). Biodiversity hotspots. Trends in ecology and evolution 13: 275�280.
Richmond C. (1999). The commons becoming uncommon: Integration or disintegration in
the protection of aquatic bioddiversity. In: Blaschke, P.M.; Green, K. Eds ,
Biodiversity Now! Joint Societies Conference, Wellington, 29 June�3 July 1997.
Selected Papers. Department of Conservation, Wellington.
Rosgen, D.L. (1994). A classification of natural rivers. Catena 22: 169�199.
Schallenberg, M.; Burns, C.W. (2003). A temperate, tidal lake complex 2. Water quality
and implications for zooplankton community structure. New Zealand Journal of
Marine and Freshwater Research 37: 429�447
Smith, B.J. (2001). The larva of Traillochorema rakiura McFarlane (Trichoptera:
Hydrobiosidae), a caddisfly endemic to Stewart Island, New Zealand. New Zealand
Entomologist 24: 71�74.
Smith, P.J.; Collier, K.J. (2001). Allozyme diversity and population structure of the
caddisfly Orthopsyche fimbriata and the mayfly Acanthophlebia cruentata in New
Zealand streams. Freshwater Biology 46: 795�805.
Smith, P.J.; McVeagh, S.M.; Allibone R. (2003). The Tarndale bully revisited with
molecular markers: an ecophenotype of the common bully Gobiomorphus
cotidianus (Pisces: Gobiidae). Journal of the Royal Society of New Zealand 33:
663�673.
Snelder, T.H.; Biggs, B.J.F. (2002). Multi-Scale River Environment Classification for water
resources management. Journal of the American Water Resources Association 38:
1225�1240.
Soons, J.M. (1982). Westland: The West Coast of the South Island. Pp. 299�319 in Soons,
J.M.; Selby, M.J. Eds: Landforms of New Zealand. Longman Paul.
Stephens, R.T.T.; Brown, D.J.; Thornley, N.J. (2002). Measuring Conservation
Achievement: concepts and their application over the Twizel Area. Science for
Conservation 200. Department of Conservation, Wellington.
Stevens, G.R. (1980). New Zealand adrift. The theory of continental drift in a New Zealand
setting. Reed. 442 p.
Suren, A. M. (2000). Effects of urbanisation. In: Collier, K.J., Winterbourn, M.J. Eds, New
Zealand stream invertebrates: ecology and implications for management. New
Zealand Limnological Society, 415 p.
Towns, D.R. (1987). The mayflies (Ephemeroptera) of Great Barrier Island, New Zealand:
macro- and micro- distributional comparisons. Journal of Royal Society of New
Zealand 17: 349�361.
Townsend, C.R.; Dolédec, S.; Norris, R.; Peacock, K.; Arbuckle, C. (2003). The influence
of scale and geography on relationships between stream community composition
and landscape variables: description and prediction. Freshwater Biology 48: 768�
785.
Vincent, W.F.; Forsyth, D.J. (1987). Geothermal influenced waters. In: A.B. Viner Ed .
Inland Waters of New Zealand. DSIR Bulletin 241. 494 p.
47Discussion document, December 2004
Vinson, M.R.; Hawkins, C.P. (1998). Biodiversity of stream insects: Variation at Local,
Basin and Regional scales. Annual Review of Entomology 43: 271�293.
Walker, K.J. (2003). Recovery plans for Powelliphanta land snails. Threatened Species
Recovery Plan 49. Department of Conservation, Wellington. 208 p.
Ward, J.V.; Stanford, J.A. (1979). The ecology of regulated rivers. Plenum Press, New
York.
Wardle, J. (1984). The New Zealand beeches: ecology, utilisation, and management.
Wellington, New Zealand Forest Service.
Waters, J.M.; Wallis, G.P. (2000). Across the Southern Alps by river capture? Freshwater
fish phylogeography in South Island, New Zealand. Molecular Ecology 9 : 1577�
1582.
Waters, J.M.; Wallis, G.P. (2001a). Cladogenesis and loss of the marine life-history phase
in freshwater galaxiid fishes (Osmeriformes: Galaxiidae). Evolution 55: 587�597.
Waters, J.M; Wallis, G.P. (2001b). Mitochondrial DNA phylogenetics of the Galaxias
vulgaris complex from South Island, New Zealand: rapid radiation of a species
flock. Journal of Fish Biology 58: 1166�1180.
Wilcock, R.J.; Nagels, J.W.; Rodda, H.J.E.; O�Connor, M.B.; Thorrold, B.S.; Barnett, J.W.
(1999). Water quality of a lowland stream in a New Zealand dairy farming
catchment. New Zealand Journal of Marine and Freshwater Research 33: 683�
696.
Wilson, H.D. (1987). Vegetation of Stewart Island New Zealand: a supplement to the New
Zealand Journal of Botany. DSIR Science Information Publishing Centre.
Winterbourn, M.J. (1995). Rivers and streams of New Zealand. In: Cushing, C.E.,
Cummins, K.W., Minshall, G.W. Eds: Ecosystems of the World. Elsevier.
Winterbourn, M.J. (2000). Feeding ecology. In: Collier, K.J.; Winterbourn, M.J. Eds New
Zealand stream invertebrates: ecology and implications for management. New
Zealand Limnological Society, 415 p.
Zedler, J.B.; Williams, G.B.; Desmond, J.S. (1997). Wetland mitigation: can fishes
distinguish between natural and constructed wetlands. Fisheries 22(3): 26�28.
49Discussion document, December 2004
Appendix 1.
C A N D I D A T E L I S T � B I O G E O G R A P H I C U N I T S
Biogeographic units are listed in alphabetical order below (for locations, refer
Fig. 1 on p. 23).
Within each biogeographic unit a general description is provided of the unit and
some of its key biotic features. These are derived almost exclusively from
Leathwick et al. (2003). Where possible this is supplemented with additional
information although this is limited due to time and resource limitations
imposed within the timeframes of the Waters of National Importance project.
Candidate catchments are listed in tables by biogeographic unit. Each table
contains abbreviated notes on key features or reasons for inclusion of some
candidates in the lists. However, some catchments have no additional notes.
These have been selected because they contain the least disturbed example of
river classes not represented within the list of nationally important catchments.
They have been chosen to make the list more representative of the full range of
river environments and hence riverine biodiversity.
Auckland
Banks Peninsula
Bay of Plenty
Canterbury
Clutha
Coromandel
East Cape
Fiordland
Grey-Buller
Hawke�s Bay
Manawatu-Wairarapa
Marlborough
Mokau
Motueka-Nelson
Northland�eastern
Northland�northern
Northland�western
Northwest Nelson-Paparoa
Otago Peninsula
Palliser-Kidnappers
Southland
Stewart Island
Taieri
Taranaki
Waikato
Waitaki
Wanganui-Rangitikei
Wellington
Westland
50 Chadderton et al. �Creating a candidate list of Rivers of National Importance
M A P E X P L A N A T I O N S
Candidate nationally important river catchments are plotted out in separate
figures, by biogeographic unit. Type I catchments are shaded in dark green, and
within these catchments the whole system is considered to be of national
significance. Catchments shaded in light green comprise Type II rivers that
contain sections of national importance. For the larger catchments these are
typically the lower main river stem, often because they contain habitat for
significant populations of aquatic bird species (e.g. Canterbury braided rivers)
or rare or special habitats or features. Some rivers simply provide a critical
connectivity or buffer (hydrological) function of a designated RAMSAR wetland
of international significance. Many of the smaller Type II catchments (e.g. Hutt
River, Tarawera River) have highly natural headwaters that contain the least
disturbed or only examples of river environment classes within that
biogeographic unit. Inclusion of these sections is necessary to capture a wider
range of river environment classes.
51Discussion document, December 2004
T A B L E L A Y O U T
Each catchment has its own unique catchment number that identifies it within
the WONI river environment database. Catchments in the candidate list of rivers
of national importance are divided into Type I and Type II. Type I catchments
are listed first and are river systems where the majority of the catchment is
nationally significant. Type II catchments contain special features of national
significance, usually a wetland or nationally important population of a
threatened species: sections of these river systems are of national significance.
� Heritage value score is total natural heritage score used to rank each
catchment within each biogeographic unit (see Section 2.3).
� Euclidean distance is a measure of catchment distinctiveness based upon
the full range of river environment classes within each biogeographic unit. A
value close to 1 indicates that the catchment is highly distinctive, whereas a
value close to 0 indicates that the catchment is representative of the
biogeographic unit.
� Total REC classes are the number of river environment classes located in
that catchment. The total number in the entire biogeographic unit is given in
the header row, in brackets. Cumulative % REC classes represents the
cumulative contribution each new river makes to the total range of river
classes present within the candidate rivers, starting with the catchment
within the biogeographic unit with the highest Natural Heritage Value score.
� The Area of each catchment is given in hectares. The percentage of the
catchment in natural land cover (% Natural cover) and public lands managed
for conservation (% DOC) are given. The final section of the table records
reasons for inclusion and special features where these are known.
Other abbreviations used in the tables:
� T10 This catchment was in the list of top ten sites by Natural Heritage Value
score in its biogeographic unit.
� Highly natural Catchment cover is largely natural (refer to % natural
cover). Data derived from the Land Cover Data base.
� B.Duck Contains records of blue duck (Hymenolaimus
malacorhynchos) recorded in the last 10 years.
� Teal Contains brown teal (Anas aucklandica chlorotis).
� Frog Contains populations of Hochstetter�s frog (Leiopelma hochstetteri)
� Nat.Sign. Nationally significant
� RAMSAR Has a connectivity or buffer function for one of four sites
designated as RAMSAR wetlands of international significance.
� Nat.Imp.Site Catchment contains or flows into a wetland, estuary or lake
that has been designated Nationally Important (see Section 2.7: Connectivity/
buffering function; and Cromarty & Scott 1996). This list is incomplete, and
will be revised in later stages of WONI.
� Nat.Sign.bird pops Contains nationally significant bird populations
� Threatened plant, fish and/or birds Catchment contains populations
or records of threatened plant, bird and/or fish species (see Section 2.6:
Special features).