thoresen thai agencies publicthoresen thai agencies public ... corporate...medium-sized industrial...
TRANSCRIPT

Thoresen Thai Agencies PublicThoresen Thai Agencies Public Company LimitedR.S. Platou (Asia) 2nd Annual Offshore & Shipping ConferenceOctober 8, 2010

TTA is reinventing itself into a dynamic investment company focused on our long-time strengths
O i i ll id f hi i i TTA d i t t i d b lk l i• Originally a provider of shipping services, TTA made investments in dry bulk vessels in the 1980’s and offshore vessels and drilling rigs in the 2000’s
• Since 2005, with the exit of TTA’s controlling shareholders, we have moved to a , g ,“corporate-run” approach due to our widely held ownership
• We are in Year 2 of a 5-year plan to become a strategic holding company focused on three lines of business Transport Energy and Infrastructurethree lines of business – Transport, Energy, and Infrastructure
• We target long-term returns of 15% per annum across the entire business portfolio
• We emphasise growth and long-term shareholder value creation by investing in our existing businesses and acquisitions that are related or add value to existing businesses
2

Our plan combines expansive growth, financial acumen, and focused diversification
Core Competencies• Disciplined investment analysis• Long term strategic thinking
What We Do Not Do• Short-term asset trading• Speculative derivatives• Long-term strategic thinking
• International business networks• Effective financial management
• Speculative derivatives
Success In Crisis Learnings• Growth-oriented investments of about
US$ 187 million• Recruited new senior management
S$ f
• Level of integration and oversight is highly correlated to success of acquisitionsQuality of people and their array of skills• Repurchased US$ 66.9 million of
convertible bonds at 72.01% of par• Raised US$ 200 million financing for
mergers and acquisitions
• Quality of people and their array of skills must be improved continuously to achieve growth objectives
3
mergers and acquisitions

TTA’s strengths allowed us to easily navigate the economic crisis
Advantage Pre-crisis (<2008) Today (2008-2010)
1. Business origination capability
• Review of multiple investment opportunities
• Executed 7 corporate acquisitions and 7 vessel and rig purchasesrig purchases
2. Deep industry expertise • In-house commercial and technical management of key businesses
• Growing advantage
3. Active asset management • Dry bulk fleet of 45 vessels • Sale of 20 dry bulk vessels,but total assets grew 73.34%
4 Experienced & disciplined • Plans to delever balance sheet • Repurchased US Dollar4. Experienced & disciplined financial management
Plans to delever balance sheet and increase liquidity
Repurchased US Dollarconvertible bonds, issued Thai Baht bonds, secured local bank financing
f C ff5. Match maturity of assets and liabilities
• Core value • Important differentiator
6. Extensive support services • Develop group-wide human resources finance and IT
• Increased shared servicesacross the group resulting in
4
resources, finance, and IT capabilities
across the group, resulting in cost efficiency

TTA maintains a strong cash and liquidity positionTTA maintains a strong cash and liquidity position
6,797
Short-Term Debt(1)
Baht millions7,558
4,970
7,447 Long-Term Debt(1)Baht millions
454 1,980
2008 2009 YTD 2010 2008 2009 YTD 2010
31,091 31,788 Equity(1)
Baht millions 0.45Leverage(1)
(x) times
29,215 0.27
0.22
2008 2009 YTD 2010 2008 2009 YTD 2010Note: (1) Consolidated
Available credit lines of US$ 694.86 million for growth opportunities5
Source: TTA

TTA has three lines of businessesTTA has three lines of businesses
Transport 27 vessel-owning subsidiaries (100.0%) Fearnleys (Thailand) Ltd. (51.0%) ISS Thoresen Agencies Ltd. (99.9%) PT Perusahaan Pelayaran Equinox (49 0%) PT Perusahaan Pelayaran Equinox (49.0%) Thoresen (Indochina) S.A. (50.0%) Thoresen Shipping FZE (100.0%) Petrolift, Inc. (38.8%)
Infrastructure Unique Mining Services PLC. (89.6%) EMC Gestion S.A.S./Baconco Co., Ltd. (100.0%) Chidlom Marine Services & Supplies Ltd. (99.9%)
Energy Mermaid Maritime PLC. (57.1%) Merton Group (Cyprus) Ltd. (21.2%) Chidlom Marine Services & Supplies Ltd. (99.9%)
GAC Thoresen Logistics Ltd. (51.0%) Gulf Agency Company (Thailand) Ltd. (51.0%)
6Achieve growth diversification and balance across three core business groups

Our business portfolio has changed with focused diversification moves
9M FY 2010Other services
and commission
income
SalesBaht 0
0%
FY 2006Revenues (Baht Millions)
Voyage
Other services
and
SalesBaht 3,222
24.41%Offshore services revenues
B ht 2 753
incomeBaht 423
2.64%
0%
revenuesBaht 6,922
52.43%Offshore services revenues
Baht 2,677 20.28%
a dcommission
incomeBaht 381
2.89%Voyage revenues
THB 12,821 80 15%
Baht 2,753 17.21%
80.15%
42 143 41,641 48,784
Total Assets (Baht Millions)
23,140 28,144
42,143 ,
2006 2007 2008 2009 9M FY 2010Source: TTA7

General business environment continues to improve across the businesses
Positive
• Coal
Cautious
• Dry bulk shipping• Logistics • Offshore oil and gas services
• TTA remains profitable in FY 2010, despite Mermaid’s significant losses
• Mermaid’s losses should have peaked, but its performance will remain poor over the next two quarters
• Improved coal sales and prices should drive the performance of Unique Mining Services and Merton
L t h t ill i t i P t lift’ d fit• Long-term charters will maintain Petrolift’s revenues and profits
• Multiple growth options are available for TTA and its major subsidiaries
8

Dry Bulk Shipping HighlightsDry Bulk Shipping Highlights
D i9M/2010 (B ht illi ) Dynamics
• 27 owned vessels with an average age of 16.25 years and average DWT of
9M/2010 (Baht millions)
Operating revenues 6,922
29,432
• FY 2010 period time charter, COA, and spot revenues: 24%, 19%, and
Operating profits 1,238
57%, respectively
• In-house commercial and technical management expertise
Net profits 962
Assets 15,663 g p
• 18% of all traffic is now Atlantic-based after termination of liner services
Business • Sold and scrapped 10 vessels in FY 2010
• Fleet renewal plan - order book of 4
BusinessDry bulk vessel ownership and operations
vessels
9

Dry Bulk Shipping Highlights (cont’)Dry Bulk Shipping Highlights (cont )
O tl k K St t iOutlook
• Continued growth in trade of key commodities, such as iron
Key Strategies
• Increase fixed-rate business through period time charters and COA’s
ore, coal, steel products, etc.
• Oversupply situation will linger for the next 2-3 years
• Execute disciplined vessel sales and purchases
• Source other methods to fund fleet• Freight rates will generally be under
pressure, while asset values might not correct to fundamental levels
• Source other methods to fund fleet renewal program
• Maintain strong cost focus
• Standardize fleet characteristics
Focus on General High Utilisation Solid Client Strong Maintenance
10
Cargog
Rates Relationshipsg
Track Record

Mermaid Offshore Services HighlightsMermaid Offshore Services Highlights
D iDynamics
• Modern fleet of 8 subsea vessels: 4 high-spec DP2 DSVs with an average age of
9M/2010 (Baht millions)
Operating revenues 1,877less than 8 years
• Complementary subsidiaries in Seascape Surveys in Indonesia & Singapore and
Operating profits (losses) 144
Subtech in the Middle East
• Strong track record in South East Asia
R t l f Alli d M i d
Net profits (losses) - 130
Assets 13 805 • Recent sale of Allied Marine and Equipment Sdn Bhd
• New management team in place to drive i l d l b l b i i
Assets 13,805
Business regional and global business expansionBusinessSubsea vessel ownership and operations
11

Mermaid Offshore Services Highlights (cont’)Mermaid Offshore Services Highlights (cont )
O tl k K St t iOutlook
• Subsea market outlook remains challenging with continued pressure
Key Strategies
• Develop new clients and business opportunities and penetrate new
on rates
• Many tender awards delayed or cancelled due to continued uncertainty
markets
• Develop our people, processes, and systems to get maximum mileage from
in the market
• Industry analysts forecast improving market conditions in mid 2011 based
our modern and sophisticated fleet
• Maintain and continue to enhance our existing strong technical and safety
upon an increase in EPIC contract awards in the past few months
g g yperformance
Ownership of Assets Established Track Solid Client Focused Niche & Facilities Record Relationships
12
Services

Mermaid Drilling HighlightsMermaid Drilling Highlights
D iDynamics
• Fleet of 2 tender drilling rigs, but one currently works as an accommodation
9M/2010 (Baht millions)
Operating revenues 778
barge
• Strong track record of technical and safety expertise
Operating profits 204
• Experienced management team with extensive background in tender rigs, jack-ups, and semi-subs
Net profits - 181
Assets 6,230 g j p
• Recent sale of KM-1
BusinessBusinessDrilling rig ownership and operations
13

Mermaid Drilling Highlights (cont’)Mermaid Drilling Highlights (cont )
O tl k K St t iOutlook
• Market showing some pick‐up in demand for tender rigs with contract
Key Strategies
• Grow the business through investments in new drilling assets
extensions and new contracts becoming available
• Preference for newer rigs and
• Continue to maintain and develop strong client relationships to secure contracts to support acquisitions
equipment observed, with some client tenders stipulating maximum age restrictions
• Maintain financial flexibility to support additional rig investments
• Rates for high specification and newer jack‐ups remain particularly robust
Leverage Opportunities Experienced Team Across Different Strong Cash Position for
14
Leverage Opportunities Outside Existing Areas
Experienced Team Across Different Drilling Asset Classes
Strong Cash Position for Acquisitions

Unique Mining Services HighlightsUnique Mining Services Highlights
D iDynamics
• Owner of 2 warehouses on 181 rais of land with capacity of about 4.1 million
9M/2010 (Baht millions)
Operating revenues 1,803
metric tonnes per annum, 2 jetties, 12 barges, and 26 trucks
• Client base of more than 500 small and
Operating profits 344
medium-sized industrial users in Thailand – No. 1 market share
• Two coal shipments of 50,000 tons
Net profits (1) 42
Assets 3,301 peach into Thailand per month
• Concentration of clients in cement, food, and pulp and paper industries
Note (1) Excluding one-time impairment due to slow-moving inventory
Business , p p p pBusinessJust-in-time provider of coal logistics
15

Unique Mining Services Highlights (cont’)Unique Mining Services Highlights (cont )
O tl k K St t iOutlook
• 2010 coal imports into Thailand to exceed 16 million tonnes, with
Key Strategies
• Increase overall market in Thailand by converting clients to use coal-fired
increasing coal demand by industrial users
• Higher competition from smaller start-
boilers
• Compete granular project to lower 0-5 mm coal inventory and increase product
up companies
• Continued strong coal prices expected through 2011-2012
margins
• Develop stronger ties to large corporate users of coal g
• Increasing difficulty to secure coal from top mines
• Strengthen coal sourcing capabilities to ensure stable coal supply
Expand Market Base Research & Solid Client Secure Coal Supply
16
Development Relationshipsy

Baconco HighlightsBaconco Highlights
D iDynamics
• Owner of 5.5 hectare fertiliserproduction and logistics facility at Phu
9M/2010 (Baht millions)
Operating revenues 1,668
My, adjacent to Baria Serece Port
• Five fertiliser production processes with combined capacity of 300,000
Operating profits 240
metric tonnes per annum
• Bagging capacity of 400,000 metric tonnes per annum
Net profits 182
Assets 877 p
• Warehousing capacity of 40,000 metric tonnes – bulk and bags
N k f 200 h l l 4 000Business • Network of 200 wholesalers, 4,000 retailers, and 2 million end users
BusinessFertiliser blending and distribution plus logistics
17
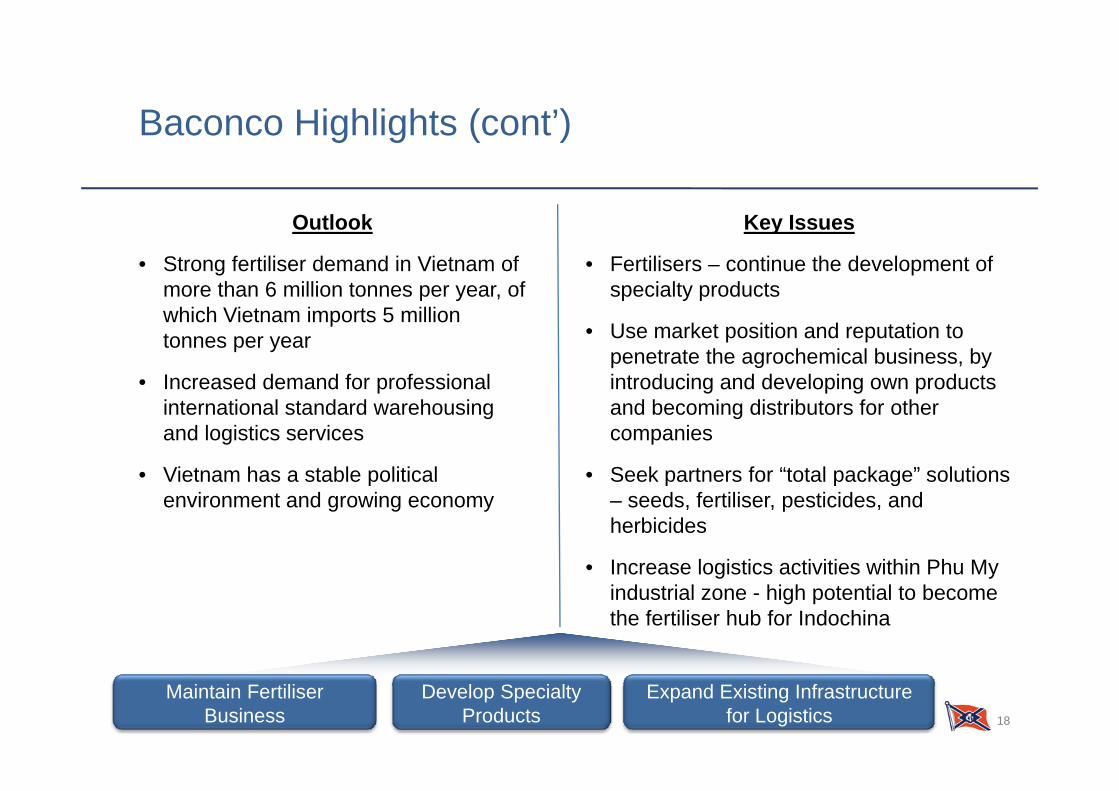
Baconco Highlights (cont’)Baconco Highlights (cont )
O tl k K IOutlook
• Strong fertiliser demand in Vietnam of more than 6 million tonnes per year, of
Key Issues
• Fertilisers – continue the development of specialty products
which Vietnam imports 5 million tonnes per year
• Increased demand for professional
• Use market position and reputation to penetrate the agrochemical business, by introducing and developing own products
international standard warehousing and logistics services
• Vietnam has a stable political
and becoming distributors for other companies
• Seek partners for “total package” solutions penvironment and growing economy
p p g– seeds, fertiliser, pesticides, and herbicides
• Increase logistics activities within Phu My g yindustrial zone - high potential to become the fertiliser hub for Indochina
18
Maintain Fertiliser Business
Develop Specialty Products
Expand Existing Infrastructure for Logistics

Other HighlightsOther Highlights
P t lift M t GPetrolift
• Owner of 7 petroleum double-hulled tankers and 1 LPG tanker, with a total
Merton Group
• JV with SKI Construction to develop 12,000 hectares of coal reserves
capacity of about 180,000 barrels, or 26,000 DWT
• Accredited contractor with three
• Reserve of over 2 million tonnes has been estimated on initial 107 hectare block
largest oil majors operating in the Philippines
• All tonnage under long-term charters
• First coal sales commenced in September 2010
P d ti t 35 000 tg g
with major oil and gas companies
• Currently pursuing fleet expansion opportunities
• Production ramp up to 35,000 tons per month by January 2011
pp
• Contributed Baht 24.16 million of net profits to TTA in FY 2010
19

TTA will continue its current strategy with stronger focus on execution and performance
A i d t d t l t t i t d d i 2009 t• A revised management and control structure was introduced in 2009 to manage our growing business portfolio
• The three lines of business Transport Energy and Infrastructure partner with fiveThe three lines of business, Transport, Energy, and Infrastructure, partner with five business management groups, Strategy, Finance and Accounting, Human Resources, Operations, and Risk
• Subsidiaries and associates are responsible for management of day to day operations, but TTA remains heavily involved in key strategic, financial, and people decisions
• The next phase of development will be to emphasise value creation from subsidiaries’ and associates’ assets and liabilities
• The key lesson from the past 2 years is that continued focus remains on people decisions, talent assessment, and recruitment to manage a larger and increasingly global businessg
20

TTA has been repositioned into an industrial conglomerate focused on commodities
2011 - 2012
Headwinds Tailwinds
Dry bulk shipping Oversupply of vessels New markets throughDry bulk shipping Oversupply of vesselsRising investment, repair, and
maintenance costs
New markets through COA’s
Competitive position
Off h il d T d d d l d Oil d i t bilitOffshore oil and gas Tender awards delayed or cancelled due to ongoing uncertainly
Size and strength of drilling
Oil and gas price stability Subsea fleet investment
competitors
Coal Ability to secure good quality coal
Global growth Upgrading technology
Corporate Earnings stability and quality Capital allocation
21
Positioning for consistent earnings growth

AppendixAppendix
I. Group Segments Earnings Results
II. Capital Structure
III. TTA Committed Capital Investments
IV. Funding Facilities & Debt Maturityg y
V. Key Financial Data
22

9M FY 2010 Group Segments Earnings Results9M FY 2010 Group Segments Earnings Results
Baht million Transport Energy Infrastructure Corporate(1) TTA
R 7 752 2 721 3 403 26 13 901Revenues 7,752 2,721 3,403 26 13,901
Operating Profits 448 -82 304 -338 332Operating Profits 448 -82 304 -338 332
Net profits/ -Losses 980 -181 221 -448 571Net profits/ Losses 980 181 221 448 571
Gross Margin 33.0% 28.1% 23.9% - 30.0%
Note:(1) Corporate is the holding company and includes inter company eliminations
Total Assets 17,865 18,398 4,605 7,916 48,784
Note:(1) Corporate is the holding company, and includes inter-company eliminations.Source: TTA
23

Capital Structure
Leverage Remains Low
Capital Structure
Baht million 9M FY 2010 9M FY 2009
Net operating CF 807.20 3,829.58
Leverage Remains Low
Net operating CF ,
Cash and short term investment 8,347.78 11,684.37
Gross debt 14,243.66 6,382.55
Net cash/- debt - 5,895.88 5,301.82
Shareholders’ equity 31 788 01 30 770 51Shareholders equity 31,788.01 30,770.51
Annualised ROE (%) 2.90% 7.05%
0 34 0 21Average debt/ Average equity (x) 0.34 0.21
Debt / Total capitalisation1 (x) 0.31 0.17
Note: 1 Total capitalisation includes gross debts and shareholders’ equitySource: TTA
24

TTA Committed Capital Investments
Initiatives from Committed New Assets are Met
TTA Committed Capital Investments
Strategy Project Project Cost Spending up to
30 Jun 10
CapexCommitted FY 2010
CapexCommitted
FY 2011
CapexCommitted FY 2012
Initiatives from Committed New Assets are Met
30 Jun 10 FY 2010 FY 2011 FY 2012
Dry bulk shipping fleet renewal
New build vessels from Oshima and
USD 142.85 million
USD 31.61 million
USD 6.93 million
USD 97.38 million
USD 6.93 million
renewal Oshima and Vinashin shipyards
Increase short-term fleet capacity
Chartered-in • 5 dry bulk
vessels
USD 60.35 million
USD 35.64 million
USD 9.93 million
USD 14.78million -
Source: TTA
25

Funding Facilities & Debt Maturity
Cash for Funding Capex Assets Acquisition and Expansions
Funding Facilities & Debt Maturity
• Cash levels exceed Baht 6,547.62 million equivalent to 13.42% of total assets.
• USD 29.06 million available under committed USD 29.10 million revolving term loan facilities.
Cash for Funding Capex, Assets Acquisition and Expansions
• USD 571.58 million available under committed USD 686.61 million term loan facilities.
• USD 94.22 million available under committed USD 136.43 million short-term credit facilities.
58.47% of Total Long Term Debt with Maturities over 12 months; 68.33% of Group Debt from Commercial Banks and 31.31% Raised in Debt Capital Markets
Baht million Within 12 Months 12-24 Months >24 MonthsBaht million Within 12 Months 12 24 Months >24 Months
As of 30 Jun 2010• Convertible Bonds• Bank Debt
1,579.203 693 82
1,209.081 107 51
1,209.083 920 87• Bank Debt
• Other Debts3,693.82
27.651,107.51
13.423,920.87
4.93
Total 5,300.67 2,330.01 5,134.88
% Breakdown 41.53% 18.25% 40.22%Source: TTA
26

Key Financial DataKey Financial Data
USD million 2005 2006 2007 2008 2009 9M 2009 9M 2010USD million 2005 2006 2007 2008 2009 9M 2009 9M 2010
Income StatementOperating Revenue 456.8 490.9 624.7 1,055.5 612.5 480.1 405.1
EBITDA 235.5 190.7 236.7 369.0 139.5 105.7 78.9* Interest Expense 13.7 21.5 20.4 16.4 11.6 8.9 10.7 Net Income 182.6 107.5 152.3 269.3 55.7 41.4 17.5 EPS (US cents) 28.4 16.7 21.5 38.1 7.9 5.9 2.5
Balance SheetCash and Cash at Bank 52.1 42.1 114.9 353.8 328.9 331.3 200.9 Total Assets 597.5 710.1 863.7 1,293.3 1,277.9 1,242.0 1,497.1 Total Debt 266 4 275 0 277 6 245 9 213 2 195 9 437 1Total Debt 266.4 275.0 277.6 245.9 213.2 195.9 437.1 Net Cash/ - Debt - 197.0 - 225.4 - 153.4 122.1 149.6 162.7 - 180.9 Total Liabilities 316.9 341.2 371.0 396.7 323.7 297.7 521.6 Total Shareholder's Equity 279.2 343.2 465.0 767.9 809.0 797.6 802.1
Cash Flow StatementCFO 215.5 129.1 210.2 348.0 153.5 117.5 24.8 CapEx 165.4 76.2 145.1 166.2 183.8 129.9 380.7
27
Dividends 108.6 42.5 28.3 47.4 14.8 14.8 11.6
Note: Using the exchange rate of Bt 32.5864 = USD 1.00 quoted by the bank of Thailand as of 30 June 2010 for all figures including previous periods.* Exclude net losses from disposal of investments in subsidiaries and an associate